nasa technical note d-4385
TRANSCRIPT

‘. .-. ”-.
NASA TECHNICAL NOTE NASA TN -I
D-4385 -
LOAN COPY: RETURN TO AFWL (WLIL-2)
KIRT‘LAND AFB, \v MEX
CORRELATION OF TRANSIENT SPECTRA WITH PERFORMANCE I N COAXIAL PLASMA GUNS
by Churles J. Michels und Henry J. Hettel
Lewis Reseurch Center CZeveZund, Ohio
N A T I O N A L A E R O N A U T I C S A N D S P A C E A D M I N I S T R A T I O N W A S H I N G T O N , D. C. F E B R U A R Y 1968

TECH LIBRARY KAFB, NM
I Illill 11111 11111 lllll IIIII 111 I Ill1 Ill1 0333463
CORRELATION O F TRANSIENT SPECTRA WITH PERFORMANCE
IN COAXIAL PLASMA GUNS
By Char l e s J. Michels and Henry J. Hettel
Lewis Resea rch Center Cleveland, Ohio
NATIONAL AERONAUTICS AND SPACE ADMINISTRATION _ _ - . - - . ______ - - .
For sale by the Clearinghouse for Federal Scientific and Technical Information Springfield, Virginia 22151 - CFSTl price $3.00

-t
I IN COAXIAL PIASMA GUNS
by Char les J. Michels and Henry J. Hettel
Lewis Research Center
SUMMARY
The time-varying spectra of an argon plasma in a coaxial gun were measured. Two gun geometries were investigated, both with argon propellant. were obtained by viewing the plasma spectra in the exit plane of a polychromator with an electronic image converter camera used as a streak camera. Frame and streak camera views and magnetic probes were also used to study the discharges occurring in the guns. The transient spectrum of each. gun was completely different. The geometry which ex- hibits relatively clean argon spectra showed good performance. It operated internally crowbarred. The performance correlates well with both earlier theory and experiments and extends previous data.
formance which does not agree with theory o r past experimental data. operated in the multiple-moving-discharges mode. The discharge spectra showed no argon lines, and the contaminant lines were those from a pyrex gas baffle just upstream of the gas ports. The influence of the gas baffle on performance accounts for discrepan- cies with earlier data (both experimental and theoretical).
transient spectra diagnostics as an added tool in ascertaining when theory can correctly be applied to a given gun.
A description of a two-channel transient voltage digitizer is given. The digitizer is used to record dynamically gun voltage and current at t k rate of 5 million samples per second. It digitizes these samples and punches them on paper tape for data reduction by a conventional high-speed computer.
The transient spectra
In contrast, the geometry which exhibited contaminant spectra showed poorer per- This geometry
The two different geometries of the guns served to demonstrate the usefulness of

I NTR 0 DUCT1 ON
The spectrum of the discharge of a coaxial plasma gun is a diagnostic tool useful in correlating experimental results with a theoretical model. The spectrum verifies quali- tatively the degree that contaminants are involved in the discharge. Time-integrated spectra (for 25 superimposed shots) were described by Michels and Johansen in refer- ence 1, and contaminants were noted. It could not be determined from these measure- ments when the contaminants occurred during a shot. The present report describes the time-varying spectrum as the discharge moves past a viewing port in the gun barrel during a single shot.
Two geometries were investigated; both used argon propellant. One geometry was 1 operated noncrowbarred and the other self-crowbarred . The spectra were taken only
for the injected mass that gave peak gun efficiency. The viewing station for each gun was chosen to observe sheets with maximum luminosity, uniform velocity, and good defini- tion.
given in references 1 and 2. It employs the snowplow model and allows for variable mass distribution along the gun barrel , as well as for various losses from the plasma. The theory indicates the important parameters for efficient gun design. One such pa- rameter is the nondimensional mass loading parameter. This parameter is proportional to the mass swept up in a shot. It was found in reference 3 that theory and experiment could best be compared by plotting the plasma velocity and the kinetic efficiency of the gun as functions of this mass loading parameter. Operating characterist ics of the guns used in the present experiments are similarly described in the present report.
charge at the station where time-resolved spectra were taken.
obtained by manual data processing of oscilloscope t race photographs. This procedure was tedious and time consuming and was subject to e r r o r s in reading the oscilloscope traces. In this investigation the data were dynamically digitized and later processed automatically. The transient digitizer is described in the appendix.
The theory for predicting kinetic efficiency of gun exhaust and exhaust velocity is
Frame and streak cameras and magnetic probes were also used to study the dis-
In the ear l ier investigations (refs. 1 to 3), the gun experimental performance was
'Self-crowbarring re fers to the formation of a secondary discharge at the breech at some time after initiation of the main discharge. The crowbar discharge remains at the breech during the shot. This process is discussed in detail in refs. 1 to 4.
2

A P PAR ATU S
Capacitor Bank
The guns described herein were energized by a capacitor bank consisting of 11 iden- tical sections. These sections were switched simultaneously through cabling to the co- axial plasma gun. Each section consists of two capacitors (1.1pF each), a GL-7703 ignitron switch, and four parallel coaxial cables. figure 1.
A partial view of the bank is shown in The 10 kilojoule bank has a resistance of 3 . 8 milliohms and an inductance of
Figure 1. - Capacitor bank, 10 kilojoule.
14 nanohenries. The trigger system is as described in reference 5 for an ear l ier model bank. The new bank has a low-inductance ignitron holder that employs a modification of a technique discussed in reference 6. It uses insulating oil and thus allows reduced- spacing coaxial geometry. This modification lowers the assembly inductance and in- creases the reliability of the switch.
3

Gun Geometries
The coaxial gun and the manner in which it is connected to the bank cables are shown in figure 2. The electrodes of each of the guns are made of oxygen-free high- conductivity copper. At the breech of the gun is a Vycor insulator and a gun header as- sembly. The header connects the gun electrodes through a parallel-plate transmission line to the capacitor bank cables.
Coaxial
r o u t e r electrode
CS-21403
To v a c u u m
Pump
Figure 2. - Coaxial plasma gun.
A short-duration.puff of argon gas was admitted into the evacuated gun annulus. It was introduced through ports in the center electrode by a fast-acting mechanical gas valve. The duration of the gas puff was set experimentally at 100 microseconds. mass per puff was controlled by the gas pressure in the valve plenum. An air-operated hammer provided the controlled blow to actuate the valve stem.
are given in figure 3. Both geometries used the same electrode radius (radius ratio of about 3). The noncrowbarred geometry incorporated a pyrex gas baffle just upstream of the gas ports to prevent a secondary discharge at the breech. Probe station locations 1 to 4 a r e shown in figure 3. In the self-crowbarred geometry a corona-inhibitor ring covered a corner protruding in the breech. crowbarring. Also shown in figure 3 are the viewing windows, spaced approximately the same distance from the initial location of the moving discharge in each gun. t r ical characteristics are also shown in figure 3 and were used in computing the theoret- ical performance.
The
The dimensions and electrical characteristics of the two gun geometries investigated
This ring delayed the time of self-
The elec-
4

Outer electrode MaQnet ic Drobes
inh ib i tor 11 ring--, ,””‘ -- -A
1 - t e rm ina l ( f ) 7 I /
Inner electrode ,N/
(1 11 2 1 1 3 114 I U U U 3.2 cm-, T !
,-Gas ports ( i n i t i a l I I
,I discharae location) i Capacitor bank 1 Gun I
, 1 flow
Ini t ia l i discharge) location> I -
Viewing window _I 3.8 mR 14.0 nH
30 20 10 0 10 20 u1 Distance, cm
(a) Noncrowbarred gun.
Magnetic probes Corona- , , A I
1 9 . 5 -, I I
Gun 6” f - p V i e w i n g window insulator- U ! Gas ports I
1 -Init ial location of moving discharge
I I I Gun I Capacitor bank I
17.0 nH 1218 nHlmbAL7 I
I I
Jff I I
In i t ia l I Plasma discharge,; location-’ I
1.0 nH
3.8 mR 26.0 nH
111 0 10 20 30 40 50 Distance, cm
(b) Self-crowbarred gun.
Figure 3. - Gun geometries and electr ical characterist ics.
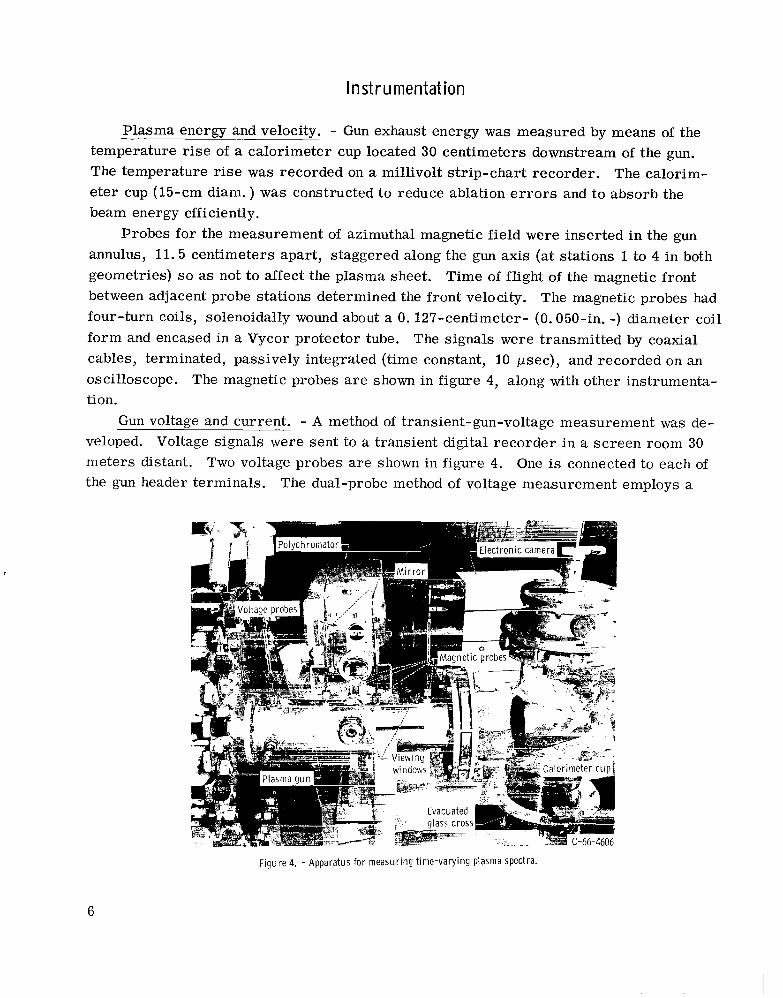
lnst ru mentat ion
Plasma energy and velocity. - Gun exhaust energy was measured by means of the temperature rise of a calorimeter cup located 30 centimeters downstream of the gun. The temperature r i s e was recorded on a millivolt str ip-chart recorder. The calorim- e te r cup (15-cm diam. ) was constructed to reduce ablation e r r o r s and to absorb the beam energy efficiently.
Probes for the measurement of azimuthal magnetic field were inserted in the gun annulus, 11.5 centimeters apart, staggered along the gun axis (at stations 1 to 4 in both geometries) s o as not to affect the plasma sheet. Time of flight of the magnetic front between adjacent probe stations determined the front velocity. The magnetic probes had four-turn coils, solenoidally wound about a 0. 127-centimeter- (0.050-in. -) diameter coil form and encased in a Vycor protector tube. The signals were transmitted by coaxial cables, terminated, passively integrated (time constant, 10 p e c ) , and recorded on an oscilloscope. The magnetic probes a r e shown in figure 4, along with other instrumenta- tion.
Gun voltage and current. - A method of transient-gun-voltage measurement was de- veloped. Voltage signals were sent to a transient digital recorder in a screen room 30 meters distant. Two voltage probes a r e shown in figure 4. One is connected to each of the gun header terminals. The dual-probe method of voltage measurement employs a
F igu re 4. - Apparatus fo r measur ing t ime-vary ing plasma spectra.
6

technique discussed in that the auxiliary periment, care was
by Moses and Korneff in reference 7. pickup coil used in reference 7 was not needed. In the present ex- taken to balance dynamically each amplifier (through internal ad-
The technique was simplified
justments), to dress and twist all signal leads, and to filter the power source. process provided sufficient common-mode signal rejection and balance s o that the added technique of a bucking coil was not needed.
Resistive divider probes (100 Ma) were employed. The shield terminals of both probes were not connected at the gun in order to prevent circulating currents from oc- curring in the shields. The shield connection of both probes was made at the screen room near the recorder. Both probe outputs were connected to a difference amplifier near the gun. The low-impedance push-pull output of the amplifier was connected by means of a twisted pair of coaxial cables to a similar difference amplifier in the screen room. The single-ended output of this amplifier was connected to a gain-adjusting am- plifier and then to the transient digital recorder.
The dual-probe technique electrically subtracts the unwanted common-mode signal portion from the ' ' readfV voltage signal, Cascaded difference amplifiers perform the subtraction. Commercially available equipment was used.
neously by using a capacitive di'vider and a surge oscilloscope near the gun. A sharp voltage waveform ( r i se time, <O. lpsec) does cause some amplifier ringing, as illus- trated in figures 5(a) and (c). turb the integrated power results. (figs. 5(b) and (d)) a r e accurately recorded.
the breech. mitted to the screen room by a coaxial cable. gain adjusted, and sent to the nearby transient digital recorder.
A two-channel transient analog-to-digital recorder accepted the gun voltage and gun current signals. It converted these signals to digital-recorded data that could be incor- porated in the laboratory computing system. The digitizer is described in the appendix.
ter camera, used in s t reak mode, in tandem with a grating polychromator. The optical arrangement is diagrammed in figure 6, and the actual apparatus is shown in figure 4. The discharge radiation was focused by two lenses (one of which served as the gun-barrel window) on the polychromator entrance slit. The spectrum produced at the focal plane of the polychromator is viewed by the electronic image-converter camera by means of the mirror .
The polychromator used is a modification of a 5 -meter Ebert-mounting spectrom- eter. The exit slit was removed to permit observation of a 4-centimeter segment of the
This
In figure 5, the dual-probe t races are compared with waveforms obtained simulta-
It could be tolerated, however, because it does not per- Voltage waveforms with r i s e times of longer duration
Gun current was sensed by a Rogowski coil (ref. 8) encircling the center electrode at A signal proportional to the time rate of change of gun current was t rans-
The signal was then actively integrated,
Transient spectra. - The s t reak spectra were obtained by coupling an image conver-
1
I
7
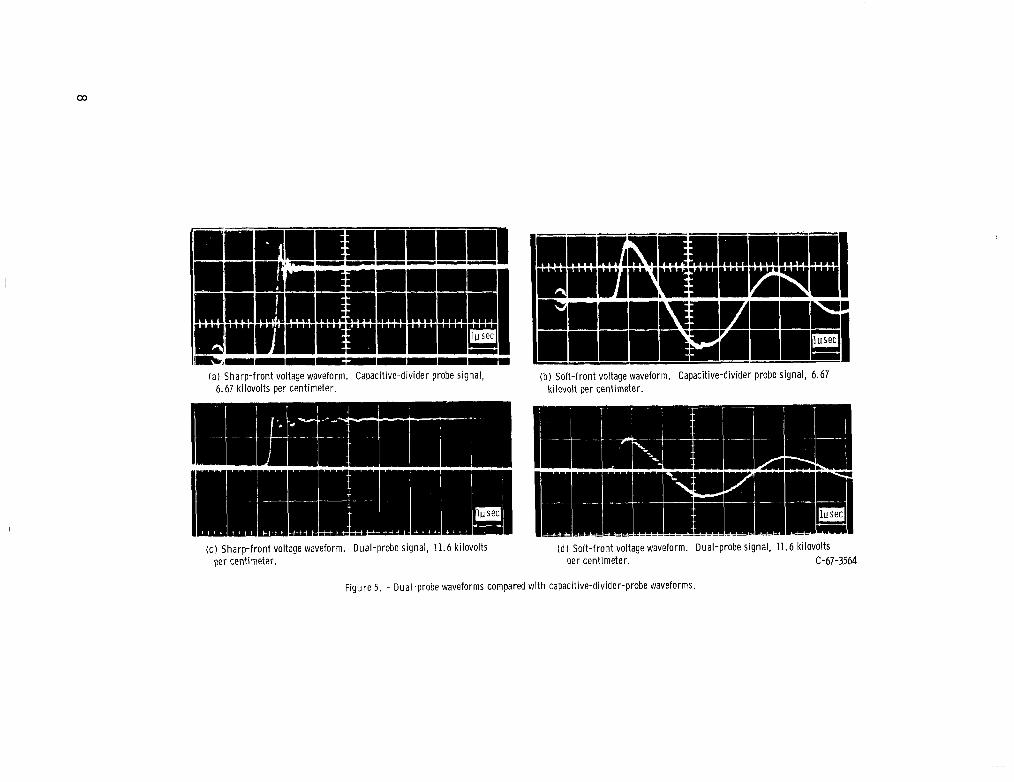
( a ) Sharp-front voltage waveform. Capacitive-divider probe signal, 6.67 kilovolts per centimeter.
(b ) Soft-front voltage waveform. Capacitive-divider probe signal, 6.67 ki lovolt per centimeter.
( c ) Sharp- f ron t voltage waveform. Dual-probe signal, 11.6 kilovolts per centimeter.
(d I Soft-front voltage waveform. Dual-probe signal, 11.6 ki lovolts per centimeter. C-67-3564
Figure 5. - Dual-probe waveforms compared w i t h capacitive-divider-probe waveforms.

Polych romator
M i r r o r M i r r o r
m
L M i r r o r
,- Grat ing
,--Entrance s l i t ,-Electronic camera rPo laro id
/ camera
L L e n s \ Image-converter tube A
,-Lens
,-Combination lens and window /
Z!, =- __ - . .- . .. . ,- I , "' 4 -\ '<' t
, - ~ -
LMoving plasma in g u n CD-9437
F igure 6. - Schematic d rawing (top-view) of apparatus for record ing t r a n s i e n t spectra.
focal plane. A short focal length cylindrical lens (mounted axis horizontal) was installed immediately preceding the focal plane to reduce the spectral image height. modification served to increase the optical speed of the system by increasing the radiant power per unit a r e a on the image-converter tube. resolution of the system by providing spectral lines which were short compared with the scannable length of the converter tube.
A minor modification of the image converter camera lens was also necessary to ob- tain adequate spectral dispersion. considerably less than 1. Thus, the 32-angstrom-per-millimeter (or X1O-l nm/mm) reciprocal linear dispersion at the polychromator focal plane becomes hundreds of ang- s t roms per millimeter on the Polaroid film when the normal camera lens is used. The attachment of a +3 diopter lens to the face of the camera lens, together with the use of the polychromator in second order, permitted a reciprocal linear dispersion of 70.4
The latter
It also served to increase the temporal
The normal magnification range of the camera was
9

per millimeter to be obtained on the film record. This dispersion was adequate for the analysis of the spectra. have been reduced optical speed.
The useable wavelength range per exposure was 250 A. Wavelengths below 3800 were not detectable because of the glass lenses in the system. The upper wavelength limit of about 5500 w. was set by the spectral response characteristics of both the image- converter tube and the film detector (Polaroid, ASA 10 000).
The camera was operated in the streak mode for a duration of 10 microseconds. Thus, a streak spectrum 250 A wide was obtained for any given shot. To survey the en- tire spectral range of the system thus would require seven successive shots. However, for this study the wavelength range encompassed by three successive shots provided suf- ficient information to permit the major constituents of the gun discharges to be identified. The camera was precisely triggered to begin its scan just before the plasma reached the viewing port. Through delay circuits the camera was synchronized with voltage applica- tion to the gun. The scan duration was monitored on an oscilloscope to permit the spec- tra observed to be correlated with the time scale of other gun events.
streak distance between the events. However, the fact that the spectral line viewed had a finite length limited the attainable time resolution of the streak. As recorded on the film, the spectral line image was 1 .2 millimeters high, and the s t reak length was 28.0 millimeters.
Better dispersion could have been obtained, but its price would
The time lapse between observed events is, of course, directly proportional to
Thus, the best attainable time resolution for a single image point is
Line height Sweep length
(Time per sweep) X
For the 10-microsecond sweep duration used, the time resolution was 0.43 microsecond.
EX PER IMENTAL PR OCEDURE
The first step in the operating sequence for the experiments was to evacuate the gun 2 andtest section to low pressure mm of Hg or N/cm ). A short-duration puff
of argon propellant was then injected between the electrodes. A controlled period of time was allowed for the gas to disperse between the electrodes and for the charged capacitor bank to be switched to the gun. A time period of 1100 microseconds was based on optimum delay time (with respect to kinetic efficiency) investigated previously (ref. 1). After breakdown, the resulting plasma was accelerated out of the gun and into the evacuated test section, where it impinged on the calorimeter cup. In all reported data, the center electrode was initially negative.
10

The followhg procedure was used to obtain gun performance for each voltage and
(1) The mass per puff was calibrated before the series of shots. (2) The gun was fired 10 t imes to outgas and condition the electrodes. (3) All data were gathered simultaneously, and synchronously for many identical
(4) The mass per puff was recalibrated. The variation of efficiency and magnetic front velocity and mass over the practical
operating range of the device was determined for three different bank voltages: 15, 18, and 20 kilovolts. received in the calorimeter cup by the original stored energy. not differentiate between the thermal energy and the directed kinetic energy of the im- pinging exhaust. energy, as indicated by theoretical results of reference 1 and observation of good exhaust - be am collimation.
injected mass:
shots.
The experimental gun efficiency was determined by dividing the energy The calorimeter cup can-
The exhaust has been assumed herein to be primarily directed kinetic
The transient spectra were obtained by recording a 250-i.-wide band of spectra per shot. Three similar shots were required to survey the spectral range of interest. Near similar shots were determined from calorimeter, voltage, current, and magnetic-probe records. mately the same plasma conditions.
for only the most intense lines. microsecond-duration sweeps, and this sweep speed was used for the spectra of this report.
Each section of the composite spectral record thus corresponds to approxi-
Camera streak speeds as fast as 2 microseconds per sweep gave recordable spectra Fully developed spectra were obtained with 10-
DEFINITION OF PERFORMANCE PARAMETERS
Ana ly t i ca l Parameters
The initial derivation of the theory used herein for determining gun performance is described in reference 2. ous losses a r e presented in reference 1. A brief description of theoretical terms is necessary before describing the results of the experiment.
the exhaust to the original stored energy in the capacitor bank:
Added details and calculations for crowbarred guns with vari-
The kinetic efficiency q2 is defined as the ratio of the directed kinetic energy in
11

A nondimensional exit velocity ti is defined in reference 1 as
i @(E) x= 2
where
Mo x
t time, s e c
C capacitance of bank, F
Vo initial capacitor voltage, V
2 effective gun length, m
L'
total mass swept up per shot, kg
distance of current sheet from initial discharge location, m
gun inductance per unit length, H/m
The theoretical gun performance is a function of various nondimensional parameters. F o r a given gun geometry, only two of these parameters a r e easily varied experimen- tally. The parameter r/l is defined as
They a r e the mass loading parameter /?/ and the mass distribution parameter cy.
,/?I =( L'C 2; vo .> MO (3)
In the theory of reference 1, the mass distribution in the x-direction Mo(df/dx) was s o chosen that a family of distributions could be presented from a slug to a constant- density profile. The function
f = l - (4)
was used, in which a varies f rom 0 (constant density) to 1 (slug). In this report CY = 0. 5 was chosen to approximate the experimental distribution.
12
- . ... . II

Neutral gas-pressure profiles in the gun as a function of time were measured prior to the experiment for a geometry similar to the self-crowbarred gun. When the time delay (1100 psec) for optimum experimental efficiency and the shape of the pressure profile at that time were known, the mass distribution parameter a was estimated to be approximately 0. 5. Pressure profiles for the noncrowbarred gun were not deter- mined, but cy = 0. 5 was used for calculating .the efficiency of that gun also.
Theory and experiment can best be compared by plotting the plasma velocity and kinetic efficiency as functions of the mass loading parameters for each gun. This com- parison is made in the RESULTS AND DISCUSSION section for the two guns examined in this experiment.
a r e discussed in references 1 and 2. The remaining nondimensional parameters required to calculate gun performance
The values used herein a r e listed in table I.
Resis tance I Heat-
TABLE I. - NONDIMENSIONAL PARAMETERS
Inductance
[Thickness of c u r r e n t sheet , 0 .01 m; effective ionization potential p e r ion, 1. lZX10-17 J (70 eV); effective excitation poten- t ia l per ion, 6 . 4 2 ~ 1 0 - ~ ~ J (40 eV); f ract ion of ions in excited s ta te , 1 . 0 ; charge number of ions, 2.0; mean lifetime of
excited s ta te , 2 . 5 ~ 1 0 - ~ s e c . ]
conduction 1 I ~ j parameter P a r a s i t i c Crowbar P a r a s i t i c
I Oy 1 . 0 ~ 1 0 ~ 1 0: ; ; ; : 1 ~~
2.0x10¹⁰
Gun geometry
Crowbar Initial 5 I
Noncrowbarred
Self-crowbar red
Diffusion 2oefficieni
4 .77
I. 62
Effective potential
2.35~10-~
1.46
Excitation l o s s
x r a m e t e r
3 . O ~ X I O - ~
2 . 41
Nondimensional p a r a m e t e r s
Convection cooling
coefficient
3 .5
5 . 6
Experi menta I Parameters
Three experimental efficiencies a r e evaluated. The f i r s t is the ratio of electrical energy delivered to the gun (in time Tc) to the original stored energy:
4"" VI dt n.
1 2 2
'I - cvo
where
V gun voltage, V
13
I

I
and Tc time in seconds of crowbar o r first current zero (whichever is less).
gun current, I = I(t), A
The value of the second experimental efficiency (q2) is the ratio of the energy exp
E, received in the calorimeter cup to the original stored energy:
This efficiency is comparable to the theoretical value defined by equation (1) if the ex- haust is primarily directed kinetic energy.
electrical energy delivered to the gun: The third efficiency is the ratio of energy received in the calorimeter cup to the
773 = iTc VI dt
and is the measure of losses in the gun itself.
RESULTS AND DISCUSSION
Gun Performance
The experimental and theoretical kinetic efficiencies v2 and velocities determined fo r the two different geometries a r e presented as functions of the mass loading param- eter in figure 7. Theoretical efficiencies a r e presented for both the simplified and loss models. The simplified model excludes losses due to the interaction of the plasma with the wall, and also the ionization and radiation effects. It does include ohmic losses and losses due to shock heating. ohmic, and shock heating losses.
while transient spectral experiments were in progress. of reference 1.
are much higher than the originally reported data but a r e within practical theoretical limits. A different gas baffle was employed in the new design. The transient spectra
The loss model includes wall drag, ionization, radiation,
The solid symbols in figure 7 a r e for experimental data obtained in this investigation The open symbols are for data
The data points a r e average values of the shots gathered. Figure ?(a) presents data for the noncrowbarred geometry. The new efficiency data
14

I 1 I t I I I I I l l
-_ . -e-- , /"
\
40 - - m 0
1.2 \\
Y
I I I I I I l l , , ! ; , I , 10
01 1 1
0 L Mass 1oddir.g parameter, . //
(dl Noncroivbarred geometry. (bl Self-crowbarred geometry. Theoretical model crowbarred at maximum energy.
Figure 1. - Theoretical and experimental performance of p lasmaqun geometries Mass distribution parameter, 0.5.
show baffle contaminants in the discharge. plasma could account for an q shift in the new data. A peaked distribution of mass (contaminants) near the baffle could account for increased efficiency.
Figure 7(b) presents data for the self-crowbarred geometry. The data of refer- ence 1 were for gas ports close to station 1 with the discharge initiating in the same lo- cation. The new data a r e for gas ports located at station 2 but with the main acceler- ating discharge initiating near the corona inhibitor ring. curves for geometry B of reference 1 are applicable provided the mass is adjusted, as has been done. A new capacitor bank was used, and switch losses were not determined. was not corrected for switch losses in the new data.
A different amount of contaminants in the
Therefore, the theoretical
The new data lie near the loss model theoretical efficiency and telocity. The efficiency
c-
r The noncrowbarred geometry was operated a t f i = 2.6 for the transient spectra ex- The self-crowbarred geometry was periment, and the kinetic efficiency was 17 percent.
operated at I"?/ = 0.72 for the transient spectra experiment, and the kinetic efficiency
- Bank voltage,
VO,
kV
20 20 20 20
20 1 8 20 15 1 8 20 20 15 18 18 20 15 20 15 18 18 15 15
~~.
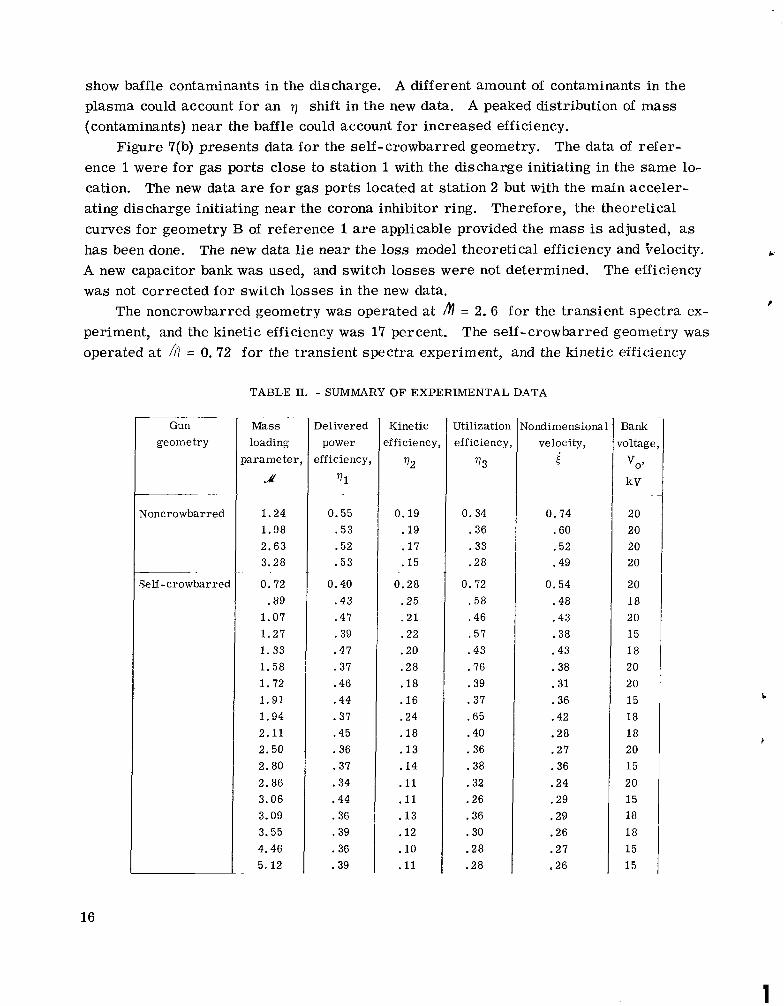
TABLE 11. - SUMMARY OF EXPERIMENTAL DATA
Gun geometry
Noncrowbarred
Self-crowbarrec
Mass loading
Jarame ter
A
1.24 1.98 2.63 3.28
0.72 .89
1.07 1.27 1.33 1.58 1.72 1.91 1.94 2.11 2.50 2.80 2.86 3.06 3.09 3.55 4.46 5.12
De livered power
efficiency,
71
0.55 .53 .52 .53
0.40 .43 .47 .39 .47 .37 .46 .44 .37 .45 .36 .37 .34 .44 .36 .39 .36 .39
Kinetic :ff icie ncy
772
0.19 .19 .17 .15
0.28 .25 . 2 1 .22 .20 .28 .18 .16 .24 .18 .13 .14 .ll .ll * 13 .12 .10 .11
Utilizatior efficiency
773
0.34 .36 .33 .28
0.72 . 5 8 .46 .57 . 4 3 .76 .39 .37 .65 .40 .36 .38 .32 - 2 6 .36 .30 .28 .28
Jondimensiona velocity,
i
0.74 .60 .52 .49
0.54 . 4 8 .43 .38 .43 .38 . 3 1 .36 .42 .28 .27 .36 .24 .29 .29 .26 .27 26
16
I
1 I
i.
was 28 percent. Spectra were taken a t these conditions for maximum luminosity and best sheet definition.
Table II is a summary of the new data. portion of the electrical energy delivered to. the gun terminals (52 to 55 percent) than has the self-crowbarred geometry (35 to 47 percent). Yet the noncrowbarred geometry has poorer kinetic efficiency. This result is partly explained by the fact that the moving discharge initiates near midbarrel in this geometry. terminals is therefore split between active and inactive portions of the barrel length. In the self-crowbarred geometry, the active portion of the bar re l length is almost twice as great. The efficiency v3 of utilizing the energy delivered to the gun terminals, for the self-crowbarred gun, is generally higher than the corresponding case for the noncrow- barred gun.
deviations from the mean value a r e of the order of 3 percent, which is less than the overall calibration accuracy.
The noncrowbarred geometry has a greater
The energy delivered to the gun
The data listed in table II a r e the mean values of many similar shots. The probable
I 30
I 2U
_. 7- Magnet ic probes -T. ; \ -. .- ,
\
-113 Kasked midbarrel window wi th 1.27-cin s l i t
\ - I f' - h"
Masked i i i u z z l e bvindow w i t h 1.0-ci i i s l i t I
1
I 1 2b M
.. - - ... -
,I Firs t
C-67 -4124 Second discharge
Streak view. 1-iu7ile :?inc!o\v s l i t
Streak view, imidbarrel slit
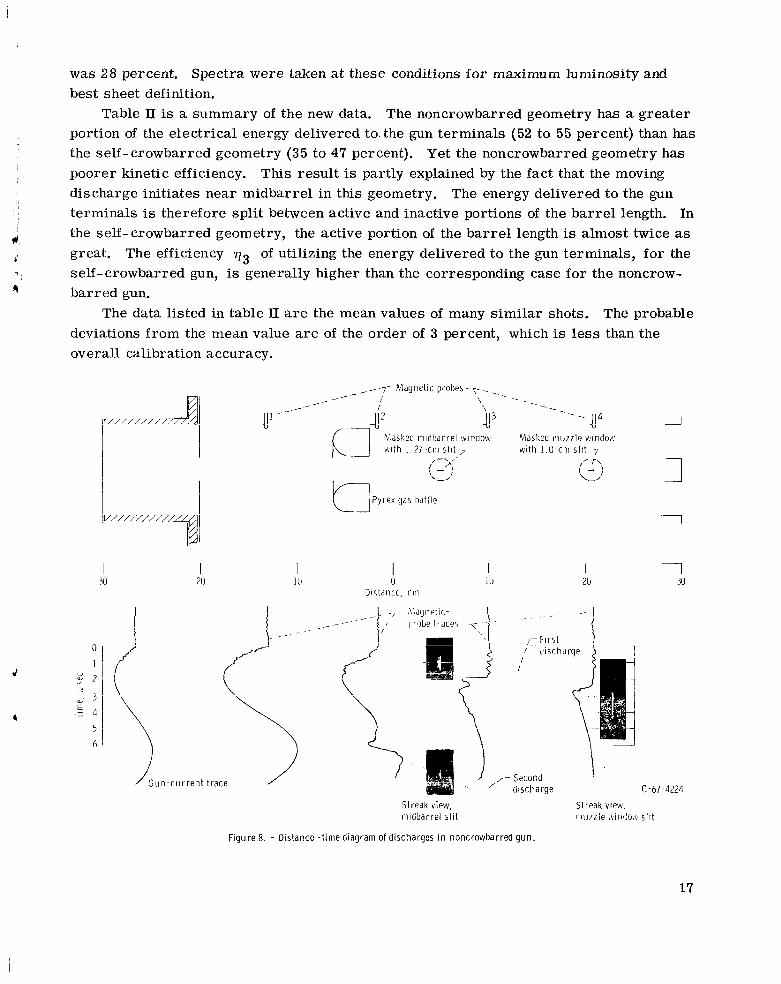
F igure 8. - Distance - t i m e diagram of discharges in noncrowbar red gun.
17

Description of the Discharges in the Guns
Noncrowbarred geometry. - Multiple moving discharges occur 'in the noncrowbarred geometry, each forming near the pyrex gas baffle. The secondary discharges decay be- fore ever reaching the gun muzzle. No static discharges occur in the barrel. These conclusions a r e drawn from the combined examination of s t reak camera views and azi- muthal magnetic field probe traces. Figure 8 shows these views and traces along with a distance-time diagram of the discharges.
alternate-sign gross currents. The fronts were well defined, and the azimuthal mag-
experiment the noncrowbarred gun exhibited similar characteristics. This similarity is evident in the magnetic field traces of figure 8. The gun current trace is shown to cor- relate the electrical events with the position of the discharges. Streak views of the dis- charges at the midbarrel window sli t show that the first discharge formed in the vicinity of the slit and that later a second discharge moved past the slit. Streak views at the muzzle window sli t show the first front with velocity of 6. 0 centimeters per microsecond with a later-decaying residual light. ence of the residual light.
Self- crowbarred ~ geometry. - - - The discharges occurring in the self - crowbarred geometry a r e more complicated. This conclusion is drawn from a combined examination of frame and streak camera views of the discharge and azimuthal magnetic field traces. Figure 9 shows these t races and views. In this gun, the viewing port is located a t midbarrel, which is the location of maximum luminosity of the first moving discharge.
(nonspoked) discharge. Figure 9 magnetic probe t races locate this discharge some- where between stations 2 and 3. It lasts until 2 .0 microseconds after gun current s tar ts , and is never observed in the streak camera views of the midbarrel sl i t in figure 9. It is
R In reference 9 the successive fronts in the gun described by Marshall carried
netic field reversed abruptly as each front passed the magnetic probe. In the present P
No secondary fronts can be discerned in the pres-
Both static and multiple moving discharges occur.
In figure 9 f rame views of the muzzle show that the first discharge is a symmetric
probably seated on the gas port holes in the center electrode. b The second discharge to occur in the gun originates near the corona inhibitor ring.
b It s ta r t s about 0.2 microsecond after the s ta r t of gun current. The magnetic probe t races of figure 9 show this front progressing down the barrel . The streak photo of fig- u re 9 shows i t to be a well-defined front with a velocity of 7. 1 centimeters per micro- second. It is the f i rs t front to pass the midbarrel window, and i t passes at a time that can be predicted from magnetic front velocity (ref. 6). Figure 9 also shows gun voltage and current, respectively, to correlate the electrical events with the other diagnostic measurements and to estimate time of crowbar occurrence.
The second discharge is followed, about a microsecond later, by a third discharge
18

L
Magnetic probes-.
\\ ---_ Outer electrode- \ .. 3 11 '-411
probe5 7..
. . U U
1 I n n e r electrode J' ' I
1 Camera graticule lines 4 I I
/ -\
I - \ I . ,
' 1
/_1 \
Mas ked m idba r re i &vi ndow with 1.27-cm-long s l i t
Distance, cm /
Time, 10 0 10 20 30
C-67-4225 Fraine views
Figure 9. - Distance-time diagram of discharges in self-crowbarred gun.

which carries less gross current. A s the third discharge passes station 3, it carr ies current of the same polarity as the second discharge. These two fronts a r e driven by the '' crowbarred-in" field in the gun. A static discharge at the breech acts as the crow- bar switch.
Kvartskhava, et al. (ref. 10). No attempt is made herein to prove o r to suggest a cur- rent cell-type model f o r the fronts, as is proposed in reference 10. These fronts were too weak to be distinguished on the probe traces.
The remaining minor fronts are not uniformly spaced in time, as is reported by
Transient Spectra
Transient spectra of the plasma passing the muzzle window of the noncrowbarred gun a r e shown in figure 10. This spectra were obtained under the same conditions as for figure 8. Detailed spectral line identification was performed through a literature search of the references cited by Moore (ref. 11). Analysis of this spectra reveals that
u a L n
1
a- E .- +
- 2.0 -
3.0 --
4.0-
5.0-
6.0-
7.0 -
8 . 0 -
9.0 -
0.0 -
Event
f r o n t ar r iva l
St reak stop
F igure 10, - Streak spectra f o r noncrowbarred geometry (streak s tar ts at To + 1.6).
20
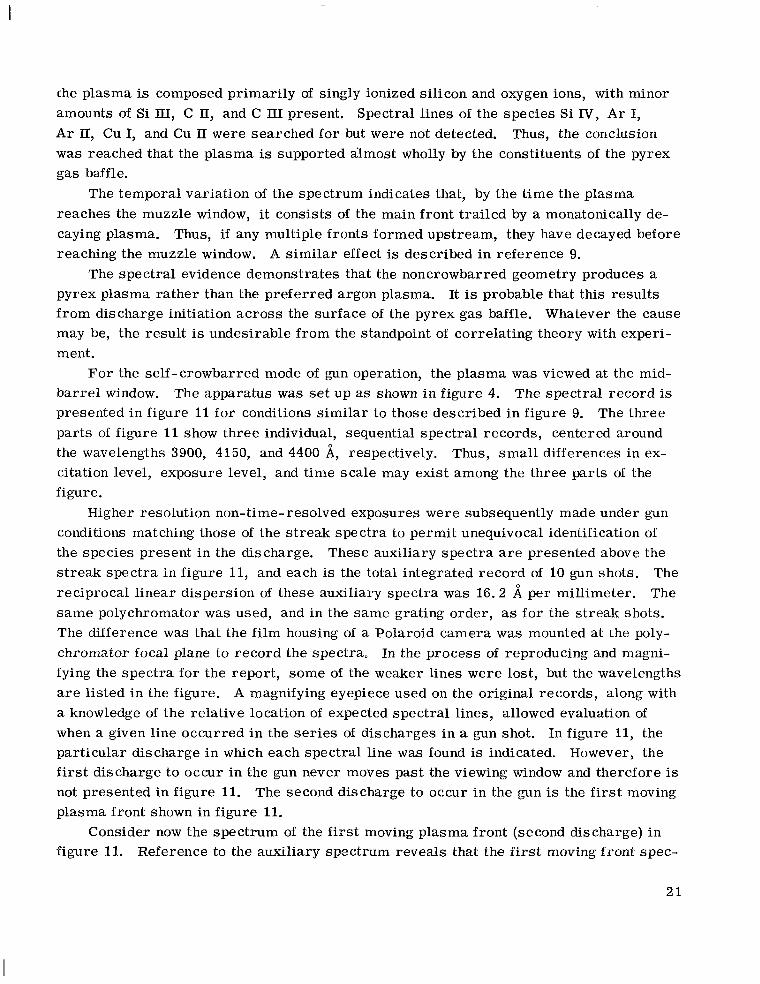
che plasma is composed primarily of singly ionized silicon and oxygen ions, with minor amounts of Si III, C II, and C III present. Spectral lines of the species Si IV, Ar I, Ar 11, Cu I, and Cu 11 were searched for but were not detected. was reached that the plasma is supported almost wholly by the constituents of the pyrex gas baffle.
The temporal variation of the spectrum indicates that, by the time the plasma reaches the muzzle window, it consists of the main front trailed by a monatonically de- caying plasma. Thus, if any multiple fronts formed upstream, they have decayed before reaching the muzzle window. A similar effect is described in reference 9.
The spectral evidence demonstrates that the noncrowbarred geometry produces a pyrex plasma rather than the preferred argon plasma. It is probable that this results f rom discharge initiation across the surface of the pyrex gas baffle. Whatever the cause may be, the result is undesirable from the standpoint of correlating theory with experi- ment.
For the self-crowbarred mode of gun operation, the plasma was viewed at the mid- The spectral record is
Thus, the conclusion
barrel window. presented in figure 11 for conditions similar to those described in figure 9. The three parts of figure 11 show three individual, sequential spectral records, centered around the wavelengths 3900, 4150, and 4400 A, respectively. Thus, small differences in ex- citation level, exposure level, and time scale may exist among the three parts of the figure.
conditions matching those of the s t reak spectra to permit unequivocal identification of the species present in the discharge. s t reak spectra in figure 11, and each is the total integrated record of 10 gun shots. reciprocal linear dispersion of these auxiliary spectra was 16.2 same polychromator was used, and in the same grating order, as for the streak shots. The difference was that the film housing of a Polaroid camera was mounted at the poly- chromator focal plane to record the spectra. In the process of reproducing and magni- fying the spectra for the report, some of the weaker lines were lost, but the wavelengths are listed in the figure. A magnifying eyepiece used on the original records, along with a knowledge of the relative location of expected spectral lines, allowed evaluation of when a given line occurred i n the series of discharges in a gun shot. particular discharge in which each spectral line was found is indicated. first discharge to occur in the gun never moves past the viewing window and therefore is not presented in figure 11. The second discharge to occur in the gun is the f i r s t moving plasma front shown in figure 11.
figure 11.
The apparatus was se t up as shown in figure 4.
Higher resolution non-time-resolved exposures were subsequently made under gun
These auxiliary spectra a r e presented above the The
per millimeter. The
In figure 11, the However, the
Consider now the spectrum of the f i r s t moving plasma front (second discharge) in Reference to the auxiliary spectrum reveals that the f i r s t moving front spec-
21

N N
L n LnLnm m \ o m - m N > M 0 0 0 0 0 0 0
I 0 - - - 0 0 0 - I C - c - - Discharge m m m m m N w N N N N u w - N N N
3 - H - - r _ - - - - - -1-3-..,-*
L I u
- Second discharge
- T h i r d discharge
C-67-4206
(a) Central wavelength, 3900 A. Figure 11. - Self-crowbarred g u n spectra,

C -67-4207
(b) Cent ra l wavelength, 4150 A (s t reak s tar ts at To + 0.6).
F igure 11. - Cont inued.
23

M M M M M M M v\ - - a Discharge 5 5 5 c c 0 0 c 0 c 0 c c 0 0 5 5 5 9
L n L n ln
N N M m M N N N N N N N N N N N N N N N N
" a, m
I
.- e- k-
To + 2 .6 -
To + 3 .6 __
To + 4.6 --
To + 5 . 6 __
To + 6.6 __
T o + 7.6 __
To t 8.6 __
To + 9 . 6 __.
To + 10.6 __
Event
Second d ischarue
T h i r d d ischarge
Su bseqilent discharges i
i
Streak stop C-67-4208
(c) Centra l wavelength, 4400 A (s t reak s tar ts at To + 0.6).
F igure 11. - Concluded.
24

!
i ,*. !
trum consists of a fully developed Ar 11 spectrum, with faint t races of Ar 111 lines vis- ible on the original records. No A r I lines were detected, but Si 111 and Si IV appear weakly. Thus, the f i r s t front is an energetic argon discharge containing some silica contaminant.
The second moving front (third discharge) is a mixture of Si 111 and Si IV, with the 0 11 spectrum beginning to rise. Neither A r I'nor A r 11 are observed. ing front is basically an energetic silica discharge.
marily Si 11, Si 111, and 0 11 and a r e reminiscent of the noncrowbarred geometry spec- t rum shown in figure 10. These latter fronts are thus lower-energy versions of the sec- ond front.
No lines of Cu I o r Cu I1 were detected in either the s t reak or the auxiliary spectra, which is notable since the electrodes are made of pure electrolytic copper. Were copper present in the third and subsequent moving fronts, Cu 11 lines would have been observed, since the excitation level in these fronts is in the range of Cu II. present in the first and second moving fronts would not have been detected, since the ex- citation level in these fronts would have been compatible with Cu IV and Cu V. However, a literature search failed to uncover any study of the spectra of these species. Careful scrutiny of figures 11 (a) to (e). reveals a singular group of spectral lines in the first and second moving fronts of markedly different time behavior from the rest. These spectral lines occur a t 3796, 3922, 3944, 4131, 4171, 4178, and 4229 A. about 0.3 microsecond behind A r 11 in the f i rs t movicg front and persist with nearly con- stant intensity through the second front. This markedly s imilar behavior suggests that all lines a r i se from the same species, which has not ye t been identified. Since at least a little copper usually appears from discharges of megampere proportions between cop- per electrodes, these lines might be components of the spectrum of Cu IV o r Cu V. worthy of note that argon neutrals were undetectable not only in the second discharge, but in all other discharges as well. were observed in this study.
The second mov-
The third and subsequent moving fronts (fourth and subsequent discharges) are pri-
However, any copper
These lines appear
It is
Indeed, no lines of neutral species of any element
Corre la t ion of Spectra and Performance
The spectral analysis results are useful in interpreting the performance compari-
The experimental spectra of sons shown in figure 7. The theory predicts the kinetic efficiency for snowplow sweepup of mass distributed in a known manner along the barrel. the noncrowbarred gun show that the primary moving discharge is composed of contami- nants from the gas baffle. The amount and distribution of contaminant propellant are not known. It is therefore understandable that experimental efficiencies appear to be too
25
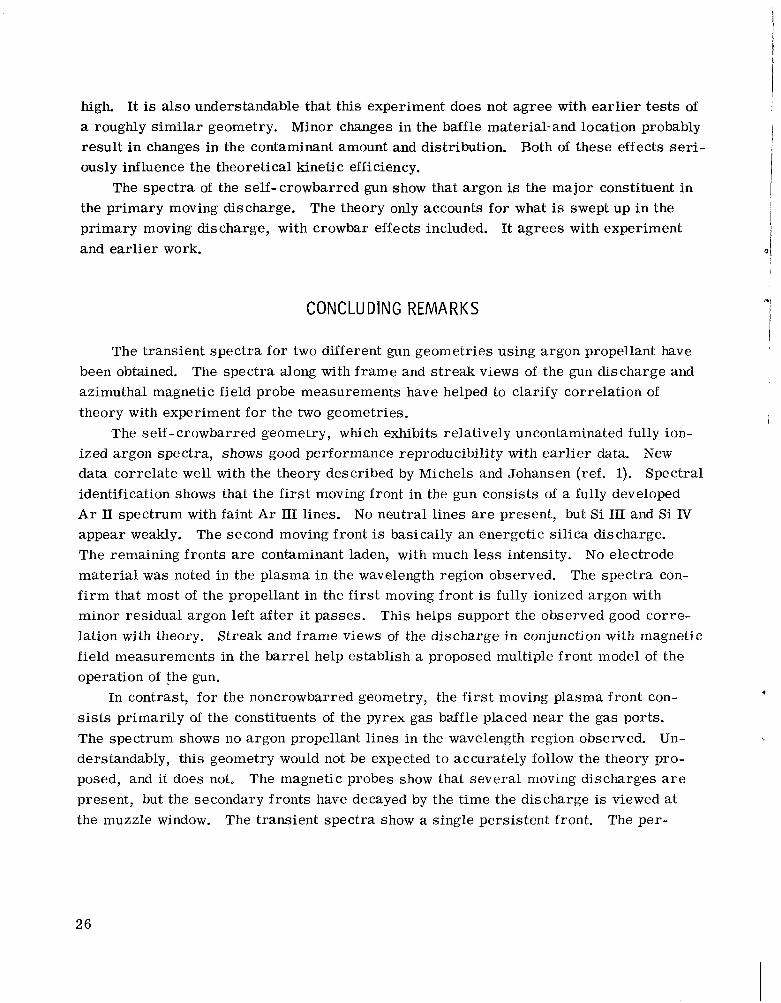
high. It is also understandable that this experiment does not agree with earlier tes ts of a roughly s imilar geometry. Minor changes in the baffle material-and location probably result in changes in the contaminant amount and distribution. Both of these effects seri- ously influence the theoretical kinetic efficiency.
the primary moving discharge. The theory only accounts for what is swept up in the primary moving discharge, with crowbar effects included. It agrees with experiment and earlier work.
The spectra of the self-crowbarred gun show that argon is the major constituent in
CONCLUDING REMARKS
The transient spectra for two different gun geometries using argon propellant have The spectra along with frame and s t reak views of the gun discharge and been obtained.
azimuthal magnetic field probe measurements have helped to clarify correlation of theory with experiment for the two geometries.
ized argon spectra, shows good performance reproducibility with earlier data. New data correlate well with the theory described by Michels and Johansen (ref. 1). Spectral identification shows that the f i rs t moving front in the gun consists of a fully developed Ar 11 spectrum with faint Ar III lines. No neutral lines are present, but Si 111 and Si IV appear weakly. The remaining fronts are contaminant laden, with much less intensity. material was noted in the plasma in the wavelength region observed. f i rm that most of the propellant in the f i r s t moving front is fully ionized argon with minor residual argon left after i t passes. lation with theory. Streak and frame views of the discharge in conjunction with magnetic field measurements in the barrel help establish a proposed multiple front model of the operation of the gun.
s i s t s primarily of the constituents of the pyrex gas baffle placed near the gas ports. The spectrum shows no argon propellant lines in the wavelength region observed. Un- derstandably, this geometry would not be expected to accurately follow the theory pro- posed, and it does not, The magnetic probes show that several moving discharges are present, but the secondary fronts have decayed by the time the discharge is viewed at the muzzle window. The transient spectra show a single persistent front.
The self- crowbarred geometry, which exhibits relatively uncontaminated fully ion-
The second moving front is basically an energetic silica discharge. No electrode
The spectra con-
This helps support the observed good corre-
In contrast, for the noncrowbarred geometry, the f i r s t moving plasma front con-
The per-
I
26

I formance does not agree with earlier tests of a quite similar geometry. in geometry was in the placing, shape, and type of material used for the gas baffle be- hind the gas ports.
The difference i !
! I Lewis Research Center, i
National Aeronautics and Space Administration, , Cleveland, Ohio, October 11, 1967,
I 129-01-05- 14-22. Y
!"
I
i
4
27

APPENDIX - TRANSIENT DIGITAL RECORDER
In earlier investigations (refs. 1 to 3), experimental performance of the gun was ob- tained by tedious and time- consuming manual data processing of oscilloscope t race pho- tographs. Position and t ime surveys and gradient calculations of such surveys for any plasma measurement (electric-field, magnetic-field, particle velocity and energy, and species determinations) were too time consuming and sensitive to manual computing er- rors to be attempted. Specifications were written for a two-channel transient analog-to- digital recorder to record data precisely for la ter incorporation in available laboratory automatic data processing and computing systems. The system was constructed by a contractor, specification checked a t Lewis, and then applied to the present experiment.
The transient digital recorder has the capability of digitizing two analog voltage in- puts a t a maximum rate of 5 million samples per second. The recorder s tores as many as 500 samples of acquired data from each of the two inputs. The stored digitized Sam- ples can be reconstructed to their analog form and presented on an oscilloscope. This method provides a llquick-lookT1 display of the analog signals recorded by the operator. The stored digital data can be punched out on paper tape for later use in a computing system.
convert the analog input signal (&O. 750 V) to a unidirectional signal (0 to 10. 0 V). Each channel has a high-speed analog-to-digital converter which converts the unidirectional signal to a binary-coded digit (seven bits) every 200 nanoseconds.
The traveling-wave-type analog- to-digital converter used in each input channel uti- l izes a signal comparator for each bit of its output code, seven comparators in total per channel. 2l, and 2 weight decisions.
the digitizer. line taps are spaced 200 nanoseconds apart.
5 the input of the delay line, The 2 weight comparator is connected to the next tap so that i t receives the leading edge of the input signal 200 nanoseconds later. other comparators are arranged by order of weight, 200 nanoseconds apart along the de- l ay line. Finally, the 2 weight comparator receives the leading edge of the input analog voltage waveform delayed by 1200 nanoseconds. The end of the delay line is terminated in i ts characteristic impedance to prevent reflections. input signal is presented sequentially (every 200 nsec) to seven comparators. A preci- sion 5-megacycle-per-second clock controls the strobe-like action of the comparators. By the time the leading edge of the input waveform has reached the 2' comparator, seven separate bit decisions have been determined controlled by seven consecutive clock pulses.
Each input channel has a wideband precision amplifier (with dc offset capability) to
6 3 2 That is, one comparator is used to determine each of the 2 , Z5, 24, 2 , 2 ,
The input analog signal is brought to the comparators through an input delay line in Each comparator is connected to a tap on the input delay line. The delay
The 2 weight comparator is connected to
0
6
Likewise, the
0
Hence, the leading edge of the
9,
I I c.
28

To make a correct decision, each comparator must "know" the previous bit decisions, properly delayed in time, along with the input signal level. weight
decision has been made, that comparator has all six previous bit decisions available. The seven decisions on digitizing the leading edge of the analog input signal are now sent to a 500-word memory. After 200 nanoseconds, the next decisions a re sent to the mem- ory. The memory is capable of storing 500 of these words for each channel. (for each bit) is a glass delay line (100-psec delay). recirculated and is available for many hours.
The data contained in the circulating memory a r e sampled by a digital-to-analog converter, and the reconstructed analog signal is displayed on the system oscilloscope. When requested by the operator, the system will punch out on paper tape all the data con- tained in the memory, in the same sequence that i t was collected. First , s ix words of predata instructions are punched on the tape. These instructions serve to identify the experiment, the run number, the type of computing to be performed, and various cali- bration and scale factors for each channel. Then the data, which have been stored in the
0 By the time the 2
The waveform, a t the next time increment after the leading edge, has been '' read". The memory
Once stored, the data is constantly
C h a n n e l A and C h a n n e l 6 analog-to- digital conver te rs
-analog
:al-
i F i g u r e 12. - High-speed data-acquisit ion system.
29
I
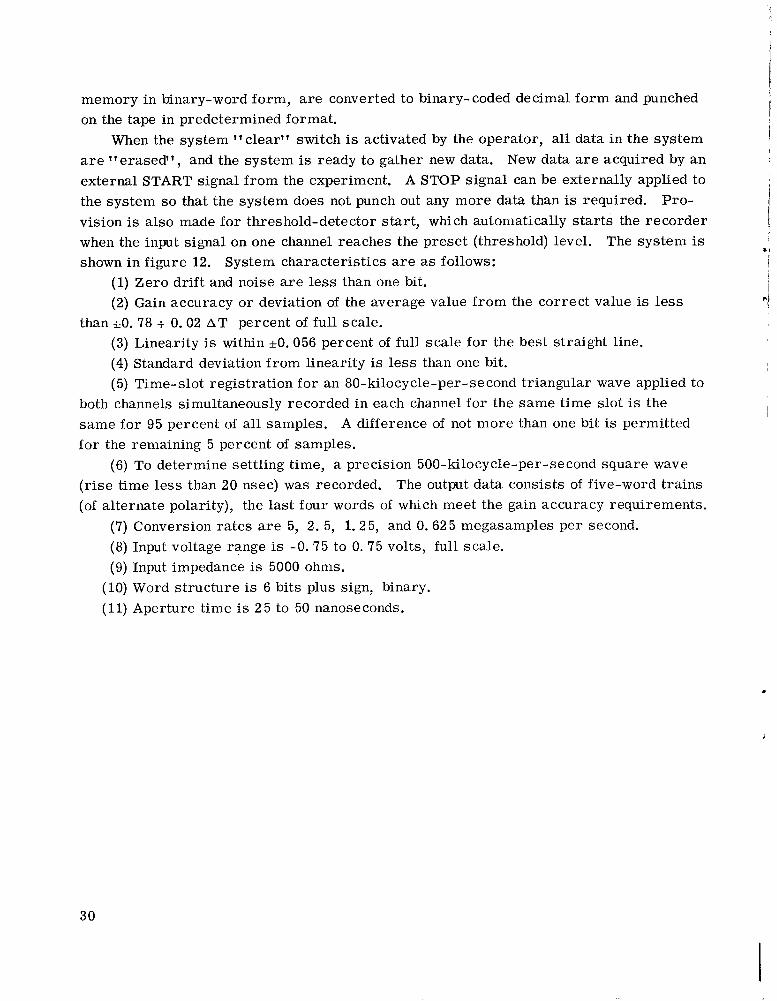
memory in binary-word form, are converted to binary-coded decimal form and punched on the tape in predetermined format.
clear" switch is activated by the operator, all data in the system are "erased", and the system is ready to gather new data. New data a r e acquired by an external START signal from the experiment. A STOP signal can be externally applied to the system so that the system does not punch out any more data than is required. vision is also made for threshold-detector start, which automatically starts the recorder when the input signal on one channel reaches the preset (threshold) level. The system is shown in figure 12.
When the system
Pro-
System characteristics are as follows: (1) Zero drift and noise are less than one bit. (2) Gain accuracy o r deviation of the average value from the correct value is less
than *O. 78 + 0.02 A T percent of full scale. (3) Linearity is within *O. 056 percent of full scale for the best straight line. (4) Standard deviation from linearity is less than one bit. (5) Time-slot registration for an 80-kilocycle-per-second triangular wave applied to
both channels simultaneously recorded in each channel for the same time slot is the same for 95 percent of all samples. A difference of not more than one bit is permitted fo r the remaining 5 percent of samples.
(6) To determine settling time, a precision 500-kilocycle-per-second square wave (rise time less than 20 nsec) was recorded. The output data consists of five-word trains (of alternate polarity), the last four words of which meet the gain accuracy requirements.
(7) Conversion rates are 5, 2. 5, 1.25, and 0.625 megasamples per second. (8) Input voltage range is -0.75 to 0. 75 volts, full scale. (9) Input impedance is 5000 ohms.
(10) Word structure is 6 bits plus sign, binary. (11) Aperture time is 25 to 50 nanoseconds.
ci
i !
.
30

REFERENCES
1. Michels, Charles J. ; and Johansen, Albert E. : Experimental and Theoretical Per-
I formance of Coaxial Plasma Guns. NASA T N D-3469, 1966. 2. Michels, C. J. ; Heighway, J. E. ; and Johansen, A. E. : Analytical and Experimen-
tal Performance of Capacitor Powered Coaxial Plasma Guns. AIAA J. , vol. 4, no. 5, May 1966, pp. 823-830.
* 3. Michels, Charles J. ; and Ramins, Peter: Performance of Coaxial Plasma Gun with Various Propellant. Phys. Fluids, vol. 7, no. 11, pt. 2, Nov. 1964, pp. S71-S74.
4. Michels, Charles J. : Some Transient Electrical Characteristics of the Exhaust of a
i
!-
I Self-Crowbarred Coaxial Plasma Gun. NASA TN D-2571, 1965.
I
I
5. Michels, Charles J. ; and Terdan, Fred F. : Characteristics of a 5-KilojouleY I
Ignitron-Switched, Fast-Capacitor Bank. NASA TN D-2808, 1965.
I 6. Dike, R. S. ; and Kemp, E. L. : Design of a Low Inductance Capacitor and Switch i
Assembly. Rev. Sci. Instr. , vol. 35, no. 4, Apr. 1964, pp. 516-517.
7. Moses, Kenneth G. ; and Korneff, Theodore: Voltage Measurements in the Presence of Strong Fields. Rev. Sci. Instr. , vol. 34, no. 8, Aug. 1963, pp. 849-853.
8. Glasstone, Samuel; and Lovberg, Ralph H. : Controlled Thermonuclear Reactions. D. Van Nostrand Co. , Inc. , 1960, pp. 164-165.
9. Marshall, J. : Hydromagnetic Plasma Gun. Plasma Acceleration. Sidney W. Kash, ed. , Stanford University Press, 1960, pp. 60-72.
10. Kvartskhava, I. F.; Meladze, R. D.; Khautiev, E. Yu.; Reshetnyak, N. G.; and Sinyavskii, A. P. : Limitation on Plasmoid Velocity in Railsotron Devices. Soviet Phys. - Tech. Phys. , vol. 11, no. 4, Oct. 1966, pp. 564-566.
11. Moore, Charlotte E. : Atomic Energy Levels as Derived from the Analyses of Opti- I
1 cal Spectra. Circ. No. 467, vol. 1, National Bureau of Standards, June 15, 1949. 1.
NASA-Langley, 1968 - 25 33-3997 31

National Aeronautics and Space Administration . FIRST CLASS MAIL WASHINGTON. 1). C.
POSTAGE AND FEES PAID NATIONAL AERONAUTICS AND
SPACE AD-ISIIUIION
OFFICIAL BUSINESS
i
POSTMASTER: If Undeliverable (Section 158 Postal Manual) Do Not Return
"The aeronautical and space activities of the United States shall be conducted so as to contribute . . . to the expansion of human knowl- edge of phenomena in the atmosphere and space. The Administration shall provide for the widest practicable and appropriate dissemination of information concerning its activities and the results thereof."
-NATIONAL AERONAUTICS AND SPACE ACT OF 1958
NASA SCIENTIFIC AND TECHNICAL PUBLICATIONS
TECHNICAL REPORTS: Scientific and technical information considered important, complete, and a lasting contribution to existing knowldge.
TECHNICAL NOTES: Information less broad in scope but nevertheless of importance as a contribution to existing knowledge.
TECHNICAL MEMORANDUMS: Information receiving limited distribu- tion because of preliminary data, security classification, or other reasons.
CONTRACTOR REPORTS: Scientific and technical information generated under a NASA contract or grant and considered an important contribution to existing knowledge.
TECHNICAL TRANSLATIONS: Information published in a foreign language considered to merit NASA distribution in English.
SPECIAL PUBLICATIONS: Information derived from or of value to NASA activities. Publications include conference proceedings, monographs, data compilations, handbooks, sourcebooks, and special bibliographies.
TECHNOLOGY UTILIZATION PUBLICATIONS: Information on tech- nology used by NASA that may be of particular interest in commercial and other non-aerospace applications. Publications include Tech Briefs, Technology Utilization Reports and Notes, and Technology Surveys.
. . e
Details on the availability of these publications may be obtained from:
SCIENTIFIC AND TECHNICAL INFORMATION DIVISION
NATIONAL AERONAUTICS AND SPACE ADMINISTRATION
Washington, D.C. PO546