national academy foundation 2012-2016 strategic plan · executive summary the national academy...
TRANSCRIPT

National Academy Foundation2012-2016 Strategic Plan

Table of Contents
Executive Summary.............................................................................................................................................. 1
NAF’s Goals 2012-2016......................................................................................................................................2
NAF Mission, History and Current Programs...............................................................................................3
The Education Landscape...................................................................................................................................5
The NAF Model....................................................................................................................................................7
NAF’s Strategic Framework...............................................................................................................................9 The Drive for Quality..............................................................................................................11 District Strategy and Ration..................................................................................................14 Building to a Gold Standard...................................................................................................19
Performance Metrics...........................................................................................................................................21
Five-Year Strategic Milestones...........................................................................................................................23
High-Level Success Dashboard..........................................................................................................................24
Organizational Implications................................................................................................................................25
Financial Implications...........................................................................................................................................28
Risk Assessment...................................................................................................................................................31
Long-Term Vision..................................................................................................................................................32
Appendix................................................................................................................................................................33
Executive Summary
The National Academy Foundation (NAF) is an acclaimed network of career-themed academies that opens doors for underserved high school students to viable careers and academic success. For 30 years, NAF has refined a proven model that provides young people access to industry-specific curricula, work-based learning experiences, and relationships with business professionals. NAF academies complement traditional high school studies with a focus on one of five career themes – finance, health sciences, hospitality & tourism, information technology, and engineering.
NAF strives to bring high-quality learning experiences to the young people who need them the most, particularly those at high risk of not graduating and those who belong to racial or ethnic minorities. In 2011-12, NAF academies are in 39 states, the District of Columbia and the U. S. Virgin Islands, and in 162 school districts. NAF academies serve nearly 60,000 students in 2011-121.
NAF recently completed a strategic planning process in consultation with The Bridgespan Group. As part of the process, NAF solicited feedback from a wide range of stakeholders to confirm its role in high school reform and to probe its future direction. This resulted in a bold five-year business plan that charts the course to significantly increase NAF’s impact in preparing more young people for college and career success.
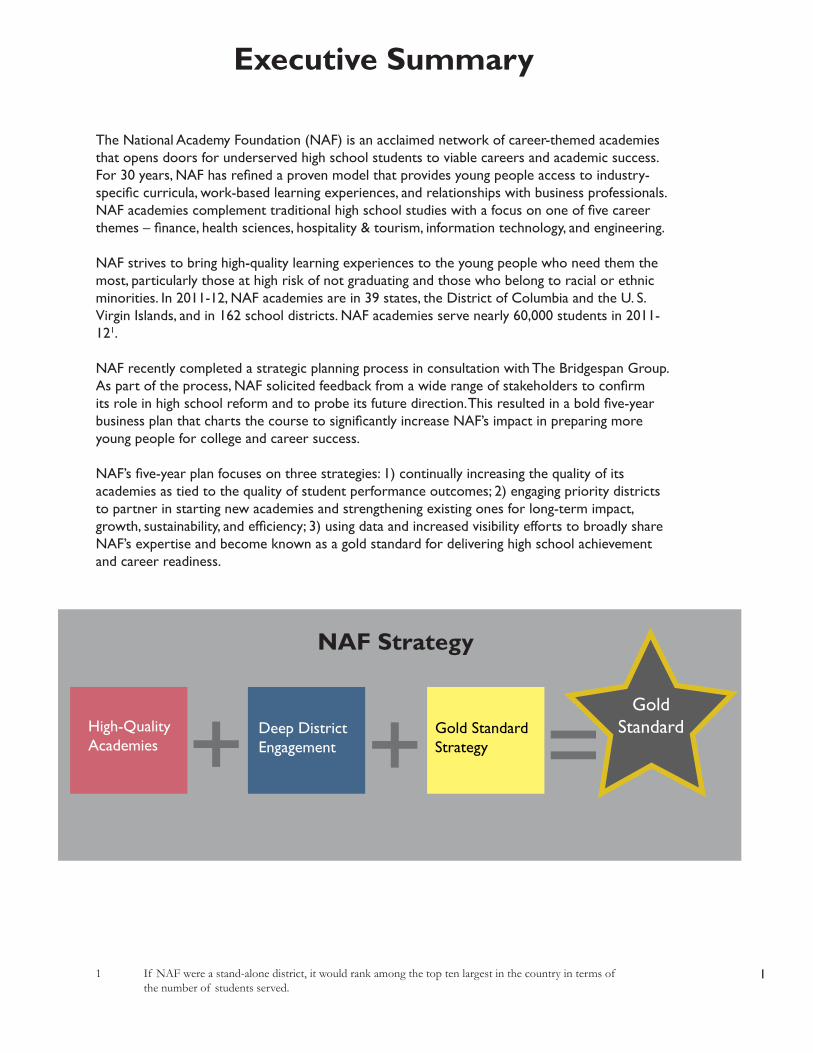
NAF’s five-year plan focuses on three strategies: 1) continually increasing the quality of its academies as tied to the quality of student performance outcomes; 2) engaging priority districts to partner in starting new academies and strengthening existing ones for long-term impact, growth, sustainability, and efficiency; 3) using data and increased visibility efforts to broadly share NAF’s expertise and become known as a gold standard for delivering high school achievement and career readiness.
NAF Strategy
High-Quality Academies
Deep District Engagement
Gold StandardStrategy
Gold Standard+ + =
1 1 If NAFwereastand-alonedistrict,itwouldrankamongthetoptenlargestinthecountryintermsof thenumberof studentsserved.

NAF’s Goals 2012-2016
High-Quality Academies
NAF will transition from a focus on the number of academies in its network to the number of high school students who graduate from NAF academies and who can be certified college and career ready (C&CR).
The NAF academy approach will deliver these better results at a systems cost that is less than 5% over the current per-student cost of public schools, as it does today.
NAF will complete an integrated data system to track student performance from 9th grade through to post-secondary that is linked with academy performance data.
Deep District Engagement
NAF will concentrate its growth efforts in districts with the highest numbers of students at-risk of academic failure and serve more at-risk students than the district population while delivering better outcomes.
• Deep engagement with priority districts provides a number of efficiency and impact benefits including leveraging existing resources and reducing costs per academy and student; sustainability by mitigating risk of individual leadership changes; broad-based support that facilitates implementation at higher fidelity; and the ability to reach higher numbers of NAF’s targeted student population.
Gold Standard Strategy
NAF will emerge from being a network of individual academies to become a unified gold standard for delivering high school achievement.
• This visibility will, in turn create more demand and support for NAF academies and provide more opportunities for NAF to help change education in America.
NAF will commit to graduate at least 100,000 students college and career ready by 2020, an average increase of 7% per year.
• The ability to reach this goal is dependent upon all academies implementing the NAF model with higher fidelity. In achieving this goal, NAF will become as large as the 5th largest high school district in America (from top 10 today) and will use this base to help inspire systemic change beyond its own network of academies.
By partnering deeply with the nation’s largest districts and growing enrollment from 60,000 students today to 100,000+ students annually, NAF will help thousands more students, strengthening the country’s key districts and demonstrating the power of career academies in delivering long-term outcomes.
2

NAF originated with the idea of “schools within schools” when America’s visionary financier and philanthropist, Sanford I. Weill, first imagined a public academy to provide high school students with access to careers in the financial services industry. His proposal to the New York City Board of Education resulted in the first Academy of Finance in a Brooklyn public high school in 1982.
Today, led by NAF President, JD Hoye, who headed of the Office of School-to-Work in the Clinton Administration, the organization supports 483 academies. Nearly 60,000 students are enrolled in the 2011-12 school year, with 63% at the poverty level based on eligibility for federal free and reduced price lunch. NAF’s student body is highly diverse with 67% of students coming from Hispanic/Latino or Black/African American backgrounds.
NAF’s track record of success includes the following:• 97% of NAF seniors graduated from high school in 2011 • 81% of students plan to pursue college or other post-secondary education2
• 52% percent of graduates earn bachelor’s degrees in four years, compared with 32% nationally3 • 85% of five- and ten-year alumni are working in a professional field3
• Graduates produced sustained earnings gains that averaged 11% over non-academy peers5 • NAF students stayed on track or got on track to graduate at a higher rate than high school
students in their same districts.5
Figure 1: Percent On Track, NAF Students vs Non-NAF Students from Grade 9 to 10
NAF History and Current Programs
2 December2011.PerformanceMeasurementSystem,2011-12StatusReport,Part1:DataCenter, SelectData.NationalAcademyFoundation.3 MargaretTerryOrr,ThomasBailey,KatherineL.Hughes,MelindaMechurKarp,andGregoryS. Kienzl.2004.TheNationalAcademyFoundation’sCareerAcademies:Shaping PostsecondaryTransitions.InstituteonEducationandtheEconomy,TeachersCollege,Columbia University.4 JamesJ.KemplewithCynthiaWillner.2008.CareerAcademies:Long-TermImpactsonLaborMarket Outcomes,EducationalAttainment,andTransitionstoAdulthood.MDRC.5 February2012.PerformanceMeasurementSystem,2011StatusReport,Part2:StudentCharacteristics andPerformanceData.NationalAcademyFoundation.
Still highlyat risk
77%
Now on track, 23%
Still on
track
85%
Now highly at risk15%
On track
68%
Highly at risk
32%
On track
68%
Highly at risk
32%
Still highly at risk70%
Now on track, 30%
Still on
track
88%
Now highly at risk12%
9th grade
10th grade 10th grade
9th grade
NAF Students District Students
3

Since 2005, NAF has focused its efforts on:
I. Revamping its curricular offerings to keep current with the emerging trends in the career themes it serves, along with developing its workplace learning and advisory board development supports.
II. Pioneering a student certification and assessment system designed to bridge the gap between high school career-technical programs, post-secondary articulation and admission policies, and workforce readiness initiatives. III. Codifying academy standards and formally assessing academies against these. IV. Developing and launching its two newest career themes, the Academy of Engineering (2007) and the Academy of Health Sciences (2011).
Despite (or because of) the current economic environment and public education crisis, demand for NAF is growing; in the last year, NAF had the largest growth of students in its history. NAF is now ready to build on its strong foundation to support more students in becoming college and career ready.
2/3 of NAF students are eligible for free- and reduced- price lunch
NAF Student Profile 2011-2012
8,510 students
11,294 students
15,981 students
2,803 students
20,342 students
Hispanic/Latino36%
Black/African American
31%
White/Caucasian
21%
Asian/Pacific Islander
9%
Multi-Racial/Other
3%
HEALTH SCIENCES

Since the 1970s, the American education system, which once led other nations, has been increasingly failing the youth it is intended to serve. This failure is most pronounced in schools serving lower income and minority students. The No Child Left Behind Act, and many years earlier, A Nation at Risk, were national calls to action to close the achievement gap. Given the current state of the economy, projections for increased global competition, and rapidly advancing technology systems, there are growing pressures on almost all participants in the education system to attain quality and equity. These will need to be delivered upon without major infusions of extra funding.
At the turn of the millennium, the call was to increase the rate of high school graduation. Since then, the gap between what is required for a high school diploma and for economic viability has grown larger at a quickening pace. With the increasingly complex knowledge needed to succeed in any of the growing sectors of the economy, the value of a high school degree as an end goal has become insufficient. Alongside this shift is a rising awareness of the wide disparity from state to state in expectations for student outcomes, with many setting them too low. Finally, there is a divide between the educational and business communities about what students need to know and be able to do. While there seems to be widespread agreement about the need for both “rigor and relevance,”defining what makes students college and career ready requires greater articulation.
These factors led to the development of the Common Core States Standards (though these are limited in the subject areas they cover) and the necessity to define these standards in terms of what makes a high school graduate ready for college and careers.
The current push for ensuring that all students are college and career ready will take many years to accomplish (the steady decline in the percent of youth graduating from high school only recently began to reverse.)While the articulation of college readiness is farther along, defining standards for career readiness involves larger challenges in developing agreement among industry, political, and educational leaders on how to link academic understanding to employability skills. Historically, expectations for career skills and behavioral expectations were developed apart from academic knowledge and skill standards.
The largest challenge to bringing industry-valued and validated curriculum to schools for every young person is our mind-set about the purpose of education. As has been demonstrated by its 30 years of work, the National Academy Foundation understands that the high school years are a critical time to introduce and inspire young people to pursue emerging careers that require specific technical, behavioral, and academic skills. NAF has taken a leadership position in designing high school curriculum and assessments which assure that graduates are equipped with skills for both college and the workplace. 6
The Education Landscape“In a global economy where the most valuable skill you can sell is your knowledge, a good education is no longer just a pathway to opportunity--it is a prerequisite. And yet, we have one of the highest high school dropout rates of any industrialized nation. And half of the students who begin college never finish. This is a prescription for economic decline.”
President Barack Obama, 2009 State of the Union Address
6 AppendixX:NAFIntendedStudentLearningOutcomes:Knowledge,AbilitiesandDispositions EssentialforCollegeandCareerReadiness
5

Research on career academies, such as that conducted by MDRC in 2008, points to the powerful impact that results from combining classroom and workplace learning. This study, of which NAF academies were a part, found that career-academy graduates earned an average of 11% more in total earnings over the eight years following high school than their non-academy peers. The NAF curriculum is designed to drive the connections between college and career readiness and support the entire NAF academy model by applying the research-based practices of project-based instruction and literacy improvement to industry-developed content. Additionally, students engage practicing professionals in their project work and stay focused on their long term goals. While NAF supports and helps students to master the Common Core, it uses an educational approach that integrates them across subject areas and applies them to real-world problems. This approach builds students’ persistence, self-efficacy and self-management.
Overall, NAF is committed to transforming the high school experience to bring it beyond the sorting structure of the past (where students were categorized as ready for college or ready for work.) NAF’s role in high school reform is as a catalytic partner working closely with public school districts to add innovative curriculum, instruction and workplace connections to the high school program. NAF brings rigor and relevance to a multiple pathway model that aspires to have all students ready for post-secondary education and, ultimately, for their careers. This demands the integration of courses, project-based learning, core numeracy/literacy and, essentially, restructuring the four-year high school experience. It is more than throwing in specialized courses – it is an intentionally sequenced and integrated set of academics and work-based learning experiences that are designed to build upon the best of K-8 practices with a specific eye to the demands that await students after high school.
To dramatically change the odds of one in three students not graduating, high school must be the leverage point for change. While efforts to create and demonstrate the power of unique approaches to high school are valuable, they have proven hard to scale with large numbers of students. NAF’s quality academy model (which already serves 60,000 students nationally) can be a force for improving high schools more quickly than the approaches that require building the whole structure of high school anew. NAF is a partner with schools in helping them accomplish their goal of graduating college- and career-ready students.
6
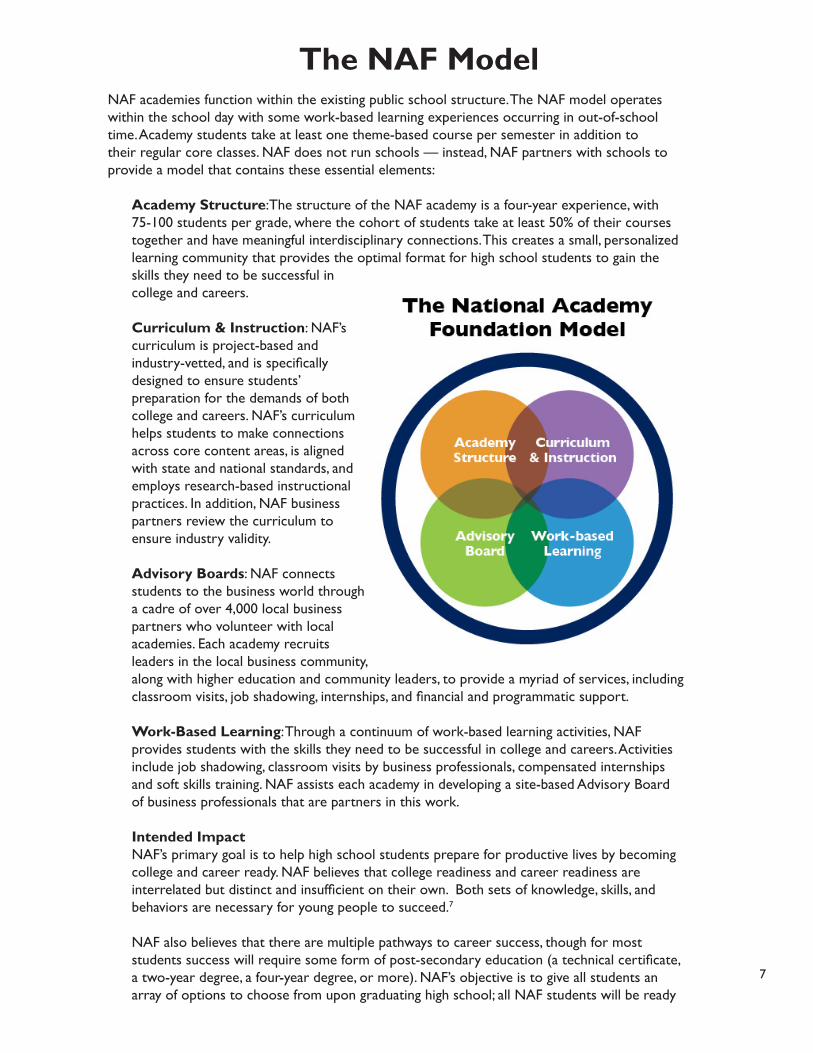
NAF academies function within the existing public school structure. The NAF model operates within the school day with some work-based learning experiences occurring in out-of-school time. Academy students take at least one theme-based course per semester in addition to their regular core classes. NAF does not run schools — instead, NAF partners with schools to provide a model that contains these essential elements:
Academy Structure:The structure of the NAF academy is a four-year experience, with 75-100 students per grade, where the cohort of students take at least 50% of their courses together and have meaningful interdisciplinary connections. This creates a small, personalized learning community that provides the optimal format for high school students to gain the skills they need to be successful in college and careers.
Curriculum & Instruction: NAF’s curriculum is project-based and industry-vetted, and is specifically designed to ensure students’ preparation for the demands of both college and careers. NAF’s curriculum helps students to make connections across core content areas, is aligned with state and national standards, and employs research-based instructional practices. In addition, NAF business partners review the curriculum to ensure industry validity.
Advisory Boards: NAF connects students to the business world through a cadre of over 4,000 local business partners who volunteer with local academies. Each academy recruits leaders in the local business community, along with higher education and community leaders, to provide a myriad of services, including classroom visits, job shadowing, internships, and financial and programmatic support.
Work-Based Learning: Through a continuum of work-based learning activities, NAF provides students with the skills they need to be successful in college and careers. Activities include job shadowing, classroom visits by business professionals, compensated internships and soft skills training. NAF assists each academy in developing a site-based Advisory Board of business professionals that are partners in this work.
Intended ImpactNAF’s primary goal is to help high school students prepare for productive lives by becoming college and career ready. NAF believes that college readiness and career readiness are interrelated but distinct and insufficient on their own. Both sets of knowledge, skills, and behaviors are necessary for young people to succeed.7
NAF also believes that there are multiple pathways to career success, though for most students success will require some form of post-secondary education (a technical certificate, a two-year degree, a four-year degree, or more). NAF’s objective is to give all students an array of options to choose from upon graduating high school; all NAF students will be ready
The NAF Model
7

to succeed in college and beyond, even if they choose to pursue other post-secondary education or training paths.
To support its extensive network, NAF has developed a comprehensive approach to supporting implementation of a full college and career program. This support builds the capacity of academy leaders, teachers and volunteers and addresses a range of knowledge required to effectively address student needs. The topics center on instructional expertise, including project-based learning, literacy instruction, curriculum integration, assessment and linking to the Common Core Standards. Beyond the classroom, professional development includes training on academy development including: building an effective advisory board, student recruitment, scheduling, and budgeting. Further professional development supports administrators and volunteers building a workplace learning program that culminates in internships. NAF provides a full continuum of site based supports, including training from academy and instructional specialists. Additional support is offered through virtual trainings and NAF eCollege, an online campus that provides short modules and longer immersion courses. NAF’s annual conference brings together representatives from all of its academies to share effective practices, plan for improvements, and learn from outstanding leaders and thinkers in business and education.
7 PathwaystoProsperityProject.2011.PathwaystoProsperity:MeetingtheChallengeof Preparing YoungAmericansforthe21stCentury.HarvardGraduateSchoolof Education.
8

During 2011, NAF’s management and Board of Directors, along with select district leaders, network members, and academy students created a business plan for the next five years in order to significantly increase the organization’s impact. As NAF solicited feedback from this wide variety of stakeholders during the strategic planning process, these interactions consistently identified several ways in which the NAF model simultaneously meets the needs of many key stakeholder groups:
• NAF is unique in its emphasis on both college and career readiness; NAF accomplishes this through a relevant, rigorous, and evaluated approach to career experiences and academic readiness made successful by involving the business sector to inform rigor and provide students with work-based learning opportunities.
• NAF sustainably integrates the business community into the educational process to inform criteria for measuring educational success (going beyond high school graduation); to support education through funding, work-based experiences, and to increase the sustainability of the NAF model and other policies by mitigating the risk associated with school leadership transitions.
• While in the education field, the definition of ‘college readiness’ has been largely codified and accepted, ‘career readiness’ is still being defined. NAF is well-positioned as a high-quality practitioner in both areas to define how career readiness is complementary yet distinct.
• Enhanced college and career readiness makes NAF more valuable as students become participants in and contributors to postsecondary education and careers, especially compared to the majority of organizations that focus primarily on academic preparation.
• Districts and schools seeking to improve student outcomes, especially for those at risk of academic failure, view NAF as a ready-made solution and partner.
• NAF is a low-cost model, building on the public education system’s existing infrastructure. Total annual costs per NAF student are less than 5% of the current per-student costs of public schools (less than $500 per student for NAF and districts costs combined). Because students are more likely to graduate, there are significant additional savings gleaned by a district by using the NAF model.
• Despite (or because of) the current economic environment and public education crisis, demand for NAF is growing; in the last year NAF had the largest growth in students in its history.
Given these strengths and opportunities, NAF’s board, staff, and funders who were surveyed agree that now is the time for NAF to pursue a large step up in its reach and impact. NAF’s five-year plan focuses on three strategies: 1) continually increasing the quality of its academies as tied to the quality of student performance outcomes; 2) engaging priority districts to partner in starting new academies and strengthening existing ones for long-term impact, growth, sustainability, and efficiency; 3) using data and increased visibility efforts to broadly share NAF’s expertise in delivering high school achievement and career readiness.
NAF’s Strategic Framework
8 TheBridgespanGroupengagedboardmembers;15districtsuperintendents,deputies,andCTE leaders(inAtlanta,Rochester,Hartford,NYC,Miami,Porterville,andSeattle);15principals,academy directorsandleadfaculty;advisoryboardmembers;students;funders;educationexperts; andNAFstaff andnetworkmembersthroughinterviews,sitevisits,datarequests,afield survey,andfocusgroups.
9
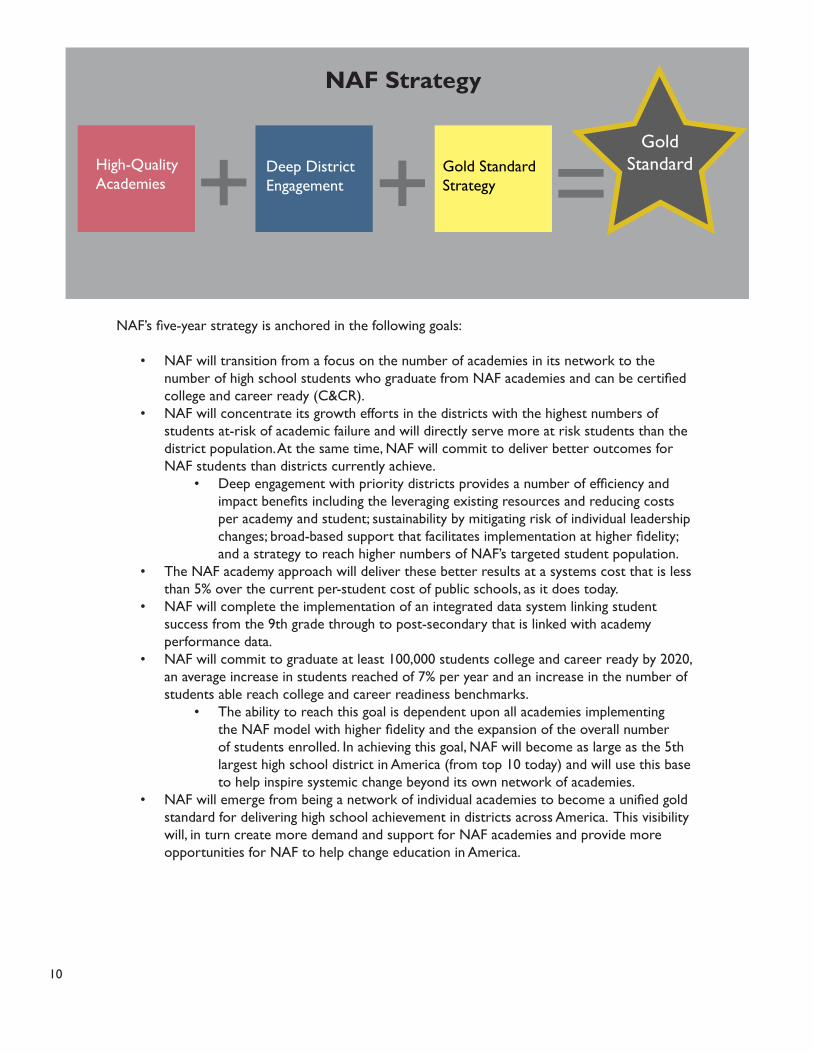
NAF’s five-year strategy is anchored in the following goals:
• NAF will transition from a focus on the number of academies in its network to the number of high school students who graduate from NAF academies and can be certified college and career ready (C&CR).
• NAF will concentrate its growth efforts in the districts with the highest numbers of students at-risk of academic failure and will directly serve more at risk students than the district population. At the same time, NAF will commit to deliver better outcomes for NAF students than districts currently achieve.
• Deep engagement with priority districts provides a number of efficiency and impact benefits including the leveraging existing resources and reducing costs per academy and student; sustainability by mitigating risk of individual leadership changes; broad-based support that facilitates implementation at higher fidelity; and a strategy to reach higher numbers of NAF’s targeted student population.
• The NAF academy approach will deliver these better results at a systems cost that is less than 5% over the current per-student cost of public schools, as it does today.
• NAF will complete the implementation of an integrated data system linking student success from the 9th grade through to post-secondary that is linked with academy performance data.
• NAF will commit to graduate at least 100,000 students college and career ready by 2020, an average increase in students reached of 7% per year and an increase in the number of students able reach college and career readiness benchmarks.
• The ability to reach this goal is dependent upon all academies implementing the NAF model with higher fidelity and the expansion of the overall number of students enrolled. In achieving this goal, NAF will become as large as the 5th largest high school district in America (from top 10 today) and will use this base to help inspire systemic change beyond its own network of academies.
• NAF will emerge from being a network of individual academies to become a unified gold standard for delivering high school achievement in districts across America. This visibility will, in turn create more demand and support for NAF academies and provide more opportunities for NAF to help change education in America.
NAF Strategy
High-Quality Academies
Deep District Engagement
Gold StandardStrategy
Gold Standard+ + =
10

Strategy #1: The Drive for Quality
NAF is focused on growing the quality of its academies as tied to the quality of student performance outcomes. NAF’s five-year plan centers on ensuring consistently high-quality academies that prepare over 90% of the entering 9th grade students to be college and career ready by the time they leave high school. Over the next three years, low performing (Affiliate level) academies will either need to embrace a plan to improve quality or leave the network.
Academy Quality: NAF began addressing network quality in 2009 by codifying academy standards and conducting two years of assessment of its academies against those standards. As Figure 2 indicates, the vast majority of NAF’s student population in 2011-12 was served by medium- (Member) or high-quality (Leader I or II, and Distinguished) academies.
In 2012, 94% of academies completed the Academy Assessment, as compared to 91% in 2011. In comparing data on the 339 academies that completed the Academy Assessment in each of two years, positive movement is shown across the levels (Affiliate, Member, Leader 1, and Leader II) with 62% of academies improving or maintaining Leader status, 15% staying in Member level and 23% declining or remaining low in fidelity to the model. NAF will focus on sustaining these gains (toward an overall goal of having 75% of academies rate at the Leader level or higher with corresponding student results by 2016) in the following ways:
• Leaders I and II: Highlight success stories and spread best practices; work to increase the academy size to over 200 students; provide intensive services to lower-level Leaders in high-priority districts.
• Members: Provide ongoing services to help Members become Leaders; provide intensive services to Members with lower outcomes in high-priority districts.
• Affiliates: Invest in high-potential Affiliates in high-priority districts; disaffiliate low-potential Affiliates in low-priority districts.
Figure 2: NAF Academies by Membership Level in 2011-12*
*The chart only includes academies that completed the 2012 Academy Assessment. Academies in their Year of Planning do not complete the assessment.
Affiliate7,403
students
Member14,779
studentsLeader I20,588
students
Leader II 4,400
students
Distinguished2,968
students
2011-2012Student Enrollment
11
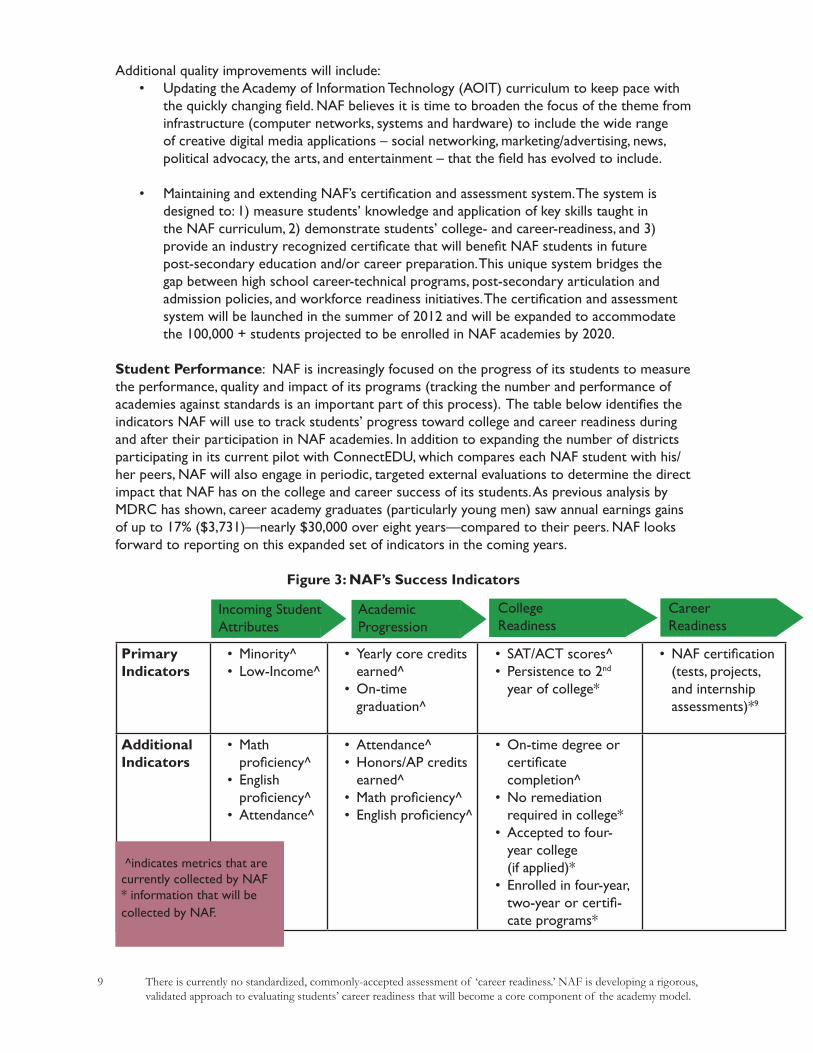
Additional quality improvements will include: • Updating the Academy of Information Technology (AOIT) curriculum to keep pace with
the quickly changing field. NAF believes it is time to broaden the focus of the theme from infrastructure (computer networks, systems and hardware) to include the wide range of creative digital media applications – social networking, marketing/advertising, news, political advocacy, the arts, and entertainment – that the field has evolved to include.
• Maintaining and extending NAF’s certification and assessment system. The system is designed to: 1) measure students’ knowledge and application of key skills taught in the NAF curriculum, 2) demonstrate students’ college- and career-readiness, and 3) provide an industry recognized certificate that will benefit NAF students in future post-secondary education and/or career preparation. This unique system bridges the gap between high school career-technical programs, post-secondary articulation and admission policies, and workforce readiness initiatives. The certification and assessment system will be launched in the summer of 2012 and will be expanded to accommodate the 100,000 + students projected to be enrolled in NAF academies by 2020.
Student Performance: NAF is increasingly focused on the progress of its students to measure the performance, quality and impact of its programs (tracking the number and performance of academies against standards is an important part of this process). The table below identifies the indicators NAF will use to track students’ progress toward college and career readiness during and after their participation in NAF academies. In addition to expanding the number of districts participating in its current pilot with ConnectEDU, which compares each NAF student with his/her peers, NAF will also engage in periodic, targeted external evaluations to determine the direct impact that NAF has on the college and career success of its students. As previous analysis by MDRC has shown, career academy graduates (particularly young men) saw annual earnings gains of up to 17% ($3,731)—nearly $30,000 over eight years—compared to their peers. NAF looks forward to reporting on this expanded set of indicators in the coming years.
Figure 3: NAF’s Success Indicators
Primary Indicators
• Minority^• Low-Income^
• Yearly core credits earned^
• On-time graduation^
• SAT/ACT scores^• Persistence to 2nd
year of college*
• NAF certification (tests, projects, and internship assessments)*9
Additional Indicators
• Math proficiency^
• English proficiency^
• Attendance^
• Attendance^• Honors/AP credits
earned^• Math proficiency^• English proficiency^
• On-time degree or certificate completion^
• No remediation required in college*
• Accepted to four-year college (if applied)*
• Enrolled in four-year, two-year or certifi-cate programs*
Incoming Student Attributes
Academic Progression
College Readiness
CareerReadiness
^indicates metrics that are currently collected by NAF* information that will be collected by NAF.
9 Thereiscurrentlynostandardized,commonly-acceptedassessmentof ‘careerreadiness.’NAFisdevelopingarigorous, validatedapproachtoevaluatingstudents’careerreadinessthatwillbecomeacorecomponentof theacademymodel.

Target Beneficiaries: While NAF’s model is non-selective and designed to serve all students, to help close the national achievement gap, NAF will focus growth in districts with the highest numbers of students who are at-risk of academic failure. The goal is for NAF’s incoming student population to be similar to that of the top 20 urban districts in America. Thus, NAF will monitor indicators such as the percentage of students from ethnic minorities, who receive free- and reduced-price lunch, and whose previous academic performance suggests that they are at risk of academic failure. Currently, 63% of NAF’s students are at the poverty level based on eligibility for federal free and reduced price lunch and 67% of students come from Hispanic/Latino or Black/African American backgrounds.
In Figure 4, 9th graders entering NAF academies in eight districts are compared to district populations on the key indicators, showing NAF 9th graders as similar or more at risk than the district population. NAF emphasizes to all academies the importance of using an open enrollment process.
Figure 4: Comparison of NAF 9th Grade Students to District Students in 2010-1110
Incoming 9th Graders NAF DistrictsBlack & Hispanic 80% 69%Low-income 67% 60%Math proficiency 67% 61%English proficiency 36% 40%
Integrated Data System: NAF is building a data system as part of its five-year strategic plan in order to integrate, automate and connect its data. Currently, the information collected on student and academy performance is in separate databases that are not connected. This requires extensive staff time to provide manual analysis of millions of data elements. An integrated data system will automate these analytics and provide real-time reports to NAF and the academies on performance, allowing both to understand effectiveness and areas for improvement (across the network, within the program model and for individual districts and academies.) In addition, through the development of an integrated system, NAF will collect and draw from its own longitudinal data. This information is critical to understanding the long-term impact on cohorts of students who participate in high-quality NAF academies and move to post-secondary education and employment. The system is integral to all three aspects of NAF’s strategic plan, and to NAF’s ability to drive quality and measure the impact of its model.
Investments for implementing NAF’s Quality improvements will require $18.3 million over five years (55% of the total growth funding envisioned.) Some of these costs include:
• $6.6M to complete the integrated data system,• $2.6M for additional and more specialized staff to improve Members and Leaders with
lower outcomes,• $2.8M for additional investment in academy professional development to match the
growth of the network,• $1.5M for updating Academy of Information Technology curriculum• $3.1M for maintain and extend certification and assessment system• $0.6M for additional investments in NAF’s advisory board, work-based learning model,
and industry connections, and• $0.4M for investments in NAF’s connections with middle schools and post-secondary
institutions.
10 ComparisonusingConnectEDUdataof 2,242NAFstudentsin75academiesto67,626studentsinfivedistricts —Miami-Dade,NewYorkCity,Broward,Porterville,andBaltimore. 13
Strategy # 2: District Strategy and Rational
Demand for Growth: For much of its 30-year history, NAF grew one academy at a time to become a network of 483 academies and nearly 60,000 students. In 2011-12 alone, NAF has opened more than 40 new academies, with an additional 60 academies in the planning and development phase. NAF projects continued growth and demand for its model as career academies are increasingly recognized by school reformers, evaluators, and the education community as a successful strategy for preparing students for college and professional careers with an emphasis on 21st Century skills.
Readiness to Scale Impact: NAF has a strong foundation to increase its impact as a result of recent efforts to strengthen the organization and network.
• The leadership team is strong, experienced, and expanding. Senior leaders have significant experience and are highly regarded by board members and external partners. In addition, there is increased depth and expertise among central and regional staff, many of whom have established key partnerships with district leaders.
• The work to improve network performance has established a strong launch pad:• Regional team pilots have informed NAF’s understanding of the most effective
services and the most efficient organizational structure required to support districts and academies.
• The process to improve network quality, begun in 2007 and continuing through 2012, will result in the removal of significantly under-performing academies.
• Ninety-four percent of academies participated in the 2011-12 Academy Assessment. Initial results have already informed NAF’s ongoing network support and professional development offerings.
• NAF’s data systems are much improved, with additional work required to facilitate system-wide metrics:
• NAF collects student-level data through its partnership with ConnectEDU. This system provides annual data on test scores, attendance, credits earned and many other indicators for both NAF students and all 9-12th grade students in the district. In 2011, NAF grew this effort to include 119 academies across eight school districts. In 2012, NAF plans to expand the system to 200 academies while also attempting to collect students’ 8th grade test results to establish an earlier baseline.
• NAF’s two newest themes, Engineering and Health Sciences, have expanded the range of offerings, enabling NAF to grow further in existing schools and districts.
A Deep District Strategy: As NAF continues to build great individual academies, it will increasingly focus on engaging priority districts for long-term impact, growth, sustainability, and efficiency. This makes sense for NAF—both in terms of the organization’s strong foundation and its long-term goals—and for the nation’s leading districts, all of which are seeking proven models that can deliver improved outcomes.
NAF’s district strategy is the next logical step in its evolution from a collection of individual academies spread across the country to a national partner for districts that serve students with the greatest needs. This approach has worked well in individual districts, such as Miami-Dade where NAF is already serving over 5% of the students in the fifth largest district in America, to smaller districts such as Porterville and Hartford, where NAF’s penetration is over 16% and where NAF students are outperforming district students. The following charts indicate recent academic improvements for the NAF students in these districts where NAF has been working closely with district leadership in an intentional and growth-oriented direction:
14

Figure 5 shows the change in Connecticut Academic Performance Test (CAPT) results over a two year period of 2009-10 to 2010-11 with the Hartford Public School District in Hartford, CT. The bars represent change for students enrolled in three district NAF academies compared to all students district-wide.
Figure 6 shows a comparison of 6,057 NAF students to 104,151 of their non-NAF peers in Miami-Dade Public Schools where NAF serves over 5% of students. Ninety-three percent of NAF students are Hispanic/Latino and/or Black/African American compared to 89% across the district. More NAF students live in poverty (64%) compared to their peers across the district (58%).
Figure 6: Select Metrics, Miami-Dade Overall vs. NAF Enrollment 2010-11
11.710.1
3
15.5
3.2-4 -8 0.3
Average Change (2010-11) in Percent At or Above Proficient for the
Connecticut Academic Performance Test (CAPT)Hartford Public Schools
NAF academies Non-NAF
15
Figure 5: Average Change in Proficiency on the Connecticut Academic Performance Test, Hartford Public Schools
Math Science Reading Writing

Some of NAF’s most promising new opportunities are developing in districts and states such as Oklahoma City and Kentucky, where the local leadership is looking to NAF to be a major player in transforming the results of entire districts in need. These leaders (and others) are not willing to accept slow improvements delivered one school at a time, but are seeking to work with proven methods that can be rolled out across many schools. Deeper partnership with NAF will increase the skills and capacity of the districts to support higher performing academies more consistently over time.
NAF has a broad platform base to build a district strategy. NAF already has meaningful penetration in eight of the top 20 districts (with academies in over a third of the other large districts) nationally and deep penetration (more than 5% of district students) in over 45 additional districts.
The development of NAF’s new district strategy was based on analysis and interviews with seven school districts (Atlanta, Hartford, Miami-Dade, New York City, Porterville, Rochester, and Seattle) and over 35 additional interviews. The reasoning behind the strategy was reviewed with academy and district leaders, NAF staff, and board members. The fundamental building block of NAF will continue to be high-quality, data-driven academies, but the sustainable architecture of establishing NAF in each major community will move toward creating important relationships that link the academy, school, district, and business communities. The entry point can either be from individual academies and reaching up to the district or in response to district-level requests and moving out to schools. NAF’s regional development teams will focus on both academy and district success with meaningful support from NAF headquarters.
For NAF, deep engagement with priority districts provides a number of efficiency and impact benefits, including:
• Scale: District support enables more students per academy and academies per district, reduced costs per academy and student, and the addition of existing district resources.
• Sustainability: Engagement and support throughout district and school leadership increases ongoing commitment and resources to NAF’s model, mitigating risk of individual leadership changes and increasing district focus and support for career academy development. This includes securing targeted support from regional and community foundations, for which NAF’s district concentration will be important.
• Quality: Broad-based support facilitates implementation of NAF’s model at a higher level of fidelity by ensuring the existence of necessary accountability processes and school structures.
• Target Population: Careful district selection is the quickest way to serve target beneficiaries. Partnering with district leaders can ensure NAF attracts and serves these youth within priority districts.
Similarly, districts and their leaders receive multiple benefits by working with NAF across multiple schools and academies through deep engagement because they see NAF as a school transformation agent that provides a relevant, proven solution to helping students become college and career ready.
16

For districts, NAF:
• Aligns with their goals and needs, providing a range of high school choices for students and school design expertise for leaders,
• Is a proven model for helping all students and comes ready-made with professional development for faculty and built-in measurement and data systems,
• Provides a high return on investment, where a less than five percent increase in annual costs generate significantly higher student outcomes,
• Increases student retention and success rates that can help schools secure additional state funding based on student attendance, and
• Attracts and incorporates support from a broad coalition of local partners (business groups, parents, etc.) that districts are eager to engage.
Process and criteria: Deep engagement with a district will develop through three phases: (1) identification, outreach and planning, (2) initial implementation, and (3) ongoing support, with additional investment required from both NAF and the districts to get started. For NAF, these investments involve additional expert staff to build relationships and develop a multi-year implementation plan with district leadership. Working with NAF advisors, districts will need to allocate portions of existing or new staff time to coordinate and facilitate faculty and leader development as well as any structural changes required. NAF and the district will collaborate to create a broad coalition of local partners including the school board, the business community, higher education, parents, and others. As NAF penetration in the district increases over time, these initial investments will result in lower per-student costs and higher quality and impact per academy as indicated in the conceptual chart below.
Reaching the goal of graduating 100,000 college- and career-ready students by 2020 will require major growth in the largest districts. NAF will concentrate its resources and growth on partnerships with districts whose students have the greatest need and that represent the greatest opportunities for scaled impact. NAF has developed an initial list of prioritized districts (see Appendix) based on a newly developed district readiness rating tool. The readiness ratings are based on quantitative and qualitative measures, with focus on targeting poor performing districts and the following criteria:
1. Size and potential for NAF growth2. Concentration of target beneficiaries 3. Degree of district/superintendent willingness to partner with NAF, leadership strength and
consistency, reform vision and budget commitment4. Contextual factors such as state policies and initiatives5. Presence and commitment of business/community partnerships6. District performance in terms of high school AYP targets, four-year graduation rate, math
and literacy score, and achievement gap data 17

The list of high-priority districts will be updated on a quarterly basis to reflect developments in these places. The initial assessment indicates that NAF has sufficient presence, relationships, and opportunity to leverage deep district engagement to meet the growth goals described below. One of the keys to successful implementation of this strategy will be adopting rigorous processes to allocate appropriate resources to high-priority districts without becoming distracted by seemingly compelling opportunities that do not significantly advance NAF’s strategic goals.
Growth scenarios: NAF’s commitments to graduating 100,000 college- and career-ready students by 2020 and having over 100,000 students enrolled annually in quality NAF academies are primarily based on expansion within existing districts and academies and, secondarily, with entering new territories. NAF is already in 75% of the largest districts and the plan is based on expanding within this footprint in the large districts while achieving faster growth in the next level of districts where more complete partnerships can be achieved in shorter time frames. Beyond these targeted efforts, NAF expects growth in non-priority areas to continue, but at a slower than rate.
Figure 7 shows NAF’s current presence and indicates how and where it expects to grow. As the table suggests, the majority of NAF’s growth will come from the 20 largest districts, including five with which NAF achieves deep penetration (with partnerships staggered to start over the next five years).
Figure 7: Projected District Partnerships and Student Growth
Through this approach to growth, NAF expects to increase the number of students in academies in priority districts and to improve the rate of students who graduate and the rate of graduates who are college- and career-ready (reaching 95% for each.) By meeting these objectives, NAF can graduate an additional 100,000 college- and career-ready students by 2020, and grow the network to serve more than 114,000 students each year (see Figure 8.) This represents 30,000 more graduates than NAF achieves at current levels.
Figure 8: NAF Student Growth by 20202011 2020*
Total students 50 K 114KC&CR graduates 8K 23KDeep district engagements
4 15
Total academies 477 600
Total HS StudentsNAF in 2011 NAF in 2020
Partnerships Others Partnerships OthersDist Students Dist Students Dist Students Dist Students
20 Largest Districts
NYC &
LA500K 9,000 18,000
Next 18 1.0M 1 5,000 14 11,000 5 25,000 10 11,000
Other NAF Priorities
35 identified districts
0.5M 2 1,500 18 7,000 10 26,000 25 7,500
Rest of Network -- 16,500 26,500
Total -- 50,000 students 114,000 students
18

2011 2012 (E)
2013 (E)
2014 (E)
2015 (E)
2016 (E)
Baseline academies 484 484 488 489 489Cumulative new academies 14 41 79 124 146Large district partnerships 1 2 3 1 -Normal district partnerships 3 3 4 4 -# students in NAF 49,744 49,012 52,043 60,801 77,394 96,343# C&CR grad 9,102 8,722 8,401 8,226 8,044 8,998
This growth plan is not overly ambitious and achievable. If NAF was only able to increase the numbers of students reached at the same rate of growth that has been realized in recent years and allowing for attrition of current academies, NAF academies would graduate more than 70,000 college- and career-ready students by 2020. If NAF was successful in creating half of the district partnerships it envisions by 2016, NAF academies would still graduate more than 95,000 college- and career-ready students. Additionally, these goals were set in 2011 when the number of students in NAF academies was not expected to reach 60,000 until 2014. Already in 2012, NAF has nearly 60,000 young people enrolled.
Developing and expanding NAF’s ability to engage with a growing number of districts is primarily a function of adding 10 new field staff at a cost of ~$4.3M in the next five years.
Strategy #3: Building Toward a Gold Standard
For the first 30 years of NAF’s history, the American public and education establishment has been almost entirely unaware of the organization’s work despite its scale and many indicators of effectiveness. While those who know NAF are highly supportive, many are unaware of NAF’s size and role in helping students become college- and career-ready through career academies.
NAF’s goal is to enhance and sustain the quality of its academies, and to grow through deep district engagements. In doing this, particularly tied to the development and implementation of an integrated data system, NAF will grow to become a gold standard for delivering high student achievement in districts nationally.
In the short-term, this awareness will drive support to local academies as their value in the community becomes more recognized and will increase district and funder support locally and nationally. In the long-term, recognition as a gold standard will enable NAF to lead a movement to improve the way the education system gets youth ready for college and careers.
This gold standard strategy will require NAF to effectively execute in three primary areas:
• Making the case: In order to become a gold standard, NAF must develop proof points (e.g. relevant case studies, rigorous impact evaluations, etc.), to show its success in improving student outcomes across America. Additionally, NAF must aggressively package and disseminate its student outcome data and evaluation results to make an even stronger case to districts, states, and educators about its impact.
• Building the brand: One of NAF’s key liabilities is a lack of brand identity and awareness among relevant stakeholders (students, districts, states, funders, business community, etc.) In early 2012, NAF has started work with Ogilvy & Mather (pro bono) to create a brand strategy that will be implemented over the next two to three years. Becoming recognized as a gold standard will build awareness of what differentiates NAF in the high school reform space and will require a new brand design and strategy.
19
Figure 9: Projected Growth 2012-2016

• Marketing NAF as an education leader: NAF must become more active in the education space. While many believe NAF should not engage broadly in the policy arena as an institution, there are ample opportunities for policy experts to draw on NAF’s expertise for select topics (e.g. the value of college and career readiness, the merits of a career-oriented education.) In addition, NAF can enable its funders, national and local advisory board members, and alumni to become more vocal proponents of their experiences with the outcomes NAF produces.
Gaining greater visibility will require approximately $0.9M for a five-year investment in a branding and communications campaign as well as $1.2M for additional capacity to maintain expanded outreach to and presence among key stakeholder groups.
20

The plan to graduate 100,000 college- and career-ready students by 2020 demands a disciplined strategy of both short- and long-term data collection, analysis and reporting of metrics to give academy, district and national leadership better tools to monitor progress and assess performance at NAF academies throughout the country. Over the next five years, NAF will improve its ability to monitor performance and to use outcomes for continuous improvement of all academies, so that it can continue to build a strong case for the effectiveness of its programs and be a major force in high school reform.
NAF’s current performance measurement system encompasses the following five components:
1. Student Enrollment and Demographics – inclusive of course offerings, internships, advisory boards, and aspirations for postsecondary and employment data.
2. Individual student demographics and performance measures for 119 participating academies – this analysis compares NAF academy students with non-NAF students in high schools in the same school districts (data will include over 200 academies by the end of 2012.)
3. Academy Assessment – assesses each academy’s fidelity to the NAF model based on standards in four elements: Academy Structure and Development, Curriculum and Instruction, Advisory Board, and Work-based Learning.
4. College and Career Planning Portal – first year data on the college and career-planning portal, Connect!. This tool is used by students in select academies and will provide information on the extent of use by area ranging from resume preparation to college investigation to college application, for example.
5. Year of Planning Academy Assessment – a preparative measure for academies moving from planning to the first year implementation (scheduled for May 2012.)
The challenge facing NAF is to evolve and build on these components to allow for two capabilities that are not currently in place: 1) Integrating and connecting the data – the five data streams are currently in separate databases and 2) Scaling to a potential five million student records if data is collected on every NAF student and corresponding other high school students in the same districts.
Through the development of an integrated data system called for in the strategic plan, NAF will build on these components with the following added capacities:
1. Year-to-year tracking and trend analysis for program improvement and resource allocation.
2. Ongoing cohort tracking over time to understand how students progress through the academy.
3. Comparison analysis to understand program impact by comparing NAF students with matched comparison groups of students in a quasi-experimental design. (An integrated data system allows for data to be mined and analyzed by outside researchers to provide evaluation of NAF’s impact.)
NAF will continue to refine its academy assessment to assure the measures are those which most fully connect to student achievement.
Impact Evaluation: NAF is focused on identifying the long-term impact of its programs on the students who participate as distinct from the other influences on their development. The central outcome pursued is improved life trajectory for underserved students.
Performance Metrics
21

In the near term, NAF will assess academy implementation in order to better understand the elements that drive progress. Specifically, NAF is interested in the following questions:
1. Compared to students enrolled in regular high school programs, how do similar students fare in NAF academies over time in terms of retention, on-time graduation and matriculation at post-secondary institutions?
2. Compared to other students, how do students at risk of not graduating fare in NAF academies over time?
3. What components of the model seem particularly associated with positive outcomes for students in NAF academies? For students at high risk of not graduating?
For ongoing impact evaluation, NAF will build an evaluation plan with an outside evaluator who can tap and use the year-over-year results in the performance measurement system to conduct quasi-experimental design analysis of NAF students. NAF expects to have annual reports tracking the difference in results between NAF students and an equivalent non-NAF control group. This analysis will provide robust information about whether NAF is on track toward its larger, long-term impact agenda.
22
NAF’s strategic imperatives by 2016 include:
1. 75% of NAF academies will rate at Leader level or higher on academy assessments with corresponding student results.
2. NAF will be in partnership with five of the top 20 school districts and in close strategic relationships with another 10 districts serving students at-risk of academic failure. These relationships will provide for close connections between academy growth and development and strategic district efforts to improve high schools.
3. Emerge from a network of individual academies to become a unified, nationally-recognized gold standard of how to deliver high standards of high school achievement in districts across America, supporting an organizational growth goal of 100,000 college- and career-ready graduates by 2020.
4. NAF will have the financial, development, research, and IT systems to support the five-year business plan, to meet the highest standards set for the non-profit industry, and to effectively support and sustain the work of a national staff and network.
5. NAF will develop and diversify funding through a growth capital campaign to support NAF’s strategic plan and organizational goals.
Five-Year Strategic Milestones
23

By 2020, NAF has committed to reaching the following parameters:
• A network that is driven by high quality standards with measurable results and continuous improvements
• Over 100,000 college- and career-ready students graduated from NAF academies• Over 100,000 students enrolled in NAF academies annually• NAF recognized as an anchor organization helping to deliver high-quality high school
education to students in communities with the greatest need
The following dashboard for the next three years will track progress on key steps to 2020 goal:
High-Level Success Dashboard
Year 1 (2012) Year 2 (2013) Year 3 (2014)
Network Quality (Data)
• New data system in development to collect, track, and use student- and academy-level data
• New data system in place. 50% of network contributing student-level data, including all students in priority districts
• 90% of network contributing student-level data
Network Quality (Academies)
• Clear communication of minimal standards
• All new academies at or above standards
• Final year for below quality academies to commit to improvement plan
• No long-term underperformers remain in system
• Specific improvement plans in place for each below standard academy
District Partnerships (Growth)
• 4 new district partnerships (w/in priority list)
• ~70 new academies
• ~8,500 new C&CR graduates
• 4 additional district partnerships (8 new total)
• ~50 new academies
• ~8,000 new C&CR graduates
• 5 additional district partnerships (13 new total)
• ~50 new academies
• ~8,000 new C&CR graduates
Gold Standard (Visibility)
• Complete communications and branding strategy
• Roll-out of communications standards to network
• Raised visibility locally and nationally of NAF as leading developer and certifier of college- and career-ready students
Strengthen organization
• Key new positions and infrastructure for 2012
• Key new positions and infrastructure for 2013
• NAF board growth underway
Funding
• Raise $19M growth fund
• Raise additional $14M. NAF has broadened base of long-term funders

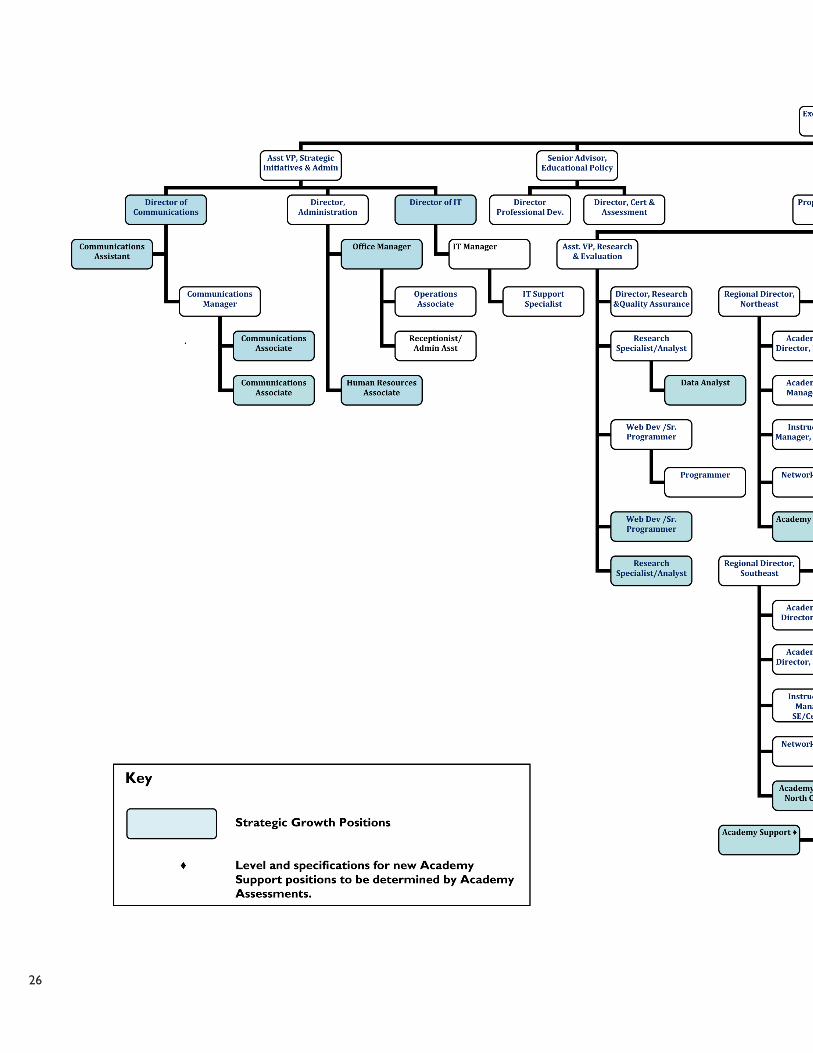
Organizational ImplicationsNAF expects to add 37 new positions over 2012-2016 to support the initiatives outlined in the plan, growing its staff by 68% over five years. While this growth is considerable, the organization will sequence the hires carefully to provide support both to core field and administrative functions to keep pace with the significant targeted growth of its student base. NAF has already invested in realigning its field staff (based on findings from a pilot model in 2010) and has grown their numbers with 24 strategically-based field employees in 2011, as compared to 15 in 2009. This has greatly advanced the organization’s ability to identify needs and impact academy performance.
The anticipated organizational chart on the following page shows that NAF will emphasize growing the capacities of field supports tied to quality and deep district engagement.
Beyond staffing implications, the organization will develop a new brand strategy that will potentially result in a modified name. This will have implications for NAF as the implementation of the new brand is carried out over a series of years towards network-wide adoption.
Additionally, NAF’s Board of Directors is expected to grow (see current Board list in Appendix 1). With 18 members in 2012, NAF envisions of Board of up to 30 members by 2016 to assist in meeting the goals of the new strategic plan. NAF is interested in individuals from industries associated with current academy themes, individuals representing family foundations and the education world who can help to further the organization’s goals.
25
26

27
Financial ImplicationsTo successfully reach its goal of graduating 100,000 college- and career-ready students by 2020, NAF’s budget is projected to grow from $14.6 million11 in 2011 to $23.5 million by 2013, an increase of 62%. A total of $33.1 million in growth funding over five years is required to fully enact the plan. Some of the largest cost drivers of growth include:
1. Development and Implementation of an Integrated Data System: The system will integrate student and academy performance and is critical to the organization’s ability to drive quality and to measure and articulate the impact of the NAF model. The system will position NAF to collect and draw from its own longitudinal data. Along with the costs of developing the data system, NAF will need to hire four professionals to analyze data and implement/manage the system. $6.6 million
2. Increased Staffing to Support District Development and Quality Initiatives: NAF will expand its field staff with 17 new hires by 2015 (10 of these will be district partnership hires focused on developing deep district relationships) and deploy them across the network to support academies in advancing along the membership continuum while disaffiliating those that do not meet minimum performance standards. $6.9 million
3. Curriculum and Certification Development and Maintenance: NAF will update its Academy of Information Technology curriculum in order to offer a quality suite of career-themed options that meet today’s industry expectations. In order to assess student readiness for colleges and careers, NAF will continue to implement and expand its certification and assessment platform. This system makes NAF unique in a field of intermediaries who seek to prepare students for both but who cannot validate that they do, particularly around career readiness indicators. $4.9 million
4. Increased Core Staffing to Support the Organization’s Growth:
• NAF will add eight professional staff members in Institutional Advancement over the course of the plan in addition to consultants to assist with the design and implementation of the growth capital initiative. This will provide NAF with the fundraising capacity it requires to meet its increased budget. $2.08 million
• NAF will add four communications professionals to implement a strategic branding and communications effort tied to becoming a gold standard for high school achievement. $1 million
• Additional central positions are envisioned to provide the foundation for growth including: Director of Finance, Office Manager and Director of Information Technology. $1.34 million
11 2011actualsubjecttoauditapproval
28

Over five years, NAF’s operating and growth budget will total $106 million. This growth is contingent upon NAF’s ability to raise the required funds and to sustain the elevated budget, which is the reason for the significant investment in Institutional Advancement personnel. Also, costs for items such as the development of the integrated data system must be secured before work can begin. As NAF begins its district engagement strategy in 2012, its current operating budget absorbs the costs of transitioning to this priority. It is important to differentiate current operating and growth budgets as NAF embarks on its campaign.
NAF’s $33.1M growth budget is centered first on continuing the increase in academy quality and performance measurement and management; the expansion in expected district partnerships is spread out over four years. Over 80% of the growth budget is dedicated to strengthening the core, with only $4.3M focused on undertaking the deep district work. If these growth steps are successfully achieved, NAF expects that the following five years would provide the opportunity for even more growth.
Figure 10: Anticipated Expenses: 2012-2016
Revenue plan
In order to support this aggressive growth, strategic outreach targeting high-net-worth individuals, institutional foundations and additive funding from current funders must take place within the first two years of the plan, with an expected increase in contributed income from $10.05 million in 2011 to approximately $18.8 million in 2013.
2012 2013 2014 2015 2016 Total (2012-16)
Baseline Costs 12.6
13.8
13.5
13.9
14.4 68.5
Health Sciences Launch 0.5
2.1
1.0
0.5
0.7 4.8
High-Quality Academies 1.7
4.7
4.3
3.7
3.9 18.3
Deep District Engagement 0.1
0.5
1.0
1.3
1.4 4.3
Gold Standard 0.2
0.6
0.5
0.4
0.4 2.1
Foundation for Growth 0.4
1.8
1.6
2.0
2.6 8.4
Total -- Strategic Investments 2.4
7.6
7.4
7.4
8.3 33.1
Grand Total (incl. Baseline and AOHS)
15.8 23.5
21.9
21.8
23.4 106.1
Total FTEs 68
75
81
87
90
29

Figure 11: Contributed Income 2005-2016 (projected)
NAF is undertaking a growth capital campaign planning study conducted by CCS to be completed by the end of May 2012. The study will guide the structure of the campaign, its leadership, duration and compelling elements to build a case for support. Sixty interviews with NAF Board members, funders and prospective individual, corporate and foundation funders will be completed. NAF will make significant investments in its Institutional Advancement staff to help meet its goals, and the NAF Board will expand its membership over the first two years of the business plan to further represent the diversity of funding that will be needed to meet the financial goals. NAF will need the active participation of its Board of Directors.
A significant opportunity to support the strategic plan comes from the Weill Family Foundation, which has created a challenge grant of $10 million. The Weills intend to provide $5 million in operating support and $5 million in growth support if NAF is successful in securing $10 million in growth funding from new and increased sources. Securing the matching funding will require significant outreach to new prospects, with a particular focus on individuals, alongside increased support from institutional funders, while adding state and federal support.
2012 and 2013 will be critical years, during which NAF must diversify its funders and move away from project-based fundraising. The emphasis will be on individual giving and on multi-year gifts.
30
$-
$5,000,000
$10,000,000
$15,000,000
$20,000,000
$25,000,000
2005
2006
2007
2008
2009
2010
2011
2012
2013
2014
2015
2016
Growth Capital
Health Sciences
Baseline

NAF has carefully crafted its growth plan in collaboration with its Board of Directors, network members, and The Bridgespan Group. The organization views the following three elements as potential challenges in implementing its plan:
• The budget crisis facing almost all school systems is placing increased pressure on any expenditures that are not already part of the routine funding in a school system. While NAF academies’ total costs are under 5% of the costs per student in high school with the promise of significantly improved college- and career-ready results, short term budget considerations could diminish the ability of local leaders to implement NAF academies.
• NAF suffers from a weak brand identity. While the new plan addresses this need, other networks which are starting from stronger brand positions are placing increased emphasis on the education focus of their work. To the extent that these efforts gain the attention of philanthropists, it may be more difficult for the message and contributions of NAF to be heard and attract resources. Efforts to introduce more funders of education reform to NAF’s track record of success will be critical.
• NAF has a comprehensive data system under development, but full results are two to four years away. NAF will use this information for continual improvements in its academies and to prove the value of the NAF contributions to improving education for American youth. Some districts may decide to wait to adopt NAF academies until the full results are available.
NAF will closely monitor and stage implementation of the plan against the organization’s capacity, and is committed to navigating these challenges.
Risk Assessment
31
“A.J. Moore Academy wasn’t always a wall-to-wall NAF academy. But we noticed some key differences between our students who were in an academy and those who weren’t: better attendance, better grades, more consistent course completion, raised test scores. We thought, ‘Shouldn’t we do this for all of them?’”
- Angela Reiher, Principal, A.J. Moore Academy, Waco, Texas
The first Academy of Finance in 1982 dared to assert that young people who experienced the fewest advantages and greatest obstacles to their achievement deserved access to both the means and the motivation to succeed. With hands-on exposure in a thriving industry, early academy students developed a newfound sense of what they could achieve and were determined to achieve. The first graduating class of John Dewey High School Academy of Finance included 35 students; 34 went on to college. NAF’s early leaders knew then, as today’s teachers and business partners know now, that with relevant skills and experience, a reason to strive and a proper introduction, these students will be successful.
Thirty years later, NAF continues to set the standards and surpass them. Added career themes continue to reflect areas of tremendous potential, offering young people a direct pathway to high-paying and plentiful jobs. The numbers—of participating students and full-fledged academies—climb each year, even as the size of the learning communities within these academies remains small and focused.
NAF’s partnerships continue to prove that the model is an effective strategy to transform struggling schools. With the direct engagement of local businesses, bringing relevant skills, opportunities and expertise, schools and students exceed all expectations. In NAF academies, students find a means to achieve their goals for career success, financial independence, and higher education.
NAF’s 2012-16 strategic plan continues to build on this vision, as NAF and its academies seek even greater impact. By deepening the organization’s research capacity, NAF will have a greater understanding of key levers within the model and their effect on student outcomes. This knowledge will, in turn, guide the expansion and deployment of professional development offerings so that each NAF academy can provide the highest quality experience to each of its students.
As NAF’s strategic plan is realized, hundreds of thousands of students previously at risk of not graduating will gain from the NAF experience, and America will see that there is a solution to its education crisis that can grow from within the current public school system. By 2020, NAF will be an established presence in over half the large urban school districts, and community and business leaders alike will continue to engage in the NAF model as a sustainable, proven method for positioning young people to create for themselves a life they desire, one that their own hard work has made possible.
Long-Term Vision
32
Appendix 1: NAF Board of DirectorsSanford I. Weill, Chairman Founder, National Academy Foundation
Kenneth I. Chenault, Vice ChairmanChairman & Chief Executive Officer, American Express Company
William P. Hannon, TreasurerExecutive Vice President, The Travelers Companies, Inc.
Eugene A. Ludwig, SecretaryFounder & Chief Executive Officer, Promontory Financial Group, LLC
Andy F. BessetteExecutive Vice President & Chief Administrative Officer, The Travelers Companies, Inc.
Ursula M. BurnsChairman & Chief Executive Officer, Xerox Corporation
Robert C. DughiExecutive Chairman, U.S. Retirement Partners
Barbara Benioff Friedman
JD HoyePresident, National Academy Foundation
Linda S. HuberExecutive Vice President and Chief Financial Officer, Moody’s Corporation
A. Kirk LantermanPresident, Kirlan Venture Capital
Lowell C. McAdamChairman & Chief Executive Officer, Verizon Communications
Harold McGraw IIIChairman, President & Chief Executive Officer, The McGraw-Hill Companies
Hunter R. Rawlings IIIPresident, Association of American Universities
James D. Robinson IIIGeneral Partner and Co-Founder, RRE Ventures
Robert SchwartzFrancis Keppel Professor of Practice in Education Policy and Administration, Harvard Graduate School of Education
Ronald A. WilliamsChairman & CEO, RW2 Enterprises, LLC
Sanjiv YajnikPresident of Financial Services, Capital One Financial Corporation
(April 2012)
33

Appendix 2: NAF Priority Districts: April 2012Growth Priority:
1. Chicago, IL2. Los Angeles, CA3. Prince Georges County, MD4. Charlotte, NC5. Wake County (Raleigh), NC6. Hawaii7. Philadelphia, PA8. Hillsborough County (Tampa), FL9. Broward County (Ft. Lauderdale), FL10. West Contra Costa, CA11. Duval County (Jacksonville), FL12. Oklahoma City, OK13. Nashville, TN14. Sacramento, CA15. Birmingham, AL16. Long Beach, CA17. Atlanta, GA18. Oakland, CA19. St. Paul, MN20. Fresno, CA
Priority Quality/Improvement/ Penetration:
1. Clark County (Las Vegas), NV2. Denver, CO3. Hawaii4. San Francisco, CA5. Dallas, TX6. Dade County (Miami), FL7. Durham, NC8. Baltimore, MD9. Hartford, CT10. New York, NY11. Washington, DC12. Philadelphia, PA13. Rochester, NY
34
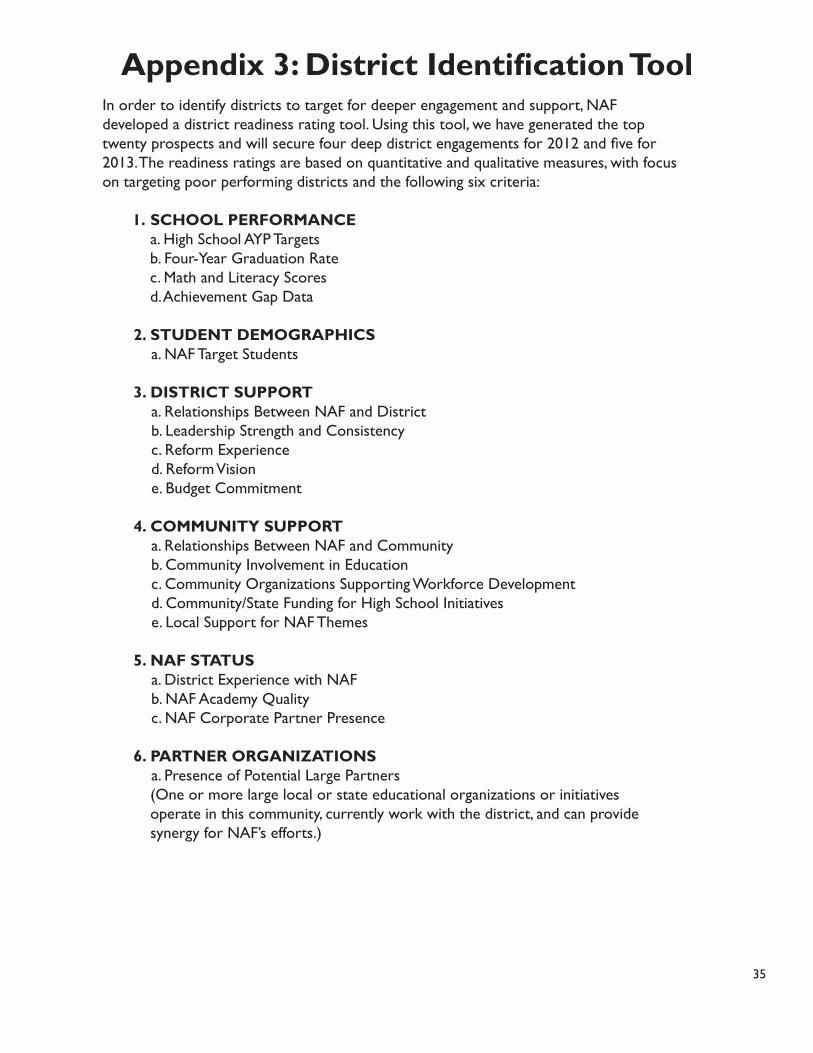
Appendix 3: District Identification ToolIn order to identify districts to target for deeper engagement and support, NAF developed a district readiness rating tool. Using this tool, we have generated the top twenty prospects and will secure four deep district engagements for 2012 and five for 2013. The readiness ratings are based on quantitative and qualitative measures, with focus on targeting poor performing districts and the following six criteria:
1. SCHOOL PERFORMANCE a. High School AYP Targets b. Four-Year Graduation Rate c. Math and Literacy Scores d. Achievement Gap Data
2. STUDENT DEMOGRAPHICS a. NAF Target Students
3. DISTRICT SUPPORT a. Relationships Between NAF and District b. Leadership Strength and Consistency c. Reform Experience d. Reform Vision e. Budget Commitment
4. COMMUNITY SUPPORT a. Relationships Between NAF and Community b. Community Involvement in Education c. Community Organizations Supporting Workforce Development d. Community/State Funding for High School Initiatives e. Local Support for NAF Themes
5. NAF STATUS a. District Experience with NAF b. NAF Academy Quality c. NAF Corporate Partner Presence
6. PARTNER ORGANIZATIONS a. Presence of Potential Large Partners (One or more large local or state educational organizations or initiatives operate in this community, currently work with the district, and can provide synergy for NAF’s efforts.)
35

Appendix 4: NAF College and Career DefinitionIntended Student Learning Outcomes: Knowledge, Abilities and Dispositions Essential for College and Career Readiness
It is well understood that in today’s demanding global economic environment, to achieve the standard of living to which we all aspire as individuals and as a society, every person should graduate from high school with a common core of knowledge, abilities, and dispositions that are now being labeled as “college and career readiness.”
While there is wide agreement on this broad idea among business, education, and civic leaders and both public and private organizations, there is no single definition of college and career readiness accepted by all. And there is no reason to expect everyone will agree on a single definition. What matters is that we all agree on the overarching goal and become very intentional about improving student learning outcomes (what students know and are able and inclined to do) with that goal in mind.
The National Academy Foundation (NAF), after participating in extensive discussions with its many partner organizations and digesting a considerable amount of the still growing policy and research literature on this topic, has settled on a working definition of college and career readiness that will guide its efforts to help more and more students, especially those at risk of failure, not only graduate from high school but succeed in whatever additional education and training beyond high school is required to pursue their long-term career and life goals.
Given NAF’s 30-year record of success in implementing its very affordable and accessible high school career academy model in partnership with public high schools and the business community in particular, we believe we have an especially valuable perspective on those elements of the common core of intended outcomes that distinctly define career readiness, and those that are equally important for college and career success.
While we gladly accept shared responsibility with schools and our more academically-focused partner organizations for ensuring all students graduate ready for college, we defer to those better suited to judge academic readiness the task of detailed definition of those parts of the common core that distinctly define college readiness (e.g. those engaged in defining Common Core State Standards in mathematics and English language arts, and postsecondary faculty and institutions charged with determining levels of proficiency needed to undertake postsecondary level programs of study, etc.).
What we have realized and represented below, is that while there obviously are content and context distinctions to be made between academic and career realms, there are parallel requirements in terms of content knowledge (i.e., “knowing that”). On the other hand, with respect to the core abilities and dispositions listed below, some have received more emphasis in discussions and literature focused on college readiness and some have received more emphasis in discussions of career readiness. NAF firmly believes that those core abilities and dispositions we have identified are equally important in both college and career realms.
36

Academic and Career Knowledge(“Knowing That” in Academic and Career Realms)
• Academic realm o Core academic content knowledge o Post-secondary context knowledge (admissions requirements, affording college, and different college types)
• Career realm o Core career content knowledge (e.g. knowledge specific to the profession) o Contextual procedural knowledge about careers and requirements/ qualifications for one or more careers
Abilities(“Knowing How” and Demonstrated Skills)
• Communication (oral and written, listening and observation)• Critical thinking and problem solving• Creativity and Innovation• Collaboration and teamwork• Organizational skills and time management• Information literacy• Use of technology • Systems thinking• Flexibility and adaptability• Ability to work with diverse individuals• Self-directed; takes initiative; resourceful• Aware of own abilities and performance
37

Appendix 5: Curricular and Assessment PhilosophyIt is a logical approach to bringing the education and industry communities together to a common perspective of college and career readiness. NAF brings this coordinated perspective to curriculum development because of its rich network of academies, higher education, and industry partners who share this vision and bring good will and common purpose to the work.
NAF recruited hundreds of educators and professionals to inform the standards, objectives, and project design for 26 new courses developed over five years, and is following the same practice to create the content for the new Academy of Health Sciences. NAF has also built an assessment system that reflects its entire model. NAF seeks out curriculum partners for its Academy of Engineering that share this perspective and approach to curriculum development. In addition, NAF has partnered with the International Baccalaureate to offer a new credential: the International Baccalaureate Career Related Certificate. The IBCC links the NAF student certificate with IB courses and projects.
NAF’s courses are built around projects designed by NAF Advisory Board members so as to replicate professional practice. Instructional delivery is dependent on the interaction among students, teachers, and professionals in the career theme. Academies integrate career professionals who are expected to help students with research, give them constructive feedback on their projects, and career guidance. NAF applies the same specifications to all third party courses that it approves.
NAF also sees the workplace as a key learning place. It provides unique and detailed guidance on a four year continuum of workplace learning experiences culminating in an internship. The emerging evidence points to the powerful impact of workplace learning on both traditional academic measures as well as those that measure attitude and motivation.
38

www.naf.org