national board of medical examiners subject …intranet.nbme.org/pdf/samplescorereports/biochemistry...
TRANSCRIPT
biochem_pp_
NATIONAL BOARD OF MEDICAL EXAMINERS® Subject Examination Program
Biochemistry Examination
Paper Version
Score Interpretation Guide
NBME® subject examinations provide medical schools with a tool for measuring examinees' understanding of the basic sciences. Items on the Biochemistry Examination were written and reviewed by national test committees preparing material for Step 1 of the United States Medical Licensing Examination®. Prior to publication, test forms are reviewed by a panel of directors of biochemistry courses. Although these examinations are designed to be broadly appropriate as part of overall examinee assessment, course objectives vary across schools, and the congruence between subject examination content and course objectives should be considered when interpreting test scores and determining grading standards. Specifically, subject examination scores should not be used alone, but rather in conjunction with other indicators of examinee performance in determination of grades. Subject Examination Scores
The subject examination score is scaled to have a mean of 500 and a standard deviation of 100 for a scaling group of 5,093 first-time takers from 31 U.S. LCME-accredited medical schools who took the paper version of the Biochemistry Examination as an end-of-course examination under standard testing conditions during the 2002-03 and 2003-04 academic years. The vast majority of scores range from 200 to 800. This scale provides a useful tool for comparing the scores of your examinees who took the paper version with those of a large, nationally representative group of examinees taking the examination as an end-of-course examination. Please note that this scale is not comparable to the scale used for the web version of this subject examination. Subject examination scores are statistically equated across test administrations. Scores are statistically adjusted for shifts in test difficulty across different forms of the examination. This makes it possible to track school and examinee performance over time. Precision of Scores
Measurement error is present on all tests, and the standard error of measurement (SEM) provides an index of the (im)precision of scores. The SEM indicates how far the score an examinee earns on the examination is likely to stray from his/her “true” proficiency level. The SEM is approximately 40 points for the paper version of the Biochemistry Examination. Using the SEM, it is possible to calculate a score interval that indicates how much a score might vary across repeated testing using different sets of items covering the same content. An interval that will encompass about two thirds of the observed scores for a given true score may be found by adding the SEM to a score and subtracting it from that score. For example, if an examinee’s true proficiency on the examination is 500, the score he/she achieved on the examination will usually (two times out of three) fall between 460 and 540 (500 - 40 and 500 + 40).
Score Feedback
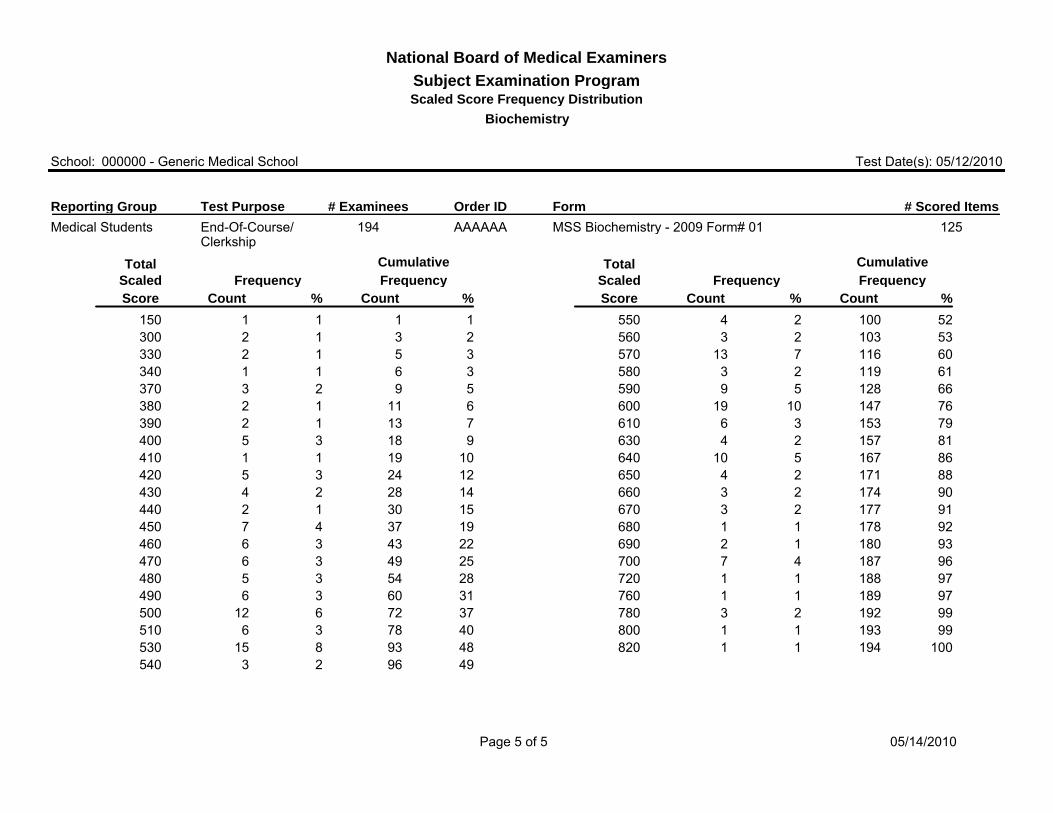
Summary information on the examinee group tested, the examination purpose, and the number of items scored is provided on each page of the feedback. If 2 or more examinees were tested, Scaled Score Descriptive Statistics for reported scores, including the mean, the standard deviation, and the lowest and highest scores for the examinees tested, is provided. The Roster of Scaled Scores reports a total test Biochemistry Examination score and content area subscores, if available, for each examinee. Reported scores also appear in a comma separated text file that can be downloaded and used to export scores. If 2 or more examinees were tested, a Frequency Distribution of the total test scaled score is provided. The distribution shows the number and percentage of examinees with each score, together with the cumulative frequency and percentage. Keyword Phrase Item Analysis
If 10 or more examinees were tested, a Keyword Phrase Item Analysis Report is provided. This report provides a keyword phrase describing the content of each item on the examination, along with the proportion of the examinees from your school and a projected proportion of examinees nationally that answered each item correctly. Norms
The most recent norms are provided to aid in the interpretation of examinee performance. These norms reflect the performance of examinees from LCME-accredited medical schools who took the paper version of the examination for the first time as an end-of-course examination.

biochem_pp_
Biochemistry Examination Paper Version
Norms for Examinee Performance
The most recent norms that have been developed for the paper version of this examination are shown below. These norms enable you to compare your examinees’ subject examination scores with the performance of a nationally representative group of examinees taking the examination at a similar stage of training. The norms are based on the performance of a reference group comprised of examinees from LCME-accredited medical schools who took the paper version of the Biochemistry Examination for the first time as an end-of-course or end-of-year examination. Please note that these norms are not applicable to the web version of this subject examination. The academic years used to compute the norms, and the sample size (N), mean, and standard deviation (SD) of the norm group for each academic period are listed below.
Period Academic Years N Mean SD
1 2004-05 & 2005-06 6,745 493 100 2 2006-07 & 2007-08 5,845 490 102
To use the norm table, locate an examinee’s subject examination score in the column labeled "Score" and note the entry in the adjacent column labeled "Percentile Ranks". For example, if an examinee’s score is 500, the corresponding percentile rank entry of 56 in Period 1 indicates that 56% of the national group of examinees taking the examination as an end-of-course or end-of-year examination during Period 1 had scores at or below 500.
Percentile Ranks Percentile Ranks Period 1 Period 2 Period 1 Period 2
Score (N=6,745) (N=5,845) Score (N=6,745) (N=5,845)
720 or above 99 98 500 56 58 710 98 98 490 53 54 700 98 97 480 46 49 690 97 97 470 44 47 680 97 96 460 39 42 670 96 96 450 36 38 660 95 95 440 32 35 650 95 94 430 29 29 640 94 93 420 25 27 630 92 92 410 22 22 620 91 90 400 19 20 610 89 89 390 15 16 600 88 87 380 14 14 590 86 86 370 11 11 580 82 84 360 10 10 570 80 81 350 8 8 560 77 78 340 7 7 550 74 76 330 5 5 540 69 72 320 4 4 530 67 69 310 3 3 520 64 66 300 3 3 510 59 61 290 or below 2 2
05/14/2010Page 3 of 5
National Board of Medical ExaminersSubject Examination ProgramScaled Score Descriptive Statistics
Test Date(s): 05/12/2010000000 - Generic Medical SchoolSchool:
Biochemistry
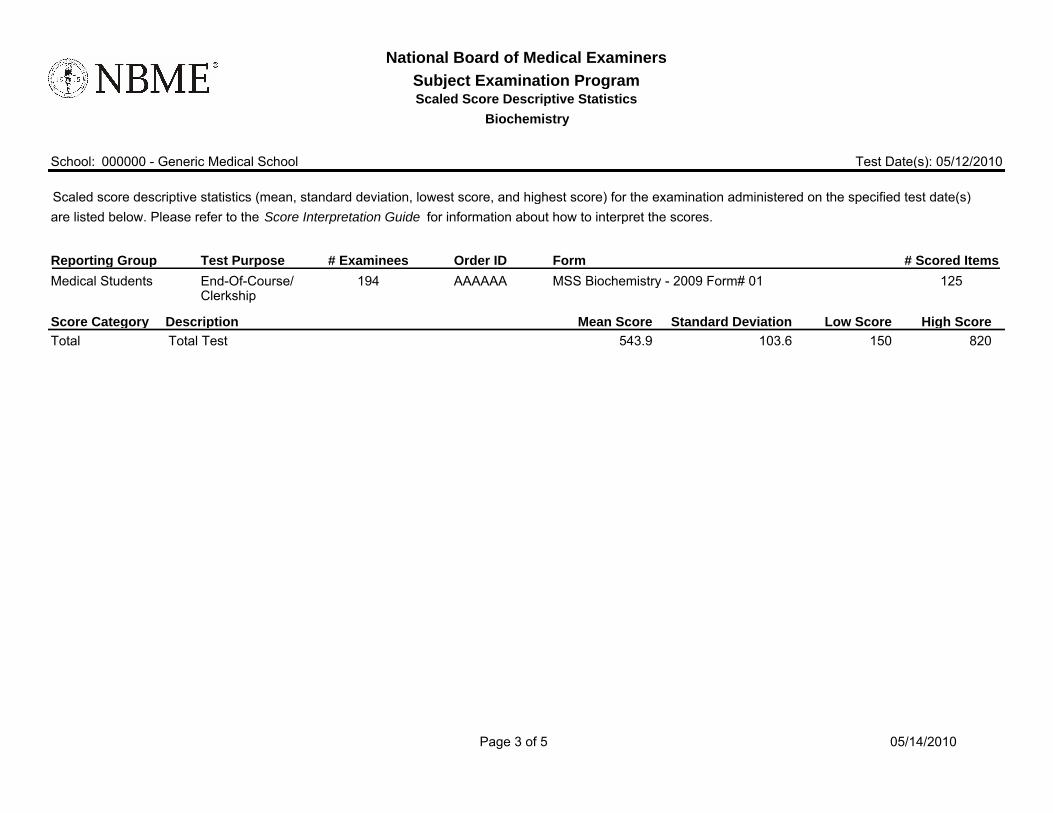
for information about how to interpret the scores.Score Interpretation Guide Scaled score descriptive statistics (mean, standard deviation, lowest score, and highest score) for the examination administered on the specified test date(s)are listed below. Please refer to the
# Scored ItemsFormOrder ID# ExamineesTest PurposeReporting Group-------------
125MSS Biochemistry - 2009 Form# 01AAAAAA 194End-Of-Course/Clerkship
Medical Students
High ScoreLow ScoreStandard DeviationMean ScoreDescriptionScore Category820150103.6543.9Total TestTotal

05/14/2010Page 4 of 5
National Board of Medical ExaminersSubject Examination Program
Roster of Scaled Scores
Test Date(s): 05/12/2010000000 - Generic Medical SchoolSchool:
Biochemistry
how to interpret the scores. Score Interpretation Guide
The roster of scores contains scaled score(s) for each examinee who tested on the specified test date(s). These same scores also appear in a comma separatedvalue text file that can be downloaded and used to export scores into your local database. Please refer to the for information about
# Scored ItemsFormOrder ID# ExamineesTest PurposeReporting Group-------------
125MSS Biochemistry - 2009 Form# 01AAAAAA 194End-Of-Course/Clerkship
Medical Students
TotalNameID430 Student 0010650 Student 0011430 Student 0012510 Student 0013600 Student 0014580 Student 0015450 Student 0016660 Student 0017530 Student 0018540 Student 0019650 Student 0020560 Student 0021570 Student 0022640 Student 0023420 Student 0024430 Student 0025570 Student 0026530 Student 0027370 Student 0028600 Student 0029
05/14/2010Page 5 of 5
Scaled Score Frequency DistributionSubject Examination Program
National Board of Medical Examiners
Test Date(s): 05/12/2010000000 - Generic Medical SchoolSchool:
Biochemistry
# Scored ItemsFormOrder ID# ExamineesTest PurposeReporting Group-------------
125MSS Biochemistry - 2009 Form# 01AAAAAA194End-Of-Course/Clerkship
Medical Students
TotalScaled
Count %
Cumulative
Count %Frequency
ScoreFrequency
52100245505310323560601167135706111923580661285959076147101960079153366108115724630861675106408817124650901742366091177236709217811680931801269096187477009718811720971891176099192237809919311800
10019411820
TotalScaled
Count %
Cumulative
Count %Frequency
ScoreFrequency
11111502312300351233036113405923370611123807131239091835400
10191141012243542014282443015301244019374745022433646025493647028543548031603649037726125004078365104893815530499623540