national dairy dairying in board development rajasthan · i.2.1: human population by residence and...
TRANSCRIPT

a Statistical Profile 2016
National Dairy Development
Board Dairying In Rajasthan

District Map of Rajasthan

National Dairy Development Board
Dairying in rajasthan - A Statistical Profile 2016
In this publication “Dairying in Rajasthan - A Statistical Profile 2016”, the major highlights are: trend in human
demographics, livestock population and production; inputs for enhancement of productivity such as breeding,
health and nutrition. This publication includes statistical tables and thematic maps on selected parameters along
with time series data of districts wherever available.
The objective of this publication is to provide a detailed presentation of various parameters, underlying factors and
their inter-linkages so as to enable effective planning and implementation of various development interventions.
We hope that a wide range of readers, students, researchers, veterinarians, planners, scientists, administrators,
policy makers and professionals in government and non-governmental organisations, will find this publication
useful. This publication aims at balancing the most comprehensive information with the most relevant.
We sincerely thank government and non-government agencies for providing information. While extreme care
has been taken in putting together data in a systematic and comprehensible manner, some errors cannot be
ruled out.
This publication “Dairying in Rajasthan - A Statistical Profile 2016” is amongst a series of similar publications for
different states being brought out by National Dairy Development Board (NDDB).
Dilip RathChairman, NDDB
September 2016Anand, Gujarat
Foreword

National Dairy Development Board
Dairying in rajasthan - A Statistical Profile 2016
IndexI. GENERAL STATISTICSI.1. Rajasthan at a Glance I.1.1: General Statistics: Rajasthan vs. India . . . . . . . . . . . . . . . . . . . . . . . . . . . . . . . . . . . . . . . . . . . . . . . . . . . . . . . . . . . . . . . . . .2 I.1.2: Formation of New Districts in Rajasthan . . . . . . . . . . . . . . . . . . . . . . . . . . . . . . . . . . . . . . . . . . . . . . . . . . . . . . . . . . . . . . .4I.2. Social Statistics: Human Population I.2.1: Human Population by Residence and Sex –2001 . . . . . . . . . . . . . . . . . . . . . . . . . . . . . . . . . . . . . . . . . . . . . . . . . . . . . . .5 I.2.2: Human Population by Residence and Sex –2011 . . . . . . . . . . . . . . . . . . . . . . . . . . . . . . . . . . . . . . . . . . . . . . . . . . . . . . .7 I.2.3: Rural Households, Electricity and Tap Water Supply - 2001 and 2011 . . . . . . . . . . . . . . . . . . . . . . . . . . . . . . . . . . . .9 I.2.4: District-wise SC and ST Population – 2001 and 2011 . . . . . . . . . . . . . . . . . . . . . . . . . . . . . . . . . . . . . . . . . . . . . . . . . . 11I.3. State Economy I.3.1: Net State Domestic Product (NSDP) and Per Capita Income . . . . . . . . . . . . . . . . . . . . . . . . . . . . . . . . . . . . . . . . . . 13 I.3.2: Value of Output: Agriculture and Livestock . . . . . . . . . . . . . . . . . . . . . . . . . . . . . . . . . . . . . . . . . . . . . . . . . . . . . . . . . . 15 I.3.3: Approved Project Cost for Dairying under Rashtriya Krishi Vikas Yojana (RKVY) in Rajasthan . . . . . . . . . . . 16 I.3.4: Approved Project Cost for Animal Husbandry under Rashtriya Krishi Vikas Yojana (RKVY) in Rajasthan . . . . . . 17
II. LIVESTOCK CENSUSII.1. Animal Population II.1.1: Summary of Livestock Census (1997 to 2012) – Rajasthan . . . . . . . . . . . . . . . . . . . . . . . . . . . . . . . . . . . . . . . . . . . . 20 II.1.2: District-wise Total Bovine Population . . . . . . . . . . . . . . . . . . . . . . . . . . . . . . . . . . . . . . . . . . . . . . . . . . . . . . . . . . . . . . . . 21 II.1.3: District-wise Female Population . . . . . . . . . . . . . . . . . . . . . . . . . . . . . . . . . . . . . . . . . . . . . . . . . . . . . . . . . . . . . . . . . . . . . 22 II.1.4: District-wise Breedable Population . . . . . . . . . . . . . . . . . . . . . . . . . . . . . . . . . . . . . . . . . . . . . . . . . . . . . . . . . . . . . . . . . . 23 II.1.5: District-wise In-milk Population . . . . . . . . . . . . . . . . . . . . . . . . . . . . . . . . . . . . . . . . . . . . . . . . . . . . . . . . . . . . . . . . . . . . . 25 II.1.6: District-wise Milch Population . . . . . . . . . . . . . . . . . . . . . . . . . . . . . . . . . . . . . . . . . . . . . . . . . . . . . . . . . . . . . . . . . . . . . . . 26 II.1.7: District-wise Male Population . . . . . . . . . . . . . . . . . . . . . . . . . . . . . . . . . . . . . . . . . . . . . . . . . . . . . . . . . . . . . . . . . . . . . . . 27II.2. Sex Ratio in Dairy Animals II.2.1: District-wise Male - Female Ratio . . . . . . . . . . . . . . . . . . . . . . . . . . . . . . . . . . . . . . . . . . . . . . . . . . . . . . . . . . . . . . . . . . . . 28II.3. Wet-Dry Ratio of Dairy Animals II.3.1: District-wise Wet-Dry Ratio . . . . . . . . . . . . . . . . . . . . . . . . . . . . . . . . . . . . . . . . . . . . . . . . . . . . . . . . . . . . . . . . . . . . . . . . . . 29II.4. Livestock Density II.4.1: District-wise Density of Total Livestock and Bovine . . . . . . . . . . . . . . . . . . . . . . . . . . . . . . . . . . . . . . . . . . . . . . . . . . . 31II.5. Breed-wise Population II.5.1: Cattle and Buffalo Breeds of Rajasthan . . . . . . . . . . . . . . . . . . . . . . . . . . . . . . . . . . . . . . . . . . . . . . . . . . . . . . . . . . . . . . . 33 II.5.2: District and Breed-wise Population of Indigenous Cattle breed in Rajasthan - 2007 . . . . . . . . . . . . . . . . . . . . 35 II.5.3: District and Breed-wise Population of Buffalo breed Animals in Rajasthan - 2007 . . . . . . . . . . . . . . . . . . . . . . 36
III. CATTLE AND BUFFALO BREEDSIII.1. Distribution of Native Breeds of Rajasthan III.1.1: Distribution of Cattle Breeds in Rajasthan . . . . . . . . . . . . . . . . . . . . . . . . . . . . . . . . . . . . . . . . . . . . . . . . . . . . . . . . . . . . 38III.2. Performance of Breeds III.2.1: Performance of Native Cattle Breeds . . . . . . . . . . . . . . . . . . . . . . . . . . . . . . . . . . . . . . . . . . . . . . . . . . . . . . . . . . . . . . . . . 46
IV. MILK PRODUCTIONIV.1. Production Performance IV.1.1: Year-wise In-milk Bovine Population, Milk Yield and Milk Production . . . . . . . . . . . . . . . . . . . . . . . . . . . . . . . . . . 48 IV.1.2: Year & District-wise In-milk Bovine Population. . . . . . . . . . . . . . . . . . . . . . . . . . . . . . . . . . . . . . . . . . . . . . . . . . . . . . . . 49 IV.1.3: Year & District-wise In-milk Indigenous Cattle Population . . . . . . . . . . . . . . . . . . . . . . . . . . . . . . . . . . . . . . . . . . . . 51 IV.1.4: Year & District-wise In-milk Crossbred Cattle Population . . . . . . . . . . . . . . . . . . . . . . . . . . . . . . . . . . . . . . . . . . . . . . 53 IV.1.5: Year & District-wise In-milk Buffalo Population . . . . . . . . . . . . . . . . . . . . . . . . . . . . . . . . . . . . . . . . . . . . . . . . . . . . . . . 55IV.2. Production Performance: Milk Yield IV.2.1: Year & District-wise Bovine Milk Yield . . . . . . . . . . . . . . . . . . . . . . . . . . . . . . . . . . . . . . . . . . . . . . . . . . . . . . . . . . . . . . . . 57 IV.2.2: Year & District-wise Indigenous Cattle Milk Yield. . . . . . . . . . . . . . . . . . . . . . . . . . . . . . . . . . . . . . . . . . . . . . . . . . . . . . 59 IV.2.3: Year & District-wise Crossbred Cattle Milk Yield . . . . . . . . . . . . . . . . . . . . . . . . . . . . . . . . . . . . . . . . . . . . . . . . . . . . . . 61 IV.2.4: Year & District-wise Buffalo Milk Yield . . . . . . . . . . . . . . . . . . . . . . . . . . . . . . . . . . . . . . . . . . . . . . . . . . . . . . . . . . . . . . . . 63IV.3. Production Performance: Milk Production IV.3.1: Year & District-wise Total Milk Production (Bovine & Goat) . . . . . . . . . . . . . . . . . . . . . . . . . . . . . . . . . . . . . . . . . . . . 65 IV.3.2: Year & District-wise Bovine Milk Production . . . . . . . . . . . . . . . . . . . . . . . . . . . . . . . . . . . . . . . . . . . . . . . . . . . . . . . . . . 67 IV.3.3: Year & District-wise Indigenous Cattle Milk Production . . . . . . . . . . . . . . . . . . . . . . . . . . . . . . . . . . . . . . . . . . . . . . . 69 IV.3.4: Year & District-wise Crossbred Cattle Milk Production . . . . . . . . . . . . . . . . . . . . . . . . . . . . . . . . . . . . . . . . . . . . . . . . 71

National Dairy Development Board
Dairying in rajasthan - A Statistical Profile 2016
IV.3.5: Year & District-wise Buffalo Milk Production . . . . . . . . . . . . . . . . . . . . . . . . . . . . . . . . . . . . . . . . . . . . . . . . . . . . . . . . . . 73 IV.3.6: Year & District-wise Goat Milk Production . . . . . . . . . . . . . . . . . . . . . . . . . . . . . . . . . . . . . . . . . . . . . . . . . . . . . . . . . . . . 79 IV.3.7: Year & District-wise Total Milk Production Density . . . . . . . . . . . . . . . . . . . . . . . . . . . . . . . . . . . . . . . . . . . . . . . . . . . . 81IV.4. Production Performance: Milk Availability IV.4.1: Year & District-wise Per Capita Milk Availability . . . . . . . . . . . . . . . . . . . . . . . . . . . . . . . . . . . . . . . . . . . . . . . . . . . . . . . 83 V. VETERINARY INFRASTRUCTURE AND SERVICE DELIVERY SYSTEMV.1. Veterinary Infrastructure V.1.1: Year & District-wise Veterinary Institutes . . . . . . . . . . . . . . . . . . . . . . . . . . . . . . . . . . . . . . . . . . . . . . . . . . . . . . . . . . . . . 86 V.1.2: Union-wise AI Centres – Cooperatives. . . . . . . . . . . . . . . . . . . . . . . . . . . . . . . . . . . . . . . . . . . . . . . . . . . . . . . . . . . . . . . . 87 V.1.3: District-wise AI Centers – BAIF . . . . . . . . . . . . . . . . . . . . . . . . . . . . . . . . . . . . . . . . . . . . . . . . . . . . . . . . . . . . . . . . . . . . . . . 88V.2. Service Delivery System - Artificial Insemination V.2.1: District-wise AI Performed by Government Agencies – Cattle . . . . . . . . . . . . . . . . . . . . . . . . . . . . . . . . . . . . . . . . . 89 V.2.2: District-wise AI Performed by Government Agencies – Buffalo . . . . . . . . . . . . . . . . . . . . . . . . . . . . . . . . . . . . . . . . 90 V.2.3: District-wise AI Performed by Government Agencies – Bovine . . . . . . . . . . . . . . . . . . . . . . . . . . . . . . . . . . . . . . . . 91 V.2.4: Union-wise AI Performed by Cooperatives – Cattle . . . . . . . . . . . . . . . . . . . . . . . . . . . . . . . . . . . . . . . . . . . . . . . . . . . 92 V.2.5: Union-wise AI Performed by Cooperatives – Buffalo . . . . . . . . . . . . . . . . . . . . . . . . . . . . . . . . . . . . . . . . . . . . . . . . . . 92 V.2.6: Union-wise AI Performed by Cooperatives – Bovine . . . . . . . . . . . . . . . . . . . . . . . . . . . . . . . . . . . . . . . . . . . . . . . . . . 92 V.2.7: District-wise AI Performed By BAIF – Cattle . . . . . . . . . . . . . . . . . . . . . . . . . . . . . . . . . . . . . . . . . . . . . . . . . . . . . . . . . . . 93 V.2.8: District-wise AI Performed By BAIF – Buffalo. . . . . . . . . . . . . . . . . . . . . . . . . . . . . . . . . . . . . . . . . . . . . . . . . . . . . . . . . . 94 V.2.9: District-wise AI Performed By BAIF – Bovine . . . . . . . . . . . . . . . . . . . . . . . . . . . . . . . . . . . . . . . . . . . . . . . . . . . . . . . . . . 95V.3. Service Delivery System - Animal Health V.3.1: District-wise Vaccination Performed for Foot-and-Mouth Disease . . . . . . . . . . . . . . . . . . . . . . . . . . . . . . . . . . . . . 96 V.3.2: District-wise Vaccination Preformed for Haemorrhagic Septicaemia . . . . . . . . . . . . . . . . . . . . . . . . . . . . . . . . . . 97 V.3.3: District-wise Vaccination Preformed for Black Quarter . . . . . . . . . . . . . . . . . . . . . . . . . . . . . . . . . . . . . . . . . . . . . . . . 98 V.3.4: District-wise Bovine Vaccination . . . . . . . . . . . . . . . . . . . . . . . . . . . . . . . . . . . . . . . . . . . . . . . . . . . . . . . . . . . . . . . . . . . . . 99
VI. FEED RESOURCESVI.1. Feed Resources - Availability vs. Requirement VI.1.1: Area under Fodder Crops and Gross Sown Area . . . . . . . . . . . . . . . . . . . . . . . . . . . . . . . . . . . . . . . . . . . . . . . . . . . . . 102 VI.1.2: District-wise Dry Matter (DM) Availability, Requirement and Balance . . . . . . . . . . . . . . . . . . . . . . . . . . . . . . . . . 103 VI.1.3: Availability, Requirement and Surplus/Deficit of Dry Matter . . . . . . . . . . . . . . . . . . . . . . . . . . . . . . . . . . . . . . . . . 105
VII. AGRICULTUREVII.1. Agro-Climatic Zones VII.1.1: Rajasthan’s Agro-Climatic Zones . . . . . . . . . . . . . . . . . . . . . . . . . . . . . . . . . . . . . . . . . . . . . . . . . . . . . . . . . . . . . . . . . . . . 108 VII.1.2: Details of Agro-Climatic Zones. . . . . . . . . . . . . . . . . . . . . . . . . . . . . . . . . . . . . . . . . . . . . . . . . . . . . . . . . . . . . . . . . . . . . . 109VII.2. Land Use Pattern VII.2.1: District-wise Land Use Pattern . . . . . . . . . . . . . . . . . . . . . . . . . . . . . . . . . . . . . . . . . . . . . . . . . . . . . . . . . . . . . . . . . . . . . . 111VII.3. Area and Production VII.3.1: District-wise Area and Production – Cereals . . . . . . . . . . . . . . . . . . . . . . . . . . . . . . . . . . . . . . . . . . . . . . . . . . . . . . . . . 112 VII.3.2: District-wise Area and Production – Pulses . . . . . . . . . . . . . . . . . . . . . . . . . . . . . . . . . . . . . . . . . . . . . . . . . . . . . . . . . . 113 VII.3.3: District-wise Area and Production – Food Grains . . . . . . . . . . . . . . . . . . . . . . . . . . . . . . . . . . . . . . . . . . . . . . . . . . . . 115 VII.3.4: District-wise Area and Production – Oilseeds . . . . . . . . . . . . . . . . . . . . . . . . . . . . . . . . . . . . . . . . . . . . . . . . . . . . . . . 116VII.4. Land Holding and Water Resources VII.4.1: Operational Holdings in Rajasthan . . . . . . . . . . . . . . . . . . . . . . . . . . . . . . . . . . . . . . . . . . . . . . . . . . . . . . . . . . . . . . . . . 117 VII.4.2: Net Irrigated Area under Different Sources of Irrigation . . . . . . . . . . . . . . . . . . . . . . . . . . . . . . . . . . . . . . . . . . . . . 117 VII.4.3: Major River Basins of Rajasthan . . . . . . . . . . . . . . . . . . . . . . . . . . . . . . . . . . . . . . . . . . . . . . . . . . . . . . . . . . . . . . . . . . . . . 119VII.5. Rainfall VII.5.1: District- wise Average Annual Rainfall . . . . . . . . . . . . . . . . . . . . . . . . . . . . . . . . . . . . . . . . . . . . . . . . . . . . . . . . . . . . . . 120 VII.5.2: Distribution of Blocks according to ground water status . . . . . . . . . . . . . . . . . . . . . . . . . . . . . . . . . . . . . . . . . . . . . 122
VIII. POLICIES AND SCHEMES FOR DAIRY DEVELOPMENT IN RAjASTHAN . . . . . . . . . . . . . . . . . . . . 123
GLOSSARY . . . . . . . . . . . . . . . . . . . . . . . . . . . . . . . . . . . . . . . . . . . . . . . . . . . . . . . . . . . . . . . . . . . . . . . . . . . . . . . . . . . . . . . . . . . . . . . . . . . . . . 129

Part I : General Statistics
Rajasthan has the largest geographical area in India covering one-tenth of country’s land area wherein just 5.7% of the country’s population reside. Of the total 68.5 million human population in Rajasthan, 75.1 per cent reside in rural areas and 24.9 per cent in urban areas. According to the 69th report of National Sample Survey Office (NSSO), more than three-fourth population stay in ‘pucca’ structure houses. Rajasthan is the first power surplus state in northern India and majority population have direct access to electricity for domestic use. In order to shore up the drinking water and sanitation facilities in Rajasthan, the State Government had amended its Panchayati Raj Act in December 2014 and as per the recent amendments, a candidate contesting for Panchayat election at village level need to have passed Class VIII for the post of Sarpanch and should have “functional toilet” facility at home.

2National Dairy Development Board
Part I : General StatisticsDairying in rajasthan - A Statistical Profile 2016
I.1. Rajasthan at a Glance
TABLE I.1.1: General Statistics: Rajasthan vs. India
Particulars Unit Year Rajasthan IndiaState Geography & Rural InfrastructureGeographical area ‘000 sq km 2011 342.2 3,287.3Districts Nos “ 33 640Talukas “ “ 244 5,924Villages ‘000 “ 44.6 640.9Households Million “ 12.7 249.5Rural Households
2001 ‘000 2001 7,157 137,4142011 “ 2011 9,490 168,565
Rural House Hold with Electricity 2001 % 2001 44 442011 “ 2011 58 55
Rural House Hold with Tap water supply2001 % 2001 22 242011 “ 2011 27 31
Human PopulationPopulation Millions 2011 68.5 1,210.1
Urban (% to total) % “ 24.9 31.2Rural (% to total) “ “ 75.1 68.8
Density of population Persons/ sq.km “ 201 382Scheduled castes (% to total) % “ 17.8 16.6Scheduled tribes (% to total) “ “ 13.4 8.6Sex ratio Ratio “ 928 943Literacy rate (excluding population of 0 to 6 age group)
Male % 2011 79.2 80.9Female % ‘’ 52.1 64.6Urban % ‘’ 79.7 84.1Rural % ‘’ 61.4 67.8
Per capita income (at current prices) ` 2013-14 65,098 74,380Livestock population Million 2012 57.7 512.0Bovine population ‘’ ‘’ 26.3 299.9
Indigenous Cattle ‘’ ‘’ 11.6 151.2Crossbred Cattle ‘’ ‘’ 1.7 39.7Buffalo ‘’ ‘’ 13.0 108.7
Small ruminants ‘’ ‘’ 31.0 200.2Poultry ‘’ ‘’ 8.0 729.2Livestock population Million 2007 56.7 529.7Bovine population ‘’ ‘’ 23.2 304.8
Indigenous Cattle ‘’ ‘’ 11.3 166.0Crossbred Cattle ‘’ ‘’ 0.8 33.1Buffalo ‘’ ‘’ 11.1 105.3
Small ruminants ‘’ ‘’ 32.6 212.1Poultry ‘’ ‘’ 4.9 648.9

3 National Dairy Development Board
Part I : General StatisticsDairying in rajasthan - A Statistical Profile 2016
I.1. Rajasthan at a Glance
TABLE I.1.1: General Statistics: Rajasthan vs. India
Particulars Unit Year Rajasthan IndiaNumber of major cattle breeds Nos 2015 3 36Number of major buffalo breeds “ “ - 13Milk ProductionTotal Milk production 000MT 2014-15 16,934 146,313
Crossbred “ “ 1,840 36,938Indigenous “ “ 4,286 29,484Buffalo “ “ 8,985 74,709Goats “ “ 1,822 5,180
Per capita milk availability Grams/day 2013-14 572 307Egg production Millions 2014-15 1,320 78,484Estimated meat production 000 MT “ 180.1 6,691Marine & inland fish production ‘’ 2013-14 35.1 9,579Wool production 000 Kg 2014-15 14,463 48,139Veterinary Infrastructure & ServicesVeterinary institutes Nos 2014-15 4,696 61,123Semen Production Center ‘’ ‘’ 2 58AI centers ‘’ ‘’ 6,728 88,095AI done 000 ‘’ 3,386 63,204Vaccinations Done 13,059
H.S. Vaccination ‘’ 2014-15 5,305 B.Q. vaccinations ‘’ “ 1,216 FMD vaccinations ‘’ “ 6,538
Agricultural ResourcesForest cover % 2012-13 8.0 21.30Pasture and Grazing land 000 Ha ‘’ 1,694 10,240
Pasture & Grazing Land (% to total reporting area) % ‘’ 4.9 3.3
Area under fodder crops 000 Ha ‘’ 4,853 9,188Gross irrigated area (% to Gross Cropped Area) % ‘’ 39.4 47.6Cropping intensity “ ‘’ 137 139Irrigation intensity “ ‘’ 126 138Production of major crops
Cereals ‘000 MT 2014-15 17,670 234,871Pulses ‘’ ‘’ 1,952 17,152Oilseeds ‘’ ‘’ 5,314 27,511
Cotton ‘000 bales (170 kg Each) ‘’ 1,527 34,805
Sugarcane ‘000 MT ‘’ 409 362,333Ground water status (2011 vs 2009)Safe % of blocks 2011 & (2009) 10 (13) 69 (73)Semi Critical ‘’ ‘’ 8 (7) 11 (9)Critical ‘’ ‘’ 10 (10) 3 (3)

4National Dairy Development Board
Part I : General StatisticsDairying in rajasthan - A Statistical Profile 2016
I.1. Rajasthan at a Glance
TABLE I.1.1: General Statistics: Rajasthan vs. India
Particulars Unit Year Rajasthan IndiaOver exploited % of blocks 2011 & (2009) 71 (69) 16 (14)Salinity Affected ‘’ ‘’ 1 (NA) 1(1)
SourCeS: Census 2001 & 2011, office of the registrar General and Census Commissioner, Govt. of India, New Delhi.• 18th and 19th Livestock Census, Department of Animal Husbandry, Dairying and Fisheries, Ministry of Agriculture, Govt. of India.• MinutesoftheMeetingofTechnicalCommitteeonDirectionforimprovementofAnimalHusbandryStatisticsheldduring24th to 25thJuly,2014,
Department of Animal Husbandry, Dairying and Fisheries, Ministry of Agriculture and Farmers Welfare, Govt. of India.• DynamicGroundWaterResourcesofIndiaason31st March, 2009, Central Ground Water Board, Ministry of Water resources, Govt. of India.• DirectorateofEconomicsandStatistics,MinistryofAgricultureandFarmersWelfare,Govt.ofIndia.• MinistryofStatisticsandProgrammeImplementation,Govt.ofIndia.
TABLE I.1.2: Formation of New Districts in Rajasthan
New District Year of formation Carved out of
Dasua 10th April 1991 Jaipur, Sawai Madhopur
Baran 10th April 1991 Kota
Rajsamand 10th April 1991 Udaipur
Hanumangarh 12th July 1994 Ganganagar
Karauli 19th July 1997 Sawai Madhopur
Pratapgarh 26th January 2008 Chittaurgarh, Banswara, Udaipur
SourCe: District Administration Websites of Govt. of rajasthan.

5 National Dairy Development Board
Part I : General StatisticsDairying in rajasthan - A Statistical Profile 2016
I.2. Social Statistics: Human Population
TABLE I.2.1: Human Population by Residence and Sex –2001
DistrictsRural (‘000) Urban (‘000) Total (‘000)
Male Female Total Male Female Total Male Female TotalRAjASTHAN 22,427 20,866 43,293 6,993 6,221 13,214 29,420 27,087 56,507
Ajmer 670 637 1,307 460 415 875 1,130 1,052 2,182
Alwar 1,350 1,208 2,558 237 198 435 1,587 1,406 2,993
Banswara 705 689 1,394 56 52 107 761 741 1,502
Baran 445 404 850 90 82 172 535 487 1,022
Barmer 960 860 1,819 78 67 145 1,038 927 1,965
Bharatpur 914 778 1,692 219 190 409 1,133 968 2,101
Bhilwara 808 791 1,599 219 196 415 1,027 987 2,014
Bikaner 569 510 1,079 317 278 595 886 788 1,674
Bundi 410 373 783 94 85 180 505 458 963
Chittaurgarh 768 747 1,514 151 139 289 918 885 1,804
Churu 711 677 1,388 277 259 536 988 936 1,924
Dausa 622 560 1,181 72 64 136 693 624 1,317
Dhaulpur 443 364 807 95 82 177 538 445 983
Dungarpur 506 521 1,027 42 39 81 548 560 1,108
Ganganagar 710 626 1,336 246 208 453 955 834 1,789
Hanumangarh 640 575 1,214 162 142 304 801 717 1,518
Jaipur 1,389 1,270 2,659 1,379 1,213 2,592 2,768 2,483 5,251
Jaisalmer 236 196 432 43 34 76 279 229 508
Jalor 680 659 1,339 58 52 110 738 711 1,449
Jhalawar 524 488 1,012 88 80 168 613 568 1,180
Jhunjhunun 776 743 1,519 208 187 395 984 930 1,914
Jodhpur 994 915 1,909 520 457 977 1,514 1,373 2,887
Karauli 560 477 1,038 92 80 172 652 558 1,210
Kota 382 347 730 445 394 839 827 741 1.569
Nagaur 1,176 1.122 2,298 249 228 477 1,425 1,350 2,775
Pali 715 715 1,429 204 187 391 919 901 1,820
Rajsamand 427 432 858 67 62 129 493 494 987
Sawai Madhopur 479 426 904 113 100 213 591 526 1,117
Sikar 927 888 1,815 246 227 473 1,173 1,115 2,288
Sirohi 357 343 700 81 70 151 438 413 851
Tonk 496 462 959 130 123 253 626 585 1,212
Udaipur 1,078 1,065 2,143 258 233 490 1,336 1,297 2,633
SourCe: Census 2001, office of the registrar General and Census Commissioner, Govt. of India, New Delhi.

6National Dairy Development Board
Part I : General StatisticsDairying in rajasthan - A Statistical Profile 2016

7 National Dairy Development Board
Part I : General StatisticsDairying in rajasthan - A Statistical Profile 2016
I.2. Social Statistics: Human Population
TABLE I.2.2: Human Population by Residence and Sex –2011
DistrictsRural (‘000) Urban (‘000) Total (‘000)
Male Female Total Male Female Total Male Female TotalRAjASTHAN 26,642 24,859 51,500 8,909 8,139 17,048 35,551 32,997 68,548
Ajmer 789 758 1,548 535 501 1,035 1,324 1,259 2,583
Alwar 1,590 1,430 3,020 350 305 654 1,939 1,735 3,674
Banswara 843 827 1,670 65 63 128 908 890 1,797
Baran 502 466 969 132 122 254 634 589 1,223
Barmer 1,273 1,149 2,422 96 86 182 1,369 1,235 2,604
Bharatpur 1,093 960 2,053 262 233 495 1,356 1,193 2,548
Bhilwara 955 940 1,896 265 247 513 1,221 1,188 2,409
Bikaner 821 742 1,564 419 381 800 1,241 1,123 2,364
Bundi 462 426 888 115 107 223 577 534 1,111
Chittaurgarh 636 623 1,259 147 139 285 783 761 1,544
Churu 755 708 1,463 296 280 576 1,051 988 2,040
Dausa 752 681 1,433 106 96 202 858 777 1,634
Dhaulpur 521 438 959 133 115 247 654 553 1,207
Dungarpur 651 649 1,300 45 43 89 697 692 1,389
Ganganagar 758 675 1,434 285 250 535 1,043 926 1,969
Hanumangarh 747 677 1,424 184 166 350 931 844 1,775
Jaipur 1,643 1,511 3,154 1,826 1,646 3,472 3,469 3,158 6,626
Jaisalmer 312 268 581 49 40 89 362 308 670
Jalor 858 819 1,677 79 73 152 937 892 1,829
Jhalawar 607 575 1,182 119 111 229 725 686 1,411
Jhunjhunun 843 805 1,648 253 236 489 1,096 1,041 2,137
Jodhpur 1,260 1,162 2,423 664 601 1,265 1,924 1,763 3,687
Karauli 668 572 1,240 115 103 218 784 675 1,458
Kota 401 373 774 620 557 1,177 1,021 930 1,951
Nagaur 1,369 1,302 2,671 328 310 637 1,696 1,611 3,308
Pali 788 790 1,578 238 222 460 1,025 1,012 2,038
Pratapgarh 401 395 796 37 35 72 438 430 868
Rajsamand 487 486 973 94 89 184 581 575 1,157
Sawai Madhopur 565 504 1,069 139 127 266 704 632 1,336
Sikar 1,047 996 2,043 328 306 634 1,375 1,302 2,677
Sirohi 424 403 828 110 99 209 534 502 1,036
Tonk 568 536 1,104 160 158 318 728 693 1,421
Udaipur 1,251 1,209 2,460 315 293 608 1,567 1,502 3,068
SourCe: Census 2011, office of the registrar General and Census Commissioner, Govt. of India, New Delhi.

8National Dairy Development Board
Part I : General StatisticsDairying in rajasthan - A Statistical Profile 2016
Decadal Growth Rate of Population 1991-2001 2001-2011
Sex Ratio (all age groups) 2001 2011
Population Density 2001 2011

9 National Dairy Development Board
Part I : General StatisticsDairying in rajasthan - A Statistical Profile 2016
I.2. Social Statistics: Human Population
TABLE I.2.3: Rural Households, Electricity & Tap Water Supply - 2001 & 2011
DistrictsRural Households (‘000) Rural Households with
Electricity (‘000)
Rural Households with Tap Water (inclusive –
treated & untreated) (‘000)
2001 2011 2001 2011 2001 2011RAjASTHAN 7,157 9,490 3,151 5,528 1,544 2,554
Ajmer 232 295 115 210 41 78
Alwar 386 505 172 368 49 104
Banswara 241 339 52 95 19 20
Baran 142 192 66 118 11 23
Barmer 286 416 50 97 61 71
Bharatpur 249 338 115 212 20 42
Bhilwara 309 394 152 280 70 105
Bikaner 155 242 44 97 43 98
Bundi 137 178 65 99 11 18
Chittaurgarh 305 268 161 213 58 88
Churu 214 255 81 149 83 182
Dausa 173 256 68 163 17 29
Dhaulpur 116 162 30 63 7 8
Dungarpur 188 265 57 124 20 32
Ganganagar 216 270 117 187 109 177
Hanumangarh 197 262 106 181 97 183
Jaipur 371 503 208 366 65 122
Jaisalmer 71 98 14 31 8 15
Jalor 226 302 79 139 79 112
Jhalawar 174 237 87 179 14 44
Jhunjhunun 246 302 139 222 97 157
Jodhpur 293 413 110 206 72 105
Karauli 157 225 44 100 16 30
Kota 126 149 85 117 16 40
Nagaur 361 483 172 257 124 162
Pali 284 342 174 247 81 123
Pratapgarh 164 58 13
Rajsamand 175 210 95 160 29 59
Sawai Madhopur 144 207 43 98 16 25
Sikar 272 347 167 247 113 160
Sirohi 135 161 75 96 36 49
Tonk 158 214 62 109 14 18
Udaipur 416 497 145 241 44 59
SourCe: Census 2001 and 2011, office of the registrar General and Census Commissioner, Govt. of India, New Delhi.

10National Dairy Development Board
Part I : General StatisticsDairying in rajasthan - A Statistical Profile 2016
Rural Households 2001 2011
Rural Households with Electricity 2001 2011
Rural Households with Tap Water 2001 2011

11 National Dairy Development Board
Part I : General StatisticsDairying in rajasthan - A Statistical Profile 2016
I.2. Social Statistics: Human Population
TABLE I.2.4: District-wise SC and ST Population – 2001 and 2011
DistrictsSC Population (‘000) ST Population (‘000)
2001 2011 2001 2011RAjASTHAN 9,694.5 12,221.6 7,097.7 9,238.5
Ajmer 386.3 478.0 52.6 63.5
Alwar 539.0 653.0 239.9 289.2
Banswara 64.3 80.1 1,085.3 1,373.0
Baran 181.1 221.2 216.9 276.9
Barmer 309.0 436.4 118.7 176.3
Bharatpur 455.9 557.3 47.1 54.1
Bhilwara 316.5 407.9 180.6 229.3
Bikaner 334.2 493.6 5.9 7.8
Bundi 174.3 210.8 194.9 228.5
Chittaurgarh 250.8 250.2 388.3 201.5
Churu 407.2 451.7 10.1 11.2
Dausa 279.4 354.3 353.2 433.3
Dhaulpur 197.9 245.7 47.6 58.6
Dungarpur 46.0 52.3 7,21.5 983.4
Ganganagar 603.4 720.4 14.7 13.5
Hanumangarh 396.6 494.2 10.0 14.3
Jaipur 777.6 1,003.3 412.9 528.0
Jaisalmer 74.1 99.1 27.8 42.4
Jalor 261.3 357.2 126.8 178.7
Jhalawar 184.6 243.6 141.9 182.2
Jhunjhunun 309.2 360.7 36.8 41.6
Jodhpur 456.4 608.0 79.5 118.9
Karauli 280.1 354.5 270.6 325.0
Kota 300.6 405.4 152.0 183.8
Nagaur 545.2 699.9 6.5 10.4
Pali 323.5 398.1 105.8 144.6
Pratapgarh 60.4 550.4
Rajsamand 122.5 148.2 129.2 160.8
Sawai Madhopur 223.2 278.8 241.1 285.8
Sikar 339.8 418.8 62.5 75.3
Sirohi 163.0 201.9 210.8 292.5
Tonk 233.1 287.9 145.9 178.2
Udaipur 158.3 188.5 1,260.4 1,525.3
SC: Scheduled Caste, ST:ScheduledTribe
SourCe: Census 2001 and 2011, office of the registrar General and Census Commissioner, Govt. of India, New Delhi.

12National Dairy Development Board
Part I : General StatisticsDairying in rajasthan - A Statistical Profile 2016
Urbanisation (%) 2001 2011
Literacy Rate 2001 2011
Scheduled Caste and Scheduled Tribe Population (%) 2001 2011

13 National Dairy Development Board
Part I : General StatisticsDairying in rajasthan - A Statistical Profile 2016
I.3. State Economy
TABLE I.3.1: Net State Domestic Product (NSDP) & Per Capita Income
SectorAt Current Prices (` crores)
2004-05 2005-06 2006-07 2007-08 2008-09 2009-10 2010-11 2011-12 2012-13 2013-14 2014-15
State Domestic Product 112,636 125,333 151,428 172,250 203,939 233,767 300,907 374,090 422,982 465,504 516,462
1. Agriculture 25,741 26,718 32,488 39,197 44,203 46,222 75,899 100,538 110,651 122,772 132,764
2. Forestry & Logging 4,665 5,264 6,486 6,288 7,453 9,366 11,065 14,066 14,158 14,952 16,556
3. Fishing 75 85 111 125 134 164 221 279 319 362 423
4. Agriculture & Allied (1+2+3)
30,480 32,068 39,085 45,609 51,789 55,752 87,185 114,883 125,128 138,087 149,743
As % of NSDP 27 26 26 26 25 24 29 31 30 30 29
A Sub-total of Primary 32,746 34,362 42,186 49,492 56,092 61,040 97,963 129,095 142,438 155,934 168,950
As % of NSDP 29 27 28 29 28 26 33 35 34 33 33
B Sub-total of Secondary 29,786 34,390 43,076 46,172 55,235 62,430 66,664 89,106 99,685 103,999 112,273
As % of NSDP 26 27 28 27 27 27 22 24 24 22 22
C Services 50,104 56,582 66,166 76,586 92,611 110,297 136,280 155,888 180,858 205,571 235,238
As % of NSDP 44 45 44 44 45 47 45 42 43 44 46
State Per Capita Income (`) 18,565 20,275 24,055 26,882 31,279 35,254 44,644 54,637 60,844 65,974 72,156
SectorAt 2004-05 Prices (` crores)
2004-05 2005-06 2006-07 2007-08 2008-09 2009-10 2010-11 2011-12 2012-13 2013-14 2014-15
State Domestic Product 112,636 120,202 134,350 140,471 152,284 161,159 185,366 202,749 214,391 224,632 237,530
1. Agriculture 25,741 25,741 27,920 28,149 29,460 28,164 40,829 40,205 39,660 41,831 42,955
2. Forestry & Logging 4,665 4,630 4,759 4,876 4,911 4,982 5,159 5,149 5,183 5,305 5,471
3. Fishing 75 82 97 99 104 113 114 116 129 138 150
4. Agriculture & Allied (1+2+3)
30,480 30,452 32,777 33,124 34,475 33,259 46,102 45,470 44,972 47,275 48,576
As % of NSDP 27 25 24 24 23 21 25 22 21 21 20
Sub-total of Primary 32,746 32,846 36,247 36,768 37,674 36,889 52,193 52,829 53,573 55,692 57,229
As % of NSDP 29 27 27 26 25 23 28 26 25 25 24
Sub-total of Secondary 29,786 32,782 38,206 38,465 41,192 45,057 43,877 55,882 57,423 58,123 59,794
As % of NSDP 26 27 28 27 27 28 24 28 27 26 25
Services 50,104 54,574 59,897 65,239 73,417 79,214 89,295 94,038 103,395 110,817 120,507
As % of NSDP 44 45 45 46 48 49 48 46 48 49 51
State Per Capita Income (`) 18,565 19,445 21,342 21,922 23,356 24,304 27,502 29,612 30,839 31,836 33,186
SourCe:MinistryofStatisticsandProgrammeImplementation,Govt.ofIndia.NoTE:Theestimatesareason31.07.2015.

14National Dairy Development Board
Part I : General StatisticsDairying in rajasthan - A Statistical Profile 2016

15 National Dairy Development Board
Part I : General StatisticsDairying in rajasthan - A Statistical Profile 2016
I.3. State Economy
TABLE I.3.2: Value of Output: Agriculture and Livestock
Item At Current Prices
2004-05 2005-06 2006-07 2007-08 2008-09 2009-10 2010-11Value of Output (` billion)Agriculture and Allied 489 521 615 677 819 897 1,187
Agriculture 265 280 338 384 444 435 636Livestock 167 177 198 220 289 345 418
Milk 114 122 138 152 211 250 308Meat 8 10 10 12 14 16 18Egg 1 1 1 1 1 2 2Dung 39 39 42 46 53 63 73Others^ 5 5 7 9 10 14 17
Share of Value of Output to Agriculture and Allied (%)Agriculture 54 54 55 57 54 48 54Livestock 34 34 32 32 35 38 35
Share of Value of Output to Livestock Output (%)Milk 68 69 70 69 73 72 74Meat 5 6 5 5 5 5 4Egg 1 1 1 0 0 1 0Dung 23 22 21 21 18 18 17Others^ 3 3 4 4 3 4 4
Item At Constant Prices (2004-05)
2004-05 2005-06 2006-07 2007-08 2008-09 2009-10 2010-11 Value of Output (` billion)Agriculture and Allied 489 488 521 534 577 538 643
Agriculture 265 259 280 287 307 252 342Livestock 167 173 183 186 217 225 239
Milk 114 119 128 130 159 165 177Meat 8 9 9 9 9 10 11Egg 1 1 1 1 1 1 1Dung 39 39 40 41 42 43 44Others^ 5 5 5 5 6 6 6
Share of Value of Output to Agriculture and Allied (%)Agriculture 54 53 54 54 53 47 53Livestock 34 35 35 35 38 42 37
Share of Value of Output to Livestock Output (%)Milk 68 69 70 70 73 73 74Meat 5 5 5 5 4 4 5Egg 1 1 1 1 0 0 0Dung 23 23 22 22 19 19 18Others^ 3 3 3 3 3 3 3
^Includes Wool and Hair, Silkworm Cocoons & Honey, Increment in Stock.SourCe:Statewiseestimatesofvalueofoutputfromagricultureandalliedactivitieswithnewbaseyear2004-2005(Publishedin2013),MinistryofStatistics
andProgrammeImplementation,Govt.ofIndia.

16National Dairy Development Board
Part I : General StatisticsDairying in rajasthan - A Statistical Profile 2016
I.3. State Economy
TABLE I.3.3: Approved Project Cost for Dairying under Rashtriya Krishi Vikas Yojana (RKVY) in Rajasthan
SegmentApproved Project Cost (` crores)
2007-08 2008-09 2009-10 2010-11 2011-12 2012-13 2013-14 2014-15 Grand Total
Establishment of new Dairy Infrastructure and quality labs and Strengthening the existing one
6.07 20.50 83.10 140.00 249.67
BMC Installation 20.00 61.80 81.80
Establishment of Cattle Feed and Milk powder Plant
25.00 25.00
Others 5.70 1.52 7.22
Capacity Building 3.03 3.03
Grand Total 6.07 46.20 144.90 1.52 165.00 3.03 366.72
SourCe: rashtriya Krishi Vikas Yojana, Department of Agriculture and Cooperation, Ministry of Agriculture and Farmers Welfare, Govt. of India.

17 National Dairy Development Board
Part I : General StatisticsDairying in rajasthan - A Statistical Profile 2016
I.3. State Economy
TABLE I.3.4: Approved Project Cost for Animal Husbandry under Rashtriya Krishi Vikas Yojana (RKVY) in Rajasthan
SegmentApproved Project Cost (` crores)
2007-08 2008-09 2009-10 2010-11 2011-12 2012-13 2013-14 2014-15 Grand Total
Capcity Building/establishment of center for Human Resource Development
12.78 47.33 35.78 95.88
Infrastructure Development-Veterinery Insitututes, Semen Station and lab, Diease Lab, Diagnostic Center, etc
8.27 4.50 2.00 18.42 24.69 29.51 87.39
Mukhyamantri Pashudhan Dawa Yojna/ Animal drug and medicine distribution
4.73 35.00 41.80 81.53
Fodder and Pasture Development 1.40 25.00 0.36 20.55 0.48 6.80 54.59
Establishment of Breeding Farms (Rathi, Kankrej, Tharparkar & Gir)
26.19 7.00 33.19
Breeding bull registration & scrub bull and calf castration
29.38 2.42 31.79
Others 7.00 7.00 3.86 17.86Management of crop residue 13.90 13.90
National Mission of Protein Supplements 13.02 13.02
Programme to combat infertility and other Programmes
0.99 0.99 5.00 4.12 0.65 11.75
Camel Development 0.51 2.50 0.93 3.94Pashupalak Samman Samaroh 2.50 0.55 3.05
Cattle and buffalo development 0.90 1.12 2.02
Horse Development 2.00 2.00
Poultry Development 0.26 0.30 1.06 1.62Animal Health and extension services 1.31 1.31
Mineral Mixture Supplementation 1.10 0.06 1.16
Utilisation of Sexed semen 0.75 0.75
Grand Total 36.85 31.80 59.02 105.60 64.29 159.21 456.77
SourCe: rashtriya Krishi Vikas Yojana, Department of Agriculture and Cooperation, Ministry of Agriculture and Farmers Welfare, Govt. of India.

18National Dairy Development Board
Part I : General StatisticsDairying in rajasthan - A Statistical Profile 2016

Part II : Livestock Census
The total bovine population consisting of Cattle & Buffalo in Rajasthan was 26.3 million numbers in 2012. It has increased by 13 per cent over the previous census. Bovine population has increased substantially in Bharatpur (67 per cent), Bikaner (37 per cent), Churu (36 per cent), Bhilwara (36 per cent), Barmer (26 per cent) & Jodhpur (26 per cent); whereas it declined in Chittaurgarh (31 per cent), Dungarpur (8 per cent), Rajsamand (5 per cent) and Jhalawar (5 per cent). The number of milch animals (in-milk and dry) in cows and buffaloes has Increased at higher rate of 17 per cent from 10.4 million in previous census to 12.2 million. The Female Cattle Population has increased by 18.6 per cent over the previous census (2007) to 10.0 million numbers. The buffalo population has also increased by 17 per cent.
Rajasthan is the second state in the country to have a dedicated ministry for cow husbandry called “Gaupalan department”. To boost milk production, the Rajasthan government is setting up its first cow sanctuary in Bikaner near Indira Canal. Cattle which have become old, infertile and disabled are sent to gaushalas in these states. The state has one of the highest number of gaushalas wherein old, infertile and disabled dairy animals are nurtured with care.

20National Dairy Development Board
Part II : Livestock CensusDairying in rajasthan - A Statistical Profile 2016
II.1. Animal Population
TABLE II.1.1: Summary of Livestock Census (1997 to 2012) – Rajasthan
PopulationLivestock Census
1997 2003 2007 2012
Total Bovine 21,911,892 21,267,346 23,211,486 26,300,557
Total Cattle 12,141,402 10,853,512 12,119,512 13,324,462
Total Exotic/ Crossbred cows 210,685 463,607 815,675 1,735,072
Females 178,071 394,287 692,639 1,496,504
Under 1 year 30,587 79,435 162,875 353,929
1 to 2.5 year 62,128 65,363 109,571 213,160
In-milk 54,143 172,671 315,510 654,393
Dry 24,092 62,042 81,855 205,718
Milch 78,235 234,713 397,365 860,111
Not even calved once 5,880 12,909 16,720 59,743
Others 1,241 1,867 6,108 9,561
Males 32,614 69,320 123,036 238,568
Total Indigenous cows 11,930,717 10,389,905 11,303,837 11,589,390
Females 7,702,811 6,842,908 7,790,537 8,566,178
Under 1 year 1,427,895 1,137,973 1,515,712 1,740,383
1 to 3 years 1,282,768 1,052,278 1,181,482 1,285,369
In-milk 2,408,575 2,208,499 2,902,557 3,090,516
Dry 2,148,161 2,039,823 1,727,900 1,916,800
Milch 4,556,736 4,248,322 4,630,457 5,007,316
Not even calved once 391,777 348,461 308,335 474,772
Others 43,635 55,874 154,551 58,338
Males 4,227,906 3,546,997 3,513,300 3,023,212
Total Buffaloes 9,770,490 10,413,834 11,091,974 12,976,095
Females 8,588,810 9,288,291 9,766,093 11,400,819
Under 1 year 1,832,447 1,793,231 2,186,008 2,625,479
1 to 3 years 1,535,416 1,837,505 1,756,136 1,842,029
In-milk 3,135,969 3,392,360 3,929,229 4,447,558
Dry 1,676,745 1,829,904 1,470,720 1,874,203
Milch 4,812,714 5,222,264 5,399,949 6,321,761
Not even calved once 367,853 418,865 327,986 551,259
Others 40,380 16,426 96,014 60,291
Males 1,181,680 1,125,543 1,325,881 1,575,276
SourCe: 16th, 17th,18th and 19th Livestock Census, Department of Animal Husbandry, Dairying and Fisheries, Ministry of Agriculture and Farmers Welfare, Govt. of India.

21 National Dairy Development Board
Part II : Livestock CensusDairying in rajasthan - A Statistical Profile 2016
II.1. Animal Population
TABLE II.1.2: District-wise Total Bovine Population
DistrictsIndigenous Cattle (‘000) Crossbred Cattle (‘000) Buffalo (‘000)
1997 2003 2007 2012 1997 2003 2007 2012 1997 2003 2007 2012RAjASTHAN 11,931 10,390 11,304 11,589 211 464 816 1,735 9,770 10,414 11,092 12,976
Ajmer 469 295 373 362 13 13 19 43 313 276 336 439
Alwar 202 175 185 144 2 8 12 63 758 917 975 1,061
Banswara 578 657 640 589 1 1 6 10 224 260 275 282
Baran 411 328 352 338 1 1 3 5 179 190 226 250
Barmer 534 537 637 786 0 0 0 2 92 131 156 214
Bharatpur 101 102 115 129 3 5 11 37 538 696 475 836
Bhilwara 724 548 515 596 27 55 68 122 382 313 304 452
Bikaner 555 588 629 849 6 20 42 57 107 133 131 193
Bundi 319 257 269 229 2 4 4 14 229 245 281 317
Chittaurgarh 688 673 719 424 7 21 42 33 395 409 475 393
Churu 331 211 244 315 2 5 12 32 211 195 215 293
Dausa 142 117 120 104 2 5 14 34 347 382 414 488
Dhaulpur 75 56 61 53 1 2 1 6 258 306 310 359
Dungarpur 400 416 425 372 1 1 1 3 177 216 233 232
Ganganagar 375 349 494 464 36 56 92 173 326 268 283 271
Hanumangarh 297 312 363 404 14 30 41 98 331 308 326 389
Jaipur 414 345 340 290 25 67 169 345 767 889 947 1,073
Jaisalmer 310 243 348 433 0 0 1 2 1 2 3 4
Jalor 288 247 294 294 0 0 0 2 315 356 412 469
Jhalawar 429 425 434 377 0 1 1 3 228 264 291 311
Jhunjhunun 116 85 85 49 7 38 90 183 352 379 370 385
Jodhpur 654 488 620 792 15 32 34 56 209 180 263 305
Karauli 151 104 117 92 0 1 2 9 342 359 399 477
Kota 267 228 245 214 2 2 4 9 182 190 227 236
Nagaur 487 355 403 429 2 8 15 73 441 420 460 557
Pali 423 283 350 347 3 5 5 9 317 286 315 312
Pratapgarh 314 16 150
Rajsamand 300 237 263 235 9 15 24 26 222 200 224 222
Sawai Madhopur 187 151 117 108 0 3 1 2 233 232 250 318
Sikar 200 159 179 130 14 37 76 201 459 508 516 554
Sirohi 214 187 202 191 1 0 1 3 128 145 166 186
Tonk 334 219 242 218 1 1 4 9 251 229 311 392
Udaipur 956 1,013 927 919 13 26 19 53 457 530 524 554
Zero denotes either nil or negligible.SourCe: 16th, 17th,18th and 19th Livestock Census, Department of Animal Husbandry, Dairying and Fisheries, Ministry of Agriculture and Farmers Welfare,
Govt. of India.

22National Dairy Development Board
Part II : Livestock CensusDairying in rajasthan - A Statistical Profile 2016
II.1. Animal Population
TABLE II.1.3: District-wise Female Population
DistrictsIndigenous Cattle (‘000) Crossbred Cattle (‘000) Buffalo (‘000)
1997 2003 2007 2012 1997 2003 2007 2012 1997 2003 2007 2012RAjASTHAN 7,703 6,843 7,791 8,566 178 394 693 1,497 8,589 9,288 9,766 11,401
Ajmer 329 217 290 303 12 11 16 37 272 247 295 386
Alwar 151 133 149 126 2 7 10 55 676 833 871 940
Banswara 222 261 253 251 1 1 4 8 199 228 244 254
Baran 222 197 236 248 1 1 2 3 148 161 188 211
Barmer 419 436 508 646 0 0 0 2 79 114 133 181
Bharatpur 80 84 95 112 3 4 10 32 478 625 417 731
Bhilwara 455 345 351 436 22 47 58 103 333 278 265 379
Bikaner 459 501 509 713 5 18 35 50 94 117 112 166
Bundi 161 143 162 170 1 3 4 12 194 216 243 278
Chittaurgarh 358 356 429 266 5 17 33 23 341 355 409 340
Churu 283 181 207 271 2 4 11 28 187 176 192 258
Dausa 94 78 89 87 1 4 12 30 310 349 371 436
Dhaulpur 49 40 48 45 0 1 1 6 227 279 277 318
Dungarpur 146 161 172 165 1 1 1 2 159 195 209 211
Ganganagar 291 272 401 380 30 47 78 148 291 243 254 240
Hanumangarh 245 254 297 332 12 25 34 82 297 279 293 345
Jaipur 294 260 273 251 22 58 148 308 683 804 845 960
Jaisalmer 235 203 272 346 0 0 0 1 1 2 2 3
Jalor 192 175 221 236 0 0 0 2 282 322 369 419
Jhalawar 236 243 256 250 0 1 1 2 196 224 247 266
Jhunjhunun 98 72 73 43 6 33 79 165 316 346 336 345
Jodhpur 535 411 507 668 14 30 30 50 181 156 226 265
Karauli 96 69 80 70 0 1 2 7 303 326 353 416
Kota 159 153 174 169 2 2 3 7 156 165 191 202
Nagaur 404 298 337 370 2 7 12 61 368 362 392 482
Pali 296 205 267 275 2 4 4 8 280 257 279 275
Pratapgarh 168 13 131
Rajsamand 172 144 163 160 8 12 19 22 196 178 197 194
Sawai Mdhopur 98 92 76 85 0 3 1 1 203 208 218 279
Sikar 160 126 146 113 11 30 63 174 406 451 458 489
Sirohi 129 117 138 141 1 0 1 3 114 130 150 171
Tonk 197 135 165 176 1 1 4 8 217 202 272 342
Udaipur 438 479 448 494 11 22 16 44 401 460 457 488
Zero denotes either nil or negligible.SourCe: 16th, 17th,18th and 19th Livestock Census, Department of Animal Husbandry, Dairying and Fisheries, Ministry of Agriculture and Farmers Welfare,
Govt. of India.

23 National Dairy Development Board
Part II : Livestock CensusDairying in rajasthan - A Statistical Profile 2016
II.1. Animal Population
TABLE II.1.4: District-wise Breedable Population
DistrictsIndigenous Cattle (‘000) Crossbred Cattle (‘000) Buffalo (‘000)
1997 2003 2007 2012 1997 2003 2007 2012 1997 2003 2007 2012RAjASTHAN 5,634 5,179 5,684 6,183 116 282 475 1,036 5,989 6,576 6,702 7,854
Ajmer 243 169 212 222 8 8 11 26 194 182 208 272
Alwar 110 96 104 89 1 4 7 37 461 567 575 634
Banswara 170 200 192 190 1 1 3 5 146 171 179 184
Baran 164 147 167 180 1 1 1 2 107 118 131 147
Barmer 309 329 372 462 0 0 0 1 55 80 92 124
Bharatpur 59 61 66 80 2 3 6 22 341 430 279 499
Bhilwara 339 265 261 322 14 33 40 72 239 202 188 269
Bikaner 334 376 367 499 3 14 26 34 65 83 76 112
Bundi 120 109 116 125 1 2 2 8 140 158 169 198
Chittaurgarh 267 271 322 196 3 12 23 16 244 258 290 241
Churu 202 134 145 192 1 3 7 19 126 120 127 174
Dausa 69 59 63 64 1 3 8 21 215 245 249 298
Dhaulpur 37 31 35 34 0 1 1 4 163 200 194 221
Dungarpur 112 125 132 125 0 1 1 1 117 144 152 151
Ganganagar 202 199 288 266 20 33 56 102 197 170 165 165
Hanumangarh 170 182 204 230 8 17 23 56 197 189 194 229
Jaipur 215 195 196 182 14 41 100 213 479 566 574 663
Jaisalmer 173 168 203 249 0 0 0 1 1 2 2 2
Jalor 134 129 161 166 0 0 0 1 187 218 249 277
Jhalawar 178 186 194 188 0 0 1 2 141 162 178 193
Jhunjhunun 67 51 50 30 4 22 51 111 202 224 215 225
Jodhpur 387 312 364 467 10 25 22 37 125 136 157 181
Karauli 72 52 57 51 0 1 1 5 213 228 235 285
Kota 118 113 125 124 1 1 2 5 114 121 137 145
Nagaur 298 230 252 275 1 5 9 43 256 258 276 333
Pali 209 157 195 200 2 3 3 6 191 183 191 188
Pratapgarh 122 9 92
Rajsamand 127 108 120 118 5 9 13 16 139 127 140 138
Sawai Madhopur 74 69 56 62 0 2 1 1 145 147 151 193
Sikar 112 94 103 82 7 20 42 119 268 307 307 327
Sirohi 93 90 102 104 0 0 1 2 79 95 105 118
Tonk 148 104 121 125 0 1 3 5 155 148 191 233
Udaipur 324 365 338 363 7 16 12 32 287 338 325 345
Zero denotes either nil or negligible.
SourCe: 16th, 17th,18th and 19th Livestock Census, Department of Animal Husbandry, Dairying and Fisheries, Ministry of Agriculture and Farmers Welfare, Govt. of India.

24National Dairy Development Board
Part II : Livestock CensusDairying in rajasthan - A Statistical Profile 2016

25 National Dairy Development Board
Part II : Livestock CensusDairying in rajasthan - A Statistical Profile 2016
II.1. Animal Population
TABLE II.1.5: District-wise In-milk Population
DistrictsIndigenous Cattle (‘000) Crossbred Cattle (‘000) Buffalo (‘000)
1997 2003 2007 2012 1997 2003 2007 2012 1997 2003 2007 2012RAjASTHAN 2,409 2,208 2,903 3,091 54 173 316 654 3,136 3,392 3,929 4,448
Ajmer 103 74 107 115 3 5 6 16 101 95 116 151
Alwar 51 45 62 50 1 3 5 24 263 302 365 374
Banswara 59 72 85 80 0 0 2 3 67 78 94 91
Baran 69 59 94 90 0 0 1 1 54 55 79 81
Barmer 142 158 190 242 0 0 0 1 31 41 53 72
Bharatpur 30 32 41 47 1 2 4 14 193 249 183 301
Bhilwara 123 98 119 147 5 17 23 41 107 88 97 137
Bikaner 154 165 182 258 2 9 19 22 30 41 42 62
Bundi 48 44 61 56 0 1 1 4 69 76 96 96
Chittaurgarh 99 103 167 88 1 7 13 9 114 122 157 123
Churu 95 69 82 105 1 2 5 12 63 63 74 103
Dausa 31 27 38 36 0 2 5 13 119 127 157 172
Dhaulpur 16 14 22 19 0 1 0 2 92 110 129 134
Dungarpur 35 41 53 48 0 0 0 1 50 65 76 72
Ganganagar 102 100 160 140 10 20 39 60 106 85 89 90
Hanumangarh 89 94 121 129 4 10 15 35 109 105 121 137
Jaipur 98 89 112 100 7 25 66 135 269 308 359 399
Jaisalmer 71 60 93 120 0 0 0 1 0 1 1 1
Jalor 64 57 75 86 0 0 0 1 105 113 134 157
Jhalawar 69 72 95 91 0 0 0 1 69 81 102 107
Jhunjhunun 39 29 33 18 2 15 37 80 116 131 141 141
Jodhpur 175 148 197 254 5 18 15 25 66 69 87 103
Karauli 30 22 32 26 0 0 1 2 116 120 144 165
Kota 47 52 72 67 1 1 1 3 56 60 83 82
Nagaur 123 96 119 128 1 3 6 26 133 135 159 191
Pali 95 61 94 94 1 2 2 3 103 94 110 105
Pratapgarh 51 5 45
Rajsamand 47 45 56 57 2 5 8 10 67 61 74 72
Sawai Mdhopur 33 31 33 35 1 1 1 1 81 82 100 117
Sikar 55 45 60 49 3 13 30 82 136 160 188 202
Sirohi 40 35 46 45 0 0 0 1 41 47 56 62
Tonk 58 39 62 66 0 0 2 3 78 72 111 133
Udaipur 118 133 139 154 3 10 7 19 130 155 152 171
Zero denotes either nil or negligible.
SourCe: 16th, 17th,18th and 19th Livestock Census, Department of Animal Husbandry, Dairying and Fisheries, Ministry of Agriculture and Farmers Welfare, Govt. of India.

26National Dairy Development Board
Part II : Livestock CensusDairying in rajasthan - A Statistical Profile 2016
II.1. Animal Population
TABLE II.1.6: District-wise Milch Population
DistrictsIndigenous Cattle (‘000) Crossbred Cattle (‘000) Buffalo (‘000)
1997 2003 2007 2012 1997 2003 2007 2012 1997 2003 2007 2012RAjASTHAN 4,557 4,248 4,630 5,007 78 235 397 860 4,812 5,222 5,400 6,322
Ajmer 199 142 175 183 5 7 9 22 160 152 171 223
Alwar 89 79 87 73 1 4 6 31 370 440 470 504
Banswara 137 164 155 153 0 1 2 4 118 138 144 150
Baran 130 121 140 149 0 0 1 1 86 94 109 122
Barmer 252 276 305 371 0 0 0 1 45 63 74 100
Bharatpur 50 51 57 68 1 2 6 19 281 355 235 408
Bhilwara 277 217 216 266 9 27 33 60 191 159 154 218
Bikaner 271 304 290 396 2 12 23 27 50 65 60 86
Bundi 96 90 95 99 0 2 2 6 113 127 136 155
Chittaurgarh 213 221 264 158 2 10 18 13 197 208 236 192
Churu 165 111 116 155 1 2 6 16 95 89 97 136
Dausa 56 49 54 53 1 2 7 17 174 192 205 242
Dhaulpur 30 26 29 29 0 1 1 3 136 163 162 182
Dungarpur 90 102 104 97 0 0 1 1 91 113 119 118
Ganganagar 163 159 234 205 14 27 47 81 153 126 118 124
Hanumangarh 138 145 163 182 6 14 18 44 153 144 150 177
Jaipur 176 163 167 150 10 34 85 179 395 461 475 544
Jaisalmer 138 145 164 204 0 0 0 1 1 1 1 2
Jalor 106 100 124 136 0 0 0 1 149 165 192 217
Jhalawar 146 154 155 152 0 0 0 1 115 131 144 157
Jhunjhunun 55 42 41 25 3 18 42 94 149 166 167 176
Jodhpur 308 256 294 385 7 22 18 32 103 109 127 149
Karauli 58 43 45 42 0 0 1 3 175 184 188 232
Kota 95 93 103 104 1 1 2 4 94 98 112 119
Nagaur 243 193 206 225 1 4 7 36 210 214 229 270
Pali 170 127 161 163 1 3 2 5 156 147 158 153
Pratapgarh 98 7 73
Rajsamand 101 89 98 97 3 7 11 13 111 99 111 111
Sawai Mdhopur 62 58 49 53 0 2 1 1 121 125 130 162
Sikar 91 76 85 69 5 17 35 101 202 231 244 262
Sirohi 75 72 83 81 0 0 0 1 64 75 83 94
Tonk 121 87 101 105 0 0 2 4 127 123 157 191
Udaipur 257 292 269 281 4 14 9 26 227 264 240 272
Zero denotes either nil or negligible.
SourCe: 16th, 17th,18th and 19th Livestock Census, Department of Animal Husbandry, Dairying and Fisheries, Ministry of Agriculture and Farmers Welfare, Govt. of India.

27 National Dairy Development Board
Part II : Livestock CensusDairying in rajasthan - A Statistical Profile 2016
II.1. Animal Population
TABLE II.1.7: District-wise Male Population
DistrictsIndigenous Cattle (‘000) Crossbred Cattle (‘000) Buffalo (‘000)
1997 2003 2007 2012 1997 2003 2007 2012 1997 2003 2007 2012RAjASTHAN 4,228 3,547 3,513 3,023 33 69 123 239 1,182 1,126 1,326 1,575
Ajmer 140 78 84 59 2 2 3 6 40 29 41 53
Alwar 52 41 35 18 0 1 2 8 82 84 104 121
Banswara 356 396 387 338 0 0 2 2 25 32 31 28
Baran 189 131 116 90 0 0 1 3 31 29 37 40
Barmer 116 101 129 140 0 0 0 0 14 17 23 33
Bharatpur 20 19 20 17 1 1 2 5 60 71 58 105
Bhilwara 269 203 164 160 4 8 10 19 49 35 39 73
Bikaner 96 88 120 135 1 2 7 7 13 16 19 28
Bundi 158 114 108 59 0 1 1 2 35 29 38 39
Chittaurgarh 330 316 290 157 2 4 9 10 55 54 66 53
Churu 48 30 37 45 0 1 2 4 24 18 23 35
Dausa 48 40 31 17 0 1 2 4 37 33 43 52
Dhaulpur 26 16 13 8 0 0 0 1 31 27 33 41
Dungarpur 254 255 253 207 0 0 0 1 17 21 24 21
Ganganagar 84 77 93 84 6 9 13 25 35 26 29 31
Hanumangarh 51 58 66 72 2 6 7 16 34 29 34 44
Jaipur 120 84 66 39 3 10 20 37 84 86 102 113
Jaisalmer 76 40 76 87 0 0 0 0 0 0 1 1
Jalor 96 71 73 58 0 0 0 0 33 35 43 50
Jhalawar 193 182 177 127 0 0 0 1 33 40 44 45
Jhunjhunun 17 13 12 6 1 5 11 19 36 33 34 39
Jodhpur 119 76 112 124 1 2 4 7 28 24 37 40
Karauli 56 35 37 22 0 0 0 2 38 33 46 61
Kota 108 75 70 45 0 0 1 2 26 26 35 35
Nagaur 83 58 66 59 0 1 3 11 72 58 69 75
Pali 127 78 83 72 0 0 1 1 37 29 36 37
Pratapgarh 147 3 19
Rajsamand 128 93 100 74 2 2 4 4 26 23 27 28
Sawai Madhopur 88 59 41 24 0 0 0 0 30 24 32 39
Sikar 41 33 33 17 3 8 13 27 53 56 57 65
Sirohi 84 70 64 50 0 0 0 0 14 14 16 16
Tonk 137 84 77 43 0 0 1 2 34 27 39 50
Udaipur 518 533 479 425 2 4 3 9 56 70 67 65
Zero denotes either nil or negligible.
SourCe: 16th, 17th,18th and 19th Livestock Census, Department of Animal Husbandry, Dairying and Fisheries, Ministry of Agriculture and Farmers Welfare, Govt. of India.

28National Dairy Development Board
Part II : Livestock CensusDairying in rajasthan - A Statistical Profile 2016
II.2. Sex Ratio in Dairy Animals
TABLE II.2.1: District-wise Male-Female Ratio
DistrictsIndigenous Cattle (%) Crossbred Cattle (%) Buffalo (%)
1997 2003 2007 2012 1997 2003 2007 2012 1997 2003 2007 2012RAjASTHAN 35 34 31 26 12 15 15 14 15 11 12 12
Ajmer 30 26 22 16 13 13 17 15 12 10 12 12
Alwar 25 24 19 12 11 14 13 12 8 9 11 11
Banswara 62 60 60 57 11 28 29 17 36 12 11 10
Baran 46 40 33 27 17 28 29 51 15 15 17 16
Barmer 22 19 20 18 15 20 22 19 36 13 15 15
Bharatpur 20 18 17 13 11 15 16 14 21 10 12 13
Bhilwara 37 37 32 27 13 15 15 15 16 11 13 16
Bikaner 17 15 19 16 12 12 16 13 19 12 15 14
Bundi 50 45 40 26 15 19 17 18 15 12 13 12
Chittaurgarh 48 47 40 37 14 20 22 29 27 13 14 13
Churu 15 14 15 14 11 15 14 13 12 9 11 12
Dausa 34 34 26 16 11 14 13 11 9 9 10 11
Dhaulpur 34 28 21 15 12 15 23 13 18 9 11 12
Dungarpur 63 61 60 56 10 33 27 21 24 10 10 9
Ganganagar 22 22 19 18 11 16 14 15 17 10 10 12
Hanumangarh 17 19 18 18 10 19 18 16 14 9 10 11
Jaipur 29 24 19 13 11 14 12 11 10 10 11 11
Jaisalmer 24 16 22 20 21 22 21 16 17 15 20 19
Jalor 33 29 25 20 10 22 38 17 30 10 10 11
Jhalawar 45 43 41 34 14 22 23 31 13 15 15 14
Jhunjhunun 15 15 14 12 10 13 12 10 11 9 9 10
Jodhpur 18 16 18 16 13 6 12 12 7 14 14 13
Karauli 37 34 31 24 11 26 12 26 34 9 12 13
Kota 40 33 29 21 14 16 17 19 15 13 16 15
Nagaur 17 16 16 14 16 15 21 16 14 14 15 13
Pali 30 28 24 21 12 10 13 12 13 10 12 12
Pratapgarh 47 17 13
Rajsamand 43 39 38 32 12 15 19 15 19 11 12 13
Sawai Madhopur 47 39 35 22 13 10 13 20 10 10 13 12
Sikar 20 21 18 13 12 20 17 13 23 11 11 12
Sirohi 39 37 32 26 11 19 17 13 24 10 10 8
Tonk 41 38 32 20 14 15 13 20 26 12 13 13
Udaipur 54 53 52 46 12 16 18 17 16 13 13 12
Zero denotes either nil or negligible.
SourCe: 16th, 17th,18th and 19th Livestock Census, Department of Animal Husbandry, Dairying and Fisheries, Ministry of Agriculture and Farmers Welfare, Govt. of India.

29 National Dairy Development Board
Part II : Livestock CensusDairying in rajasthan - A Statistical Profile 2016
II.3. Wet-Dry Ratio of Dairy Animals
TABLE II.3.1: District-wise Wet-Dry Ratio
DistrictsIndigenous Cattle (%) Crossbred Cattle (%) Buffalo (%)
1997 2003 2007 2012 1997 2003 2007 2012 1997 2003 2007 2012RAjASTHAN 53 52 63 62 69 74 79 76 65 65 73 70
Ajmer 52 52 61 63 63 66 74 73 63 63 68 68
Alwar 57 57 70 69 69 73 83 76 71 69 78 74
Banswara 43 44 55 52 67 69 72 71 57 56 65 61
Baran 53 49 68 61 77 75 70 66 63 58 73 66
Barmer 56 57 62 65 65 74 79 66 68 65 71 71
Bharatpur 60 62 73 69 64 73 79 76 69 70 78 74
Bhilwara 44 45 55 55 60 65 67 68 56 55 63 63
Bikaner 57 54 63 65 74 74 83 81 59 64 71 73
Bundi 50 48 63 56 64 65 70 67 61 60 71 62
Chittaurgarh 47 47 63 56 64 68 71 68 58 59 67 64
Churu 58 62 71 68 72 81 82 75 66 70 77 76
Dausa 56 55 70 68 65 73 75 73 69 66 77 71
Dhaulpur 53 55 75 65 67 71 76 71 68 67 80 74
Dungarpur 39 40 51 50 81 69 74 76 55 57 64 61
Ganganagar 63 63 68 68 70 74 83 75 69 68 75 73
Hanumangarh 64 65 74 71 70 75 82 78 71 73 80 77
Jaipur 56 55 67 67 72 73 78 75 68 67 75 73
Jaisalmer 51 41 57 59 71 77 74 79 57 52 65 71
Jalor 60 57 60 63 53 61 85 78 70 68 70 72
Jhalawar 47 47 61 60 72 69 71 69 60 62 71 68
Jhunjhunun 72 70 79 72 78 84 88 84 78 79 84 80
Jodhpur 57 58 67 66 76 78 80 79 64 63 69 69
Karauli 52 52 70 62 73 68 88 65 66 65 76 71
Kota 49 56 70 65 80 72 69 72 60 62 74 69
Nagaur 51 50 58 57 78 72 77 72 63 63 69 71
Pali 56 48 58 58 62 68 74 72 66 64 70 69
Pratapgarh 52 65 62
Rajsamand 47 50 57 58 65 67 72 73 60 62 67 64
Sawai Madhopur 53 54 69 67 63 76 86 83 67 66 77 72
Sikar 60 59 71 71 73 78 85 82 67 69 77 77
Sirohi 53 49 56 55 60 72 72 70 65 63 67 66
Tonk 48 45 61 63 49 62 77 74 61 59 70 69
Udaipur 46 46 52 55 70 77 76 72 57 59 63 63
Zero denotes either nil or negligible.
SourCe: 16th, 17th,18th and 19th Livestock Census, Department of Animal Husbandry, Dairying and Fisheries, Ministry of Agriculture and Farmers Welfare, Govt. of India.

30National Dairy Development Board
Part II : Livestock CensusDairying in rajasthan - A Statistical Profile 2016

31 National Dairy Development Board
Part II : Livestock CensusDairying in rajasthan - A Statistical Profile 2016
II.4. Livestock Density
TABLE II.4.1: District-wise Density of Total Livestock and Bovine
DistrictsLivestock (No. per sq km) Bovine (No. per sq km)
1997 2003 2007 2012 1997 2003 2007 2012RAjASTHAN 159 144 166 169 64 62 68 77
Ajmer 248 190 239 232 94 69 86 100
Alwar 194 199 240 206 115 131 140 151
Banswara 259 310 309 309 178 203 204 195
Baran 117 112 124 115 85 74 83 85
Barmer 145 116 158 189 22 24 28 35
Bharatpur 182 207 183 251 127 159 119 198
Bhilwara 259 203 194 234 108 88 85 112
Bikaner 84 81 85 92 22 25 27 36
Bundi 169 155 172 167 95 88 96 97
Chittaurgarh 221 238 256 176 139 141 158 109
Churu 154 104 137 134 39 30 34 46
Dausa 233 243 283 292 143 147 160 182
Dhaulpur 149 158 174 174 110 120 123 138
Dungarpur 273 303 309 289 153 168 175 161
Ganganagar 130 120 151 144 67 61 79 83
Hanumangarh 129 120 140 138 66 67 76 92
Jaipur 208 221 255 252 108 117 131 153
Jaisalmer 64 46 74 83 8 6 9 11
Jalor 170 154 179 153 57 57 66 72
Jhalawar 149 167 182 165 106 111 117 111
Jhunjhunun 210 200 237 217 80 85 92 104
Jodhpur 172 116 146 157 38 31 40 50
Karauli 144 140 177 169 89 84 94 105
Kota 126 126 139 124 86 81 91 88
Nagaur 183 149 176 178 52 44 50 60
Pali 223 172 187 186 60 46 54 54
Pratapgarh 172 108
Rajsamand 265 233 249 242 114 97 110 104
Sawai Madhopur 176 166 196 179 93 86 82 95
Sikar 232 241 293 274 87 91 100 114
Sirohi 188 189 188 175 67 65 72 74
Tonk 175 141 169 168 81 62 77 86
Udaipur 216 253 233 237 122 134 125 130
Zero denotes either nil or negligible.SourCe: estimated from 16th, 17th,18th and 19th Livestock Census, Department of Animal Husbandry, Dairying and Fisheries, Ministry of Agriculture and
Farmers Welfare, Govt. of India.

32National Dairy Development Board
Part II : Livestock CensusDairying in rajasthan - A Statistical Profile 2016

33 National Dairy Development Board
Part II : Livestock CensusDairying in rajasthan - A Statistical Profile 2016
II.5. Cattle and Buffalo Breeds
TABLE II.5.1: Cattle and Buffalo Breeds of Rajasthan - 2012
(‘000)
Category Total Male Milch Female Total Female
Cattle Jersey Exotic 11.6 41.5 68.7
Crossbred 85.4 268.4 469.1
Holstein Friesian Exotic 11.2 38.2 70.2
Crossbred 130.3 512.1 1,018.8
Gir Pure 70 155.4 259.1
Graded 85.9 205.2 358.3
Hariana Pure 34.9 117.5 195.8
Graded 33.1 102.3 179.6
Kankrej Pure 79.3 218.1 372.4
Graded 75.9 135.6 240
Malvi Pure 203.8 164.2 271.8
Graded 83.2 67.4 111.4
Nagori Pure 59.7 190.9 309.9
Graded 23.9 67.4 109.6
Rathi Pure 137.5 405.6 722.3
Graded 54.5 163.1 303.9
Tharparkar Pure 22.7 65.7 109.7
Graded 59 169.9 294.9
Buffalo Murrah Pure 236.1 934.4 1,682
Graded 518.9 2,181 4,011.6
Surti Pure 53.9 255.8 449.3
Graded 46.6 191.5 342.3
SourCe:EstimatedLivestockPopulationBreedwise,BasedonBreedSurvey,2013,DepartmentofAnimalHusbandry,DairyingandFisheries,MinistryofAgriculture and Farmers Welfare, Govt. of India.

34National Dairy Development Board
Part II : Livestock CensusDairying in rajasthan - A Statistical Profile 2016

35 National Dairy Development Board
Part II : Livestock CensusDairying in rajasthan - A Statistical Profile 2016
II.5. Cattle and Buffalo Breeds
TABLE II.5.2: District and Breed-wise Population of Indigenous Cattle breed in Rajasthan - 2007
Districts
Indigenous Cattle breed Population (‘000)
Gir Hariana Kankrej Malvi Nagori Rathi Thar-parkar
Other's graded
Non-descript
Total Indig-enous Cattle
RAjASTHAN 506.1 574.5 1,195.8 789.4 837.3 924.1 460.2 76.9 5,894.5 11,303.8
Ajmer 175 0.3 1.5 0.5 17.8 0.9 0 3.4 173.6 373.3
Alwar 0 41.8 0 0.5 0.5 0.1 0 8.4 133.1 184.5
Banswara 5.1 0.5 12.1 60 2.2 0 0 2.1 558.2 640.4
Baran 26.1 1.7 0.6 46.9 0.3 0 0 0 275.9 352.1
Barmer 0 0.1 393.8 0 0.4 0 69 0.4 171.2 637.1
Bharatpur 0.3 37.7 0.1 0.1 3.2 0 0.4 0.2 71 114.6
Bhilwara 50.7 1.5 7.5 2.5 3.2 1.5 0 0.4 447.1 514.6
Bikaner 0 13.6 0.9 0 114.7 419.5 10.6 0 67.7 629.2
Bundi 0 0 0 58 0 0 0 3.8 207.3 269.2
Chittaurgarh 39 1.8 14.9 43.7 5.9 0.5 4.9 1 603.5 718.9
Churu 0.5 95.4 0.5 2.7 48.9 50.9 0.6 0 44.1 243.8
Dausa 0 42.3 5 0 0.1 0 0 6.4 65.9 119.8
Dhaulpur 0.1 0.3 0.1 0.5 0.6 0 0 0 58 60.7
Dungarpur 0.4 0.1 1.7 66.3 1.1 2.6 0 0.4 351.5 425.2
Ganganagar 0.4 56.3 0.2 0 7 244.5 11 0.5 169.1 494
Hanumangarh 0.1 88.6 0.9 0 6.8 122.6 8.2 0.2 135 363.2
Jaipur 72.1 59.8 2.3 3.6 38.3 1 1.1 30.4 122.5 339.5
Jaisalmer 0 0.1 11.5 0 2.3 10.1 230.9 0 93.4 348.3
Jalor 0 0 292.8 0 0.1 0 0 0 0.9 293.8
Jhalawar 16.9 0 0 136 0 30 0 0.7 249.6 433.6
Jhunjhunun 0 53.5 0.8 0 6.9 6.1 0.4 0 17.3 84.9
Jodhpur 0 0.1 85.6 0.5 138.9 10 121.3 0 254.8 619.8
Karauli 2.4 5.4 0 5.8 1.8 0.7 0 0 100.2 117.1
Kota 14.5 4.9 0.6 41.7 8 0 0 2.7 171.9 244.8
Nagaur 5.1 0.8 0.3 0.1 349.8 10.2 1.2 0 33.8 402.7
Pali 16.2 0 220.1 0 24.3 0 0 0 89.5 350.2
Rajsamand 16.7 0.1 8 26.5 6.2 0.2 0 0 204 262.7
Sawai Madhopur 2 4.8 0 0.9 0 0.1 0 0.4 108.1 116.6
Sikar 0 47.4 0.1 0.4 47.5 12.2 0 0.1 69.9 178.8
Sirohi 0 0 132.1 0 0.1 0.1 0 0.1 68.6 201.7
Tonk 62.2 15.6 0.3 0 0 0 0 0 163.6 241.8
Udaipur 0.2 0.1 1.4 292.1 0.5 0 0.4 15.3 614 926.8
Zero denotes either nil or negligible.SourCe:18th Livestock Census, Department of Animal Husbandry, Dairying and Fisheries, Ministry of Agriculture and Farmers Welfare, Govt. of India.

36National Dairy Development Board
Part II : Livestock CensusDairying in rajasthan - A Statistical Profile 2016
II.5. Cattle and Buffalo Breeds
TABLE II.5.3: District and Breed-wise Population of Buffalo breed Animals in Rajasthan - 2007
DistrictsBuffalo breed Population (‘000)
Murrah Surti Others graded Non-descript Total BuffaloRAjASTHAN 4,257 951.2 162.2 5,695.2 11,091.4
Ajmer 165.6 10.5 3.5 156.7 336.3
Alwar 248.6 0 15.3 708.8 974.7
Banswara 19.4 40.3 1.4 213.4 274.7
Baran 21.4 28.8 0 175.4 225.7
Barmer 135.7 1.4 0.5 18.9 156.5
Bharatpur 207.2 9.2 1.1 257 474.7
Bhilwara 27.5 19.8 6.4 249.4 303.7
Bikaner 116.1 2.5 0 12.7 131.3
Bundi 63 0 4.7 212.4 281.2
Chittaurgarh 59.4 43 2.1 369.2 474.5
Churu 179.8 3.3 0.4 30.9 214.7
Dausa 110.8 25 35.5 241.9 413.9
Dhaulpur 23.3 3.6 10.5 272.4 310
Dungarpur 26.6 25.5 0 180.1 233
Ganganagar 230.2 6.2 2.5 43.2 282.8
Hanumangarh 225.3 4.8 3.9 91.9 326.4
Jaipur 510.7 83.7 4.5 344.5 946.5
Jaisalmer 2 0.1 0 0.6 2.7
Jalor 411.3 0.1 0 0.2 411.6
Jhalawar 26.6 41.7 0 222.4 290.7
Jhunjhunun 268.3 30.6 6.9 64.6 370.5
Jodhpur 178.3 9.4 1.5 73.8 263
Karauli 53.7 4.4 29 303.1 399.3
Kota 36.5 21.5 4.8 163.8 226.6
Nagaur 193 76.9 5.3 184.1 460.3
Pali 226.5 12.4 0 76.6 315.4
Rajsamand 33.1 27.7 0.1 162.6 223.6
Sawai Madhopur 22.9 5.1 4.4 215.9 250.3
Sikar 167.1 94.2 17.2 236.8 515.7
Sirohi 122.4 4.5 0 39.1 166
Tonk 102.4 0 0.6 207.5 311.4
Udaipur 42.4 315.1 0.2 165.4 523.7
Zero denotes either nil or negligible.SourCe:18th Livestock Census, Department of Animal Husbandry, Dairying and Fisheries, Ministry of Agriculture and Farmers Welfare, Govt. of India.

Part III : Cattle and buffalo breeds
The Rajasthan state has three native cattle breeds viz Rathi, Tharparker and Nagori, having great deal of endurance. Rathi cattle breed is reared for dairy purposes in the northern districts of Shri Ganganagar, Bikaner and parts of Jaisalmer which are irrigated or partially irrigated arid zones with alluvial or loamy soil. The Tharparkar cattle breed is native of the Jodhpur and Jaisalmer districts in eastern region of the state which has arid climate characterised by low rainfall and desert soil. Tharparkar is also known as “White Sindhi”, “Cutchi” or “Thari” cattle breed reared for dual purpose of draught and milk production as it can produce milk under rigorous feeding and unfavourable environmental conditions. Nagori cattle breed has been named after the Nagaur district which is in central part of the state. The Nagori cattle are sturdy and used for ploughing, cultivation, drawing water from wells as well as transportation of field produce to markets. Earlier they were used as trotters in light iron-wheeled carts for quick transportation. There was a good demand of Nagori animals in Bihar but after implementation of Rajasthan Bovine Animal (Prohibition on Slaughter and Regulation of Temporary Migration or Export) Act, the demand has tapered off. In addition to native breeds, Gir, Malvi, Kankrej and Hariana cattle are found in large numbers in the State.
In case of buffalo, there is no native breed. However, enormous number of Murrah, Surti buffaloes are reared in the region.

38National Dairy Development Board
Part III : Cattle and buffalo breedsDairying in rajasthan - A Statistical Profile 2016
II.1. Distribution of Native Breeds in RajasthanTABLE III.1.1: Distribution of Cattle Breeds in Rajasthan
Breed Breeding Tract Utility Distribution
Rathi Bikaner, Ganganagar and Jaisalmer
districts of Rajasthan
Milch Mainly distributed in Bikaner, Ganganagar and
Hanumangarh districts
Tharparkar Jodhpur, Barmer, Jaisalmer districts of
Rajasthan and Kutch district of Gujarat
Milk and Draught
Distributed in Jaisalmer, Jodhpur and Barmer
districts
Nagori Nagaur, Bikaner and Jodhpur districts of
Rajasthan
Draught Mainly distributed across Nagaur, Jodhpur, Bikaner
districts
Source: Animal Genetic resources of India (AGrI-IS), National Bureau of Animal Genetic resources, IcAr and 18th Livestock census, Department of Animal Husbandry, Dairying and Fisheries, Ministry of Agriculture and Farmers Welfare, Govt. of India.

39 National Dairy Development Board
Part III : Cattle and buffalo breedsDairying in rajasthan - A Statistical Profile 2016
Distribution of Indigenous Cattle Breeds
Rathi
Tharparkar

40National Dairy Development Board
Part III : Cattle and buffalo breedsDairying in rajasthan - A Statistical Profile 2016
Distribution of Indigenous Cattle Breeds
Gir
Nagori

41 National Dairy Development Board
Part III : Cattle and buffalo breedsDairying in rajasthan - A Statistical Profile 2016
Distribution of Indigenous Cattle Breeds
Hariana
Kankrej

42National Dairy Development Board
Part III : Cattle and buffalo breedsDairying in rajasthan - A Statistical Profile 2016
Distribution of Indigenous Cattle Breeds
Malvi

43 National Dairy Development Board
Part III : Cattle and buffalo breedsDairying in rajasthan - A Statistical Profile 2016
Distribution of Jersey Crossbred
Distribution of Holstein Friesian Crossbred
Jersey Crossbred
Holstein Friesian Crossbred

44National Dairy Development Board
Part III : Cattle and buffalo breedsDairying in rajasthan - A Statistical Profile 2016

45 National Dairy Development Board
Part III : Cattle and buffalo breedsDairying in rajasthan - A Statistical Profile 2016
Distribution of Buffalo Breeds
Murrah
Surti

46National Dairy Development Board
Part III : Cattle and buffalo breedsDairying in rajasthan - A Statistical Profile 2016
III.2. Performance of Major BreedsTABLE III.2.1: Performance of Native Cattle Breeds
Parameters Cattle
Rathi Tharparkar Nagori
Breed Population as on 2012 1,218,294 486,339 503,193
Colour The animals are usually brown
with white patches all over
the body, but animals having
completely brown, or black
coat with white patches are
often encountered.
Animals are white or light grey.
Face and extremities are of a
darker shade than the body.
Generally white or light grey.
In some cases head, face and
shoulder are slightly greyish.
Average Adult Body Weight (Kg)
Female : 295
Male : 475
Female : 295
Male : 363
Female : 318
Lactation Yield (Kg) 1,560 (1,062 - 2,810) 1,749 (913 - 2,147) 603 (479 - 905)
Lactation Length (days) 336 285 267 (237 - 300)
Calving Interval (days) 512 (420 - 600) 425 (403-565) 455 (420 - 540)
Age at First Calving (days) 1,392 (1,080 - 1,560) 1,231 (1,101 - 1,575) 1,421 (1,260 - 1,500)
Average Milk Fat (%) 3.7 - 4.0 4.9 (4.7 - 4.9) 5.8
Source: Animal Genetic resources of India (AGrI-IS), National Bureau of Animal Genetic resources, IcAr and estimated Livestock Population Breed Wise, Based on Breed Survey 2013, Department of Animal Husbandry, Dairying and Fisheries, Ministry of Agriculture and Farmers Welfare, Govt. of India. Ae Nivsarkar et al., (2000), Animal Genetic resources of India, cattle and Buffalo, IcAr publication.

Part IV : Milk Production
In Rajasthan, livestock sector play major role in improving socio-economic status and fulfilling nutritional needs of rural masses. The state is second highest in milk production in the country. Of the total milk produced, 53 per cent is buffalo milk, 36 per cent is cattle milk and 11 per cent is goat milk. Per capita availability of milk is highest in Jaisalmer district having 1,085 grams of milk per day per person. Approximately, 50 per cent of the milk produced is sold in the market and only 25 per cent is consumed at home as liquid milk. Remaining 25 per cent of the milk produced is converted into milk products. Highest livestock density is in Rajsamand and Dausa district having 292 livestock per square kilometer.
Animal Husbandry is a major economic activity of the rural people of Rajasthan, especially in the arid and semi-arid regions. The State faces frequent droughts and famine which causes frequent crop failure as most of the agriculture is rain fed. In this climatic scenario, dairy sector provides sustainable year-round income to large number of farmers. Over a decade, there has been an incremental increase of 3 per cent in number of in-milk bovine with maximum increase in Jaisalmer and Pali districts.

48National Dairy Development Board
Part IV : Milk ProductionDairying in rajasthan - A Statistical Profile 2016
IV.1. Production PerformanceTable IV.1.1: Year-wise In-milk bovine Population,
Milk Yield and Milk Production
Year In-milk bovine (‘000)
Milk Yield (kg per day)
bovine Milk Production (‘000 MT)
2001-02 4,941 3.775 6,808
2003-04 5,199 3.706 7,033
2004-05 5,162 3.828 7,213
2006-07 6,342 3.871 8,960
2007-08 6,554 4.119 9,855
2008-09 6,518 4.355 10,361
2009-10 6,563 4.543 10,882
2010-11 6,810 4.684 11,644
2011-12 6,757 4.802 11,842
2012-13 6,905 4.851 12,238
2013-14 7,100 4.933 12,793
Source: Integrated Sample Survey reports (2001-02 to 2013-14), Department of Animal Husbandry, Govt. of rajasthan.

49 National Dairy Development Board
Part IV : Milk ProductionDairying in rajasthan - A Statistical Profile 2016
IV.1. Production Performance: Animal PopulationTable IV.1.2: Year & District-wise In-milk bovine Population
DistrictsIn-milk bovine Population (‘000)
2001-02 2003-04 2004-05 2007-08 2008-09 2009-10 2010-11 2011-12 2012-13 2013-14
RaJaSTHaN 4,941 5,199 5,162 6,554 6,518 6,563 6,810 6,757 6,905 7,100
Ajmer 203 183 186 224 223 225 234 240 247 254
Alwar 310 316 322 371 363 361 376 434 438 449
Banswara 110 125 126 167 167 168 174 191 198 209
Baran 112 97 179 187 185 185 192 156 160 156
Barmer 164 177 179 185 188 191 196 332 315 313
Bharatpur 207 263 247 298 290 288 301 153 167 177
Bhilwara 222 187 185 263 265 269 280 289 285 288
Bikaner 173 191 190 258 263 268 277 275 285 296
Bundi 104 107 92 136 134 135 140 187 180 194
Chittaurgarh 189 202 180 260 259 262 272 203 228 274
Churu 136 121 122 157 157 158 164 148 158 152
Dausa 134 198 105 149 146 146 152 185 191 185
Dhaulpur 100 108 112 130 127 126 131 109 109 115
Dungarpur 74 89 84 118 117 117 122 153 144 153
Ganganagar 210 209 188 263 265 269 278 265 273 281
Hanumangarh 193 193 195 235 235 236 245 199 211 213
Jaipur 172 368 376 492 488 490 511 380 422 421
Jaisalmer 67 59 57 79 81 83 85 105 104 111
Jalor 162 156 165 187 185 186 193 163 178 173
Jhalawar 127 135 139 172 172 173 179 180 188 188
Jhunjhunun 143 142 142 185 182 183 191 186 193 205
Jodhpur 172 202 209 273 277 283 293 375 356 377
Karauli 133 130 130 149 146 145 151 143 157 160
Kota 93 96 57 129 129 129 134 130 137 138
Nagaur 233 205 225 257 255 257 266 266 262 268
Pali 188 154 160 183 181 182 189 302 285 312
Pratapgarh
Rajsamand 105 91 100 159 158 159 166 127 138 141
Sawai Madhopur 113 104 111 120 118 118 122 144 143 151
Sikar 171 173 172 235 233 235 245 281 270 267
Sirohi 71 69 73 88 87 88 91 92 94 95
Tonk 127 101 105 123 122 122 127 173 168 167
Udaipur 223 249 249 321 321 324 336 192 222 218
Source: Integrated Sample Survey reports (2001-02 to 2013-14), Department of Animal Husbandry, Govt. of rajasthan.

50National Dairy Development Board
Part IV : Milk ProductionDairying in rajasthan - A Statistical Profile 2016
District-wise In-milk bovine Population

51 National Dairy Development Board
Part IV : Milk ProductionDairying in rajasthan - A Statistical Profile 2016
IV.1. Production Performance: Animal PopulationTable IV.1.3: Year & District-wise In-milk Indigenous Cattle Population
DistrictsIn-milk Indigenous Cattle Population (‘000)
2001-02 2003-04 2004-05 2007-08 2008-09 2009-10 2010-11 2011-12 2012-13 2013-14
RaJaSTHaN 2,286 2,080 2,017 2,786 2,854 2,924 2,995 2,947 3,051 3,111
Ajmer 101 82 83 109 111 114 117 106 112 112
Alwar 51 53 53 69 71 73 74 72 74 75
Banswara 51 60 63 89 92 94 96 78 86 88
Baran 65 52 45 62 64 65 67 82 82 81
Barmer 137 142 147 146 150 153 157 277 254 251
Bharatpur 28 29 28 41 42 43 44 30 34 36
Bhilwara 125 99 93 134 138 141 144 143 145 151
Bikaner 146 157 157 201 206 211 217 219 225 228
Bundi 45 42 28 59 61 62 64 78 73 84
Chittaurgarh 86 95 74 130 133 136 139 92 116 122
Churu 80 65 65 93 95 97 100 80 87 79
Dausa 28 27 58 50 51 52 53 30 44 39
Dhaulpur 15 14 16 20 20 21 21 27 26 29
Dungarpur 31 35 30 52 53 55 56 80 71 79
Ganganagar 107 112 101 143 147 150 154 156 157 161
Hanumangarh 84 93 64 121 124 127 130 101 108 105
Jaipur 101 94 96 136 139 142 146 79 99 92
Jaisalmer 67 58 57 78 80 82 84 104 103 109
Jalor 61 54 60 76 78 79 81 66 79 75
Jhalawar 64 66 69 95 97 100 102 82 88 84
Jhunjhunun 37 28 25 37 38 39 40 28 32 39
Jodhpur 171 142 141 172 177 180 185 216 216 225
Karauli 28 20 23 28 29 29 30 26 27 28
Kota 45 44 4 64 66 68 69 53 58 56
Nagaur 116 87 98 122 125 128 131 135 129 134
Pali 88 54 57 75 77 79 80 178 161 187
Pratapgarh
Rajsamand 44 35 40 52 53 54 56 46 52 53
Sawai Madhopur 33 25 29 34 35 36 37 34 37 39
Sikar 51 42 32 58 60 61 63 61 61 68
Sirohi 33 30 32 44 45 46 47 42 45 46
Tonk 55 33 34 49 50 51 52 65 62 64
Udaipur 112 110 114 146 149 153 157 80 105 92
Source: Integrated Sample Survey reports (2001-02 to 2013-14), Department of Animal Husbandry, Govt. of rajasthan.

52National Dairy Development Board
Part IV : Milk ProductionDairying in rajasthan - A Statistical Profile 2016
District-wise In-milk Indigenous Cattle Population

53 National Dairy Development Board
Part IV : Milk ProductionDairying in rajasthan - A Statistical Profile 2016
IV.1. Production Performance: Animal PopulationTable IV.1.4: Year & District-wise In-milk Crossbred Cattle Population
DistrictsIn-milk Crossbred Cattle Population (‘000)
2006-07 2007-08 2008-09 2009-10 2010-11 2011-12 2012-13 2013-14
RaJaSTHaN 243.51 272.79 291.45 311.00 332.00 311.94 326.48 331.80
Ajmer 7.01 8.39 8.95 9.55 10.19 10.42 10.50 10.69
Alwar 1.70 1.90 2.03 2.16 2.31 5.22 5.25 5.37
Banswara 0.55 0.61 0.65 0.69 0.74 2.11 2.11 2.17
Baran 0.69 0.77 0.82 0.88 0.94 0.71 0.76 0.78
Barmer 0.14 0.15 0.16 0.17 0.18 0.15 0.18 0.20
Bharatpur 0.85 0.96 1.02 1.09 1.16 6.16 6.31 6.47
Bhilwara 29.10 32.53 34.70 37.03 39.53 24.42 25.94 25.94
Bikaner 14.56 16.28 17.37 18.53 19.78 15.26 18.47 18.61
Bundi 1.63 1.83 1.95 2.08 2.22 1.59 1.72 1.82
Chittaurgarh 10.90 12.18 12.99 13.87 14.80 12.18 13.94 13.80
Churu 0.01 0.01 0.01 0.02 0.02 5.04 5.52 5.61
Dausa 0.42 0.47 0.50 0.53 0.57 6.03 6.61 7.00
Dhaulpur 0.15 0.17 0.18 0.19 0.20 0.41 0.45 0.49
Dungarpur 0.61 0.68 0.73 0.78 0.83 0.43 0.45 0.48
Ganganagar 20.11 22.48 23.99 25.59 27.32 41.75 42.13 42.71
Hanumangarh 3.58 4.01 4.27 4.56 4.87 15.70 16.27 16.42
Jaipur 42.71 47.75 50.94 54.35 58.02 48.04 49.44 49.88
Jaisalmer 0.01 0.01 0.01 0.01 0.01 0.15 0.24 0.25
Jalor 0.14 0.15 0.16 0.17 0.18 0.22 0.24 0.25
Jhalawar 0.07 0.08 0.09 0.09 0.10 0.22 0.33 0.35
Jhunjhunun 17.05 19.06 20.34 21.70 23.16 37.08 38.22 38.69
Jodhpur 31.39 35.09 37.43 39.94 42.64 17.40 18.01 18.35
Karauli 0.56 0.63 0.67 0.72 0.76 1.05 1.05 1.08
Kota 1.75 1.95 2.08 2.22 2.37 1.47 1.57 1.69
Nagaur 2.08 2.33 2.48 2.65 2.83 5.85 5.92 6.04
Pali 1.16 1.30 1.38 1.48 1.58 2.01 2.03 2.16
Pratapgarh
Rajsamand 9.84 11.00 12.18 13.00 13.87 8.35 8.84 8.98
Sawai Madhopur 0.33 0.37 0.40 0.43 0.45 0.62 0.67 0.72
Sikar 24.22 27.08 28.89 30.82 32.90 33.13 33.65 34.14
Sirohi 0.25 0.28 0.30 0.32 0.34 0.32 0.33 0.39
Tonk 0.57 0.63 0.68 0.72 0.77 1.79 1.87 1.95
Udaipur 19.38 21.67 23.12 24.67 26.33 6.64 7.48 8.34
Source: Integrated Sample Survey reports (2006-07 to 2013-14), Department of Animal Husbandry, Govt. of rajasthan.

54National Dairy Development Board
Part IV : Milk ProductionDairying in rajasthan - A Statistical Profile 2016
District-wise In-milk Crossbred Cattle Population

55 National Dairy Development Board
Part IV : Milk ProductionDairying in rajasthan - A Statistical Profile 2016
IV.1. Production Performance: Animal PopulationTable IV.1.5: Year & District-wise In-milk buffalo Population
DistrictsIn-milk buffalo Population (‘000)
2001-02 2003-04 2004-05 2007-08 2008-09 2009-10 2010-11 2011-12 2012-13 2013-14
RaJaSTHaN 2,655 3,119 3,145 3,495 3,373 3,328 3,483 3,498 3,527 3,657
Ajmer 103 101 103 107 103 102 106 123 125 131
Alwar 259 263 268 300 290 286 299 357 359 369
Banswara 59 65 64 77 74 73 77 110 110 118
Baran 47 45 134 124 120 118 124 74 77 74
Barmer 26 36 32 39 38 37 39 55 60 62
Bharatpur 179 233 219 256 247 244 255 117 126 135
Bhilwara 97 88 92 96 93 91 96 122 114 111
Bikaner 27 34 33 40 39 38 40 41 42 50
Bundi 59 65 64 74 72 71 74 107 105 108
Chittaurgarh 104 107 106 118 114 112 117 98 98 138
Churu 55 56 57 64 62 61 64 64 65 67
Dausa 107 171 47 98 95 94 98 149 140 139
Dhaulpur 85 94 96 110 107 105 110 81 83 85
Dungarpur 43 54 54 65 63 62 65 73 72 74
Ganganagar 103 96 88 97 94 93 97 68 73 78
Hanumangarh 108 100 131 110 106 105 110 83 87 92
Jaipur 71 275 281 308 297 294 307 253 274 280
Jaisalmer 0 1 1 1 1 1 1 1 1 1
Jalor 101 102 105 112 108 106 111 97 99 98
Jhalawar 63 69 70 77 74 73 77 97 100 104
Jhunjhunun 106 114 117 129 124 123 128 121 123 127
Jodhpur 1 60 68 65 63 62 65 142 122 133
Karauli 105 110 106 121 116 115 120 116 128 130
Kota 49 53 53 63 60 60 62 76 77 80
Nagaur 117 118 127 133 128 127 132 124 126 128
Pali 100 100 103 107 103 102 107 122 121 123
Pratapgarh
Rajsamand 61 56 60 97 93 92 96 73 77 80
Sawai Madhopur 80 79 82 85 82 81 85 110 106 111
Sikar 120 131 140 150 144 143 149 187 176 165
Sirohi 38 39 41 44 42 42 44 49 48 48
Tonk 71 67 71 74 71 70 74 107 104 101
Udaipur 111 139 135 154 148 146 153 105 109 117
Source: Integrated Sample Survey reports (2001-02 to 2013-14), Department of Animal Husbandry, Govt. of rajasthan.

56National Dairy Development Board
Part IV : Milk ProductionDairying in rajasthan - A Statistical Profile 2016
District-wise In-milk buffalo Population

57 National Dairy Development Board
Part IV : Milk ProductionDairying in rajasthan - A Statistical Profile 2016
IV.2. Production Performance: Milk Yield Table IV.2.1: Year & District-wise bovine Milk Yield
DistrictsIn-milk bovine Yield (kg/day)
2001-02 2003-04 2004-05 2007-08 2008-09 2009-10 2010-11 2011-12 2012-13 2013-14
RaJaSTHaN 3.775 3.706 3.828 4.119 4.355 4.543 4.684 4.802 4.851 4.933
Ajmer 3.736 3.958 5.152 4.791 5.121 5.371 5.525 5.754 5.832 6.344
Alwar 4.516 4.552 4.965 5.850 6.097 6.237 6.482 5.760 5.862 6.198
Banswara 2.690 2.997 3.055 2.734 2.899 2.990 3.097 3.024 3.038 3.455
Baran 2.067 8.230 4.273 2.907 3.031 3.098 3.222 3.687 3.801 3.949
Barmer 2.652 3.197 3.161 3.628 3.920 4.076 4.207 4.027 4.079 3.970
Bharatpur 3.921 3.830 3.768 3.843 4.029 4.134 4.290 5.174 5.283 5.078
Bhilwara 3.223 3.307 3.290 3.544 3.745 4.013 4.097 4.121 4.183 4.122
Bikaner 5.281 4.912 5.058 5.142 5.614 5.958 6.092 3.519 3.934 3.891
Bundi 2.810 3.341 3.240 4.266 4.527 4.681 4.841 5.629 5.631 5.136
Chittaurgarh 2.372 2.224 2.430 2.952 3.113 3.254 3.355 3.889 3.730 4.152
Churu 3.293 3.647 3.520 4.121 4.437 4.609 4.757 4.866 4.920 5.025
Dausa 4.405 1.192 2.069 3.986 4.186 4.296 4.459 5.564 5.381 5.683
Dhaulpur 3.444 3.560 3.839 4.076 4.258 4.356 4.526 4.672 4.711 4.202
Dungarpur 2.259 2.495 2.277 3.284 3.486 3.601 3.727 3.427 3.572 3.876
Ganganagar 4.594 4.610 4.521 5.096 5.440 5.749 5.891 5.009 5.282 5.056
Hanumangarh 4.619 4.221 4.191 4.181 4.468 4.649 4.796 4.922 5.052 5.130
Jaipur 10.533 5.020 4.487 4.927 5.161 5.438 5.582 6.273 6.211 6.556
Jaisalmer 2.311 2.615 2.682 3.388 3.790 4.008 4.105 3.733 3.883 3.675
Jalor 3.651 4.773 5.088 4.284 4.548 4.692 4.858 4.744 4.732 5.237
Jhalawar 2.128 2.261 2.309 2.588 2.727 2.800 2.907 3.962 3.852 4.044
Jhunjhunun 4.096 4.685 5.031 4.679 4.863 5.155 5.288 6.626 6.598 6.401
Jodhpur 4.522 3.215 3.618 4.563 4.860 5.208 5.312 4.856 4.945 4.871
Karauli 3.535 3.599 3.717 4.229 4.423 4.531 4.706 3.577 3.645 4.040
Kota 2.389 2.303 3.205 2.592 2.732 2.826 2.926 3.936 3.839 4.089
Nagaur 3.043 3.057 3.353 3.475 3.698 3.833 3.962 4.426 4.511 4.580
Pali 3.589 3.763 3.753 4.413 4.681 4.836 5.004 4.716 4.764 4.782
Pratapgarh
Rajsamand 2.845 2.557 2.496 3.583 3.729 3.884 4.008 4.385 4.369 4.502
Sawai Madhopur 3.744 3.855 4.221 4.650 4.866 4.984 5.178 5.112 5.116 5.326
Sikar 3.979 4.365 4.856 5.402 5.617 5.926 6.081 6.385 6.386 6.434
Sirohi 3.378 3.582 3.834 4.169 4.460 4.622 4.776 5.079 5.088 4.815
Tonk 3.387 4.097 3.605 3.200 3.392 3.504 3.626 4.616 4.715 4.381
Udaipur 2.680 2.528 2.474 3.037 3.183 3.345 3.444 4.709 4.539 4.666
Source: Integrated Sample Survey reports (2001-02 to 2013-14), Department of Animal Husbandry, Govt. of rajasthan.

58National Dairy Development Board
Part IV : Milk ProductionDairying in rajasthan - A Statistical Profile 2016
District-wise In-milk bovine Milk Yield

59 National Dairy Development Board
Part IV : Milk ProductionDairying in rajasthan - A Statistical Profile 2016
IV.2. Production Performance: Milk Yield Table IV. 2.2: Year & District-wise Indigenous Cattle Milk Yield
DistrictsIndigenous Cattle Milk Yield (kg/day)
2001-02 2003-04 2004-05 2007-08 2008-09 2009-10 2010-11 2011-12 2012-13 2013-14
RaJaSTHaN 2.787 2.790 2.862 3.100 3.480 3.680 3.769 3.544 3.667 3.674
Ajmer 2.884 3.343 4.386 4.197 4.712 4.982 5.103 4.438 4.626 5.177
Alwar 2.995 3.101 3.514 3.109 3.490 3.691 3.780 3.682 3.810 3.984
Banswara 1.665 1.587 1.791 1.904 2.137 2.260 2.315 2.125 2.223 2.537
Baran 1.420 1.320 3.149 1.418 1.592 1.683 1.724 2.679 2.901 3.093
Barmer 2.387 3.055 2.988 2.874 3.226 3.412 3.494 3.856 3.875 3.859
Bharatpur 2.510 2.784 2.488 3.322 3.730 3.944 4.040 4.094 4.305 4.388
Bhilwara 3.127 3.004 2.380 2.709 3.041 3.215 3.293 3.098 3.159 3.192
Bikaner 5.326 4.899 4.859 4.837 5.430 5.743 5.882 2.966 3.445 3.254
Bundi 1.771 2.212 2.135 3.335 3.744 3.959 4.055 3.969 3.960 4.231
Chittaurgarh 1.385 1.383 1.573 1.987 2.230 2.359 2.416 2.653 2.613 2.908
Churu 2.818 3.290 2.971 3.557 3.993 4.223 4.325 3.839 3.955 3.853
Dausa 3.009 2.757 1.394 2.581 2.897 3.064 3.138 3.205 3.167 3.152
Dhaulpur 2.427 2.138 2.137 2.641 2.965 3.135 3.211 3.235 3.205 3.319
Dungarpur 1.676 1.679 1.557 2.548 2.861 3.025 3.098 2.639 2.776 2.826
Ganganagar 4.593 4.311 3.703 4.392 4.930 5.214 5.340 3.923 4.276 4.116
Hanumangarh 4.040 3.457 3.285 3.483 3.910 4.135 4.235 3.822 4.032 3.918
Jaipur 3.804 3.394 3.699 3.853 4.325 4.574 4.685 4.359 4.388 4.774
Jaisalmer 2.321 2.289 2.316 3.379 3.793 4.011 4.108 3.717 3.866 3.653
Jalor 2.348 3.308 3.263 3.446 3.869 4.091 4.190 4.020 4.065 4.065
Jhalawar 1.285 1.204 1.209 1.570 1.762 1.864 1.909 2.761 2.646 2.712
Jhunjhunun 2.936 3.429 3.740 2.893 3.248 3.434 3.518 4.521 4.309 4.563
Jodhpur 2.869 2.690 2.818 3.666 4.115 4.352 4.457 3.587 3.828 3.726
Karauli 2.248 2.648 2.797 2.784 3.126 3.305 3.385 3.495 3.556 3.496
Kota 1.777 1.321 1.394 1.643 1.845 1.951 1.998 2.855 2.737 3.089
Nagaur 2.453 2.396 2.592 2.746 3.082 3.259 3.338 3.488 3.516 3.514
Pali 2.458 2.430 2.430 3.495 3.924 4.149 4.249 4.025 4.059 3.997
Pratapgarh
Rajsamand 1.922 1.815 1.940 1.891 2.123 2.245 2.299 2.536 2.646 2.764
Sawai Madhopur 2.450 2.582 2.738 2.768 3.108 3.286 3.366 3.991 4.014 4.029
Sikar 3.039 3.321 3.684 3.466 3.891 4.115 4.215 5.112 4.962 4.966
Sirohi 2.401 2.668 2.858 3.545 3.979 4.208 4.310 4.000 4.086 3.727
Tonk 2.536 2.707 2.712 2.533 2.843 3.007 3.080 4.331 4.541 3.639
Udaipur 1.842 1.844 1.983 1.870 2.099 2.220 2.274 3.060 3.046 2.993
Source: Integrated Sample Survey reports (2001-02 to 2013-14), Department of Animal Husbandry, Govt. of rajasthan.

60National Dairy Development Board
Part IV : Milk ProductionDairying in rajasthan - A Statistical Profile 2016
District-wise Indigenous Cattle Milk Yield

61 National Dairy Development Board
Part IV : Milk ProductionDairying in rajasthan - A Statistical Profile 2016
IV.2. Production Performance: Milk Yield Table IV.2.3: Year & District-wise Crossbred Cattle Milk Yield
DistrictsCrossbred Cattle Milk Yield (kg/day)
2006-07 2007-08 2008-09 2009-10 2010-11 2011-12 2012-13 2013-14
RaJaSTHaN 6.820 6.823 6.608 7.770 7.535 7.595 7.669 7.749
Ajmer 8.620 8.620 8.350 9.819 9.522 7.885 8.089 8.669
Alwar 8.700 8.700 8.428 9.911 9.611 7.448 7.488 7.666
Banswara 5.462 5.462 5.291 6.222 6.034 5.937 5.905 6.109
Baran 5.350 5.350 5.183 6.094 5.910 6.266 6.258 6.386
Barmer 5.850 5.850 5.667 6.664 6.462 5.295 5.448 5.719
Bharatpur 6.012 6.012 5.824 6.849 6.641 7.309 7.295 7.431
Bhilwara 6.017 6.017 5.829 6.854 6.647 7.116 7.131 7.203
Bikaner 6.780 6.780 6.568 7.723 7.490 6.932 6.867 7.267
Bundi 4.900 4.900 4.747 5.582 5.413 7.010 7.044 7.107
Chittaurgarh 5.450 5.450 5.280 6.208 6.021 7.060 7.015 7.336
Churu 6.500 6.500 6.297 7.404 7.180 6.707 7.054 7.178
Dausa 6.000 6.000 5.812 6.835 6.628 6.949 6.920 6.933
Dhaulpur 5.420 5.420 5.250 6.174 5.987 6.669 6.743 6.945
Dungarpur 5.100 5.100 4.940 5.810 5.634 5.877 5.877 6.161
Ganganagar 6.839 6.839 6.625 7.791 7.555 7.967 8.321 8.212
Hanumangarh 6.780 6.780 6.568 7.723 7.490 7.945 8.321 7.971
Jaipur 7.156 7.156 6.932 8.152 7.905 7.850 7.822 7.917
Jaisalmer 5.511 5.511 5.339 6.278 6.088 6.240 6.584 6.594
Jalor 5.950 5.950 5.764 6.778 6.573 6.796 6.659 6.997
Jhalawar 5.480 5.480 5.309 6.243 6.054 6.180 6.607 6.623
Jhunjhunun 8.410 8.410 8.147 9.580 9.290 7.817 7.981 8.021
Jodhpur 6.940 6.940 6.723 7.906 7.667 7.766 7.845 7.461
Karauli 6.100 6.100 5.909 6.949 6.739 6.748 6.759 6.965
Kota 6.200 6.200 6.006 7.063 6.849 6.966 7.055 7.001
Nagaur 7.430 7.430 7.198 8.464 8.208 7.061 7.273 7.347
Pali 6.320 6.320 6.122 7.199 6.982 7.341 7.370 7.538
Pratapgarh
Rajsamand 5.200 5.200 5.037 5.924 5.744 6.985 7.154 7.730
Sawai Madhopur 6.500 6.500 6.297 7.404 7.180 6.540 6.547 6.787
Sikar 7.800 7.800 7.556 8.885 8.617 8.121 8.267 8.313
Sirohi 6.130 6.130 5.938 6.983 6.772 6.518 6.528 6.682
Tonk 6.200 6.200 6.006 7.063 6.849 7.032 7.038 7.111
Udaipur 5.722 5.722 5.543 6.518 6.321 6.731 6.533 6.553
Source: estimated from Integrated Sample Survey reports (2006-07 to 2013-14), Department of Animal Husbandry, Govt. of rajasthan.

62National Dairy Development Board
Part IV : Milk ProductionDairying in rajasthan - A Statistical Profile 2016
District-wise Crossbred Cattle Milk Yield

63 National Dairy Development Board
Part IV : Milk ProductionDairying in rajasthan - A Statistical Profile 2016
IV.2. Production Performance: Milk Yield Table IV.2.4: Year & District-wise buffalo Milk Yield
Districtsbuffalo Milk Yield (kg/day)
2001-02 2003-04 2004-05 2007-08 2008-09 2009-10 2010-11 2011-12 2012-13 2013-14
RaJaSTHaN 4.218 4.293 4.412 4.700 4.900 5.000 5.200 5.587 5.624 5.756
Ajmer 4.572 4.455 5.772 5.066 5.282 5.390 5.605 6.708 6.718 7.159
Alwar 4.810 4.839 5.247 6.443 6.717 6.854 7.129 6.152 6.253 6.624
Banswara 3.589 4.303 4.292 3.661 3.816 3.894 4.050 3.607 3.615 4.095
Baran 2.950 4.899 4.597 3.627 3.782 3.859 4.013 4.779 4.730 4.856
Barmer 4.033 4.561 3.913 6.395 6.667 6.803 7.075 4.887 4.937 4.824
Bharatpur 4.146 3.947 3.927 3.907 4.073 4.156 4.322 5.333 5.450 5.147
Bhilwara 3.358 3.624 4.203 3.847 4.011 4.093 4.256 4.714 4.811 4.665
Bikaner 5.056 4.882 6.007 5.911 6.162 6.288 6.540 5.213 5.277 5.538
Bundi 3.587 4.066 3.714 4.971 5.182 5.288 5.500 6.809 6.769 5.809
Chittaurgarh 3.194 2.966 3.013 3.737 3.896 3.975 4.135 4.658 4.593 4.938
Churu 3.958 4.059 4.151 4.911 5.120 5.225 5.434 6.007 6.032 6.226
Dausa 4.776 3.735 2.880 4.670 4.868 4.968 5.166 5.984 6.008 6.332
Dhaulpur 3.630 3.773 4.149 4.317 4.500 4.592 4.776 5.140 5.164 4.487
Dungarpur 2.673 3.025 2.690 3.838 4.002 4.083 4.247 4.278 4.343 4.987
Ganganagar 4.590 4.929 5.465 5.691 5.933 6.054 6.297 5.675 5.698 5.267
Hanumangarh 5.082 4.828 4.650 4.829 5.035 5.138 5.343 5.688 5.715 6.006
Jaipur 5.280 5.560 4.758 5.034 5.248 5.355 5.569 6.565 6.577 6.896
Jaisalmer 3.475 3.242 3.242 3.279 3.419 3.488 3.628 5.173 5.128 5.593
Jalor 4.438 5.556 6.141 4.830 5.035 5.138 5.343 5.232 5.260 6.126
Jhalawar 2.998 3.279 3.392 3.825 3.988 4.070 4.232 4.970 4.905 5.103
Jhunjhunun 4.486 4.990 5.335 4.622 4.819 4.917 5.114 6.742 6.758 6.478
Jodhpur 4.701 4.485 5.323 5.601 5.840 5.959 6.197 6.432 6.504 6.466
Karauli 3.889 3.766 3.901 4.541 4.734 4.831 5.024 3.567 3.638 4.134
Kota 2.949 3.151 2.257 3.442 3.589 3.662 3.809 4.634 4.599 4.728
Nagaur 3.630 3.548 3.948 4.056 4.228 4.315 4.487 5.323 5.402 5.560
Pali 4.601 4.501 4.502 5.012 5.225 5.332 5.545 5.684 5.658 5.924
Pratapgarh
Rajsamand 3.494 3.007 2.877 4.290 4.473 4.564 4.746 5.262 5.222 5.286
Sawai Madhopur 4.270 4.255 4.721 5.382 5.611 5.725 5.954 5.453 5.489 5.768
Sikar 4.380 4.866 5.133 5.700 5.943 6.064 6.306 6.489 6.516 6.653
Sirohi 4.234 4.230 4.638 4.752 4.955 5.056 5.258 6.004 6.012 5.834
Tonk 3.522 4.783 4.041 3.599 3.752 3.828 3.982 4.748 4.777 4.802
Udaipur 3.522 3.073 2.891 3.748 3.907 3.987 4.146 5.841 5.838 5.850
Source: Integrated Sample Survey reports (2001-02 to 2013-14), Department of Animal Husbandry, Govt. of rajasthan.

64National Dairy Development Board
Part IV : Milk ProductionDairying in rajasthan - A Statistical Profile 2016
District-wise buffalo Milk Yield

65 National Dairy Development Board
Part IV : Milk ProductionDairying in rajasthan - A Statistical Profile 2016
IV.3. Production Performance: Milk ProductionTable IV.3.1: Year & District-wise Total Milk Production (bovine & Goat)
DistrictsTotal Milk Production (‘000 MT)
2001-02 2003-04 2004-05 2007-08 2008-09 2009-10 2010-11 2011-12 2012-13 2013-14
RaJaSTHaN 7,597 7,897 8,122 11,378 11,933 12,330 13,234 13,512 13,930 14,565
Ajmer 327 314 412 460 488 506 542 593 613 679
Alwar 542 545 610 827 843 854 925 990 1,011 1,116
Banswara 113 143 146 176 186 192 206 230 241 296
Baran 88 308 290 212 217 221 239 228 240 245
Barmer 250 267 308 416 443 445 478 624 615 596
Bharatpur 310 377 357 430 440 447 484 300 335 345
Bhilwara 290 251 258 378 401 431 457 489 486 487
Bikaner 355 371 378 530 584 626 662 419 473 487
Bundi 113 144 120 235 247 254 273 411 397 388
Chittaurgarh 181 181 179 315 332 345 370 326 347 455
Churu 193 220 204 339 360 365 391 327 360 358
Dausa 227 92 85 240 249 253 273 410 412 425
Dhaulpur 135 147 162 202 206 208 226 195 198 188
Dungarpur 67 87 82 155 164 168 180 214 210 248
Ganganagar 374 374 334 518 555 590 628 513 554 549
Hanumangarh 335 310 315 377 401 418 447 383 415 426
Jaipur 713 749 675 986 1,024 1,070 1,148 941 1,036 1,084
Jaisalmer 98 81 86 142 159 164 174 231 236 255
Jalor 242 302 330 336 352 359 387 323 349 371
Jhalawar 109 123 129 186 195 199 214 291 295 313
Jhunjhunun 261 294 309 378 388 404 433 517 534 548
Jodhpur 398 309 344 646 689 719 767 779 768 785
Karauli 183 182 191 250 255 258 280 219 242 273
Kota 88 88 77 140 146 151 161 203 210 226
Nagaur 292 282 330 403 424 432 465 556 561 569
Pali 249 246 256 342 358 365 394 587 557 614
Pratapgarh 0 0 0 0 0 0 0 0 0 0
Rajsamand 117 92 101 222 231 240 257 236 252 263
Sawai Madhopur 172 161 192 228 235 237 256 294 294 320
Sikar 271 333 345 580 598 617 664 772 739 715
Sirohi 100 109 123 171 180 183 198 206 212 205
Tonk 173 170 153 171 178 181 196 329 325 304
Udaipur 231 245 241 391 410 429 459 379 420 430
Source: Integrated Sample Survey reports (2001-02 to 2013-14), Department of Animal Husbandry, Govt. of rajasthan.

66National Dairy Development Board
Part IV : Milk ProductionDairying in rajasthan - A Statistical Profile 2016

67 National Dairy Development Board
Part IV : Milk ProductionDairying in rajasthan - A Statistical Profile 2016
IV.3. Production Performance: Milk ProductionTable IV.3.2: Year & District-wise bovine Milk Production
Districtsbovine Milk Production (‘000 MT)
2001-02 2003-04 2004-05 2007-08 2008-09 2009-10 2010-11 2011-12 2012-13 2013-14
RaJaSTHaN 6,808 7,033 7,213 9,855 10,361 10,882 11,644 11,842 12,238 12,793
Ajmer 277 265 350 392 418 442 471 503 526 588
Alwar 510 525 583 793 807 821 889 913 937 1,015
Banswara 108 137 141 167 176 183 196 211 220 263
Baran 84 290 279 199 204 209 226 210 222 225
Barmer 158 207 207 246 268 284 301 489 469 454
Bharatpur 296 367 340 418 427 435 471 288 321 328
Bhilwara 261 226 222 340 362 395 418 435 434 433
Bikaner 334 342 350 485 538 584 615 353 410 420
Bundi 106 131 109 211 222 231 248 384 371 365
Chittaurgarh 164 164 160 280 295 311 333 288 310 415
Churu 163 161 157 236 254 267 284 264 284 278
Dausa 216 86 79 216 224 230 248 375 376 384
Dhaulpur 126 140 157 194 197 200 217 185 188 176
Dungarpur 61 81 70 141 149 154 165 191 188 217
Ganganagar 353 351 311 490 526 564 599 485 526 519
Hanumangarh 325 297 298 359 382 401 428 358 390 399
Jaipur 663 675 616 884 918 973 1,041 870 956 1,009
Jaisalmer 56 56 56 97 112 121 127 143 148 148
Jalor 216 272 306 293 308 318 342 283 307 331
Jhalawar 99 111 117 163 171 177 190 260 264 278
Jhunjhunun 213 242 261 316 324 345 369 450 464 478
Jodhpur 285 237 276 454 491 537 567 665 642 669
Karauli 172 171 176 231 235 240 260 187 208 236
Kota 81 81 67 122 128 134 143 187 192 206
Nagaur 259 229 275 326 345 359 385 429 431 447
Pali 247 212 219 295 310 321 345 519 495 544
Pratapgarh
Rajsamand 109 85 91 208 216 226 242 204 220 232
Sawai Madhopur 155 146 171 204 210 214 231 269 267 293
Sikar 249 275 304 464 478 507 543 655 629 628
Sirohi 88 90 102 134 142 148 159 170 174 167
Tonk 156 151 138 144 151 156 168 292 289 267
Udaipur 218 230 225 356 373 395 422 329 367 371
Source: Integrated Sample Survey reports (2001-02 to 2013-14), Department of Animal Husbandry, Govt. of rajasthan.

68National Dairy Development Board
Part IV : Milk ProductionDairying in rajasthan - A Statistical Profile 2016
District-wise bovine Milk Production

69 National Dairy Development Board
Part IV : Milk ProductionDairying in rajasthan - A Statistical Profile 2016
IV.3. Production Performance: Milk ProductionTable IV.3.3: Year & District-wise Indigenous Cattle Milk Production
DistrictsIndigenous Cattle Milk Production (‘000 MT)
2001-02 2003-04 2004-05 2007-08 2008-09 2009-10 2010-11 2011-12 2012-13 2013-14
RaJaSTHaN 2,324 2,134 2,148 3,161 3,625 3,927 4,120 3,822 4,085 4,172
Ajmer 106 100 132 167 191 207 218 172 189 212
Alwar 56 61 69 79 90 98 103 96 103 108
Banswara 31 35 41 62 71 77 81 61 69 82
Baran 34 27 54 32 37 40 42 80 87 92
Barmer 120 147 161 154 176 191 200 390 360 345
Bharatpur 25 30 26 50 58 62 65 44 54 57
Bhilwara 142 109 81 133 153 165 174 161 167 176
Bikaner 284 281 278 357 409 443 465 237 283 270
Bundi 29 34 22 72 83 90 94 113 106 130
Chittaurgarh 43 48 43 94 108 117 123 90 111 130
Churu 83 78 70 121 139 150 158 112 126 111
Dausa 30 25 30 47 54 58 61 35 51 45
Dhaulpur 13 11 13 19 22 24 25 32 30 35
Dungarpur 19 21 17 49 56 60 63 77 72 81
Ganganagar 180 177 136 230 264 286 300 223 246 242
Hanumangarh 124 118 76 154 177 192 201 141 160 150
Jaipur 140 116 129 191 220 238 250 125 158 159
Jaisalmer 56 48 48 97 111 120 126 141 146 146
Jalor 52 66 72 96 110 119 124 97 117 111
Jhalawar 30 29 30 55 63 68 71 83 85 83
Jhunjhunun 40 35 34 39 45 49 51 46 50 66
Jodhpur 180 139 145 231 265 287 301 283 302 306
Karauli 23 20 24 29 33 36 37 33 36 36
Kota 29 21 23 39 44 48 51 55 58 63
Nagaur 104 76 93 122 140 152 159 172 166 171
Pali 79 48 50 96 110 119 125 262 239 272
Pratapgarh
Rajsamand 31 23 28 36 41 45 47 43 51 53
Sawai Madhopur 30 23 29 35 40 43 45 50 54 57
Sikar 56 51 43 74 85 92 96 114 110 124
Sirohi 29 30 34 57 65 70 74 62 67 63
Tonk 51 33 34 45 52 56 59 102 103 85
Udaipur 75 74 83 100 114 124 130 90 117 101
Source: Integrated Sample Survey reports (2001-02 to 2013-14), Department of Animal Husbandry, Govt. of rajasthan.

70National Dairy Development Board
Part IV : Milk ProductionDairying in rajasthan - A Statistical Profile 2016
District-wise Indigenous Cattle Milk Production

71 National Dairy Development Board
Part IV : Milk ProductionDairying in rajasthan - A Statistical Profile 2016
IV.3. Production Performance: Milk ProductionTable IV.3.4: Year & District-wise Crossbred Cattle Milk Production
DistrictsCrossbred Cattle Milk Production (‘000 MT)
2006-07 2007-08 2008-09 2009-10 2010-11 2011-12 2012-13 2013-14
RaJaSTHaN 606 681 703 882 913 867 914 938
Ajmer 22 26 27 34 35 30 31 34
Alwar 5 6 6 8 8 14 14 15
Banswara 1 1 1 2 2 5 5 5
Baran 1 2 2 2 2 2 2 2
Barmer 0 0 0 0 0 0 0 0
Bharatpur 2 2 2 3 3 16 17 18
Bhilwara 64 72 74 93 96 64 68 68
Bikaner 36 40 42 52 54 39 46 49
Bundi 3 3 3 4 4 4 4 5
Chittaurgarh 22 24 25 31 33 31 36 37
Churu 0 0 0 0 0 12 14 15
Dausa 1 1 1 1 1 15 17 18
Dhaulpur 0 0 0 0 0 1 1 1
Dungarpur 1 1 1 2 2 1 1 1
Ganganagar 50 56 58 73 75 122 128 128
Hanumangarh 9 10 10 13 13 46 49 48
Jaipur 112 125 129 162 167 138 141 144
Jaisalmer 0 0 0 0 0 0 1 1
Jalor 0 0 0 0 0 1 1 1
Jhalawar 0 0 0 0 0 1 1 1
Jhunjhunun 52 59 60 76 79 106 111 113
Jodhpur 80 89 92 115 119 49 52 50
Karauli 1 1 1 2 2 3 3 3
Kota 4 4 5 6 6 4 4 4
Nagaur 6 6 7 8 8 15 16 16
Pali 3 3 3 4 4 5 5 6
Pratapgadh
Rajsamand 19 21 22 28 29 21 23 25
Sawai Madhopur 1 1 1 1 1 1 2 2
Sikar 69 77 80 100 103 98 102 104
Sirohi 1 1 1 1 1 1 1 1
Tonk 1 1 1 2 2 5 5 5
Udaipur 40 45 47 59 61 16 18 20
Zero denotes either nil or negligible.
Source: Integrated Sample Survey reports (2006-07 to 2013-14), Department of Animal Husbandry, Govt. of rajasthan.

72National Dairy Development Board
Part IV : Milk ProductionDairying in rajasthan - A Statistical Profile 2016
District-wise Crossbred Cattle Milk Production

73 National Dairy Development Board
Part IV : Milk ProductionDairying in rajasthan - A Statistical Profile 2016
IV.3. Production Performance: Milk ProductionTable IV.3.5: Year & District-wise buffalo Milk Production
Districtsbuffalo Milk Production (‘000 MT)
2001-02 2003-04 2004-05 2007-08 2008-09 2009-10 2010-11 2011-12 2012-13 2013-14
RaJaSTHaN 4,484 4,899 5,065 6,012 6,033 6,074 6,611 7,153 7,240 7,682
Ajmer 171 165 218 198 199 200 218 301 307 341
Alwar 454 464 514 708 711 716 779 802 820 891
Banswara 77 102 100 103 103 104 113 145 146 176
Baran 50 263 225 165 166 167 181 129 134 132
Barmer 38 60 46 91 92 92 101 98 108 108
Bharatpur 271 337 314 366 367 370 402 227 250 254
Bhilwara 119 117 141 135 136 137 149 210 200 189
Bikaner 50 61 72 87 88 88 96 77 80 101
Bundi 77 97 87 135 136 137 149 267 260 229
Chittaurgarh 121 116 117 161 162 163 177 167 164 248
Churu 80 83 87 115 116 116 127 139 144 152
Dausa 186 61 49 168 169 170 185 325 308 321
Dhaulpur 113 129 144 175 175 176 192 152 157 140
Dungarpur 42 60 53 91 92 92 100 113 115 134
Ganganagar 173 174 175 203 203 205 223 140 152 149
Hanumangarh 201 179 222 195 195 197 214 171 181 201
Jaipur 523 559 487 568 570 574 624 606 657 705
Jaisalmer 0.3 8 8 1 1 1 1 2 2 2
Jalor 164 206 234 197 198 199 217 185 190 219
Jhalawar 69 82 87 108 108 109 119 176 179 194
Jhunjhunun 173 207 227 218 218 220 239 297 303 299
Jodhpur 105 98 131 134 134 135 147 332 289 313
Karauli 149 151 152 201 201 203 221 151 170 197
Kota 52 60 44 79 79 80 87 128 130 139
Nagaur 155 153 182 197 198 199 217 242 249 260
Pali 168 164 169 196 197 198 216 252 250 266
Pratapgarh
Rajsamand 78 62 63 152 152 153 167 140 147 153
Sawai Madhopur 125 123 142 168 169 170 185 218 212 234
Sikar 193 224 261 312 313 315 343 443 418 401
Sirohi 59 60 68 76 77 77 84 107 106 103
Tonk 105 118 104 97 98 98 107 185 181 176
Udaipur 143 156 142 211 211 213 232 223 232 250
Source: Integrated Sample Survey reports (2001-02 to 2013-14), Department of Animal Husbandry, Govt. of rajasthan.

74National Dairy Development Board
Part IV : Milk ProductionDairying in rajasthan - A Statistical Profile 2016
District-wise buffalo Milk Production

75 National Dairy Development Board
Part IV : Milk ProductionDairying in rajasthan - A Statistical Profile 2016
Rajasthan’s Milk Production (MMT) (Change due to no. of in-milk animals and average yield)
9.859.859.859.859.85
0.56
-0.06
0.011.01 1.38 1.66
2.03
0.41 0.33 0.90
9.85
9.8510.36
10.8811.64
11.8412.78
bovine
2007-08 2008-09 2009-10 2010-11 2011-12 2013-14
Milk production in base year -2007-2008 - MMT Total milk production - MMT Change in total milk production due to change in average yield - kg/in-milk animal per day - MMT Change in total milk production due to change in numbers of in milk animals - MMT
6.016.016.016.016.01
-0.21 -0.30 -0.02
0.36 0.621.14 1.36
0.31
6.01
6.016.03 6.07 6.61
7.15 7.68
2007-08 2008-09 2009-10 2010-11 2011-12 2013-14
buffalo
0.24 0.01

76National Dairy Development Board
Part IV : Milk ProductionDairying in rajasthan - A Statistical Profile 2016

77 National Dairy Development Board
Part IV : Milk ProductionDairying in rajasthan - A Statistical Profile 2016
Rajasthan’s Milk Production (MMT) (Change due to no. of in-milk animals & average yield)
Milk production in base year -2007-2008 - MMT Total milk production - MMT Change in total milk production due to change in average yield - kg/in-milk animal per day - MMT Change in total milk production due to change in numbers of in milk animals - MMT
0.04
-0.02
0.10 0.15 0.160.101.10 0.08 0.100.08
0.680.70
0.88 0.91 0.940.87
Crossbred Cattle
2007-08 2008-09 2009-10 2010-11 2011-12 2013-14
3.163.163.163.163.16
0.380.62 0.70
0.470.60
3.16
3.16
3.633.93
4.123.82
4.16
2007-08 2008-09 2009-10 2010-11 2011-12 2013-14
Indigenous Cattle
0.08 0.17 0.26 0.20 0.40
0.680.680.680.680.680.68

78National Dairy Development Board
Part IV : Milk ProductionDairying in rajasthan - A Statistical Profile 2016

79 National Dairy Development Board
Part IV : Milk ProductionDairying in rajasthan - A Statistical Profile 2016
IV.3. Production Performance: Milk ProductionTable IV.3.6: Year & District-wise Goat Milk Production
DistrictsGoat Milk Production (‘000 MT)
2001-02 2003-04 2004-05 2007-08 2008-09 2009-10 2010-11 2011-12 2012-13 2013-14
RaJaSTHaN 789 864 909 1,523 1,572 1,448 1,590 1,670 1,703 1,781
Ajmer 50 49 62 68 70 64 71 90 87 91
Alwar 32 20 27 34 36 33 36 77 74 101
Banswara 5 6 5 9 10 9 10 19 21 33
Baran 4 18 11 13 13 12 13 18 18 20
Barmer 92 60 101 170 175 161 177 135 146 142
Bharatpur 14 10 17 12 13 12 13 12 14 17
Bhilwara 29 25 36 38 39 36 39 54 52 54
Bikaner 21 29 28 45 46 42 47 66 63 67
Bundi 7 13 11 24 25 23 25 27 26 23
Chittaurgarh 17 17 19 35 37 34 37 38 37 40
Churu 30 59 47 103 106 98 107 63 76 80
Dausa 11 6 6 24 25 23 25 35 36 41
Dhaulpur 9 7 5 8 9 8 9 10 10 12
Dungarpur 6 6 12 14 15 14 15 23 22 31
Ganganagar 21 23 23 28 29 26 29 28 28 30
Hanumangarh 10 13 17 18 19 17 19 25 25 27
Jaipur 50 74 59 102 106 97 107 71 80 75
Jaisalmer 42 25 30 45 47 43 47 88 88 107
Jalor 26 30 24 43 44 41 45 40 42 40
Jhalawar 10 12 12 23 24 22 24 31 31 35
Jhunjhunun 48 52 48 62 64 59 64 67 70 70
Jodhpur 113 72 68 192 198 182 200 114 126 116
Karauli 11 11 15 19 20 18 20 32 34 37
Kota 7 7 10 18 18 17 18 16 18 20
Nagaur 33 53 55 77 79 73 80 127 130 122
Pali 2 34 37 47 48 44 49 68 62 70
Pratapgarh
Rajsamand 8 7 10 14 15 14 15 32 32 31
Sawai Madhopur 17 15 21 24 25 23 25 25 27 27
Sikar 22 58 41 116 120 110 121 117 110 87
Sirohi 12 19 21 37 38 35 39 36 38 38
Tonk 17 19 15 27 27 25 28 37 36 37
Udaipur 13 15 16 35 37 34 37 50 53 59
Source: Integrated Sample Survey reports (2001-02 to 2013-14), Department of Animal Husbandry, Govt. of rajasthan.

80National Dairy Development Board
Part IV : Milk ProductionDairying in rajasthan - A Statistical Profile 2016

81 National Dairy Development Board
Part IV : Milk ProductionDairying in rajasthan - A Statistical Profile 2016
IV.3. Production Performance: Milk ProductionTable IV.3.7: Year & District-wise Total Milk Production Density
DistrictsMilk Production Density (kg/day/sq km)
2001-02 2003-04 2004-05 2007-08 2008-09 2009-10 2010-11 2011-12 2012-13 2013-14
RaJaSTHaN 61 63 65 91 96 99 106 108 112 117
Ajmer 106 101 133 148 157 163 175 192 198 219
Alwar 177 178 199 270 276 279 303 324 331 365
Banswara 52 65 67 80 85 88 94 105 110 135
Baran 35 121 114 83 85 87 93 89 94 96
Barmer 24 26 30 40 43 43 46 60 59 58
Bharatpur 168 204 193 233 238 242 262 162 181 187
Bhilwara 76 66 68 99 105 113 120 128 127 128
Bikaner 32 34 34 48 53 57 60 38 43 44
Bundi 54 68 57 111 117 120 129 195 188 184
Chittaurgarh 53 53 53 93 98 102 109 96 102 134
Churu 38 44 40 67 71 72 77 65 71 71
Dausa 181 73 68 192 199 202 218 327 329 339
Dhaulpur 122 133 146 182 186 188 204 176 179 170
Dungarpur 48 63 60 113 119 122 131 156 153 180
Ganganagar 93 93 83 129 138 147 157 128 138 137
Hanumangarh 95 88 89 107 114 119 127 109 118 121
Jaipur 175 184 166 243 252 263 282 231 255 266
Jaisalmer 7 6 6 10 11 12 12 16 17 18
Jalor 62 78 85 87 91 93 100 83 90 96
Jhalawar 48 54 57 82 86 88 94 128 130 138
Jhunjhunun 121 136 143 175 179 187 200 239 247 253
Jodhpur 48 37 41 77 83 86 92 93 92 94
Karauli 91 90 95 124 127 128 139 109 120 135
Kota 46 46 40 74 77 79 85 107 110 119
Nagaur 45 44 51 62 66 67 72 86 87 88
Pali 55 54 57 76 79 81 87 130 123 136
Pratapgarh
Rajsamand 69 54 59 131 136 141 152 139 148 155
Sawai Madhopur 105 98 117 139 143 145 156 179 179 195
Sikar 96 118 122 205 212 219 235 274 262 253
Sirohi 53 58 66 91 96 98 105 110 113 109
Tonk 66 65 58 65 68 69 75 125 124 116
Udaipur 48 51 50 81 85 89 95 79 87 89
Source: estimated from Integrated Sample Survey reports (2001-02 to 2013-14), Department of Animal Husbandry, Govt. of rajasthan.

82National Dairy Development Board
Part IV : Milk ProductionDairying in rajasthan - A Statistical Profile 2016
District-wise Milk Production Density

83 National Dairy Development Board
Part IV : Milk ProductionDairying in rajasthan - A Statistical Profile 2016
IV.4. Production Performance: Milk AvailabilityTable IV.4.1: Year & District-wise Per Capita Milk availability
DistrictsPer Capita availability of Milk (grams/day)
2001-02 2003-04 2004-05 2007-08 2008-09 2009-10 2010-11 2011-12 2012-13 2013-14
RaJaSTHaN 368 368 372 491 505 512 539 540 546 560
Ajmer 411 381 492 521 544 555 585 629 640 696
Alwar 497 479 525 669 669 664 704 738 739 799
Banswara 206 244 241 263 270 270 280 301 306 364
Baran 237 797 737 510 513 513 544 511 529 530
Barmer 349 352 395 489 508 495 518 656 629 593
Bharatpur 404 473 439 500 501 499 530 323 353 357
Bhilwara 394 329 333 462 481 508 529 556 543 534
Bikaner 581 567 558 705 751 777 794 486 529 527
Bundi 322 398 327 614 636 644 682 1,013 964 929
Chittaurgarh 275 274 271 473 498 518 553 487 518 678
Churu 275 310 285 466 492 495 528 439 481 476
Dausa 472 183 166 439 445 442 467 688 675 683
Dhaulpur 375 393 425 498 498 493 524 443 440 410
Dungarpur 165 206 189 335 345 347 364 422 405 467
Ganganagar 573 562 497 748 794 837 882 714 763 749
Hanumangarh 605 542 542 619 649 666 701 591 630 638
Jaipur 372 373 328 448 454 464 486 389 419 428
Jaisalmer 530 413 427 651 705 708 731 945 939 988
Jalor 458 545 582 553 565 564 593 484 511 530
Jhalawar 253 276 284 388 400 401 424 564 564 586
Jhunjhunun 374 412 428 506 514 529 561 662 677 688
Jodhpur 377 279 303 530 551 561 584 579 557 556
Karauli 415 397 409 505 508 503 535 412 447 494
Kota 154 147 126 215 219 221 231 285 288 304
Nagaur 288 269 309 358 370 371 392 461 456 455
Pali 375 362 373 481 498 502 535 789 740 807
Pratapgarh
Rajsamand 325 247 267 561 573 586 619 558 588 603
Sawai Madhopur 421 381 446 502 508 504 535 604 593 633
Sikar 324 386 394 632 641 652 691 790 744 709
Sirohi 322 337 373 488 506 504 533 544 551 521
Tonk 392 372 330 351 360 361 383 634 616 567
Udaipur 240 243 233 351 360 368 384 310 335 334
Source: estimated from Integrated Sample Survey reports (2001-02 to 2013-14), Department of Animal Husbandry, Govt. of rajasthan.

84National Dairy Development Board
Part IV : Milk ProductionDairying in rajasthan - A Statistical Profile 2016
District-wise Per Capita Milk availability

Part V : Veterinary Infrastructure And Service Delivery System
Under rain-fed agriculture, dairying is most reliable livelihood insurance for the poor in rural areas of Rajasthan. The government manage a network of institutions for health care and service delivery which includes a Biological Product Lab (B.P.) at Jaipur, a State Disease Diagnostic Centre (SDDC) at Jaipur, six Regional Disease Diagnostic Centres (RDDC), 34 District Disease Diagnostic Lab, 1,718 Veterinary Hospitals (VH), 198 Veterinary Dispensaries (VD) and a series of Sub-centres. In addition to a Rajasthan State Livestock Management Institute (RSLMTI), Bassi, it has Livestock Assistant Training Institute for strengthening the quality of manpower involved in providing services.
The efforts of the State Government are supported by Rajasthan University of Veterinary and Animal Science (RAJUVAS), Bikaner which has three constituent colleges at Bikaner, Udaipur and Jaipur. In addition, it has six private veterinary colleges affiliated to RAJUVAS under Public Private Partnership (PPP). It has 7 Livestock Research Stations and 65 institutions to produce 3,000 para-vet per annum.

86National Dairy Development Board
Part V : Veterinary Infrastructure And Service Delivery System
Dairying in rajasthan - A Statistical Profile 2016
V.1. Veterinary Infrastructure TABLE V.1.1: Year & District-wise Veterinary Institutes
DistrictsNumber of Veterinary Institutes
1994-95 1997-98 2003-04 2007-08 2009-10 2010-11 2011-12 2012-13 2013-14 2014-15
RAjAsThAN 2,175 2,470 3,437 3,561 3,595 3,698 3,900 4,303 4,696 4,696
Ajmer 61 63 94 100 100 104 116 133 147 147
Alwar 122 119 164 175 175 178 186 208 237 237
Banswara 56 70 117 105 105 110 113 117 120 120
Baran 23 33 62 67 67 68 72 78 84 84
Barmer 42 72 100 105 105 110 119 138 158 158
Bharatpur 71 82 140 149 149 150 154 170 180 180
Bhilwara 142 146 179 173 176 178 183 194 205 205
Bikaner 61 62 69 110 110 114 121 134 148 148
Bundi 42 45 60 64 67 67 69 71 79 79
Chittaurgarh 100 107 148 116 115 119 123 131 138 138
Churu 64 73 93 87 88 92 97 110 125 125
Dausa 63 57 69 73 75 78 83 94 102 102
Dhaulpur 20 31 38 48 49 49 50 54 58 58
Dungarpur 71 74 132 133 136 140 142 146 151 151
Ganganagar 143 165 143 128 115 118 123 135 141 141
Hanumangarh 0 0 74 76 90 95 102 119 133 133
Jaipur 152 163 219 230 231 239 253 284 318 318
Jaisalmer 27 39 50 50 48 49 52 57 60 60
Jalor 35 60 82 87 87 90 91 95 106 106
Jhalawar 39 41 69 71 71 73 73 78 78 78
Jhunjhunun 59 93 137 143 147 154 168 198 219 219
Jodhpur 102 96 135 137 138 140 144 160 174 174
Karauli 0 0 59 60 61 62 67 73 78 78
Kota 48 45 61 60 60 61 64 70 76 76
Nagaur 68 100 150 160 161 170 196 235 277 277
Pali 61 82 115 119 120 121 126 135 143 143
Pratapgarh 63 64 65 66 72 75 75
Rajsamand 76 77 103 104 103 103 108 112 115 115
Sawai Madhopur 78 79 54 54 54 59 65 76 84 84
Sikar 119 132 160 163 167 173 191 219 244 244
Sirohi 73 64 83 75 75 75 77 79 82 82
Tonk 32 39 59 76 80 83 90 98 114 114
Udaipur 125 161 219 200 206 211 216 230 247 247
Source: Administrative reports, Directorate of Animal Husbandry, Govt. of rajasthan

87 National Dairy Development Board
Part V : Veterinary Infrastructure And Service Delivery System
Dairying in rajasthan - A Statistical Profile 2016
V.1. Veterinary Infrastructure TABLE V.1.2: Union-wise AI Centres – Cooperatives
Milk UnionsNumber of AI Centres
2006-07 2007-08 2008-09 2009-10 2010-11 2011-12 2012-13 2013-14 2014-15RAjAsThAN 532 528 543 543 525 514 394 373 375
Ajmer 46 46 48 48 51 59 59 53 53
Alwar 92 92 85 85 87 85 80 73 73
Bhilwara 65 65 86 44 47 49 0 0 0
Chittorgarh 0 0 34 31 26 0 0 0
Gangangar 51 51 51 44 36 31 30 28 29
Jaipur 149 149 165 185 185 185 189 189 187
Jodhpur 48 48 45 46 40 32 32 29 32
Pali 29 29 25 17 15 16 4 1 1
Udaipur 52 48 38 40 33 31 0 0 0
Zero denotes either zero or not reported.
Source: NDDB

88National Dairy Development Board
Part V : Veterinary Infrastructure And Service Delivery System
Dairying in rajasthan - A Statistical Profile 2016
V.1. Veterinary InfrastructureTABLE V.1.3: District-wise AI Centers – BAIF
DistrictsNumber of AI Centres
2008-09 2009-10 2010-11 2011-12 2012-13 2013-14 2014-15 2015-16RAjAsThAN 304 325 365 422 431 411 431 405
Ajmer 41 44 47 47 51 51 50 48
Alwar 20 20 29 37 30 28 28 27
Banswara 15 10 14 26 25 24 26 26
Baran 8 2 14 14 14 14 14 6
Barmer 0 0 0 0 0 0 0 0
Bharatpur 5 5 5 5 5 5 5 5
Bhilwara 39 44 50 56 56 52 51 50
Bikaner 0 0 0 0 0 0 0 0
Bundi 6 7 7 7 7 7 7 8
Chittaurgarh 33 31 35 36 35 35 40 38
Churu 0 0 0 0 0 0 0 0
Dausa 9 9 9 19 19 22 23 26
Dhaulpur 0 0 0 0 0 0 0 0
Dungarpur 5 5 5 6 6 6 6 6
Ganganagar 0 0 0 0 0 0 0 0
Hanumangarh 0 0 0 0 0 0 0 0
Jaipur 12 12 12 12 20 21 21 24
Jaisalmer 0 0 0 0 0 0 0 0
Jalor 0 0 0 0 0 0 0 0
Jhalawar 26 20 22 30 30 16 16 15
Jhunjhunun 0 0 0 0 0 0 0 0
Jodhpur 0 0 0 0 0 0 0 0
Karauli 23 27 27 31 31 31 31 30
Kota 0 0 0 0 0 0 0 0
Nagaur 10 25 5 0 0 0 14 11
Pali 0 0 0 0 0 0 0 0
Pratapgarh 0 0 0 0 0 0 0 0
Rajsamand 8 9 14 14 14 14 14 12
Sawai Madhopur 1 1 1 11 11 11 11 5
Sikar 0 0 0 0 0 0 0 0
Sirohi 3 13 13 15 14 13 14 13
Tonk 9 8 23 23 30 29 29 27
Udaipur 31 33 33 33 33 32 31 28
Source: BAIF Data repository

89 National Dairy Development Board
Part V : Veterinary Infrastructure And Service Delivery System
Dairying in rajasthan - A Statistical Profile 2016
V.2. Service Delivery System - Artificial InseminationTABLE V.2.1: District-wise AI Performed by Government Agencies – Cattle
Districts Number of AI Performed (‘000)
2011-12 2012-13 2013-14 2014-15RAjAsThAN 1,071.6 1,118.9 1,247.5 1,432.5
Ajmer 54.9 59.0 64.6 68.1
Alwar 63.3 68.5 69.7 70.4
Banswara 16.7 19.9 23.4 28.3
Baran 11.8 11.3 17.6 17.7
Barmer 4.5 5.0 6.4 7.9
Bharatpur 48.5 53.8 55.0 78.2
Bhilwara 46.8 52.4 57.6 64.5
Bikaner 40.5 37.3 51.4 48.7
Bundi 14.7 16.7 16.9 18.0
Chittaurgarh 24.2 25.3 23.5 26.8
Churu 29.7 30.0 30.1 35.5
Dausa 31.9 32.9 33.8 36.8
Dhaulpur 15.6 16.9 15.7 24.1
Dungarpur 5.8 7.6 9.2 10.1
Ganganagar 69.7 66.6 69.3 96.4
Hanumangarh 41.3 50.2 40.9 65.1
Jaipur 107.6 137.7 151.4 154.0
Jaisalmer 0.6 1.3 1.9 3.2
Jalor 6.4 5.9 6.3 6.8
Jhalawar 9.8 9.8 14.1 16.3
Jhunjhunun 89.9 31.4 89.9 113.8
Jodhpur 31.9 34.8 50.7 54.1
Karauli 6.8 7.5 8.2 11.7
Kota 11.2 12.5 17.9 17.8
Nagaur 64.8 70.3 79.7 81.4
Pali 12.9 13.6 15.6 16.8
Pratapgarh 15.5 17.3 16.8 18.7
Rajsamand 23.7 27.8 26.6 27.8
Sawai Madhopur 7.2 8.2 9.5 11.0
Sikar 97.7 116.5 103.7 126.9
Sirohi 5.0 5.1 4.7 5.5
Tonk 15.2 18.4 16.1 20.1
Udaipur 45.7 47.3 49.2 50.1
Source: Administrative reports, Directorate of Animal Husbandry, Govt. of rajasthan.

90National Dairy Development Board
Part V : Veterinary Infrastructure And Service Delivery System
Dairying in rajasthan - A Statistical Profile 2016
V.2. Service Delivery System - Artificial InseminationTABLE V.2.2: District-wise AI Performed by Government Agencies – Buffalo
DistrictsNumber of AI Performed (‘000)
2011-12 2012-13 2013-14 2014-15RAjAsThAN 858.7 924.2 1,016.6 1,213.5
Ajmer 23.4 25.1 26.8 27.5
Alwar 85.3 87.9 94.8 110.5
Banswara 32.2 37.3 46.5 51.6
Baran 5.6 5.4 9.6 9.6
Barmer 6.3 6.0 7.8 11.5
Bharatpur 54.2 57.3 58.7 87.0
Bhilwara 22.6 23.2 29.1 38.4
Bikaner 5.5 4.7 8.0 7.1
Bundi 10.5 11.1 14.5 15.6
Chittaurgarh 22.4 26.4 30.6 33.3
Churu 14.6 13.4 14.9 17.9
Dausa 39.0 38.1 40.6 50.1
Dhaulpur 15.1 15.5 16.8 21.7
Dungarpur 22.3 27.3 28.2 31.1
Ganganagar 21.4 20.9 22.6 31.3
Hanumangarh 26.2 30.5 26.0 44.7
Jaipur 95.6 113.0 126.6 150.7
Jaisalmer 0.2 0.4 0.5 1.0
Jalor 20.4 19.3 25.6 24.4
Jhalawar 6.8 7.1 11.2 10.9
Jhunjhunun 45.9 44.3 43.6 53.8
Jodhpur 16.7 20.3 30.1 32.3
Karauli 17.2 20.4 24.5 34.2
Kota 6.1 5.9 12.0 11.0
Nagaur 49.9 52.9 58.3 67.0
Pali 18.1 17.9 19.1 24.0
Pratapgarh 9.3 9.5 9.5 10.6
Rajsamand 17.0 20.1 18.6 23.0
Sawai Madhopur 7.9 10.0 13.5 18.1
Sikar 86.4 96.8 87.8 98.9
Sirohi 5.7 6.3 6.1 6.4
Tonk 11.0 11.8 14.4 17.7
Udaipur 37.7 38.3 39.4 40.4
Source: Administrative reports, Directorate of Animal Husbandry, Govt. of rajasthan.

91 National Dairy Development Board
Part V : Veterinary Infrastructure And Service Delivery System
Dairying in rajasthan - A Statistical Profile 2016
V.2. Service Delivery System - Artificial InseminationTABLE V.2.3: District-wise AI Performed by Government Agencies – Bovine
DistrictsNumber of AI Performed (‘000)
2001-02 2002-03 2008-09 2009-10 2010-11 2011-12 2012-13 2013-14 2014-15
RAjAsThAN 638.2 702.3 1,726.0 1,851.4 1,912.7 1,930.3 2,043.1 2,264.0 2,646.0
Ajmer 31.1 30.4 58.2 62.7 70.3 78.4 84.0 91.5 95.6
Alwar 27.2 30.9 130.3 146.5 145.1 148.6 156.4 164.6 180.9
Banswara 17.0 21.2 38.9 41.7 45.0 48.9 57.1 69.9 80.0
Baran 6.3 6.5 12.1 14.0 12.9 17.4 16.7 27.2 27.3
Barmer 3.7 3.4 8.2 9.9 10.7 10.8 11.1 14.3 19.4
Bharatpur 32.5 35.5 87.0 88.5 97.0 102.7 111.1 113.7 165.2
Bhilwara 36.8 33.3 65.6 66.2 68.0 69.4 75.6 86.7 102.9
Bikaner 16.9 17.4 38.5 42.0 43.2 46.0 42.0 59.4 55.8
Bundi 9.0 9.2 19.5 21.5 22.1 25.2 27.7 31.4 33.6
Chittaurgarh 28.1 34.2 45.6 47.8 51.7 46.6 51.7 54.1 60.1
Churu 12.0 14.4 37.0 40.8 46.7 44.3 43.4 45.0 53.4
Dausa 17.0 15.8 52.9 63.5 67.6 70.9 71.0 74.4 86.9
Dhaulpur 9.3 10.5 24.5 25.6 28.2 30.8 32.4 32.4 45.8
Dungarpur 11.6 15.8 23.0 27.2 29.0 28.0 34.9 37.4 41.2
Ganganagar 35.1 44.5 85.7 88.4 86.2 91.1 87.5 91.9 127.7
Hanumangarh 20.4 23.8 63.7 64.8 67.8 67.4 80.7 67.0 109.9
Jaipur 81.1 75.4 194.5 198.5 206.3 203.2 250.7 278.0 304.7
Jaisalmer 0.7 0.8 0.7 0.9 0.8 0.8 1.7 2.4 4.2
Jalor 7.7 8.6 19.9 21.6 23.4 26.8 25.2 32.0 31.3
Jhalawar 5.9 9.5 17.4 17.9 16.8 16.6 16.9 25.3 27.2
Jhunjhunun 33.4 45.8 12.8 124.9 131.1 135.7 75.7 133.5 167.6
Jodhpur 19.2 22.9 39.5 45.2 46.8 48.6 55.1 80.7 86.4
Karauli 7.1 8.2 20.7 20.2 20.6 24.1 27.9 32.7 45.9
Kota 8.1 8.2 13.3 13.4 13.3 17.3 18.4 29.9 28.8
Nagaur 28.0 33.6 100.5 112.8 113.1 114.7 123.2 138.0 148.4
Pali 13.3 14.1 27.7 30.2 31.8 31.0 31.5 34.8 40.8
Pratapgarh 21.2 24.7 24.4 24.7 26.8 26.3 29.3
Rajsamand 17.3 19.2 38.0 38.1 35.9 40.8 47.9 45.2 50.8
Sawai Madhopur 5.4 8.1 12.3 15.2 14.5 15.1 18.2 23.1 29.1
Sikar 47.7 54.8 204.9 224.4 228.0 184.1 213.3 191.5 225.8
Sirohi 4.9 4.9 9.8 10.2 9.5 10.7 11.4 10.9 11.9
Tonk 8.3 7.9 21.2 24.1 24.8 26.2 30.2 30.4 37.8
Udaipur 35.9 37.4 72.4 77.2 79.7 83.3 85.7 88.6 90.6
Source: Administrative reports, Directorate of Animal Husbandry, Govt. of rajasthan.

92National Dairy Development Board
Part V : Veterinary Infrastructure And Service Delivery System
Dairying in rajasthan - A Statistical Profile 2016
V.2. Service Delivery System - Artificial InseminationTABLE V.2.4: Union-wise AI Performed by Cooperatives – Cattle
UnionNumber of AI Performed (‘000)
2006-07 2007-08 2008-09 2009-10 2010-11 2011-12 2012-13 2013-14 2014-15RAjAsThAN 194.8 196.7 240.7 257.8 280.2 289.3 252.7 185.9 189.6Ajmer 16.5 16.5 21.5 24.9 19.5 27.8 26.6 17.5 12.6Alwar 16.7 16.7 23.7 26.2 29.4 28.4 28.7 26.2 19.9Bhilwara 31.2 31.2 38.1 22.4 25.9 33.5 23.1 0.0 0.0Chittorgarh 13.5 14.9 14.9 7.9 0.0 0.0Ganganagar 22.9 22.9 22.0 26.5 27.0 28.7 22.5 20.5 20.2Jaipur 79.2 79.2 117.8 107.0 130.4 121.7 111.7 98.6 111.9Jodhpur 18.6 18.6 33.5 17.5 15.4 16.2 21.2 23.0 25.0Pali 2.3 2.3 5.4 4.7 4.3 4.4 2.8 0.0 0.0Udaipur 7.5 9.4 11.7 15.0 13.3 13.7 8.0 0.0 0.0
Zero denotes either zero or not reported.Source: NDDB
TABLE V.2.5: Union-wise AI Performed by Cooperatives – Buffalo
UnionNumber of AI Performed (‘000)
2006-07 2007-08 2008-09 2009-10 2010-11 2011-12 2012-13 2013-14 2014-15RAjAsThAN 94.5 94.8 142.5 156.9 206.5 175.8 145.1 115.1 131.8Ajmer 3.3 3.3 3.6 5.0 5.8 5.8 7.5 6.1 4.4Alwar 17.3 17.3 32.0 33.1 32.9 29.9 25.4 27.3 28.9Bhilwara 11.3 11.3 19.8 10.6 18.4 15.3 7.6 0.0 0.0Chittorgarh 11.7 13.7 11.5 4.7 0.0 0.0Ganganagar 8.5 8.5 8.7 10.7 12.8 9.5 8.9 7.9 7.7Jaipur 37.1 37.1 71.1 59.6 86.0 76.6 69.6 61.4 76.5Jodhpur 6.3 6.3 17.6 7.8 16.0 8.4 12.1 12.4 14.3Pali 3.3 3.3 5.9 5.5 6.8 6.2 3.3 0.0 0.0Udaipur 7.3 7.6 10.2 13.0 14.1 12.6 5.9 0.0 0.0
Zero denotes either zero or not reported.Source: NDDB
TABLE V.2.6: Union-wise AI Performed by Cooperatives – Bovine
UnionNumber of AI Performed (‘000)
2006-07 2007-08 2008-09 2009-10 2010-11 2011-12 2012-13 2013-14 2014-15RAjAsThAN 289.3 291.5 383.2 414.7 486.7 465.1 397.8 301 321.4Ajmer 19.8 19.8 25.1 29.9 25.3 33.6 34.1 23.6 17Alwar 34 34 55.7 59.3 62.3 58.3 54.1 53.5 48.8Bhilwara 42.5 42.5 57.9 33 44.3 48.8 30.7 0 0Chittorgarh 25.2 28.6 26.4 12.6 0 0Ganganagar 31.4 31.4 30.7 37.2 39.8 38.2 31.4 28.4 27.9Jaipur 116.3 116.3 188.9 166.6 216.4 198.3 181.3 160 188.4Jodhpur 24.9 24.9 51.1 25.3 31.4 24.6 33.3 35.4 39.3Pali 5.6 5.6 11.3 10.2 11.1 10.6 6.1 0 0Udaipur 14.8 17 21.9 28 27.4 26.3 13.9 0 0
Zero denotes either zero or not reported.Source: NDDB

93 National Dairy Development Board
Part V : Veterinary Infrastructure And Service Delivery System
Dairying in rajasthan - A Statistical Profile 2016
V.2. Service Delivery System - Artificial InseminationTABLE V.2.7: District-wise AI Performed By BAIF – Cattle
DistrictsNumber of AI Performed (‘000)
2008-09 2009-10 2010-11 2011-12 2012-13 2013-14 2014-15 2015-16RAjAsThAN 120.8 131.4 176.9 208.5 231.3 230.9 254.7 247.8
Ajmer 15.4 22.2 33.7 38.1 39.8 42.6 44 39.1
Alwar 7.3 8.9 11.2 14 15.8 14.5 16.8 17.7
Banswara 1.5 2 2.5 4.5 6.7 6.9 7.4 8.8
Baran 1 0.1 0.3 1.7 2.1 2.2 2.2 1.5
Barmer 0 0 0 0 0 0 0 0
Bharatpur 2.2 2.2 2.7 3.3 3.4 3.4 4.5 4.6
Bhilwara 33.2 37.2 47.9 54.6 57.8 50.9 52.5 48.5
Bikaner 0 0 0 0 0 0 0 0
Bundi 4.2 1 3.1 5.1 5.9 5.2 5.9 5.6
Chittaurgarh 21.4 19.9 23.9 24.9 26.6 27 29.1 25.9
Churu 0 0 0 0 0 0 0 0
Dausa 2.6 4 4.7 8.5 9.5 10.3 13.2 16
Dhaulpur 0 0 0 0 0 0 0 0
Dungarpur 0.6 0.6 0.7 0.6 1.7 0.9 0.8 1.2
Ganganagar 0 0 0 0 0 0 0 0
Hanumangarh 0 0 0 0 0 0 0 0
Jaipur 2.9 4.6 8.1 8.9 10 13.8 13.9 16.6
Jaisalmer 0 0 0 0 0 0 0 0
Jalor 0 0 0 0 0 0 0 0
Jhalawar 2.3 1.6 3.8 5 6.4 4.7 4.6 5.2
Jhunjhunun 0 0 0 0 0 0 0 0
Jodhpur 0 0 0 0 0 0 0 0
Karauli 3.9 5 6.1 7 8.4 8.4 10.2 10.1
Kota 0 0 0 0 0 0 0 0
Nagaur 3.3 4.4 2.5 0.4 0 0 6.9 6.6
Pali 0 0 0 0 0 0 0 0
Pratapgarh 0 0 0 0 0 0 0 0
Rajsamand 4.5 3.3 5.3 6.6 6.5 6.9 6.2 6.5
Sawai Madhopur 0.2 0.3 0.3 0.6 1.8 1.9 2.4 2.1
Sikar 0 0 0 0 0 0 0 0
Sirohi 0.9 1.7 2.5 3.1 4.4 5.3 5.7 5.6
Tonk 3.7 2.3 6.3 9 10.6 11.9 13.7 12.1
Udaipur 9.6 10 11.2 12.6 13.9 14.2 14.6 13.9
Source: BAIF Data repository.

94National Dairy Development Board
Part V : Veterinary Infrastructure And Service Delivery System
Dairying in rajasthan - A Statistical Profile 2016
V.2. Service Delivery System - Artificial InseminationTABLE V.2.8: District-wise AI Performed By BAIF – Buffalo
DistrictsNumber of AI Performed (‘000)
2008-09 2009-10 2010-11 2011-12 2012-13 2013-14 2014-15 2015-16RAjAsThAN 101.4 112.6 173.6 206.2 243.1 261.0 312.9 334.8
Ajmer 5.3 7.4 13 13.9 14.2 16.8 18.8 23.2
Alwar 11.4 13.5 19.5 23.8 24.1 26.7 31.2 33.6
Banswara 3.9 4.6 10 13.9 19.9 19.4 21.4 21.4
Baran 0.8 0 0.4 1.3 1.6 1.8 2 1.8
Barmer 0 0 0 0 0 0 0 0
Bharatpur 3 2.8 3.4 3.9 4.3 4.8 6.2 5.6
Bhilwara 13.3 16.7 26.2 27.8 31.3 31 32.8 37
Bikaner 0 0 0 0 0 0 0 0
Bundi 7 0.3 4.7 6 7.2 7.1 8.7 9.5
Chittaurgarh 16.4 16.2 25.4 28.9 31.4 36.2 43.5 40
Churu 0 0 0 0 0 0 0 0
Dausa 3.5 5.6 6.6 13.2 14.4 17 24 28.7
Dhaulpur 0 0 0 0 0 0 0 0
Dungarpur 2.5 2.9 4 3.7 7.5 4 4.2 3.6
Ganganagar 0 0 0 0 0 0 0 0
Hanumangarh 0 0 0 0 0 0 0 0
Jaipur 2.8 4.6 7.9 8.8 13.1 15.6 18.1 25.2
Jaisalmer 0 0 0 0 0 0 0 0
Jalor 0 0 0 0 0 0 0 0
Jhalawar 2.2 1.6 2.9 4.1 5.2 3.7 3.9 4.6
Jhunjhunun 0 0 0 0 0 0 0 0
Jodhpur 0 0 0 0 0 0 0 0
Karauli 9.9 13.8 17.5 22.3 26.2 27.5 33.8 35.4
Kota 0 0 0 0 0 0 0 0
Nagaur 3.7 5.9 3.2 0.3 0 0 9.5 9.6
Pali 0 0 0 0 0 0 0 0
Pratapgarh 0 0 0 0 0 0 0 0
Rajsamand 2.5 2.2 5.1 6.6 7.8 8 7.9 8.7
Sawai Madhopur 0.2 0.2 0.4 0.7 2.1 2.4 3.6 3
Sikar 0 0 0 0 0 0 0 0
Sirohi 0.9 2.9 5.7 5.8 7.4 9.4 10.1 9.8
Tonk 3.2 2.1 6 7.4 9.8 12.2 15.5 17.5
Udaipur 8.9 9.5 11.9 13.9 15.8 17.5 17.9 16.7
Source: BAIF Data repository.

95 National Dairy Development Board
Part V : Veterinary Infrastructure And Service Delivery System
Dairying in rajasthan - A Statistical Profile 2016
V.2. Service Delivery System - Artificial InseminationTABLE V.2.9: District-wise AI Performed By BAIF – Bovine
DistrictsNumber of AI Performed (‘000)
2008-09 2009-10 2010-11 2011-12 2012-13 2013-14 2014-15 2015-16RAjAsThAN 222.2 244.0 350.5 414.6 474.5 491.9 567.6 582.6
Ajmer 20.8 29.5 46.7 52 54 59.4 62.8 62.3
Alwar 18.8 22.4 30.8 37.9 39.9 41.2 48 51.3
Banswara 5.5 6.6 12.5 18.4 26.6 26.2 28.8 30.1
Baran 1.8 0.1 0.6 3 3.8 4 4.2 3.3
Barmer 0 0 0 0 0 0 0 0
Bharatpur 5.1 5 6 7.2 7.7 8.2 10.7 10.2
Bhilwara 46.5 53.9 74.1 82.5 89.1 81.9 85.2 85.6
Bikaner 0 0 0 0 0 0 0 0
Bundi 11.2 1.3 7.8 11 13.1 12.2 14.5 15.1
Chittaurgarh 37.8 36.1 49.3 53.8 57.9 63.1 72.6 65.9
Churu 0 0 0 0 0 0 0 0
Dausa 6.1 9.6 11.3 21.7 23.9 27.3 37.2 44.7
Dhaulpur 0 0 0 0 0 0 0 0
Dungarpur 3.2 3.5 4.6 4.3 9.3 4.9 5 4.9
Ganganagar 0 0 0 0 0 0 0 0
Hanumangarh 0 0 0 0 0 0 0 0
Jaipur 5.7 9.1 16 17.7 23.1 29.4 32 41.8
Jaisalmer 0 0 0 0 0 0 0 0
Jalor 0 0 0 0 0 0 0 0
Jhalawar 4.5 3.2 6.8 9.1 11.6 8.4 8.5 9.8
Jhunjhunun 0 0 0 0 0 0 0 0
Jodhpur 0 0 0 0 0 0 0 0
Karauli 13.7 18.7 23.6 29.2 34.6 35.9 44 45.5
Kota 0 0 0 0 0 0 0 0
Nagaur 7 10.3 5.7 0.7 0 0 16.4 16.2
Pali 0 0 0 0 0 0 0 0
Pratapgarh 0 0 0 0 0 0 0 0
Rajsamand 7 5.4 10.4 13.2 14.3 14.9 14.1 15.3
Sawai Madhopur 0.4 0.6 0.6 1.3 3.9 4.4 6 5.1
Sikar 0 0 0 0 0 0 0 0
Sirohi 1.8 4.6 8.2 8.9 11.8 14.6 15.8 15.4
Tonk 6.9 4.4 12.3 16.4 20.4 24.1 29.2 29.6
Udaipur 18.5 19.5 23.1 26.4 29.7 31.7 32.4 30.6
Source: BAIF Data repository.

96National Dairy Development Board
Part V : Veterinary Infrastructure And Service Delivery System
Dairying in rajasthan - A Statistical Profile 2016
V.3. Service Delivery System - Animal HealthTABLE V.3.1: District-wise Vaccination Performed for Foot-and-Mouth Disease
DistrictsFoot-and-Mouth Disease Vaccination (‘000)
2001-02 2002-03 2008-09 2009-10 2010-11 2011-12 2012-13 2013-14 2014-15RAjAsThAN 505 476 846 993 906 885 1,376 1,809 6,538
Ajmer 14 16 25 23 26 28 38 59 226
Alwar 24 40 57 69 68 49 97 134 298
Banswara 9 13 31 42 20 33 32 34 165
Baran 10 8 29 32 22 28 36 28 176
Barmer 5 3 10 6 8 8 15 15 97
Bharatpur 28 22 60 55 61 64 85 78 256
Bhilwara 13 16 19 23 25 8 32 37 244
Bikaner 11 7 28 28 26 13 21 52 218
Bundi 10 7 16 20 24 30 40 30 137
Chittaurgarh 10 17 8 34 22 21 39 27 162
Churu 7 10 11 16 15 15 16 31 188
Dausa 6 5 11 18 14 21 32 31 148
Dhaulpur 2 6 15 12 16 15 37 82 159
Dungarpur 11 9 16 18 12 13 16 14 180
Ganganagar 28 58 83 113 94 96 103 90 90
Hanumangarh 25 28 48 45 49 35 58 126 418
Jaipur 94 48 53 70 75 129 103 109 287
Jaisalmer 5 4 6 11 16 11 37 91 117
Jalor 23 20 19 21 17 10 17 23 113
Jhalawar 14 12 25 20 12 19 20 17 125
Jhunjhunun 34 20 20 38 38 32 57 115 229
Jodhpur 14 13 29 28 34 44 58 64 261
Karauli 3 5 10 9 7 10 24 58 160
Kota 10 7 15 10 20 22 31 33 164
Nagaur 20 22 28 34 43 28 91 153 653
Pali 30 19 33 34 33 32 49 50 249
Pratapgarh 0 0 10 8 11 6 11 6 201
Rajsamand 8 12 18 24 12 4 22 17 170
Sawai Madhopur 10 2 16 6 3 1 7 8 152
Sikar 10 8 37 57 30 19 84 129 290
Sirohi 6 4 13 15 15 15 16 11 114
Tonk 9 7 22 25 23 14 27 41 127
Udaipur 5 9 25 29 15 12 25 16 301
Source: Administrative reports, Directorate of Animal Husbandry, Govt. of rajasthan.

97 National Dairy Development Board
Part V : Veterinary Infrastructure And Service Delivery System
Dairying in rajasthan - A Statistical Profile 2016
V.3. Service Delivery System - Animal HealthTABLE V.3.2: District-wise Vaccination Preformed for haemorrhagic septicaemia
Districtshaemorrhagic septicaemia Vaccination (‘000)
2001-02 2002-03 2008-09 2009-10 2010-11 2011-12 2012-13 2013-14 2014-15RAjAsThAN 4,470 3,540 4,156 4,344 4,456 4,693 4,782 4,937 5,305
Ajmer 170 126 156 156 156 168 182 204 199
Alwar 358 211 258 276 277 308 289 393 461
Banswara 310 248 251 250 249 252 252 247 231
Baran 107 83 93 113 94 133 104 134 163
Barmer 40 23 33 38 57 38 53 55 73
Bharatpur 393 253 284 298 314 341 342 319 381
Bhilwara 127 127 114 124 123 129 120 159 145
Bikaner 0 1 2 2 4 5 4 7 10
Bundi 156 66 119 134 124 131 122 139 143
Chittaurgarh 169 211 181 148 176 185 184 148 162
Churu 15 11 10 9 13 16 17 16 23
Dausa 168 111 151 157 164 177 182 177 188
Dhaulpur 150 124 142 139 144 157 159 159 145
Dungarpur 179 109 151 148 165 165 155 153 203
Ganganagar 141 177 190 202 172 194 206 185 199
Hanumangarh 52 60 75 73 74 73 82 111 107
Jaipur 282 204 282 295 296 349 337 360 329
Jaisalmer 44 36 12 11 18 17 11 15 14
Jalor 64 72 68 78 80 76 86 77 93
Jhalawar 128 100 116 124 141 122 122 116 123
Jhunjhunun 153 141 145 143 153 162 165 147 167
Jodhpur 93 96 148 126 142 142 144 99 157
Karauli 166 86 104 102 118 132 139 143 173
Kota 108 63 62 65 61 66 68 81 83
Nagaur 114 106 97 104 107 112 111 118 148
Pali 130 107 142 149 148 153 148 148 149
Pratapgarh 0 0 62 81 58 75 83 70 118
Rajsamand 126 122 108 119 119 118 114 130 115
Sawai Madhopur 95 64 62 75 76 88 97 104 98
Sikar 107 105 77 105 105 79 159 179 163
Sirohi 34 25 56 78 69 65 59 66 57
Tonk 90 82 132 171 177 164 192 212 204
Udaipur 200 191 273 251 282 301 294 266 280
Source: Administrative reports, Directorate of Animal Husbandry, Govt. of rajasthan.

98National Dairy Development Board
Part V : Veterinary Infrastructure And Service Delivery System
Dairying in rajasthan - A Statistical Profile 2016
V.3. Service Delivery System - Animal HealthTABLE V.3.3: District-wise Vaccination Preformed for Black Quarter
DistrictsBlack Quarter Vaccination (‘000)
2001-02 2002-03 2008-09 2009-10 2010-11 2011-12 2012-13 2013-14 2014-15RAjAsThAN 1,027 950 1,072 1,048 1,139 1,168 1,127 1,166 1,216
Ajmer 46 32 29 39 37 35 38 45 45
Alwar 1 6 18 23 21 24 23 29 39
Banswara 63 54 40 45 51 43 43 45 50
Baran 14 10 11 17 17 18 22 22 24
Barmer 90 51 64 68 85 70 69 82 67
Bharatpur 3 2 1 1 1 2 3 2 1
Bhilwara 27 32 29 32 31 30 30 34 36
Bikaner 27 51 51 43 46 59 39 35 65
Bundi 4 1 9 12 8 12 11 9 13
Chittaurgarh 29 31 26 23 26 25 26 26 21
Churu 15 15 14 15 15 22 19 16 22
Dausa 5 7 3 3 6 3 3 5 5
Dhaulpur 3 3 0 0 1 1 1 2 2
Dungarpur 2 9 13 11 13 13 2 12 19
Ganganagar 73 89 140 105 99 108 116 107 94
Hanumangarh 60 57 75 74 82 85 86 100 93
Jaipur 11 18 27 12 26 39 17 15 18
Jaisalmer 99 82 53 57 71 71 47 67 56
Jalor 45 50 48 53 48 49 53 46 53
Jhalawar 36 23 30 25 27 28 25 27 23
Jhunjhunun 29 22 22 24 27 42 55 41 40
Jodhpur 117 98 128 116 120 101 103 91 97
Karauli 8 3 2 3 3 3 2 5 8
Kota 2 1 3 2 0 4 5 7 7
Nagaur 48 48 41 49 54 61 62 70 83
Pali 72 61 74 64 82 79 84 81 91
Pratapgarh 0 0 6 12 10 13 0 10 17
Rajsamand 38 24 27 29 29 30 30 35 30
Sawai Madhopur 3 2 0 0 1 1 0 0 0
Sikar 14 18 18 28 28 22 47 33 32
Sirohi 21 17 30 32 35 33 27 33 27
Tonk 2 2 4 4 2 3 1 3 0
Udaipur 21 33 36 27 37 39 38 31 36
Source: Administrative reports, Directorate of Animal Husbandry, Govt. of rajasthan.

99 National Dairy Development Board
Part V : Veterinary Infrastructure And Service Delivery System
Dairying in rajasthan - A Statistical Profile 2016
V.3. Service Delivery System - Animal HealthTABLE V.3.4: District-wise Bovine Vaccination
DistrictsBovine Vaccination (‘000)
2001-02 2002-03 2008-09 2009-10 2010-11 2011-12 2012-13 2013-14 2014-15RAjAsThAN 6,002 4,966 6,074 6,385 6,501 6,746 7,285 7,912 13,059
Ajmer 230 174 210 218 219 231 258 308 470
Alwar 383 257 333 368 366 381 409 556 798
Banswara 382 315 322 337 320 328 327 326 446
Baran 131 101 133 162 133 179 162 184 363
Barmer 135 77 107 112 150 116 137 152 237
Bharatpur 424 277 345 354 376 407 430 399 638
Bhilwara 167 175 162 179 179 167 182 230 425
Bikaner 38 59 81 73 76 77 64 94 293
Bundi 170 74 144 166 156 173 173 178 293
Chittaurgarh 208 259 215 205 224 231 249 201 345
Churu 37 36 35 40 43 53 52 63 233
Dausa 179 123 165 178 184 201 217 213 341
Dhaulpur 155 133 157 151 161 173 197 243 306
Dungarpur 192 127 180 177 190 191 173 179 402
Ganganagar 242 324 413 420 365 398 425 382 383
Hanumangarh 137 145 198 192 205 193 226 337 618
Jaipur 387 270 362 377 397 517 457 484 634
Jaisalmer 148 122 71 79 105 99 95 173 187
Jalor 132 142 135 152 145 135 156 146 259
Jhalawar 178 135 171 169 180 169 167 160 271
Jhunjhunun 216 183 187 205 218 236 277 303 436
Jodhpur 224 207 305 270 296 287 305 254 515
Karauli 177 94 116 114 128 145 165 206 341
Kota 120 71 80 77 81 92 104 121 254
Nagaur 182 176 166 187 204 201 264 341 884
Pali 232 187 249 247 263 264 281 279 489
Pratapgarh 0 0 78 101 79 94 94 86 336
Rajsamand 172 158 153 172 160 152 166 182 315
Sawai Madhopur 108 68 78 81 80 90 104 112 250
Sikar 131 131 132 190 163 120 290 341 485
Sirohi 61 46 99 125 119 113 102 110 198
Tonk 101 91 158 200 202 181 220 256 331
Udaipur 226 233 334 307 334 352 357 313 617
Source: Administrative reports, Directorate of Animal Husbandry, Govt. of rajasthan.Note: Bovine vaccination includes vaccination for BQ, HS and FMD.

100National Dairy Development Board
Part V : Veterinary Infrastructure And Service Delivery System
Dairying in rajasthan - A Statistical Profile 2016

Part VI : Feed Resources
In Rajasthan, the livestock keepers have traditionally relied on common grazing lands “gochars”, scared groves “orans” and forests. With the growth of mining industry and allocation of community wastelands for biodiesel plantation, the permanent pastures and other grazing land reduced from 1.9 million ha in 1990-91 to 1.7 million ha in 2009-10. Often layers of white marble dust choke neighbouring grazing land. Amidst shrinking grazing land, forest were open for grazing to animals. But a Supreme Court ruling in 2002 that all human use (including grazing) in sanctuaries be banned to curb the transmission of disease to resident wildlife. Now the dairy farmers are shifting from extensive open grazing system to semi-intensive and intensive stall feeding system. Dairying is the most reliable source of earning to farmers in Rajasthan but with disappearing grazing land, restricted forest and stall feeding, the bovine are facing a severe shortage of fodder.

102National Dairy Development Board
Part VI : Feed ResourcesDairying in rajasthan - A Statistical Profile 2016
VI.1. Feed Resources - Availability vs. RequirementTable VI.1.1: area under Fodder Crops and Gross Sown area
Districts
area under Fodder Crops (‘000 ha) Gross Sown area (‘000 ha)
2000-01
2003-04
2007-08
2008-09
2009-10
2010-11
2011-12
2012-13
2000-01
2003-04
2007-08
2008-09
2009-10
2010-11
2011-12
2012-13
RaJaSTHaN 3,982 3,227 3,229 3,627 2,875 3,287 3,386 4,853 19,230 21,664 22,208 22,771 21,745 26,002 24,505 23,954
Ajmer 44 15 19 17 15 13 12 27 423 468 463 493 436 775 640 664
Alwar 59 47 46 50 35 34 30 55 785 829 813 809 864 859 854 853
Banswara 3 3 2 2 2 2 2 2 275 323 361 316 325 332 337 340
Baran 4 5 3 2 3 2 2 2 451 449 528 550 547 574 593 629
Barmer 378 314 357 360 370 411 430 417 1,650 1,794 1,756 1,777 1,820 1,979 1,868 1,646
Bharatpur 36 30 34 30 31 27 26 35 563 573 574 562 603 597 591 587
Bhilwara 71 39 57 47 35 36 30 54 410 457 543 520 456 733 624 643
Bikaner 835 782 612 891 653 884 908 1,101 1,465 1,713 1,434 1,784 1,502 1,880 1,884 1,807
Bundi 29 27 17 15 15 18 13 14 344 372 403 413 384 444 461 464
Chiiorgarh 34 22 23 21 21 22 21 27 476 562 691 492 423 520 505 518
Churu 456 328 347 350 295 248 327 608 1,141 1,304 1,449 1,459 1,283 1,575 1,528 1,355
Dausha 33 25 18 18 14 12 11 15 315 342 338 351 382 392 384 378
Dholpur 6 4 4 3 3 3 3 4 159 205 198 208 229 226 230 230
Dungarpur 4 6 4 4 5 5 5 5 128 174 193 158 186 187 200 200
Ganganagar 181 191 213 282 187 217 216 357 907 953 1,054 1,092 947 1,073 1,107 1,187
Hanumangarh 265 261 337 389 215 310 314 509 883 1,144 1,234 1,237 1,014 1,278 1,220 1,198
Jaipur 120 82 69 73 70 59 53 71 818 951 896 963 934 1,172 1,091 1,013
Jaisalmer 318 357 330 374 318 426 430 500 505 628 638 728 626 878 848 844
Jalor 95 68 76 66 63 61 50 103 700 813 855 813 824 1,126 911 895
Jhalawar 4 4 3 3 4 3 3 4 417 464 511 549 579 570 601 614
Jhunjhunun 80 59 74 79 67 61 66 132 632 646 648 655 614 734 668 644
Jodhpur 256 174 172 174 148 153 158 291 1,205 1,425 1,379 1,420 1,402 1,580 1,516 1,449
Karuli 11 8 5 5 5 4 3 7 271 313 295 306 348 344 340 340
Kota 9 8 5 5 5 5 4 4 426 399 421 435 439 459 462 492
Nagaur 288 151 136 135 92 78 91 217 1,340 1,478 1,464 1,460 1,411 1,859 1,469 1,453
Pali 102 54 85 66 53 46 35 65 570 627 706 645 631 887 702 721
Pratapgarh 2 2 2 2 2 272 267 272 283 291
Rajsamand 10 7 16 12 9 10 8 12 92 102 143 110 99 146 139 140
Sawai Madhopur 27 10 7 7 6 5 4 8 318 374 330 372 425 412 398 400
Sikar 128 80 87 87 76 72 80 134 673 735 740 743 715 847 777 748
Sirohi 31 27 29 23 22 22 18 32 168 202 226 192 171 241 233 230
Tonk 48 23 18 16 14 13 13 19 465 550 540 584 575 715 691 637
Udaipur 14 17 23 22 22 22 21 22 256 299 386 303 284 336 348 342
Source: Directorate of economics and Statistics, Department of Agriculture and cooperation, Ministry of Agriculture and Farmers Welfare, Govt. of India.

103 National Dairy Development Board
Part VI : Feed ResourcesDairying in rajasthan - A Statistical Profile 2016
VI.1. Feed Resources - Availability vs. RequirementTable VI.1.2: District-wise Dry Matter (DM) availability, Requirement and balance
Districtsavailable/ Required/
balance
Dry Matter availability, Requirement and balance (‘000 MT)
1992 1997 2003 2007 2008 2009 2010 2011Ajmer Available 826.9 806.4 452.7 1,070.3 949.4 949.1 967.2 981.2
Requirement 1,619.2 2,426.3 1,911.0 2,398.0 2,508.4 2,627.9 2,756.9 2,895.6Balance -792.3 -1,619.9 -1,458.3 -1,327.7 -1,559.0 -1,678.8 -1,789.7 -1,914.4
Alwar Available 410.8 539.2 1,499.7 2,457.6 2,493.3 2,493.3 2,297.6 2,167.2Requirement 2,478.8 3,195.9 3,627.3 4,073.8 4,187.2 4,310.4 4,443.6 4,587.2Balance -2,068.0 -2,656.8 -2,127.6 -1,616.2 -1,693.9 -1,817.1 -2,146.0 -2,420.0
Banswara Available 1,838.3 1,937.7 871.0 1,032.1 1,182.9 1,182.9 854.3 1,018.6Requirement 1,600.8 1,956.9 2,261.2 2,383.6 2,405.6 2,433.6 2,466.0 2,502.5Balance 237.5 -19.2 -1,390.2 -1,351.5 -1,222.7 -1,250.6 -1,611.7 -1,483.9
Baran Available 1,035.5 1,201.4 700.5 1,256.8 1,278.9 1,278.9 1,406.5 1,342.7Requirement 1,343.6 1,523.8 1,350.8 1,643.8 1,728.8 1,825.3 1,933.5 2,053.7Balance -308.1 -322.4 -650.3 -387.0 -449.9 -546.5 -527.0 -711.0
Barmer Available 1,243.1 1,661.6 1,404.1 1,779.8 1,688.3 1,661.6 1,411.3 1,334.6Requirement 2,352.0 2,603.1 2,464.2 2,899.8 3,013.3 3,139.8 3,280.7 3,437.9Balance -1,108.9 -941.5 -1,060.1 -1,120.0 -1,325.0 -1,478.2 -1,869.4 -2,103.3
Bharatpur Available 1,623.6 1,631.4 1,046.5 1,441.2 1,545.5 1,545.5 1,706.8 1,626.2Requirement 1,841.1 2,179.4 2,711.9 2,070.1 1,978.5 1,898.0 1,828.1 1,768.6Balance -217.5 -5,48.0 -1,665.5 -628.8 -432.9 -352.5 -121.3 -142.4
Bhilwara Available 801.3 1,007.6 699.4 1,970.8 1,550.7 1,550.7 1,018.9 1,284.8Requirement 2,603.2 3,085.2 2,568.8 2,590.8 2,608.5 2,633.1 2,663.8 2,700.1Balance -1,801.9 -2,077.6 -1,869.4 -620.0 -1,057.8 -1,082.5 -1,645.0 -1,451.3
Bikaner Available 1,898.6 1,941.6 1,999.0 2,067.4 2,222.3 2,177.1 1,558.7 1,867.9Requirement 2,084.3 2,149.9 2,404.7 2,538.8 2,580.6 2,630.3 2,688.9 2,757.2Balance -185.7 -208.3 -405.7 -471.4 -358.3 -453.3 -1,130.2 -889.3
Bundi Available 1,476.2 2,307.8 571.7 1,484.8 1,210.4 1,210.4 1,187.3 1,198.9Requirement 1,306.4 1,494.5 1,443.6 1,651.3 1,702.0 1,758.9 1,821.4 1,889.4Balance 169.7 813.4 -871.9 -166.5 -491.6 -548.5 -634.1 -690.5
Chittaurgarh Available 1,211.4 524.1 1,436.4 2,333.2 2,371.4 2,371.4 1,779.7 2,075.6Requirement 2,711.3 2,807.8 2,932.3 3,515.9 3,661.4 3,827.3 4,013.4 4,220.1Balance -1,499.9 -2,283.7 -1,495.9 -1,182.7 -1,290.0 -1,456.0 -2,233.7 -2,144.5
Churu Available 395.6 474.3 884.1 1,555.0 2,116.8 2,026.3 1,017.5 1,521.9Requirement 1,077.3 1,944.2 1,523.3 1,754.0 1,812.0 1,875.8 1,946.3 2,024.3Balance -681.8 -1,469.9 -639.2 -199.0 304.9 150.5 -928.8 -502.4
Dausa Available 408.7 483.7 677.5 1,081.6 1,138.4 1,138.4 1,092.9 1,115.7Requirement 1,234.4 1,567.7 1,641.1 1,878.8 1,945.8 2,020.8 2,104.5 2,197.9Balance -825.7 -1,084.0 -963.6 -797.2 -807.5 -882.5 -1,011.6 -1,082.2
Dhaulpur Available 647.0 610.4 573.7 635.9 679.2 679.2 821.1 544.9Requirement 921.4 1,079.4 1,226.6 1,335.1 1,366.6 1,401.6 1,440.0 1,481.9Balance -274.4 -469.0 -652.9 -699.1 -687.4 -722.4 -618.9 -937.0
Dungarpur Available 359.5 367.6 375.7 343.3 429.2 429.2 442.0 435.6Requirement 1,186.8 1,448.7 1,641.7 1,760.5 1,785.4 1,814.3 1,846.4 1,881.3Balance -827.3 -1,081.1 -1,266.0 -1,417.2 -1,356.2 -1,385.1 -1,404.4 -1,445.7
Ganganagar Available 1,980.1 2,367.7 1,289.6 1,820.2 2,231.7 2,231.0 1,636.1 1,933.6Requirement 3,339.7 2,252.5 2,098.4 2,666.2 2,816.5 2,983.5 3,169.1 3,375.2Balance -1,359.6 115.2 -808.8 -846.0 -584.8 -752.5 -1,533.0 -1,441.7
Hanumangarh Available 1,267.9 1,100.1 1,435.7 1,924.7 2,250.3 2,239.6 1,761.9 2,001.8Requirement 1,987.4 2,100.4 2,129.5 2,414.3 2,482.2 2,555.0 2,633.1 2,716.8Balance -719.5 -1,000.3 -693.8 -489.6 -231.9 -315.4 -871.2 -715.0

104National Dairy Development Board
Part VI : Feed ResourcesDairying in rajasthan - A Statistical Profile 2016
Districtsavailable/ Required/
balance
Dry Matter availability, Requirement and balance (‘000 MT)
1992 1997 2003 2007 2008 2009 2010 2011Jaipur Available 874.0 1,103.2 1,639.3 2,259.9 2,816.5 2,816.4 2,033.4 2,424.9
Requirement 3,056.1 3,870.6 4,317.8 5,012.1 5,221.2 5,462.7 5,741.7 6,064.6Balance -2,182.1 -2,767.4 -2,678.6 -2,752.2 -2,404.7 -2,646.3 -3,708.3 -3,639.7
Jaisalmer Available 1,045.4 1,092.8 1,476.3 1,871.3 1,251.1 1,251.1 1,204.2 1,125.3Requirement 324.4 1,206.8 1,017.4 1,399.0 1,501.2 1,619.1 1,755.4 1,913.3Balance 721.0 -113.9 458.9 472.3 -250.1 -368.0 -551.2 -788.0
Jalor Available 1,009.5 1,157.6 746.7 1,517.1 1,011.5 1,001.5 705.0 1,243.2Requirement 1,277.2 1,941.0 1,954.4 2,277.8 2,348.5 2,423.6 2,503.0 2,586.6Balance -267.7 -783.5 -1,207.7 -760.7 -1,336.9 -1,422.1 -1,797.9 -1,343.4
Jhalawar Available 1,853.3 1,735.2 794.9 1,333.2 1,276.6 1,276.6 1,455.3 1,365.9Requirement 1,596.6 1,687.0 1,825.8 2,047.5 2,095.3 2,150.2 2,211.4 2,278.3Balance 256.8 48.2 -1,030.9 -714.3 -818.7 -873.6 -756.0 -912.4
Jhunjhunun Available 835.8 826.2 816.6 1,454.9 1,702.8 1,702.6 1,106.4 1,404.5Requirement 1,102.2 1,683.0 1,823.9 2,051.2 2,123.0 2,207.8 2,307.8 2,425.6Balance -266.4 -856.8 -1,007.3 -596.4 -420.2 -505.2 -1,201.4 -1,021.1
Jodhpur Available 1,195.1 1,312.2 1,280.1 1,829.0 2,002.7 1,976.4 1,379.4 1,013.2Requirement 1,556.8 2,902.5 2,470.3 3,008.6 3,126.5 3,254.7 3,393.9 3,545.2Balance -361.7 -1,590.3 -1,190.2 -1,179.6 -1,123.8 -1,278.3 -2,014.5 -2,532.0
Karauli Available 794.8 1,071.1 518.4 960.9 1,074.7 1,074.7 1,224.8 1,149.8Requirement 1,532.8 1,552.6 1,513.0 1,738.7 1,795.2 1,857.2 1,924.7 1,998.3Balance -738.0 -481.5 -994.6 -777.9 -720.5 -782.4 -699.9 -848.5
Kota Available 1,069.9 1,227.8 558.5 960.7 993.9 993.9 1,075.3 1,034.6Requirement 1,034.2 1,208.8 1,196.2 1,441.9 1,503.2 1,570.7 1,644.5 1,724.5Balance 35.7 19.0 -637.7 -481.3 -509.3 -576.8 -569.1 -689.9
Nagaur Available 1,556.3 1,372.4 1,336.2 2,274.6 2,800.9 2,755.9 1,671.2 2,213.6Requirement 2,016.8 3,075.4 2,657.3 3,027.7 3,112.8 3,203.8 3,301.1 3,405.1Balance -460.5 -1,703.0 -1,321.1 -753.1 -311.9 -447.9 -1,629.9 -1,191.5
Pali Available 1,235.4 968.1 647.1 1,178.1 925.2 924.7 647.9 562.0Requirement 1,642.4 2,213.9 1,940.4 2,235.9 2,309.7 2,391.2 2,480.6 2,578.1Balance -407.0 -1,245.7 -1,293.3 -1,057.8 -1,384.4 -1,466.5 -1,832.6 -2,016.0
Rajsamand Available 1,086.7 1,284.7 260.9 623.5 439.4 439.3 382.3 410.8Requirement 1,294.0 1,513.7 1,339.3 1,537.0 1,577.2 1,621.3 1,669.0 1,720.3Balance -207.3 -229.0 -1,078.4 -913.6 -1,137.9 -1,181.9 -1,286.7 -1,309.5
Sawai Madhopur Available 456.6 464.2 414.5 757.7 823.1 823.1 892.7 244.7Requirement 1,137.6 1,277.3 1,223.8 1,294.7 1,321.8 1,352.7 1,387.1 1,424.9Balance -681.0 -813.0 -809.3 -537.0 -498.7 -529.6 -494.4 -1,180.2
Sikar Available 918.9 1,011.1 1,085.8 1,790.8 2,117.5 2,115.7 1,374.2 1,744.9Requirement 1,562.4 2,235.6 2,432.4 2,807.1 2,909.1 3,023.9 3,153.1 3,298.4Balance -643.5 -1,224.5 -1,346.6 -1,016.3 -791.6 -908.2 -1,778.9 -1,553.5
Sirohi Available 394.3 347.6 300.9 495.9 443.5 443.4 332.8 388.1Requirement 696.5 865.1 1,033.7 1,145.9 1,172.8 1,202.5 1,234.7 1,269.2Balance -302.2 -517.5 -732.8 -650.0 -729.4 -759.1 -901.9 -881.1
Tonk Available 614.9 691.9 537.8 845.9 998.4 998.4 698.4 848.4Requirement 1,444.8 1,553.3 1,336.3 1,770.2 1,881.7 2,005.5 2,142.1 2,292.4Balance -829.9 -861.4 -798.6 -924.3 -883.3 -1,007.1 -1,443.7 -1,444.0
Udaipur Available 1,205.1 1,218.9 1,191.3 1,246.5 1,293.4 1,293.4 1,074.7 1,184.1Requirement 4,083.1 4,031.4 4,134.8 3,927.9 3,882.0 3,846.2 3,817.4 3,793.6Balance -2,878.0 -2,812.5 -2,943.4 -2,681.4 -2,588.6 -2,552.8 -2,742.7 -2,609.5
Source: Feedbase 2012, National Institute of Animal Nutrition and Physiology, Bangalore.

105 National Dairy Development Board
Part VI : Feed ResourcesDairying in rajasthan - A Statistical Profile 2016
VI.1. Feed Resources - Availability vs. RequirementTable VI.1.3: availability, Requirement and Surplus/Deficit of Feed Nutrient
YearDry Matter (‘000 MT)
availability Requirement Surplus/Deficit1992 33,571 55,046 -21,475
1997 35,848 66,634 -30,786
2003 29,523 66,153 -36,630
2007 45,655 74,298 -28,643
2008 47,310 76,464 -29,154
2009 47,052 78,929 -31,877
2010 38,218 81,703 -43,485
2011 40,809 84,808 -43,999
Source: Feedbase 2012, National Institute of Animal Nutrition and Physiology, Bangalore.

106National Dairy Development Board
Part VI : Feed ResourcesDairying in rajasthan - A Statistical Profile 2016

National Dairy Development Board
Part VII : Agriculture
The state of Rajasthan has extreme geo-climatic conditions. It had 48 drought years in 100 years for the century ending 2002. It has about 11 per cent of the country’s land mass, but only 1 per cent of total surface water of the country is available in the state. Of the 14 river basins, Chambal river is perennial. Even rainfall is erratic and scanty as average rainfall is 57 cm. Out of the total 237 blocks in the state, only 30 blocks are in safe category and balance are either “over exploited” or “critical”. Apart from water resource limitations, the weather is severe as the temperature ranges from as low as 3oC to as high as 49oC. Although it has 10 agro-climatic zones, about two-third is arid or semi-arid area with tropical desert climate. Weather uncertainties and unfavourable climatic conditions lead to high level of fluctuation in crop productivity as well as agricultural production which results into wide fluctuation in Gross State Domestic Product (GSDP). It is the largest producer of mustard, bajra, coriander, cumin, cluster beans, isabgul and guar. But considering high risk involved in food grain production, the grower are diverting area under oilseed cultivation and increasing reliance on animal husbandry as source of income. In order to impart stability to agriculture, the State Government has formulated State Agriculture Policy in 2012.

108National Dairy Development Board
Part VII : AgricultureDairying in rajasthan - A Statistical Profile 2016
Table VII.1.1: Rajasthan’s agro-Climatic Zones
Arid Western Irrigated North Western PlainHyper Arid
Irrigated WesternPlain Partially
Transitional Plain of Inland Drainage Transitional Plain of Luni Basin Semi Arid Eastern Plain
Flood Prone Eastern Plain Sub Humid Southern Plain Humid Southern Plain
Humid South- Eastern Plain
Source: Water resources Department, Govt. of rajasthan.
VII.1. Agro-Climatic Zones

109 National Dairy Development Board
Part VII : AgricultureDairying in rajasthan - A Statistical Profile 2016
VII.1. AgricultureTable VII.1.2: Details of agro-Climatic Zones
Name of Zone arid western Irrigated North Western Plain
Hyper arid Irrigated
Western plain Partially.
Transitional Plain of inland
drainage
Transitional plain of luni
basin
Districts Covered (blocks)
Part of Barmer district (Barmer, Balotra, Baytod, Chohtan, Dhorimanna, Sindhari, Sheo) and Jodhpur district (Balesar, Bap, Part of Bhopalgarh, Luni, Mandore, Osian, Phalodi, Shergarh)
Ganganagar, Hanumangarh
Bikaner, Jaisalmer and Part of Churu (Ratangarh, Sardarshahar, Sujangarh)
Nagaur, Sikar, Jhunjhunun and Part of Churu (Churu, Rajgarh, Taranagar)
Jalor, Pali, Part of Sirohi (Reodhar, Sheoganj, Sirohi), Barmer (Siwana) and Jodhpur (Bilara, Part of Bhopalgarh)
Total area (Million Ha)
4.56 2.06 7.70 3.71 3.17
Net Sown area (Million Ha)
2.34 1.60 2.44 2.68 1.93
Rainfall (mm) 216-496 183-344 192-420 266-627 139-1,273
Soil Type Desert soils and sand dunes aeolian soil, coarse sand in Texture and some places Calcareous
Alluvial deposits calcareous, high soluble salts and exchangeable sodium
Desert soils and sand dunes aeolian soil, Loamy coarse in texture and calcareous
Sandy loam, shallow depth red soils in depressions
Red desert soils in Jodhpur, Jalor and Pali sierozems in Pali and Sirohi
Major Crops Bajra, Mothbean, sesame, Wheat, Mustard, Cumin
Cotton, Guar, Wheat, Mustard, Gram
Bajra, Mothbean, Guar, Wheat, Mustard, Gram
Bajra, Guar, Pulses, Wheat, Mustard, Gram
Bajra, Guar, Sesame, Wheat, Mustard
Source: Water resources Department, Govt. of rajasthan.

110National Dairy Development Board
Part VII : AgricultureDairying in rajasthan - A Statistical Profile 2016
VII.1. AgricultureTable VII.1.2: Details of agro-Climatic Zones
Name of Zone Semi arid eastern Plains
Flood Prone eastern Plain.
Sub-humid Southern
Plains
Humid Southern
Plains
Humid south eastern Plain
District Covered (blocks)
Ajmer, Jaipur, Tonk, Part of Dausa (Bandikui, Dausa, Lalsot, Sikrai)
Alwar, Bharatpur, Dhaulpur, Karauli, Part of Dausa (Mahuwa) and Sawai Madhopur (Bamanwas, Bonli, Gangapur)
Bhilwara, Chittaurgarh, Rajsamand, Part of Sirohi (Abu Road, Pindwara), Udaipur (Bargain, Bhinder, Girwa, Gogunda, Kherwara, Kotra, Jhadol, Mavli, Sarada) and Pratapgarh (Choti Sadri, Pratapgarh)
Dungarpur, Banswara, Part of Udaipur (Salumber) and Pratapgarh (Dhariyawad, Peepalkhunt, Arnod
Baran, Bundi, Jhalawar, Kota, Part of Sawai Madhopur (Khandar, Sawai Madhopur)
Total area (Million Ha)
2.95 2.44 3.76 1.20 2.69
Net Sown area (Million Ha)
1.77 1.41 0.92 0.57 1.27
Rainfall (mm) 313-694 140-736 311-1,470 511-1,043 452-985
Soil Sierozems, eastern part alluvial, west north west lithosols, foot hills, brown soils
Alluvial prone to water logging, nature of recently alluvial calcareous has been observed
Soil are lithosol at foot hills and alluvial in plains
Predominantly reddish medium texture, well drained calcareous, shallow on hills, deep soil in valleys
black, of alluvial origin, clay loam
Major Crops Bajra, Guar, Jowar, Wheat, Mustard, Gram
Bajra, Guar, Groundnut Wheat, Barley, Mustard, Gram
Maize, Pulses, Jowar, Wheat, Mustard Gram
Maize, Paddy, Jowar, Black gram, Wheat, Mustard, Gram
Jowar, Soybean, Wheat, Mustard,
Source: Water resources Department, Govt. of rajasthan.

111 National Dairy Development Board
Part VII : AgricultureDairying in rajasthan - A Statistical Profile 2016
VII.2. Land Use PatternTable VII.2.1: District-wise land Use Pattern
(‘000 ha)
Districts
Reporting area Forest area
Permanent Pastures and Grazing land
Fallow land Net sown area
2000
-01
2012
-13
2000
-01
2012
-13
2000
-01
2012
-13
2000
-01
2012
-13
2000
-01
2012
-13
RaJaSTHaN 34,265 34,267 2,606 2,750 1,707 1,695 4,859 3,894 15,865 17,479
Ajmer 842 843 51 58 80 78 130 48 363 454
Alwar 783 783 71 84 24 24 34 38 508 504
Banswara 506 454 111 91 13 12 49 35 227 228
Baran 700 699 215 217 37 35 44 23 312 345
Barmer 2,817 2,817 29 32 204 204 600 684 1,552 1,492
Bharatpur 507 507 29 34 9 8 22 15 389 396
Bhilwara 1,047 1,051 74 76 120 121 144 96 332 429
Bikaner 3,036 3,042 81 94 52 51 418 387 1,379 1,542
Bundi 582 582 141 144 24 25 58 35 235 262
Chittaurgarh 1,036 751 189 120 76 74 60 35 385 312
Churu 1,386 1,386 6 7 39 38 180 107 1,087 1,153
Dausa 340 341 24 26 26 26 31 17 212 229
Dhaulpur 301 301 27 27 18 18 38 15 130 158
Dungarpur 386 386 61 62 35 35 48 40 115 134
Ganganagar 1,093 1,093 59 61 0 0 256 141 666 786
Hanumangarh 970 970 13 19 5 5 237 62 647 824
Jaipur 1,106 1,106 82 82 78 74 200 105 584 662
Jaisalmer 3,839 3,839 22 45 101 103 153 239 425 667
Jalor 1,057 1,057 20 24 46 47 212 178 622 662
Jhalawar 632 632 120 126 52 47 33 20 309 334
Jhunjhunun 592 592 40 40 40 39 44 60 426 408
Jodhpur 2,256 2,256 7 7 126 122 703 623 1,162 1,256
Karauli 505 504 168 173 31 31 29 15 188 202
Kota 521 518 123 126 14 14 42 17 251 273
Nagaur 1,764 1,764 18 19 72 72 306 311 1,209 1,203
Pali 1,233 1,233 80 87 90 91 280 204 529 606
Pratapgarh 412 121 23 12 178
Rajsamand 455 453 24 26 58 56 36 31 86 92
Sawai Madhopur 499 497 78 81 25 26 60 22 251 292
Sikar 774 774 61 61 41 40 101 89 510 521
Sirohi 518 518 152 155 33 33 86 55 135 163
Tonk 718 718 26 27 46 41 124 56 405 472
Udaipur 1,462 1,388 405 397 91 83 100 77 232 239
Source: Directorate of economics and Statistics, Ministry of Agriculture and Farmers Welfare, Govt. of India and Department of Agriculture, Govt. of rajasthan.

112National Dairy Development Board
Part VII : AgricultureDairying in rajasthan - A Statistical Profile 2016
VII.3. Area and ProductionTable VII.3.1: District-wise area and Production – Cereals
Districts
Cerealsarea (‘000 ha) Production (‘000 MT)
2006
-07-
2008
-09
2010
-11
2011
-12
2012
-13
2013
-14
2014
-15
2006
-07-
2008
-09
2010
-11
2011
-12
2012
-13
2013
-14
2014
-15
RaJaSTHaN 9,587 10,907 9,991 9,124 9,583 9,473 14,262 20,322 19,572 18,062 18,218 17,670
Ajmer 294 397 287 327 317 321 263 607 418 509 459 373
Alwar 467 519 503 493 492 511 1,157 1,406 1,367 1,391 1,345 1,341
Banswara 261 264 267 262 259 245 359 497 394 413 412 353
Baran 122 179 165 183 176 198 377 589 587 771 575 733
Barmer 977 975 894 725 870 760 166 561 593 314 391 222
Bharatpur 306 338 330 294 308 324 733 985 960 811 914 857
Bhilwara 317 411 343 341 339 351 606 794 698 828 818 669
Bikaner 269 336 295 162 240 216 214 378 420 253 357 305
Bundi 174 228 222 219 222 244 541 745 858 853 743 540
Chittaurgarh 240 301 280 270 267 271 700 844 820 869 817 738
Churn 447 438 434 313 367 340 281 326 327 229 272 263
Dausa 211 251 240 239 241 253 460 562 585 619 609 648
Dhaulpur 123 147 143 142 143 153 295 366 435 408 403 413
Dungarpur 144 149 157 155 153 140 153 205 152 176 192 190
Ganganagar 259 282 294 292 319 349 873 1,169 1,137 1,115 1,290 1,218
Hanumangarh 339 355 358 306 324 340 928 1,082 1,113 1,053 1,088 1,122
Jaipur 519 598 556 545 552 558 911 1,310 1,144 1,135 1,143 1,202
Jaisalmer 142 209 159 73 105 84 25 145 93 31 27 15
Jalor 360 420 361 321 353 331 273 451 556 407 229 309
Jhalawar 112 117 125 118 132 154 282 319 399 347 357 436
Jhunjhunun 365 378 362 321 338 328 531 788 774 599 676 701
Jodhpur 652 752 676 557 606 559 349 812 835 383 411 661
Karauli 182 222 206 204 208 212 406 624 553 538 565 570
Kota 118 151 134 146 153 160 384 487 507 580 582 329
Nagaur 609 657 586 555 565 555 641 1,031 817 368 614 613
Pali 276 337 249 262 235 230 240 375 272 291 240 225
Pratapgarh 100 110 115 114 119 116 218 211 283 337 352 306
Rajsamand 100 113 110 108 104 103 195 211 228 272 231 217
Sawai Madhopur 121 178 146 139 142 144 250 467 362 350 325 380
Sikar 412 465 441 418 424 414 624 870 854 784 826 867
Sirohi 88 102 92 79 74 66 135 203 158 161 129 109
Tonk 205 271 187 172 173 174 269 502 354 326 296 254
Udaipur 277 256 274 271 266 268 437 401 521 538 529 490
Source: Various Issues of rajasthan Agricultural Statistics at a Glance, commissionerate of Agriculture, Govt. of rajasthan.

113 National Dairy Development Board
Part VII : AgricultureDairying in rajasthan - A Statistical Profile 2016
VII.3. Area and ProductionTable VII.3.2: District-wise area and Production – Pulses
Districts
Pulsesarea (‘000 ha) Production (‘000 MT)
2006
-07-
2008
-09
2010
-11
2011
-12
2012
-13
2013
-14
2014
-15
2006
-07-
2008
-09
2010
-11
2011
-12
2012
-13
2013
-14
2014
-15
RaJaSTHaN 3,583 4,752 4,449 3,246 4,198 3,362 1,620 3,252 2,353 1,957 2,471 1,952
Ajmer 102 207 247 206 270 191 39 163 114 139 224 82
Alwar 15 19 16 15 18 14 17 26 19 19 24 15
Banswara 42 34 33 33 34 31 26 20 24 27 23 23
Baran 6 11 12 15 11 14 6 14 11 17 10 11
Barmer 251 327 290 237 282 223 38 173 101 95 89 63
Bharatpur 7 9 7 5 6 7 7 13 9 9 8 8
Bhilwara 81 115 120 107 113 104 39 94 67 79 83 56
Bikaner 436 495 481 351 420 391 170 364 215 182 226 238
Bundi 25 43 62 54 48 61 22 42 56 48 32 47
Chittaurgarh 12 14 14 14 13 12 14 12 10 12 12 11
Churn 589 817 685 343 642 487 212 373 136 154 167 180
Dausa 4 11 12 13 19 19 4 12 13 17 29 24
Dhaulpur 3 4 3 3 2 2 3 4 3 3 3 2
Dungarpur 30 28 31 32 33 28 20 21 24 23 28 27
Ganganagar 130 162 126 123 95 77 106 137 95 131 94 76
Hanumangarh 245 325 228 96 122 102 126 179 111 66 74 78
Jaipur 103 200 236 175 255 214 60 255 152 178 269 147
Jaisalmer 58 93 110 137 150 116 32 60 85 83 129 50
Jalor 134 131 153 107 133 97 55 82 82 68 40 46
Jhalawar 38 53 35 36 41 33 30 42 32 35 30 30
Jhunjhunun 116 185 124 95 150 99 86 162 105 102 157 103
Jodhpur 260 296 291 195 239 218 64 178 166 43 78 157
Karauli 8 17 19 17 17 11 9 23 20 21 22 12
Kota 11 15 24 18 9 11 9 13 20 15 7 8
Nagaur 492 588 541 394 573 394 218 369 307 75 261 184
Pali 107 167 160 126 170 144 46 102 81 68 84 70
Pratapgarh 34 32 30 30 33 31 19 28 26 27 30 32
Rajsamand 4 4 3 4 4 3 2 3 2 2 2 2
Sawai Madhopur 11 23 22 22 19 13 10 30 23 25 21 15
Sikar 118 164 122 88 108 83 71 136 109 72 99 71
Sirohi 10 18 16 11 14 8 8 13 9 7 8 3
Tonk 69 124 170 122 135 106 30 85 108 99 91 64
Udaipur 29 23 24 20 23 21 23 23 19 16 19 16
Source: Various Issues of rajasthan Agricultural Statistics at a Glance, commissionerate of Agriculture, Govt. of rajasthan.

114National Dairy Development Board
Part VII : AgricultureDairying in rajasthan - A Statistical Profile 2016

115 National Dairy Development Board
Part VII : AgricultureDairying in rajasthan - A Statistical Profile 2016
VII.3. Area and ProductionTable VII.3.3: District-wise area and Production – Food Grains
Districts
Food Grainsarea (‘000 ha) Production (‘000 MT)
2006
-07-
2008
-09
2010
-11
2011
-12
2012
-13
2013
-14
2014
-15
2006
-07-
2008
-09
2010
-11
2011
-12
2012
-13
2013
-14
2014
-15
RaJaSTHaN 13,170 15,659 14,440 12,370 13,781 12,835 15,882 23,574 21,925 20,019 20,689 19,622
Ajmer 396 604 534 533 587 512 302 770 532 648 683 455
Alwar 482 538 519 508 510 525 1,174 1,432 1,386 1,410 1,369 1,356
Banswara 303 298 300 295 293 276 385 517 418 440 435 376
Baran 128 190 177 198 187 212 383 603 598 788 585 744
Barmer 1,228 1,302 1,184 962 1,152 983 204 734 694 409 480 285
Bharatpur 313 347 337 299 314 331 740 998 969 820 922 865
Bhilwara 398 526 463 448 452 455 645 888 765 907 901 725
Bikaner 705 831 776 513 660 607 384 742 635 435 583 543
Bundi 199 271 284 273 270 305 563 787 914 901 775 587
Chittaurgarh 252 315 294 284 280 283 714 856 830 881 829 749
Churn 1,036 1,255 1,119 656 1,009 827 493 699 463 383 439 443
Dausa 215 262 252 252 260 272 464 574 598 636 638 672
Dhaulpur 126 151 146 145 145 155 298 370 438 411 406 415
Dungarpur 174 177 188 187 186 168 173 226 176 199 220 217
Ganganagar 389 444 420 415 414 426 979 1,306 1,232 1,246 1,384 1,294
Hanumangarh 584 680 586 402 446 442 1,054 1,261 1,224 1,119 1,162 1,200
Jaipur 622 798 792 720 807 772 971 1,565 1,296 1,313 1,412 1,349
Jaisalmer 200 302 269 210 255 200 57 205 178 114 156 65
Jalor 494 551 514 428 486 428 328 533 638 475 269 355
Jhalawar 150 170 160 154 173 187 312 361 431 382 387 466
Jhunjhunun 481 563 486 416 488 427 617 950 879 701 833 804
Jodhpur 912 1,048 967 752 845 777 413 990 1,001 426 489 818
Karauli 190 239 225 221 225 223 415 647 573 559 587 582
Kota 129 166 158 164 162 171 393 500 527 595 589 337
Nagaur 1,101 1,245 1,127 949 1,138 949 859 1,400 1,124 443 875 797
Pali 383 504 409 388 405 374 286 477 353 359 324 295
Pratapgarh 134 142 145 144 152 147 237 239 309 364 382 338
Rajsamand 104 117 113 112 108 106 197 214 230 274 233 219
Sawai Madhopur 132 201 168 161 161 157 260 497 385 375 346 395
Sikar 530 629 563 506 532 497 695 1,006 963 856 925 938
Sirohi 98 120 108 90 88 74 143 216 167 168 137 112
Tonk 274 395 357 294 308 280 299 587 462 425 387 318
Udaipur 306 279 298 291 289 289 460 424 540 554 548 506
Source: Various Issues of rajasthan Agricultural Statistics at a Glance, commissionerate of Agriculture, Govt. of rajasthan.

116National Dairy Development Board
Part VII : AgricultureDairying in rajasthan - A Statistical Profile 2016
VII.3. Area and ProductionTable VII.3.4: District-wise area and Production – Oilseeds
Districts
Oilseedsarea (‘000 ha) Production (‘000 MT)
2006
-07-
2008
-09
2010
-11
2011
-12
2012
-13
2013
-14
2014
-15
2006
-07-
2008
-09
2010
-11
2011
-12
2012
-13
2013
-14
2014
-15
RaJaSTHaN 4,384 5,509 4,623 4,912 5,274 4,457 4,848 6,642 5,765 6,364 6,034 5,314
Ajmer 43 140 59 64 76 60 22 104 40 67 88 39
Alwar 259 260 271 250 243 235 367 431 344 387 354 322
Banswara 22 20 21 23 28 40 19 19 16 23 33 34
Baran 304 311 308 371 404 199 391 499 551 588 322 228
Barmer 49 99 62 59 70 59 37 83 44 41 79 46
Bharatpur 211 206 211 234 213 200 298 376 343 377 309 275
Bhilwara 90 153 80 81 100 74 64 95 55 72 104 60
Bikaner 116 138 163 167 196 230 146 287 299 278 368 472
Bundi 168 144 152 169 165 143 188 149 194 217 174 132
Chittaurgarh 142 141 118 145 175 167 178 162 160 203 181 194
Churn 41 57 61 75 78 89 54 82 79 94 126 132
Dausa 104 111 111 107 98 87 125 150 123 146 133 112
Dhaulpur 66 65 72 74 73 63 92 114 110 94 89 72
Dungarpur 2 4 5 7 10 21 2 4 5 8 8 21
Ganganagar 280 302 285 271 220 198 319 579 300 388 344 277
Hanumangarh 121 128 102 112 106 104 140 244 123 152 172 160
Jaipur 184 276 207 183 190 167 204 304 239 218 234 192
Jaisalmer 95 107 91 77 76 68 53 81 57 38 62 49
Jalor 158 384 193 187 221 185 181 370 309 301 294 286
Jhalawar 272 289 289 354 363 284 321 364 449 503 259 292
Jhunjhunun 93 97 101 86 84 81 111 131 77 122 119 121
Jodhpur 166 224 211 222 306 289 162 203 240 188 373 355
Karauli 100 98 109 110 98 98 122 138 126 144 132 133
Kota 223 224 223 275 286 193 301 265 330 381 296 185
Nagaur 129 400 78 146 264 91 132 240 74 121 209 79
Pali 166 278 188 196 256 176 87 117 94 112 118 97
Pratapgarh 126 111 113 123 133 131 124 148 136 150 153 147
Rajsamand 9 14 8 6 6 5 7 11 5 4 5 4
Sawai Madhopur 198 198 214 226 219 211 183 245 221 266 223 251
Sikar 109 118 101 87 93 81 125 155 111 116 128 119
Sirohi 68 88 93 89 90 87 81 118 139 135 87 115
Tonk 237 294 300 312 315 319 187 337 354 409 436 293
Udaipur 30 30 22 22 23 23 25 35 21 19 23 21
Source: Various Issues of rajasthan Agricultural Statistics at a Glance, commissionerate of Agriculture, Govt. of rajasthan.

117 National Dairy Development Board
Part VII : AgricultureDairying in rajasthan - A Statistical Profile 2016
VII.4. Land Holding and Water ResourcesTable VII.4.1: Operational Holdings in Rajasthan
Size of Holding (ha)Total Holdings average Size of Holding
(ha)Number (‘000) area (‘000 ha)
Marginal (<1 ha) 2,511.5 1,237.6 0.49
Small (1-2 ha) 1,511.1 2,161.9 1.43
Semi-medium (2-4 ha) 1,335.1 3,774.4 2.83
Medium (4-10 ha) 1,127.1 6,918.4 6.14
Large (<10 ha) 403.6 7,044.1 17.45
All Classes 6,888.4 21,136.2 3.07
Source: Agricultural census Database, 2010-11, Ministry of Agriculture and Farmers Welfare, Govt. of India.
Table VII.4.2: Net Irrigated area under Different Sources of Irrigation(‘000 ha)
Particulars 1997-98 2000-01 2003-04 2004-05 2005-06 2006-07 2007-08 2008-09 2009-10 2010-11 2011-12 2012-13
Net Irrigated Area
5,421 4,907 5,239 5,880 6,294 6,496 6,444 6,245 5,850 6,661 7,122 7,499
Gross Irrigated Area
6,676 6,135 6,393 7,093 7,818 7,958 8,088 7,910 7,309 8,322 8,903 9,455
Net Sown Area
17,075 15,865 17,394 16,549 16,836 16,764 17,096 17,551 16,974 18,349 18,034 17,479
Gross Sown Area
22,325 19,230 21,664 21,062 21,699 21,534 22,208 22,771 21,745 26,002 24,505 23,954
Sources (net irrigated area)
Canals 1,525 1,354 1,314 1,457 1,706 1,703 1,688 1,583 1,424 1,629 1,844 1,901
Tanks 182 38 60 82 77 131 102 31 17 56 69 92
Wells and Tube Wells
3,657 3,473 3,810 4,267 4,427 4,581 4,572 4,559 4,338 4,897 5,111 5,382
Other Sources 57 42 55 73 85 81 83 73 71 79 98 125
Source: Directorate of economics and Statistics, Ministry of Agriculture and Farmers Welfare, Govt. of India.

118National Dairy Development Board
Part VII : AgricultureDairying in rajasthan - A Statistical Profile 2016

119 National Dairy Development Board
Part VII : AgricultureDairying in rajasthan - A Statistical Profile 2016
VII.4. Land Holding and Water ResourcesTable VII.4.3: Major River basins of Rajasthan
Name of the River Origin length
(km)Catchment area
(sq km) States Falling in the Catchment area
Indus Mansarovar (Tibet) 1,114 + 321,289 +J&K, Punjab, Himachal Pradesh, Rajasthan and
Chandigarh UT
Ganga Gangotri 2,525 + 861,452 +Uttaranchal, Uttar Pradesh, Himachal Pradesh,
Haryana, Rajasthan, Madhya Pradesh, Bihar, West Bengal and Delhi UT
Sabarmati Aravalli Hills (Rajasthan) 371 21,674 Rajasthan and Gujarat
Mahi Dhar (Madhya Pradesh) 583 34,842 Rajasthan, MP and Gujarat
Source: Hydrology and Water resources Information System for India, National Institute of Hydrology, roorkee.

120National Dairy Development Board
Part VII : AgricultureDairying in rajasthan - A Statistical Profile 2016
VII.5. RainfallTable VII.5.1: District- wise average annual Rainfall
Districtsaverage annual Rainfall (mm)
2004 - 2010 2011 2012 2013 2014RaJaSTHaN 525 745 605 734 592
Ajmer 456 651 612 556 561
Alwar 617 635 595 661 432
Banswara 957 1,101 1,087 1,058 720
Baran 688 1,476 737 1,502 1,120
Barmer 325 452 223 405 220
Bharatpur 583 740 725 550 486
Bhilwara 615 720 642 690 748
Bikaner 267 351 318 301 272
Bundi 536 798 596 895 753
Chittaurgarh 796 849 760 925 839
Churu 351 650 428 465 477
Dausa 545 791 793 827 653
Dhaulpur 616 629 776 1,011 550
Dungarpur 785 956 930 955 646
Ganganagar 238 253 314 213 346
Hanumangarh 254 388 247 349 352
Jaipur 501 682 636 644 574
Jaisalmer 221 308 225 237 112
Jalor 438 626 283 608 355
Jhalawar 742 1,233 689 1,437 878
Jhunjhunun 427 652 457 484 463
Jodhpur 267 398 348 493 338
Karauli 603 667 749 832 584
Kota 723 1,197 637 1,189 815
Nagaur 321 406 497 499 444
Pali 404 638 505 537 538
Pratapgarh 542 1,264 1,038 1,271 763
Rajsamand 577 722 602 691 558
Sawai Madhopur 392 829 699 938 729
Sikar 862 588 639 515 511
Sirohi 453 1,304 799 953 720
Tonk 710 811 667 790 1,254
Udaipur 456 848 702 746 737
Source: Hydromet Division, India Meteorological Department, Govt. of India and Integrated Sample Survey reports, Department of Animal Husbandry, Govt. of rajasthan.

121 National Dairy Development Board
Part VII : AgricultureDairying in rajasthan - A Statistical Profile 2016
Status of Ground Water (% of Blocks)
Safe Semi-critical Critical Over-exploited Saline
2004 2011
Groundwater Status in Rajasthan
2004 2009
Source: Dynamic Ground Water resources of India (2004-2011), central Ground Water Board, Ministry of Water resources, river Development & Ganga rejuvenation, Govt. of India.
59%
14%
6%
21%
71%
10%
8%
1%
10%
Safe Semi-critical Critical Over-exploited

122National Dairy Development Board
Part VII : AgricultureDairying in rajasthan - A Statistical Profile 2016
VII.5. RainfallTable VII.5.2: Distribution of blocks according to ground water status
DistrictsNumber of blocks under
SalineSemi-critical Critical Over-exploited
2004 2009 2011 2004 2009 2011 2004 2009 2011 2011RaJaSTHaN 14 16 20 50 25 24 140 166 172 2
Ajmer 2 6 8 8
Alwar 1 13 14 14
Banswara 6 1 1 1
Baran 1 1 1 1 1 2 2 5
Barmer 2 2 2 5 5 5
Bharatpur 1 1 2 4 3 4 5
Bhilwara 3 2 8 11 11
Bikaner 1 1 2 3 3 1
Bundi 1 2 1 2 3 3
Chittaurgarh 1 13 11 11
Churu 2 1 1 2 2 1
Dausa 5 5 5
Dhaulpur 1 1 2 4 3
Dungarpur 2 4 4 2
Ganganagar
Hanumangarh
Jaipur 1 2 1 11 12 12
Jaisalmer 1 2 2 2
Jalor 7 7 8
Jhalawar 4 1 1 2 5 5
Jhunjhunun 7 8 8
Jodhpur 1 1 2 1 5 7 8
Karauli 1 1 1 2 3 4 3
Kota 3 3 1 4 2 2
Nagaur 1 1 2 1 2 7 9 9
Pail 1 5 3 2 5 7 7
Pratapgarh 1 1 3 3
Rajsamand 2 5 7 7
Sawai Madhopur 3 1 2 4 5
Sikar 1 7 7 7
Sirohi 3 3 2 2 2 3
Tonk 2 5 3 1 1 3 3
Udaipur 2 1 3 4 5 8 5 5
Source: Dynamic Ground Water resources of India (2004-2011), central Ground Water Board, Ministry of Water resources, river Development & Ganga rejuvenation, Govt. of India.

123 National Dairy Development Board
Part VIII : Policies and schemes for dairy development In Rajasthan
Rajasthan is the largest State of the country with extreme geo-climatic variation. The Aravali range of mountains splits the state into two geographical zones – desert on the west and forest belt on the other. The Thar desert in the far west encompasses about 60 per cent of the total land mass with thorny bushes, shrubs and xerophilious grass and is inhabited by various species of lizards and snakes. In order to counter frequent draughts, many rural household in Rajasthan keep animals and the State ranks second in milk production in the country.
Old, unproductive, infirm bovine are often deserted by their owners and to manage them numerous Gaushalas have been established in Rajasthan. Under the “The Rajasthan Gaushala Act” enacted as early as 1960, the Central as well as the State government are assisting these Gaushalas. To date, about 1,300 Gaushala have been registered under this act.

124National Dairy Development Board
Part VIII : Policies and schemes for
dairy development in Rajasthan
Dairying in rajasthan - A Statistical Profile 2016
To facilitate organised cattle trading, “The Rajasthan State Cattle Fair Act & Rules” was enacted in 1963 recognising 11 state level cattle fairs. The College of Veterinary and Animal Science was established in Bikaner in 1954 to provide veterinary care and animal health support which, in turn, culminated into the Rajasthan University of Veterinary and Animal Science (RAJUVAS) in 2010. Dairy development was initiated by the state government in the early seventies under the auspices of Rajasthan State Dairy Development Corporation (RSDDC) registered in 1975. Two years later, the Rajasthan Cooperative Dairy Federation (RCDF) was set up to assume responsibility for many of the functions of RSDDC. RCDF became the nodal agency for implementation of Operation Flood and other dairy development programmes in Rajasthan. The State has enacted “Rajasthan Go-Seva Ayog Act” and has a separate ministry for the protection of cow.
The main programmes and schemes for dairy development in Rajasthan can be classified into two categories viz.I. Central Schemes;II. States Schemes;
ANIMAL HUSBANDRY & DAIRY DeveLopMeNt
I. CeNtRAL SCHeMeS FoR ANIMAL HUSBANDRY DeveLopMeNt (BUDGet HeAD 2403 – AH)
National Livestock Health and Disease Control programme (LH & DC)A.1 Assistance to States for Control of animal
disease (ASCAD)This Centrally Sponsored Scheme aimed to control livestock diseases through mass vaccination and by creating awareness on diseases. Under the scheme, assistance is provided to State for the control of economically important diseases of livestock and poultry by way of immunization, strengthening of existing State Veterinary Biological Production Units, strengthening of existing State Disease Diagnostic Laboratories, holding workshops/ seminars and in-service training to Veterinarians and Para-veterinarians. The programme is being implemented on 60:40 sharing basis. 100 per cent assistance is provided to States for training and seminar/workshops. Besides this, the programme monitor and compile information on incidence of various livestock diseases.
A.2 National project on Rinderpest Surveillance & Monitoring (NpRSM)
It is a 100 per cent centrally sponsored project launched w.e.f. May, 1992 to combat highly infection viral “Rinderpest” disease of Cloven footed Animals (generally called cattle plague). Although OIE has declared India free from the Rinderpest disease as well as infection, continuous sero/monitoring and sero-surveillance is done to maintain country’s disease/infection free status.
A.3 professional efficiency Development (peD) For improvement in the efficiency of Veterinary professionals, 50 per cent Central Assistance is provided to the States. Funds are provided to State Veterinary councils for imparting training on latest technical knowledge through Continuing Veterinary Education (CVE).

125 National Dairy Development Board
Part VIII : Policies and schemes for dairy
development in Rajasthan
Dairying in rajasthan - A Statistical Profile 2016
A.4 Foot & Mouth Control programme (FMD-Cp) To prevent economic losses due to Foot and Mouth Disease and to develop herd immunity in cloven-footed animals, a ‘Foot and Mouth Disease Control Programme (FMD-CP)’ was initiated in the country to create several FMD-free zones. During 2014-15, the funding has been revised to 60:40 from 100 per cent central assistance in the previous years.
A.5 establishment & Strengthening of existing veterinary Hospitals and Dispensaries (eSvHD)
Under this programme, GoI funds were used for establishment of 85 new veterinary hospitals in Rajasthan and repair and renovation of 150 existing hospitals or dispensaries. The expenses were shared between GoI and States in 50:50 ratio.
A.6 National Animal Disease Reporting System (NADRS)
The GoI has put in place an information technology based pan-India animal disease monitoring system using National Informatics Centre (NIC). The GoI provides 100 per cent support to the States for meeting expenditure on monitoring animal diseases and dissemination of information. In Rajasthan, even Animal Disease Diagnostic Laboratories are linked with NADRS to initiate preventive and curative action in a timely and speedy manner.
A.7 Brucellosis Control programme (Brucellosis-Cp)
Brucellosis is a critical diseases affecting reproductive system of livestock. It induces infertility and abortions, resulting in interrupted lactation and reduced production of milk. Bovine brucellosis is endemic in all states of India. It can be prevented over a period of time by one time vaccination of all eligible female calves. GoI is providing 60 per cent assistance to Rajasthan for mass screening of cattle & buffaloes to ascertain exact incidence of the disease in specific location and to vaccinate all female calves between 6-8 months in these specific areas.
National Livestock Management programme (earlier National Livestock Mission)B.1 Sub-Mission on Livestock Development GoI’s has “Risk Management & Insurance” scheme under this sub-
mission wherein it subsidizes dairy animal insurance premium upto 5 animals per household by 25 per cent, state pay 25 per cent and balance is borne by the beneficiary (50 per cent). This scheme is implemented across Rajasthan to protect farmers against any loss of their animal due to death.
B.2 Sub- Mission: Fodder and Feed Development Under “National Fodder Production Programme”, the State Government runs a programme of distribution of fodder seed minikit with 75 per cent Central Government Assistance so as to promote the green fodder production.
In addition, the State Government has established a Regional Station for Forage Production and Demonstration at Dudli-Bassi (Jaipur). This Station liaisons with regional Agricultural Universities, National Agriculture Research Institutes and the farmers for quickly transferring the findings of research from lab to land.
B.3 Sub- Mission: Skill Development technology transfer & extension
It strengthens regional and district training centers to deliver a range of trainings with appropriate modules, manuals, training materials, reference materials, posters, leaflets, documentary films etc. It also envisages to disseminate the information through various means like Electronic/ Print Media, Melas etc

126National Dairy Development Board
Part VIII : Policies and schemes for
dairy development in Rajasthan
Dairying in rajasthan - A Statistical Profile 2016
Animal Husbandry Statistics
C.1 Integrated Sample Survey (ISS) As per the guidelines of IASRI, it estimates the production of major livestock products in Rajasthan and study animal husbandry practices. The Central Government provides grant-in-aid on 50:50 basis towards salaries and allowance of the staff employed under the scheme.
Livestock Census
D.1 Livestock Census Since 1919, Livestock Census is conducted every five year to generate data required for planning and research activities in livestock sector. In Rajasthan, the Board of Revenue implement this scheme with 100 per cent central assistance. The 19th Livestock Census was completed in 2012 and the data was compiled at the Central level by setting up data entry centers at selected States considering the volume of work.
National programme for Bovine Breeding & Dairy Development (NpBBDD)
E.1 National programme for Bovine Breeding (NpBB)
The scheme aims to bring all breedable females under organized breeding through Artificial Insemination (AI) or Natural Service using germplasm of high genetic merits. In Rajasthan, the Rajasthan Livestock Development Board is implementing this scheme. Under its “Indigenous Breed Improvement Programme”, frozen semen of the selected bulls of specific breeds is provided for AI of selective breeding / upgradation of the animals in the respective breed tract. The breeds identified are : Gir (Ajmer), Tharparkar (Barmer), Rathi (Bikaner), Kankrej (Jalor) and Nagauri (Nagaur district).
E.2 National programme for Dairy Development (NpDD)
The “Assistance to Cooperative” component of NPDD provides grant-in-aid on 50:50 basis to bring more farmers under the dairy co-operative sector and enable them to comply with FSSAI Act, 2006, improve the facilities for testing the chemicals and microbials of milk and strengthening and modernization of infrastructure of DCS to improve procurement/marketing etc.
E.3 National Dairy plan phase-I (NDp-I) The scheme provides 100 per cent grant-in-aid for animal nutrition & breeding activities, and 50 per cent grant on cost of capital items for village milk procurement system.
II. StAteS SCHeMeS FoR ANIMAL HUSBANDRY
ANIMAL HUSBANDRY
A Bovine Breeding Considering extreme geo-climatic conditions and uncertainity of rains, the State Government has developed region specific bovine breeding policy for various agencies involved in breeding. It highlights as to which indigenous breed should be promoted for selective breeding in particular district, spells blood level of exotic breed, use of exotic semen etc.
Under Rashtriya Krishi vikas Yojana (RKvY)B Free Medicine Scheme This scheme was started in August, 2012 with the aim to ensure
availability of all necessary medicines at the veterinary institutes free of cost. Presently under this scheme 79 types of medicine are available at Veterinary Hospital level and 35 types of medicine are available at Sub-center/ Dispensary level.
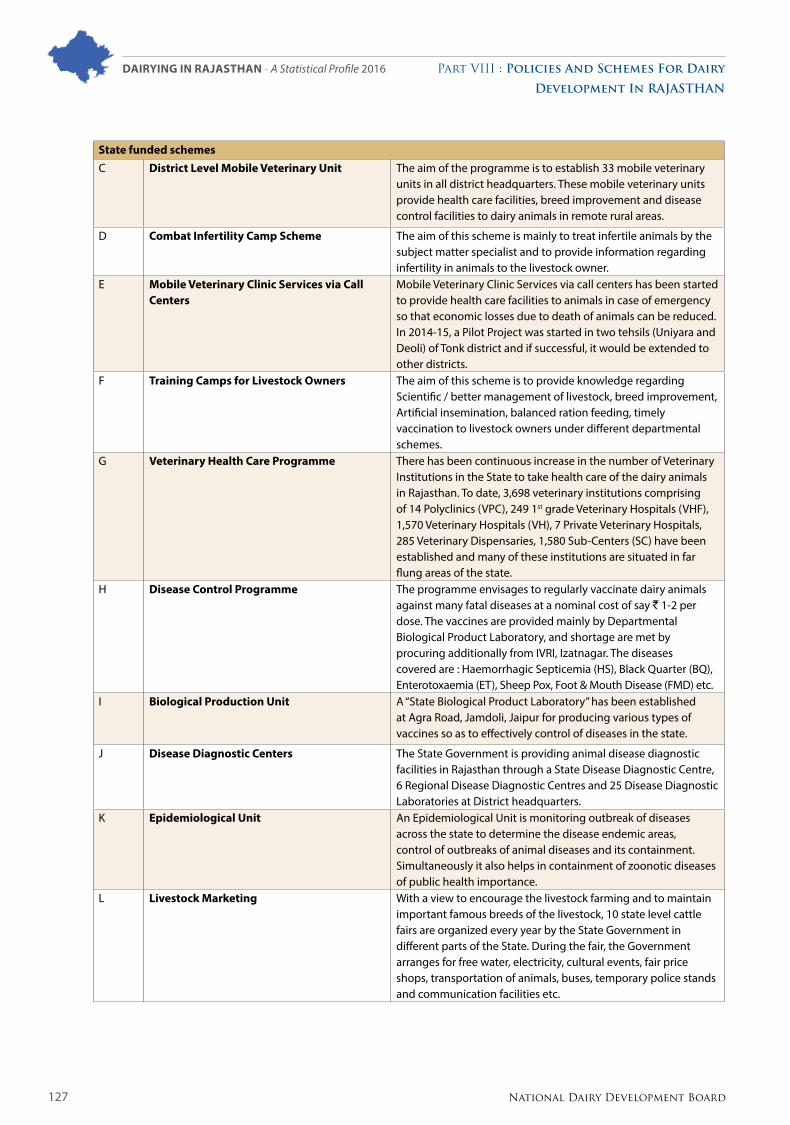
127 National Dairy Development Board
Part VIII : Policies and schemes for dairy
development in Rajasthan
Dairying in rajasthan - A Statistical Profile 2016
State funded schemesC District Level Mobile veterinary Unit The aim of the programme is to establish 33 mobile veterinary
units in all district headquarters. These mobile veterinary units provide health care facilities, breed improvement and disease control facilities to dairy animals in remote rural areas.
D Combat Infertility Camp Scheme The aim of this scheme is mainly to treat infertile animals by the subject matter specialist and to provide information regarding infertility in animals to the livestock owner.
E Mobile veterinary Clinic Services via Call Centers
Mobile Veterinary Clinic Services via call centers has been started to provide health care facilities to animals in case of emergency so that economic losses due to death of animals can be reduced. In 2014-15, a Pilot Project was started in two tehsils (Uniyara and Deoli) of Tonk district and if successful, it would be extended to other districts.
F training Camps for Livestock owners The aim of this scheme is to provide knowledge regarding Scientific / better management of livestock, breed improvement, Artificial insemination, balanced ration feeding, timely vaccination to livestock owners under different departmental schemes.
G veterinary Health Care programme There has been continuous increase in the number of Veterinary Institutions in the State to take health care of the dairy animals in Rajasthan. To date, 3,698 veterinary institutions comprising of 14 Polyclinics (VPC), 249 1st grade Veterinary Hospitals (VHF), 1,570 Veterinary Hospitals (VH), 7 Private Veterinary Hospitals, 285 Veterinary Dispensaries, 1,580 Sub-Centers (SC) have been established and many of these institutions are situated in far flung areas of the state.
H Disease Control programme The programme envisages to regularly vaccinate dairy animals against many fatal diseases at a nominal cost of say ` 1-2 per dose. The vaccines are provided mainly by Departmental Biological Product Laboratory, and shortage are met by procuring additionally from IVRI, Izatnagar. The diseases covered are : Haemorrhagic Septicemia (HS), Black Quarter (BQ), Enterotoxaemia (ET), Sheep Pox, Foot & Mouth Disease (FMD) etc.
I Biological production Unit A “State Biological Product Laboratory” has been established at Agra Road, Jamdoli, Jaipur for producing various types of vaccines so as to effectively control of diseases in the state.
J Disease Diagnostic Centers The State Government is providing animal disease diagnostic facilities in Rajasthan through a State Disease Diagnostic Centre, 6 Regional Disease Diagnostic Centres and 25 Disease Diagnostic Laboratories at District headquarters.
K epidemiological Unit An Epidemiological Unit is monitoring outbreak of diseases across the state to determine the disease endemic areas, control of outbreaks of animal diseases and its containment. Simultaneously it also helps in containment of zoonotic diseases of public health importance.
L Livestock Marketing With a view to encourage the livestock farming and to maintain important famous breeds of the livestock, 10 state level cattle fairs are organized every year by the State Government in different parts of the State. During the fair, the Government arranges for free water, electricity, cultural events, fair price shops, transportation of animals, buses, temporary police stands and communication facilities etc.

128National Dairy Development Board
Part VIII : Policies and schemes for
dairy development in Rajasthan
Dairying in rajasthan - A Statistical Profile 2016
M Fodder Development Regional Station for Forage Production and Demonstration has been established by State Government at Dudli-Bassi (Jaipur) for seed production. This Station liaisons with regional Agricultural Universities, National Agriculture Research Institutes so that the finding are implemented quickly.
N Gaushala Development programme About 1,100 Gaushalas of various public trusts are registered in Rajasthan for maintaining old, infirm, unproductive cows and their progenies. These Gaushalas are also used to preserve and conserve indigenous breeds. The central government as well as state government is also assisting these Gaushalas for cattle development.
O training programmes In order to upgrade skills, regular AI training programmes are arranged at KVS, Jaipur and Jodhpur. In addition, Refresher Courses for Veterinarians are organized at RSLMTI, Jaipur.

129 National Dairy Development Board
GlossaryDairying in rajasthan - A Statistical Profile 2016
GlossaryAI : Artificial Insemination is the process of deliberate introduction of sperm into the
female reproductive tract for impregnation.
Bovine : Large ruminants like cattle, buffaloes, yak and mithun.
Breedable : Female animals that have attained the age of puberty.
Breeding Tract : Area where breeds/group of animals are found.
Calving Interval : Period between two calvings.
Castration : Technique by which males are made sterile for use in draught operations.
Crossbred : Animal produced by hybridization of two different breeds.
DM : Dry biomass available from feed and fodder.
Dry Animal : Adult animals calved at least once but not in-milk at present.
Food Grains : Cereals and pulses.
GSDP : Basic measure of a State’s overall economic performance. It represents the market value of all final goods and services made within the borders of a State in a year.
Indigenous Animals : Animals native to a particular area.
In-milk Animals : Animals which are lactating.
Irrigation Intensity : (Gross irrigated area/Net irrigated area) * 100.
Lactation Length : Number of days the animal secretes milk.
Lactation Yield : Total milk production over period of 300/305 days.
Literacy Rate : Percentage of literates in the age group above six years.
Livestock : Domesticated mammals.
Male to Female Ratio : Number of males to females.
Milch Animals : Sum of in-milk and dry animals.
Milk Utilisation Pattern : Quantities of milk retained for home consumption in liquid form, retained for product conversion and milk sold by the milk producers.
Marginal Holdings : Farmers possessing less than one hectare of operational holding.
Small Holdings : Greater than one hectare and less than two hectare of operational holding.
Semi Medium : Greater than two and less than four hectare of operational holding.
Medium Holdings : Are more than four and less than ten hectare of operational holding.
Large Holdings : Are those larger than ten hectare of operational holding.
Population Density : Number of human beings/animals per square km of geographical area.
Poultry : All categories of chicken, guinea fowls, turkey, ducks and quails.
Sex Ratio : Number of females to 1,000 males in a population.
Small Ruminants : Sum of sheep and goats.
Urbanisation : Per cent of urban population to total population.
Wet to Dry Ratio : Number of in-milk to dry animals.


National Dairy Development BoardPB No 40, Anand 388 001
Telephone: (02692) 260148/260149/260160Fax: (02692) 260157
E-mail: [email protected]: www.nddb.coop