national economic survey of iraq 1 the agriculture survey part 1 november 21, 2004
TRANSCRIPT

1
National Economic Survey of Iraq
The Agriculture Survey
Part 1
November 21, 2004
2
National Economic Survey of Iraq
The Agriculture survey done to build up a data base for Agriculture in Iraq .
It is the only source of information after the war.
It is a unique source for policy making and testing hypothesis.
It shows the great opportunities to invest in agriculture.
The Agriculture Survey

3
National Economic Survey of Iraq
Overview
70% of farm land is state owned.
Farming characterized by large input subsidies.
Low productivity (30% of possible productivity according to Mosul study).
Significant salinity and calcinate problems stem from water quality issues on irrigated land.
4
National Economic Survey of Iraq
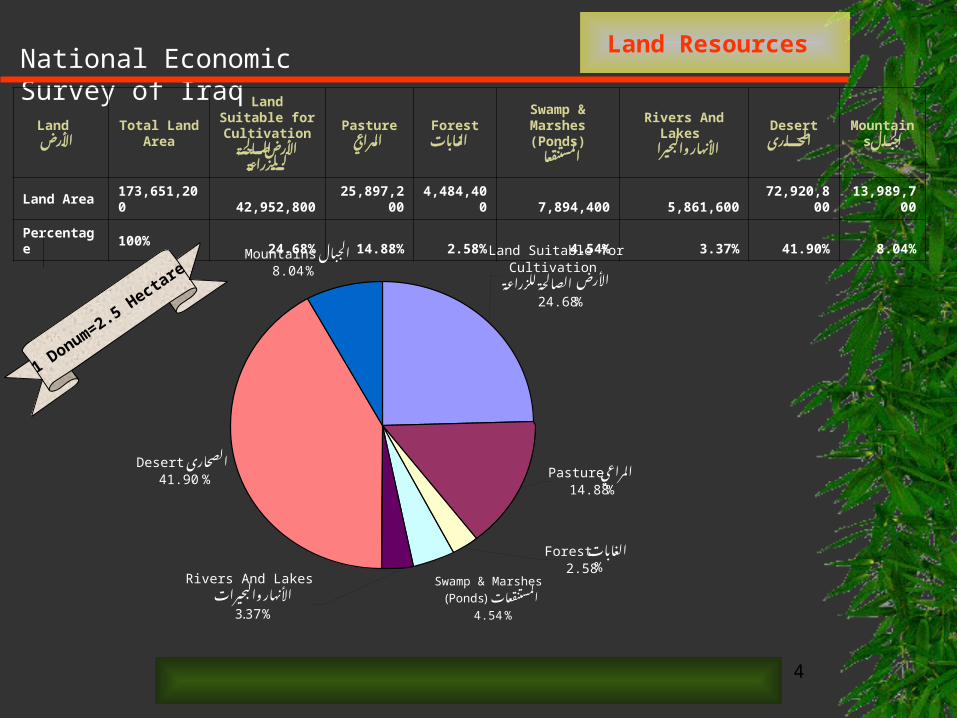
Land Resources
Land األرض
Total Land Area
Land Suitable for Cultivation
الصالحة األرضللزراعة
Pasture المراعي
Forest الغابات
Swamp & Marshes (Ponds)
المستنقعا
Rivers And Lakes
والبحيرا األنهار
Desert الصحارى
Mountains الجبال
Land Area 173,651,200 42,952,800 25,897,200 4,484,400 7,894,400 5,861,600 72,920,800 13,989,700
Percentage 100% 24.68% 14.88% 2.58% 4.54% 3.37% 41.90% 8.04%
1 Donum=2.5 H
ectare
Desert الصحارى 41.90 %
Mountains الجبال8.04 %
Land Suitable for Cultivation
األرض
للزراعة الصالحة24.68%
Forest الغابات2.58%
Swamp & Marshes
(Ponds المستنقعات (4.54 %
Rivers And Lakes والبحيرات األنهار
3.37%
Pasture المراعي 14.88%
5
National Economic Survey of Iraq
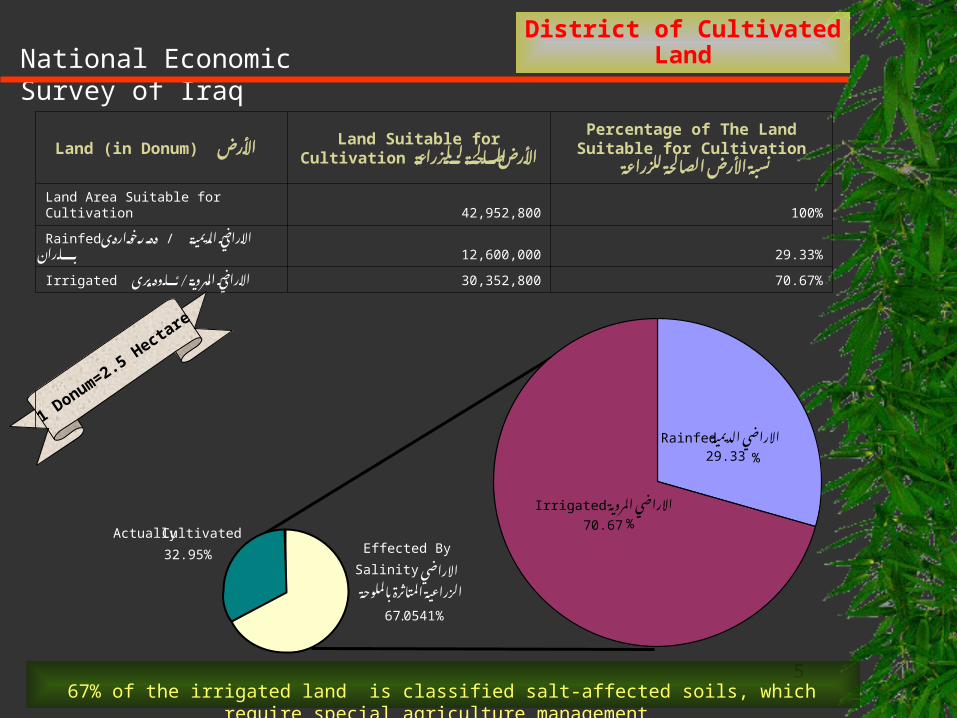
District of Cultivated Land
Land (in Donum) األرض Land Suitable for Cultivation
للزراعة الصالحة األرض
Percentage of The Land Suitable for Cultivation
للزراعة الصالحة األرض نسبة
Land Area Suitable for Cultivation 42,952,800 100%
Rainfed الديمية رخواردى / االراضي دهباران 12,600,000 29.33%
Irrigated / ئاوديرى المروية 30,352,800 االراضي 70.67%
1 Donum=2.5 H
ectare
Rainfed الديمية االراضي29.33 %
Irrigated المروية االراضي
70.67 %Actually Cultivated
32.95% Effected By
Salinity االراضي
بالملوحة المتاثرة الزراعية
67.0541%
67% of the irrigated land is classified salt-affected soils, which require special agriculture management
6
National Economic Survey of Iraq
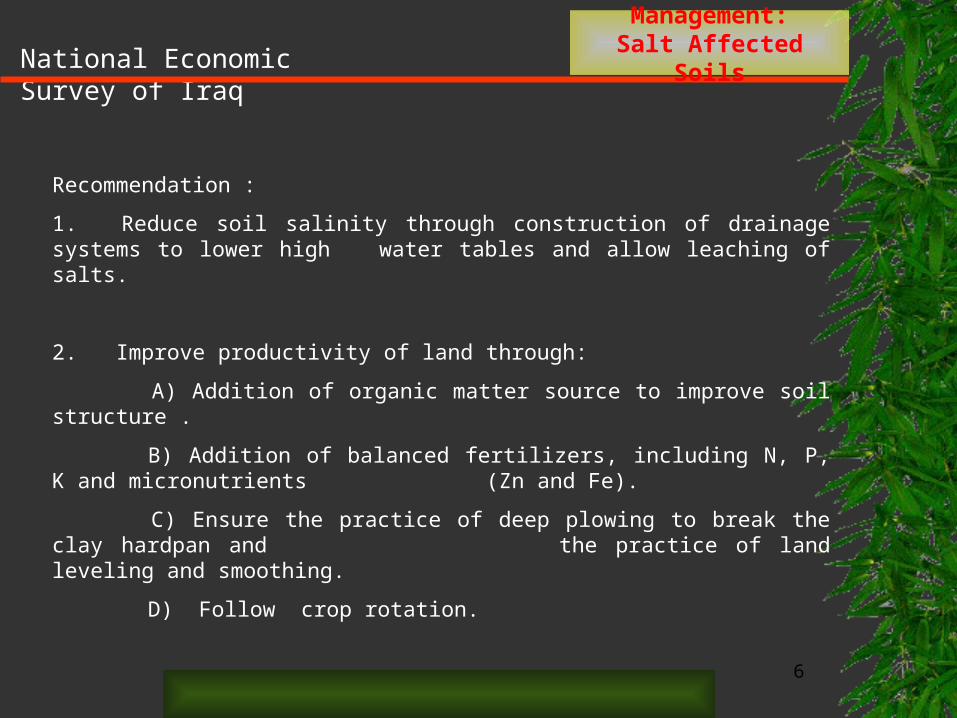
Management:Salt Affected Soils
Recommendation :
1. Reduce soil salinity through construction of drainage systems to lower high water tables and allow leaching of salts.
2. Improve productivity of land through:
A) Addition of organic matter source to improve soil structure .
B) Addition of balanced fertilizers, including N, P, K and micronutrients (Zn and Fe).
C) Ensure the practice of deep plowing to break the clay hardpan and the practice of land leveling and smoothing.
D) Follow crop rotation.
7
National Economic Survey of Iraq
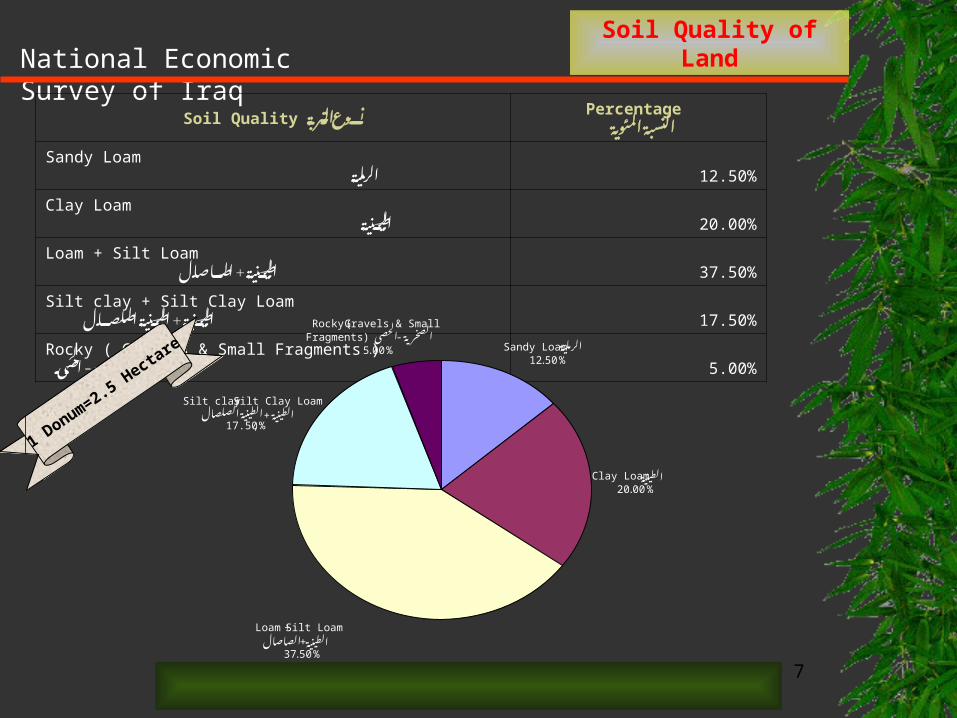
Soil Quality التربة نوعPercentage
المئوية النسبة
Sandy Loam الرملية 12.50%
Clay Loam الطينية 20.00%
Loam + Silt Loam + الطينيةالصاصال 37.50%
Silt clay + Silt Clay Loam + الطينية الطينيةالصلصال 17.50%
Rocky ( Gravels & Small Fragments ) - الحصى الصخرية 5.00%
Soil Quality of Land
1 Donum=2.5 H
ectare Sandy Loam الرملية 12.50%
Clay Loam الطينية 20.00%
Loam + Silt Loam
الصاصال + الطينية
37.50%
Silt clay + Silt Clay Loam + الطينية
17.50, الصلصال الطينية
%
Rocky ( Gravels & Small Fragments ) الصخرية -الحصى
5.00%
8
National Economic Survey of Iraq
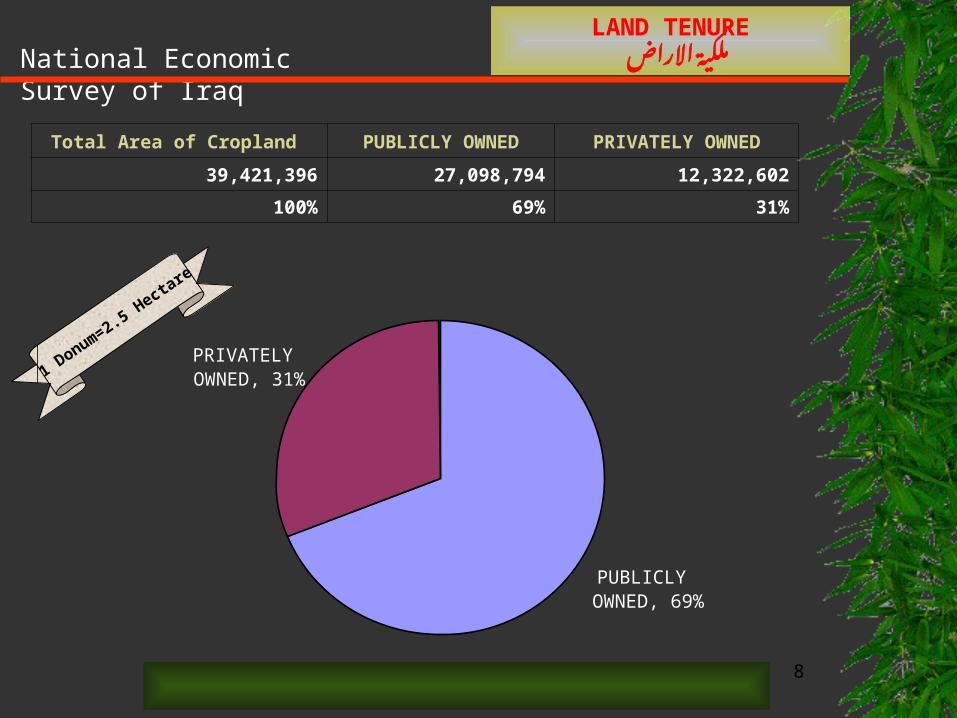
LAND TENUREاالراض ملكية
Total Area of Cropland PUBLICLY OWNED PRIVATELY OWNED
39,421,396 27,098,794 12,322,602
100% 69% 31%
1 Donum=2.5 H
ectare
PUBLICLY OWNED, 69%
PRIVATELY OWNED, 31%
9
National Economic Survey of Iraq
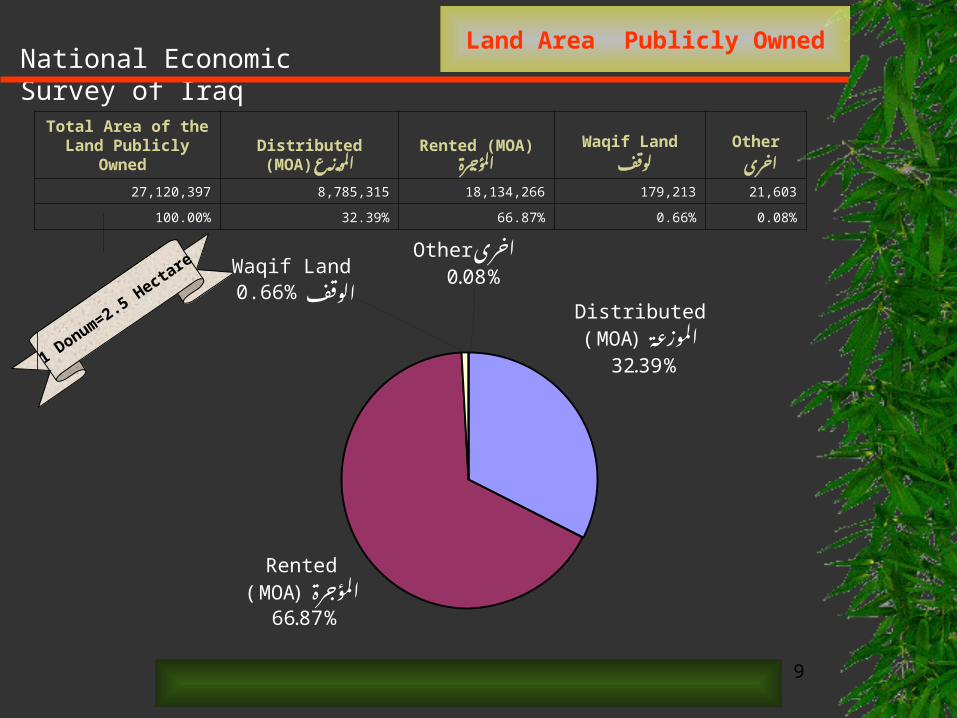
Land Area Publicly Owned
Total Area of the Land Publicly Owned
Distributed (MOA) الموزع
Rented (MOA) المؤجرة
Waqif Land
لوقف Other
اخرى
27,120,397 8,785,315 18,134,266 179,213 21,603
100.00% 32.39% 66.87% 0.66% 0.08%
1 Donum=2.5 H
ectareOther اخرى
Distributed (MOA) الموزعة
32.39%
Waqif Land
الوقف
0.66%
Rented (MOA) المؤجرة
66.87%
0.08%

10
National Economic Survey of Iraq
Land Suitable for Cultivation
1 Donum=2.5 Hectare
Governorate / المحافظةناوجه
Nassiriya الناصرية
Muthanna مثنى
Amara العمارة
Basra البصرة
KutكوتBabylon
بابلDiwaniya ديوانية
Najaf النجف Karbala كربالء
Baghdaبغدادd
ديالىDialah
Anbar أنبارTikrit تكريت
Erbil اربيلSuleimaniyaال
سليمانية دهوكDahuk
Tamim التأميم
Ninevah نينوى
Land Suitable for Cultivation األرض
للزراعة زه / الصالحةكال كشتو وى
3360738 1291826 1701852 1225611 3260677 1117777 2778958 618782 421314 109645 3913415 1271566 4120658 2297400 2200100 552357 3154530 8199037
65.13% 6.24% 26.47% 16.07% 47.52% 54.59% 85.21% 5.37% 20.92% 6.02% 55.32% 2.31% 42.28% 38.10% 32.31% 21.07% 81.48% 54.92%
Cropland األراضيوى / المزروعة زه
كالكراوه كشتو
1561593 887817 1150663 515283 2979942 1085761 2224466 617653 421314 108301.5 3777172 1074322 3764075 1125560 1774400 94439.2 2104888 7693814
30.26% 4.29% 17.90% 6.76% 43.43% 53.03% 68.21% 5.36% 20.92% 5.94% 53.40% 1.95% 38.62% 18.67% 26.06% 3.63% 54.37% 51.54%
0.00%
10.00%
20.00%
30.00%
40.00%
50.00%
60.00%
70.00%
80.00%
90.00%
Land Suitable forCultivation األرض
الصالحةللزراعة / زهوى كال كشتو
Cropland األراضيالمزروعة / زهوىكشتو
كالكراوه

11
National Economic Survey of Iraq
Land Area Publicly Owned
Total Area of the Land Publicly Owned
Distributed (MOA) الموزع
Rented (MOA) المؤجرة
Waqif Land
لوقف Other
اخرى
27,120,397 8,785,315 18,134,266 179,213 21,603
100.00% 32.39% 66.87% 0.66% 0.08%
1 Donum=2.5 H
ectareOther اخرى
Distributed (MOA) الموزعة
32.39%
Waqif Land
الوقف
0.66%
Rented (MOA) المؤجرة
66.87%
0.08%

12
National Economic Survey of Iraq
CropsHarvested
Output (In Ton) بالطن االنتاج
Wheat 2,134,199.2
Barley 1,149,859.6
Maize 580,531.4
Sorghum 39,187
Rice, Paddy, Regular 200,869
Cotton 115,511
Sunflowers 39,709.6
Crop Production
Wheat , 2134199.2
Barley , 1149859.6
Sorghum , 39187
Rice, Paddy, Regular , 200869
Cotton, 115511 Sunflowers , 39709.6
Maize , 580531.4
13
National Economic Survey of Iraq
Crops Year 1985
Year 1986
Year 1987
Year 1988
Year 1989
Year 1990
Year 1991
Year 1992
Year 1993
Year 1994
Year 1995
Year 1996
Year 1997
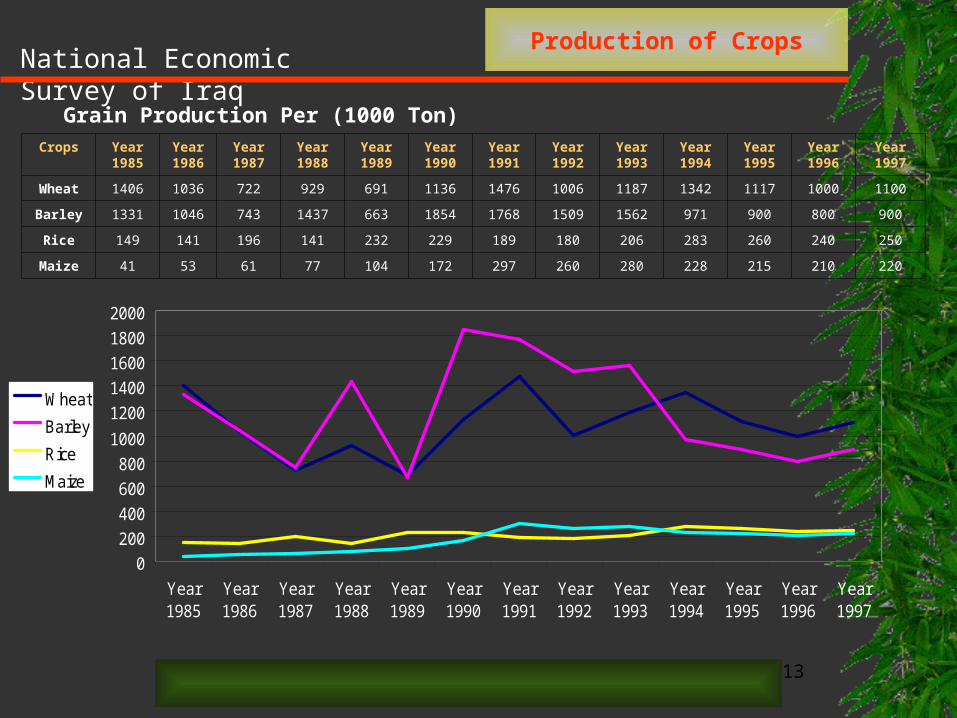
Wheat 1406 1036 722 929 691 1136 1476 1006 1187 1342 1117 1000 1100
Barley 1331 1046 743 1437 663 1854 1768 1509 1562 971 900 800 900
Rice 149 141 196 141 232 229 189 180 206 283 260 240 250
Maize 41 53 61 77 104 172 297 260 280 228 215 210 220
Production of Crops
0
200
400
600
800
1000
1200
1400
1600
1800
2000
Year1985
Year1986
Year1987
Year1988
Year1989
Year1990
Year1991
Year1992
Year1993
Year1994
Year1995
Year1996
Year1997
Wheat
Barley
Rice
Maize
Grain Production Per (1000 Ton)

14
National Economic Survey of IraqHarvested Output
(In Ton)بالطن االنتاج
Total المجموع
Beans, Broad 11,032
Beans, String 74,390
Green Beans 163,827
Cabbages 22,713
Carrots 30,979
Cauliflower 45,059
Melon 20,986
Iraqi Squash 60,282
Round Squash (intl) 157,400
Cover Squash 90,425
Beet 23,090
Green Pepper 79,909
Onions 182,445
Lettuce 169,172
Okra 344,266
Potato 774,638
Water Melon 586,338
Tomatoes 1,400,328
Eggplant 527,512
Cucumber 480,331
Production of Crops
Potato , 774638
Water Melon , 586338
Tomatoes , 1400328
Eggplant , 527512
Melon , 20986
Cauliflowers , 45059
Carrots 30979Cabbages 22713
Iraqi Squash , 60282
Round Squash (intl) , 157400
Cover Squash , 90425
Beet , 23090
Green Pepper , 79909
Green Beans , 163827
Beans, Broad , 11032
Beans, String , 74390
Cucumber , 480331
Lettuce , 169172
Okra , 344266
Onions , 182445
15
National Economic Survey of Iraq
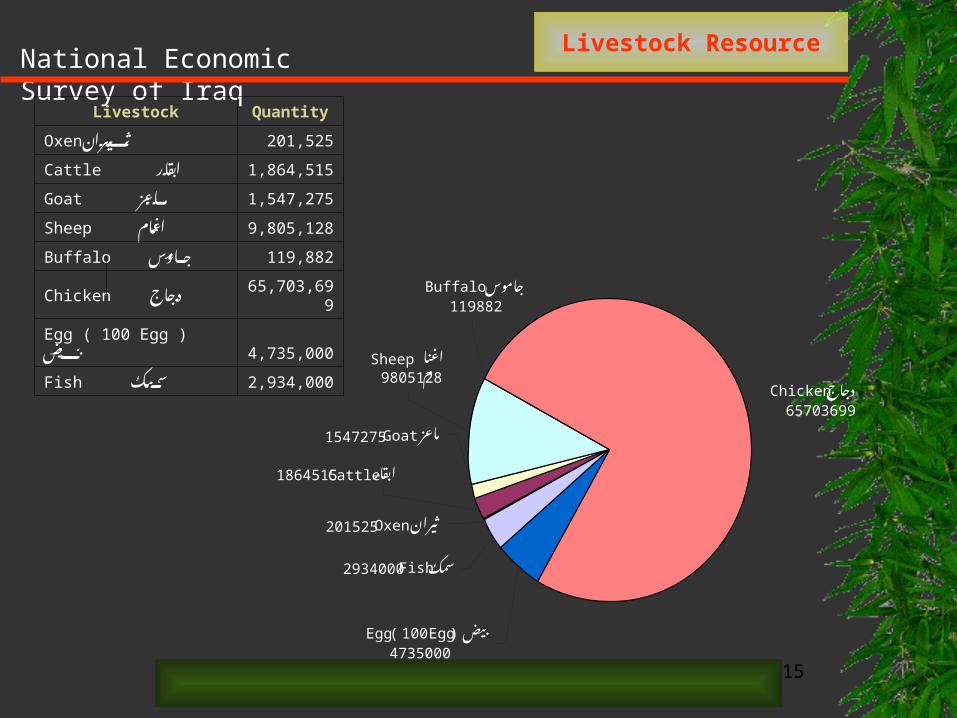
Livestock Quantity
Oxen 201,525 ثيران
Cattle ابقار 1,864,515
Goat ماعز 1,547,275
Sheep اغنام 9,805,128
Buffalo جاموس 119,882
Chicken 65,703,699 دجاج
Egg ( 100 Egg ) بيض 4,735,000
Fish سمك 2,934,000
Livestock Resource
Chicken دجاج 65703699
Oxen 201525 ثيران
Cattle 1864515 ابقار
Fish 2934000 سمك
Egg ( 100 Egg ) بيض4735000
Buffalo جاموس119882
Sheep اغنا9805128 م
Goat 1547275 ماعز

16
National Economic Survey of IraqLivestock Year
1985Year 1986
Year 1987
Year 1988
Year 1989
Year 1990
Year 1991
Year 1992
Year 1993
Year 1994
Year 1995
Year 1996
Year 1997
Year 1998
Year 1999
Sheep 9400 9300 9150 9000 8800 8631 5800 5600 5400 5150 5100 5000 5000 4800 4600
Goat 1850 1700 1600 1500 1400 1350 1070 960 800 650 500 350 350 330 310
Buffalo 160 160 155 150 145 140 105 95 90 85 80 75 75 70 65
Camels 68 66 63 61 60 59 14 13 13 13 13 13 13 12 12
Cattle 1648 1638 1618 1580 1550 1520 1150 1130 1100 1050 1030 1000 1000 950 950
0
1000
2000
3000
4000
5000
6000
7000
8000
9000
10000
Year1985
Year1986
Year1987
Year1988
Year1989
Year1990
Year1991
Year1992
Year1993
Year1994
Year1995
Year1996
Year1997
Year1998
Year1999
Sheep
Goats
Buffalo
Camels
Cattle
Livestock’s Quantity By Time
17
National Economic Survey of Iraq
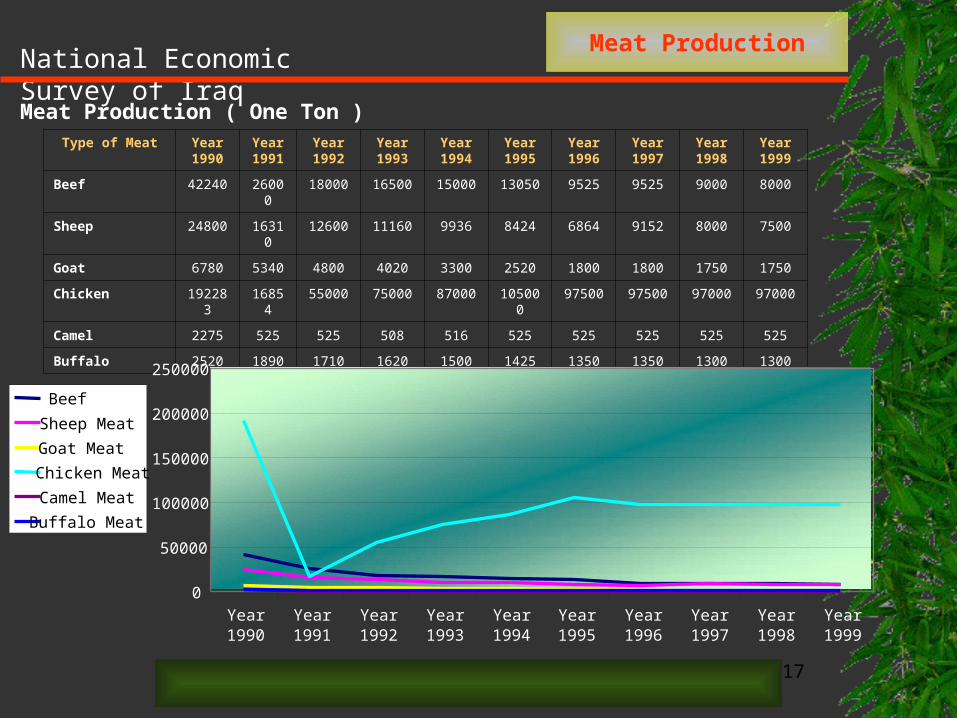
Type of Meat Year 1990
Year 1991
Year 1992
Year 1993
Year 1994
Year 1995
Year 1996
Year 1997
Year 1998
Year 1999
Beef 42240 26000 18000 16500 15000 13050 9525 9525 9000 8000
Sheep 24800 16310 12600 11160 9936 8424 6864 9152 8000 7500
Goat 6780 5340 4800 4020 3300 2520 1800 1800 1750 1750
Chicken 192283 16854 55000 75000 87000 105000 97500 97500 97000 97000
Camel 2275 525 525 508 516 525 525 525 525 525
Buffalo 2520 1890 1710 1620 1500 1425 1350 1350 1300 1300
Meat Production ( One Ton )
Meat Production
0
50000
100000
150000
200000
250000
Year1990
Year1991
Year1992
Year1993
Year1994
Year1995
Year1996
Year1997
Year1998
Year1999
Beef
Sheep Meat
Goat Meat
Chicken Meat
Camel Meat
Buffalo Meat
18
National Economic Survey of Iraq
Years Year 1985
Year 1986
Year 1987
Year 1988
Year 1989
Year 1990
Year 1991
Year 1992
Year 1993
Year 1994
Year 1995
Year 1996
Year 1997
Year 1998
Year 1999
Year 2000
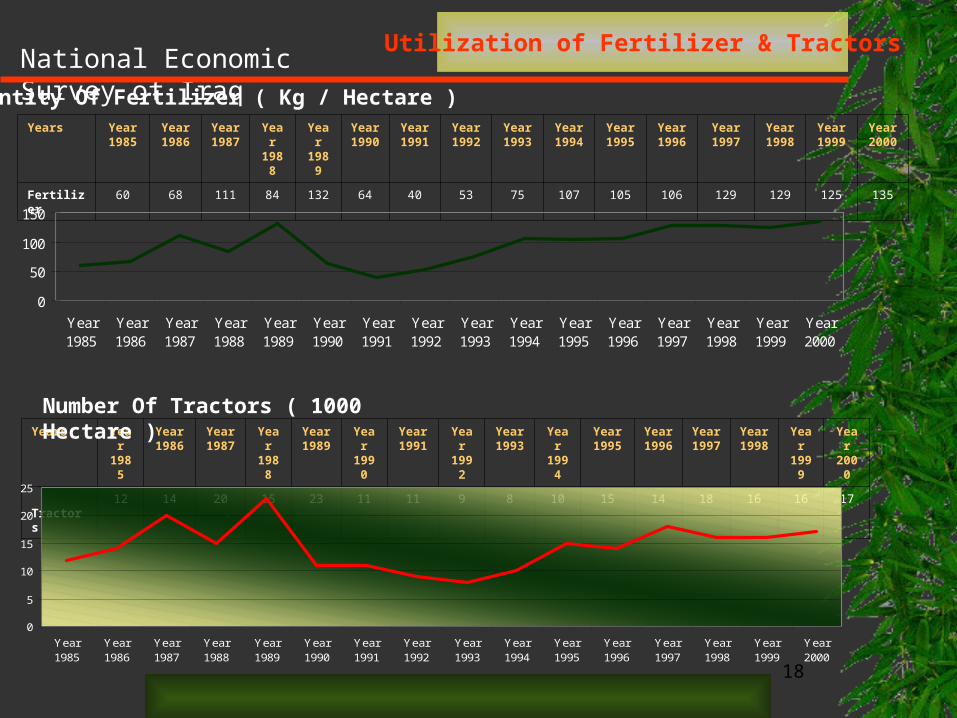
Fertilizer 60 68 111 84 132 64 40 53 75 107 105 106 129 129 125 135
Quantity Of Fertilizer ( Kg / Hectare )
0
50
100
150
Year1985
Year1986
Year1987
Year1988
Year1989
Year1990
Year1991
Year1992
Year1993
Year1994
Year1995
Year1996
Year1997
Year1998
Year1999
Year2000
Years Year 1985
Year 1986
Year 1987
Year 1988
Year 1989
Year 1990
Year 1991
Year 1992
Year 1993
Year 1994
Year 1995
Year 1996
Year 1997
Year 1998
Year 1999
Year 2000
Tractors 12 14 20 15 23 11 11 9 8 10 15 14 18 16 16 17
Number Of Tractors ( 1000 Hectare )
0
5
10
15
20
25
Year1985
Year1986
Year1987
Year1988
Year1989
Year1990
Year1991
Year1992
Year1993
Year1994
Year1995
Year1996
Year1997
Year1998
Year1999
Year2000
Utilization of Fertilizer & Tractors

19
National Economic Survey of Iraq
Countries Year 1990
Year 1991
Year 1992
Year 1993
Year 1994
Year 1995
Year 1996
Year 1997
Year 1998
Year 1999
Year 2000
Iraq 64 40 53 75 107 105 106 129 129 125 135
Syria 73 108 82 93 99 92 109 105 98 108 119
Jordan 150 183 132 246 168 128 246 224 216 205 205
Egypt 422 389 354 395 332 408 455 366 421 394 395
Iran 129 114 135 90 111 112 119 128 139 179 156
Turkey 134 126 137 157 107 121 128 130 155 167 167
America 283 302 288 338 301 335 313 316 328 344 340
Canada 96 103 112 116 133 140 131 140 145 145 145
Average Use of Fertilizer: International Comparison
Quantity Fertilizer ( Kg/ Hectare):
050
100150200250300350400450500
Year1990
Year1991
Year1992
Year1993
Year1994
Year1995
Year1996
Year1997
Year1998
Year1999
Year2000
Iraq
Syria
Jordan
Egypt
Iran
Turkey
America
Canada
20
National Economic Survey of Iraq
Countries Year 1990
Year 1991
Year 1992
Year 1993
Year 1994
Year 1995
Year 1996
Year 1997
Year 1998
Year 1999
Year 2000
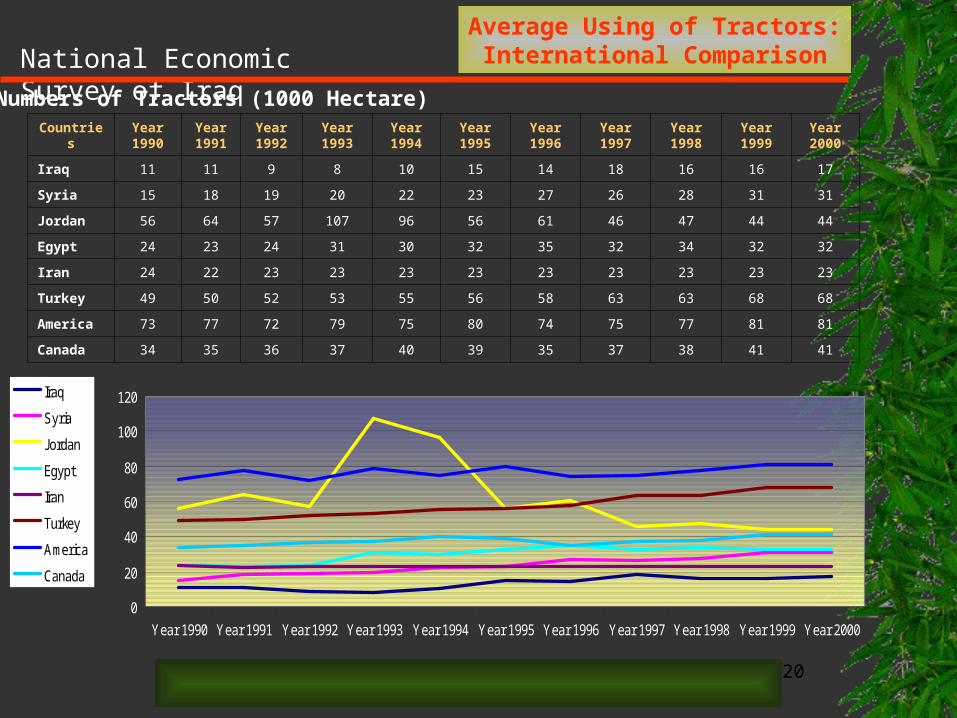
Iraq 11 11 9 8 10 15 14 18 16 16 17
Syria 15 18 19 20 22 23 27 26 28 31 31
Jordan 56 64 57 107 96 56 61 46 47 44 44
Egypt 24 23 24 31 30 32 35 32 34 32 32
Iran 24 22 23 23 23 23 23 23 23 23 23
Turkey 49 50 52 53 55 56 58 63 63 68 68
America 73 77 72 79 75 80 74 75 77 81 81
Canada 34 35 36 37 40 39 35 37 38 41 41
Average Using of Tractors: International Comparison
Numbers of Tractors (1000 Hectare)
0
20
40
60
80
100
120
Year 1990 Year 1991 Year 1992 Year 1993 Year 1994 Year 1995 Year 1996 Year 1997 Year 1998 Year 1999 Year 2000
Iraq
Syria
Jordan
Egypt
Iran
Turkey
America
Canada
21
National Economic Survey of Iraq
Remarks
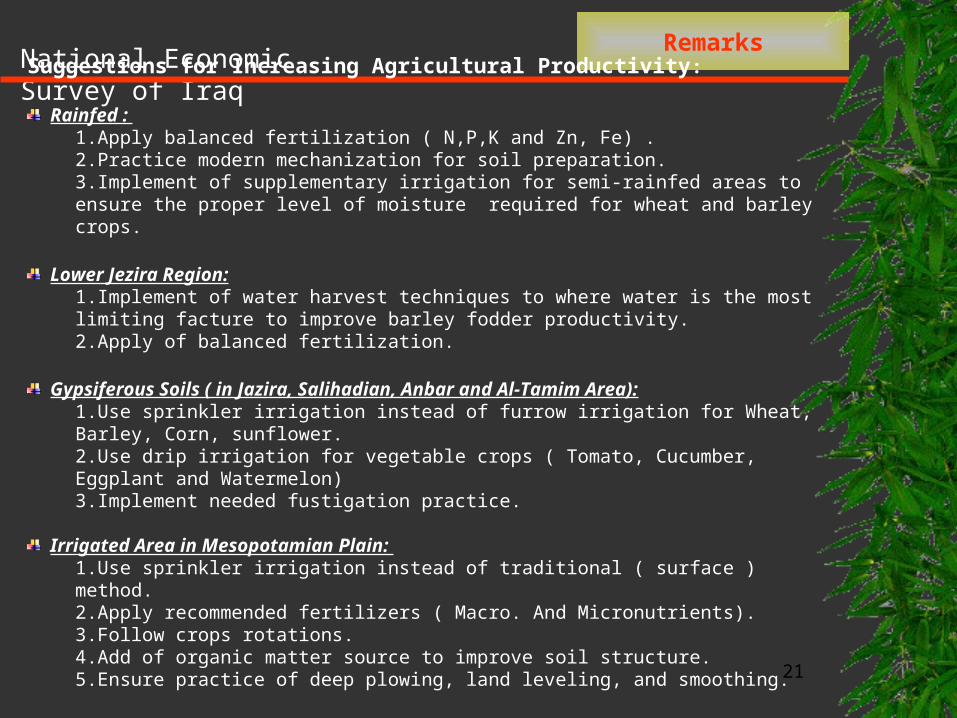
Suggestions for Increasing Agricultural Productivity:
Rainfed : 1.Apply balanced fertilization ( N,P,K and Zn, Fe) .2.Practice modern mechanization for soil preparation.3.Implement of supplementary irrigation for semi-rainfed areas to ensure the proper level of moisture required for wheat and barley crops.
Lower Jezira Region:1.Implement of water harvest techniques to where water is the most limiting facture to improve barley fodder productivity.2.Apply of balanced fertilization.
Gypsiferous Soils ( in Jazira, Salihadian, Anbar and Al-Tamim Area):1.Use sprinkler irrigation instead of furrow irrigation for Wheat, Barley, Corn, sunflower. 2.Use drip irrigation for vegetable crops ( Tomato, Cucumber, Eggplant and Watermelon) 3.Implement needed fustigation practice.
Irrigated Area in Mesopotamian Plain:
1.Use sprinkler irrigation instead of traditional ( surface ) method.2.Apply recommended fertilizers ( Macro. And Micronutrients). 3.Follow crops rotations.4.Add of organic matter source to improve soil structure.5.Ensure practice of deep plowing, land leveling, and smoothing.