national energy policy (complete) - cs.mcgill.caabatko/splitting_the_sky/documents/... · reliable,...
TRANSCRIPT

National Energy Policy
May 2001
Report of the
National Energy Policy Development Group

Reliable, Affordable, and Environmentally Sound Energy for America’s Future
Report of theNational Energy Policy Development Group
“America must have an energy policy that plans
for the future, but meets the needs of today.
I believe we can develop our natural resources
and protect our environment.”
— President George W. Bush

For Sale by the Superintendent of Documents, U.S Government Printing OfficeInternet: bookstore.gpo.gov Phone: (202) 512-1800 Fax: (202) 512-2250
Mail: Stop SSOP, Washington, DC 20402-0001ISBN 0-16-050814-2


Members of the
National Energy Policy Development Group
DICK CHENEY
The Vice President
COLIN L. POWELL
The Secretary of State
PAUL O’NEILL
The Secretary of the Treasury
GALE NORTON
The Secretary of the Interior
ANN M. VENEMAN
The Secretary of Agriculture
DONALD L. EVANS
The Secretary of Commerce
NORMAN Y. MINETA
The Secretary of Transportation
SPENCER ABRAHAM
The Secretary of Energy
JOE M. ALLBAUGH
The Director of the Federal Emergency Management Agency
CHRISTINE TODD WHITMAN
The Administrator of the Environmental Protection Agency
JOSHUA B. BOLTEN
The Assistant to the President and Deputy Chief of Staff for Policy
MITCHELL E. DANIELS
The Director of the Office of Management and Budget
LAWRENCE B. LINDSEY
The Assistant to the President for Economic Policy
RUBEN BARRALES
Deputy Assistant to the President and Director of Intergovernmental Affairs
Executive Director: Andrew D. Lundquist

12345678
Contents Taking Stock Energy Challenges Facing the United States
Striking Home The Impacts of High Energy Prices on Families, Communities, and Businesses
Protecting America’s Environment Sustaining the Nation’s Health and Environment
Using Energy Wisely Increasing Energy Conservation and Efficiency
Energy for a New Century Increasing Domestic Energy Supplies
Nature’s Power Increasing America’s Use of Renewable and Alternative Energy
America’s Energy Infrastructure A Comprehensive Delivery System
Strengthening Global Alliances Enhancing National Energy Security and International Relationships
Appendix One Summary of Report Recommendations
Appendix Two Glossary

Overview Reliable, Affordable, and Environmentally SoundEnergy for America’s Future
I n his second week in office, President George W. Bush established the National Energy Policy Development Group, directing it to “develop a national energy policy designed to
help the private sector, and, as necessary and appropriate, State and local governments, promote dependable, affordable, and environmentally sound production and distribution of energy for the future.” This Overview sets forth the National Energy Policy Development (NEPD) Group’s findings and key recommendations for a National Energy Policy.
Figure 1 Growth in U.S. Energy Consumption Is Outpacing Production (Quadrillion Btus) 140
120
100
80
60
America in the year 2001 faces the most serious energy shortage since the oil embargoes of the 1970s. The effects are already being felt nationwide. Many families face energy bills two to three times higher than they were a year ago. Millions of Americans find themselves dealing with rolling blackouts or brownouts; some employers must lay off workers or curtail production to absorb the rising cost of energy. Drivers across America are paying higher and higher gasoline prices.
Californians have felt these problems most acutely. California actually began the 1990s with a surplus of electricity generating capacity. Yet despite an economic boom, a rapidly growing population, and a corresponding increase in energy needs, California did not add a single new major electric power plant during the 1990s. The result is a demand for electricity that greatly succeeds the amount available.
A fundamental imbalance between supply and demand defines our nation’s energy crisis. As the chart illustrates, if energy production increases at the same rate as during the last decade our projected energy needs will far outstrip expected levels of production.
This imbalance, if allowed to con-
Energy Production at 1990-2000 Growth Rates
Energy Consumption
Projected Shortfall
40
20
0
2000 2005 2010 2015 2020
Over the next 20 years, growth in U.S. energy consumption will increasingly outpace U.S. energy production, if production only grows at the rate of the last 10 years. ________ Sources: Sandia National Laboratories and U.S. Department of Energy, Energy Information Administration.
tinue, will inevitably undermine our economy, our standard of living, and our national security. But it is not beyond our power to correct. America leads the world in scientific achievement, technical skill, and entrepreneurial drive. Within our country are abundant natural resources, unrivaled technology, and unlimited human creativity. With forward-looking leadership and sensible policies, we can meet our fu
viii NATIONAL ENERGY POLICY

America’s expanding
economy, growing
population, and
rising standard of
living will be
sustained by our
unmatched techno
logical know-how.
ture energy demands and promote energy conservation, and do so in environmentally responsible ways that set a standard for the world.
The Challenge America’s energy challenge begins
with our expanding economy, growing population, and rising standard of living. Our prosperity and way of life are sustained by energy use. America has the technological know-how and environmentally sound 21st century technologies needed to meet the principal energy challenges we face: promoting energy conservation, repairing and modernizing our energy infrastructure, and increasing our energy supplies in ways that protect and improve the environment. Meeting each of these challenges is critical to expanding our economy, meeting the needs of a growing population, and raising the American standard of living.
We are already working to meet the first challenge: using energy more wisely. Dramatic technological advances in energy efficiency have enabled us to make great strides in conservation, from the operation of farms and factories to the construction of
buildings and automobiles. New technology allows us to go about our lives and work with less cost, less effort, and less burden on the natural environment. While such advances cannot alone solve America’s energy problems, they can and will continue to play an important role in our energy future.
The second challenge is to repair and expand our energy infrastructure. Our current, outdated network of electric generators, transmission lines, pipelines, and refineries that convert raw materials into usable fuel has been allowed to deteriorate. Oil pipelines and refining capacity are in need of repair and expansion. Not a single major oil refinery has been built in the United States in nearly a generation, causing the kind of bottlenecks that lead to sudden spikes in the price of gasoline. Natural gas distribution, likewise, is hindered by an aging and inadequate network of pipelines. To match supply and demand will require some 38,000 miles of new gas pipelines, along with 255,000 miles of distribution lines. Similarly, an antiquated and inadequate transmission grid prevents us from routing electricity over long distances and thereby avoiding regional blackouts, such as California’s.
“America must
have an energy
policy that plans
for the future,
but meets the
needs of today.
I believe we
can develop
our natural
resources and
protect our
environment.”
— President George W. Bush
Overview • Reliable, Affordable, and Environmentally Sound Energy for America’s Future ix

w chart 1 overview
Increasing energy supplies while protecting the environment is the third challenge. Even with successful conservation efforts, America will need more energy.
Renewable and alternative fuels offer hope for America’s energy future. But they supply only a small fraction of present energy needs. The day they fulfill the bulk of our needs is still years away. Until that day comes, we must continue meeting the nation’s energy requirements by the means available to us.
Estimates indicate that over the next 20 years, U.S. oil consumption will increase by 33 percent, natural gas consumption by well over 50 percent, and demand for electricity will rise by 45 percent. If America’s energy production grows at the same rate as it did in the 1990s we will face an ever-increasing gap.
Figure 2 Figure 3
U.S. Oil Consumption Will Continue to
Increases on this scale will require preparation and action today. Yet America has not been bringing on line the necessary supplies and infrastructure.
Extraordinary advances in technology have transformed energy exploration and production. Yet we produce 39 percent less oil today than we did in 1970, leaving us ever more reliant on foreign suppliers. On our present course, America 20 years from now will import nearly two of every three barrels of oil – a condition of increased dependency on foreign powers that do not always have America’s interests at heart. Our increasing demand for natural gas – one of the cleanest forms of energy – far exceeds the current rate of production. We should reconsider any regulatory restrictions that do not take technological advances into account.
Exceed Production U.S. Natural Gas Consumption Is Outpacing Production (Millions of Barrels per Day) (Trillion Cubic Feet)
Natural Gas Production at 1990-2000 Growth Rates
Projected Shortfall
Natural Gas Consumption
40
35
30
25
20
15
10
5
Oil Consumption
Oil Field Production at 1990-2000 Growth Rates
30
25
20
15
10
05
0
Projected Shortfall
2000 2005 2010 2015 2020
2000 2005 2010 2015 2020 Over the next 20 years, U.S. natural gas consumption will grow by over 50 percent. Over the next 20 years, U.S. oil consumption will grow by over 6 million barrels At the same time, U.S. natural gas production will grow by only 14 percent, if it per day. If U.S. oil production follows the same historical pattern of the last 10 grows at the rate of the last 10 years.
________years, it will decline by 1.5 million barrels per day. To meet U.S. oil demand, oil and product imports would have to grow by a combined 7.5 million barrels per Sources: Sandia National Laboratories and U.S. Department of Energy, Energy Information day. In 2020, U.S. oil production would supply less than 30 percent of U.S. oil Administration.
needs. ervie ________ Sources: Sandia National Laboratories and U.S. Department of Energy, Energy Information Administration.
x NATIONAL ENERGY POLICY

We have a similar opportunity to increase our supplies of electricity. To meet projected demand over the next two decades, America must have in place between 1,300 and 1,900 new electric plants. Much of this new generation will be fueled by natural gas. However, existing and new technologies offer us the opportunity to expand nuclear generation as well. Nuclear power today accounts for 20 percent of our country’s electricity. This power source, which causes no greenhouse gas emissions, can play an expanding part in our energy future.
The recommendations of this report address the energy challenges facing America. Taken together, they offer the thorough and responsible energy plan our nation has long needed.
Components of the National Energy Policy
The National Energy Policy we propose follows three basic principles: • The Policy is a long-term, compre
hensive strategy. Our energy crisis has been years in the making, and will take years to put fully behind us.
• The Policy will advance new, environmentally friendly technologies to increase energy supplies and encourage cleaner, more efficient energy use.
• The Policy seeks to raise the living standards of the American people, recognizing that to do so our country must fully integrate its energy, environmental, and economic policies.
Applying these principles, we urge action to meet five specific national goals. America must modernize conservation, modernize our energy infrastructure, increase energy supplies, accelerate the protection and improvement of the environment, and increase our nation’s energy security.
Modernize Conservation Americans share the goal of energy
conservation. The best way of meeting this goal is to increase energy efficiency by applying new technology – raising productivity, reducing waste, and trimming costs. In addition, it holds out great hope for improving the quality of the environment. American families, communities, and businesses all depend upon reliable and affordable energy services for their well being and safety. From transportation to communication, from air conditioning to lighting, energy is critical to nearly everything we do in life and work. Public policy can and should encourage energy conservation.
Over the past three decades, America has made impressive gains in energy efficiency. Today’s automobiles, for example, use about 60 percent of the gasoline they
Figure 4 U.S. Economy is More Energy Efficient(Energy Intensity) Primary Energy Use Quadrillion Btus
“Here we aim to
continue a path
of uninterrupted
progress in
many fields…
New technolo
gies are proving
that we can save
energy without
sacrificing our
standard of liv
ing. And we’re
going to encour
age it in every
way possible.”
— Vice President Richard B. Cheney
Energy Use at Constant 1972 E/GDP
Actual Energy Use
180
160
140
120
100
80
60
40
20
0
1950 60 70 80 90 00 10 20
Improvements in energy efficiency since the 1970s have had a major impact in meeting national energy needs relative to new supply. If the intensity of U.S. energy use had remained constant since 1972, consumption would have been about 70 quadrillion Btus (74 percent) higher in 1999 than it actually was.
________Source: U.S. Department of Energy, Energy Information Administration.
Overview • Reliable, Affordable, and Environmentally Sound Energy for America’s Future xi

“For the electric
ity we need, we
must be ambi
tious. Transmis
sion grids stand
in need of repair,
upgrading, and
expansion. . . . If
we put these con
nections in place,
we’ll go a long
way toward
avoiding future
blackouts.”
— Vice President Richard B. Cheney
did in 1972, while new refrigerators require just one-third the electricity they did 30 years ago. As a result, since 1973, the U.S. economy has grown by 126 percent, while energy use has increased by only 30 percent. In the 1990s alone, manufacturing output expanded by 41 percent, while industrial electricity consumption grew by only 11 percent. We must build on this progress and strengthen America’s commitment to energy efficiency and conservation.
The National Energy Policy builds
on our nation’s successful track record
and will promote further improvements
in the productive and efficient use of
energy. This report includes recom
mendations to:
• Direct federal agencies to take appropriate actions to responsibly conserve energy use at their facilities, especially during periods of peak demand in regions where electricity shortages are possible, and to report to the President on actions taken.
• Increase funding for renewable energy and energy efficiency research and development programs that are performance-based and cost-shared.
• Create an income tax credit for the purchase of hybrid and fuel cell vehicles to promote fuel-efficient vehicles.
• Extend the Department of Energy’s “Energy Star” efficiency program to include schools, retail buildings, health care facilities, and homes and extend the “Energy Star” labeling program to additional products and appliances.
• Fund the federal government’s Intelligent Transportation Systems program, the fuel cell powered transit bus program, and the Clean Buses program.
• Provide a tax incentive and streamline permitting to accelerate the development of clean Combined Heat and Power technology.
• Direct the Secretary of Transportation to review and provide recommendations on establishing Corporate Average Fuel Economy (CAFE) standards
with due consideration to the National Academy of Sciences study of CAFE standards to be released in July, 2001.
Modernize Our Energy Infrastructure The energy we use passes through a
vast nationwide network of generating facilities, transmission lines, pipelines, and refineries that converts raw resources into usable fuel and power. That system is deteriorating, and is now strained to capacity.
One reason for this is government regulation, often excessive and redundant. Regulation is needed in such a complex field, but it has become overly burdensome. Regulatory hurdles, delays in issuing permits, and economic uncertainty are limiting investment in new facilities, making our energy markets more vulnerable to transmission bottlenecks, price spikes and supply disruptions. America needs more environmentally-sound energy projects to connect supply sources to growing markets and to deliver energy to homes and business.
To reduce the incidence of electricity blackouts, we must greatly enhance our ability to transmit electric power between geographic regions, that is, sending power to where it is needed from where it is produced. Most of America’s transmission lines, substations, and transformers were built when utilities were tightly regulated and provided service only within their assigned regions. The system is simply unequipped for large-scale swapping of power in the highly competitive market of the 21st
century. The National Energy Policy will
modernize and expand our energy infra
structure in order to ensure that en
ergy supplies can be safely, reliably,
and affordably transported to homes
and businesses. This report includes
recommendations to:
• Direct agencies to improve pipeline safety and expedite pipeline permitting.
• Issue an Executive Order directing federal agencies to expedite permits and coordinate federal, state, and local actions necessary for energy-related project approvals on a national basis
xii NATIONAL ENERGY POLICY

in an environmentally sound manner, and establish an interagency task force chaired by the Council on Environmental Quality. The task force will ensure that federal agencies set up appropriate mechanisms to coordinate federal, state and local permitting activity in particular regions where increased activity is expected.
• Grant authority to obtain rights-ofway for electricity transmission lines with the goal of creating a reliable national transmission grid. Similar authority already exists for natural gas pipelines and highways.
• Enact comprehensive electricity legislation that promotes competition, encourages new generation, protects consumers, enhances reliability, and promotes renewable energy.
• Implement administrative and regulatory changes to improve the reliability of the interstate transmission system and enact legislation to provide for enforcement of electricity reliability standards.
• Expand the Energy Department’s research and development on transmission reliability and superconductivity.
Increase Energy Supplies A primary goal of the National Energy
Policy is to add supply from diverse sources. This means domestic oil, gas, and coal. It also means hydropower and nuclear power. And it means making greater use of non-hydro renewable sources now available.
One aspect of the present crisis is an increased dependence, not only on foreign oil, but on a narrow range of energy options. For example, about 90 percent of all new electricity plants currently under construction will be fueled by natural gas. While natural gas has many advantages, an over-reliance on any one fuel source leaves consumers vulnerable to price spikes and supply disruptions. There are several other fuel sources available that can help meet our needs.
Currently, the U.S. has enough coal to last for another 250 years. Yet very few
coal-powered electric plants are now under “As a country, construction. Research into clean coal we have technologies may increase the attractive-
demandedness of coal as a source for new generation plants. more and more
Nuclear power plants serve millions of energy. But American homes and businesses, have a de- we have not pendable record for safety and efficiency, and discharge no greenhouse gases into the
brought on line
atmosphere. As noted earlier, these facili- the supplies
ties currently generate 20 percent of all needed to meet electricity in America, and more than 40 that demand.… percent of electricity generated in 10 states
We can explorein the Northeast, South, and Midwest. Other nations, such as Japan and France, for energy, we
generate a much higher percentage of their can produce electricity from nuclear power. Yet the energy and use number of nuclear plants in America is ac- it, and we cantually projected to decline in coming years, as old plants close and none are built to re- do so with a
place them. decent regard
Enormous advances in technology for the natural have made oil and natural gas exploration environment.” and production both more efficient and more environmentally sound. Better tech- —Vice President nology means fewer rigs, more accurate Richard B. Cheneydrilling, greater resource recovery and envi-
Figure 5 Fuel Sources for Electricity Generation in 2000
Hydropower 7%
Renewables 2%
Oil 3%
Nuclear 20%
Natural Gas 16%
Coal 52%
Electricity is a secondary source of energy, generated through the consumption of primary sources. Coal and nuclear energy account for nearly 75 percent of U.S. electricity generation. ______ Source: U.S. Department of Energy, Energy Information Administration
Overview • Reliable, Affordable, and Environmentally Sound Energy for America’s Future xiii

“We will insist
on protecting
and enhancing
the environment,
showing consid
eration for the
air and natural
lands and water
sheds of our
country.”
— Vice President Richard B. Cheney
ronmentally friendly exploration. Drilling pads are 80 percent smaller than a generation ago. High-tech drilling allows us to access supplies five to six miles away from a single compact drilling site, leaving sensitive wetlands and wildlife habitats undisturbed. Yet the current regulatory structure fails to take sufficient account of these extraordinary advances, excessively restricting the environmentally safe production of energy from many known sources.
Our policy will increase and diver
sify our nation’s sources of traditional
and alternative fuels in order to furnish
families and businesses with reliable and
affordable energy, to enhance national
security, and to improve the environ
ment. This report includes recommenda
tions to:
• Issue an Executive Order directing all federal agencies to include in any regulatory action that could significantly and adversely affect energy supplies a detailed statement on the energy impact of the proposed action.
• Open a small fraction of the Arctic National Wildlife Refuge to environmentally regulated exploration and production using leading-edge technology. Examine the potential for the regulated increase in oil and natural gas development on other federal lands.
• Earmark $1.2 billion of bid bonuses from the environmentally responsible leasing of ANWR to fund research into alternative and renewable energy resources – including wind, solar, biomass, and geothermal.
• Enact legislation to expand existing alternative fuels tax incentives to include landfills that capture methane gas emissions for electricity generation and to electricity produced from wind and biomass. Extend the number of eligible biomass sources to include forest-related sources, agricultural sources, and certain urban sources.
• Provide $2 billion over 10 years to fund clean coal technology research and a new credit for electricity produced from biomass co-fired with coal.
• Direct federal agencies to streamline the
hydropower relicensing process with proper regard given to environmental factors.
• Provide for the safe expansion of nuclear energy by establishing a national repository for nuclear waste, and by streamlining the licensing of nuclear power plants.
Accelerate Protection and Improvement of the Environment
America’s commitment to environmental protection runs deep. We are all aware of past excesses in our use of the natural world and its resources. No one wishes to see them repeated. In the 21st century, the ethic of good stewardship is well established in American life and law.
We do not accept the false choice between environmental protection and energy production. An integrated approach to policy can yield a cleaner environment, a stronger economy, and a sufficient supply of energy for our future. The primary reason for that has been steady advances in the technology of locating, producing, and using energy. Since 1970, emissions of key air emissions are down 31 percent. Cars today emit 85 percent less carbon monoxide than 30 years ago. Lead emissions are down 90 percent. Lead levels in ambient air today are 98 percent lower than they were in 1970. America is using more, and polluting less.
One of the factors harming the environment today is the very lack of a comprehensive, long-term national energy policy. States confronting blackouts must take desperate measures, often at the expense of environmental standards, requesting waivers of environmental rules, and delaying the implementation of anti-pollution efforts. Shortfalls in electricity generating capacity and shortsighted policies have blocked construction of new, cleaner plants, leaving no choice but to rely on older, inefficient plants to meet demand. The increased use of emergency power sources, such as diesel generators, results in greater air pollution.
New anti-pollution technologies hold great promise for the environment. The same can be said of 21st century power generators that must soon replace older models; signifi
xiv NATIONAL ENERGY POLICY

cant new resources for land conservation efforts; and continued research into renewable energy sources. All have a place in the National Energy Policy.
The National Energy Policy will
build upon our nation’s successful track
record and will promote further improve
ments in the productive and efficient use
of energy. This report includes recom
mendations to:
• Enact “multi-pollutant” legislation to establish a flexible, market-based program to significantly reduce and cap emissions of sulfur dioxide, nitrogen oxides, and mercury from electric power generators.
• Increase exports of environmentally friendly, market-ready U.S. technologies that generate a clean environment and increase energy efficiency.
• Establish a new “Royalties Conservation Fund” and earmark royalties from new, clean oil and gas exploration in ANWR to fund land conservation efforts.
• Implement new guidelines to reduce truck idling emissions at truck stops.
Increase Energy Security. The National Energy Policy seeks to
lessen the impact on Americans of energy price volatility and supply uncertainty. Such uncertainty increases as we reduce America’s dependence on foreign sources of energy. At the same time, however, we recognize that a significant percentage of our resources will come from overseas. Energy security must be a priority of U.S. trade and foreign policy.
We must look beyond our borders and restore America’s credibility with overseas suppliers. In addition, we must build strong relationships with energy-producing nations in our own hemisphere, improving the outlook for trade, investment, and reliable supplies.
Energy security also requires preparing our nation for supply emergencies, and assisting low-income Americans who are most vulnerable in times of supply disruption, price spikes, and extreme weather.
To ensure energy security for our
nation and its families, our report in
cludes these recommendations:
• Dedicate new funds to the Low Income Home Energy Assistance Program by funneling a portion of oil and gas royalty payments to LIHEAP when oil and natural gas prices exceed a certain amount.
• Double funding for the Department of Energy’s Weatherization Assistance Program, increasing funding by $1.4 billion over 10 years.
• Direct the Federal Emergency Management Administration to prepare for potential energy-related emergencies.
• Support a North American Energy Framework to expand and accelerate cross-border energy investment, oil and gas pipelines, and electricity grid connections by streamlining and expediting permitting procedures with Mexico and Canada. Direct federal agencies to expedite necessary permits for a gas pipeline route from Alaska to the lower 48 states.
Looking Toward the Future The President’s goal of reliable, afford
able, and environmentally sound energy supplies will not be reached overnight. It will call forth innovations in science, research, and engineering. It will require time and the best efforts of leaders in both political parties. It will require also that we deal with the facts as they are, meeting serious problems in a serious way. The complacency of the past decade must now give way to swift but wellconsidered action.
Present trends are not encouraging, but they are not immutable. They are among today’s most urgent challenges, and well within our power to overcome. Our country has met many great tests. Some have imposed extreme hardship and sacrifice. Others have demanded only resolve, ingenuity, and clarity of purpose. Such is the case with energy today.
We submit these recommendations with optimism. We believe that the tasks ahead, while great, are achievable. The energy crisis is a call to put to good use the resources around us, and the talents within us. It summons the best of America, and offers the best of rewards – in new jobs, a healthier environment, a stronger economy, and a brighter future for our people.
“The goals of
this strategy are
clear: to ensure
a steady supply
of affordable
energy for
America’s homes
and businesses
and industries.”
— President George W. Bush
Overview • Reliable, Affordable, and Environmentally Sound Energy for America’s Future xv

C H A P T E R O N E
Taking StockEnergy Challenges Facing the United States
The U.S. economy depends on re
liable and affordable energy. In
the coming months, we face sev
eral serious long-term energy
challenges: electricity shortages
and disruptions in California
and the West, dramatic increases
in gasoline prices due to record
low inventories, a strained sup
ply system, and continued depen
dence on foreign suppliers.
1-1 NATIONAL ENERGY POLICY
America’s current energy challenges can be met with rapidly improving technology, dedicated leadership, and a comprehensive approach to our energy needs.
Our challenge is clear—we must use technology to reduce demand for energy, repair and maintain our energy infrastructure, and increase energy supply. Today, the United States remains the world’s undisputed technological leader; but recent events have demonstrated that we have yet to integrate 21st-century technology into an energy plan that is focused on wise energy use, production, efficiency, and conservation.
Prices today for gasoline, heating oil, and natural gas are dramatically higher than they were only a year ago. In California, homeowners, farmers, and businesses face soaring electricity prices, rolling blackouts, increasing financial turmoil, and an uncertain energy future. Our nation’s dependence on foreign sources of oil is at an all-time high and is expected to grow. Current high energy prices and supply shortages are hurting U.S. consumers and businesses, as well as their prospects for continued economic growth.
Our national energy policy must be comprehensive in scope. It must protect our environment. It must also increase our supply of domestic oil, natural gas, coal, nuclear, and renewable energy sources. Our failure over the past several years to modernize our energy infrastructure—the network of transmission lines, gas pipelines, and oil refineries that transports our energy to consumers and converts raw materials into usable fuels—is a result of the
lack of careful planning and lack of a comprehensive national energy plan. The United States faces serious energy challenges: electricity shortages and disruptions in California and elsewhere in the West, dramatic increases in gasoline prices due to record-low inventories, a strained supply system, and continued dependence on foreign suppliers. These challenges have developed from years of neglect and can only be addressed with the implementation of sound policy. There are no easy, short-term solutions.
Our increased dependence on foreign oil profoundly illustrates our nation’s failure to establish an effective energy policy. Between 1991 and 2000, Americans used 17 percent more energy than in the previous decade, while during that same period, domestic energy production rose by only 2.3 percent. While U.S. production of coal, natural gas, nuclear energy, and renewable energy has increased somewhat in recent years, these increases have been largely offset by declines in domestic oil production. As a result, America has met almost all of its increased energy demand over the past ten years with increased imports.
U.S. energy consumption is projected to increase by about 32 percent by 2020. Unless a comprehensive national energy policy is adopted, Americans will continue to feel the effects of an inadequate electrical transmission grid, a pipeline system stretched to capacity, insufficient domestic energy supply, and a regional imbalance in supply sources. It is important that we meet these challenges with a comprehensive energy plan that takes a long-term approach to meeting our energy needs.
& V
ISIT
OR
S B
UR
EA
UC
ON
VE
NT
ION
PH
ILA
DE
LP
HIA

California’s Energy Challenge Recent and looming electricity black
outs in California demonstrate the problem of neglecting energy supply. They also foretell the consequences of failing to implement a long-term energy plan for our nation as a whole. Though weather conditions and design flaws in California’s electricity restructuring plan contributed, the California electricity crisis is at heart a supply crisis.
Since 1995, California’s peak summer demand for electricity has risen by at least 5,500 megawatts (MW), while in-state generation has failed to keep pace. California’s generation shortfall did not stem from a lack of interest in building capacity. Since 1997, power producers filed applications to build an additional 14,000 MW of new capacity in California.
In addition to a lack of new generation, a crucial transmission bottleneck in the middle of the state—called Path 15— prevents power in the south from being shipped to the north during emergencies.
This year, reduced hydropower availability due to low rainfall, higher than expected unplanned plant outages, and the financial problems of California’s utilities exacerbated this growing supply–demand imbalance. As a result, California’s supply problem turned into a crisis, resulting in soaring electricity bills for homes and businesses and rolling blackouts.
In part due to the interconnected nature of the western electricity grid, California’s critical electricity shortages have helped to drive up electricity costs in the West.
Unfortunately, there are no short-term solutions to long-term neglect. It can take new power plants and transmission facilities years to site, permit, and construct. Despite expedited federal permitting, California’s emergency efforts to increase new generation by 5,000 MW by July appear to be falling short. Less than 2,000 MW of new generation is expected to be in place by summer. Even with aggressive conservation measures, peak demand this summer is projected to outstrip supply by several thousand megawatts. The California grid
operator expects more than 30 days of blackouts.
California officials have warned that the crisis may last several years. Though California’s efforts to increase generation may not suffice to prevent blackouts this summer, if continued and strengthened, they promise to limit the duration of the crisis.
Recommendations:
★ The National Energy Policy Development (NEPD) Group recommends that the President issue an Executive Order to direct all federal agencies to include in any regulatory action that could significantly and adversely affect energy supplies, distribution, or use, a detailed statement on (1) the energy impact of the proposed action, (2) any adverse energy effects that cannot be avoided should the proposal be implemented, and (3) alternatives to the proposed action. The agencies would be directed to include this statement in all submissions to the Office of Management and Budget of proposed regulations covered by Executive Order 12866, as well as in all notices of proposed regulations published in the Federal Register.
★ The NEPD Group recommends that the President direct the executive agencies to work closely with Congress to implement the legislative components of a national energy policy.
Conservation and Energy Efficiency Conservation and energy efficiency
are crucial components of a national energy plan. Energy efficiency is the ability to use less energy to produce the same amount of useful work or services. Conservation is closely related and is simply using less energy. Improved energy efficiency and conservation reduces energy consumption and energy costs, while maintaining equivalent service in our homes, offices, factories, and automobiles. Greater energy
1-3 NATIONAL ENERGY POLICY

efficiency helps the United States reduce energy efficiency is projected to continue to imenergy imports, the likelihood of energy prove between 2000 and 2020. A decrease in deshortages, emissions, and the volatility of mand from 1.8 percent to 1.5 percent would reenergy prices. duce the need for new generating capacity next
Over the last three decades, the Unit- year by about 2,000 MW. Extending that reduced States has significantly improved its en- tion over the next 20 years would reduce the ergy efficiency by developing and expand- need for new generation by 60,000 to 66,000 MW. ing the use of energy efficient technologies. While this projection shows that conser-Although our economy has grown by 126 vation can help ensure the United States has adpercent since 1973, our energy use has in- equate energy supplies for the future, it also creased by only 30 percent. Had energy use shows that conservation alone is not the ankept pace with economic growth, the na- swer. Even with more conservation, the U.S. tion would have consumed 171 quadrillion will need more energy supplies. Today, new British thermal units (Btus) last year in- technologies offer new opportunities to enstead of 99 quadrillion Btus. hance our energy efficiency. As these technolo-
About a third to a half of these savings gies gain market acceptance, they will help enresulted from shifts in the economy, such as sure a reliable and affordable energy and electhe growth of the service sector. The other tric power supply for the nation. half to two-thirds resulted from greater energy efficiency. Technological improve- Energy Intensity ments in energy efficiency allow consumers The energy intensity of the U.S. economy to enjoy more energy services without com- is measured by the amount of energy used to mensurate increases in energy demand. The produce a dollar’s worth of gross domestic rate at which these efficiency improve- product (GDP). It now takes only about 56 perments are made varies over time, depend- cent of the energy required in 1970 to produce a ing on the extent to which factors—such as energy policies, research and development,
Figure 1-1prices, and market regulations—encourage U.S. Energy Use per Capita and per Dollar ofthe development of new, efficient products GDP: 1970–1999 and consumer investment in these prod- (Index: 1970 = 1)
ucts. An increased rate of improvement in energy efficiency can have a large impact on energy supply and infrastructure needs, reducing the need for new power plants and other energy resources, along with reduced stress on the energy supply infrastructure.
Load management is the ability to adjust energy loads to reflect immediate supply conditions. In the very short term, direct appeals forconservation can ease strained energy supplymarkets for a time. Over the longer run, the ability to adjust demand on an as-needed basis canbe an important source of energy reserves, resulting in lower energy bills for participatingcustomers. 1970 75 80 85 90 95 99
1.2
1.0
0.8
0.6
0
Energy Use per Capita
Energy Use per Dollar of GDP
The impact that improvements in energy The energy intensity of the U.S. economy is measured by the efficiency can have on energy supply markets amount of energy used to produce a dollar’s worth of gross
grows over time. Electricity demand is project- domestic product (GDP). By that yardstick, U.S. energy intensity declined significantly between 1970 and 1985, and
ed to rise by 1.8 percent a year over the next 20 has continued to decline, albeit at a slower rate. years, requiring the addition of some 393,000 _______
Source: U.S. Department of Energy, Energy InformationMW of generation capacity. At the same time, Administration.
Measures of
Electrical Power
A watt is a measure of the amount of energy that can be produced during a specific period of time.
1 kilowatt (KW)= 1,000 watts 1 megawatt (MW)=1million watts 1 gigawatt (GW)=1 billion watts 1 terawatt (TW)=1 trillion watts
U.S. Energy Efficiency
Is Improving
• New home refrigerators now use about onethird less energy than they did in 1972.
• New commercial fluorescent lighting systems use less than half the energy they did during the 1980s.
• Federal buildings now use about 20 percent less energy per square foot since 1985.
• Industrial energy use per unit of output declined by 25 percent from 1980 to 1999.
• The chemical industry’s energy use per unit of output has declined by roughly 40 percent in the past 25 years.
• The U.S. government has reduced its energy use in buildings by over 20 percent since 1985.
• The amount of energy required to generate 1 kilowatt-hour of electricity has declined by 10 percent since 1980.
Chapter 1 • Taking Stock: Energy Challenges Facing the United States 1-4

What Causes
Transmission
Constraints?
When additional electricity flow from one area exceeds a circuit’s capacity to carry that flow to another area, the overloaded circuit becomes congested and blocks a steady flow of power. To prevent transmission bottlenecks, system operators curtail transactions between areas or increase generation on the side of the constraint where the electricity is flowing and reduce generation on the opposite side. Transmission constraints result in price differences between regions that exceed differences due to line losses, because electricity can no longer flow freely to the affected area.
A pressing long-term electricity
challenge is to build enough new
generation and transmission ca
pacity to meet projected growth in
demand.
1-5 NATIONAL ENERGY POLICY
dollar of GDP today (Figure 1-1). This reduction is attributable to improved energy efficiency, as well as to structural changes in the economy, particularly the relative decline of energyintensive industries.
The decline in the nation’s energy intensity accelerated between 1999 and 2000, a period when nonenergy-intensive industries experienced rapid growth. Energy intensity is projected to continue to decline through 2020 at an average rate of 1.6 percent a year. This is a slower rate of decline than experienced in the 1970s and early 1980s, which was characterized by high energy prices and a shift to less energyintensive industries, but is a more rapid rate of decline than experienced on average during the latter part of the 1980s and the 1990s.
Challenges Confronting Electricity Supply Our nation’s electricity supply has
failed to keep pace with growing demand. This imbalance is projected to persist into the future. The adverse consequences have manifested themselves most severely in the West, where supply shortages have led to high prices and even blackouts. In other regions, inadequate supply threatens the reliability and affordability of electric power.
Large amounts of new generating capacity are slated for installation around the country from 2001 to 2004. However, there is a geographic mismatch between where we will generate energy and where it is needed. For example, little capacity is being added where it is most needed, such as in California and eastern New York.
Electricity supply conditions in the Southeast are expected to be tight in the summer of 2001, much as they have been the previous two years. The Northeast may also face supply shortages. If the temperatures of the summer of 2000 had been normal rather than unseasonably cool, New York and New England would most likely have experienced electricity supply shortfalls and price spikes. Critical supply problems could arise if the weather in the summer of 2001 is unusually warm or if plant outages rise above average levels.
Our nation’s most pressing long-term electricity challenge is to build enough new generation and transmission capacity to meet projected growth in demand. Across the country, we are seeing the same signs that California faced in the mid-1990s: significant economic regulatory uncertainty, which can result in inadequate supply. This level of uncertainty can vary across the country, depending on state and local regulations. Of the approximately 43,000 MW of new generating capacity that power companies planned in 1994 for construction from 1995 to 1999, only about 18,000 MW were actually built. Although plans have been announced to build more capacity than the country will need over the next five to seven years, this new construction assumes market and regulatory conditions that are not yet assured. Over the next twenty years, the United States will need 1,300 to 1,900 new power plants, which is the equivalent of 60 to 90 new power plants a year (Figure 1-2).
But even with adequate generating capacity, we do not have the infrastructure to ensure reliable supply of electricity. Investment in new transmission capacity has failed to keep pace with growth in demand and with changes in the industry’s structure. Since 1989, electricity sales to consumers have increased by 2.1 percent annually, yet transmission capacity has increased by only 0.8 percent annually. As electricity markets become more regional, transmission constraints are impeding the movement of electricity both within and between regions.
The price spikes in the Midwest in the summer of 1998 were in part caused by trans-

Figure 1-2The U.S. Needs More Power Plants
4,500
4,000
3,500
3,000
2,500
0
High Electricity Demand Case
Reference Case Electricity Generating Capaciity
Existing Capacity Minus Future Retirements
2000 2010 2020
The nation is going to require significant new generationcapacity in the next two decades. Depending on demand, theUnited States will need to build between 1,300 and 1,900 newpower plants—or about one new power plant a week.________Source: U.S. Department of Energy, Energy InformationAdministration.
mission constraints, which limited the region’s ability to import electricity from other regions at a time of high demand. Transmission bottlenecks contributed to the blackouts in California over the past year, and have been a persistent cause of price spikes in New York City during peak demand. Constraints on New England’s ability to import low-cost power from Canada could raise electricity prices during periods of high demand.
Electricity is a secondary source of energy, generated through the consumption of primary sources (Figure 1-3). The largest source of U.S. electricity generation is coal, followed by nuclear energy, natural gas, hydropower, oil, and non-hydropower renewable energy.
Coal
Coal is America’s most abundant fuel source. The United States has a 250-year supply of coal. Over 1 billion tons of coal were produced in 25 states in 2000. About 99.7 percent of U.S. coal production is consumed domestically, with electricity generation accounting for about 90 percent of coal consumption.
After peaking in 1982, coal prices have generally declined. This trend is projected to continue through 2020, reflecting an expanding shift into lower-cost western coal production and substantial increases in productivity. While coal is expected to
remain the dominant fuel in meeting increasing U.S. electricity demand through 2020, energy policy goals must be carefully integrated with environmental policy goals. The Clean Air Act Amendments of 1990 and related state regulations require electricity generators to reduce emissions of sulfur dioxide and nitrogen oxide.
Nuclear Energy Nuclear energy is the second-largest
source (20 percent) of U.S. electricity generation. Nuclear power is used exclusively to generate electricity. Nuclear power has none of the emissions associated with coal and gas power plants, including nitrogen oxides, sulfur dioxide, mercury and carbon dioxide. Costs of electricity generation by nuclear plants compare favorably with the costs of generation by other sources.
While the number of nuclear plants has declined due to retirements, nuclear electricity generation has steadily increased in recent years. Several factors have created a more favorable environment for nuclear energy: safe, standardized plant designs; an improved licensing process; effective safety oversight by the Nuclear Regulatory Commission (NRC); the advent of new technologies; and uncertain, volatile natural gas prices. This more favorable environment has resulted in increased re-licensing of nuclear plants and the consolidation of several plants in the hands of fewer, more experienced operators.
Figure 1-3
Fuel Sources for ElectricityGeneration in 2000
Natural Gas 16%
Hydropower 7%
Nuclear 20%
Renewables 2%
Coal 52%
Oil 3%
Electricity is a secondary source of energy, generated through the consumption of primary sources. Coal and nuclear energy account for over 70 percent of U.S. electricity generation. ______
Source: U.S. Department of Energy, Energy Information Administration.
Chapter 1 • Taking Stock: Energy Challenges Facing the United States 1-6

Many Americans received high
heating bills this winter as a re
sult of sharp increases in natural
gas prices.
1-7 NATIONAL ENERGY POLICY
The nuclear industry is closely regulated by the NRC, which provides oversight of the operation and maintenance of these plants. This oversight includes a comprehensive inspection program that focuses on the most significant potential risks of plant operations, and features fulltime resident inspectors at each plant, as well as regional inspectors with specialized expertise. In addition to rigorous inspection criteria, the installation of new design features, improvements in operating experience, nuclear safety research, and operator training have all contributed to the nuclear industry’s strong safety record.
An important challenge to the use of nuclear energy is the issue of safe and
timely long-term storage of spent nuclear fuel and high- and low-level radioactive waste. Currently, no plans exist to construct any new nuclear plants. However, due to more favorable conditions, the decline in nuclear energy generation has not been as rapid as was predicted only a few years ago, as evidenced by increased re-licensing.
Natural Gas
Natural gas is the third-largest source of U.S. electricity generation, accounting for 16 percent of generation in 2000. Under existing policy, natural gas generating capacity is expected to constitute about 90 percent of the projected increase in electricity generation between 1999 and 2020. Electricity generated by natural gas is expected to grow to 33 percent in 2020—a growth driven by electricity restructuring and the economics of natural gas power plants. Lower capital costs, shorter construction lead times, higher efficiencies, and lower emissions give gas an advantage over coal and other fuels for new generation in most regions of the country.
However, natural gas is not just an electricity source. It is used in many different ways, including as vehicle fuel, as industrial fuel, and in our homes. In addition, natural gas is used as a feedstock during the manufacturing process of such products as chemicals, rubber, apparel, furniture, paper, clay, glass, and other petroleum and coal products. Overall, natural gas accounts for 24 percent of total U.S. energy consumed and for all purposes 27 percent of domestic energy produced.
Eighty-five percent of total U.S. natural gas consumption is produced domestically. The import share of consumption rose from 5 percent in 1987 to 15 percent in 2000, and net imports have comprised more than 50 percent of the growth in gas demand since 1990. Canada, with very large gas supplies and easy pipeline access to the lower 48 states, accounts for nearly all U.S. natural gas imports. Unlike oil, almost all natural gas is produced and sold within the same region. Therefore, prices are determined by regional, rather than global, markets.
In 2000, natural gas prices moved

sharply higher after fifteen years of generally flat prices. Futures prices surged by 320 percent in 2000 to an all-time high of $9.98 per million Btus in late December 2000—nearly five times higher than the $2.05 per million Btu average from 1991 to 1999. While prices have declined since the beginning of 2001, they remain much higher than recent levels.
Between 2000 and 2020, U.S. natural gas demand is projected by the Energy Information Administration to increse by more than 50 percent, from 22.8 to 34.7 trillion cubic feet. Others, such as Cambridge Energy Research Associates, expect gas consumption to increase by about 37 percent over that period. Growth is projected in all sectors—industrial, commercial, residential, transportation, and electric generation. More than half of the increase in overall gas consumption will result from rising demand for electricity generation.
Although high natural gas prices have negative effects on consumers, businesses, industries, and the economy as a whole, they also promote more rapid development and adoption of new energy efficient technologies, investment in distribution systems, and greater investment in exploration and development. Although these market responses do not occur rapidly enough to prevent nearterm price spikes, over time, they help to hold down prices.
As a result of the sharp increase in natural gas prices, many consumers received historically high utility bills this winter. The price spike has had a particularly severe impact on low-income consumers who use natural gas for heating. In recent months, 5 million consumers have applied for federal and state assistance to pay their heating bills—an increase of 1 million consumers over last year.
The projected rise in domestic natural gas production—from 19.3 trillion cubic feet in 2000 to 29.0 trillion cubic feet in 2020— may not be high enough to meet projected demand. In the near term, incremental production of natural gas is expected to come primarily from unconventional sources in the Rocky Mountain, Gulf Coast, and midcontinent regions; the North Slope of Alaska; and the offshore Gulf of Mexico. Onshore federal lands currently contribute
about 10 percent of U.S. production, and federal offshore production contributes about 26 percent.
The most significant long-term challenge relating to natural gas is whether adequate supplies can be provided to meet sharply increased projected demand at reasonable prices. If supplies are not adequate, the high natural gas prices experienced over the past year could become a continuing problem, with consequent impacts on electricity prices, home heating bills, and the cost of industrial production. These concerns will redouble if policy decisions sharply reduce electricity generation by any other source, since it is doubtful that natural gas electricity generation could expand to the extent necessary to compensate for that loss of generation.
To meet this long-term challenge, the United States not only needs to boost production, but also must ensure that the natural gas pipeline network is expanded to the extent necessary. For example, although natural gas electricity generation in New England is projected to increase by 16,000 MW through 2000, bottlenecks may block the transmission of necessary supplies. Unless pipeline constraints are eliminated, they will contribute to supply shortages and high prices, and will impede growth in electricity generation.
Hydropower Hydropower is the fourth-largest
source of U.S. electricity generation, accounting for about 7 percent of total generation in 2000. In some regions of the country, such as the Northwest and New York, hydropower makes a much bigger contribution to electricity generation. Although the United States is second only to Canada in hydropower generation, hydropower generation has remained relatively flat in the United States for years.
Hydropower has significant environmental benefits. It is a form of low-cost electricity generation that produces no emissions, and it will continue to be an important source of U.S. energy for the future. Given the potential impacts on fish and wildlife, however, it is important to ef-
Chapter 1 • Taking Stock: Energy Challenges Facing the United States 1-8

Hydropower is the fourth-largest
source of U.S. electricity genera
tion. The most significant chal
lenge confronting this source of
energy is regulatory uncertainty
regarding the federal licensing
process.
1-9 NATIONAL ENERGY POLICY
ficiently and effectively integrate national interests in both natural resource preservation and environmental protection with energy needs.
There are two categories of hydropower projects in the United States: (1) those operated by federal electric utilities, such as the federal power marketing administrations (Bonneville, Western, Southwestern, and Southeastern); and (2) the approximately 2,600 non-federal hydropower dams licensed or exempted by the Federal Energy Regulatory Commission (FERC). The federal utilities have large hydropower systems operated by the Bureau of Reclamation and Army Corps of Engineers, and play an important role meeting electricity
demand, especially in the Northwest and the West. Hydropower projects operate with multiple purposes, such as electricity generation, flood control, navigation, and irrigation.
Although most potential for hydropower has already been developed, there is some undeveloped hydropower capacity in the United States. Much of this capacity could be expanded without constructing a new dam.
The most significant challenge confronting hydropower is regulatory uncertainty regarding the federal licensing process. The process is long and burdensome, and decision-making authority is spread across a range of federal and state agencies charged with promoting different public policy goals. Reforms can improve the hydropower licensing process, ensuring better public participation, ensuring that effective fish and wildlife conditions are adopted, and providing interagency resolution before conflicting mandatory license conditions are presented. The licensing process needs both administrative and legislative reforms. In addition, FERC should be encouraged to adopt appropriate deadlines for its own actions during the process.
Oil
Oil accounts for approximately 3 percent of electricity generation. Oil is used as a primary source to fire electricity generation plants in some regions. Specifically, oil is an important source of electricity in Hawaii, Florida, and some northeastern states. Oil can also be used an additional source of fuel for electricity generation in plants that can use either natural gas or oil. However, electricity generation from oil is projected to decline to about one-half of one percent of total electricity generation by 2020.
Renewable Energy: A Growing Resource
Renewable energy technologies tap natural flows of energy—such as water, wind, solar, geological, and biomass sources—to produce electricity, fuels, and heat. Non-hydropower renewable electricity generation is projected to grow at a faster rate

than all other generation sources, except Figure 1-4
natural gas. These sources of energy are U.S. Per Capita Oil
continuously renewable, can be very clean, Consumption: 1970–2000
are domestically produced, and can gener- (Barrels per Year)
ate income for farmers, landowners, andothers. Although its production costs generally remain higher than other sources, renewable energy has not experienced theprice volatility of other energy resources.
Non-hydropower renewable energy sources currently account for only about 4 percent of total energy consumption and 2 percent of total electricity generation. The sources of non-hydropower renewable electricity generation are biomass (the direct combustion of plant matter and organic residues, such as municipal solid waste use); geothermal (use of naturally occurring steam and hot water); wind; and solar. Biomass and geothermal account for most renewable electricity generation.
35
30
25
20
0
The most important long-term chal- 1970 75 80 85 90 95 00
lenge facing renewable energy remains eco- Per capita oil consumption reached a peak in 1978 of 31 nomic. Renewable energy costs are often barrels. it has fallen by 20 percent since then to 26 barrels
greater than those of other energy sources. per capita. _______
However, these costs have declined sharply Source: U.S. Department of Energy, Energy Information Administration in recent years, due to improved technology. If this trend continues, renewable energy growth will accelerate. By 2020, nonhydropower renewable energy is expected to account for 2.8 percent of total electrici-
Renewable energy technologies tap
natural flows of energy to produce
electricity, fuels, and heat.
U.S. DEPARTMENT OF ENERGY, NATIONAL
RENEWABLE ENERGY LABORATORY
ty generation.
Transportation Energy Needs Oil is the nation’s largest source of
primary energy, serving almost 40 percent of U.S. energy needs. In 2000, the United States consumed an average of 19.5 million barrels of oil every day. Transportation fuels account for about two-thirds of our oil consumption, and the industrial sector for 25 percent. Residential and commercial uses, such as heating oil and propane—important fuels in the Northeast and Midwest—account for most of the rest.
The share of oil in U.S. energy supply has declined since the early 1970s, the result of growth in other fuels, particularly coal and nuclear. Per capita oil consumption, which reached a peak in 1978, has fallen by 20 percent from that level (Figure 1-4).
Chapter 1 • Taking Stock: Energy Challenges Facing the United States 1-10

Net Imports
Consumption
20
15
10
1970 80 90 00 U.S. dependence on oil imports is a serious long-term challenge. The economic security of our nation and our trading partners will remain closely tied to global oil market developments. _______Source: U.S. Department of Energy, Energy InformationAdministration.
Figure 1-5 In 2020, oil is projected to account forDependence on Foreign Sources of Oil roughly the same share of U.S. energy con
sumption as it does today. (Millions of Barrels a Day)
The United States has been a net importer of energy since the 1950s, and U.S. dependence on imports has grown sharply since 1985 (Figure 1-5). Today, oil accounts for 89 percent of net U.S. energy imports. Net oil imports account for most of the rise in energy imports since the mid-1980s, and have grown from about 4.3 million barrels per day (bpd) in 1985 to 10 million bpd in 2000.
World oil prices have been marked by notable price volatility over the past sever
5
0
al years. For example, the average initial purchase price of crude oil rose from $8.03 a barrel in December 1998 to $30.30 a barrel in November 2000. Spot prices rose even higher. This dramatic price swing was the product of several events. A series of production cuts by the Organization of Petroleum Exporting Countries (OPEC) in 1998 and 1999 sharply curtailed global oil supplies. At the same time, rebounding demand for oil in Asia following roughly two years of economic weakness, and rapid economic growth in the United States boosted oil consumption and squeezed supplies even further. By September 2000, oil prices peaked as markets faced limited supply of crude and petroleum products
U.S
. D
EPA
RT
ME
NT
OF T
RA
NS
PO
RT
AT
ION
Domestic oil supply cannot be increased unless several access and infrastructure challenges are addressed. For
example, U.S. refining and pipeline capacity has not kept pace with increasing demand for petroleum products.
1-11 NATIONAL ENERGY POLICY

ahead of the winter season, when demand is typically higher. In December 2000, oil prices fell after the market absorbed the impact of a series of OPEC production increases.
This recent price volatility illustrates the effect of intermittent market power exerted by cartel behavior in a global petroleum market. Moreover, prices are set in a market where supply is geographically concentrated. Almost two-thirds of world proven reserves are in the Middle East. Elsewhere, Central and South America account for 9 percent; Africa, 7 percent; North America, 5 percent; Eastern Europe and the former Soviet Union, 5 percent; the rest of Asia, 4 percent; and Western Europe, 2 percent. OPEC’s huge oil reserves and production capacity and its periodic efforts to influence prices add to volatility in the market.
Oil prices are expected to remain high through 2002, affecting the cost of transportation, heating, electricity generation, and industrial production. High oil prices mean high prices for petroleum products, such as gasoline, diesel fuel, heating oil, propane, and jet fuel. The summer 2001 base case average gasoline price from the Department of Energy Short-Term Energy Outlook is $1.49 per gallon. However, prices have risen more rapidly than anticipated since the report’s release, and a much higher summer average in the range of $1.50 to $1.65 per gallon is likely. Some areas have already experienced gasoline prices above $2.00 per gallon. Gasoline inventories going into the driving season are projected to be lower than last year, which could set the stage for regional supply problems that once again create significant price volatility in gasoline markets.
Price Volatility in Gasoline Markets
During the early summer of 2000, low inventories set the stage for a gasoline price run-up in the Midwest. Several pipeline and refinery problems sent marketers scrambling for limited supplies of both reformulated gasoline (RFG) and conventional gasoline, driving prices up rapidly. In Chicago, the spot price for blend stock for RFG, ex-
Chapter 1 • Taking Stock: Energy Challenges Facing the United States 1-12
cluding ethanol, doubled in about six weeks, from 83 cents per gallon on April 25 to $1.65 on June 7. Spot prices then fell back over the next five weeks to 84 cents on July 12 as extra supply began arriving. Retail regulargrade RFG prices in the Midwest rose from $1.47 on April 24 to just over $2.00 per gallon on June 19, before falling back to $1.43 by July 24, showing the typical tendency of
Because the United States is a
mature oil-producing region,
production costs are often higher
than in foreign countries.

retail prices to lag spot price changes. Refiners face additional challenges as
a result of various state and local clean fuel requirements for distinct gasoline blends (“boutique fuels”). These different requirements sometimes make it difficult, if not impossible, to draw on gasoline supplies from nearby areas or states to meet local needs when the normal supply is disrupted.
In 2000, very low inventories of gasoline and other refined products on the U.S. East and Gulf coasts increased the market’s susceptibility to external shocks, such as operating problems in refineries or pipelines, or short-term surges in demand. Last winter, heating oil prices were at nearrecord levels. During 2000, the federal government reduced the vulnerability of the Northeast to heating oil shortages, such as those experienced in January 2000, by creating a 2-million-barrel heating oil reserve in New Jersey and Connecticut.
Because the United States is a mature oil-producing region, production costs are often higher than in foreign countries, particularly OPEC countries. In addition, access to promising domestic oil reserves is limited. U.S. oil production in the lower 48 states reached its peak in 1970 at 9.4 million bpd. A surge in Alaskan North Slope oil production beginning in the late 1970s helped postpone the decline in overall U.S. production, but Alaska’s production peaked in 1988 at 2 million bpd, and fell to 1 million bpd by 2000. By then, U.S. total oil output had fallen to 5.8 million bpd, 39 percent below its peak.
By 2020, U.S. oil production is projected to decline from 5.8 to 5.1 million bpd under current policy. However, oil consumption is expected to rise to 25.8 million bpd by 2020, primarily due to growth in consumption of transportation fuels. Given existing law, production from offshore sources, particularly the Gulf of Mexico, is predicted to play an increasingly important role in the future, accounting for a projected high of 40 percent of domestic oil production by 2010, up from 27 percent today. Technological advances can mitigate the decline in U.S. oil production by enhancing recovery from domestic oil reserves and
lowering production costs. Our projected growing dependence
on oil imports is a serious long-term challenge. U.S. economic security and that of our trading partners will remain closely tied to global oil market developments. Without a change in current policy, the share of U.S. oil demand met by net imports is projected to increase from 52 percent in 2000 to 64 percent in 2020. By 2020, the oil for nearly two of every three gallons of our gasoline and heating oil could come from foreign countries. The sources of this imported oil have changed considerably over the last thirty years, with more of our imports coming from the Western Hemisphere. Despite progress in diversifying our oil suppliers over the past two decades, the U.S. and global economies remain vulnerable to a major disruption of oil supplies.
The Strategic Petroleum Reserve (SPR), the federal government’s major tool for responding to oil supply disruptions, has not kept pace with the growth in imports. The number of days of net oil import protection provided by the Reserve declined from 83 days of imports in 1992 to 54 days of imports today. Net domestic oil imports have increased significantly since 1992, while the SPR’s oil inventory actually decreased.
Domestic oil supply cannot be increased unless several access and infrastructure challenges are addressed. U.S. refining and pipeline capacity has not kept pace with increasing demand for petroleum products. Unless changes take place, the net effect will likely be increased imports, regionally tight markets, and circumstances in which prices for gasoline, heating oil, and other products rise independently of oil prices.
Greater price volatility for gasoline, diesel fuel, heating oil, propane, and jet fuel is likely to become a larger problem over time, unless additional refining capacity and expanded distribution infrastructure can be developed at the same time cleaner products are required. Increasing domestic oil production and reducing demand, particularly for transportation fuels, will re
1-13 NATIONAL ENERGY POLICY

quire adoption of a comprehensive national energy policy.
Alternative Transportation Fuels
Development of alternative fuels such as ethanol and other biofuels (liquid fuels derived from organic matter, such as crops), natural gas, and electricity, can help diversify the transportation sector that is so reliant on oil.
Ethanol, a biofuel based on starch crops such as corn, is already making a significant contribution to U.S. energy security, displacing more oil than any other alternative fuel. Other biofuels, such as biodiesel, which can be made from soybean, canola oils, animal fats, and vegetable oils, are making an increasingly important con-
Summary of Recommendations
tribution The success of the federal alternative
fuels program has been limited, however. The program focuses on mandating that certain fleet operators purchase alternative fueled vehicles. The hope was that this vehicle purchase mandate would lead to expanded use of alternative fuels. That expectation has not been realized, since most fleet operators purchase dual-fueled vehicles that operate on petroleum motor fuels. Reforms to the federal alternative fuels program could promote alternative fuels use, such as expanding the development of an alternative fuels infrastructure.
Taking Stock: Energy Challenges Facing the United States
★ The NEPD Group recommends that the President issue an Executive Order to direct all federal agencies to include in any regulatory action that could significantly and adversely affect energy supplies, distribution, or use, a detailed statement on: (1) the energy impact of the proposed action, (2) any adverse energy effects that cannot be avoided should the proposal be implemented, and (3) alternatives to the proposed action. The agencies would be directed to include this statement in all submissions to the Office of Management and Budget of proposed regulations covered by Executive Order 12866, as well as in all notices of proposed regulations published in the Federal Register.
★ The NEPD Group recommends that the President direct the executive agencies to work closely with Congress to implement the legislative components of a national energy policy.
★ The NEPD Group recommends to the President that the NEPD Group continue to work and meet on the implementation of the National Energy Policy, and to explore other ways to advance dependable, affordable, and environmentally responsible production and distribution of energy.
Note: All recommendations in this report are subject to execution in accordance with applica
ble law. Legislation would be sought where needed. Also, any recommendations that involve
foreign countries would be executed in accordance with the customs of international
relations, including appropriate diplomatic consultation.
Chapter 1 • Taking Stock: Energy Challenges Facing the United States 1-14

Regional U.S. Energy Challenges
MIDWEST Energy consumption in the Midwest is dominated by the industrial sector, the sector with the fastest-growing consumption rate
through 2020. The transportation sector has the second-fastest consumption growth rate through 2020. States are affected by higher
prices for natural gas, propane, and gasoline, and they expect gasoline price spikes this summer. Electricity supplies in some parts
of the region may be tight during peak summer demand. High energy prices will drive up farm operating costs, particularly for
fertilizer, irrigation, grain drying, and fuel for tractors.
Illinois consumers are reeling from high heating and cooling costs. Landlords are forced to pass on these costs in the form of higher
because of the cost of meeting cleaner-burning gasoline requirements.
economy.
WEST Energy consumption in the West is dominated by the transportation sector,
which is followed closely by the industrial sector. The region’s drought emer
gency is exacerbating an already challenging energy picture. California is
likely to experience more severe electricity blackouts this summer. The Pacific
Northwest faces a major shortage of hydropower generation due to low water
levels. Electricity prices will remain high in the West until more supply is
added. Gasoline could be in short supply this summer in California and other states.
rents. Farmers face low commodity prices, high fuel costs, and dramatically higher fertilizer costs. A key refinery is closing in part
Minnesota’s residential electricity use has increased due to population growth and a healthy
Iowa imports over 90 percent of its energy. Farmers are paying twice the 1999 price of fertilizer because of higher prices for natural gas, which is a major component in the fertilizer production.
California’s energy consumption has grown by about 7 percent a year, while production has remained flat. The point has been reached where demand is occasionally exceeding supply, which has caused rolling blackouts. The situation is likely to worsen this summer when demand will peak.
Oregon’s lowest snow pack in history will result in the most severe short-term electricity problem in decades. The state will face high spot market prices and reports the highest gasoline prices in the country.
Washington businesses are closing down or cutting back on production. Electricity costs of $400 per unit compared to $35 a year ago contributed to the closure of a major paper plant employing 800 employees.
Colorado small business are suffering as well. A 169 percent jump in natural gas prices in one year may force small businesses to close.
Idaho utilities are offering to pay their irrigation customers to not farm portions of their fields to reduce electricity demand and make that saved power available for other local customers. The low snow pack has reduced water in river systems needed for hydropower generation.
Hawaii’s geographic isolation contributes to its many energy issues, such as importing 100 percent of its energy, its disproportionately high consumption of jet fuel and heavy reliance on tourism, and its dependence on imported oil for over 90 percent of its primary energy, the majority from sources in the Asia-Pacific region. Electricity is produced mainly from oil, including residuals and distillates from refineries and coal. Because the Islands’ electric grids are not interconnected, electric utilities must operate with high reserve margins.
Nevada is covered in large part by federal lands that require federal approval for permitting new transmission and generation facilities. The permitting process can be protracted and cumbersome, despite efforts by federal agencies to streamline and coordinate. The desert climate requires both heating and cooling, the cost of which can be burdensome. While the desert climate is also conducive to geothermal, wind, and solar technologies, additional work is needed to make these technologies economically competitive.
1-15 NATIONAL ENERGY POLICY

NORTHEAST Energy consumption in the Northeast is dominated by the transportation sector. Forecasts developed by the Energy Information
Administration indicate that the transportation sector will also remain the dominant sector with the fastest-growing consumption
rate through 2020. Northeast states’ energy challenges include reducing vehicle pollution and interstate transport of power plant
emissions. Heavy dependence on heating oil results in disproportionate impacts during cycles of high prices. Energy supplies in
the region are limited by electric transmission and gas pipeline bottlenecks.
New York is rushing to complete 11 small natural gas turbines to avoid blackouts in New York City this summer, where customers pay
Delaware needs upgraded transmission lines to handle increasing loads. Traditional distributed generation using diesel generators may address these
shortfalls, but could raise environmental problems.
Connecticut expects no power shortages this summer, but brownouts are possible if there is a prolonged spike in energy use while power plants are shut down for
market prices.
routine maintenance.
New Hampshire must conserve power on hot days to avoid summer blackouts.
New Jersey regulators have had to allow utilities to raise natural gas rates by 2 percent a month through July 2001 to make up for money lost during the winter due to high fuel
prices.
SOUTH Energy consumption in the South is dominated by the industrial sector, followed by the
transportation sector. The transportation sector, however, is expected to grow faster than the
industrial sector through 2020. While no state in the region anticipates summer power
shortages, electricity supplies in parts of the region may be tight during peak summer
demand.
Arkansas’ costs of natural gas and propane have doubled and then tripled, contributing to employee layoffs.
Oklahoma’s second-largest industry is the oil and gas industry. The volatility of oil and gas markets can severely affect Oklahomans and the state’s economy.
Chapter 1 • Taking Stock: Energy Challenges Facing the United States 1-16

C H A P T E R T W O
Striking Home The Impacts of High Energy Priceson Families, Communities, and Businesses
Figure 2-1
Income Spent on Energy
(Percent)
9.0
8.0
7.0
6.0
5.0
4.0
3.0
1970 75 80 85 90 95 00 Until recently, the share of disposable household income spent on energy steadily declined, falling to a low of 3.8 percent at the end of 1998. Higher prices for oil and other energy products and record cold temperatures in late 2000 bumped this share up to 4.8 percent in the fourth quarter. _______ Note: Plotted quarterly through the fourth quarter of 2000. Source: U.S. Department of Commerce, Bureau of Economic Analysis.
2-1 NATIONAL ENERGY POLICY
American families, communities, and businesses all depend on reliable and affordable energy for their health, safety, and livelihood. Energy is a critical compo
nent of nearly everything that affects our daily lives, from transportation to communication, from food production to medical services, and from air conditioning to heating. Americans expect these services to enhance our lives, and are keenly aware that each additional, unanticipated energy expense is a decrease in funds available for other needs.
Recommendation:
★ The NEPD Group recommends that the President direct the Secretary of Energy to explore potential opportunities to develop educational programs related to energy development and use. This should include possible legislation to create public education awareness programs about energy. Such programs should be longterm in nature, should be funded and managed by the respective energy industries, and should include information on energy’s compatibility with a clean environment.
Impacts of High Energy Prices on the Daily Lives of Americans
Many American families and businesses have already felt the strain of rising prices and unreliable energy supplies. Every time energy prices rise, American families have fewer dollars available to meet their needs. Low-income households, energy-intensive industries, and
farmers generally find it difficult to make rapid adjustments to energy price increases.
Rising oil prices act like a tax by foreign oil exporters on Americans. Changing energy prices impose economic costs, such as forcing plants to change schedules, replace machinery, or even shut down. These costs can eventually impact economic growth. So far, increased capital investment by domestic energy producers has offset only a small part of the dampening effects of higher energy costs on consumer spending.
Families Energy bills for the 74 million middle
class American households consist primarily of home and transportation related expenses. Heating and cooling expenses represent about 40 percent of household energy costs. Other energy expenses include costs for lighting, hot water, appliances, and transportation.
For almost twenty years, the share of household income that Americans spent on their energy needs steadily declined. However, between 1998 and the end of last year, family spending on energy rose by more than 26 percent, from 3.8 to 4.8 percent of after-tax income (Figure 2-1).
Last winter, heating bills for many families tripled. Roughly 50 percent of American families heat their homes with natural gas. Because the last two months of 2000 were particularly cold in some parts of the country, heating bills increased significantly relative to the previous winter. Last winter, average natural gas heating costs in the Midwest increased by 73 percent, from $540 to $933. New Englanders’ heating bills rose by 27 percent, from $760 to $967.


Many working households can usually�accommodate such increases in energy by�cutting back on other needs. However, low-�income households often have more diffi-�cult choices to make. Energy costs for an av-�erage low-income household could total 14�percent of family income during the winter�of 2000–01, up from about 11 percent for the�previous winter. In contrast, energy costs�typically represent only about 4 percent of a�middle-class family’s household budget.�
The Low Income Home Energy Assis-�tance Program (LIHEAP) is a federal block�grant program that helps low-income con-�sumers pay their energy bills. Last winter,�
Higher energy prices have 1.2 million more American families applied�forced some energy-intensive for LIHEAP assistance to pay their heating�manufacturing industries to
bills, bringing the total close to 5 millionhalt or scale back production
and lay off workers. American families—up by 26 percent over�last year’s 3.9 million applicants. As many�as 3.6 million families in eighteen states�and the District of Columbia risk being un-�able to pay their bills and having their en-�ergy cut off because of the effects of rap-�idly increasing energy costs.�
Recommendations:
★ The NEPD Group recommends that the President take steps to�mitigate impacts of high energy costs on low-income consumers. These�steps would include:�
•� Strengthening the Low Income Home Energy Assistance Pro�gram by making $1.7 billion available annually. This is an increase�of $300 million over the regular FY 2001 appropriation.�
• Directing the Secretaries of Interior and Health and Human Ser-�vices to propose legislation to bolster LIHEAP funding by using a�portion of oil and gas royalty payments.�
• Redirecting royalties above a set trigger price to LIHEAP, when-�ever crude oil and natural gas prices exceed that trigger price, as�determined by the responsible agencies.�
★ The NEPD Group recommends that the President increase funding�for the Weatherization Assistance Program by $1.2 billion over ten�years. This will roughly double the spending during that period on�weatherization. Consistent with that commitment, the FY 2002 Budget�includes a $120 million increase over 2001. The Department of Energy�will have the option of using a portion of those funds to test improved�implementation approaches for the weatherization program.�
★ The NEPD Group recommends that the President support legisla-�tion to allow funds dedicated for the Weatherization and State Energy�Programs to be transferred to LIHEAP if the Department of Energy�deems it appropriate.�
2-3 NATIONAL ENERGY POLICY
The low-income elderly are particu-�larly vulnerable to disruptions in energy�supply. If they keep their homes at a reason-�able temperature, the high cost of electricity�may make it difficult for them to pay their�higher electricity bills. This could further re-�sult in an elimination of service. Another�summer of very hot weather and high en-�ergy bills could cause serious health prob-�lems for some Americans, particularly those�sensitive to high temperatures.�
The Department of Energy’s Weather-�ization Assistance Program has reduced the�heating and cooling costs of low-income�households by weatherizing more than 5�million homes since its inception in 1976.�The President has requested $1.2 billion in�additional funding for this program over ten�years, roughly double the current level of�spending. Consistent with that commitment,�the 2002 budget will include a $120 million�increase over 2001.�
The Department of Energy’s
Weatherization Assistance Program
The energy burden on low-income house-�holds, as a proportion of income, is four�times greater than for other American�households. The Weatherization Program�provides grant funding for a network of all�states and some 970 local weatherization�agencies to provide insulation, duct system�improvements, furnace upgrades, and�other cost-effective, energy-saving im-�provements based on the energy needs of�each home weatherized. Currently, each�dollar spent on home weatherization gen-�erates $2.10 worth of energy savings over�the life of the home; with additional eco-�nomic, environmental, health, and safety�benefits associated with the installations�and resulting home improvements. Typi-�cal savings in heating bills, for a natural gas�heated home, grew from about 18 percent�in 1989 to 33 percent today.�
Businesses�For businesses, higher energy prices�
and disruptions in energy supply� may in-�crease inflation and reduce profits, produc-�tion, investment, and employment. The im-�

pact of higher energy prices takes two�forms: the higher costs of paying for the�energy to run the business, and the higher�costs when raw fuel sources are used in�manufacturing.�
In some energy-intensive industries,�rising energy prices have had a significant�effect on product prices and operations.�For instance, while nonenergy producer�prices at the intermediate stage of process-�ing have risen by only 3.6 percent since De-�cember 1998, prices of industrial materials�and plastic resins, which use petroleum in-�puts, are up 14 and 23 percent, respectively.�DuPont, the leading U.S. producer of plas-�tics, chemicals, and fibers derived from oil�and natural gas, faced an increase of $1.3�billion in raw material costs last year, the�largest increase in the industry in a decade.�The company expects further disruptions�this year due to high energy costs.�
The Federal Reserve has reported that�businesses have experienced higher energy�costs for a number of months, but have�been unable to pass these increases on to�customers due to intense foreign and do-�mestic competition and slowing demand.�On March 7, 2001, the Federal Reserve re-�ported that businesses across the country�experienced higher fuel and other energy�costs in February 2001, but most businesses�were unwilling or unable to pass these�costs on to consumers.�
This absorption of much of the higher�costs of energy has deteriorated the profit�
margins of many businesses. About one-�quarter of the increase in total unit costs of�nonfinancial, nonenergy corporations in�the final quarter of last year reflected a rise�in energy costs. A more moderate pace of�consumer spending, due in part to higher�energy prices (natural gas in particular)�also contributed to the margin squeeze. The�reduction in businesses’ purchasing power�has also constrained outlays for plants and�equipment and most likely intensified the�slowdown in business investment that oc-�curred in the last half of 2000.�
Energy-intensive manufacturing in-�dustries are very sensitive to changes in en-�ergy prices, and adjust their production ac-�cordingly. Some companies have been�forced to halt or scale back production and�lay off workers. Others have deemed it�more profitable to sell their energy than to�produce their products. In the Pacific�Northwest, Georgia-Pacific’s paper mill closed�down and laid off 800 workers until diesel gen-�erators could be installed. In recent months, the�company’s average power costs soared from�$1.2 million to $10 million.�
For other industries, such as computer-�driven service industries, energy is not an im-�portant component of the total cost. However,�many such businesses require a high-quality, re-�liable source of power. Even a brief loss of�power can impose significant costs on high-�technology firms.�
Energy supply disruptions also im-�pose costs on firms when products or prod-�
Disruptions in the supply of
energy impose hardships on
businesses when products or
product inputs are damaged or
destroyed, or when production
runs are interrupted.
Many companies have been
unable to pass higher energy
costs on to their customers,
which has sharply reduced their
profit margins.
Chapter 2 • Striking Home: The Impacts of High Energy Prices on Families, Communities, and Businesses 2-4

Farmers have been hit especially
hard by higher fuel and oil
prices, which accounted for over
a third of the rise in the cost of
running their farms.
2-5 NATIONAL ENERGY POLICY
uct inputs are damaged or destroyed, or�when production runs are interrupted. For�example, a survey of small businesses con-�ducted by the National Federation of Inde-�pendent Business in February, 2001, found�that more than half of the firms surveyed�that had experienced blackouts this year in�California were forced to reduce or shut�down business operations altogether during�the blackouts. About one-third lost sales, al-�most 21 percent said materials were dam-�aged or destroyed, and nearly 40 percent�had to absorb wage costs for work that was�not completed.�
For businesses that seek to mitigate en-�ergy price volatility, an important factor is ac-�cess to derivatives markets. Both exchange-�traded futures and over-the-counter deriva-�tive contracts allow firms to substantially re-�duce their exposure to changes in energy�prices. A wide variety of highly liquid futures�contracts on energy products such as oil,�natural gas, and electricity allow energy users�and market participants to reduce or add fi-�nancial exposure to energy prices. More so-�
Figure 2-2�
Farmers Are Being Squeezed by Energy Prices (Index: 1990–92 = 100)�
130�
125�
120�
115�
110�
105�
100�
95�
90�
Prices Received
Prices Paid
1990 92 94 96 98 00 02�
Costs for fuel, fertilizer, and electricity have boosted total prices�paid by farmers, while prices farmers receive for their products�have remained weak.�________éNote: Prices paid are for goods, services, interest, taxes, and wages; priceséreceived are for all farm products.éSource: U.S. Department of Agriculture.�
phisticated and customizable products are avail-�able in the over-the-counter derivative markets.�As these markets become increasingly liquid�and efficient, more firms will take advantage of�these products, reducing the economy’s sensitiv-�ity to shifts in energy prices. However, most�small businesses currently lack the resources or�sophistication to take advantage of these prod-�ucts, and will therefore remain vulnerable to ris-�ing energy costs. The U.S. government should�continue to support the development of efficient�derivatives markets.�
Agriculture Farmers need ample, affordable energy to�
run their machinery and equipment. Today, farm�production costs are rising sharply, while farm�income remains low. Increasing oil prices and�interest rates, along with higher prices for other�production inputs (including hired labor),�boosted farmers’ production expenses by 4 per-�cent, or $7.6 billion, in 2000. The rise in farm�production expenses has occurred at a time of�continued weakness in the prices farmers re-�ceive for their products (Figure 2-2).�
Higher fuel and oil prices accounted�for over one-third of the increase in farm�
Figure 2-3�Farm Costs Are Increasing (Index: December 1979 = 100)�
240�
220�
200�
180�
160�
140�
120�
100�
1990 91 92 93 94 95 96 97 98 99 00 01�
Rising energy prices had a significant effect on product prices�in some industries that are heavily dependent on energy inputs.�The most dramatic example is the 90 percent increase in theéprice of nitrogenous fertilizer since December 1998.é_________éSource: U.S. Department of Labor.é

production costs. Retail diesel prices this�past winter were $1.60 a gallon, compared�to about $1.40 a year ago and only $1.00�two years ago. Propane prices were over�$1.60 a gallon this winter, compared to $1.10�a year ago. And, natural gas prices hit $10.00�per million Btus in January, after averaging�about $2.50 for most of 1998–99. Although�natural gas prices have declined, they remain�much higher than earlier levels.�
Natural gas is an important component�of farm production costs. For example, it is�used to dry grain, heat farm buildings, and�run food-processing equipment. Heating�costs for poultry producers soared last win-�ter, sharply reducing earnings.�
Natural gas also is a major component�in the production of fertilizers, pesticides,�and other farm chemicals. It accounts for�70 to 90 percent of the cost of producing�anhydrous ammonia, a key source of nitro-�gen fertilizer. Surging natural gas prices�have boosted the price of nitrogenous fertil-�izer by 90 percent since 1998 (Figure 2-3).�During last December and January, several�nitrogen production plants shut down, and�capacity utilization fell to 50 percent. Anhy-�drous ammonia recently sold for $330 a ton�in the Midwest, compared to $210 a ton for�
all of 2000 and $160 to $170 a ton at the�start of 2000.�
Depending on the region of the coun-�try and type of farming enterprises, energy-�related expenses range from 10 to 30 per-�cent of operating costs for producing major�crops. Farm operating costs are highest�where fertilizer use is heaviest and natural�gas is used for irrigation pumps, such as�wheat, cotton, and corn farms in the West�and southwestern plains states. Costs are�high for greenhouse and nursery crops that�use natural gas for heating. Perishable�crops also face problems, as energy costs�in processing are markedly higher.�
Most of California’s 9.5 million irri-�gated acres use electricity to pump water.�In addition to higher bills, California farm-�ers will likly face rolling blackouts this�summer, which may disrupt farming and�processing operations. Low stream flows in�the West this year may lead to more pump-�ing of ground water, which will add to irri-� Farm production costs are rising
gation costs in the West. As a result, the� sharply, while farmers’
incomes remain low. Dependingcosts of California’s agricultural products�
on the region of the country and
may rise significantly.� type of farming enterprises,
In 2001, farmers’ total cash production� energy-related expenses range
expenses are forecast to increase by an addi-� from 10 to 30 percent of
operating costs for producing tional $1.5 billion to a record $179.5 billion.� major crops
Chapter 2 • Striking Home: The Impacts of High Energy Prices on Families, Communities, and Businesses 2-6

Even though total planted acreage is expected�to fall this year, higher natural gas prices will�raise expenses for nitrogen fertilizer. At the�same time, net cash farm income is projected to�decline from $56.4 billion in 2000 to under $51�billion in 2001, as production expenses continue�to rise.�
Taken together, fertilizer, fuel, and�electricity costs for farmers are forecast to�reach $24 billion for 2001, up by about 28�percent from $18.7 billion in 1999. This in-�crease is about 9 percent of U.S. net cash�farm income, and that share could be much�higher for many individual commodities.�
Transportation The transportation sector accounts for�
nearly 30 percent of total U.S. energy con-�sumption. The major transportation fuel�sources are petroleum-based gasoline and�diesel, jet, and marine-mode bunker fuels.�Natural gas pipelines are used for product�distribution, and electricity is the primary�source of power for rail transit and liquid�pipeline transmission and distribution.�
During 2000, oil prices surged to a�nine-year high, and gasoline prices skyrock-�eted. On average, fuel prices rose by 30 to�40 cents a gallon from 1999 prices, resulting�in sharp increases for most modes of trans-�
Figure 2-4 Transportation Costs Are on the Rise
(Index: 1982 = 100)
A recent study by a San Francisco Bay business
group concluded that blackouts could cost California
as much as $16 billion annually, and $5 billion in
the Bay area alone.
portation, with nearly a 60 percent increase�in railroad diesel fuel prices.�
Price spikes have hit the travel and�trucking industries particularly hard and�have led to the closure of some operations.�Trucking bankruptcies are currently at an�all-time high. Over 3,500 motor carrier op-�erations failed in 2000, a dramatic increase�over the previous record high of 2,700 mo-�tor carrier failures in 1997. Producer prices�for� intermediate diesel fuel and aviation fuel�each rose by about 140 percent from a low in�December 1998, affecting passenger and�freight transport in the highway, airline, rail,�and other transportation sectors (Figure 2-4).�
For most transport operations, energy-�related expenses were 7 to 14 percent of total�operating costs in 1998–99. This share was�expected to jump to 10 to 25 percent in 2000.�Excluding private auto travel, U.S. passenger�and freight operations in 1999 generated�
1990 92 94 96 98 00 01 about $600 billion in annual revenue and paid�The recent 140 percent rise in producer prices for intermedi- approximately $60 billion for fuel and power.�ate diesel and airline fuels has affected the price of passen-
If the volume stayed the same in 2000, theger and freight transport. various increases in fuel costs for each mode_________
Diesel Fuel110
100
90
80
70
60
50
40
30 Jet Fuel
Note: Plotted through February 2001. of transportation would yield a fuel bill of�Source: U.S. Department of Labor.
2-7 NATIONAL ENERGY POLICY

about $80 billion—an increase of one-third�over the prior year’s bill.�
Economic Impacts of California’s Energy Crunch
In California, 43 percent of small busi-�nesses surveyed in February, 2001, said the�power problem had dimmed their views�about California as an attractive place for�doing business. When asked whether they�agreed with the statement, “The electricity�problem has forced me to take concrete�steps exploring the possibility of moving�
lending facilities and supplier credit.�The situation in California is of par-�
ticular concern because of the major role�the state plays in the regional and national�economies. California’s economy is equiva-�lent to about 13 percent of U.S. gross do-�mestic product (GDP), and it has ac-�counted for an even larger share of U.S.�GDP growth in recent years. Some busi-�nesses and consumers have been affected�by production losses, lost wages, and�higher energy bills resulting from rolling�blackouts and higher natural gas prices.�
my business out of California,” 18.3 percent� The power supply crunch in Califor-�
of small business respondents said they ei-�ther agreed or strongly agreed with the�statement. More than 31 percent said they�will probably or definitely cut back on�planned business investment, and almost 20�percent are exploring a move to another�state. Half of these small businesses con-�cluded that blackouts would reduce their�earnings.�
The Silicon Valley Manufacturing�Group recently estimated that its nearly 200�members lost over $100 million dollars be-�cause of one day of rolling blackouts in�June 2000. Countless more millions of dol-�lars have been lost by interruptible com-�mercial power users. Fontana-based Cali-�fornia Steel Industries estimates it lost $2.4�million in a single day after its interruptible�power was cut off twice for a total of about�12 hours. A recent study by a San Francisco�Bay business group concluded that black-�outs could cost California as much as $16�billion annually, and $5 billion in the Bay�area alone.�
The example of California’s utilities il-�lustrates the potentially severe negative ef-�fects on companies whose business is�highly sensitive to energy prices. In this in-�stance, rising energy costs coupled with an�inability to pass those costs along to cus-�tomers has created a sharp increase in�short-term liabilities. Pacific Gas & Electric�has been forced to file for bankruptcy as a�result, and Southern California Edison,�while avoiding bankruptcy for the time be-�ing, has seen its access to credit markets�disappear and the value of its financial as-�
nia and the West could affect the region’s�economy, as energy supply uncertainty�could reduce investment in the region.�California’s troubles could also spill over to�the national economy:�
• California accounted for 11 percent�of U.S. manufacturing output in 1998. Sec-�tors in other regions that rely on those�products, or that supply inputs to Califor-�nia manufacturers, may share any pain�caused by the energy squeeze.�
• Disruptions to California’s economy�could have negative impacts on our inter-�national trade. California accounts for over�16 percent of total U.S. commodity exports;�nearly 25 percent of industrial equipment�and computers, electronics, and instru-�ments exports; and over 15 percent of farm�commodity and food product exports.�
• The credit problems of the Califor-�nia utilities have boosted commercial paper�rates for all lower-rated borrowers, and li-�quidity in the commercial paper market has�fallen. This will push some firms to seek�other sources of financing, which can be�more costly than commercial paper.�
American consumers and businesses�are best served when markets function�freely. Free markets allow prices to reflect�changes in demand and supply, and avoid�subsidies, price caps, and other con-�straints.�
Improvements in Energy Efficiency Can Help
Improved energy efficiency strength-�ens energy security. The 42 percent decline�in the intensity of U.S. energy use since the�
The Silicon Valley Manufactur
ing Group recently estimated
that its nearly 200 members lost
over $100 million dollars
because of only one day of
rolling blackouts in California.
Figure 2-5
Conservation Through Higher Efficiency Energy Consumption per Dollar of Real GDP
(Thousands of Btus)
27.0
17.5
15.0
12.5
10.0 10.6
18.4
42% decline between 1973
and 2000
1973 78 83 88 93 98 00 Energy intensity is the amount of energy used to produce a dollar’s worth of gross domestic product (GDP). As a result of the 42 percent decline in energy intensity since the first energy crisis in 1973, the U.S. economy is far better prepared today than it was in the 1970s to adjust to energy price or supply shocks. __________
sets plummet. Resulting concerns about� energy crisis in 1973 reflects a combination� Note: Real GDP in 1996 chained dollars. Source: U.S. Department of Energy,
solvency have led to a withdrawal of bank-� of technological advances, conservation ef-� Energy Information Administration.
Chapter 2 • Striking Home: The Impacts of High Energy Prices on Families, Communities, and Businesses 2-8

forts, regulatory action, market response,�and a shift toward a service economy (Fig-�ure 2-5). Our improvements in energy effi-�ciency have prevented our current energy�problems from becoming worse.�
The macroeconomic effects of a sub-�stantial rise in energy prices take two forms.�First, to the extent that energy resources are�imported, more U.S. dollars must be sent�abroad to finance energy consumption, thus�reducing funds available for investing in our�own country. Second, higher prices cause dis-�locations among certain sectors of the�economy, which could ultimately feed�through to lower GDP growth and higher in-�flation.�
Reliance on Foreign Energy Between 1973 and 2000, U.S. depen-�
dence on foreign oil rose from about 35�percent to more than 52 percent of U.S. con-�sumption (Figure 2-6). During the same pe-�riod, the import share of natural gas con-�sumption climbed from less than 5 percent�to more than 15 percent and continues to�rise.�
Figure 2-6 Dependence on Oil Imports Is Rising (Millions of Barrels per Day)
Figure 2-7 Oil Prices Have Risen Sharply Monthly Spot Price of West Texas Intermediate Crude Oil (Dollars per Barrel) 90
80
70
60
50
40
30
Nominal Prices
20
10
0
1970
Real Prices
95 90 85 80 75
Despite the sharp rise in crude oil prices since late 1998, real prices still remain lower than at any time from 1974 to 1985. ________Note: Real prices in 2000 dollars. Prices deflated using the ConsumerPrice Index–Urban (CPI–U) Research Series for all items linked to CPI–U–X1 prior to December 1977.Sources: Wall Street Journal; U.S. Department of Labor, Bureau of Labor Statistics.
Imports of energy products make up�nearly 11 percent of all U.S. imports. By�contrast, U.S. energy exports are relatively�small. The energy trade deficit relative to�our GDP represents the share of U.S. in-�
1973
Net Imports as a Share of U.S. Consumption
34.8% 51.6%
20
18
16
14
12
10
0
Domestic Production Net Imports
Consumption
Production
2000
come that must be exported to purchase�foreign fuel to meet domestic energy needs.�The U.S. energy trade deficit in 2000 was�about $120 billion, most of which was spent�on oil imports.�
As a share of GDP, the energy trade�deficit had fallen to as low as 0.4 percent at�the beginning of 1999, when prices for im-�ported crude oil were less than $10 a barrel.�However, by the end of 2000, these prices�had tripled to more than $30 a barrel (Fig-�
1973 78 83 88 93 98 00 Over the past few decades, U.S. consumption of oil and petroleum products has increasingly outpaced domestic pro
it consumes—up from about 35 percent in the early 1970s. duction. Today the United States imports over half of the oil
____________ Note: Petroleum includes both crude oil and petroleum products. Source: U.S. Department of Energy, Energy Information Administration.
ure 2-7). As a result of both the oil price�spike and growing U.S. demand, the energy�deficit deteriorated significantly to 1.3 per-�cent of GDP by the fourth quarter of last�year—the largest deficit relative to GDP�since the mid-1980s (Figure 2-8). The rise in�oil prices alone has added about 0.7 percent�of GDP to the U.S. trade deficit, compared�to 0.9 percent in the euro currency area,�and 0.8 percent in Japan.�
2-9 NATIONAL ENERGY POLICY
01

Figure 2-8
The U.S.Energy Trade Deficit Has Worsened (Percent)
0.0
–0.5
–1.0
–1.5
–2.0
–2.5
–3.0
–3.5
1970 75 80 85 90 95 00
The energy trade deficit relative to GDP represents the share of domestic income that must be exported to support domestic energy needs. For the past several years, the United States has been a net importer of energy products. As a consequence, our energy trade balance has been in deficit. By the fourth quarter of 2000, the energy deficit had deteriorated significantly to 1.3 percent of GDP—the largest since the mid-1980s. _____________Note: Plotted quarterly through the fourth quarter of 2000.Source: U.S. Department of Commerce, Bureau of Economic Analysis.
Net U.S. oil imports are 4 billion bar-�rels a year, which means that each $1 in-�crease in the price of imported crude oil�boosts U.S. expenditures by about $4 bil-�lion. Given these guidelines, the $20 per�barrel increase from early 1999 to late 2000�translates into an export of roughly $80 bil-�lion a year (0.9 percent of GDP) when mea-�sured from the low price prevailing at the�end of 1998.�
Impacts of Energy Prices on Financial Markets
An analysis of the financial impacts of�higher energy prices can be divided into two�parts: the effects on individual firms whose se-�curities comprise the financial markets, and�the macroeconomic impact on inflation and in-�terest rates. Rising energy costs and greater�volatility in energy prices can have a negative�effect on both individual firms and the broader�financial environment, generally producing�lower asset prices and higher interest rates.�The financial market impact to date of rising�energy prices has been limited to firms with�high sensitivity to energy costs and to those�with significant exposure to the California cri-�sis. The second broad effect of rising energy�costs is an increase both in measured inflation�
Financial markets react to
energy costs and the effect those
energy costs have on both
individual firms and sectors of
the market.
Chapter 2 • Striking Home: The Impacts of High Energy Prices on Families, Communities, and Businesses 2-10

and in expectations for future inflation. Both�factors have considerable impact on interest�rates and, therefore, on the borrowing costs for�businesses and consumers throughout the�economy.�
Inflation Expectations and Interest Rates
Measurable inflation, for both producers�and consumers, is a primary concern of the�Federal Reserve in conducting monetary policy.�Energy costs represent roughly 16� percent of�the producer price index for finished goods and�8 percent of the consumer price index. This�means that sharply rising energy costs can have�a substantial impact on the Federal Reserve’s�decision-making process. Additional impacts�will come from the market’s anticipating Fed-�eral Reserve actions and pushing short-term in-�terest rates higher than they otherwise would�have been. Higher short-term interest rates raise�the nominal cost of borrowing for firms and in-�dividuals and can slow economic growth.�
Rising energy prices can also raise the in-�flation expectations of lenders, which can result�in higher interest rates for borrowing at longer�maturities. Rising long-term interest rates can�reduce long-term investment, limiting future�economic growth and productivity gains. Such�an outcome would carry negative consequences�for growth-sensitive financial sectors, such as�equity and high-yield debt markets.�
More broadly, declining credit fundamen-�tals for certain business sectors could raise bor-�rowing costs for firms not directly affected by�higher energy prices. For example, commercial�paper rates for all lower-rated borrowers have�been affected by the credit problems of the Cali-�fornia utilities, and liquidity in the market has�fallen. As a result, firms may need to seek other�sources of financing, such as bank loans (if ob-�tainable) or asset-backed loans, that can be�more costly than traditional commercial paper�issuance.�
Global Financial Markets
The upward pressure on interest rates�that may result from higher U.S. energy costs�also affects markets beyond our borders. U.S.�monetary policy and related movements in�short-term interest rates can have a significant�impact on other countries. While the effect var-�ies from region to region, many emerging mar-�
ket economies, particularly in Latin America, are�vulnerable to upward moves in U.S. interest�rates.�
Higher nominal interest rates in the de-�veloped countries tend to reduce the amount of�capital flowing to emerging markets. To the ex-�tent that this reduces investment, economic ac-�tivity may be further reduced. In addition, bor-�rowing in dollars is a significant source of fund-�ing for sovereign and private-sector entities�worldwide, particularly in the emerging markets.�Rising U.S. interest rates will increase the inter-�est expenses for these borrowers, diverting�funds from more productive uses and reducing�overall credit quality.�
The global market for energy is highly frag-�mented and region-specific, with the exception of�oil. Nevertheless, certain nations and regions are�net importers of energy and are highly sensitive to�changing prices. Japan, a major importer of oil�and natural gas, is particularly vulnerable. Europe�is a net importer of energy, with certain excep-�tions, while emerging market nations vary widely�in their dependence on foreign energy sources.�
At the macroeconomic level, rising energy�prices will increase the current account deficit of�energy-importing nations. Since current account�deficits must be financed, these nations will�most likely need to pay higher interest rates to�attract the necessary capital. As noted, this will�tend to reduce domestic investment and lower�long-term growth. In some countries, such as the�United States or Japan, changes in interest rates�and growth expectations can have substantial�global impact.�
Central banks and monetary authorities�vary in the degree to which they focus on infla-�tion in setting monetary policy, making some�countries more or less likely than others to raise�interest rates in an environment of rising energy�prices.�
Although Japan maintains a current ac-�count surplus due to manufacturing exports, its�role as an international creditor could diminish.�This may have additional impacts on the global�financial markets, since Japanese financial insti-�tutions are generally suppliers of global credit.�
The impact of rising energy costs on the�dollar is likely to be mixed. While slower U.S.�growth generally reduces demand for dollars,�rising oil prices are likely to increase demand,�since oil contracts are usually denominated in�dollars.�
2-11 NATIONAL ENERGY POLICY

Summary of Recommendations
★ The NEPD Group recommends that the President direct the Secretary of Energy to explore�potential opportunities to develop educational programs related to energy development and�use. This should include possible legislation to create public education awareness programs�about energy. Such programs should be long-term in nature, should be funded and managed by�the respective energy industries, and should include information on energy’s compatibility with�a clean environment.�
★ The NEPD Group recommends that the President take steps to mitigate impacts of high�energy costs on low-income consumers. These steps would include:�
• Strengthening the Low Income Home Energy Assistance Program by making $1.7�billion available annually. This is an increase of $300 million over the regular FY�2001 appropriation.�
• Directing the Secretaries of Interior and Health and Human Services to propose legisla-�tion to bolster LIHEAP funding by using a portion of oil and gas royalty payments.�
• Redirecting royalties above a set trigger price to LIHEAP, whenever crude oil and natural�gas prices exceed that trigger price, as determined by the responsible agencies.�
★ The NEPD Group recommends that the President increase funding for the�Weatherization Assistance Program by $1.2 billion over ten years. This will roughly double the�spending during that period on weatherization. Consistent with that commitment, the FY 2002�Budget includes a $120 million increase over 2001. The Department of Energy will have the�option of using a portion of those funds to test improved implementation approaches for the�weatherization program.�
★ The NEPD Group recommends that the President support legislation to allow funds�dedicated for the Weatherization and State Energy Programs to be transferred to LIHEAP if the�Department of Energy deems it appropriate.�
★ The NEPD Group recommends the President recognize unique regional energy concerns�by working with the National Governors Association and regional governor associations to�determine how to better serve the needs of diverse areas of the country.�
★ The NEPD Group recommends the President direct FEMA to prepare for potential energy�emergencies.�
• FEMA should work with states’ Offices of Emergency Management as they expand�existing emergency operations plans to identify potential problems and address conse-�quences of the power shortages. FEMA should use its current Regional Incident Report-�ing System to identify any situations that might demand immediate attention.�
• Using the structure of the already existing Federal Response Plan, FEMA should�conduct Regional Interagency Steering Committee (RISC) meetings for states affected�by the energy shortfalls. The RISC is a FEMA-led interagency committee comprised of�agencies and departments that support the Federal Response Plan. Either an upcoming,�scheduled RISC meeting or a special-focus RISC meeting can be held to identify the�short-term energy outlook, as well as any expected consequences, in each of the states�during the peak summer season.�
Chapter 2 • Striking Home: The Impacts of High Energy Prices on Families, Communities, and Businesses 2-12

C H A P T E R T H R E E é
Protecting America’s Environment Sustaining the Nation’s Health and Environment
Over the last three decades, Ameri-�can ingenuity has led to a reduction�in adverse environmental and pub-�lic health impacts from energy�
development and use. Americans demand a�reliable energy supply and a clean environ-�ment, and we can achieve both. Spurred by�strong environmental concerns, competi-�tive forces, and environmental regulations,�businesses have developed innovative tech-�nologies and pollution-prevention tech-�niques to protect the environment. How-�ever, more can be done.�
As our energy needs continue to grow�and our production and distribution system�is strained to capacity, it is clear that the�lack of a comprehensive energy policy has�environmental costs. For example, to pre-�vent blackouts, California officials must tol-�erate a large short-term increase in smog-�forming nitrogen oxides emissions. In Los�Angeles, older, dirtier power plants have�had to run longer than expected. California�is also rushing to use mid-sized “peaker�power plants” and diesel-fired emergency�backup generators to keep the lights on.�
The short-term cost in increased pol-�lutant emissions of these emergency mea-�sures has been stark. Preliminary figures�from California’s South Coast Air Quality�Management District indicate emissions�have doubled in the first three months of�the year compared with last year. In addi-�tion to nitrogen oxides emissions, diesel-�fired backup generators also emit toxic�soot. But with many days of blackouts pre-�dicted in California this summer, these gen-�erators will most likely run for much longer�than expected, and could greatly increase�emissions.�
In the longer term, penalties and tech-�nological improvements should offset the�impact of these increased emissions. How-�ever, California’s experience demonstrates�the environmental costs of not building an�adequate supply of clean energy.�
Government’s Role The federal government has a unique�
role in facilitating energy development�while simultaneously protecting the envi-�ronment and conserving our country’s natu-�ral resource legacy. Energy development ini-�tiatives will be successful only if they ad-�equately address their impacts on natural�resource values.�
Federal, state, tribal, and local govern-�ments have the responsibility of protecting�unique natural resources and environmental�values. In fact, some environmental protec-�tions we enjoy today are often taken for�granted. For example, lead levels in ambient�air today are 98 percent lower than they�were in 1970, largely because government�regulations required that lead be removed�from gasoline. The reduced number of chil-�dren with IQs below 70 is attributed to re-�ducing lead in our environment.�
As U.S. energy needs grow, additional�innovations will be necessary to continue�improving environmental conditions and to�meet new environmental challenges. As we�improve the energy production and distribu-�tion system, all levels of government must�ensure that regulatory systems protecting�public health and the environment are rigor-�ous and efficient, and encourage innovation�and improvement.�
3-1 NATIONAL ENERGY POLICY


Roughly 30 percent of�our nation’s electricity�supply is now generated�by nuclear, hydropower,�and renewable sources,�all of which have few air�emissions.�
Figure 3-1 Cleaner Air: EnergyConsumption Has Risen While Emissions Have Declined (Percent Change Since 1970)
U.S. Coal Consumption +100%
Gross Domestic Product +147%
U.S.Energy Consumption +42%
Vehicle Miles Traveled +140%
150
100
50
0
-50 Key Air Emissions –31%
1970 75 80 85 90 95 99 Despite a marked increase in U.S. energy consumption, a combination of environmental regulations and technologies has decreased aggregate emissions of key air emissions: SO2, NOx, mercury, CO, and volatile organic compounds. ________ Sources: U.S. Department of Energy, Energy Information Administration, and U.S. Environmental Protection Agency.
Air Quality Regulatory Programs
Advances in technology and environ-�mental regulations have decreased aggre-�gate emissions of key air pollutants over�the last three decades, despite a marked in-�crease in energy consumption (Figure 3-1).�Roughly 30 percent of our nation’s electric-�ity supply is now generated by nuclear, hy-�dropower, and renewable sources, all of�which have few air emissions.�
Nonetheless, fossil fuel-fired power�plants, other industrial sources, and ve-�hicles remain significant sources of air pol-�lution (Figure 3-2). These emissions can be�associated with significant health problems,�including respiratory and cardiopulmonary�disease, cancer, and birth defects. In addi-�tion, they can be harmful to forests, water�bodies, and fish, and can decrease visibility�in scenic areas.�
Environmental Protection Agency’s�(EPA) Acid Rain Program, enacted as part�of the 1990 Clean Air Act Amendments, is�the only program directed primarily at re-�ducing air emissions from electric utilities.�
Using flexible market-based incen-�tives instead of technology-forcing stan-�dards, the program has reduced sulfur diox-�ide (SO
2)� emissions from utilities faster�
than required by law for a fraction of the�initial cost estimates. By 2010, EPA expects�the program will reduce annual SO
2 emis-�
sions by 10 million tons from 1980 levels,�thus avoiding significant health problems�and the costs associated with those levels.�
Federal and state regulatory programs�also limit air pollution directly by restrict-�ing emissions from cars and trucks, and in-�directly by setting criteria for the fuel for�these vehicles. An individual car meeting�2004 federal requirements will emit 95 per-�cent less carbon monoxide (CO), 94 percent�fewer nitrogen oxides (NOx), and 98 percent�fewer hydrocarbons than an average car did�before laws limiting such vehicle pollution.�Although individual cars and trucks are far�cleaner today than they were in 1970, total�emissions from the fleet of highway vehicles�have remained relatively constant, because�Americans drive twice as many miles today�(2.5 trillion miles a year) as they did in 1970�
(1.1 trillion miles a year).�Despite these and other achievements,�
further air quality improvements can be�sought, as well as ways to address new�problems identified by recent scientific find-�ings. EPA has recently adopted new, more�stringent standards to further reduce ozone�and particulate matter. To meet public�health and environmental challenges, power�plants, industrial sources, and vehicles will�need to produce fewer potentially harmful�emissions.�
Recommendation:
★ The NEPD Group recommends�that the President direct the Adminis-�trator of the Environmental Protec-�tion Agency (EPA) to propose multi-�pollutant legislation. The NEPD�Group recommends that the President�direct the EPA Administrator to work�with Congress to propose legislation�that would establish a flexible,�market-based program to significantly�reduce and cap emissions of sulfur�dioxide, nitrogen oxides, and mercury�from electric power generators. Such�a program (with appropriate mea-�sures to address local concerns)�would provide significant public�health benefits even as we increase�electricity supplies.�• Establish mandatory reduction tar-�
gets for emissions of three main�pollutants: sulfur dioxide, nitrogen�oxides, and mercury.�
• Phase in reductions over a reason-�able period of time, similar to the�successful acid rain reduction pro-�gram established by the 1990�amendments to the Clean Air Act.�
• Provide regulatory certainty to al-�low utilities to make modifications�to their plants without fear of new�litigation.�
• Provide market-based incentives,�such as emissions-trading credits�to help achieve the required reduc-�tions.�
3-3 NATIONAL ENERGY POLICY

Cleaner, More Efficient Technologies Emission control technologies and�
emission prevention not only decrease pol-�lution but can also contribute to economic�prosperity. Innovative emission control and�prevention technology and increasingly ef-�ficient energy systems have developed at a�brisk pace, increasing our ability to provide�cleaner, cheaper energy. Besides reducing�pollution, environmental technologies ac-�count for about $21.3 billion in U.S. ex-�ports, and support approximately 136,000�U.S. jobs.�
The need to reduce emissions from�cars and trucks has contributed to techno-�logical innovations that have transformed�the domestic and global automotive indus-�tries. U.S. vehicle emission standards were�the primary driving force for the original�development of innovative technologies,�many of which have become standard de-�sign features of today’s high-tech vehicles:�sophisticated three-way catalysts, on-board�computers, oxygen sensors, and fuel-injec-�tion systems for cars and advanced fuel�systems for trucks. Technologies such as�these have allowed today’s vehicles to be�much cleaner, more efficient, higher per-�forming, more reliable, and more durable�than their counterparts of the 1960s and�1970s. Manufacturers are now working on�developing state-of-the-art pollution control�technology to further reduce emissions�from motor vehicles. For optimal perfor-�mance, this technology requires low-sulfur�fuel that, consistent with applicable law,�will be required in 2004 for gasoline and�2006 for diesel fuel. Some vehicles use al-�ternative fuels (e.g., natural gas, propane,�ethanol, and electricity); others operate�with a hybrid gasoline and electrical motor;�and others are using fuel cells.�
Cleaner Electricity The source of energy used for power�
generation significantly affects the amount�of air emissions. Clean energy can be gen-�erated from nuclear plants, hydropower fa-�cilities, wind farms, and solar energy sys-�tems with negligible (if any) air emissions.�These sources today make up about 30 per-�cent of our electricity supply. Solar and�
Figure 3-2 Sources of Pollutants from Energy Generation and Use (Percent)
Volatile Organic Emissions Compounds
S02 NO2 Mercury CO (VOCs) 100
90
80
70
60
50
40
30
20
10
0 Fuel CombustionOther Stationary CombustionIndustrial ProcessesTransportationMiscellaneous
wind energy systems will continue to im-�prove with advances in short-term weather�and climate forecasting. Improved forecast-�ing can also maximize hydropower effi-�ciency.�
Technology significantly reduces pol-�lution from coal-fired power plants, which�generate more electricity in the United�States than any other source. For example,�scrubbers can remove 95 percent of the SO
2�
emissions from a coal-fired power plant.�With the innovative, market-based SO
2 re-�
duction requirements of the Clean Air Act�Amendments of 1990, the estimated cost of�using a scrubber on a coal-fired power plant�to remove one ton of SO
2 has dropped ap-�
proximately 40 percent in four years, from�$474/ton in a 1993 estimate to $282/ton in a�1997 estimate, and continues to decline.�Other existing control technologies for coal-�fired plants can reduce NOx emissions by�more than 90 percent.�
A recently permitted state-of-the-art�coal-fired unit, for example, at a Kansas City�Power & Light facility, has 88 percent lower�NOx, 99 percent lower particulate matter,�and 92 percent lower SO
2 emissions than�
would an uncontrolled facility.�Recent research by the Department of�
Energy (DOE), EPA, and private companies�suggests that existing technologies can also�significantly reduce mercury emissions.�
Technologies for
Reducing SO2
Emissions
Many power plants use�flue-gas desulfurization,�or scrubbers, to reduce�SO
2 emissions from�
burning coal. The most�common wet scrubber,�the limestone forced-�oxidation (LSFO)�process, removes SO
2�
from the flue gas by�sorption and through�chemical reactions with�the limestone. LSFO�technologies can�remove up to 98 percent�of SO
2 and significant�
amounts of mercury.�The most common dry�scrubber, the lime spray-�drying process, is used�for plants that burn�lower-sulfur coals. A�lime slurry mixes with�the hot flue gas in a�spray dryer and reacts�with SO
2 . By recaptur-�
ing sorbent at the�bottom of the spray�dryer removed in a�particulate control�device, dry scrubbers�can remove up to 96�percent of SO
2.�
Chapter 3 • Protecting America’s Environment: Sustaining the Nation’s Health and Environment 3-4
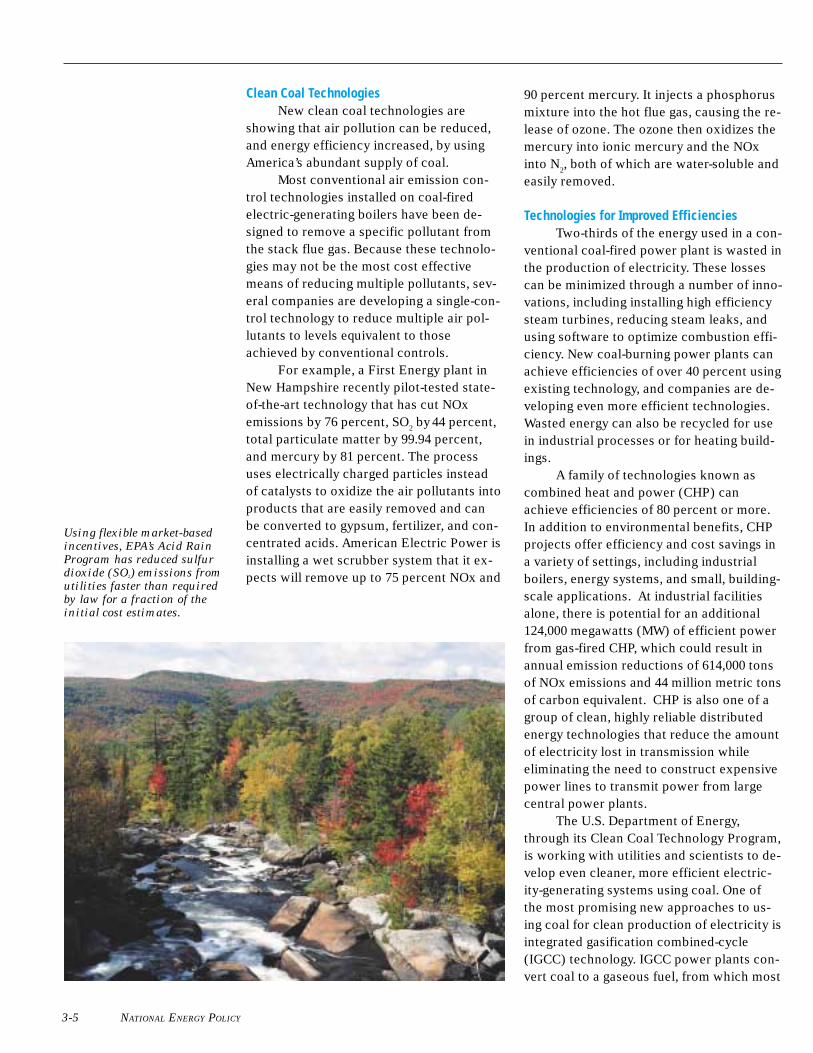
Using flexible market-based
incentives, EPA’s Acid Rain
Program has reduced sulfur
dioxide (SO2) emissions from
utilities faster than required
by law for a fraction of the
initial cost estimates.
Clean Coal Technologies New clean coal technologies are�
showing that air pollution can be reduced,�and energy efficiency increased, by using�America’s abundant supply of coal.�
Most conventional air emission con-�trol technologies installed on coal-fired�electric-generating boilers have been de-�signed to remove a specific pollutant from�the stack flue gas. Because these technolo-�gies may not be the most cost effective�means of reducing multiple pollutants, sev-�eral companies are developing a single-con-�trol technology to reduce multiple air pol-�lutants to levels equivalent to those�achieved by conventional controls.�
For example, a First Energy plant in�New Hampshire recently pilot-tested state-�of-the-art technology that has cut NOx�emissions by 76 percent, SO
2 by� 44 percent,�
total particulate matter by 99.94 percent,�and mercury by 81 percent. The process�uses electrically charged particles instead�of catalysts to oxidize the air pollutants into�products that are easily removed and can�be converted to gypsum, fertilizer, and con-�centrated acids. American Electric Power is�installing a wet scrubber system that it ex-�pects will remove up to 75 percent NOx and�
90 percent mercury. It injects a phosphorus�mixture into the hot flue gas, causing the re-�lease of ozone. The ozone then oxidizes the�mercury into ionic mercury and the NOx�into N
2, both of which are water-soluble and�
easily removed.�
Technologies for Improved Efficiencies Two-thirds of the energy used in a con-�
ventional coal-fired power plant is wasted in�the production of electricity. These losses�can be minimized through a number of inno-�vations, including installing high efficiency�steam turbines, reducing steam leaks, and�using software to optimize combustion effi-�ciency. New coal-burning power plants can�achieve efficiencies of over 40 percent using�existing technology, and companies are de-�veloping even more efficient technologies.�Wasted energy can also be recycled for use�in industrial processes or for heating build-�ings.�
A family of technologies known as�combined heat and power (CHP) can�achieve efficiencies of 80 percent or more.�In addition to environmental benefits, CHP�projects offer efficiency and cost savings in�a variety of settings, including industrial�boilers, energy systems, and small, building-�scale applications. At industrial facilities�alone, there is potential for an additional�124,000 megawatts (MW) of efficient power�from gas-fired CHP, which could result in�annual emission reductions of 614,000 tons�of NOx emissions and 44 million metric tons�of carbon equivalent. CHP is also one of a�group of clean, highly reliable distributed�energy technologies that reduce the amount�of electricity lost in transmission while�eliminating the need to construct expensive�power lines to transmit power from large�central power plants.�
The U.S. Department of Energy,�through its Clean Coal Technology Program,�is working with utilities and scientists to de-�velop even cleaner, more efficient electric-�ity-generating systems using coal. One of�the most promising new approaches to us-�ing coal for clean production of electricity is�integrated gasification combined-cycle�(IGCC) technology. IGCC power plants con-�vert coal to a gaseous fuel, from which most�
3-5 NATIONAL ENERGY POLICY

Clean Coal Technologies Up Close
The Wabash River Coal Gasification Project in Terre Haute, Indiana, is one of the�cleanest, most efficient coal-burning facilities in the country. Partly funded by the�Department of Energy (DOE) as part of its Clean Coal Technology Program, the 262-�MW coal gasification facility is owned and operated by PSI Energy and Global Energy,�Inc. Instead of being directly burned, the coal is gasified and then combusted in a�combined-cycle gas turbine. This allows the coal to burn more efficiently—which�means it gets more energy than a traditional plant out of the same amount of coal. The�Wabash River Facility is over 20 percent more efficient than a typical coal-fired power�plant.�
The gasification process also allows many of the impurities in the coal to be removed�before it is combusted to generate electricity. At the Wabash River project, over 99�percent of the sulfur is removed from the coal and marketed to industrial users of�sulfur. Slag is also removed and is marketed to the construction industry. The plant’s�design allows it to burn other fuels, such as petroleum coke.�
DOE is currently working with Global Energy and other industry partners to see if the�plant could also be used to co-produce chemical feedstocks and transportation fuels.�Additionally, DOE and its partners are studying lessons learned from the project to�design a less expensive, more efficient coal gasification facility that would be ready for�commercial deployment by 2005.�
of the impurities are removed prior to com-�bustion, and then use the gaseous fuel in a�combustion turbine to produce electricity.�Waste heat from the turbine is used to gen-�erate steam and drive a steam turbine, to�produce more electricity.�
Coal gasification plants offer the flex-�ibility to burn other fuels, such as petro-�leum coke, and to make other products in�addition to electricity, such as chemical�feedstocks and transportation fuels. Hydro-�gen, which is produced directly in the coal�gasifier, can be used in fuel cell-equipped�vehicles. Methane, hydrogen, and other�gasified coal products can be recombined�into more traditional fuels, such as metha-�nol, gasoline, or diesel fuel. Because these�fuels would contain essentially no sulfur,�they would easily meet EPA’s sulfur stan-�dards for transportation fuels, and they�would be usable in fuel cell-equipped ve-�hicles designed for these fuels.�
Two plants demonstrating coal gasifi-�cation technology have already been built�in the United States and have achieved over�98 percent SO
2 reduction, 90 percent NOx�
reduction, particulate emissions below de-�tectable levels, and approximately 38 per-�cent efficiency. EPA believes that lessons�
learned will enable the next plant of this de-�sign to achieve 42 percent efficiency, and�the research goal is to achieve 60 percent�efficiency for plants introduced after 2015.�
A modern gas-fired power plant has�virtually no SO
2 or mercury emissions and�
emits 97 percent less NOx and 50 percent�less carbon dioxide (CO
2) than a traditional�
coal-fired plant. Natural gas as a source of�electricity generation is on the rise, in part�because it can help generators meet in-�creasingly stringent clean air requirements.�
Conservation and Environmental Protection Conserving energy minimizes adverse�
environmental effects. Government partner-�ships with businesses and consumers are�improving the energy efficiency of homes,�office buildings, transportation sources, and�industrial sites throughout the country.�EPA’s voluntary conservation and energy ef-�ficiency programs include Energy Star�products labeling; Energy Star Residential�programs for both new homes and home�improvement; Energy Star Buildings, princi-�pally for commercial buildings; and new En-�ergy Star for Industry, which focuses on�manufacturers. In 2000, business participa-�tion in EPA’s voluntary energy efficiency�
Chapter 3 • Protecting America’s Environment: Sustaining the Nation’s Health and Environment 3-6

programs� reduced NOx emissions by more�than 160,000 tons.�
Through EPA’s and the Department of�Transportation’s Commuter Choice Leader-�ship Initiative, private-public employers are�offering employees a variety of commuting�options, which encourage commuting pat-�terns that save fuel and energy while reduc-�ing emissions. For example, a 10 percent re-�duction in the rate of growth in vehicle�miles traveled can result in annual savings�
Federal and state regulators of 38 million barrels of gasoline (82 million�
are working with businesses barrels of oil) by 2005, and can remove�and communities to mitigate 45,000 metric tons of NOx, 37,000 metric�adverse environmental tons of hydrocarbons, and 4.8 million met-�impacts by requiring develop- ric tons of carbon-equivalent emissions.�ers and operators to choose
Energy efficiency and conservation in�more environmentally
friendly sites, infrastructure the home are also important factors. Ex-�routes, and operational amples include EPA’s home improvement�criteria; fostering the use of program, which involves efficient appli-�technologies that both protect ances, duct work to prevent air condition-�the environment and still ers from leaking, efficient windows, pro-�meet energy production goals;
and requiring reclamation grammable thermostats, and efficient resi-�
and mitigation of any dential lighting.�environmental damage.
3-7 NATIONAL ENERGY POLICY
Water Quality Oil, gas, and coal extraction processes�
can degrade water quality through their dis-�charges. Energy generation and use can also�degrade water quality by directly discharg-�ing pollutants into water bodies; changing�the temperature, timing, and flow character-�istics of water bodies; and emitting pollut-�ants into the air that are ultimately depos-�ited in water. Leaking storage tanks and�pipelines release petroleum and fuel addi-�tives that can contaminate surface water�and ground water, including drinking-water�supplies.�
Federal and state regulators are work-�ing with businesses and communities to�mitigate these adverse impacts by requiring�developers and operators to choose more�environmentally friendly sites, infrastruc-�ture routes, and operational criteria; foster-�ing the use of technologies that both protect�the environment and meet energy produc-�tion goals; and requiring reclamation and�mitigation of any environmental damage.�For example, as a result of an analysis un-�der the National Environmental Policy Act�of the impacts of a new power plant in Cali-�fornia, the company building the plant�agreed to change the design to use a dry�cooling method. This change reduced�ground-water consumption by 95 percent�and eliminated both cooling tower�“blowdown” water and particulate emis-�sions, while still achieving the desired en-�ergy production. Adverse impacts to aquatic�life from cooling-water intakes, thermal dis-�charges, and hydropower intakes can be�minimized with proper design and environ-�mental controls. A cooperative government,�industry, and community-based approach�during project siting and design will help en-�sure full consideration of the effects upon�fish and aquatic resources.�
Programs to reduce air pollution also�help clean up water bodies. For example,�reducing electric utilities’ air emissions of�NOx and SO
2 and vehicles’ NOx emissions�
reduces eutrophication and acid deposition�in estuaries, both of which can harm fish�populations and threaten commercial and�recreational yields. For example, roughly 25�percent of nitrogen (which contributes to�

eutrophication) entering Chesapeake Bay is�from air emissions. And by significantly re-�ducing SO
2 air emissions, the Acid Rain Pro-�
gram has helped reduce the acidification of�water bodies.�
Airborne mercury emitted by coal-�fired power plants has been deposited into�thousands of water bodies, and humans can�be exposed to toxic methyl mercury when�they eat fish from these waters. The Bush�Administration will propose legislation add-�ing mercury to the list of pollutant emis-�sions from power plants that will be subject�to mandatory limits.�
Fish, Wildlife, and Their Habitat Ecosystems provide food, shelter, and�
critical breeding and spawning grounds for�fish and wildlife, and support commercial�and recreational fishing, tourism, and other�activities that contribute billions of dollars�to the U.S. economy every year. Oil and gas�exploration and production, hydropower�dams, power plants, pipelines, and other�energy-related projects can potentially af-�fect fish, wildlife, and habitat. However,�technological advances, a strong commit-�ment to environmental protection, and the�use of appropriate regulatory tools can�enable proper energy development to go�forward in an environmentally sensitive�manner. It is important to recognize and to�continue the progress in this area.�
When energy development is pro-�posed, the federal government has the dual�
Recommendation:Ä
★ The NEPD Group recommends�that the President direct the Secretary�of the Interior to work with Congress�to create the “Royalties Conservation�Fund.”�• This fund will earmark potentially�
billions of dollars in royalties from�new oil and gas prodution in�ANWR to fund land conservation�efforts.�
• This fund will also be used to�eliminate the maintenance and im-�provements backlog on federal�lands.�
responsibilities of facilitating such energy�development and conserving our natural re-�source legacy.�
Special efforts are often necessary to�ensure that proposed energy projects do�not diminish the vitality of these unique re-�sources. Working together, the public, busi-�nesses, and federal, state, tribal, and local�governments can ensure that environmental�impacts are carefully evaluated when con-�sidering energy exploration and production�activities. For example, such precautions�have been important for the exploration�and production that is already allowed to-�day in 42 National Wildlife Refuges.�
Hydropower Generation Hydropower, although a clean energy�
source, does present environmental chal-�lenges. Unless properly designed and oper-�ated, hydropower dams can injure or kill�fish, such as salmon, by blocking their pas-�sage to upstream spawning pools. Innova-�tions in fish ladders, screens, and hatcher-�ies are helping to mitigate these adverse im-�pacts. Ongoing dam relicensing efforts are�resulting in community involvement and the�industry’s application of the latest technolo-�gies to ensure the maintenance of down-�stream flows and the upstream passage of�fish. These efforts also have been success-�ful in identifying and removing older,�nonfunctioning dams and other impedi-�ments to fish movements.�
Technological advances and
a strong commitment to
environmental protection
are enabling the healthy
coexistence of our nation’s
diverse ecosystems with the
development of energy
resources.
Ecosystems provide food,
shelter, and critical breeding
and spawning grounds for
fish and wildlife, and
support commercial and
recreational fishing,
tourism, enhance our
quality of life,and other
activities that contribute
billions of dollars to the U.S.
economy every year.
Chapter 3 • Protecting America’s Environment: Sustaining the Nation’s Health and Environment 3-8

Some natural resource areas
are to be protected from any
exploration. In other areas,
energy development can
proceed using the most
advanced designs and
technologies to ensure that
proposed energy projects do
not diminish the vitality and
diversity of these unique
resources.
An example of such successful col-�laboration involves the Wanapum Dam on�the Columbia River. In coordination with�the National Marine Fisheries Service, the�Grant� County Public Utility District No. 2�installed spillway deflectors that effectively�reduced concentrations of total dissolved�gas that can harm fish and other aquatic�life. Furthermore, through the unique col-�laboration on this project, the cost for the�spillway deflectors was a fraction of that for�deflectors installed at other hydropower�projects.�
Coal, Oil, and Gas Exploration and Production Certain exploration and production�
activities can pose environmental impacts�to wildlife habitat, unless conducted in a�way that protects the environment. In sensi-�tive areas, these effects can often be�avoided or minimized by timing exploration�and operation activities in light of migra-�tion, nesting, and other critical time periods�for wildlife. In addition, new technologies�designed to lessen these and other impacts�can be used, such as double-walled pipes to�reduce the risk of oil spills.�
Surface impacts from coal mining and�oil exploration can temporarily damage�habitats during the operation phases until�reclamation is complete. To mitigate im-�pacts during mining, for example, storm-�water runoff and discharge into undis-�turbed environments are controlled. After�mining is complete, reclamation efforts re-�quired by the Surface Mining Control and�Reclamation Act restore viable habitats�through careful reconstruction of physical�and botanical resources. For instance, in�the Powder River Basin, as part of reclama-�tion, coal companies strategically place�large boulders and other rock material to�create wildlife cover and denning habitat.�Restoration of wildlife habitat on these re-�claimed areas has been quite successful.�
In Alaska’s Arctic—home to such ani-�mals as polar bears, musk oxen, caribou,�wolves, and arctic fox—the bitterly cold�winters have proven to be beneficial for en-�vironmentally responsible energy develop-�ment. For example, when the North Slope is�
frozen and snow-covered, seismic trains can�travel across it to gather geophysical infor-�mation. Furthermore, companies have�adopted innovative techniques to reduce the�possible impacts of exploration and devel-�opment. In Alaska’s National Petroleum Re-�serve, the “footprint” from most exploratory�wells on federal lands is short-lived and has�minimal impact due to the use of ice roads�and ice pads that melt with the spring thaw.�Advances in extended-reach drilling tech-�nologies have also served to minimize envi-�ronmental effects during energy production�activities.�
A lengthy 1999 Department of Energy�study examined the environmental benefits�of new exploration and production tech-�nologies and concluded that “improvements�over the past 40 years have dramatically re-�duced industry’s footprint on the fragile tun-�dra, have minimized waste produced, and�have protected the land for resident and mi-�grating wildlife.” The same study concluded�that “it is important to tell this remarkable�story of environmental progress in E&P [ex-�ploration and production] technology.�Greater awareness of the industry’s achieve-�ments in environmental protection will pro-�vide the context for effective policy, and for�informed decision-making by both the pri-�vate and public sectors.”�
Waste Management Vigilant management and careful dis-�
posal of waste from energy extraction and�production can prevent the contamination�of our air, land, and water. Federal and state�authorities are working to ensure that en-�ergy projects maintain sound programs to�safely handle wastes from mining, drilling,�generation and transmission.�
Nuclear power plants present waste�management challenges unique among en-�ergy-generating technologies. They generate�spent fuel, as well as other radioactive�waste, which must be isolated from ecosys-�tems and human contact for long periods of�time. Currently, spent fuel is stored at reac-�tor sites in a number of states, although ca-�pacity is limited. Newer technologies have�been developed to reduce the volume and�
3-9 NATIONAL ENERGY POLICY

increase the manageability of spent fuel,�but such spent fuel will still require safe�handling and long-term isolation.�
While the federal government has the�responsibility to address such high-level�wastes, states have the responsibility to ad-�dress low-level wastes from nuclear plants,�such as clothing and equipment. Disposal�options for this type of radioactive waste�are limited, because siting these facilities�has been controversial. In fact, there are�only three disposal facilities active in the�United States.�
Accidental Releases Since the passage of the Oil Pollution�
Act in 1990, which, among other things, re-�quired double-hulled vessels and improved�industry readiness, oil spilled in coastal�zone waters has decreased from almost 8�million gallons in 1990 to just over 1 million�gallons in 1999. Most energy production fa-�cilities implement comprehensive risk-man-�agement plans, which reduce the potential�for accidents and help local officials pre-�pare for accidents that may arise.�
In contrast, inland oil spills do not ap-�pear to be decreasing at the same rate as�coastal spills. The federal government re-�ceives many more inland oil spill notifica-�tions (9,000 notifications a year in the early�1990s versus 10,000 to 12,000 a year in the�late 1990s), and many very large inland oil�spills occur each year (over 100,000 gal-�lons). The continued problem with inland�oil spills may be due to aging pipelines,�storage tanks, and other infrastructure�components.�
Since the advent of commercial�nuclear power generation, there have been�no radiation-related injuries or deaths asso-�ciated with the operation of a commercial�nuclear power plant in the United States.�The most significant incident from a�nuclear plant in the United States, at Three�Mile Island in 1979, prompted improved�safety regulation of nuclear plants. New�nuclear reactor designs promise even�higher safety levels than the reactors cur-�rently operating in this country.�
Radiation exposure from nuclear fa-�cilities is extremely rare. In fact, roughly 82�percent of human exposure to radiation�comes from natural sources: radon gas; the�human body, which contains radioactive el-�ements; outer space; and rocks and soil. Ra-�don accounts for about 55 percent of our�exposure to natural sources of radiation; ra-�dioactive elements in our own bodies ac-�count for 11 percent; rocks and soil account�for 11 percent; and outer space, including�the sun, accounts for 8 percent. The remain-�ing 18 percent of average human radiation�exposure comes from man-made sources,�primarily medical and dental X-rays and�consumer products.�
The safety of U.S. nuclear energy�plants has improved sharply in recent years.�A safe nuclear energy plant is one that runs�well, experiences few unplanned outages,�and has a well-disciplined work force that�follows procedures and avoids accidents.�The safety of a U.S. nuclear energy plant is�typically gauged by monitoring indicators of�its performance in these areas: unplanned�automatic reactor shutdowns, the annual�percentage of possible power generated,�and the industrial safety accident rate for�plant workers.�
In 2000, for the fourth year in a row,�the number of unscheduled reactor shut-�downs was zero. The industry generated�91.1 percent of its potential maximum out-�put, breaking its 1999 record of 88.7 per-�cent, far better than the typical 80 percent�number of ten years ago.�
Today, U.S. nuclear plants are more ef-�ficient and safer than ever. In the increas-�ingly deregulated marketplace, competition�has forced improvements in plant opera-�tions that have benefited safety perfor-�mance as much as economic performance.�
Climate Change Energy-related activities are the pri-�
mary sources of U.S. man-made greenhouse�gas emissions, representing about 85 per-�cent of the U.S. man-made total carbon-�equivalent emissions in 1998.�
Chapter 3 • Protecting America’s Environment: Sustaining the Nation’s Health and Environment 3-10

Forests can absorb carbon
dioxide, which accounts for
the largest share of green
house gas emissions.
Working with the U.S. Fish
and Wildlife Service Re
search, Illinova Generating
Company has voluntarily
committed to reforesting
100,000 acres of bottomland
hardwood forests on National
Wildlife Refuges in the Lower
Mississippi River Valley.
Scientists continue to learn more�about global climate change, its causes,�potential impacts, and possible solutions.�
The United States recognizes the seri-�ousness of this global issue as scientists at-�tempt to learn more about climate change.�The United States is making progress in re-�ducing emissions of greenhouse gases. Re-�cent data show that the rate of growth in�U.S. greenhouse gas emissions has begun to�decline, even as the U.S. economy has been�growing at an unprecedented rate. For ex-�ample, historically U.S. CO
2 emissions have�
grown at roughly half the rate of GDP. In re-�cent years, however, very robust growth in�the nation’s GDP has been accompanied by�a slowdown in the growth of greenhouse�gas emissions. In both 1998 and 1999, U.S.�
GDP grew by more than 4 percent a year,�while CO
2 emissions grew by less than 1.5�
percent a year. In addition, the carbon inten-�sity of the U.S. economy—the amount of�CO
2 emitted per unit of GDP—declined by�
15 percent during the 1990s.�The United States has reduced green-�
house gas emissions by promoting energy�efficiency and the broader use of renewable�energy through a wide range of public-pri-�vate partnership programs. These programs�save energy, cut energy bills, enhance eco-�nomic growth, and reduce emissions of con-�ventional air pollutants as well as green-�house gases.�
The U.S. government, businesses, and�nongovernmental organizations are seques-�tering carbon, at home and abroad. For ex-�ample, working with the U.S. Fish and Wild-�life Service Research, Illinova Generating�Company has voluntarily committed to re-�foresting 100,000 acres of bottomland hard-�wood forests on National Wildlife Refuges�in the Lower Mississippi River Valley. It is�projected that this project will sequester ap-�proximately 13.5 million tons of carbon, im-�prove fish and wildlife populations by re-�storing the natural forest wetland habitats,�and enhance the Gulf of Mexico’s near-shore�aquatic environment by restoring natural�forested wetland filters to the Mississippi�River floodplain.�
Industry and the federal government�are researching various new technologies�that will reduce greenhouse gas emissions�or sequester those emissions, in geologic�formations, oceans, and elsewhere.�
3-11 NATIONAL ENERGY POLICY

Regulatory Structure The United States has adopted many�
regulatory protections to limit the environ-�mental damage and public health conse-�quences of the exploration, extraction, pro-�duction, and use of energy. Most environ-�mental controls are implemented through�state or federal permitting or review sys-�tems, which often require time for agency�review and public participation. Facilities�may need several different permits or re-�views from different agencies, and they�may also need to meet local licensing or�zoning laws. Businesses have an interest in�moving expeditiously to respond to con-�sumers’ needs. The public also has an inter-�est in participating in the system to ensure�that appropriate health and environmental�precautions will be taken.�
Regulatory requirements are not�static. New scientific information and new�control technologies result in new regula-�tions and modifications to existing regula-�tions over time. However, some level of�certainty in the regulatory environment is�important for all parties. Businesses can�plan more effectively in such an environ-�ment, and regulators can focus on ensuring�that the desired outcomes are in fact�achieved consistently. For example, studies�have shown that if electricity generators�knew today what their emission require-�ments for several emissions would be for a�defined time period, they would most likely�control emissions more cost effectively and�sooner than if their emission requirements�were decided upon one gas at a time.�
Traditional permit and regulatory pro-�grams may not always be the most effective�and efficient way to protect the environ-�ment. Increasingly, regulatory programs are�considering approaches that include mar-�ket-based incentives. These types of incen-�tives offer advantages over traditional�forms of regulation because they set high�performance standards and then allow mar-�ket forces to determine the most effective�way to meet them. While not appropriate�for every situation, market-based incentives�can control pollution at a lower cost to so-�ciety than traditional regulation, stimulate�
technological improvements, and be struc-�tured to achieve larger reductions in pollu-�tion than would result from traditional regu-�lations.�
A good example of a U.S. market-�based program is the Acid Rain Program,�which has reduced SO
2 air emissions from�
utilities at a fraction of the initial cost esti-�mates. Other emerging market-based envi-�ronmental protection mechanisms include�effluent trading, wetland mitigation banks,�tradable development rights, easement pur-�chases, off-site mitigation, and leasing or�purchasing of water rights. These programs�can reduce mitigation or pollution control�costs, increase business flexibility, and pro-�vide transparency and environmental pro-�tection for the public.�
Chapter 3 • Protecting America’s Environment: Sustaining the Nation’s Health and Environment 3-12

The environmental review process can�also be made more open, understandable,�predictable, and coordinated among federal�agencies and with state and local agencies.�It can be improved by providing greater in-�formation to clarify expectations for energy�developers, facilitating concurrent reviews�by federal agencies by standardizing certain�information needs, sharing information re-�ceived by project applicants, and seeking�opportunities to integrate required environ-�mental processes and reviews.�
Recommendation:
★ The NEPD Group recommends that the President issue an�Executive Order to rationalize permitting for energy production�in an environmentally sound manner by directing federal�agencies to expedite permits and other federal actions necessary�for energy-related project approvals on a national basis. This�order would establish an interagency task force chaired by the�Council on Environmental Quality to ensure that federal agen-�cies responsible for permitting energy-related facilities are�coordinating their efforts. The task force will ensure that federal�agencies set up appropriate mechanisms to coordinate federal,�state, tribal, and local permitting activity in particular regions�where increased activity is expected.�
3-13 NATIONAL ENERGY POLICY

Summary of Recommendations
Protecting America’s Environment: Sustaining the
Nation’s Health and Environment
★ The NEPD Group recommends that the President direct the Administrator�of the Environmental Protection Agency (EPA) to propose multi-pollutant�legislation. The NEPD Group recommends that the President direct the EPA�Administrator to work with Congress to propose legislation that would�establish a flexible, market-based program to significantly reduce and cap�emissions of sulfur dioxide, nitrogen oxides, and mercury from electric power�generators. Such a program (with appropriate measures to address local�concerns) would provide significant public health benefits even as we in-�crease electricity supplies.�• Establish mandatory reduction targets for emissions of three main pollut-�
ants: sulfur dioxide, nitrogen oxides, and mercury.�• Phase in reductions over a reasonable period of time, similar to the suc-�
cessful acid rain reduction program established by the 1990 amendments to�the Clean Air Act.�
• Provide regulatory certainty to allow utilities to make modifications to�their plants without fear of new litigation.�
• Provide market-based incentives, such as emissions trading credits to help�achieve the required reductions.�
★ The NEPD Group recommends the President direct the Secretary of the�Interior to work with Congress to create the “Royalties Conservation Fund.”�• This fund will earmark potentially billions of dollars in royalties from new�
oil and gas production in ANWR to fund land conservation efforts.�• This fund will also be used to eliminate the maintenance and improvements�
backlog on federal lands.�
★ The NEPD Group recommends the President issue an Executive Order to�rationalize permitting for energy production in an environmentally sound�manner by directing federal agencies to expedite permits and other federal�actions necessary for energy-related project approvals on a national basis.�This order would establish an interagency task force chaired by the Council�on Environmental Quality to ensure that federal agencies responsible for�permitting energy-related facilities are coordinating their efforts. The task�force will ensure that federal agencies set up appropriate mechanisms to�coordinate federal, state, tribal, and local permitting activity in particular�regions where increased activity is expected.�
Chapter 3 • Protecting America’s Environment: Sustaining the Nation’s Health and Environment
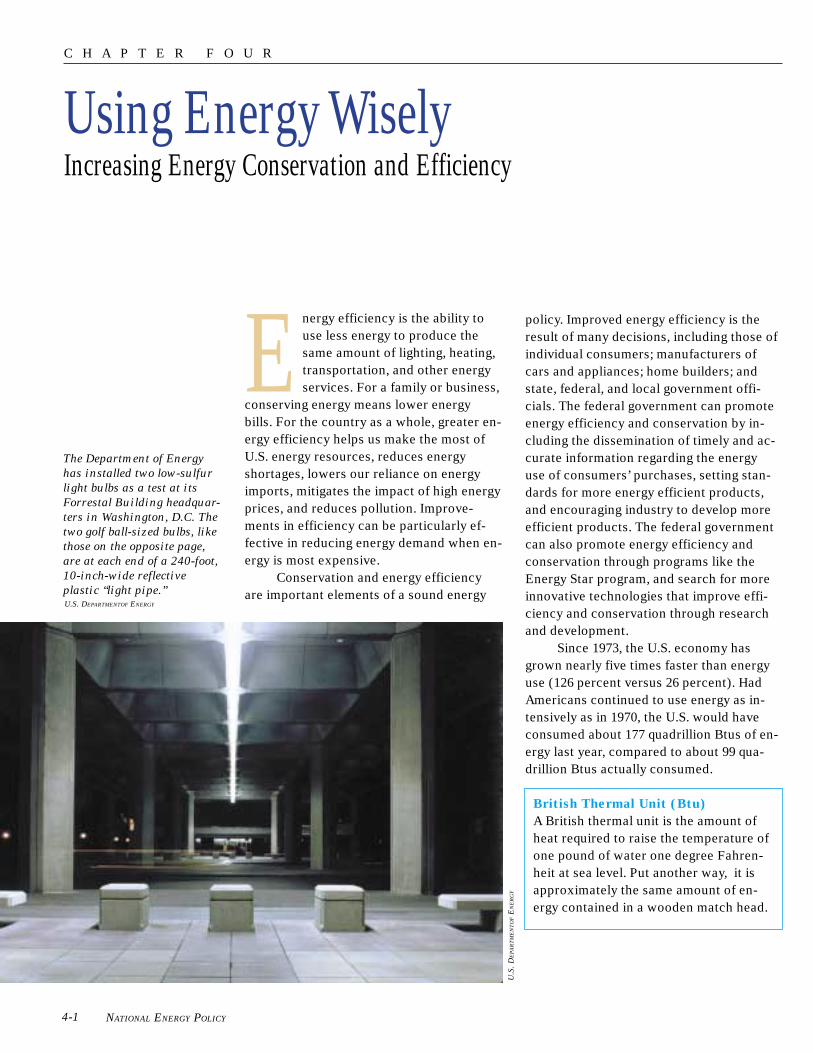
C H A P T E R F O U R �
Using Energy Wisely Increasing Energy Conservation and Efficiency
The Department of Energy
has installed two low-sulfur
light bulbs as a test at its
Forrestal Building headquar
ters in Washington, D.C. The
two golf ball-sized bulbs, like
those on the opposite page,
are at each end of a 240-foot,
10-inch-wide reflective
plastic “light pipe.” U.S. DEPARTMENTOF ENERGY
E nergy efficiency is the ability to�use less energy to produce the�same amount of lighting, heating,�transportation, and other energy�services. For a family or business,�
conserving energy means lower energy�bills. For the country as a whole, greater en-�ergy efficiency helps us make the most of�U.S. energy resources, reduces energy�shortages, lowers our reliance on energy�imports, mitigates the impact of high energy�prices, and reduces pollution. Improve-�ments in efficiency can be particularly ef-�fective in reducing energy demand when en-�ergy is most expensive.�
Conservation and energy efficiency�are important elements of a sound energy�
policy. Improved energy efficiency is the�result of many decisions, including those of�individual consumers; manufacturers of�cars and appliances; home builders; and�state, federal, and local government offi-�cials. The federal government can promote�energy efficiency and conservation by in-�cluding the dissemination of timely and ac-�curate information regarding the energy�use of consumers’ purchases, setting stan-�dards for more energy efficient products,�and encouraging industry to develop more�efficient products. The federal government�can also promote energy efficiency and�conservation through programs like the�Energy Star program, and search for more�innovative technologies that improve effi-�ciency and conservation through research�and development.�
Since 1973, the U.S. economy has�grown nearly five times faster than energy�use (126 percent versus 26 percent). Had�Americans continued to use energy as in-�tensively as in 1970, the U.S. would have�consumed about 177 quadrillion Btus of en-�ergy last year, compared to about 99 qua-�drillion Btus actually consumed.�
British Thermal Unit (Btu)
A British thermal unit is the amount of�heat required to raise the temperature of�one pound of water one degree Fahren-�heit at sea level. Put another way, it is�approximately the same amount of en-�ergy contained in a wooden match head.�
U.S
. D
EP
AR
TM
EN
TO
F E
NE
RG
Y
4-1 NATIONAL ENERGY POLICY


Figure 4-1 New Refrigerator-Freezers are Using Less Energy Consumption per Unit for New Shipments (Kilowatt-Hours per Year)
1,800
1,600
1,400
1,200
1,000
800
600
400
200
0
1972 80 85 90 95 01 Over the last thirty years, the energy efficiency of refrigerator-freezer appliances has increased by approximately 70 percent. ________Sources: AHAM 2000 Major HomeIndustry Fact Book and BTS appliancestandard.
Improving Efficiency through Innovative Technologies
One measure of energy efficiency is energy intensity—the amount of energy it takes to produce a dollar of gross domestic product (GDP). While about half of the long-term decline in energy intensity can be attributed to changes in the economy, especially the shift from manufacturing to services, the other half reflects improved energy efficiency. Gains in energy efficiency over the last three decades were built on a combination of technological improvements, better management practices, and learning to put these technologies and practices to their best use in automobiles, homes, offices, factories, and farms. In many areas the results have been quite impressive. New home refrigerators use about one-third of the electricity they used in 1972 (Figure 4-1). Compact fluorescent lights use about 25 percent of the electricity of the incandescent bulbs they replace. Automobiles use roughly 60 percent of the gasoline they did in 1972 per mile driven. These individual technological improvements have resulted in significant reductions in energy use (Figure 4-2).
Several new and innovative technolo-
Figure 4-2 The U.S. Economy Has Become More Energy Efficient
(Thousands of Btus)
gies offer expanded opportunities to improve our energy efficiency. For example, advanced sensors and controls enable more efficient operation of buildings and factories, and allow equipment and lights to be turned off or dimmed when not in use. Hybrid vehicles use power electronics and battery storage to get more out of every gallon of gasoline consumed, and provide the ability to double vehicle mileage. Cogeneration of electricity and heat and combined heat and power allow for the productive use of much of the waste heat from electricity production, which accounts for about two-thirds of the energy used to produce electricity.
District Energy St. Paul—
A Combined Heat and Power Plant
District Energy St. Paul, Inc., is a combined heat and power plant that canoperate on natural gas, oil, or cleanburning coal that is mixed with woodchips. These wood wastes come fromdowned trees, trimmings, andbranches. District Energy has beenable to keep its rates stable because itis able to rely on a diverse fuel supply.District Energy serves about 75 percent of all building space in the city.Nearly 150 large buildings and 3,200residential units use the system. It isthe largest system of its kind in thenation.
Recommendation:
★ The NEPD Group recommends thatthe President direct the Secretary ofEnergy to conduct a review of currentfunding and historic performance ofenergy efficiency research and development programs in light of the rec
20
18
16
14
12
10
1973 77 81 85 89 93 97 99
The amount of energy used by the United States in relation to its economic output has steadily declined since the early 1970s. ________Source: U.S. Department of Energy, Energy Information Administration.
4-3 NATIONAL ENERGY POLICY
ommendations of this report. Based on this review, the Secretary of Energy is then directed to propose appropriate funding of those research and development programs that are performance-based and are modeled as public-private partnerships.

Consumer Choices The two most important factors in
consumers’ decisions about purchasing an energy efficient product are price and the life of the product. When energy prices are high, consumers tend to weigh energy efficiency more heavily. Unless consumers are informed about the price of energy, they may not have the incentive to select the most energy efficient product.
Consumers do not receive timely signals about rising electricity costs in order to make adjustments to their energy use and efficiency. When consumers’ peak costs are averaged with off-peak costs, the higher cost of peak electricity supplies is masked. As a result, consumers may not recognize the benefits of investing in technologies that best target peak consumption.
Some energy efficiency improvements are easiest and most cost effective to undertake when first building new factories, cars, equipment, appliances, and buildings. Some energy-using equipment, like computers, are used for only a few years before being replaced. Other equipment is used from five to twenty years, such as home appliances, home electronics, and lighting systems. Some capital stock, such as buildings and boilers, can last a half a century or more.
The average car now lasts fourteen years, and newer cars have even more longevity. Vehicle efficiency improvements require significant technological changes. Development of new-car production models requires at least three to four years, which limits the rate at which new technologies can enter the market. Making fundamental changes, such as switching to the use of a fuel cell, would take even longer. Once those new vehicles are in the showroom, it then takes several more years before they constitute any sizable percentage of total vehicles.
In a typical U.S. home, appliances are responsible for about 20 percent of the energy bills. Refrigerators, freezers, clothes washers, dryers, dishwashers, and ranges and ovens are the primary energy-using appliances in most households. Taking steps to save energy while using these appliances, and replacing old inefficient appli
ances with modern ones can save money. The federal government established a
mandatory program in the 1970s requiring that certain types of new appliances bear a label to help consumers compare the energy efficiency of various products. Under this program, all refrigerators, freezers, clothes washers, and dishwashers are sold with yellow Energy Guide labels to indicate their energy efficiency. These labels provide an estimated annual operating cost of the appliance, and also indicate the cost of operating the models with the highest annual operating cost and the lowest annual operating cost. By comparing a model’s annual operating cost with the operating cost of the most efficient model, you can compare their efficiencies. This labeling program ensures that consumers have the information they need to make the right decisions when they purchase major home appliances. However, Energy Guide labels are not currently required for some products, such as kitchen ranges, microwave ovens, clothes dryers, on–demand water heaters, portable space heaters, and lights.
The federal government not only ensures consumers have information on the energy efficiency of major home appliances. It also promotes the most energy efficient products through the Energy Star program, a joint program run by the Department of Energy and the Environmental Protection
Some efficiency improve
ments are easiest and most
cost-effective to undertake
when first building new
factories, cars, equipment,
appliances and buildings.
Chapter 4 • Using Energy Wisely: Increasing Energy Conservation and Efficiency 4-4

In April 2001, the Sustain
able Buildings Industry
Council showcased a net
zero-energy home featuring
passive solar design strate
gies, an integrated photovol
taic system, domestic solar
hot water, high-efficiency
lights and appliances, and a
host of sustainable, market
ready components and
systems. SUSTAINABLE BUILDINGS INDUSTRY COUNCIL
A 48-story skyscraper at the corner of Broad
way and 42nd Street in New York City has a
photovoltaic skin that uses thin-film PV panels
to replace traditional glass cladding material.
The PV curtain wall extends from the 35th to
the 48th floors on the south and east walls of
the tower, making it a highly visible part of the
New York City skyline. U.S. DEPARTMENT OF ENERGY, NATIONAL RENEWABLE ENERGY
LABORATORY
Agency. Energy Star is only awarded to appliances that significantly exceed minimum energy efficiency standards. The Energy Star program does not extend to all products. Energy efficiency would be further promoted if the Energy Star program were expanded to a broader range of products.
Recommendation:
★ The NEPD Group recommends that the President direct the Secretary of Energy to promote greater energy efficiency. • Expand the Energy Star program be
yond office buildings to include schools, retail buildings, health care facilities, and homes.
• Extend the Energy Star labeling program to additional products, ap
pliances, and services. • Strengthen Department of Energy
public education programs relating to energy efficiency.
Energy efficiency can also be improved by the establishment of minimum energy efficiency standards. Congress enacted legislation in 1987 and 1988 to establish minimum energy efficiency standards for many major appliances. These standards apply to manufacturers, not consumers. Appliance manufacturers must produce products that meet the minimum level of energy efficiency. These rules do not affect the marketing of products manufactured before the standards went into effect, and any products made beforehand can be sold. The new standards will stimulate energy savings that benefit the consumer, and reduce fossil fuel consumption, thus reducing air emissions.
These laws established minimum energy efficiency standards for many appliances, including refrigerators, refrigeratorfreezers, freezers, room air conditioners, fluorescent lamp ballasts, and incandescent reflector lamps, clothes dryers, clothes washers, dishwashers, kitchen ranges, and ovens, pool heaters, and water heaters. The Energy Policy Act of 1992 added standards for fluorescent and incandescent reflector lamps, plumbing products, electric motors, and commercial water heaters, and heating, ventilation, and air conditioning systems. Under current law, the Department of Energy can raise the minimum energy efficiency standards for these appliances if certain criteria are met, such as cost, technological feasibility, and the impact on competition among appliance manufacturers. In addition, the Department can set energy efficiency standards for appliances not covered by these laws.
Recommendation:
★ The NEPD Group recommends that the President direct the Secretary of Energy to take steps to improve the energy efficiency of appliances.
4-5 NATIONAL ENERGY POLICY

• Support appliance standards program for covered products, setting higher standards where technologically feasible and economically justified.
• Expand the scope of the appliance standard program, setting standards for additional appliances where technologically feasible and economically justified.
Energy Efficiency Government Agencies
As the largest energy consumer in the nation, the U.S. government’s cost- and energy-saving opportunity is enormous. In 1999, the government consumed nearly 1.1 percent of all U.S. energy and spent nearly $8 billion for its vehicles, operations, and its nearly 500,000 buildings.
The federal government has reduced its energy use in buildings by about 30 percent from 1990 levels, largely by installing energy efficient technologies (Figure 4-3). It has reduced its energy use for vehicles and equipment by 35 percent. Some of these improvements are attributable to the Department of Energy, whose Federal Energy Management Program helps government agencies reduce their energy and water use, manage their utility costs, and promote renewable energy.
Recommendations:
★ The NEPD Group recommends that the President direct heads of executive departments and agencies to take appropriate actions to conserve energy use at their facilities to the maximum extent consistent with the effective discharge of public responsibilities. Agencies located in regions where electricity shortages are possible should conserve especially during periods of peak demand. • Agencies should report to the Presi
dent, through the Secretary of Energy, within 30 days of the conservation actions taken.
State and local governments have unique opportunities for energy savings in schools, transportation, state buildings, and building codes. For example, the Texas School Energy Management Program could save school districts as much as $100 million in energy costs every year by helping school districts evaluate their energy needs and resources. Similarly, Wisconsin’s Energy Initiative is working with utilities to make basic changes to public buildings. By installing new lighting fixtures and taking other steps, Wisconsin estimates that it will save $60 million in state spending on energy over ten years.
Residential and Commercial Buildings There are significant opportunities to
improve the energy efficiency of buildings and homes through technologies and better practices. For existing homes, immediate options for improving efficiency include reducing air infiltration with caulking and weather stripping, installing modern thermostats, sealing ductwork, and adding insulation. These steps can reduce the 40 percent share of residential energy bills that
Figure 4-3 The U.S. Government is ReducingIts Energy Consumption (Trillions of Btus)
1,500
1,400
1,300
1,200
1,100
1,000 800
1990 91 92 93 94 95 96 97 98 99
During the 1990s, energy use in federal buildings decreased by about 30 percent. ________Source: U.S. Department of Energy, Energy Information Administration.
Chapter 4 • Using Energy Wisely: Increasing Energy Conservation and Efficiency 4-6

PULTE HOMES
Building America—Pulte Homes
Pulte Homes Southwest Division has used technical assistance from the Department of Energy’s Building America program to create what one residential expert calls “the best production house in the world,” which won the 2001 National Association of Home Builders’ Energy Value Award. In Tucson, Phoenix, and Las Vegas, Pulte Homes has worked with the Department of Energy to redesign the energy features of its basic models.
Using advanced insulation techniques, highly efficient equipment and windows, and right-sized heating and cooling systems, the homes look the same, but perform so well they use half the energy for heating and cooling at virtually no increase in construction costs.
The whole building/systems engineering approach used in the Building America program allows builders to add more insulation and more efficient windows while reducing the size of the heating and cooling equipment. The trade-off means no added cost to the builder, better value for the buyer, reduced electric load for the utility, and improved affordability.
go toward heating and cooling. Additional savings are possible when efficient appliances are purchased or major home renovations are undertaken. Installing a new, more efficient gas furnace can save up to 20 percent annually on natural gas. New buildings offer the greatest energy efficiency opportunities and can be designed to be both more comfortable and more efficient, cutting heating and cooling costs by close to 50 percent.
In commercial buildings, typically the quickest, most cost effective way to increase energy efficiency is to replace the lighting systems. Sensors help to avoid 24hour operation of lights and equipment that are only used for a portion of the day. As with homes, advances in windows, heating and air conditioning systems, overall building designs, and equipment and appliances present significant energy saving opportunities.
Many families and businesses can face obstacles to realizing energy cost reductions.
Insufficient Information Monthly energy bills generally report
only total electricity or natural gas used, leaving families and businesses unsure about which energy services are most responsible for their energy use, and which investments could best help them reduce their costs. In addition, consumers may be unsure about the credibility of the energysaving claims of individual manufacturers, salesmen, and designers. This incomplete information causes imperfections in the marketplace that hinder purchases of efficient technologies that would actually save families and businesses money.
Lack of Availability Frequently, the most energy efficient
products cost more and are not widely available, especially in smaller communities. Builders who would like to construct more efficient homes and businesses face the same problem at the wholesale level. For example, to keep costs down, builders are less likely to install top-of-the-line,
4-7 NATIONAL ENERGY POLICY

highly efficient products. The less expensive and generally less efficient products are heavily stocked and deeply discounted due to volume ordering. The decisions made about the energy efficiency of buildings and homes are not usually made by the consumer who will ultimately pay the energy bills. The incentive is for the builders to choose the material that poses the least cost to the builder, which is not necessarily the most energy efficient choice.
Lack of Automation People often walk out of their offices
and homes with the lights on and the air conditioner running. Turning off unused appliances, electronics, and lights is not always easy. Lack of automation (e.g., daylight sensors) means that conservation mostly depends on people turning off switches. Some appliances and electronics, such as stereos, video tape players, and televisions, continue to use electricity even after they are turned off.
Higher Initial Costs Efficient products often cost more
than less efficient versions, especially when they are first introduced to the market. Unless consumers can verify the resulting savings, they may be reluctant to pay the additional costs. Businesses that adopt labeling programs that spell out energy savings may be more successful in selling a more efficient, yet initially more expensive product. Higher initial costs can be particularly difficult for the purchaser or builder of a new home or office building.
Industry and Agriculture Six industries consume three-quarters
of all industrial energy: lumber and paper; chemicals; petroleum refining; primary metals; food processing; and stone, clay, and glass. Improved energy efficiency in these energy-intensive industries yields even larger improvements in overall productivity, product quality, safety, and pollution prevention. Manufacturing companies generally obtain their largest savings from
Chapter 4 • Using Energy Wisely: Increasing Energy Conservation and Efficiency 4-8
improved efficiency of motors (motors account for 54 percent of electricity use in manufacturing) and from improved steam and hot-water systems. Many companies can reduce energy needs further by cogenerating their electricity and heat for steam.
Energy use for U.S. agriculture grew during the 1960s and 1970s, peaking in 1978. High energy prices during the 1970s and early 1980s caused many farmers to find ways to reduce their energy costs, such as by switching from gasoline-powered to more fuel-efficient dieselpowered engines, adopting conservation tillage practices, shifting to larger multiprocessor machines, and using energy saving methods for drying and irrigating crops. These measures helped farmers reduce their energy use by 41 percent from 1978 to 1998, while agricultural output grew by about 40 percent over the same period.
Farmers can reap additional energy savings as they replace old machinery with more energy efficient equipment. Furthermore, farmers can adopt more advanced practices, such as precision farming, that optimize the use of machines, chemicals, and fertilizers to achieve energy savings. New seed varieties can also reduce energyintensive chemical requirements.
Despite the opportunity for increased energy efficiency, the industrial and agricultural sectors face several obstacles. Because many manufacturing and farming operations are highly specialized, they need specific information on energy-saving opportunities to effectively respond to energy price signals and supply problems.
High energy prices during
the 1970s and early 1980s
caused many farmers to find
ways to reduce their energy
costs, such as by switching
from gasoline-powered to
more fuel efficient diesel
powered engines and by
adopting conservation tillage
practices.

Cogeneration
In 1998, Malden Mills Industries, a textile manufacturer employing 2,300 workers in Lawrence, Massachusetts, installed a state-of-the-art combined heat and power (CHP) facility. The system uses two 4.3 MW industrial gas turbines, retrofitted with ceramic combustion liners, that were developed as part of the Department of Energy’s Advanced Turbine Systems program, and that enable higher operating temperatures and lower emissions. The CHP system saves Malden Mills more than $1 million annually. The liners have accumulated more than 9,500 hours of successful operation and have cut emissions of nitrogen oxides and carbon monoxide to less than 15 parts per million.
In order for manufacturing or agriculture to switch to more efficient energy products and practices, significant costs are incurred due to production delays, waste and spoilage, and labor costs. As a result, manufacturers and farmers tend to use readily available and reliable equipment when upgrading, instead of untested, newer products and approaches.
Because of their large needs for both heat and electricity, businesses find combined heat and power (CHP) systems particularly attractive. However, replacing old, inefficient boilers with highly efficient CHP systems may add a number of new regulatory requirements (such as air permits), but does not offer the same tax depreciation incentives the tax code grants to power plants.
Recommendations:
★ The NEPD Group recommends that the President direct the Secretary of the Treasury to work with the Congress on legislation to encourage increased energy efficiency through combined heat and power (CHP) projects by shortening the depreciation life for CHP projects or providing an investment tax credit.
★ The NEPD Group recommends that the President direct the Administrator of the Environmental Protection Agency (EPA) to work with local and state governments to promote the use of well-designed CHP and other clean power generation at brownfield sites, consistent with the local communities’ interests. EPA will also work to clarify liability issues if they are raised at a particular site.
★ The NEPD Group recommends that the President direct the EPA Administrator to promote CHP through flexibility in environmental permitting.
Conservation can be improved by car pooling,
telecommuting, increasing public transit
choices, and pricing highway use during
periods of peak demand.
Transportation Transportation plays a key role in a
growing U.S. economy, comprising 16 percent of GDP in 1998, 10.5 percent of total employment, and 27 percent of total U.S. energy consumption. Trucks and automobiles account for over three-fourths of the sector’s petroleum use, with the remainder attributable to rail, ship, air, and pipeline systems. Mass transit ridership has increased by 21 percent since 1996. Automobiles today use roughly 60 percent of the gasoline they did in 1972 per mile driven, due in part to new technology, such as better engine and design controls, improved transmission, weight reduction, and improved aerodynamics. Despite the adoption of more efficient transportation technologies, average fuel economy for passenger vehicles has remained relatively flat for ten years and is, in fact, at a twenty-year low, in large part due to the growth and popularity of low-fuel-economy pickup trucks, vans, and sport utility vehicles (Figure 4-4).
Recommendation:
★ The NEPD Group recommends that the President direct the Secretary of Transportation to: • Review and provide recommenda
tions on establishing Corporate Average Fuel Economy (CAFE) standards with due consideration of the National Academy of Sciences study to be released in July 2001. Responsibly crafted CAFE standards should increase efficiency without negatively impacting the U.S. automotive industry. The determination of future fuel economy standards must therefore be addressed analytically and based on sound science.
• Consider passenger safety, economic concerns, and disparate impact on the U.S. versus foreign fleet of automobiles.
• Look at other market-based approaches to increasing the national average fuel economy of new motor vehicles.
4-9 NATIONAL ENERGY POLICY

Opportunities for reducing oil demand in the transportation sector include increasing conservation, vehicle efficiency, and alternative fuels. Conservation can be improved by car pooling, telecommuting, and increasing transit choices. For example, an increase in the average fuel economy of the on-road vehicle fleet by three miles per gallon would save one million barrels of oil a day, or about half of the global shortfall between supply and demand that triggered the oil price increases since 1998. In addition, fuel conservation can be further improved by technologies to reduce congestion.
A recent analysis indicates that the fuel economy of a typical automobile could be enhanced by 60 percent by increasing engine and transmission efficiency and reducing vehicle mass by about 15 percent. Several promising efficiency technologies are being presented to the U.S. market. For example, some automobile manufacturers have already introduced hybrid vehicles, and others have announced that they will introduce hybrid vehicles within the next several years. Advanced lightweight materials offer up to 6 percent improvement in mileage for each 10 percent reduction in body weight. Although promising, it may be many years before hybrids become a substantial part of the automotive fleet.
Recommendations:
★ The NEPD Group recommends thatthe President direct the Secretary ofTransportation to review and promotecongestion mitigation technologiesand strategies and to work with theCongress on legislation to implementthese strategies.
★ The NEPD Group recommends thatthe President direct the Secretary ofthe Treasury to work with Congress onlegislation to increase energy efficiency with a tax credit for fuel-efficient vehicles. The NEPD Group recommends that a temporary, efficiencybased income tax credit be availablefor purchase of new hybrid or fuel cellvehicles between 2002 and 2007.
Higher Initial Production Costs Because of the large economies of
scale in automobile manufacturing, new technologies with limited early production runs often enter the market at higher initial costs. In this highly competitive international market, higher initial production costs can be a significant impediment to the introduction of new technologies. Unless U.S. automakers can remain competitive with their overseas counterparts, it is unlikely they will invest in new, more efficient technologies. Vehicle efficiency technologies, such as advanced engines, fuel cells, and cutting-edge electronic drive-train technologies, will become widely available only when component costs are reduced or demand is increased.
Hybrid Vehicles
The engine of a conventional gasoline vehicle is typically sized for the small amount of time the driver spends accelerating to enter the freeway, to pass another car, or to climb a hill. Most of the time it operates at less than 20 percent efficiency. An attractive alternative is to use a hybrid system that allows the engine to operate at peak efficiency, and get a boost from a battery when entering the freeway or climbing a hill. Not only does this system allow improved performance from a smaller engine, but the energy usually lost in stopping the car can be recovered and stored in the battery.
What does this mean to the average American? Significantly improved fuel economy and reduced emissions.
Figure 4-4 Fuel Efficiency of LightVehicles Has Remained Flat (Miles per Gallon)
New Trucks
30
25
20
15
10
5
0
New Cars
Combined
1980 85 90 95
Despite the adoption of more efficient transportation technologies, U.S. average fuel economy has been flat for 10 years. In large part, this is due to the growth of low-fueleconomy pickup trucks, vans, and sport utility vehicles. ________Source: U.S. Department of Energy, EnergyInformation Administration.
Chapter 4 • Using Energy Wisely: Increasing Energy Conservation and Efficiency 4-10
00

Summary of Recommendations
Using Energy Wisely: Increasing Energy Conservation and Efficiency
★ The NEPD Group recommends that the President direct the Office of Science and Technology Policy and the President’s Council of Advisors on Science and Technology to review and make recommendations on using the nation’s energy resources more efficiently.
★ The NEPD Group recommends that the President direct the Secretary of Energy to conduct a review of current funding and historic performance of energy efficiency research and development programs in light of the recommendations of this report. Based on this review, the Secretary of Energy is then directed to propose appropriate funding of those research and development programs that are performance-based and are modeled as public-private partnerships.
★ The NEPD Group recommends that the President direct the Secretary of Energy to promote greater energy efficiency.
• Expand the Energy Star program beyond office buildings to include schools, retail buildings, health care facilities, and homes.
• Extend the Energy Star labeling program to additional products, appliances, and services.
• Strengthen Department of Energy public education programs relating to energy efficiency.
★ The NEPD Group recommends that the President direct the Secretary of Energy to improve the energy efficiency of appliances.
• Support the appliance standards program for covered products, setting higher standards where technologically feasible and economically justified.
• Expand the scope of the appliance standards program, setting standards for additional appliances where technologically feasible and economically justified.
★ The NEPD Group recommends that the President direct heads of executive departments and agencies to take appropriate actions to conserve energy use at their facilities to the maximum extent consistent with the effective discharge of public responsibilities. Agencies located in regions where electricity shortages are possible should conserve especially during periods of peak demand. Agencies should report to the President, through the Secretary of Energy, within 30 days on the conservation actions taken.
★ The NEPD Group recommends that the President direct the Secretary of the Treasury to work with Congress to encourage increased energy efficiency through combined heat and power (CHP) projects by shortening the depreciation life for CHP projects or providing an investment tax credit.
★ The NEPD Group recommends that the President direct the Administrator of the Environmental Protection Agency (EPA) to work with local and state governments to promote the use of well-designed CHP and other clean power generation at brownfields sites, consistent with the local communities’ interests. EPA will also work to clarify liability issues if they are raised at a particular site.
★ The NEPD Group recommends that the President direct the EPA Administrator to promote CHP through flexibility in environmental permitting.
★ The NEPD Group recommends that the President direct the Secretary of Transportation to: • Review and provide recommendations on establishing Corporate Average Fuel Economy (CAFE) standards
with due consideration of the National Academy of Sciences study to be released in July 2001. Responsibly
4-11 NATIONAL ENERGY POLICY

crafted CAFE standards should increase efficiency without negatively impacting the U.S. automotive industry. The determination of future fuel economy standards must therefore be addressed analytically and based on sound science.
• Consider passenger safety, economic concerns, and disparate impact on the U.S. versus foreign fleet of automobiles.
• Look at other market-based approaches to increasing the national average fuel economy of new motor vehicles.
★ The new NEPD Group recommends that the President direct the Secretary of Transportation to review and promote congestion mitigation technologies and strategies and work with Congress on legislation to implement these strategies.
★ The NEPD Group recommends that the President direct the Secretary of the Treasury to work with Congress on legislation to increase energy efficiency with a tax credit for fuel-efficient vehicles. The NEPD Group recommends that a temporary, efficiency-based income tax credit be available for purchase of new hybrid fuel cell vehicles between 2002 and 2007.
★ The NEPD Group recommends that the President direct all agencies to use technological advances to better protect our environment.
• The Administration remains committed to investing in Intelligent Transportation Systems (ITS) and encourages the private sector to invest in ITS applications. This Department of Transportation (DOT) program funds the development of improved transportation infrastructure that will reduce congestion, such as traveler information/navigation systems, freeway management, and electronic toll collection. ITS applications reduce fuel associated with travel.
• The Administration remains committed to the DOT’s fuel-cell-powered transit bus program, authored by the Transportation Equity Act for the 21st Century (TEA-21). This program demonstrates the viability of fuel-cell power plants for transit bus applications.
• The Administration remains committed to the Clean Buses program. TEA-21 establishes a new clean fuel formula grant program, which provides an opportunity to accelerate the introduction of advanced bus propulsion technologies into the mainstream of the nation’s transit fleet.
★ The NEPD Group recommends that the President direct the EPA and DOT to develop ways to reduce demand for petroleum transportation fuels by working with the trucking industry to establish a program to reduce emissions and fuel consumption from long-haul trucks at truck stops by implementing alternatives to idling, such as electrification and auxiliary power units at truck stops along interstate highways. EPA and DOT will develop partnership agreements with trucking fleets, truck stops, and manufacturers of idle-reducing technologies (e.g., portable auxiliary packs, electrification) to install and use low-emission-idling technologies.
★ The NEPD Group recommends that the President direct the Secretary of Energy to establish a national priority for improving energy efficiency. The priority would be to improve the energy intensity of the U.S. economy as measured by the amount of energy required for each dollar of economic productivity. This increased efficiency should be pursued through the combined efforts of industry, consumers, and federal, state, and local governments.
★ The NEPD Group recommends that the President direct the EPA Administrator to develop and implement a strategy to increase public awareness of the sizable savings that energy efficiency offers to homeowners across the country. Typical homeowners can save about 30 percent (about $400) a year on their home energy bill by using Energy Star-labeled products.
Chapter 4 • Using Energy Wisely: Increasing Energy Conservation and Efficiency 4-12
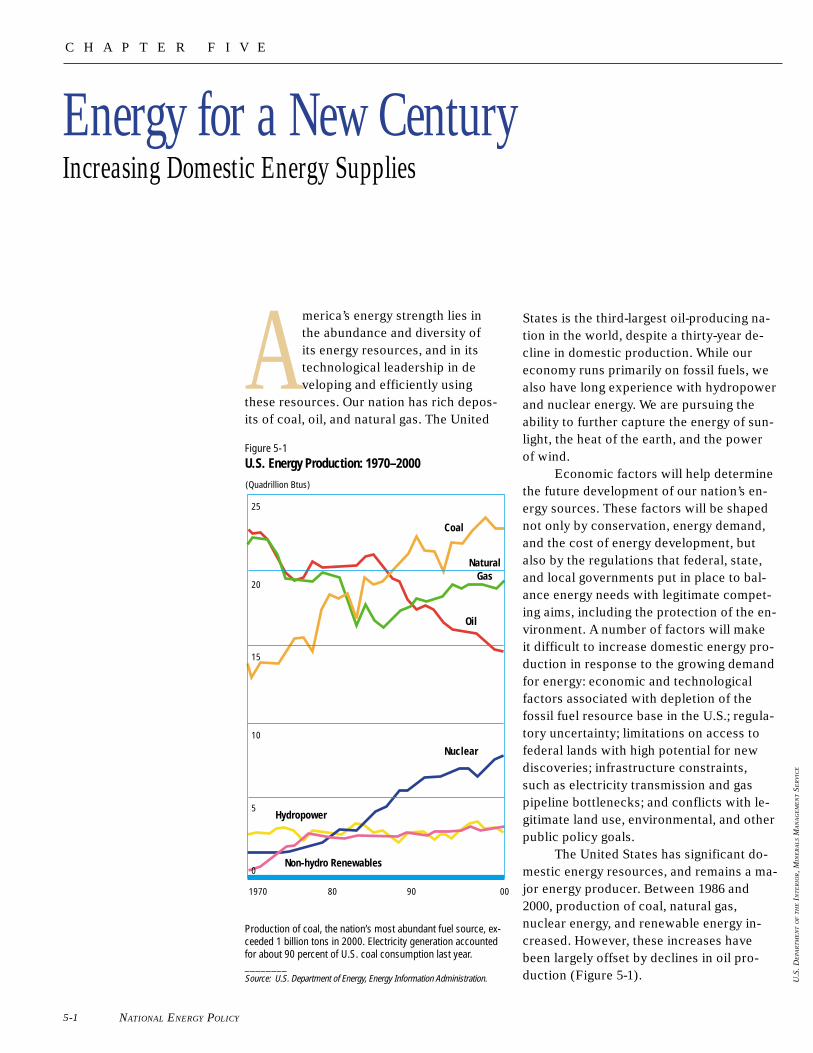
C H A P T E R F I V E
Energy for a New CenturyIncreasing Domestic Energy Supplies
America’s energy strength lies in the abundance and diversity of its energy resources, and in its technological leadership in de veloping and efficiently using
these resources. Our nation has rich deposits of coal, oil, and natural gas. The United
Figure 5-1 U.S. Energy Production: 1970–2000 (Quadrillion Btus)
Coal
Oil
Nuclear
25
20
15
10
5
0 Non-hydro Renewables
Hydropower
Natural Gas
States is the third-largest oil-producing nation in the world, despite a thirty-year decline in domestic production. While our economy runs primarily on fossil fuels, we also have long experience with hydropower and nuclear energy. We are pursuing the ability to further capture the energy of sunlight, the heat of the earth, and the power of wind.
Economic factors will help determine the future development of our nation’s energy sources. These factors will be shaped not only by conservation, energy demand, and the cost of energy development, but also by the regulations that federal, state, and local governments put in place to balance energy needs with legitimate competing aims, including the protection of the environment. A number of factors will make it difficult to increase domestic energy production in response to the growing demand for energy: economic and technological factors associated with depletion of the fossil fuel resource base in the U.S.; regulatory uncertainty; limitations on access to federal lands with high potential for new discoveries; infrastructure constraints, such as electricity transmission and gas pipeline bottlenecks; and conflicts with legitimate land use, environmental, and other public policy goals.
The United States has significant domestic energy resources, and remains a major energy producer. Between 1986 and 2000, production of coal, natural gas, nuclear energy, and renewable energy increased. However, these increases have been largely offset by declines in oil production (Figure 5-1). U
.S. D
EPA
RT
ME
NT
OF
TH
E I
NT
ER
IOR, M
INE
RA
LS M
AN
AG
EM
EN
T S
ER
VIC
E
1970 80 90 00
Production of coal, the nation’s most abundant fuel source, exceeded 1 billion tons in 2000. Electricity generation accounted for about 90 percent of U.S. coal consumption last year. ________Source: U.S. Department of Energy, Energy Information Administration.
5-1 NATIONAL ENERGY POLICY

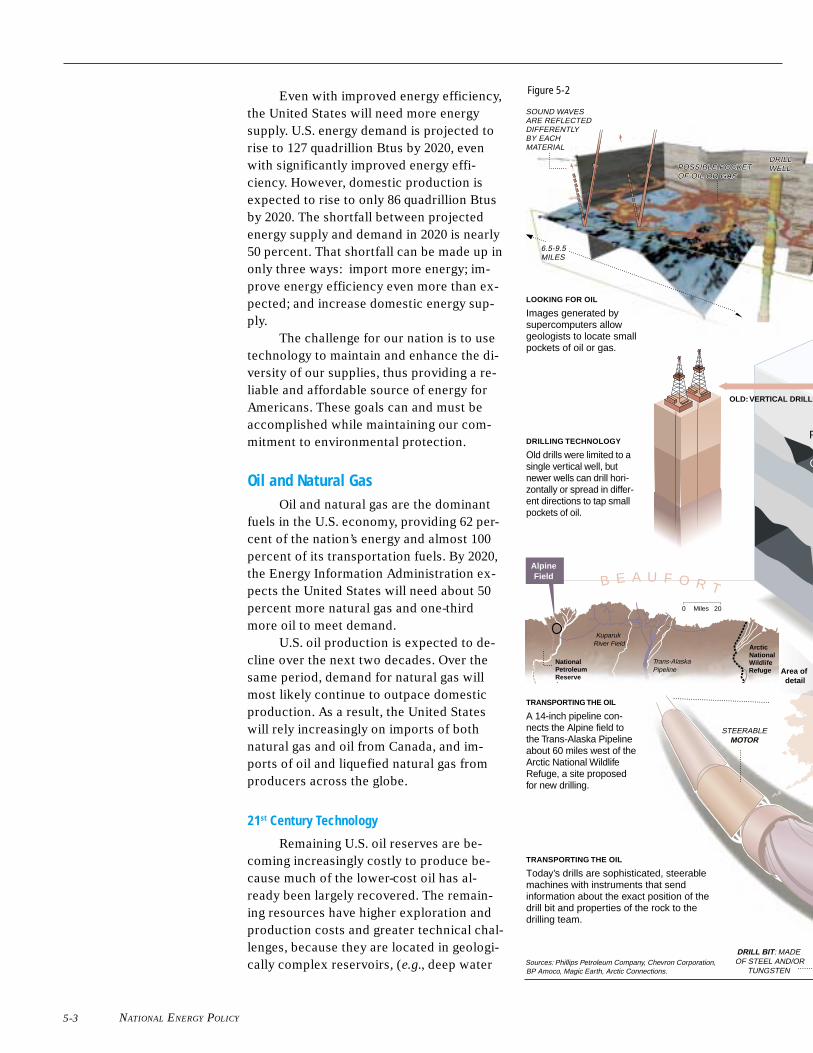
DRILL DRILL WELLWELLPOSSIBLE POCKET POSSIBLE POCKET
OF OIL OR GASOF OIL OR GAS
Even with improved energy efficiency, Figure 5-2
SOUND WAVESthe United States will need more energy ARE REFLECTED
supply. U.S. energy demand is projected to BY EACH
rise to 127 quadrillion Btus by 2020, even MATERIAL
DIFFERENTLY
DRILLwith significantly improved energy effi- POSSIBLE POCKET WELL OF OIL OR GAS
ciency. However, domestic production is expected to rise to only 86 quadrillion Btus by 2020. The shortfall between projected energy supply and demand in 2020 is nearly 50 percent. That shortfall can be made up in only three ways: import more energy; improve energy efficiency even more than expected; and increase domestic energy supply.
The challenge for our nation is to use technology to maintain and enhance the diversity of our supplies, thus providing a reliable and affordable source of energy for Americans. These goals can and must be accomplished while maintaining our commitment to environmental protection.
Oil and Natural Gas Oil and natural gas are the dominant
fuels in the U.S. economy, providing 62 percent of the nation’s energy and almost 100 percent of its transportation fuels. By 2020, the Energy Information Administration expects the United States will need about 50 percent more natural gas and one-third more oil to meet demand.
U.S. oil production is expected to decline over the next two decades. Over the same period, demand for natural gas will most likely continue to outpace domestic production. As a result, the United States will rely increasingly on imports of both natural gas and oil from Canada, and imports of oil and liquefied natural gas from producers across the globe.
21st Century Technology
Remaining U.S. oil reserves are becoming increasingly costly to produce because much of the lower-cost oil has already been largely recovered. The remaining resources have higher exploration and production costs and greater technical challenges, because they are located in geologically complex reservoirs, (e.g., deep water
Area of detail
Arctic National Wildlife Refuge
Trans-Alaska Pipeline
0 20 Miles
National Petroleum Reserve
Alpine Field B E A U F O R T
Kuparuk River Field
OLD: VERTICAL DRILLI
O
P
LOOKING FOR OIL
Images generated by supercomputers allow geologists to locate small pockets of oil or gas.
DRILLING TECHNOLOGY
Old drills were limited to a single vertical well, but newer wells can drill horizontally or spread in different directions to tap small pockets of oil.
TRANSPORTING THE OIL
A 14-inch pipeline connects the Alpine field to the Trans-Alaska Pipeline about 60 miles west of the Arctic National Wildlife Refuge, a site proposed for new drilling.
TRANSPORTING THE OIL
Today’s drills are sophisticated, steerable machines with instruments that send information about the exact position of the drill bit and properties of the rock to the drilling team.
Sources: Phillips Petroleum Company, Chevron Corporation, BP Amoco, Magic Earth, Arctic Connections.
6.5-9.5 MILES
DRILL BIT: MADE OF STEEL AND/OR
TUNGSTEN
STEERABLE MOTOR
5-3 NATIONAL ENERGY POLICY

DRILL WELLPOSSIBLE POCKET
OF OIL OR GAS
Chapter 5 • Energy for A New Century:
-50’Sea level
-100’
W
a l a s k a
DRILL
MUDLAYER
OIL LAYER
MUD/ROCKPUMPING,CRUSHING
AND INJECTION
Pipeline
Permafrost
ING NEW: DIRECTIONAL AND MULTILATERALDRILLING
A PIPELINE ELEVATED5 FT. ALLOWS THE CROSSING OF CARIBOU
DISPOSING OIL FIELD WASTES
Oil
Permafrost
Oil drilling sites like those in the Alpine
field on Alaska’s North Slope are using cutting-edge technol-
ogy in hopes of re-ducing environmental
damage.
Recent advances are lessening the industry’s impact
on the fragile Arctic ecosystem.
GETTING THERE
To minimize the project’s impact on the environment, temporary ice roads are used in the winter, leaving few traces after they thaw.
DISPOSING OF WASTES
Mud and debris from drill-ing used to be placed in big reserve pits. Today, rock cuttings are crush-ed, mixed with the mud, and sent deep into the earth where they originat-ed. This minimizes the size of well pads.
CROSSING A RIVER
Although traditional pipelines are built above ground, the pipeline to the Trans-Alaska Pipeline plunges beneath the Colville River, preserving the surface and the river bed environment.
OCCUPYING LESS OF THE TUNDRA
The new drilling technology allows for smaller surface production pads and larger areas explored in the earth.
to Reduce Environmental DamageUsing the Latest Drilling Technology
8 MILES
5 MILES
3 MILES
2 M.
1970
1980
1985
1999
SUBSURFACE DRILLABLE
AREA
DRILLSITE SIZE
5 ACRES
24 ACRES
11ACRES
13 ACRES
PIPELINE TO THE TRANS-
ALASKA PIPELINE
EXTENDS HORIZONTALLY,TURNING IN DIFERRENT DIRECTIONS TO AVOID DIFFICULT MATERIALS
MULTILATERAL DRILLING ALLOWS ONE WELL TO REACH DIFFERENT OIL POCKETS
ALPINE FIELD, ALASKA
BP Amoco
DIAMOND CUTTING PARTS
5-4
Source: ork Times News Service
Increasing Domestic Energy Supplies
E
OF
New Y

21st Century Technology:
The Key to Environmental Protection and New Energy Production
Producing oil and gas from geologically challenging areas while protecting the environment is important to Americans and to the future of our nation’s energy security. New technology and management techniques allow for sophisticated energy production as well as enhanced environmental protection. A technology evolution has occurred in the way oil and natural gas are found. The computer, three dimensional seismic technology, and other technologies have transformed the process from one based on “feel,” to one highly dependent on the most advanced and sophisticated technology available. These technologies reduce cost and protect the environment.
Today’s oil and gas exploration technology, for example, is boosting the success rate of pinpointing new resources. The results: fewer dry holes, reduced waste volumes, and a cleaner environment. Smaller, lighter drilling rigs coupled with advances in directional and extended-reach drilling significantly increase protection of the environment.
• Advanced, more energy efficient drilling and production methods: — reduce emissions; — practically eliminate spills from offshore platforms; and — enhance worker safety, lower risk of blowouts, and provide bet
ter protection of groundwater resources. • With each improvement in operational performance and efficiency, more
oil and gas resources can be recovered with fewer wells drilled, resulting in smaller volumes of: — cuttings; — drilling muds and fluids; and — produced waters.
• Modular drilling rigs, “slimhole” drilling, directional drilling, and other advances enable: — production of oil and gas with increased protection to wetlands
and other sensitive environments; — reduced greenhouse gas emissions;
and worker safety through the use of innovative best management practices.
Other examples of advanced technology include:
• 3-D seismic technology that enables geologists to use computers to determine the location of oil and gas before drilling begins, dramati cally improving the exploration success rate;
• deep-water drilling technology that enables exploration and produc tion of oil and gas at depths over two miles beneath the ocean’s sur face;
• high-powered lasers that may one day be used for drilling for oil and gas; and
• highly sophisticated directional drilling that enables wells to be drilled long horizontal distances from the drilling site.
:
5-5 NATIONAL ENERGY POLICY

and harsh environments). While the resource base that supplies
today’s natural gas is vast, U.S. conventional production is projected to peak as early as 2015. Increasingly, the nation will have to rely on natural gas from unconventional resources, such as tight sands, deep formations, deep water, and gas hydrates. Also, many resources are in environmentally sensitive areas that require use of less intrusive technologies.
New technologies are being developed to reduce both the environmental effects and the economic costs of exploration for oil and gas. These exciting new technologies, like horizontal drilling and three-dimensional seismic technology allow for much greater precision and significantly less impact on the environment (Figure 5-2).
Small independent businesses account for 50 and 65 percent, respectively, of domestic petroleum and natural gas production in the lower 48 states. However, even when new technology is available, independent producers can lack the investment capital needed to apply the technology and be unable to cope with the increased economic and technical risks associated with harder-to-recover resources.
For example, most new gas wells drilled in the United States will require hydraulic fracturing. This is a common procedure used by producers to complete gas wells by stimulating the well’s ability to flow increased volumes of gas from the reservoir rock into the wellbore. During a fracture procedure, fluid and a propping agent (usually sand) are pumped into the reservoir rock, widening natural fractures to provide paths for the gas to migrate to the wellbore. In certain formations, it has been demonstrated that the gas flow rate may be increased as much as twenty-fold by hydraulic fracturing. Each year nearly 25,000 oil and gas wells are hydraulically fractured.
The use of hydraulic fracturing in natural gas production from coal seams is one of the fastest-growing sources of gas production. This source will most likely face added controls, and costs to ensure that disposal (by re-injection or discharge) of production waters is done in an environmentally sensitive manner.
For each of these issues, opportunities exist to better coordinate, improve performance, and meet America’s energy, public health, safety and environmental goals.
Recommendation:
★ The NEPD Group recommends that the President direct the Secretaries of Energy and the Interior to promote enhanced oil and gas recovery from existing wells through new technology.
Anywhere from 30 to 70 percent of oil, and 10 to 20 percent of natural gas, is not recovered in field development. It is estimated that enhanced oil recovery projects, including development of new recovery techniques, could add about 60 billion barrels of oil nationwide through increased use of existing fields (Figure 5-3).
Figure 5-3 Major U.S. Oil and Gas Fields
The United States is the most mature oil-producing region in the world, and much of our easy-to-find resource base has been delpeted. Advanced exploration and production technologies of the past two decades have played a key role in recovering additional oil and natural gas from existing fields. ________Source: U.S. Department of Energy, Energy Information Administration.
Public Lands Leasing The federal government owns about
31 percent of the nation’s land, so it can have a major role in increasing energy production in appropriate places. A large portion of U.S. energy resources are contained in these federal lands and offshore areas. Public lands provide nearly 30 percent of
Small independent businesses account for 50 and 65 percent, respectively, of domestic petroleum and natural gas production in the lower 48 states.
Chapter 5 • Energy for A New Century: Increasing Domestic Energy Supplies 5-6

annual national energy production, and are estimated to contain a substantial majority of the nation’s undiscovered domestic energy resources.
Portions of federal onshore and offshore lands are off-limits to oil and gas exploration and development. Access is restricted for a variety of reasons, including administrative land withdrawals for competing land uses, such as national defense or water projects; and stipulations affecting surface occupancy, use, and timing for environmental compatibility.
Recommendations:
★ The NEPD Group recommends that the President direct the Secretary of the Interior to examine land status and lease stipulation impediments to federal oil and gas leasing, and review and modify those where opportunities exist (consistent with the law, good environmental practice, and balanced use of other resources). • Expedite the ongoing Energy Policy
and Conservation Act study of impediments to federal oil and gas exploration and development.
• Review public lands withdrawals and lease stipulations, with full public consultation, especially with the people in the region, to consider modifications where appropriate.
★ The NEPD Group recommends that the President direct the Secretary of the Interior to consider economic incentives for environmentally sound offshore oil and gas development where warranted by specific circumstances: explore opportunities for royalty reductions, consistent with ensuring a fair return to the public where warranted for enhanced oil and gas recovery; for reduction of risk associated with production in frontier areas or deep gas formations; and for development of small fields that would otherwise be uneconomic.
5-7 NATIONAL ENERGY POLICY
Offshore Congress has designated about 610
million acres off limits to leasing on the Outer Continental Shelf (OCS), which contains large amounts of recoverable oil and gas resources. These Congressional moratoria have been expanded by Presidential action through 2012, effectively confining the federal OCS leasing program to the central and western Gulf of Mexico, a small portion of the eastern Gulf, existing leases off California’s shore, and areas off of Alaska.
Concerns over the potential impacts of oil spills have been a major factor behind imposition of the OCS moratoria. For areas that are available for possible development, it is projected that with advanced technology, we could recover 59 billion barrels of oil and 300 trillion cubic feet of natural gas. This type of exploration and production from the OCS has an impressive environmental record. For example, since 1985, OCS operators have produced over 6.3 billion barrels of oil, and have spilled only 0.001 percent of production. Naturally occurring oil seeps add about 150 times as much oil to the oceans. Additionally, about 62 percent of OCS energy production is natural gas, which poses little risk of pollution.
For those areas that are available for potential coastal zone and OCS exploration and production activity, businesses must comply with a variety of federal and state statutes, regulations, and executive orders. Aspects of these, under the Coastal Zone Management Act and the Outer Continental Shelf Lands Act and their regulations, attempt to provide for responsible development while considering important environmental resources. However, effectiveness is sometimes lost through a lack of clearly defined requirements and information needs from federal and state entities, as well as uncertain deadlines during the process. These delays and uncertainties can hinder proper energy exploration and production projects.
The Deep Water Royalty Relief Act of 1995, granting variable royalty reductions for new leases in deep water, contributed to a significant increase in deep-water leasing in the central and western Gulf over the last five years. The opportunities created in deep water help spur the development of new
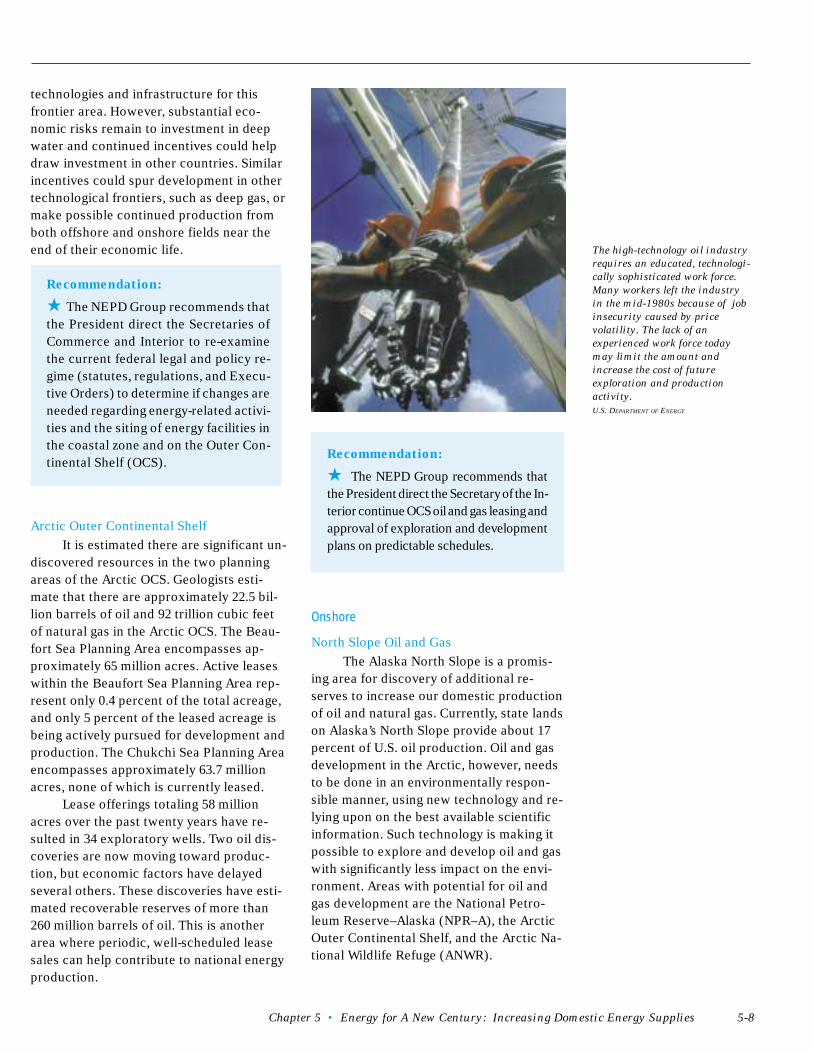
technologies and infrastructure for this frontier area. However, substantial economic risks remain to investment in deep water and continued incentives could help draw investment in other countries. Similar incentives could spur development in other technological frontiers, such as deep gas, or make possible continued production from both offshore and onshore fields near the end of their economic life.
Recommendation:
★ The NEPD Group recommends that the President direct the Secretaries of Commerce and Interior to re-examine the current federal legal and policy regime (statutes, regulations, and Executive Orders) to determine if changes are needed regarding energy-related activities and the siting of energy facilities in the coastal zone and on the Outer Continental Shelf (OCS).
Arctic Outer Continental Shelf
It is estimated there are significant undiscovered resources in the two planning areas of the Arctic OCS. Geologists estimate that there are approximately 22.5 billion barrels of oil and 92 trillion cubic feet of natural gas in the Arctic OCS. The Beaufort Sea Planning Area encompasses approximately 65 million acres. Active leases within the Beaufort Sea Planning Area represent only 0.4 percent of the total acreage, and only 5 percent of the leased acreage is being actively pursued for development and production. The Chukchi Sea Planning Area encompasses approximately 63.7 million acres, none of which is currently leased.
Lease offerings totaling 58 million acres over the past twenty years have resulted in 34 exploratory wells. Two oil discoveries are now moving toward production, but economic factors have delayed several others. These discoveries have estimated recoverable reserves of more than 260 million barrels of oil. This is another area where periodic, well-scheduled lease sales can help contribute to national energy production.
The high-technology oil industry
requires an educated, technologi
cally sophisticated work force.
Many workers left the industry
in the mid-1980s because of job
insecurity caused by price
volatility. The lack of an
experienced work force today
may limit the amount and
increase the cost of future
exploration and production
activity.
U.S. DEPARTMENT OF ENERGY
Recommendation:
★ The NEPD Group recommends that the President direct the Secretary of the Interior continue OCS oil and gas leasing and approval of exploration and development plans on predictable schedules.
Onshore
North Slope Oil and Gas
The Alaska North Slope is a promising area for discovery of additional reserves to increase our domestic production of oil and natural gas. Currently, state lands on Alaska’s North Slope provide about 17 percent of U.S. oil production. Oil and gas development in the Arctic, however, needs to be done in an environmentally responsible manner, using new technology and relying upon on the best available scientific information. Such technology is making it possible to explore and develop oil and gas with significantly less impact on the environment. Areas with potential for oil and gas development are the National Petroleum Reserve–Alaska (NPR–A), the Arctic Outer Continental Shelf, and the Arctic National Wildlife Refuge (ANWR).
Chapter 5 • Energy for A New Century: Increasing Domestic Energy Supplies 5-8

National Petroleum Reserve–Alaska
The National Petroleum Reserve– Alaska lies between the Brooks Range and the Arctic Ocean. The U.S. Geological Survey (USGS) estimates a high potential for oil and gas resources in the NPR–A, with a mean estimate of 2.1 billion barrels of oil and 8.5 trillion cubic feet of gas. A leasing program was designed and initiated in 1999 for the northeast sector of NPR–A, resulting in the award of 133 leases covering 900,000 acres. Eight exploratory wells have been completed in the past two years, and additional exploratory wells are expected this coming winter.
Recommendation:
★ The NEPD Group recommends that the President direct the Secretary of the Interior to consider additional environmentally responsible oil and gas development, based on sound science and the best available technology, through further lease sales in the National Petroleum Reserve-Alaska. Such consideration should include areas not currently leased within the Northeast corner of the Reserve.
Arctic National Wildlife Refuge
The Alaska National Interest Lands Conservation Act expanded ANWR from 9 million acres to 19 million acres, and designated 8 million acres as wilderness. Congress specifically left open the question of management of a 1.5-million-acre Arctic Coastal Plain area of ANWR because of the likelihood that it contains significant oil and gas resources. Section 1002 of the Act directed the Department of the Interior to conduct geological and biological studies of the Arctic Coastal Plain, “the 1002 Area,” and to provide to Congress the results of those studies with recommendations on future management of the area. Section 1003 of the Act prohibits leasing of the 1002 Area until authorized by an act of Congress.
In 1987, after more than five years of biological baseline studies, surface geological studies, and two seasons of seismic ex
ploration surveys, the Department of the Interior recommended to Congress that the 1002 Area be leased for oil and gas exploration and production in an environmentally sensitive manner. In 1995, both the Senate and the House passed legislation containing a provision to authorize leasing in the 1002 Area, but the legislation was vetoed.
In May 1998, the USGS issued revised estimates of oil and gas resources in the 1002 Area. The 1998 USGS assessment shows an overall increase in estimated oil resources when compared to all previous government estimates. The estimate reaffirms the 1002 Area’s potential as the single most promising prospect in the United States. The total quantity of recoverable oil within the entire assessment area is estimated to be between 5.7 and 16 billion barrels (95 percent and 5 percent probability range) with a mean value of 10.4 billion barrels. The mean estimate of 10.4 billion barrels is just below the amount produced to date from North America’s largest field, Prudhoe Bay, since production began 23 years ago. Peak production from ANWR could to be between 1 and 1.3 million barrels a day and account for more than 20 percent of all U.S. oil production. ANWR production could equal 46 years of current oil imports from Iraq.
Technological improvements over the past 40 years have dramatically reduced industry’s footprint on the tundra, minimized waste produced, and protected the land for resident and migratory wildlife. These advances include the use of ice roads and drilling pads, low-impact exploration approaches such as winter-only exploration activities, and extended reach and throughtubing rotary drilling. These technologies have significantly reduced the size of production-related facilities on the North Slope. Estimates indicate that no more than 2,000 acres will be disturbed if the 1002 Area of ANWR is developed. For purposes of comparison, ANWR is about the size of the state of South Carolina, whereas the developed area is estimated to be less than one-fifth the size of Washington D.C.’s Dulles International Airport.
5-9 NATIONAL ENERGY POLICY

Figure 5-4 Recommendation: Restricted Natural Gas Resource Areas
★ The NEPD Group recommends that in the U.S. Lower 48
the President direct the Secretary of the Interior to work with Congress to authorize exploration and, if resources are discovered, development of the 1002 Area of ANWR. Congress should require the use of the best available technology and should require that activities will result in no significant adverse impact to the surrounding environment.
Other Onshore Restrictions
There is a significant potential for oil and gas resources on federal land in the lower 48 states as well. According to the most recent estimates from the USGS and the Minerals Management Service, oil resources underlying federal lands in the lower 48 states are estimated to be 4.1 billion barrels, and natural gas reserves are estimated to be 167 trillion cubic feet (Figure 5-4). Much of these potential resources have been placed off-limits or are subject to significant restrictions. For example, about 40 percent of the natural gas resources on federal land in the Rocky Mountain region have been placed off-limits.
The Department of the Interior initiated a study to examine the energy potential and restrictions on development on federal lands in the lower 48 states. In many cases, limits on oil and gas development are appropriate. However, improved technology has helped to reduce the impact of oil and gas development on the environment.
Exploration and Production To meet increased natural gas demand
in the coming decades, total wells drilled annually will need to double the 1999 level by 2020. Very few new onshore rigs have been built since the mid-1980s, because the oil field supply and service sectors have been hit especially hard by price volatility. Major additions to the offshore rig fleet will also be needed just to develop existing leases. The lack of an experienced work force may limit the speed and increase the cost of exploration and production activity.
21 TCF
31 TCF
24 TCF
137 TCF
Much of the nation’s oil and gas resource base resides on federal lands or in federal waters. A large portion of this is not open to exploration and development. For example, an estimated 40 percent or 137 trillion cubic feet of potential natural gas resource in the Rockies is either closed to exploration (29 tcf) or is open to development under restrictive provisions (108 tcf). ________Source: U.S.Department of Energy, Energy Information Administration.
Electricity Electricity is an essential part of mod
ern life. When supply fails to keep pace with demand, costs to consumers and businesses rise and reliability falls. The California experience demonstrates the crippling effect that electricity shortages and blackouts can have on a state or region. This summer, the possibility exists for more intense electricity shortfalls in the West, with additional problems possible in New York City and on Long Island.
Electricity demand is projected to grow sharply over the next twenty years. Based on current estimates, the United States will need about 393,000 MW of new generating capacity by 2020 to meet the growing demand. If the U.S. electricity demand continues to grow at the high rate it has recently, we will need even more generating capacity. To meet that future demand, the United States will have to build between 1,300 to 1,900 new power plants; that averages out to be more than 60 to 90 plants a year, or more than one a week.
Over the next few years, if the demand for electricity continues to grow as predicted, and if we fail to implement a
Chapter 5 • Energy for A New Century: Increasing Domestic Energy Supplies 5-10

Electricity demand is projected
to rise sharply over the next
twenty years. If we fail to build
the 1,300–1,900 new power
plants needed to increase
generation and transmission
capacity, current electricity
shortages will become more
frequent and more widespread.
U.S. DEPARTMENT OF ENERGY
comprehensive energy plan that recognizes the need to increase capacity, we can expect our electricity shortage problems to grow. The result will be higher costs and lower reliability.
Electricity Restructuring
One of the most important energy issues facing the Administration and Congress is electricity restructuring. The electricity industry is going through a period of dramatic change. To provide ample electricity supplies at reasonable prices, states are opening their retail markets to competition. This is the most recent step in a long transition from reliance on regulation to reliance on competitive forces.
Changes in Wholesale Electricity Market This transition from regulation to
competition began in 1978 with enactment of the Public Utility Regulatory Policies Act, which promoted independent electricity generation. Open-access transmission policies adopted by the Federal Energy Regulatory Commission (FERC) in the late 1980s further promoted competition in wholesale power markets. Congress largely ratified these policies with enactment of
the Energy Policy Act of 1992, which further promoted non-utility generation. FERC took another large step to promote competition with its open-access rule in 1996, which provided greater access to the transmission grid, the highway for interstate commerce in electricity.
Changes in the Retail Electricity Market Increased competition in wholesale
power markets encourages states to open retail electricity markets. Under current law, FERC has jurisdiction over the wholesale power market, while states have jurisdiction over retail markets. Beginning in 1996, states began opening their retail markets to competition in order to lower electricity prices. Twenty-five states have opted to open their retail electricity markets to competition.
Most new electricity generation is being built not by regulated utilities, but by independent power producers. These companies assume the financial risk of investment in new generation, and their success rides on their ability to generate electricity at a low cost.
These dramatic changes affecting the industry led to important structural changes. Independent power producers, which were once infant industries, now dwarf many utilities. Utility mergers, which were once rare, are now commonplace. U.S. utilities have been purchased by foreign companies, and U.S. utilities have in turn purchased utilities abroad. While utilities had service areas that were limited to a single state or region, independent power producers are international companies that can build power plants across the globe. Many utilities that were once vertically integrated divested themselves of generation, either voluntarily or because of state law.
Pending Congressional Action Since 1995, Congress has been grap
pling with electricity competition legislation. Initial efforts sought to require states to open their retail markets by a date certain. Subsequent efforts focused on promoting competition in electricity markets and complementing state retail competition plans. Under this
5-11 NATIONAL ENERGY POLICY

approach, federal legislation focused on core federal issues, including: • regulation of interstate commerce; • assuring open access to the interstate and international transmission system; • enhancing reliability of the grid; • lowering barriers to entry; • reforming outdated federal electricity laws, such as the Public Utility Holding Company Act and Public Utility Regulatory Policies Act of 1978; • reforming the role of federal electric utilities in competitive markets; • protecting consumers; and • clarifying federal and state regulatory jurisdictions.
Recommendations:�
★ The NEPD Group recommends that the President direct the Secretary of Energy to propose comprehensive electricity legislation that promotes competition, protects consumers, enhances reliability, improves efficiency, promotes renewable energy, repeals the Public Utility Holding Company Act, and reforms the Public Utility Regulatory Policies Act.
★ The NEPD Group recommends the President encourage FERC to use its existing statutory authority to promote competition and encourage investment in transmission facilities.
California Electricity Crisis
The California electricity crisis is not a test of the merits of competition in electricity markets. Instead, it demonstrates that a poorly designed state retail competition plan can have disastrous results if electricity supply does not keep pace with increased demand. At heart, the California electricity crisis is a supply crisis. California allowed demand to outstrip supply, and did little to lower barriers to entry through reform of an inflexible siting process. The risk that the California experience will repeat itself is low, since other states have not modeled their retail competition plans on California’s plan.
The California crisis also shows that state electricity markets do not stay neatly confined within legal and jurisdictional bounds. Due to regional interconnection, disastrous mistakes made by the State of California have dire effects on the entire West. California’s failure to reform flawed regulatory rules affecting the market drove up wholesale prices. Actions such as forcing utilities to purchase all their power through volatile spot markets, imposing a single-price auction system, and barring bilateral contracts all contributed to the problems that California now faces.
Lessons Learned from Successful Deregulation
As stated previously, 25 states have decided to open their retail electricity markets. A comparison of the different approaches taken by California and other states demonstrates that competition will benefit consumers if implemented effectively. A better gauge of the potential for retail competition to lower prices can be found in Pennsylvania, where electricity prices have fallen significantly as a result of competition. There is also reason to believe that the plan in Texas will have similar success.
A major difference between the California experience and the approaches taken by Pennsylvania and Texas is that the latter states ensured they had adequate electricity supplies. Pennsylvania and Texas took steps to ensure that procedures for adding new power plants were efficient. Unlike California, which imports 25 percent of its electricity, Pennsylvania is a net exporter of power, and Texas imports almost no power from other states. For these reasons, Pennsylvania and Texas have ample electricity supply to meet demand, while California is confronting a serious supply shortage.
In addition, California required its utilities to divest themselves of much of their generation, unlike Pennsylvania and Texas. This action forced California utilities to rely much more heavily on buying power, at ever-increasing prices, instead of generating power themselves.
Chapter 5 • Energy for A New Century: Increasing Domestic Energy Supplies 5-12

Another major difference is that Pennsylvania and Texas did not require their utilities to purchase electricity through volatile spot markets. This requirement, combined with frozen retail rates imposed by the State, forced California utilities to purchase power at much higher costs than could be passed along to the consumer. As a result, the California regulatory plan resulted in unreliable service, destroyed the financial health of the State’s utilities, and drove one utility into bankruptcy.
The federal government does not site power plants; that is a responsibility of the states. For that reason, delays relating to the construction of new power plants are usually the result of state action. A number of federal agencies, such as the Environmental Protection Agency, the Department of Commerce, and the Department of the Interior, do issue air and other permits for generation facilities. Some of the concerns about permitting or review delays in other states can be similarly addressed by expediting processes. These agencies, pursuant to President Bush’s Executive Order, have expedited permit-processing applications for energy production in California.
Some of the concerns about permitting or review delays in other states can be similarly addressed by expediting processes.For example, in 1999–2000, the time for issuing air permits (including the time for public participation) for turbines was reduced to three to four months (compared to the twelve months allowed by the regulations) for the majority of permit applications.
Fuels for Electricity Generation Electricity is not a primary source of
energy. It is generated by the use of primary energy sources (Figure 5-5). Coal, nuclear energy, natural gas and hydropower account for about 95 percent of total electricity generation, with oil and renewable energy contributing the remainder. Despite this healthy diversity of energy sources, each type of electricity resource is faced with constraints to maintaining or expanding its contribution to electricity production.
Coal Coal is used almost exclusively to gen
erate electricity. Coal power plants account for over 50 percent of all U.S. electricity generation, and over 80 percent of generation in twelve states in the Midwest, Southeast, and West. Coal electricity generation costs are low, and coal prices have proved remarkably stable. In 1999, the United States produced 1.1 billion tons of coal. Production of coal from federal and tribal lands, which has increased substantially in the past decade, accounted for 38 percent of this total.
Although coal is the nation’s most abundant fossil energy source, production and market issues can affect the adequacy of supply. Production issues include the protection of public health, safety, property, and the environment, and the effectiveness of federal and state agencies implementing various laws governing coal mining. These issues have resulted in some coal resources becoming uneconomical to produce. Statutory, regulatory, and administrative difficulties also may limit or prevent the production of some coal resources. However, technological advances in cleaner coal technology have allowed for significant progress toward reducing these barriers. There are also opportunities to protect the environment while lowering costs through further improvements in technology.
Over the past decade, greater efficiencies, lower capital costs, fewer emissions and quicker start-up times have made power plants fueled by natural gas a more attractive choice for new coal generation. Recently, however, rising natural gas prices have renewed interest in building coal power plants.
Uncertainty about future environmental controls is of particular concern for companies that operate existing coal power plants. Regulations under development include a variety of measures requiring reductions in emissions of nitrogen oxide, sulfur dioxide, and mercury. In addition, rules related to discharges to streams and coolingwater intake structures, possible regulation of large-volume wastes as hazardous wastes,
5-13 NATIONAL ENERGY POLICY

uncertainty over rules requiring air permits for certain modifications to power plants, and uncertainty over global and domestic efforts to reduce carbon dioxide emissions also play a role. This regulatory uncertainty discourages power producers from building coal power plants and is one reason the Unites States is relying so heavily on natural gas power generation to meet growing electricity demand.
Much of the current uncertainty has resulted because regulators do not weigh the cumulative impacts of their proposals. Compliance decisions by businesses concerning each new regulation must often be made without the benefit of clear information regarding additional requirements that may be imposed. More effective and economical compliance strategies are possible if companies know the full range of requirements with which they must comply.
If rising U.S. electricity demand is to be met, then coal must play a significant role. Under current policies, in the next two decades, nuclear electricity generation and hydropower are projected to decline. Natural gas electricity generation is projected to increase from about 16 to 36 percent of total generation, which would require the tripling of natural gas used for electricity generation. Significantly, this projected increase in natural gas genera-
Figure 5-5 Electricity Generation by Fuel: Current Trends (Billions of Kilowatt-Hours)
3,500
3,000
2,500
2,000
1,500 1,000
500
0 Oil
Coal
Natural Gas
Nuclear
Renewables
Electricity Demand
1970
1,392 4,804
2020
tion assumes that coal electricity generation will continue to account for about 50 percent of U.S. electricity generation. If policies are adopted that sharply lower coal electricity generation, then the likely result is an even greater dependence on natural gas generation. This creates concern about the adequacy of natural gas supplies and policies.
Clean Coal Technology Technology has been and will con
tinue to be a key to achieving our energy, economic, and environmental goals. In recent years, technological advancements through efforts of both the public and private sectors have led to substantial reductions in the cost of controlling sulfur dioxide and nitrogen oxide emissions, while the effectiveness of control systems increased significantly. The Department of Energy, through its Clean Coal Technology Program, has worked to provide effective control technologies. These nitrogen oxide and sulfur dioxide control technologies have moved into the utility marketplace and now provide a means to achieve cost effective regulatory compliance.
For example, most power plants that can use low nitrogen oxide burners have now installed them, and about 25 percent of all coal power plants have either ordered or installed selective catalytic reduction technology, which reduces nitrogen oxide emissions.
Technologies like fluidized-bed combustion and integrated gasification combined cycle have been developed that further reduce emissions. Fluidized-bed combustion is a low-emitting nitrogen oxide combustion technology that allows the use of fuels, such as coal pile washer waste, that were not formerly usable. Integrated gasification combined cycle is a relatively new technology that uses refinery waste as fuel.
Future coal electricity generation will need to meet new challenges to reduce emissions even further, especially mercury
1970 80 90 2000 10 2020 ________ Source: U.S. Department of Energy, Energy Information Administration
emissions. The Department of Energy is supporting efforts to develop more cost effective control technology. Indeed, the goal
Chapter 5 • Energy for A New Century: Increasing Domestic Energy Supplies 5-14

Clean Coal Technology
Clean Coal Technology describes a category of technologies that allow for the use of coal to generate electricity while meeting environmental regulations at low cost.
• In the short term, the goal of the program is to meet existing and emerging environmental regulations, which will dramatically reduce compliance costs for controlled mercury, NOx, SO2, and fine particulate at new and existing coal power plants.
• In the mid-term, the goal of the program is to develop low-cost, superclean coal power plants, with efficiencies 50 percent higher than today’s average. The higher efficiencies will reduce emissions at minimal costs.
• In the long term, the goal of the program is to develop low-cost, zeroemission power plants with efficiencies close to double that of today’s fleet.
5-15 NATIONAL ENERGY POLICY
of these research, development, and demonstration programs is to develop and demonstrate coal power systems with near zero environmental emissions, while maintaining low production costs.
Recommendations:
★ The NEPD Group recognizes the importance of looking to technology to help us meet the goals of increasing electricity generation while protecting our environment. To that end, the NEPD Group recommends that the President direct the Department of Energy to continue to develop advanced clean coal technology by: • Investing $2 billion over 10 years to
fund research in clean coal technologies.
• Supporting a permanent extension of the existing R&D tax credit.
• Directing agencies to explore regulatory approaches that will encourage advancements in environmental technology.
★ The NEPD Group recommends that the President direct federal agencies to provide greater regulatory certainty relating to coal electricity generation through clear policies that are easily applied to business decisions.
Nuclear Energy
Nuclear energy accounts for 20 percent of all U.S. electricity generation, and more than 40 percent of the electricity generation in ten states in the Northeast, the South, and the Midwest. Despite the closure of several less efficient plants during the 1990s, the 103 U.S. nuclear energy plants currently operating produce more electricity today than at any time in history.
There are a number of reasons why nuclear energy expansion halted in the 1980s. Regulatory changes implemented after the Three Mile Island incident in 1979 lengthened the licensing period to an average of fourteen years, resulting in large cost overruns. Increased public concern
about the safety of nuclear energy after the accident often resulted in active opposition to proposed plants. As a result, the last completed nuclear energy plant in the United States was ordered in 1973.
Since the 1980s, the performance of nuclear energy plant operations has substantially improved. While U.S. nuclear energy plants once generated electricity only around 70 percent of the time, the average plant today is generating electricity close to 90 percent. This improved performance has lowered the cost of nuclear generation, which is now competitive with other sources of electricity (Figure 5-6).
There is potential for even greater generation from existing nuclear energy plants. Experts estimate that 2,000 MW could be added from existing nuclear power plants by increasing operating performance to 92 percent. In addition, about 12,000 MW of additional nuclear electricity generation could be derived from uprating U.S. nuclear power plants, a process that uses new technologies and methods to increase rated power levels without decreasing safety. However, modifications to uprate plants can be expensive and require extensive licensing review and approval by the Nuclear Regulatory Commission (NRC). Another way to increase nuclear generation from existing plants is through license renewal. Many nuclear utilities are planning to extend the operating license of existing nuclear plants by twenty years, and the licenses of as many as 90 percent of the currently operating nuclear plants may be renewed.
The nuclear energy industry is closely regulated by the NRC, which provides rigorous oversight of the operation and maintenance of these plants. This oversight includes a comprehensive inspection program that focuses on the most significant potential risks of plant operations and features full-time resident inspectors at each plant, as well as regional inspectors with specialized expertise. The NRC has made great strides to provide greater regulatory certainty while maintaining high safety standards.

The installation of new design features, improvements in operating experience, nuclear safety research, and operator training have all contributed to the strong safety record of the nuclear energy industry. Since the Three Mile Island incident in 1979, the nuclear industry’s safety record has significantly improved. This safety record has been achieved through a defense-in-depth philosophy accomplished by way of engineering design, quality construction, safe operation, and emergency planning. This philosophy provides for diverse and redundant systems to prevent accidents from occurring, as well as multiple safety barriers to mitigate the effects of accidents in the highly unlikely event they do occur.
Over the last several years, utilities have begun purchasing nuclear plants from other operators as the industry undergoes consolidation. Several nuclear utilities have merged, creating management teams with extensive expertise in running and maintaining nuclear plants. These mergers are impeded by tax rules relating to the transfer of decommissioning funds.
Utilities are also considering nuclear energy as an option for new generation. The NRC
Figure 5-6�Nuclear Generation is Competitively Priced (1998 Cents per Kilowatt-Hour)�
Oil
Coal
Gas
Nuclear
12�
10�
8�
6�
4�
2�
0�
1981 83 85 87 89 91 93 95 97 98�
________�
Note: Fuel costs are included.éSource: Utility Data Institute via the Nuclear Energy Institute.é
has certified three standardized nuclear power plant designs, and Congress enacted legislation in 1992 to reform the nuclear licensing process. Under this process, a utility can apply for a combined construction and operating license for one of these standardized designs in a streamlined process. This reformed licensing process provides for site permits—a way to resolve siting issues early in the process. Building new generators on existing sites avoids many complex issues associated with building plants on new sites. Many U.S. nuclear plant sites were designed to host four to six reactors, and most operate only two or three; many sites across the country could host additional plants.
Advanced reactor technology promises to improve nuclear safety. One example of an advanced reactor design is the gas-cooled, pebble-bed reactor, which has inherent safety features. The industry has an interest in this and other advanced reactor designs.
The federal government must also provide for the safe disposal of nuclear waste. At present, nuclear waste continues to be stored at local plant sites. The Department of Energy is over a decade behind schedule for accepting nuclear waste from utilities, but has made progress toward characterization of the Yucca Mountain, Nevada site. Construction of an exploratory studies facility has been completed, a viability assessment was published, and recently scientists placed their extensive research about Yucca Mountain on the record for public scrutiny. However, key regulatory standards to protect public health and the environment at the repository have not been issued.
The Administration will continue to study the science to determine whether to proceed with the consideration of this site as the location for the repository. If the Administration decides to proceed, the Department of Energy must file a license application with the NRC. No waste will be sent to any location until the NRC determines it to be safe.
Other countries have developed different approaches for nuclear waste disposal. For example, the French, British and Japanese rely on reprocessing, an in-
Chapter 5 • Energy for A New Century: Increasing Domestic Energy Supplies 5-16

Calvert Cliffs is the first U.S.
nuclear plant to receive a
renewed license from the Nuclear
Regulatory Commission. The
renewal will allow the plant to
continue producing environmen
tally sound electricity for an
additional twenty years.
CONSTELLATION ENERGY GROUP
dustrial approach that separates nuclear waste into usable fuel and highly concentrated waste. While this approach does not obviate the need for geologic disposal of nuclear waste, it could significantly optimize the use of a geologic repository. There is growing interest in new technology known as accelerator transmutation, which could be used in combination with reprocessing to reduce the quantity and toxicity of nuclear waste.
Recommendations:
★ The NEPD Group recommends that the President support the expansion of nuclear energy in the United States as a major component of our national energy policy. Following are specific components of the recommendation: • Encourage the Nuclear Regulatory
Commission (NRC) to ensure that safety and environmental protection are high priorities as they prepare to evaluate and expedite applications for licensing new advancedtechnology nuclear reactors.
• Encourage the NRC to facilitate efforts by utilities to expand nuclear energy generation in the United States by uprating existing nuclear plants safely.
• Encourage the NRC to relicense existing nuclear plants that meet or exceed safety standards.
• Direct the Secretary of Energy and the Administrator of the Environmental Protection Agency to assess the potential of nuclear energy to improve air quality.
• Increase resources as necessary for nuclear safety enforcement in light of the potential increase in generation.
• Use the best science to provide a deep geologic repository for nuclear waste.
• Support legislation clarifying that qualified funds set aside by plant owners for eventual decommissioning will not be taxed as part of the transaction.
• Support legislation to extend the Price–Anderson Act.
★ The NEPD Group recommends that, in the context of developing advanced nuclear fuel cycles and next generation technologies for nuclear energy, the United States should reexamine its policies to allow for research, development and deployment of fuel conditioning methods (such as pyroprocessing) that reduce waste streams and enhance proliferation resistance. In doing so, the United States will continue to discourage the accumulation of separated plutonium, worldwide.
★ The United States should also consider technologies, in collaboration with international partners with highly developed fuel cycles and a record of close cooperation, to develop reprocessing and fuel treatment technologies that are cleaner, more efficient, less waste-intensive, and more proliferationresistant.
5-17 NATIONAL ENERGY POLICY

Hydropower Although hydropower generation ac
counts for only about 7 percent of overall U.S. electricity generation, the following states depend heavily on this source of energy: Idaho, Washington, Oregon, Maine, South Dakota, California, Montana, and New York.
Hydropower generation has remained relatively flat for years. The most significant constraint on expansion of U.S. hydropower generation is physical; most of the best locations for hydropower generation have already been developed. Potential does remain for some increases in hydropower generation, and capacity can be optimized by adding additional turbines and increasing efficiency at existing facilities.
Also, the amount of hydropower generation depends upon the quantity of available water. A drought can have a devastating effect on a region that depends on hydropower. In fact, this year’s water availability has been a contributing factor in California’s electricity supply shortages. The amount of hydropower generation depends upon the quantity of available water. A drought can have a devastating effect on a region that depends on hydropower. In fact, this year’s water availability has been a contributing factor in California’s electricity supply shortages.
The Federal Energy Regulatory Commission is required to incorporate mandatory conditions proposed by different state and federal resource agencies into hydropower licenses. Decision-making authority in the licensing process is diffused among a host of federal and state agencies, all of which are pursuing different statutory missions. The hydropower licensing process is prolonged, costly, and poses regulatory uncertainty. The challenge is to efficiently and effectively balance national interests in natural resource and environmental preservation with energy needs.
Recommendation:
★ The NEPD Group recognizes there is a need to reduce the time and cost of the hydropower licensing process. The NEPD Group recommends that the President encourage the Federal Energy Regulatory Commission (FERC) and direct federal resource agencies to make the licensing process more clear and efficient, while preserving environmental goals. In addition, the NEPD Group recognizes the importance of optimizing the efficiency and reliability of existing hydropower facilities, and will encourage the Administration to adopt efforts toward that end. • Support administrative and legisla
tive reform of the hydropower licensing process.
• Direct federal resource agencies to reach interagency agreement on conflicting mandatory license conditions before they submit their conditions to FERC for inclusion in a license.
• Encourage FERC to adopt appropriate deadlines for its own actions during the licensing process.
Natural Gas Currently, natural gas provides about
16 percent of U.S. electricity generation. Seven states obtain over one-third of their generation from natural gas (Rhode Island, new York, Delaware, Louisiana, Texas, California, and Alaska). Perhaps more importantly, natural gas-fired electricity is projected to constitute about 90 percent of capacity additions between 1999 and 2020. The amount of natural gas used in electricity generation is projected to triple by 2020.
Ensuring the long-term availability of adequate, reasonably priced natural gas supplies is a challenge. Low gas prices in 1998 and 1999 caused the industry to scale back gas exploration and production activity. Since 2000, the North American natural gas market has remained tight due to strong demand and diminished supplies. Last year, natural gas prices quadrupled, which resulted in substantially higher prices for electricity generated with natural gas.
Chapter 5 • Energy for A New Century: Increasing Domestic Energy Supplies 5-18

High-tech power plants, like this
combined cycle plant, are
signaling a new age in electric
power generation. The capability
to co-produce electricity and a
slate of fuels and chemicals
makes the technology economi
cally attractive to a broad range
of industrial applications.
TAMPA ELECTRIC COMPANY
While the largest barriers to expanded natural gas electricity generation relate to production and pipeline constraints, there are several other barriers. Environmental regulations affect the use of gas for electricity generation. Although natural gas electric plants produce fewer emissions than coal-fired power plants, they still emit nitrogen oxides, carbon dioxide and small
,amounts of toxic air emissions.
Oil While oil fuels only about 3 percent of to
tal U.S. electricity generation, it is the dominant source of electricity generation in Hawaii, and provides over 20 percent of the generation in Massachusetts, Connecticut, Delaware, Maine, and Florida. Over the next twenty years, market conditions are expected to reduce today’s level of oil electricity generation by about 80 percent.
Renewable Energy Hydropower is, to date, the most suc
cessful form of renewable energy. However, some forms of renewable energy generation—wind, geothermal, and biomass— have the potential to make more significant contributions in coming years, and the cost of most forms of renewable energy has declined sharply in recent years. The most important barrier to increased renewable energy production remains economic; nonhydropower renewable energy generation costs are greater than other traditional energy sources. The following chapter discusses renewable and alternative energy in greater detail.
5-19

Summary of Recommendations�Energy for a New Century: Increasing Domestic Energy Supplies
★ The NEPD Group recommends that the President direct the Secretaries of Energy and the Interior to promote enhanced oil and gas recovery from existing wells through new technology.
★ The NEPD Group recommends that the President direct the Secretary of Energy to improve oil and gas exploration technology through continued partnership with public and private entities.
★ The NEPD Group recommends that the President direct the Secretary of the Interior to examine land status and lease stipulation impediments to federal oil and gas leasing, and review and modify those where opportunities exist (consistent with the law, good environmental practice, and balanced use of other resources).
• Expedite the ongoing Energy Policy and Conservation Act study of impediments to federal oil and gas exploration and development.
• Review public lands withdrawals and lease stipulations, with full public consultation, especially with the people in the region, to consider modifications where appropriate.
★ The NEPD Group recommends that the President direct the Secretary of the Interior to consider economic incentives for environmentally sound offshore oil and gas development where warranted by specific circumstances: explore opportunities for royalty reductions, consistent with ensuring a fair return to the public where warranted for enhanced oil and gas recovery; for reduction of risk associated with production in frontier areas or deep gas formations; and for development of small fields that would otherwise be uneconomic.
★ The NEPD Group recommends that the President direct the Secretaries of Commerce and Interior to re-examine the current federal legal and policy regime (statutes, regulations, and Executive Orders) to determine if changes are needed regarding energy-related activities and the siting of energy facilities in the coastal zone and on the Outer Continental Shelf (OCS).
★ The NEPD Group recommends that the President direct the Secretary of the Interior continue OCS oil and gas leasing and approval of exploration and development plans on predictable schedules.
★ The NEPD Group recommends that the President direct the Secretary of the Interior to consider additional environmentally responsible oil and gas development, based on sound science and the best available technology, through further lease sales in the National Petroleum Reserve-Alaska. Such consideration should include areas not currently leased within the Northeast corner of the Reserve.
★ The NEPD Group recommends that the President direct the Secretary of the Interior work with Congress to authorize exploration and, if resources are discovered, development of the 1002 Area of ANWR. Congress should require the use of the best available technology and should require that activities will result in no significant adverse impact to the surrounding environment.
Chapter 5 • Energy for A New Century: Increasing Domestic Energy Supplies 5-20
★ The NEPD Group recommends that the President direct the Secretary of the Interior to work with Congress and the State of Alaska to put in place the most expeditious process for renewal of the Trans-Alaska Pipeline System rights-of-way to ensure that Alaskan oil continues to flow uninterrupted to the West Coast of the United States.
★ The NEPD Group recommends that the President direct the Secretary of Energy to propose comprehensive electricity legislation that promotes competition, protects consumers, enhances reliability, promotes renewable energy, improves efficiency repeals the Public Utility Holding Company Act, and reforms the Public Utility Regulatory Policies Act.
★ The NEPD Group recommends that the President encourage FERC to use its existing statutory authority to promote competition and encourage investment in transmission facilities.
★ The NEPD Group recognizes the importance of looking to technology to help us meet the goals of increasing electricity generation while protecting our environment. To that end, the NEPD Group recommends that the President direct the Department of Energy to continue to develop advanced clean coal technology by:
• Investing $2 billion over 10 years to fund research in clean coal technologies. • Supporting a permanent extension of the existing research and development
tax credit. • Directing federal agencies to explore regulatory approaches that will encour
age advancements in environmental technology.
★ The NEPD Group recommends that the President direct federal agencies to provide greater regulatory certainty relating to coal electricity generation through clear policies that are easily applied to business decisions.
★ The NEPD Group recommends that the President support the expansion of nuclear energy in the United States as a major component of our national energy policy. Following are specific components of the recommendation:
• Encourage the Nuclear Regulatory Commission (NRC) to ensure that safety and environmental protection are high priorities as they prepare to evaluate and expedite applications for licensing new advanced-technology nuclear reactors.
• Encourage the NRC to facilitate efforts by utilities to expand nuclear energy generation in the United States by uprating existing nuclear plants safely.
• Encourage the NRC to relicense existing nuclear plants that meet or exceed safety standards.
• Direct the Secretary of Energy and the Administrator of the Environmental Protection Agency to assess the potential of nuclear energy to improve air quality.
• Increase resources as necessary for nuclear safety enforcement in light of the potential increase in generation.
• Use the best science to provide a deep geologic repository for nuclear waste. • Support legislation clarifying that qualified funds set aside by plant owners for
eventual decommissioning will not be taxed as part of the transaction. • Support legislation to extend the Price–Anderson Act.
5-21 NATIONAL ENERGY POLICY
★ The NEPD Group recommends that, in the context of developing advanced nuclear fuel cycles and next generation technologies for nuclear energy, the United States should reexamine its policies to allow for research, development and deployment of fuel conditioning methods (such as pyroprocessing) that reduce waste streams and enhance proliferation resistance. In doing so, the United States will continue to discourage the accumulation of separated plutonium, worldwide.
★ The United States should also consider technologies (in collaboration with international partners with highly developed fuel cycles and a record of close cooperation) to develop reprocessing and fuel treatment technologies that are cleaner, more efficient, less waste-intensive, and more proliferation-resistant.
★ The NEPD Group recognizes there is a need to reduce the time and cost of the hydropower licensing process. The NEPD Group recommends that the President encourage the Federal Energy Regulatory Commission (FERC) and direct federal resource agencies to make the licensing process more clear and efficient, while preserving environmental goals. In addition, the NEPD Group recognizes the importance of optimizing the efficiency and reliability of existing hydropower facilities and will encourage the Administration to adopt efforts toward that end.
• Support administrative and legislative reform of the hydropower licensing process.
• Direct federal resource agencies to reach interagency agreement on conflicting mandatory license conditions before they submit their conditions to FERC for inclusion in a license.
• Encourage FERC to adopt appropriate deadlines for its own actions during the licensing process.
Chapter 5 • Energy for A New Century: Increasing Domestic Energy Supplies 5-22

C H A P T E R S I X
Nature’s PowerIncreasing America’s Use of Renewable and Alternative Energy
Renewable hydropower has
long provided a significant
contribution to the U.S.
energy supply. Today,
hydropower is competitive
with other forms of conven
tionally generated electricity.
A sound national energy policy should encourage a clean and diverse portfolio of domestic energy supplies. Such diversity helps to ensure that future gen
erations of Americans will have access to the energy they need.
Renewable energy can help provide for our future needs by harnessing abundant, naturally occurring sources of energy, such as the sun, the wind, geothermal heat, and biomass. Effectively harnessing these renewable resources requires careful planning and advanced technology. Through improved technology, we can ensure that America will lead the world in the development of clean, natural, renewable and alternative energy supplies.
Renewable and alternative energy supplies not only help diversify our energy portfolio; they do so with few adverse envi
ronmental impacts. While the current contribution of renewable and alternative energy resources to America’s total electricity supply is relatively small—only 9 percent— the renewable and alternative energy sectors are among the fastest growing in the United States. Non-hydropower only account for 2 percent of our electricity needs. However, electricity generation from nonhydropower renewable energy grew by nearly 30 percent in the 1990s. Continued growth of renewable energy will continue to be important in delivering larger supplies of clean, domestic power for America’s growing economy.
Renewable energy resources tap naturally occurring flows of energy to produce electricity, fuel, heat, or a combination of these energy types. One type of renewable energy, hydropower, has long provided a significant contribution to the U.S. energy supply and today is competitive with other forms of conventional electricity. However, there is limited growth potential for hydropower. Non-hydropower renewable energy is generated from four sources: biomass, geothermal, wind, and solar (Figure 6-1). The United States has significant potential for renewable resource development. These nondepletable sources of energy are domestically abundant and often have less impact on the environment than conventional sources. They can provide a reliable source of energy at a stable price, and they can also generate income for farmers, landowners, and others who harness them.
6-1 NATIONAL ENERGY POLICY


Figure 6-1
U.S. Resource Potential for Renewable Energy
Potential Kilowatts per County greater than 40,000 5,000–40,000 0–5,000
Geothermal Resources
Resource Potential Good–Excellent Fair–Moderate
Wind Resources
Resource Potential Moderate
Solar Insolation Resources
Resource Potential 7+ kWh/M2/day 6+ kWh/M2/day 4+ kWh/M2/day 3+ kWh/M2/day
Biomass and Biofuel Resources
Excellent Good
Almost every state has the potential for wind energy and for biomass and biofuel production. The Southwest has the greatest potential for solar energy, and geothermal energy resources are most abundant in the West.____________Source: U.S. Department of Energy, National Renewable Energy Laboratory.
Recommendation:
★ The NEPD Group recommendsthat the President direct the Secretaries of the Interior and Energy to reevaluate access limitations to federallands in order to increase renewableenergy production, such as biomass,wind, geothermal, and solar.
Alternative energy includes: alternative fuels that are transportation fuels other than gasoline and diesel, even when the
type of energy, such as natural gas, is traditional; the use of traditional energy sources, such as natural gas, in untraditional ways, such as for distributed energy at the point of use through microturbines or fuel cells; and future energy sources, such as hydrogen and fusion.
Both renewable and alternative energy resources can be produced centrally or on a distributed basis near their point of use. Providing electricity, light, heat, or mechanical energy at the point of use diminishes the
6-3 NATIONAL ENERGY POLICY

need for some transmission lines and pipelines, reducing associated energy delivery losses and increasing energy efficiency. Distributed energy resources may be renewable resources, such as biomass cogeneration in the lumber and paper industry or rooftop solar photovoltaic systems on homes, or they may be alternative uses of traditional energy, such as natural gas microturbines.
Recommendations:
★ The NEPD Group supports the increase of $39.2 million in the FY 2002 budget amendment for the Department of Energy’s Energy Supply account that would provide increased support for research and development of renewable energy resources.
★ The NEPD Group recommends that the President direct the Secretary of Energy to conduct a review of current funding and historic performance of renewable energy and alternative energy research and development programs in light of the recommendations of this report. Based on this review, the Secretary of Energy is then directed to propose appropriate funding of those research and development programs that are performance-based and are modeled as public-private partnerships.
Renewable Energy Technologies Biomass
Biomass is organic matter that can be used to provide heat, make fuel, and generate electricity. Wood, the largest source of biomass, has been used to provide heat for thousands of years. Many other types of biomass are also used as an energy source, such as plants, residue from agriculture or forestry, and the organic component of municipal and industrial wastes. Landfill gas is also considered a biomass source. Biomass resources can be replenished through culti-
Microturbines
Microturbines are small combustion turbines approximately the size of a refrigerator with outputs of 25 to 500 kilowatts. Microturbines can be used to power a home or small business. This technology has evolved largely from automotive and truck turbochargers, auxiliary power units for airplanes, and small jet engines.
Compared to other technologies for small-scale power generation, microturbines offer a number of significant advantages, including a small number of moving parts; compact size; lightweight, optimal efficiency; lower emissions and electricity costs; and opportunities to use waste fuels. For these reasons, microturbines could easily capture a significant share of the distributed generation market.
vation of what are known as energy crops, such as fast-growing trees and grasses.
Unlike other renewable energy sources, biomass can be converted directly into liquid fuels, called biofuels, to meet our transportation needs. The two most common biofuels are ethanol and biodiesel. Ethanol is made by fermenting any biomass that is rich in carbohydrates, such as corn. It is mostly used as a fuel additive to reduce a vehicle’s emissions. Biodiesel is made using vegetable oils, animal fats, algae, or even recycled cooking greases. It can be used as a diesel additive to reduce emissions or in its pure form to fuel a vehicle. Beyond energy benefits, development of biomass benefits rural economies that produce crops used for biomass, particularly ethanol and biomass electricity generation.
Biomass, like corn, that is
rich in carbohydrates can be
converted directly into
biofuels to meet our transpor
tation needs. The biofuel
ethanol is mostly used as a
fuel additive to reduce
vehicles’ smog-causing
emissions. In June 1992, the
Greater Peoria Mass Transit
District began operating
fourteen ethanol-powered
buses along regular city
routes.
U.S. DEPARTMENT OF ENERGY
Chapter 6 • Nature’s Power: Increasing America’s Use of Renewable and Alternative Energy 6-4

The Geysers in northern
California is the world’s
largest producer of renewable
geothermal power. The dry
steam field has successfully
produced power since the
early 1960s, when Pacific
Gas & Electric installed the
first 11-megawatt plant.
Today, nearly 2,000 mega
watts are on line – enough
energy to supply the electric
ity needs of San Francisco
and Oakland.
PACIFIC GAS & ELECTRIC
Biomass is also used to generate electricity. This is accomplished through the direct combustion of wood, municipal solid waste, and other organic materials; co-firing with coal in high efficiency boilers; or combustion of biomass that has been chemically converted into fuel oil. In the lumber and paper industries, wood scraps are sometimes directly fed into boilers to produce steam for their manufacturing processes or to heat their buildings. For that reason, renewable energy offers a particular advantage to the lumber and paper industry, and many analysts project the industry may soon become a net seller of electricity. Co-firing coal power plants with biomass has environmental benefits, since cofiring can significantly reduce emissions. Biomass accounts for 76 percent of renewable electricity generation and 1.6 percent of total U.S. electricity supply.
Even gas for generating electricity can be produced from biomass. Gasification systems use high temperatures to convert biomass into a gas that is used to fuel a turbine. The decay of biomass in landfills also produces methane, a gas that can be captured and burned in a boiler to produce steam for electricity generation or for industrial processes. Using methane emissions increases electricity supplies, reduces pollution from landfills and reduces greenhouse gas emissions. The technologies to collect and use landfill methane to generate electricity are already in the market. How
ever, they have not been successfully integrated at present due to the perceived higher risk of new technologies.
Recommendation:
★ The NEPD Group recommends that the President direct the Secretary of the Treasury, to work with Congress on legislation to expand the section 29 tax credit to make it available for new landfill methane projects. The credit could be tiered, depending on whether a landfill is already required by federal law to collect and flare its methane emissions due to local air pollution concerns.
Geothermal Geothermal energy is the use of steam
and hot water generated by heat from the Earth to perform work. Some geothermal power plants use steam or hot water from a natural underground reservoir to power a generator. Others use hot water to provide direct heat for residential and other buildings, and for other applications.
The most readily accessible resources for geothermal power generation in the United States are located in the West, Alaska, and Hawaii. A wide array of hightechnology geological, geochemical, and geophysical techniques are used to locate geothermal resources. In large measure, the technology for developing these resources has been adapted from the oil industry. Improvements in drill bits, drilling techniques, advanced instruments, and other technological advances have made energy production from geothermal resources increasingly efficient.
Geothermal accounts for 17 percent of renewable electricity generation and 0.3 percent of total U.S. electricity supply. However, the net installed capacity of U.S. geothermal power plants has increased significantly, from 500 MW in 1973 to 2,800 MW today.
Hot water near the surface of the Earth can also be used directly for heat. These direct-use applications include heat
6-5 NATIONAL ENERGY POLICY

ing buildings, growing plants in greenhouses, drying crops, heating water at fish farms, and several industrial processes, such as pasteurizing milk.
In addition, individual homeowners, farmers, and businesses can tap into geothermal energy through geothermal heat pumps to heat and cool buildings. A geothermal heat pump system consists of a heat pump, an air delivery system, a heat exchanger, and a system of pipes buried in the shallow ground near the building. In the winter, a heat pump removes heat from the heat exchanger and pumps that heat into the indoor air delivery system. In the summer, the process is reversed, and the heat pump moves heat from the indoor air into the heat exchanger. The heat removed from the indoor air during the summer can also be used to provide a free source of hot water. Geothermal heat pumps can be used almost anywhere in the United States, and can significantly increase system efficiencies.
Recommendation:
★ The NEPD Group recommends thatthe President direct the Secretary of theInterior to determine ways to reducethe delays in geothermal lease processing as part of the permitting reviewprocess.
Wind Energy Wind energy has been used since at
least 200 B.C. for grinding grain and pumping water. By 1900, windmills were used on farms and ranches in the United States to pump water and, eventually, to produce electricity. Windmills developed into modern-day wind turbines.
Wind turbines are used for several applications. Wind power uses the naturally occurring energy of the wind for practical purposes like generating electricity, charging batteries, or pumping water. Large, modern wind turbines operate together in wind farms to produce electricity for utilities. Small turbines are used by homeowners, farmers, and remote villages to help meet localized energy needs.
Wind turbines capture energy by using propeller-like blades that are mounted on a
rotor. These blades are placed on top of high towers, in order to take advantage of the stronger winds at 100 feet or more above the ground. The wind causes the propellers to turn, which then turn the attached shaft to generate electricity. Wind can be used as a stand-alone source of energy or in conjunction with other renewable energy systems. Wind and natural gas hybrid systems are a promising approach that offers clean power to consumers.
Wind energy accounts for 6 percent of renewable electricity generation and 0.1 percent of total electricity supply. However, advances by research labs, universities, utilities, and wind energy developers have helped cut wind energy’s costs by more than 80 percent during the last twenty years. The industry is poised for growth. In some parts of the country, electricity from wind power can be produced at prices that are comparable to other conventional energy technologies. The United States has many areas with abundant wind energy potential, namely in the West, the Great Plains and New England.
Solar Sunlight, or solar energy, can be used
to generate electricity; heat water; and heat, cool, and light buildings. Photovoltaic (solar cell) systems use semiconductor materials similar to those used in computer chips to capture the energy in sunlight and to convert it directly into electricity. Photovoltaic cells have been used in everything from
In 1996, the National
Association of Home Builders
constructed advanced
townhouses featuring
standing-seam roofs and
other energy efficient
materials and systems.
The townhouse on the right
differs from the others in that
it has an integrated photovol
taic standing-seam roof that
also produces electricity.
TIM ELLISON, ENERGY CONVERSION DEVICES
Chapter 6 • Nature’s Power: Increasing America’s Use of Renewable and Alternative Energy 6-6

the solar cells in calculators to the space station Freedom.
Another technology for harnessing the sun’s energy is a concentrating solar power system, which uses the sun’s heat to generate electricity. The sunlight is collected and focused with mirrors to create a high intensity heat source that in turn can be used to generate electricity through a steam turbine or a heat engine.
Solar hot water systems use the sun to heat water for domestic or industrial use. Many large commercial buildings also use solar collectors for heat. A solar ventilation system can be used in cold climates to preheat air as it enters a building. The heat from a solar collector can even be used to provide energy for cooling a building.
Some architects are using careful design and new optical materials to use sunlight to reduce the need for traditional lighting and to cut down on heating and cooling costs. For example, materials that absorb and store the sun’s heat can be built into the sunlit floors and walls. The floors and walls
Recommendations:
will store heat during the day and slowly release heat at night.
While solar energy technologies have undergone technological and cost improvements and are well established in highvalue markets like remote power, satellites, communications, and navigational aids, continued research is needed to reduce costs and improve performance. Solar energy accounts for 1 percent of renewable electricity generation and 0.02 percent of total U.S. electricity supply.
Alternative Energy Alternative Transportation Fuels
Alternative fuels are any transportation fuels made from a nontraditional source, including ethanol, biodiesel, and other biofuels. These can be made from biomass resources, including liquid fuels (e.g., ethanol, methanol, biodiesel) and gaseous fuels (e.g., hydrogen and methane). Biofuels are primarily used to fuel vehicles, but can also fuel engines or fuel cells for electricity generation. Alternative fuels also
★ The NEPD Group recommends that the President direct the Administrator of the Environmental Protection Agency to develop a new renewable energy partnership program to help companies more easily buy renewable energy, as well as receive recognition for the environmental benefits of their purchase, and help consumers by promoting consumer choice programs that increase their knowledge about the environmental benefits of purchasing renewable energy.
★ The NEPD Group recommends that the President direct the Secretary of the Treasury to work with Congress on legislation to extend and expand tax credits for electricity produced using renewable technology, such as wind and biomass. The President’s budget request extends the present 1.7 cents per kilowatt hour tax credit for electricity produced from wind and biomass; expands eligible biomass sources to include forest-related sources, agricultural sources, and certain urban sources; and allows a credit for electricity produced from biomass co-fired with coal.
★ The NEPD Group recommends that the President direct the Secretary of the Treasury to work with Congress on legislation to provide a new 15 percent tax credit for residential solar energy property, up to a maximum credit of $2,000.
★ The NEPD Group recommends that the President direct the Secretaries of the Interior and Energy to work with Congress on legislation to use an estimated $1.2 billion of bid bonuses from the environmentally responsible leasing of ANWR for funding research into alternative and renewable energy resources, including wind, solar, geothermal, and biomass.
6-7 NATIONAL ENERGY POLICY

Alternative Fuel Vehicles Alternative fuel vehicles (AFVs) can run on methanol, ethanol, compressed natural gas, liquefied natural gas, propane, hydrogen, electricity, biodiesel, and natural gas. Today, more than 450,000 alternative vehicles are operating in the United States. Some of the barriers to using AFVs include:
Cost—For example, a Ford Crown Victoria that runs on compressed natural gas costs about $4,000 more than its gasoline counterpart.
Refueling Infrastructure—Refueling infrastructure is limited, which can make refueling inconvenient and travel options difficult.
Travel Distance—Ability to travel a long distance on a single volume of fuel. Al ternative fuels have an energy content lower than that of gasoline, which means that AFVs cannot travel as far as traditional vehicles on a single tank of fuel.
In the short term, natural gas and propane offer the greatest potential for market growth, especially in niche markets where lower fuel costs make them attractive, such as transit buses, school buses, shuttles, and other heavy-duty vehicles. Ethanol vehicles offer tremendous potential if ethanol production can be expanded. Electric vehicles could reach large numbers in the future if technology breakthroughs help bring costs down and increase driving distance. Fuel cell vehicles operating on compressed hydrogen offer long-term potential. Compressed natural gas offers a distribution stepping-stone to a hydrogen-refueling infrastructure.
include traditional energy sources, such as natural gas and liquid propane that are traditionally not used as a transportation fuel.
Currently, there are approximately 450,000 alternative fuel vehicles in the United States, and more than 1.5 million flexible-fuel vehicles that can use gasoline or a mixture of ethanol and gasoline. Ethanol is made by converting the carbohydrate portion of biomass into sugar, which is then converted into ethanol through a fermentation process. Ethanol is the most widely used biofuel, and its production has increased sharply since 1980, rising from 200 million gallons a year to 1.9 billion gallons. Today, many states are considering phasing out the use of MTBE (methyl tertiary butyl ether), an oxygenate additive for gasoline. If they do so, that will likely spur greater reliance on ethanol.
Each year, approximately 65 percent of the oil consumed in the United States is used for transportation. As a result, vehicle emissions have become the leading source of U.S. air pollution. However, recent advances in fuels and vehicle design are helping increase fuel efficiency and reduce toxic substances discharged into the air.
Changes in the composition of trans
portation fuels, such as gasoline and diesel fuels, are one way to improve vehicle performance while reducing emissions and lowering oil consumption. Reformulated gasoline contains fuel additives such as ethanol to increase oxygen content, which reduces harmful emissions such as carbon monoxide. Low-sulfur gasoline reduces sulfur oxide emissions. New diesel fuels, some of which have lower sulfur contents or are produced from clean-burning natural gas, can help vehicles with diesel engines achieve lower emissions.
In addition to advanced transportation fuels, alternative fuels are being developed, such as biodiesel, electricity, ethanol, hydrogen, methanol, natural gas, and propane. These alternative fuels not only reduce dependence on petroleum transportation fuels. They reduce or entirely eliminate harmful emissions as well. With the exception of natural gas and propane, these fuels also have the potential of being generated from renewable resources, such as ethanol from corn. The federal government has promoted development of alternative fuels for many years and this program has helped to reduce U.S. reliance on oil-based fuels.
The evolution toward more efficient,
Chapter 6 • Nature’s Power: Increasing America’s Use of Renewable and Alternative Energy 6-8
environmentally friendly transportation fuels has been mirrored by improvements in vehicle design, components, and materials. Alternative fuel vehicles, which can either switch between two fuels or run on a mixture of two fuels such as gasoline and ethanol, are now available. Recent developments in both alternative fuel vehicles and petroleum-based vehicles, such as advances in engines, drive trains, and emission-control technologies, may double or triple the efficiency of current vehicles. Some of these new technologies include hybrid electric vehicles, which combine an engine with an electric motor, and fuel cells, which produce electricity by converting a fuel, generally hydrogen and oxygen, into water.
A number of issues drive the research and marketability of advanced alternative fuel vehicles and petroleum-based vehicles in the United States. The goal of reducing U.S. dependence on imported oil, combined with the link between vehicle emissions and air pollution, have prompted the development of emissions and fuel economy standards for car manufacturers. In addition, federal, state, and local governments have enacted regulations, laws, and incentives designed to reduce the number of vehicle miles traveled and to encourage businesses and individuals to purchase alternative fuel vehicles.
The success of the federal alternative fuels program has been limited, however. The current program focuses on mandating certain fleet operators to purchase alternative fueled vehicles. The hope was that this vehicle purchase mandate would lead to expanded use of alternative fuels. That expectation has not been realized, since most fleet operators purchase dual-fueled vehicles that operate on petroleum motor fuels. The Clean Air Act required the use of oxygenates, such as MTBE (methyl tertiary butyl ether) and ethanol in fuel. These oxygenates account for 92 percent of alternative fuel use. Reforms to the federal alternative fuels program could promote alternative fuels use instead of mandating purchase of vehicles that ultimately run on petroleum fuels.
Recommendation:
★ The NEPD Group recommends thatthe President direct the Secretary ofTreasury to work with Congress tocontinue the ethanol excise taxexemption.
Distributed Energy Untapped opportunities for reducing
energy demand loads could be realized by better integrating electricity supply systems and customers. Improved integration can produce a variety of benefits for tight energy markets, including reducing peak demand loads, bypassing congested areas of transmission by placing new generating capacity closer to the consumer, and thus achieving greater overall system efficiencies.
Current electricity load management efforts are typically limited to cutting off interruptible or nonfirm customers, appeals to the public to conserve, and brownouts. Some utilities are incorporating currentgeneration metering, sensor, and control technologies to take the next step: selective reduction of individual energy-using appliances. In some areas, residents can reduce their monthly bills by allowing the utility to electronically turn off selected appliances, such as water heaters, on a rotating basis. If this option is well managed, consumers are unaware of the temporary loss service, and critical systems continue to run unimpeded. Advanced integrated supply-and-demand load management controls also allow for widespread “demand auctions,” in which consumers can decide which energy services to forego on which days.
Distributed energy resources describe a variety of smaller electricity-generating options well suited for placement in homes, offices, and factories, or near these facilities. Distributed energy systems have the distinct advantage of being brought on line faster than new central power plants. While natural gas microturbines and solar roof panels are the most familiar types of distributed energy, other distributed energy resources include: combined heat and power, stationary fuel cells, generation of
6-9 NATIONAL ENERGY POLICY

bioenergy from landfill methane recovery, and small wind systems. Photovoltaic solar distributed energy is a particularly valuable energy generation source during times of peak use of power.
Efficiency gains from distributed energy come from three sources. First, transmission and distribution line losses (about 5 percent) are reduced because the energy is generally used near the source. Second, the co-location with consumption makes it more feasible to use waste heat, displacing otherwise needed natural gas or electricity for heating purposes. And, third, the co-location with consumption allows for the integration of on-site energy efficiency and generating capabilities. For example, in the residential market, distributed energy applications can make possible the concept of the “net zero energy home,” in which the overall level of energy produced at the home equals or exceeds the amount of energy used in the home.
Despite these advantages, a number of impediments and competing policy objectives discourage the wider application of integrated electricity supply and demand solutions, many of which reflect the relative newness and lack of familiarity with these technologies.
For example, the lack of standards governing interconnection of distributed energy to the grid impedes development. The lack of standards prevents a uniformly effective means of getting excess distributed energy to the grid.
In addition, current air quality regulations do not take into account the additional energy savings from many distributed energy technologies. Likewise, distributed energy systems purchased by consumers may receive different tax rates than those purchased by traditional electricity producers.
Although distributed energy can alleviate distribution constraints, these systems often cannot be sited and permitted in a timely manner. For instance, land-use zoning codes may not allow generating equipment in association with residential or commercial land uses, and building code officials may not know enough about solar roof systems to provide timely building permits.
As with energy efficiency equipment, load management integrating systems, both controls and distributed energy, have higher first costs associated with lower future energy bills.
Another barrier to development of distributed energy is the need for net metering, which enables consumers to install a small electricity project at their homes and sell the excess to the local utility, offsetting their purchases from the utility at other times. Net metering can lower the cost to consumers of distributed energy projects. Some consumers are reluctant to install distributed renewable energy resources because many regions do not have the regulatory framework under which consumers can sell energy back to the grid under a net metering system.
Future Energy Sources As we look to the long-term future of
alternative energy technologies, there is significant promise in these technologies to meet an ever-growing portion of our nation’s energy needs.
Hydrogen In the long run, alternative energy
technologies such as hydrogen show great promise. Hydrogen is the most common element in the universe and can be made from water. Converting hydrogen into energy is compatible with existing energy technologies, such as fuel cells, engines, and combustion turbines. The energy for extracting hydrogen could come from existing, traditional fuels, or it could be derived from renewable energy sources, such as solar, nuclear, and fossil, to achieve the cleanest possible energy cycle. Hydrogen can be converted into useful energy forms efficiently and without detrimental environmental effects. Unlike other energy sources, its production by-product is water.
In the future, hydrogen may be able to be used in furnaces and as a transportation fuel for automobiles, buses, trains, ships and airplanes. Hydrogen could also be converted directly into electricity by fuel cells. Combustion of hydrogen with oxygen results in pure steam, which has many appli-
Chapter 6 • Nature’s Power: Increasing America’s Use of Renewable and Alternative Energy 6-10

There is a significant
promise in renewable
technologies to meet an ever
growing portion of our
nation’s energy needs. Wind
power has significant growth
potential. The principal
challenges to achieving this
level of renewable energy
generation are cost and
market acceptance of renew
able power technologies.
U.S. DEPARTMENT OF ENERGY, NATIONAL
RENEWABLE ENERGY LABORATORY
cations in industrial processes and space heating. Moreover, hydrogen is an important industrial gas and raw material in numerous industries, such as computer, metallurgical, chemical, pharmaceutical, fertilizer and food industries.
An energy infrastructure that relies on hydrogen could enable much greater use of distributed energy systems. These systems are small, modular electricity generators that can be placed right where they are needed for heating, cooling, and powering offices, factories, and residences. Hydrogen fuel cells are a promising type of distributed energy system that can provide the exacting reliability needed for the high-tech industry.
Fuel cells can produce electricity and heat from hydrogen, natural gas, and petroleum fuels, and fuel gases derived from coal and biomass. What makes fuel cells unique is that they can use fuels without combustion, simply by chemical reactions, making them extremely clean and efficient.
Fuel cells were developed by the National Aeronautics and Space Administration to generate electricity, heat, and water in space vehicles. The first-generation fuel cells for stationary power applications entered the commercial market in 1995. This type of fuel cell is used to generate very high-quality electricity and heat with negligible emissions in commercial and industrial settings. It is most likely to be used in cases where users are willing to pay a premium for cleaner, more reliable power than is available from the commercial grid.
The second generation of stationary fuel cells is currently in the demonstration phase, including a combined fuel cell–turbine hybrid. These fuel cells are expected to be more efficient and cost less when used in similar distributed energy systems. Smaller fuel cells for residential units are also being developed, and some are in the demonstration phase.
Despite technical progress, high costs remain the main deterrent to widespread fuel cell use. Significant cost reductions must be achieved before fuel cells will be competitive with internal combustion engines, and the size and weight of fuel cell systems must be reduced even more to ac
commodate vehicle packaging requirements.
The primary challenge to using more hydrogen in our energy systems is the cost of producing, storing, and transporting it. A serious challenge confronting a move toward distributed energy is the transition away from centralized energy systems of supply and production. These challenges are not expected to be resolved overnight, but progress made in the last few years has already far surpassed the expectations of just a decade ago.
A significant amount of promising research and development has already been completed. The automobile industry is aggressively exploring the fuel cell as the future of the industry. Moreover, a new firstgeneration class of distributed energy technologies are already hitting the market.
Fusion Fusion—the energy source of the
sun—has the long-range potential to serve as an abundant and clean source of energy. The basic fuels, deuterium (a heavy form of hydrogen) and lithium, are abundantly available to all nations for thousands of years. There are no emissions from fusion, and the radioactive wastes from fusion are shortlived, only requiring burial and oversight for about 100 years. In addition, there is no risk of a melt-down accident because only a small amount of fuel is present in the system at any time. Finally, there is little risk of nuclear proliferation because special nuclear materials, such as uranium and plutonium, are not required for fusion energy. Fusion systems could power an energy supply chain based on hydrogen and fuel cells, as well as provide electricity directly.
Although still in its early stages of development, fusion research has made some advances. In the early 1970s, fusion research achieved the milestone of producing 1/10 of one watt of fusion power, for 1/100 of a second. Today the energy produced from fusion is 10 billion times greater, and has been demonstrated in the laboratory at powers over 10 million watts in the range of a second.
6-11 NATIONAL ENERGY POLICY

Internationally, an effort is underway in Europe, Japan, and Russia to develop plans for constructing a large-scale fusion science and engineering test facility. This test facility may someday be capable of steady operation with fusion power in the range of hundreds of megawatts.
Both hydrogen and fusion must make significant progress before they can become viable sources of energy. However, the technological advances experienced over the last decade and the advances yet to come will hopefully transform the energy sources of the distant future.
Recommendation:
★ The NEPD Group recommendsthat the President direct the Secretaryof Energy to develop next-generationtechnology—including hydrogen andfusion.• Develop an education campaign that communicates the benefits of alternative forms of energy, including hydrogen and fusion. • Focus research and development efforts on integrating current programs regarding hydrogen, fuel cells, and distributed energy.
Current Markets for Renewable and Alternative Energy Advances in Technology
Non-hydropower renewable energy accounts for about 4 percent of current U.S. energy production, divided evenly between electricity generation and transportation fuels such as ethanol. Between 1990 and 1999, renewable energy generation grew by 29 percent, and renewable energy is projected to continue to grow (Figure 6-1). Renewable fuel consumption, including ethanol for gasoline blending, is projected to grow at an average rate of 1.1 percent a year through 2020. In 2020, 55 percent of renewables are projected to be used for electricity generation and the rest for dispersed heating, industrial uses, and fuel blending.
The success of renewables is, in part,
the result of over twenty years of research, development, and demonstration conducted by the public and private sectors. This work has dramatically improved these technologies and has reduced their costs by as much as 90 percent. For example:
• The Department of Energy (DOE), the National Renewable Energy Laboratory (NREL), and Alstom Energy Systems jointly created Advanced Direct-Contact Condensers, which improve the efficiency and generating capacity of electric power plants by providing the best surface area for condensing spent steam. This technological advance, tested in geothermal applications in California, can improve the efficiency of electricity production by 5 percent and capacity by 17 percent.
• United Solar Systems in Michigan pioneered the first commercial use of solar photovoltics as a building material. The triple-junction, thin-film technology is now sold as flexible solar panels, solar shingles for building roofs, and a peel-and-stick-on variety for standing seam metal roofs. United Solar is now building a larger manufacturing plant in Michigan that is five times the size of its existing manufacturing facility. DOE collaborates with United Solar on research and development helping overcome hurdles in manufacturing. As a result, United Solar is able to provide unique solarelectric products using a unique roll-to-roll manufacturing process.
• In partnership with DOE, NREL, Battelle Lab, Burlington Electric and others, Future Energy Resources Corporation of Norcross, Georgia, was able to build, test, and operate the world’s first biomass gasification system. The McNeil Plant, located in Burlington, Vermont, gasifies rather than combusts wood chips to power a gas boiler. The technology has shown itself to be commercially viable, and is being considered worldwide by industries as a way of upgrading existing inefficient and aging boilers.
Improved renewable and alternative energy technologies are becoming increasingly attractive to a number of energy companies seeking to build new business opportunities for the future (Figure 6-3). Following are a few examples:
Figure 6-1 Increases in U.S. EnergyProduction: 1990–1999 (Quadrillion Btus)
Natural Gas 1.12
Renewables 1.18
Nuclear 1.57
Coal 0.90
1.8
1.6
1.4
1.2
1.0
0.8
0.6
0.4
0.2 0
During the last decade, renewable energy sources contributed substantially to the growth in U.S. energy production, outpacing all fuel sources except for nuclear energy. _______ Source: U.S. Department of Energy, Energy Information Administration.
Chapter 6 • Nature’s Power: Increasing America’s Use of Renewable and Alternative Energy 6-12

Table 6-2 Electricity Generated by Renewable Energy Sources: 1999
Current net summer capacity (MW) 350 2,600 2,870 6,170 79,130
Annual generation (millions of kWh) 940 4,460 13,070 36,570 312,000
Expected growth PV: 19.3 in generation (%) Thermal: 21 5.3 3.3 3.0 -0.1
Cost (cents/kWh) 20 4–6 5–8 6–20 2–6
Solar Wind Geothermal Biomass Hydropower
Renewable energy has become a significant source of electric power in the United States. _______ Note: Capacity, generation, and growth data do not include off-grid electricity, thermal, or other nonelectricity energy production, municipal solid waste, or methane from landfills.
Sources: U.S. Department of Energy, Energy Information Administration and Office of Power Technologies.
• FPL Group announced in January 2001 the construction of two major wind farms: a 300 MW facility on the Washington–Oregon border, and a 25.5 MW facility in Wisconsin. The company now has more than 1,000 MW of wind generating capacity in operation or under construction in seven states.
• CalEnergy Company has made renewable and alternative energy generation a central focus of its power portfolio. The company operates 1,300 MW of geothermal, natural gas, hydropower, and other power facilities in the U.S. and abroad, with another 750 MW currently under construction.
• General Motors, Ford, DaimlerChrysler, Texaco, BP/Amoco, and Shell are collectively spending between $500 million and $1 billion dollars a year on fuel cells, hydrogen storage, and infrastructure development for passenger vehicles. Ongoing bus demonstrations in the United States and Europe are expected to commercialize fuel cell power hydrogen buses in the next five years.
Because alternative and renewable energy resources can be used in so many different ways throughout the economy to produce so many combinations of energy types, their total use is often difficult to measure precisely. As of 1996, California alone had over 10 MW of installed distributed energy, a large increase in generating
capacity during a period of otherwise limited growth in generation (Figure 6-3). In 1999, several types of renewable energy were used to produce electricity (Table 6-2).
On the transportation side, there are approximately 450,000 alternative fuel vehicles in the United States. Additionally, there are more than 1.5 million flexible-fuel vehicles that can use gasoline or a high mixture of ethanol and gasoline. These include the Ford Taurus, the DaimlerChrysler Caravan, and the General Motors S10 pickup. Ethanol is the most widely used biofuel, and its production is currently 1.9 billion gallons a year, representing a nearly ten-fold growth from about 200 million gallons a year in 1980.
Recommendation:
★ The NEPD Group recommendsthat the President direct the Secretaryof the Treasury to work with Congressto develop legislation to provide for atemporary income tax credit availablefor the purchase of new hybrid orfuel-cell vehicles.
Hybrid Electric Vehicles Hybrid electric vehicles (HEVs) combine the internal combustion engine of a conventional engine with the battery and electric motor of an electric vehicle, resulting in twice the fuel economy of conventional vehicles. This combination offers the extended range and rapid refueling that consumers expect from a conventional vehicle, with a significant portion of the energy and environmental benefits of an electric vehicle. The practical benefits of HEVs include improved fuel economy and lower emissions compared to conventional vehicles. The car’s flexibility will mean convenient use for individuals as well as businesses.
Removing Barriers to Renewable and Alternative Energy Growth
Perhaps the greatest barrier to growth of renewable energy is cost. Currently, the cost of renewable energy generation fre
6-13 NATIONAL ENERGY POLICY

quently exceeds the costs of conventional electricity generation. In recent years, though, the costs of renewable energy have declined substantially. For example, the cost of wind energy has declined by more than 80 percent over the past twenty years and is increasingly competitive with conventional electricity generation sources. Wind, biomass, and geothermal are all increasingly competitive with conventional electricity generation.
The ability of these technologies to meet specific market needs is another factor in how quickly their market share will grow. These technologies and energy sources provide multiple benefits to the energy producer and the consumer. For example, many of these technologies are modular and can be constructed rapidly, adding an immediate source of new power in areas that otherwise might face a shortfall. Distributed renewable energy resources can enhance the reliability and quality of power.
Cogeneration uses of waste products and heat can increase profits by reducing purchased electricity costs, as well as costs for process steam and heating or cooling. Several sectors, including lumber and paper, steel, and chemical manufacturing, are exploring the increased use of cogeneration. With the technological development of biomass gasification, the lumber and paper industry could become a seller of electricity.
Recommendation:
★ The NEPD Group recommends that the President direct the Administrator of the Environmental Protection Agency to issue guidance to encourage the development of welldesigned combined heat and power (CHP) units that are both highly efficient and have low emissions. The goal of this guidance would be to shorten the time needed to obtain each permit, provide certainty to industry by ensuring consistent implementation across the country, and encourage the use of these cleaner, more efficient technologies.
Renewable technologies can help provide insurance against price volatility. In addition, many renewable technologies can help industry achieve compliance with the Clean Air Act and other environmental regulations. In some cases, renewables can be more readily located in urban areas whose air quality does not meet regulatory requirements.
With the growth rate for non-hydropower renewable electricity generation more than doubling the expected growth in overall electricity capacity, these energy sources will play a more significant role in electricity markets in the next two decades. However, the extent to which these domestic resources are successfully tapped will depend in large part on continued technological development.
For renewable and alternative energy to play a greater role in meeting our energy demands, these sources of generation must be able to integrate into our existing distribution system. The tools that form the necessary interface between distributed energy systems and the grid need to be less expensive, faster, more reliable, and more compact.
Promising technologies exist that will improve the transmission, storage, and reliability of renewable energy. An example of recent technological success that will allow for increased access to all forms of energy, including renewable energy, is the high-temperature superconducting underground power transmission cables that the Department of Energy is developing in partnership with industry. These cables will allow a 300 percent increase in capacity without excavation to lay new transmission lines. This summer, Detroit Edison is demonstrating this commercially viable high-temperature superconducting cable system in an application that serves 14,000 customers.
Renewable and alternative energy technologies, such as wind energy and combined heat and power could be significantly expanded, given today’s technologies. They could be further expanded with added investment in technology. For example, wind energy could be developed that could be adapted to sites with lower wind speeds than is feasible today. Combined heat and
Figure 6-3 Growth in California’s Renewable EnergyCapacity
(Thousands of Megawatts)
4,139 5
4
3
2
1
0 187
4,097
1,497
1980 1985 1990 1996
_______
Source: U.S. Department of Energy, Energy Information Administration.
Chapter 6 • Nature’s Power: Increasing America’s Use of Renewable and Alternative Energy 6-14

While solar energy technolo
gies have undergone techno
logical and cost improve
ments, and are well estab
lished in high value markets
like remote power, satellites,
communications, and
navigational aids continued
research is needed to reduce
costs and improve perfor
mance.
U.S. DEPARTMENT OF ENERGY
Figure 6-4 Investors Are Betting onDistributed Energy (Millions of Dollars)
Less Than $20 Million Annually
800
600
400
200
0
1980 94 96 98 00
In the last few years, surging venture capital investments showed strong support for distributed energy technologies. _______ Note: Data for 2000 are projectedinvestments.Source: Nth Power via the Economist,August 5, 2000.
power in buildings offers great potential for
increased system efficiencies and lower
costs. New developments in microturbine
and fuel cell technologies are also highly
promising. Performance improvements of
other technologies, such as photovoltaic
systems, would facilitate much wider use.
In addition to technological performance,
attention to several key market and regula
tory constraints would accelerate the devel
opment and use of renewable and alterna
tive energy in the marketplace.
Because many renewable and alterna
tive energy technologies do not fit into tra
ditional regulatory categories, they are of
ten subjected to competing regulatory re
quirements or to requirements that were
never designed to address them. For ex
ample, much of the current Clean Air Act
does not specifically address the use of
new, more efficient renewable energy tech
nologies. Consequently, the Act does not
provide significant incentives for the devel
opment of such technologies.
The lack of interconnection standards
or guidelines for electricity supply and loads
impedes the use of distributed energy tech
nologies. As a result, developers of small re
newable energy projects must negotiate in
terconnection agreements on a site-by-site
basis with local distribution companies that
are often opposed to distributed energy
projects because of the increased competi
tion. Although a few states have established
interconnection standards, there is no na
tional standard to facilitate development of
distributed energy (Figure 6-4).
New combined heat and power facili
ties may face air permitting hurdles when
they replace marginally dirty boilers. The
Clean Air Act does not recognize the pollu
tion prevention benefits of the increased ef
ficiency of combined heat and power units.
At the same time, these combined heat and
power investments are taxed at the
industry’s tax rate, not at the rate they
would receive if they were considered part
of the utility sector for tax purposes.
6-15 NATIONAL ENERGY POLICY
In addition, modifications to permitting and
siting requirements may be necessary to fa
cilitate the incorporation of these technolo
gies into buildings.
The infrastructure needed for increas
ing the use of renewable and alternative en
ergy varies considerably. In particular, the
alternative fuels infrastructure lags far be
hind the existing infrastructure for conven
tional fuels. The lack of infrastructure for al
ternative fuels is a major obstacle to con
sumer acceptance of alternative fuels and
the purchase of alternative fuel vehicles. It
is also one of the main reasons why most al
ternative fuel vehicles actually operate on
petroleum fuels, such as gasoline and diesel.
In addition, a considerable enlargement of
ethanol production and distribution capac
ity would be required to expand beyond
their current base in the Midwest in order to
increase use of ethanol-blended fuels.
The use of natural gas or electricity for
vehicles requires enhancements to these
distribution systems, such as compression
stations for natural gas. While many alterna
tive fuels can be shipped by pipeline, they
may require separation within the pipeline
to avoid mixing different energy products.
Geographically dispersed renewable energy
plants often face significant transmission
barriers, including unfavorable grid sched
ule policies and increased embedded costs.
Uncertainty regarding the tax treat
ment of these technologies and energy
sources can discourage long-term invest
ment. Though existing tax credits provide
an incentive for investing in some types of
renewable energy, the limited scope of the
credit and its frequent expiration discour
ages investment.
Chapter 6 • Nature’s Power: Increasing America’s Use of Renewable and Alternative Energy 6-16

Summary of Recommendations
Nature’s Power: Increasing America’s Use of Renewable and
Alternative Energy
★ The NEPD Group recommends that the President direct the Secretaries of the Interior and Energy to re-evaluate access limitations to federal lands in order to increase renewable energy production, such as biomass, wind, geothermal, and solar.
★ The NEPD Group supports the increase of $39.2 million in the FY 2002 budget amendment for the Department of Energy’s Energy Supply account that would provide increased support for research and development of renewable energy resources.
★ The NEPD Group recommends that the President direct the Secretary of Energy to conduct a review of current funding and historic performance of renewable energy and alternative energy research and development programs in light of the recommendations of this report. Based on this review, the Secretary of Energy is then directed to propose appropriate funding of those research and development programs that are performance-based and are modeled as public-private partnerships.
★ The NEPD Group recommends that the President direct the Secretary of the Treasury to work with Congress on legislation to expand the section 29 tax credit to make it available for new landfill methane projects. The credit could be tiered, depending on whether a landfill is already required by federal law to collect and flare its methane emissions due to local air pollution concerns.
★ The NEPD Group recommends that the President direct the Secretary of the Interior to determine ways to reduce the delays in geothermal lease processing as part of the permitting review process.
★ The NEPD Group recommends that the President direct the Administrator of the Environmental Protection Agency to develop a new renewable energy partnership program to help companies more easily buy renewable energy, as well as receive recognition for the environmental benefits of their purchase, and help consumers by promoting consumer choice programs that increase their knowledge about the environmental benefits of purchasing renewable energy.
★ The NEPD Group recommends that the President direct the Secretary of the Treasury to work with Congress on legislation to extend and expand tax credits for electricity produced using wind and biomass. The President’s budget request extends the present 1.7 cents per kilowatt hour tax credit for electricity produced from wind and biomass; expands eligible biomass sources to include forest-related sources, agricultural sources, and certain urban sources; and allows a credit for electricity produced from biomass co-fired with coal.
★ The NEPD Group recommends that the President direct the Secretary of the Treasury to work with Congress on legislation to provide a new 15 percent tax credit for residential solar energy property, up to a maximum credit of $2,000.
★ The NEPD Group recommends that the President direct the Secretaries of the Interior and Energy to work with Congress on legislation to use an estimated $1.2 billion of bid bonuses from the environmentally responsible leasing of ANWR for funding research into alternative and renewable energy resources, including wind, solar, geothermal, and biomass.
6-17 NATIONAL ENERGY POLICY

★ The NEPD Group recommends that the President direct the Secretary of the Treasury to work with Congress to continue the ethanol excise tax exemption.
★ The NEPD Group recommends that the President direct the Secretary of Energy to develop next-generation technology—including hydrogen and fusion. • Develop an education campaign that communicates the benefits of alternative forms of energy, including hydrogen and fusion. • Focus research and development efforts on integrating current programs regarding hydrogen, fuel cells, and distributed energy. • Support legislation reauthorizing the Hydrogen Energy Act.
★ The NEPD Group recommends that the President direct the Secretary of the Treasury to work with Congress to develop legislation to provide for a temporary income tax credit available for the purchase of new hybrid or fuel-cell vehicles between 2002 and 2007.
★ The NEPD Group recommends that the President direct the Administrator of the Environmental Protection Agency to issue guidance to encourage the development of well-designed combined heat and power (CHP) units that are both highly efficient and have low emissions. The goal of this guidance would be to shorten the time needed to obtain each permit, provide certainty to industry by ensuring consistent implementation across the country, and encourage the use of these cleaner, more efficient technologies.
Chapter 6 • Nature’s Power: Increasing America’s Use of Renewable and Alternative Energy 6-18

C H A P T E R S E V E N
America’s EnergyInfrastructure A Comprehensive Delivery System
O ne of the greatest energy challenges facing America is the need to use 21st- century technology to improve America’s aging energy infrastructure. Americans
need a comprehensive, long-term solution to deliver energy to industry and consumers in a reliable and safe manner.
Our energy infrastructure is comprised of many components, such as the physical network of pipes for oil and natural gas, electricity transmission lines and other means for transporting energy to consumers. This infrastructure also includes facilities that turn raw natural resources into useful energy products. The rail network, truck lines, and marine transportation are also key components of America’s energy infrastructure.
The energy industry has undergone major changes in the last two decades, and more are expected. These changes affect how our energy infrastructure operates. For example, while the electricity industry was once vertically integrated, it is increasingly separated into three isolated segments: generation, transmission, and distribution.
Our energy infrastructure has failed to keep pace with the changing requirements of our energy system. Domestic refining capacity has not matched increases in demand, requiring the United States to import refined products. Natural gas pipelines have not expanded sufficiently to meet demand. The electricity transmission system is constrained by insufficient capacity. Rail capacity was significantly increased during the 1970s when rail facilities were improved to move more coal. Since then, however, few additions to the coal transportation rail network have been built.
The United States needs to modernize its energy infrastructure. One sign of a lack of an energy policy in recent years has been the failure to maintain the infrastructure needed to move energy where it is needed most.
Electricity The electricity infrastructure includes
a nationwide power grid of long-distance transmission lines that move electricity from region to region, as well as the local distribution lines that carry electricity to homes and businesses. Electricity originates at power plants, which are primarily fueled by coal, nuclear, natural gas, water and, to a lesser extent, oil. Coal, natural gas and oil powered plants require a dependable transportation infrastructure to deliver the fuels necessary for the production of electricity. A transportation network for waste disposal is also necessary for power plants that create byproducts.
Restructuring The electricity industry has undergone
considerable changes in the last two decades. These changes affect how our electricity infrastructure operates. Major industry restructuring has separated once vertically integrated electric utilities that supplied generation, transmission, and distribution services into distinct entities. To facilitate competition at the wholesale level, in 1996, the Federal Energy Regulatory Commission (FERC) required transmission-owning utilities to “unbundle” their transmission and power marketing functions, and provide nondiscriminatory, open access to their transmission systems by other utilities
U.S
. DE
PAR
TM
EN
T O
F E
NE
RG
Y
7-1 NATIONAL ENERGY POLICY


FIGURE 7-1North AmericanTransmission Lines
About 204,000 miles of long-distance transmission lines move power from region to region. The four integrated transmission grids serving North America are the Western Interconnection, Eastern Interconnection, Electric Reliability Council of Texas, and Province of Quebec. ______ Source: PA Consulting Group
7-3 NATIONAL ENERGY POLICY

Chapter 7 • America’s Energy Infrastructure: A Comprehensive Delivery System 7-4

and independent power producers. At the retail level, some states have required utilities to divest their generation assets as part of restructuring. These utilities currently supply only transmission and distribution services for customers who purchase electricity (i.e., generation services) from other firms. In addition, power marketers—who often do not own generation, transmission, or distribution facilities—buy and sell power on wholesale markets and market electricity directly to customers.
Electricity competition has led to significant changes in the operation of the bulk power grid, which are the power plants and high-voltage transmission facilities that make up the wholesale power market. More electricity is being shipped longer distances over a transmission system that was initially designed only to provide limited power and reserve sharing among neighboring utilities. Electric utilities that were once solely responsible for ensuring that adequate generation was available to meet demand now purchase a substantial amount of the power they need from the wholesale market, relying on independent power producers to build and operate plants.
Electricity Generation There are roughly 5,000 power plants
in the United States, and they have a total generating capacity of nearly 800,000 megawatts. Over the past few years, there has been an explosion of “merchant” power plants proposed by independent power producers seeking to sell into wholesale markets. In spite of this interest, a number of regions of the country are experiencing capacity shortages as a result of wholesale market design problems and barriers to siting and building new power plants.
Over the next ten years, demand for electric power is expected to increase by about 25 percent, and more than 200,000 megawatts of new capacity will be required. However, under current plans electric transmission capacity will increase by only 4 percent. This shortage could lead to serious transmission congestion and reliability problems.
Transmission Grid The United States does not have a na
tional transmission grid. Instead, there are four integrated transmission grids serving North America: the Western Interconnection, Eastern Interconnection, Electric Reliability of Council of Texas, and the Province of Quebec (Figure 7-1). These regional grids themselves are international, encompassing the United States, Canada, and part of Mexico.
Transactions between the four integrated transmission grids are very limited because they are interconnected at only a few locations through interties, so for all practical purposes they can be viewed as separate transmission grids. The four integrated transmission grids break down into a series of smaller regions, largely defined by transmission constraints. Altogether, 204,000 miles of transmission lines in North America move power from the point of generation to where electricity is needed. There are 157,810 miles of transmission lines in the United States. Transmission grid expansions are expected to be slow over the next ten years, with additions totaling only 7,000 miles.
The transmission system is the highway system for interstate commerce in electricity. Transmission allows the sale of electricity between regions. In a particular region, transmission can be a substitute for generation, allowing that region to import power that otherwise would have to be generated within that region. In some cases, transmission expansion may be more costeffective than generation additions, allowing a region better access to lower-cost generation.
Transmission constraints limit these power flows, and result in consumers paying higher prices for electricity. The electricity price spikes in the Midwest in the summer of 1998 were caused in part by transmission constraints limiting the ability of the region to import electricity from other regions of the country that had available electricity. During the summer of 2000, transmission constraints limited the ability to sell low-cost power from the Midwest to the South during a period of peak demand,
7-5 NATIONAL ENERGY POLICY

resulting in higher prices for consumers. Transmission capacity limits could result in price pressures and reliability problems this summer in California, Long Island, the Great Lakes, the Southeast, and New England (Figure 7-2).
Regional shortages of generating capacity and transmission constraints combine to reduce the overall reliability of electric supply in the country and are reducing the quality of power delivered to end users. Power quality is becoming an increasingly important issue as our digital economy continues to grow.
One factor limiting reliability is the lack of enforceable reliability standards. Since 1968, the reliability of the U.S. transmission grid has depended entirely on voluntary compliance with reliability standards. There is a broad recognition that voluntary adherence with reliability standards is no longer a viable approach in an increasingly competitive electricity market. There is a need to provide for enforcement of mandatory reliability standards. Broad support has emerged for development of these standards by a self-regulating organization overseen by FERC.
Recommendations:
★ The NEPD Group recommends thatthe President direct the Secretary ofEnergy to work with FERC to improvethe reliability of the interstate transmission system and to develop legislation providing for enforcement by aself-regulatory organization subject toFERC oversight.
★ The NEPD Group recommendsthat the President direct the Secretaryof Energy to expand the Department’sresearch and development on transmission reliability and superconductivity.
Transmission constraints were also a primary factor in blackouts in northern California, which imports power from both the Northwest and southern California. When resources are not available in the Northwest, electricity supply must come
Figure 7-2
Current Electric Power Bottlenecks
Transmission capacity limits could result in price pressures and reliability problems this summer in California, Long Island, the Great Lakes, the Southeast, and New England. The arrows in this figure depict the locations and directions of current transmission congestion. _____ Source: North American Electric Reliability Council.
from southern California’s Path 15 transmission route. Path 15 does not have sufficient capacity to provide all of the power needed in northern California.
Recommendation:
★ The NEPD Group recommends thatthe President direct the Secretary ofEnergy to authorize the Western AreaPower Administration to explorerelieving the “Path 15” bottleneckthrough transmission expansionfinanced by nonfederal contributions.
Transmission constraints have been a persistent cause of price spikes in New York City in recent years. The New York Independent System Operator (the grid operator in that state) estimates that the city will be short about 400 MW below their desired reserve margin of power during the summer peak. To fill this gap, the New York Power Authority is trying to install additional generation capacity in the city. Market-oriented approaches could also be used to create additional capacity and alleviate some of the potential problems.
If transmission constraints are not removed, the result can be higher prices and
Chapter 7 • America’s Energy Infrastructure: A Comprehensive Delivery System 7-6

lower reliability. There are various reasons why transmission constraints exist. One is the lack of sufficient investment in transmission. Transmission investment has lagged dramatically over the past decade (Figure 7-3). There is a need to ensure that transmission rates create incentives for adequate investment in the transmission system, especially as restructuring leads to the creation of transmission companies whose only business is operation of transmission facilities. FERC recognizes this need and has expressed a willingness to consider innovative transmission pricing proposals.
Another cause of transmission constraints is the siting process. Under current law, siting of transmission facilities is a responsibility of state governments, not the federal government, even though the transmission system is not only interstate but also international, extending into both Canada and Mexico. This stands in stark contrast to siting of other interstate facilities, such as natural gas pipelines, oil pipelines, railroads, and interstate highways.
Federal law governing the responsibility for siting transmission facilities was written in 1935, nearly 80 years ago. At the time, transmission facilities were not inter-
Figure 7-3 U.S. Investment in New Electric Power Transmission (Millions of 1990 Dollars)
1,400
1,200
1,000
800
600
0
310
300
290
280
270
260
0
1990
Transmission Investment
System Peak Demand
98 97 96 95 94 93 92 91
As a result, transmission Growth in peak demand for electricity has far outstripped investment in transmission capacity. constraints could aggravate already limited supplies of power and could result in high prices in some areas of the country. ________ Source: PA Consulting Group, based on data from the UDI data base.
7-7 NATIONAL ENERGY POLICY
state, and there was virtually no interstate commerce in electricity. Congress did not anticipate the development of an interstate and international transmission system.
State decisions on where to locate transmission lines often do not recognize the importance of proposed transmission facilities to the interstate grid. For example, a recent decision by regulators in Connecticut to block a proposed transmission line to Long Island did not recognize the need for electricity on Long Island. Some state siting laws require that the benefits of a proposed transmission facility accrue to the individual state, resulting in the rejection of transmission proposals that benefit an entire region, rather than a single state.
Much has changed since 1935. The transmission system is the highway for interstate commerce in electricity. Transmission constraints are resulting in higher prices for consumers and lower reliability. The siting process must be changed to reflect the interstate nature of the transmission system.
Recommendations:
★ The NEPD Group recommends thatthe President direct the appropriatefederal agencies to take actions to remove constraints on the interstatetransmission grid and allow ournation’s electricity supply to meet thegrowing needs of our economy.• Direct the Secretary of Energy, by
December 31, 2001, to examine the benefits of establishing a national grid, identify transmission bottlenecks, and identify measures to remove transmission bottlenecks.
• Direct the Secretary of Energy to work with FERC to relieve transmission constraints by encouraging the use of incentive rate-making proposals.
• Direct the federal utilities to determine whether transmission expansions are necessary to remove constraints. The Administration should review the Bonneville Power Administration’s (BPA’s) capital and

financing requirements in the context of its membership in a regional RTO, and if additional Treasury financing appears warranted or necessary in the future, the Administration should seek an increase in BPA’s borrowing authority at that time.
• Direct the Secretary of Energy, in consultation with appropriate federal agencies and state and local government officials, to develop legislation to grant authority to obtain rights-of-way for electricity transmission lines, with the goal of creating a reliable national transmission grid. Similar authority already exists for natural gas pipelines in recognition of their role in interstate commerce.
Another cause of transmission constraints is limited access to federal lands. The federal government is the largest landowner in the United States and owns most of the land in some western states. Limited access to federal lands can block needed transmission expansion. A case in point is a transmission line being built from West Vir
ginia to Virginia. Five years ago, the Department of Energy identified that line as critical to the reliability of the transmission system on the East Coast. Five years later, the line is still not complete. Improved access to federal land can help remove transmission constraints.
Rights-of-Way on Federal Lands The Bureau of Land Management
(BLM) estimates that 90 percent of the oil and natural gas pipeline and electric transmission rights-of-way in the western United States cross federal lands. These lands are principally lands managed by either the BLM or the U.S. Forest Service. Rights-ofway are authorized through an approval process that allows the public to comment on proposals to locate infrastructure items, like utility poles, on these rights-of way. As part of this process, proposals are examined for resource and other use conflicts, and a national interest test is applied prior to approval.
The BLM administers 85,000 rights-ofway, including 23,000 for oil and gas pipelines and 12,000 for electric transmission lines. It processes over 1,200 pipeline and electric system right-of-way applications a year, with an increase in applications of
The electric power infrastruc
ture includes a nationwide
“power grid” of long-distance
transmission lines that move
electricity from the point of
generation to where the
electricity is needed. Over the
next ten years, U.S. demand
for electric power is expected
to increase by 25 percent,
while transmission capacity
is expected to increase by
only 4 percent.
Chapter 7 • America’s Energy Infrastructure: A Comprehensive Delivery System 7-8

Virtually all natural gas in
the United States is moved via
pipeline. The current domestic
natural gas transmission
capacity of approximately 23
trillion cubic feet (tcf) will be
insufficient to meet the
projected 50 percent increase
in U.S. consumption projected
for 2020.
over 10 percent a year in recent years. The demand for additional energy and electricity is expected to increase the need for rights-of-way across federal lands.
Other federal entities also deal with rights-of-way, each approaching the issue from a unique perspective. The National Park Service is authorized to grant leases and permits, but discourages rights-of-way corridors unless there are no practical alternatives. The U.S. Fish and Wildlife Service manages National Wildlife Refuge lands for wildlife and habitat values, and allows corridors where they were pre-existing or are determined to be compatible with the purposes for which a refuge was established. The Bureau of Reclamation is authorized to grant rights-of-way over lands acquired or withdrawn for reclamation purposes, if compatible with authorized project purposes. The Bureau of Indian Affairs and tribal governments are authorized to grant rights-of-way across both tribal and individually owned Indian lands.
Pipelines After being pumped from the ground
in domestic oil fields, oil travels through gathering lines to pipelines, which bring it to refineries, where it is transformed into petroleum products like gasoline, diesel fuel, or heating oil. These products then travel through pipelines and tanker trucks to distribution outlets for purchase by consumers. Natural gas must similarly travel from gas fields through gathering lines to processing facilities, and then into pipelines
and local distribution lines to its final destination. These pipeline systems involve a complex infrastructure of their own, including pump stations or compressor stations, and control systems that open and close valves and switch product flow through pipes, often with the use of computer technology.
Oil Pipelines The two million miles of oil pipelines
in the United States are the principal mode for transporting oil and petroleum products such as gasoline. They account for about 66 percent of domestic product movements (Figure 7-4). Increases in the demand for oil and changes in where it is supplied will lead to the need for more pipeline capacity.
Pipelines are less flexible than other forms of oil transport, because they are fixed assets that cannot be easily adjusted to changes in supply and demand. Once built, they are an efficient way to move petroleum and petroleum products. A modestsized pipeline carries the equivalent of 750 tanker truckloads a day—the equivalent of a truckload leaving every two minutes, 24 hours a day, 7 days a week. Replacing the same pipeline with a railroad train of tank cars, carrying 2,000 barrels each, would require a 75-car train to arrive and be unloaded every day. Pipelines are relatively inexpensive to operate and are generally quiet and safe. Ensuring pipeline safety requires careful management, as multiple products move through a single pipeline system at the same time.
Insufficient domestic pipeline capacity has caused peak-load problems in moving oil and petroleum products such as gasoline from one region of the country to another. For example, many energy analysts forecasted the possibility of a shortage last winter in the upper Midwest of liquefied petroleum gas used for heating and for drying crops. Others were concerned about possible shortages of heating oil in New England.
Energy supply shortages can create operational difficulties for the pipelines themselves. The complex interrelationship
7-9 NATIONAL ENERGY POLICY
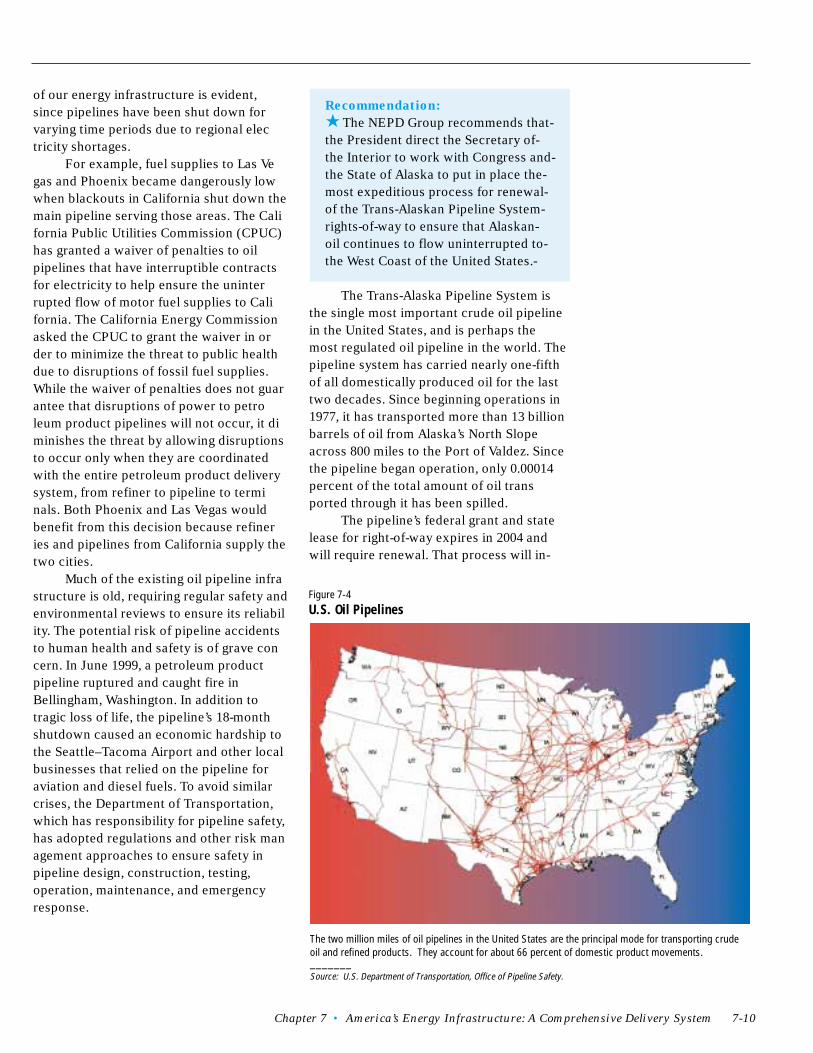
of our energy infrastructure is evident, since pipelines have been shut down for varying time periods due to regional electricity shortages.
For example, fuel supplies to Las Vegas and Phoenix became dangerously low when blackouts in California shut down the main pipeline serving those areas. The California Public Utilities Commission (CPUC) has granted a waiver of penalties to oil pipelines that have interruptible contracts for electricity to help ensure the uninterrupted flow of motor fuel supplies to California. The California Energy Commission asked the CPUC to grant the waiver in order to minimize the threat to public health due to disruptions of fossil fuel supplies. While the waiver of penalties does not guarantee that disruptions of power to petroleum product pipelines will not occur, it diminishes the threat by allowing disruptions to occur only when they are coordinated with the entire petroleum product delivery system, from refiner to pipeline to terminals. Both Phoenix and Las Vegas would benefit from this decision because refineries and pipelines from California supply the two cities.
Much of the existing oil pipeline infrastructure is old, requiring regular safety and environmental reviews to ensure its reliability. The potential risk of pipeline accidents to human health and safety is of grave concern. In June 1999, a petroleum product pipeline ruptured and caught fire in Bellingham, Washington. In addition to tragic loss of life, the pipeline’s 18-month shutdown caused an economic hardship to the Seattle–Tacoma Airport and other local businesses that relied on the pipeline for aviation and diesel fuels. To avoid similar crises, the Department of Transportation, which has responsibility for pipeline safety, has adopted regulations and other risk management approaches to ensure safety in pipeline design, construction, testing, operation, maintenance, and emergency response.
Recommendation:
★ The NEPD Group recommends thatthe President direct the Secretary ofthe Interior to work with Congress andthe State of Alaska to put in place themost expeditious process for renewalof the Trans-Alaskan Pipeline Systemrights-of-way to ensure that Alaskanoil continues to flow uninterrupted tothe West Coast of the United States.
The Trans-Alaska Pipeline System is the single most important crude oil pipeline in the United States, and is perhaps the most regulated oil pipeline in the world. The pipeline system has carried nearly one-fifth of all domestically produced oil for the last two decades. Since beginning operations in 1977, it has transported more than 13 billion barrels of oil from Alaska’s North Slope across 800 miles to the Port of Valdez. Since the pipeline began operation, only 0.00014 percent of the total amount of oil transported through it has been spilled.
The pipeline’s federal grant and state lease for right-of-way expires in 2004 and will require renewal. That process will in-
Figure 7-4 U.S. Oil Pipelines
The two million miles of oil pipelines in the United States are the principal mode for transporting crude oil and refined products. They account for about 66 percent of domestic product movements._______Source: U.S. Department of Transportation, Office of Pipeline Safety.
Chapter 7 • America’s Energy Infrastructure: A Comprehensive Delivery System 7-10

Several federal agencies are
authorized to grant rights-of
way for oil and gas pipeline
and electric transmission
systems on federal lands, and
each approaches the issue
from a unique perspective.
Authorizing agencies include
the Bureau of Land Manage
ment, the U.S. Forest Service
the National Park Service, the
U.S. Fish and Wildlife
Service, the Bureau of
Reclamation, and the Bureau
of Indian Affairs.
volve a thorough review of compliance with federal laws and regulations, including those related to safety and environmental impacts. Because nearly 50 percent of the right-of-way is owned by the State of Alaska, they must also renew the applicable state permits. To commence the formal portion of the federal renewal process, regulations require a renewal application to be filed with the Alaska Office of the BLM of the Department of the Interior. To the extent possible, a single, joint federal/state approach should be considered.
Natural Gas Pipelines Virtually all natural gas in the United
States is moved via pipeline (Figure 7-5). The current domestic natural gas transmission capacity of approximately 23 trillion cubic feet (tcf) will be insufficient to meet the projected 50 percent increase in U.S. consumption projected for 2020.
Some parts of the country, such as California and New England, already face capacity shortages. Several pipeline opera
tors have applied for permits to increase their delivery of natural gas to California, but right-of-way issues and local permitting delays have constrained the ability to transport natural gas to California, contributing to high prices. In addition, the natural gas pipeline connections from Canada are near capacity, so any greater U.S. reliance on Canadian natural gas will require increased pipeline capacity.
One of the largest known reserves of natural gas in the United States has been found in the Arctic, associated with the development of oil at Alaska’s Prudhoe Bay. These known gas reserves, over 35 tcf, would make a significant long-term contribution to the nation’s energy supplies if delivered to the lower 48 states. It is estimated there may be an additional 100 tcf on the North Slope of Alaska. Recently, as the energy supply situation has changed, interest has renewed in tapping into Alaska’s natural gas supplies. Over the past year, the Alaska North Slope gas producers have been reviewing whether projected market conditions will make transportation of this natural gas economically feasible. The North Slope gas producers are scheduled to complete that review by the end of 2001.
Recommendation:
★ The NEPD Group recommends that the President direct the Secretaries of Energy and State, coordinating with the Secretary of the Interior and the Federal Energy Regulatory Commission, to work closely with Canada, the State of Alaska, and all other interested parties to expedite the construction of a pipeline to deliver natural gas to the lower 48 states. This should include proposing to Congress any changes or waivers of law pursuant to the Alaska Natural Gas Transportation Act of 1976 that may be required.
America needs the energy that Alaska’s North Slope natural gas can provide. The Administration seeks to expedite the construction of a pipeline to deliver this natural gas to the lower 48 states.
7-11 NATIONAL ENERGY POLICY

In addition to shortfalls in capacity, sources of natural gas have shifted from the Southwest to the deep water of the Gulf of Mexico, the Rocky Mountains, western Canada, and the Canadian Atlantic. At the same time, demand has shifted from the industrial Midwest to the growing population centers in the South and the West. An additional 263,000 miles of distribution pipelines and 38,000 miles of new transmission pipelines will be necessary to meet increased consumption and the new geographic realities of supply and demand.
Several factors complicate efforts to meet the need for increased pipeline capacity, including encroachment on existing rights-of-way and heightened community resistance to pipeline construction. Currently it takes an average of four years to obtain approvals to construct a new natural gas pipeline. In some cases it can take much longer.
The projected growth in energy demand has called into question whether regulatory actions and permitting processes can keep pace with the necessary construction of new facilities for storage and delivery. Consistent federal, state, and local government policies, and faster, more predictable regulatory decisions on permitting for oil and natural gas pipelines are needed to enable timely and cost-effective infrastructure development. The permitting process has a positive role in protecting the environment, public health, and safety by allowing all interested parties an opportunity to participate effectively and fully in the deliberations prior to the permit issuance.
Recent pipeline ruptures involving a natural gas pipeline near Carlsbad, New Mexico, and an underground natural gas storage facility near Hutchinson, Kansas, highlight the need to develop technologies and policies that protect people, environment, and the safety of the nation’s energy infrastructure. The federal government has an important role in ensuring and improving the safety of these gas pipelines. New technologies need to be developed to improve monitoring and assessment of system integrity, improve data quality for system
Figure 7-5 U.S. Natural Gas Transmission Pipelines
Virtually all natural gas in the United States is moved via pipeline. The forecast of a doubling in the number of new natural gas wells drilled annually and an 80 percent increase in the number of active drilling rigs will require new pipelines. _____Source: U.S. Department of Transportation, Office of Pipeline Safety.
planning, extend the serviceability and life of the national natural gas transmission and distribution network, provide safer transport of energy products, and lessen the impacts of the energy infrastructure on the environment.
Recommendations:
★ The NEPD Group recommends thatthe President support legislation to improve the safety of natural gas pipelines,protect the environment, strengthenemergency preparedness and inspections and bolster enforcement.
★ The NEPD Group recommends thatthe President direct agencies to continue their interagency efforts to improve pipeline safety and expedite pipeline permitting in an environmentallysound manner and encourage the Federal Energy Regulatory Commission toconsider improvements in the regulatoryprocess governing approval of interstatenatural gas pipeline projects.
Chapter 7 • America’s Energy Infrastructure: A Comprehensive Delivery System 7-12

U.S. demand for refined
petroleum products currently
exceeds its domestic capacity
to produce them. The refinery
industry is now running at
nearly 100 percent of
capacity during the peak
gasoline consumption season.
Oil Refineries U.S. demand for refined petroleum
products, such as gasoline and heating oil, currently exceeds our domestic capacity to produce them. The refinery industry is now running at nearly 100 percent of capacity during the peak gasoline consumption season and is producing record levels of needed products at other times. The excess demand has recently been met by increased imports.
The U.S. refining industry has experienced a decade of low profitability and rates of return on investment. This has discouraged investment in new refineries. In fact, almost 50 U.S. refineries closed over the last ten years, and no major refineries have been built in the last twenty-five years.
During the last ten years, overall refining capacity grew by about 1 to 2 percent a year as a result of expansion in the capacity of existing, larger refineries. Although there was a significant, sustained improvement in margins during 2000, those gains arose out of a very tight supply situation and high, volatile prices. Industry consolidation has been a key response to this poor profitability.
The U.S. refining industry is also facing major infrastructure problems. While the industry expanded steadily through the 1970s, it went through a period of consolidation after the oil shocks of 1973 and 1978.
Ongoing industry consolidation, in an effort to improve profitability, inevitably leads to the sale or closure of redundant facilities by the new combined ownership. This has been particularly true of terminal facilities, which can lead to reductions in inventory and system flexibility. While excess capacity may have deterred some new capacity investments in the past, more recently, other factors, such as regulations, have deterred investments.
Refiners are subject to significant environmental regulation and face several new clean air requirements over the next decade. Refiners will face many clean fuel production standards, which require the production of many different kinds of gasoline and diesel fuel for different parts of the country. New Environmental Protection Agency rules will require refiners to produce gasoline and diesel fuel with significantly lower sulfur content. New clean air requirements will benefit the environment, but will also require substantial capital investments and additional government permits. The proliferation of distinct regional and state gasoline and diesel product standards, the significant permitting needed, and the downtime to make the needed physical and operational changes will challenge refiners and governments to effectively coordinate in order to reduce the likelihood of supply shortfalls and price spikes.
7-13 NATIONAL ENERGY POLICY

Recommendation:
★ The NEPD Group recommends that the President direct the Administrator of the EPA to study opportunities to maintain or improve the environmental benefits of state and local “boutique” clean fuel programs while exploring ways to increase the flexibility of the fuels distribution infrastructure, improve fungibility, and provide added gasoline market liquidity. In concluding this study, the Administrator shall consult with the Departments of Energy and Agriculture, and other agencies as needed.
Since 1990, refiners have met growing demand by increasing the use of existing equipment and increasing the efficiency and capacity of existing plants. Even with these efforts, however, refining capacity has begun to lag behind peak summer demand. Price volatility and the cyclical nature of oil markets inhibit investment in supply infrastructure. While investors can withstand market fluctuations for some commodities, large investments in oil exploration and development—such as for drilling required to maintain a steady supply and the pipelines needed to bring supply to market—are often curtailed during times of low oil prices. The outcome of this lack of steady investment is less supply, higher prices, and the abandonment of marginal oil resources that may never be recovered.
Recommendations:
★ The NEPD Group recommends thatthe President direct the Administratorof the Environmental ProtectionAgency and the Secretary of Energy totake steps to ensure America has adequate refining capacity to meet theneeds of consumers.• Provide more regulatory certainty
to refinery owners and streamline the permitting process where possible to ensure that regulatory overlap is limited.
• Adopt comprehensive regulations
(covering more than one pollutant and requirement) and consider the rules’ cumulative impacts and benefits.
★ The NEPD Group recommends that the President to direct the Administrator of the Environmental Protection Agency, in consultation with the Secretary of Energy and other relevant agencies, to review New Source Review regulations, including administrative interpretation and implementation, and report to the President within 90 days on the impact of the regulations on investment in new utility and refinery generation capacity, energy efficiency, and environmental protection. • The NEPD Group recommends that
the President direct the Attorney General to review existing enforcement actions regarding New Source Review to ensure that the enforcement actions are consistent with the Clean Air Act and its regulations.
Energy Transportation Infrastructure The infrastructure used to transport
energy products includes ocean tankers; inland barges; specialized trucks for oil and refined products, such as gasoline and heating oil; railroad tank cars and coal cars; and the waterways, highways, and railroads upon which they travel. There is also a substantial inventory of river and oceanside port facilities that are used for moving energy materials.
Marine Transportation Marine transportation of oil and re
fined products accounts for nearly one-third of domestic shipments. Approximately 3.3 billion barrels of oil and petroleum products and 229 million short tons of coal move through the nation’s ports and waterways every year.
There are three kinds of ship transports of domestic energy products. Tankers
Double-hulled tank barges
provide distribution of
petroleum products.
NICOLE LEIGH REINAUER AND RTC 135
Chapter 7 • America’s Energy Infrastructure: A Comprehensive Delivery System 7-14

primarily carry Alaskan oil to the West Coast. Product tankers transport refined products from the Gulf of Mexico to the Atlantic Coast, from the Gulf to the West Coast, and between ports within the West Coast. Tank barges provide coastwise distribution of refined product imports, distribution from pipeline terminals, and inland distribution. In addition, 477 foreign tankers and 64 U.S. flag tankers deliver oil and petroleum products to the United States. They deliver approximately 2.1 million barrels a day, for a total of 770 million barrels a year.
Winter storms, extended Ships are also used to import liquefied
darkness, and ice formation natural gas (LNG). With increasing demand
disrupt barge and tanker for natural gas for electricity generation, movements. The U.S. Coast there is a potential for substantial growth in Guard’s fleet of ice breakers the demand for LNG imports. From 1998 to has become an important 1999, the number of LNG carrier arrivals incomponent of the energy
infrastructure for the New Boston increased by 350 percent. In addi-
England, Mid-Atlantic, and tion, mothballed terminals at Elba Island,
Great Lakes regions. Georgia, and Cove Point, Maryland, mayU.S. COAST GUARD reinitiate LNG imports by 2002.
7-15 NATIONAL ENERGY POLICY
Unlike pipelines, water transportation requires the positioning of vessels to where cargoes are located. For example, it can take three weeks to move a tanker from the Gulf of Mexico to the West Coast. Consequently, tanker markets do not respond quickly to temporary surges in demand, which typically result in price spikes.
Safety In accordance with the Oil Pollution
Act of 1990, a timeline has been established to replace all single-hulled vessels with double-hulled vessels. Many have already been replaced. Modern navigation and port services also help to prevent maritime oil spills. Spill-response technologies and coordinated response plans are key to minimizing damage to property and the environment. Oil spill technology has improved during the last decade and will continue to do so. Risk assessments, preparedness drills, and cleanup strategies are all necessary safeguards for transporting energy goods. As maritime transportation grows, port and waterway infrastructure, as well as the availability of accurate and timely navigation information, will continue to be important for the safe, efficient delivery of energy.
New England’s Dependence on Marine Transportation
New England has no refineries, and its small oil pipeline system is not connected to the interstate pipeline system. As a result, New England must rely on tanker and barge shipments of petroleum products from the south as well as direct imports from overseas. There is some question as to whether this distribution system is sufficient to meet the future needs of the region and, if not, what steps need to be taken to ensure future economical, reliable energy supplies.
In recent years, lower national inventories, market forces, and other factors have combined to create much lower inventories for petroleum products such as heating oil in the Northeast. A supply system with less capacity in reserve is more vulnerable to variations in product delivery, and is less capable of absorbing the disruptions in barge and tanker movements that inevitably come

with winter storms, extended darkness, and ice formation. A rapid change to colder weather affects both supply and demand: households need more fuel at the same time that harbors and rivers experience severe ice conditions.
For the New England and Mid-Atlantic seaboards, U.S. Coast Guard icebreakers have become an important component of the infrastructure necessary to provide energy to the region.
The Department of Energy established the Northeast Heating Oil Reserve to ensure heating oil supplies in the region. This emergency buffer can support a shortage for approximately ten days, which is the time required for ships to carry heating oil from the Gulf of Mexico to New York Harbor.
Even with the Reserve in place, marine transportation remains the only source of heating oil for the New England’s winter months.
Recommendation:
★ The NEPD Group supports thePresident’s budget proposal to provide$8 million to maintain the two-millionbarrel Northeast Heating Oil Reserve.Operated by the private sector, theReserve helps ensure adequate supplies of heating oil in the event thatcolder than normal winters occur inthe Northeast United States.
Rail Transportation Coal, which provides about 52 percent
of America’s electricity, is the most important single commodity carried by rail. Over the past ten years, the rail share of coal transportation has increased, primarily as a result of increases in low-sulfur western coal, which moves long distances over rail. In 1999, domestic railroads carried 68 percent of the nation’s coal, and in 2000, they transported an average of 14.4 million tons of coal a week.
Transportation costs account for 30 to 50 percent of the final delivered price of coal to utilities. About 74 percent of U.S.
low-sulfur coal reserves are located in Montana and Wyoming. Demand for clean coal from Wyoming’s Powder River Basin is expected to increase because of its environmental benefits. However, rail capacity problems in the Powder River Basin have created a bottleneck in the coal transportation system.
With little excess capacity in the rail lines supporting the Powder River Basin, expected increases in demand could result in capacity shortfalls and delays in providing coal to power plants that are relying increasingly on “just-in-time” shipments to reduce inventory costs. Additionally, delays in other parts of the rail network, such as at key rail facilities, can undermine the efficiency and reliability of the system. There is a need to eliminate bottlenecks in the coal transportation system.
Infrastructure Security The energy infrastructure is vulnerable
to physical and cyber disruption that could threaten its integrity and safety. Disruptions could come from natural events, like geomagnetic storms and earthquakes, or could come from accidents, equipment failures, or deliberate sabotage. In addition, the nation’s transportation and power infrastructures have grown increasingly complex and interdependent. Consequently, any disruption can have extensive consequences.
Transportation facilities have weathered relatively short interruptions in power as a result of natural disasters and accidents, with varying degrees of impact. In a few instances, they have experienced intermittent, lengthy outages that have affected not only primary systems, but integrated services as well, such as voice, data, Internet, and wireless networks that may be used to transmit control information. The growing reliance on computer technologies, automated monitoring and control systems, and electronic commerce makes the system more efficient and vibrant, but also requires a greater level of diligence and use of safeguards.
Accurate weather and climate forecasting can prevent millions of dollars in
Chapter 7 • America’s Energy Infrastructure: A Comprehensive Delivery System 7-16

damage to U.S. energy infrastructure. For example, the interaction of geomagnetic storms with the Earth’s magnetic field can cause additional current to enter transmission lines, which at times has caused regional grid collapse and has destroyed power plant electrical transformers. Given sufficient warning, the industry can initiate protective countermeasures, such as when several northeastern power plants shed 20 percent of their load during a July 2000 geomagnetic storm.
Summary of Recommendations
Improvements in forecasting can further assist in the management of energy resources and materials, can prevent power outages in many cases, and can accelerate restoration of power after outages that do occur. Also, data from extreme weather events can be used to design and build infrastructure, such as transmission lines, pipelines, and hydropower dams.
America’s Energy Infrastructure: A Comprehensive Delivery System
★ The NEPD Group recommends that the President direct the Secretary of Energy to work with the Federal Energy Regulatory Commission (FERC) to improve the reliability of the interstate transmission system and to develop legislation providing for enforcement by a self-regulatory organization subject to FERC oversight.
★ The NEPD Group recommends that the President direct the Secretary of Energy to expand the Department’s research and development on transmission reliability and superconductivity.
★ The NEPD Group recommends that the President direct the Secretary of Energy to authorize the Western Area Power Administration to explore relieving the “Path 15” bottleneck through transmission expansion financed by nonfederal contributions.
★ The NEPD Group recommends that the President direct the appropriate federal agencies to take actions to remove constraints on the interstate transmission grid and allow our nation’s electricity supply to meet the growing needs of our economy. • Direct the Secretary of Energy, by December 31, 2001, to examine the benefits of
establishing a national grid, identify transmission bottlenecks, and identify measures to remove transmission bottlenecks.
• Direct the Secretary of Energy to work with FERC to relieve transmission constraints by encouraging the use of incentive rate-making proposals.
• Direct the federal utilities to determine whether transmission expansions are necessary to remove constraints. The Administration should review the Bonneville Power Administration’s (BPA’s) capital and financing requirements in the context of its membership in a regional RTO, and if additional Treasury financing appears warranted or necessary in the future, the Administration should seek an increase in BPA’s borrowing authority at that time.
• Direct the Secretary of Energy, in consultation with appropriate federal agencies and state and local government officials, to develop legislation to grant authority to obtain rights-of-way for electricity transmission lines, with the goal of creating a reliable national transmission grid. Similar authority already exists for natural gas pipelines in recognition of their role in interstate commerce.
7-17 NATIONAL ENERGY POLICY

★ The NEPD Group recommends that the President direct the Secretary of the Interior to work with Congress and the State of Alaska to put in place the most expeditious process for renewal of the Trans-Alaskan Pipeline System rights-of-way to ensure that Alaskan oil continues to flow uninterrupted to the West Coast of the United States.
★ The NEPD Group recommends that the President direct the Secretaries of Energy and State, coordinating with the Secretary of the Interior and the Federal Energy Regulatory Commission, to work closely with Canada, the State of Alaska, and all other interested parties to expedite the construction of a pipeline to deliver natural gas to the lower 48 states. This should include proposing to Congress any changes or waivers of law pursuant to the Alaska Natural Gas Transportation Act of 1976 that may be required.
★ The NEPD Group recommends that the President support legislation to improve the safety of natural gas pipelines, protect the environment, strengthen emergency preparedness and inspections and bolster enforcement.
★ The NEPD Group recommends that the President direct agencies to continue their interagency efforts to improve pipeline safety and expedite pipeline permitting in an environmentally sound manner and encourage FERC to consider improvements in the regulatory process governing approval of interstate natural gas pipeline projects.
★ The NEPD Group recommends that the President direct the Administrator of the EPA to study opportunities to maintain or improve the environmental benefits of state and local “boutique” clean fuel programs while exploring ways to increase the flexibility of the fuels distribution infrastructure, improve fungibility, and provide added gasoline market liquidity. In concluding this study, the Administrator shall consult with the Departments of Energy and Agriculture, and other agencies as needed.
★ The NEPD Group recommends that the President direct the Administrator of the Environmental Protection Agency and the Secretary of Energy to take steps to ensure America has adequate refining capacity to meet the needs of consumers. • Provide more regulatory certainty to refinery owners and streamline the permitting
process where possible to ensure that regulatory overlap is limited. • Adopt comprehensive regulations (covering more than one pollutant and require
ment) and consider the rules’ cumulative impacts and benefits.
★ The NEPD Group recommends that the President direct the Administrator of the Environmental Protection Agency, in consultation with the Secretary of Energy and other relevant agencies, to review New Source Review regulations, including administrative interpretation and implementation, and report to the President within 90 days on the impact of the regulations on investment in new utility and refinery generation capacity, energy efficiency, and environmental protection.
★ The NEPD Group recommends that the President direct the Attorney General to review existing enforcement actions regarding New Source Review to ensure that the enforcement actions are consistent with the Clean Air Act and its regulations.
★ The NEPD Group supports the President’s budget proposal to provide $8 million to maintain the two-million-barrel Northeast Heating Oil Reserve. Operated by the private sector, the Reserve helps ensure adequate supplies of heating oil in the event that colder than normal winters occur in the Northeast United States.
Chapter 7 • America’s Energy Infrastructure: A Comprehensive Delivery System 7-18

C H A P T E R E I G H T
Strengthening Global Alliances Enhancing National Energy Security and International Relationships
U .S. national energy security depends on sufficient energy supplies to support U.S. and global economic growth. Energy policies that have em
phasized reliance on market forces have led to major energy security gains over the past two decades. Major improvements in exploration and production technology, as well as the trend toward opening new areas around the globe for exploration and development, have yielded significant dividends:
Figure 8-1 The U.S. Economy is More Energy Efficient(Energy Intensity) Primary Energy Use Quadrillion Btus
Energy Use at Constant 1972 E/GDP
Actual Energy Use
180
160
140
120
100
80
60
40
20 0
• The U.S. and world economies have diversified their sources of oil supplies, largely through increased production in the Western Hemisphere, the North Sea, and Africa.
• The world’s fuel mix is also more diverse, primarily because of greater reliance on natural gas and nuclear power.
• The rate of growth in U.S. oil demand has slowed significantly since the first oil shocks of the 1970s because of more energy-efficient industries, structural changes in the economy, and greater efficiencies in vehicles, appliances, and buildings.
Since 1970, as the economy has shifted toward greater use of more efficient technologies, U.S. energy intensity (the amount of energy it takes to produce a dollar of GDP) has declined by 30 percent (Figure 8-1). However, energy use per person in the United States is expected to rise as is overall demand for energy.
Measures to enhance U.S. energy security by meeting this increased demand must begin at home. The first step toward a sound international energy policy is to use our own capability to produce, process, and transport the energy resources we
1950 60 70 80 90 00
Improvements in energy efficiency since the 1970s have had a major impact in meeting national energy needs relative to new supply. If the intensity of U.S. energy use had remained constant since 1972, consumption would have been about 70 quadrillion Btus (74 percent) higher in 1999 than it actually was.
________ Source: U.S. Department of Energy, Energy Information Administration.
need in an efficient and environmentally sustainable manner. Market solutions to limit the growth in our oil imports would reduce oil consumption for our economy and increase our economic flexibility in responding to any domestic or international disruption of oil or other energy supplies. The United States produces 72 of the 99 quadrillion British thermal snits (Btus) of
8-1 NATIONAL ENERGY POLICY


Figure 8-2
Sources of U.S. Fuel Consumption in 1999 (Quadrillion Btus)
U.S. Production
Net Imports
40
20
0
-20
Solar/Geothermal
Biofuels
Hydroelectric
Nuclear
Natural Gas
CoalOil Wind
The United States produced 72 of the 98 quadrillion Btus of energy that it consumed in 1999. We are self-sufficient in virtually all our energy resources, except oil, of which we import 52 percent of our net requirements, and natural gas, of which we import 15–16 percent net, primarily from Canada. __________Source: U.S. Department of Energy, Energy Information Administration.
energy that it consumes (Figure 8-2). We are self-sufficient in virtually all our energy resources except oil, of which we import 52 percent of our net requirements, and natural gas, of which we import 15 to 16 percent of our net requirements, primarily from Canada.
We should not, however, look at energy security in isolation from the rest of the world. In a global energy marketplace, U.S. energy and economic security are directly linked not only to our domestic and international energy supplies, but to those of our trading partners as well. A significant disruption in world oil supplies could adversely affect our economy and our ability to promote key foreign and economic policy objectives, regardless of the level of U.S. dependence on oil imports.
Our energy security also depends on an efficient domestic and international infrastructure to support all segments of the energy supply chain. We can strengthen our own energy security and the shared prosperity of the global economy by working cooperatively with key countries and institutions to expand the sources and types of global energy supplies. We can also advance these goals by increasing the effi
ciency of energy consumption, enhancing the transparency and efficient operation of energy markets, and strengthening our capacity to respond to disruptions of oil supplies. Energy is fundamental to economic growth, and we believe that economic growth and environmental protection can be mutually achieved.
We need to strengthen our trade alliances, to deepen our dialogue with major oil producers, and to work for greater oil production in the Western Hemisphere, Africa, the Caspian, and other regions with abundant oil resources. Greater cooperation with our allies in addressing the growth in oil demand in the transportation sector is particularly important, given the growing demand for oil and other energy resources. Significant economic and environmental benefits can be realized from increased energy efficiency and from the use of clean energy technologies. We need to ensure that our partners in the International Energy Agency (IEA) continue to meet their obligations for emergency supply reserves. Finally, we must continue to work with the IEA, the Asia-Pacific Economic Cooperation (APEC) forum, and others to encourage other large importers to consider measures to augment their oil reserves
Oil Imports and Global Reserves The U.S. influence on overall world
markets is substantial in terms of production and consumption. The United States is the world’s second largest natural gas producer and its third largest oil producer. The United States consumes over 25 percent of the oil produced worldwide, slightly more than half of which it imports. Nevertheless, because the price of our domestic and imported oil is determined by a world market, our energy security interests transcend the source of our physical energy supplies (Figure 8-3). Given the large and projected growing volume of U.S. oil imports, our energy and economic security will increase if we take the steps necessary to realize America’s potential as a major world oil and natural gas producer.
8-3 NATIONAL ENERGY POLICY

Figure 8-3 Regional Sources of U.S. Oil Imports in 2000
fig 3
Other 3%
Western Hemisphere
50%
Middle East 24%
Eurasia 9% Africa
14%
Slightly over half of the oil the United States imports every day comes from the Western Hemisphere. Canada, Venezuela, and Mexico account for the bulk (41%) of these imports. _______ Source: US. Department of Energy, Energy Information Administration.
Recommendation:
★ The NEPD Group recommendsthat the President make energy security a priority of our trade and foreignpolicy.
In 2000, nearly 55 percent of U.S. gross oil imports came from four countries: 15 percent from Canada, 14 percent each from Saudi Arabia and Venezuela, and 12 percent from Mexico (Figure 8-4). The security of U.S. energy supply is enhanced by
Figure 8-4
Top 10 Suppliers of U.S.Oil Imports in 2000 1,686
1,566
887
332 330 296
613
1,519
1,359
Cana
da
Vene
zuel
a
Nige
ria
Colo
mbi
a
UK
1,800
1,500
1,200
900
600
300
0 Saud
i
Mex
ico
Iraq
Norw
ay
Ango
la
332
Arab
ia
In 2000, nearly 55 percent of gross U.S. oil imports came from four leading suppliers: Canada (15%), Saudi Arabia (14%), Venezuela (14%), and Mexico (12%). ________Source: U.S.Department of Energy, Energy Information Administration.
several factors characterizing our diplomatic and economic relationships with our four top suppliers. These factors range from geographic proximity and free trade agreements to integrated pipeline networks, reciprocal energy-sector investments, shared security commitments, and, in all cases, long-term reliable supply relationships (Figure 8-5).
Saudi Arabia and the Middle East Oil Supplies
By 2020, Gulf oil producers are projected to supply between 54 and 67 percent of the world’s oil. Thus, the global economy will almost certainly continue to depend on the supply of oil from Organization of Petroleum Exporting Countries (OPEC) members, particularly in the Gulf. This region will remain vital to U.S. interests. Saudi Arabia, the world’s largest oil exporter, has been a linchpin of supply reliability to world oil markets.
Saudi Arabia has pursued a policy of investing in spare oil production capacity, diversifying export routes to both of its coasts, and providing effective assurances that it will use its capacity to mitigate the
Figure 8-5
Proven World Oil Reserves in January 2000
Middle East 67%
Central and
South America
9%
Eastern Europe and the Former Soviet Union 6%
Far East and
Oceania 4%
Western Europe
2%
North America
5%
Africa 7%
The world’s proven crude oil reserves remain relatively concentrated. The Middle East holds 664 billion barrels, or roughly two-thirds of the world’s conventional oil reserves, followed by the Western Hemisphere (14%) and Africa (7%). _________
Source: U.S. Department of Energy, Energy Information Administration.
Chapter 8 • Strengthening Global Alliances: Enhancing National Energy Security and International Relationships 8-4

impact of oil supply disruptions in any region (Figure 8-6). Algeria, Kuwait, Oman, Qatar, Saudi Arabia, the United Arab Emirates (UAE), Yemen, and other states in the region with which we maintain diplomatic relations have all, to some extent, opened
Saudi Arabia has pursued a their energy sectors to international investpolicy of investing in spare ment. This development provides an imporoil production capacity,
diversifying export routes to tant opportunity to further encourage for
both of its coasts, and eign investment in these important energy
providing effective assur- producing countries, thereby broadeningances that it will use its our shared commercial and strategic intercapacity to mitigate the ests. By any estimation, Middle East oil proimpact of oil supply disrup- ducers will remain central to world oil secutions in any region.
rity. The Gulf will be a primary focus of U.S.ARAMCO
Figure 8-6 Saudi Arabia Export Pipelines
Saudi Arabia, the world’s largest oil supplier, maintains major oil export ports and storage capacity on both the Gulf and the Red Sea. _______ ARAMCO
8-5 NATIONAL ENERGY POLICY
international energy policy, but our engagement will be global, spotlighting existing and emerging regions that will have a major impact on the global energy balance.
Recommendation:
★ The NEPD Group recommends thatthe President support initiatives bySaudi Arabia, Kuwait, Algeria, Qatar,the UAE, and other suppliers to openup areas of their energy sectors to foreign investment.
Improving Market Transparency The United States must work with oil
producers to improve the transparency, timeliness, and accuracy of the data that guide global oil markets. A lack of timely and accurate data relating to both oil production and inventory levels has contributed to the price volatility witnessed in 2000. Discussions among the major oil producers and consumer countries should be designed to improve the transparency, accuracy, and timeliness of data that guide the market. In turn, enhanced data quality and increased data transparency will improve market efficiency. Refocusing that dialogue beyond short-term market developments to long-term issues of world economic growth, improving data quality, and addressing energy infrastructure is needed to maintain a smooth flow of energy from the wellhead to the consumer.
Recommendation:
★ The NEPD Group recommends thatthe President direct the Secretaries ofState, Energy and Commerce work toimprove dialogue among energy producing and consuming nations.
Promoting International Trade and Investment
Longstanding U.S. policy supports a liberalized global energy sector that is open to international trade and investment. The United States benefits from international investments at home that have increased our

energy sector’s capacity and its infrastructure. Both producers and consumers will benefit from ensuring that the global energy infrastructure is sufficient and flexible to meet growing global demand.
American energy firms remain world leaders, and their investments in energy producing countries enhance efficiencies and market linkages while increasing environmental protections. Expanded trade and investment between oil importing and exporting nations can increase shared interests while enhancing global energy and economic security. Promoting such investment will be a core element of our engagement with major foreign oil producers.
Recommendations:
★ The NEPD Group recommends that the President direct the Secretaries of State, Commerce and Energy to continue supporting American energy firms competing in markets abroad and use our membership in multilateral organizations, such as the Asia-Pacific Economic Cooperation (APEC) forum, the Organization for Economic Cooperation and Development (OECD), the World Trade Organization (WTO) Energy Services Negotiations, the Free Trade Area of the Americas (FTAA), and our bilateral relationships to implement a system of clear, open, and transparent rules and procedures governing foreign investment; to level the playing field for U.S. companies overseas; and to reduce barriers to trade and investment.
★ The NEPD Group recommends that the President direct the Secretaries of Commerce and Energy, and the U.S. Trade Representative, to support a sectoral trade initiative to expand investment and trade in energy-related goods and services that will enhance exploration, production, and refining, as well as the development of new technologies.
Reviewing and Reforming Sanctions Economic sanctions include U.S. uni
lateral sanctions as well as multilateral sanctions, such as United Nations (UN) Security Council Resolutions. Sanctions can advance important national and global security objectives and can be an important foreign policy tool, especially against nations that support terrorism or seek to acquire weapons of mass destruction. Nevertheless, sanctions should be periodically reviewed to ensure their continued effectiveness and to minimize their costs on U.S. citizens and interests.
Recommendation:
★ The NEPD Group recommends thatthe President direct the Secretaries ofState, Treasury, and Commerce to initiate a comprehensive review of sanctions. Energy security should be oneof the factors considered in such a review.
Diversity of Supply Concentration of world oil production
in any one region of the world is a potential contributor to market instability, benefiting neither oil producers nor consumers. Periodic efforts by OPEC to maintain oil prices above levels dictated by market forces have increased price volatility and prices paid by consumers, and have worked against the shared interests of both producers and consumers in greater oil market stability. This remains a policy challenge, which we will meet over the longer term through a comprehensive energy policy that addresses both supply and demand, as well as through increased engagement with all our major suppliers. Greater diversity of world oil production remains important.
Encouraging greater diversity of oil production and, as appropriate, transportation, within and among geographic regions has obvious benefits to all market participants. Technological advances will enable the United States to accelerate the diversification of oil supplies, notably through deep-
The United States is helping
developing countries use
energy efficient technologies.
Photovoltaic-powered pumps
are being used in many wells
throughout rural India for
collecting potable water.
U.S. DEPARTMENT OF ENERGY, NATIONAL
RENEWABLE ENERGY LABORATORY
Chapter 8 • Strengthening Global Alliances: Enhancing National Energy Security and International Relationships 8-6

water offshore exploration and production in the Atlantic Basin, stretching from offshore Canada to the Caribbean, Brazil, and West Africa. The Caspian Sea can also be a rapidly growing new area of supply.
The ongoing development of so-called “heavy oil” reserves in the Western Hemisphere is an important factor that promises to significantly enhance global oil reserves and production diversity. Recent Canadian and Venezuelan success in making heavy oil deposits commercially viable suggests that they will contribute substantially to the diversity of global energy supply, and to our own energy supply mix over the medium to long term. Leading non-OPEC oil exporters, such as Mexico and Norway, remain critical to the diversity of global energy supply.
Growing levels of conventional and heavy oil production and exports from the Western Hemisphere, the Caspian, and Africa are important factors that can lessen the impact of a supply disruption on the U.S. and world economies. Overall U.S. policies in each of these high-priority regions will focus on improving the investment climate and facilitating the flow of needed investment and technology.
Bilateral energy working groups, such as the U.S.-Kazakhstan Oil, Gas and Commercial Energy Working Group and the U.S.-Russian Oil and Gas Working Group, can improve the trade climate in high-priority countries. In addition to seeking new sources of oil, the United States is helping developing countries use energy efficient technologies to mitigate the environmental impacts of energy use, and to improve access to energy resources.
WTO members are beginning to examine global trade in energy services. The United States has called on WTO members to open markets eligible for private participation in the entire range of energy services, from exploration to the final customer. The energy service proposal would attempt to ensure nondiscriminatory access to foreign providers of energy services. Equally important, the U.S. proposal suggests that WTO members consider how to best create a pro-competitive regulatory en-
Figure 8-7
Canada–U.S. Natural Gas Pipelines: 2001
UNITED STATES
C A N A D A
Canada–U.S. Oil Pipelines: 2001
C A N A D A
UNITED STATES
An integrated network of oil and gas pipelines demonstrates the seamless nature of North American energy trade. _______ Sources: Lakehead Pipe Line Company, Inc., and Canadian Association of Petroleum Producers.
Figure 8-8
Maritimes and Northeast Pipeline: 2000
Maritimes & Northeast Pipeline
New Brunswick
Nova Scotia
Sable Island
Boston Concord
Portland
Bangor
Fredericton
Saint John Sable Island EnergyProject
Halifax
New England’s geography made it the “last stop” for natural gas pipelines stretching thousands of miles across the continent from the South and the West. Consequently, the region became the most oil-dependent area in the country, particularly for home heating and electricity. With the January 1, 2000, inauguration of Atlantic Canada’s Maritimes and Northeast Pipeline, New England is now at the beginning of the line for natural gas flowing across the border from Canada at Calais, Maine. Overall, the region’s fuel mix is becoming increasingly diversified, with natural gas demand slated to increase by 2.4 percent a year through 2020. ______ Source: Maritimes and NorthEast Pipeline.
8-7 NATIONAL ENERGY POLICY

vironment for energy services, so that opaque or discriminatory regulatory practices do not undermine commitments to open their domestic markets to foreign service providers. Such objectives can also be pursued in the FTAA and APEC.
Toward a North American Energy Framework Increased U.S., Canadian, and Mexi
can energy production and cooperation would enhance energy security and, through our economic links in the North America Free Trade Agreement (NAFTA) economy, fundamentally advance each country’s economic security. As state and federal governments consider energy reforms, there will be a need to ensure compatible regulatory frameworks with our neighbors while recognizing differences in jurisdictions.
Canada Canada’s deregulated energy sector
has become America’s largest overall energy trading partner, and our leading foreign supplier of natural gas, oil, and electricity. Canada’s sustainable developmentbased energy strategies contribute to the health of the NAFTA economy and of our shared environment.
Canada provided 14 percent of U.S. natural gas supply last year. An integrated network of pipelines demonstrates the seamless nature of North American energy trade (Figure 8-7). Estimated natural gas deposits in Alaska and Northwest Canada exceed 70 trillion cubic feet, representing over three years of total U.S. consumption at present levels.
To advance shared economic and environmental objectives, the private sector is poised to develop the continent’s northern gas reserves, with pipeline linkages between both countries. To the east, recent development of Canada’s Atlantic offshore energy reserves has made significant strides, with major offshore natural gas and oil production now available. Canada’s Atlantic energy development is now providing previously untapped sources of clean-burning natural gas not only to Nova Scotia and New Brunswick but also to heating oil-de
pendent New England (Figure 8-8). Our large cross-border electricity
trade flows in each direction. Our electricity imports from Canada are derived largely from hydropower produced in eastern Canada, Canadian and American hydropower projects in the Pacific Northwest operating pursuant to the Columbia River Treaty, and a nuclear power plant in New Brunswick. All of these sources provide important trade and clean air benefits, while allowing both countries to benefit from load sharing and integration. The reliability of the North American electricity grid can be enhanced yet further through closer coordination and compatible regulatory and jurisdictional approaches.
Canada’s oil trade, responding to market signals, increased 4 percent worldwide and 10 percent with the United States last year. Estimates of Canada’s recoverable heavy oil sands reserves are substantial, and new technologies are being deployed to develop their potential. Production from these promising areas now approaches 600,000 barrels a day. Their continued development can be a pillar of sustained North American energy and economic security.
Mexico Our energy relationship with Mexico
reflects the increasingly interrelated character of NAFTA economies and our contiguous border. U.S. natural gas reserves, pipe-
Offshore oil platform
near Campeche,
Mexico. Mexico’s large
crude oil reserves—
approximately 25
percent larger than
our own proven
reserves—makes it a
likely source of
increased oil produc
tion over the next
decade.
U.S. EMBASSY, MEXICO CITY
Chapter 8 • Strengthening Global Alliances: Enhancing National Energy Security and International Relationships 8-8

Figure 8-9
Mexican Oil and Gas Resources: 2001
C E N T R A L A M E R I C A
U N I T E D S T A T E S
M E X I C O
North Pacific Ocean
Gulf of Mexico
PedregosaBasin
Sabinas
Burgos
Tampico-Mistanta
Gas Producing
Oil Producing
Prospective Region
Veracruz
Bahia de Campeche
Macuspana
Gulf of California
Mexico City •
Mazatlan Basin
Mexico’s large oil reserves—approximately 25 percent larger than U.S. proven reserves—make it a likely source of increased oil production over the next decade.
next decade (Figure 8- 9). Mexico began exporting 50 megawatts
of electricity from Baja to California in January 2001. However, the transmission infrastructure on both sides of the border is insufficient for greater flows of energy in either direction without expansion. In the United States, our process for “Presidential Permitting” of cross-border infrastructure linkages needs to be updated and streamlined.
Mexico will make its own sovereign decisions on the breadth, pace, and extent to which it will expand and reform its electricity and oil and gas capacities. Where the country has opened its energy sector to private investment, such as in natural gas transmission, distribution, and storage, investments have been made to our mutual benefit. To the extent Mexico seeks to attract additional foreign investment consistent with its Constitution, which reserves exploration and production rights to the Mexican government, the United States should actively encourage the U.S. private sector to consider market-based investments.
Recommendations:
★ The NEPD Group recommends that the President direct the Secretaries of State, Commerce, and Energy to engage in a dialogue through the North American Energy Working Group to develop closer energy integration among Canada, Mexico, and the United States and identify areas of cooperation, fully consistent with the countries’ respective sovereignties.
★ The NEPD Group recommends that the President direct the Secretaries of Energy and State, in consultation with the Federal Energy Regulatory Commission, to review their respective oil, natural gas, and electricity crossboundary “Presidential Permitting” authorities, and to propose reforms as necessary in order to make their own regulatory regimes more compatible for cross-border trade.
_________Source: U.S. Central Intelligence Agency.
A carrier transports liquefied
natural gas (LNG) from
Trinidad and Tobago—our
largest LNG supplier—to
Boston harbor. LNG currently
represents 16 percent of New
England’s natural gas supply.
CABOT LNG
lines, and industries are closer to the growing border area than some of Mexico’s reserves. The United States is a net exporter of refined petroleum products and natural gas to Mexico, primarily through pipeline connections to northern Mexico. Mexico is a leading and reliable source of imported oil, and its large reserve base, approximately 25 percent larger than our own proven reserves, makes Mexico a likely source of increased oil production over the
8-9 NATIONAL ENERGY POLICY

★ The NEPD Group recommends that the President direct the Secretaries of Energy and State, coordinating with the Secretary of the Interior and the Federal Energy Regulatory Commission, to work closely with Canada, the State of Alaska, and all other interested parties to expedite the construction of a pipeline to deliver natural gas to the lower 48 states. This should include proposing to Congress any changes or waivers of law pursuant to the Alaska Natural Gas Transportation Act of 1976 that may be required.
South America:Latin America and the Caribbean
Latin America and the Caribbean are growing not only as major producing regions, but also as major consumers of oil and natural gas. Trinidad and Tobago’s progressive investment code has made it the hemisphere’s largest exporter of LNG and the largest supplier of LNG to the United States in 2000. Unprecedented development of Central and South America’s vast natural gas reserves—222.7 trillion cubic feet as of January 2000, illustrated by transcontinental pipelines linking Bolivia, Brazil, Argentina, Chile, Paraguay, and Uruguay—increase regional self-reliance, affirm economic integration, aid the environment, and stem the growth in oil demand. Colombia has also become an important supplier of oil to the United States.
The United States, with Venezuela, is a co-coordinator of the Hemispheric Energy Initiative process. In March 2001, a Summit of the Americas Hemispheric Energy Ministerial meeting was hosted by the Government of Mexico. At the meeting, the region’s energy ministers pledged to support integration and sustainable development in the hemisphere, recognizing the need to foster stable and transparent regulatory frameworks. In April 2001, the thirtyfour democratically elected leaders of the Western Hemisphere met in Quebec City for the Third Summit of the Americas. They called for a renewed effort to strengthen the hemisphere’s energy cooperation and integration.
Venezuela is the world’s fifth largest oil exporter, and the third largest oil supplier to the United States. Its energy industry is increasingly integrated into the U.S. marketplace. Venezuela’s downstream investments in the United States make it a leading refiner and gasoline marketer here. Growing U.S. and international investments in Venezuela’s energy sector, particularly in its resource-rich heavy oil sector, are enhancing the country’s ability to meet its development goals and to keep pace with a growing world energy marketplace. Venezuela is also moving to liberalize its natural gas sector, which will increase opportunities for foreign investment to expand Venezuelan natural gas production. These positive steps along with conclusion of a Bilateral Investment Treaty, which is now being negotiated, would provide investors from both the United States and Venezuela incentives for increased investment.
Brazil has long been a pioneer in the development of deep-water offshore oil and gas resources. Its world-class oil industry is now moving to become a partner with U.S. and international investors to more fully develop its prolific offshore oil reserves. This welcome development will enhance hemispheric energy production from well-established sedimentary basins.
U.S. Secretary of
Energy Spencer
Abraham listens to
his colleagues at the
Summit of the Ameri
cas Hemispheric
Energy Ministerial
meeting in Mexico City
on March 9, 2001.
U.S. EMBASSY, MEXICO CITY
Chapter 8 • Strengthening Global Alliances: Enhancing National Energy Security and International Relationships 8-10

Recommendations:
★ The NEPD Group recommends that the President direct the Secretaries of State and Commerce to conclude negotiations with Venezuela on a Bilateral Investment Treaty, and propose formal energy consultations with Brazil, to improve the energy investment climate for the growing level of energy investment flows between the United States and each of these countries. ★ The NEPD Group recommends that the President direct the Secretaries of Energy, Commerce, and State to work through the Summit of the Americas Hemispheric Energy Initiative to develop effective and stable regulatory frameworks and foster reliable supply sources of all fuels within the region.
Africa Sub-Saharan Africa holds 7 percent of
world oil reserves and comprises 11 percent of world oil production. Along with Latin America, West Africa is expected to be one of fastest-growing sources of oil and gas for the American market. African oil tends to be of high quality and low in sulfur, making it suitable for stringent refined product requirements, and giving it a growing market share for refining centers on the East Coast of the United States.
In 2000, OPEC member Nigeria exported an average of 900,000 barrels of oil per day to the United States, out of its total production of 2.1 million barrels of oil per day. Nigeria, in partnership with the private sector, has set ambitious production goals as high as 5 million barrels of oil per day over the coming decade.
Angola’s growing offshore oil industry, with participation by U.S. and international oil firms, is also a major source of growth. In 2000, Angola exported 300,000 barrels of oil per day out of its 750,000 barrels of oil per day of total production to the United States, and is thought to have the potential to double its exports over the next ten years. Other significant exporters to the United States included Gabon and the Congo-Brazzaville.
The World Bank has supported Chad’s efforts to begin ambitious oil development. This year an international consortium that includes U.S. firms began investing $3.5 billion in this pipeline from Chad to Cameroon, the largest infrastructure project in Africa today. When complete, the pipeline will allow Chad to export up to 250,000 barrels of oil per day.
The U.S. Agency for International Development (USAID) has provided technical assistance in support of a West Africa Power Pool and associated pipeline project involving a number of U.S. oil companies, and is providing assistance for the creation of a regional regulatory framework that will enable Ghana and Nigeria to become major exporters of natural gas and electricity.
The West Africa Gas Pipeline is a 161mile (1,000-kilometer), $400 million onshore/offshore natural gas pipeline connecting Nigeria with Benin, Togo, and Ghana. The pipeline is being built by a consortium of companies, and includes financing by the U.S. Export-Import Bank.
Recommendations:
★ The NEPD Group recommends that the President direct the Secretaries of State, Energy, and Commerce to reinvigorate the U.S.-Africa Trade and Economic Cooperation Forum and the U.S.-African Energy Ministerial process; deepen bilateral and multilateral engagement to promote a more receptive environment for U.S. oil and gas trade, investment, and operations; and promote geographic diversification of energy supplies, addressing such issues as transparency, sanctity of contracts, and security. ★ The NEPD Group recommends that the President direct the Secretaries of State, Energy, and Commerce to recast the Joint Economic Partnership Committee with Nigeria to improve the climate for U.S. oil and gas trade, investment, and operations and to advance our shared energy interests. ★ The NEPD Group recommends that the President direct the Secretaries of
8-11 NATIONAL ENERGY POLICY

State, Energy, and Commerce to support more transparent, accountable, and responsible use of oil resources in African producer countries to enhance the stability and security of trade and investment environments.
The Caspian Proven oil reserves in Azerbaijan and
Kazakhstan are about 20 billion barrels, a little more than the North Sea and slightly less than the United States. Exploration, however, is continuing, and proven reserves are expected to increase significantly.
For example, initial results of the exploration well at Kazakhstan’s Kashagan field indicate the find is one of the most important in thirty years, and is comparable to Prudhoe Bay in size. Current exports from the region are only about 800,000 barrels of oil per day, in part due to limited export route options. However, potential exports could increase by 1.8 million barrels of oil per day by 2005, as the United States works closely with private companies and countries in the region to develop commercially viable export routes, such as the Baku-Tbilisi-Ceyhan (BTC) and Caspian Pipeline Consortium oil pipelines (Figure 810). Moreover, there is considerable optimism that exports could grow even more substantially in subsequent years because of positive prospects for new oil and gas finds as additional geologic structures undergo exploration, and the development of new export routes.
Foreign investors and technology are critical to rapid development of new commercially viable export routes. Such development will ensure that rising Caspian oil production is effectively integrated into world oil trade. U.S.-supported East–West pipeline routes will add substantial new oil transportation capacity to allow continued expansion of production and exports. Overland routes via pipeline, such as the planned BTC oil pipeline, will also help mitigate maritime risks in the crowded Bosporus Straits. To help countries prepare for increased oil production within the re-
Figure 8-10
Caspian Energy Export Pipelines: 2001
caspian fig 10
Several oil and natural gas pipeline projects are proposed for the Caspian area. _________ Source: U.S. Central Intelligence Agency.
gion, the United States is working with Black Sea and Caspian Sea border states to ensure that they develop adequate oil spill response capabilities.
Chapter 8 • Strengthening Global Alliances: Enhancing National Energy Security and International Relationships 8-12

Recommendations:
★ The NEPD Group recommends thatthe President direct the Secretaries ofState, Commerce, and Energy to support the BTC oil pipeline as it demonstrates its commercial viability.
★ The NEPD Group recommends thatthe President direct the Secretaries ofCommerce, State, and Energy to continue working with relevant companies and countries to establish thecommercial conditions that will allowoil companies operating in Kazakhstanthe option of exporting their oil via theBTC pipeline.
★ The NEPD Group recommends thatthe President direct the Secretaries ofState, Commerce, and Energy to support the efforts of private investorsand regional governments to developthe Shah Deniz gas pipeline as a wayto help Turkey and Georgia diversifytheir natural gas supplies and helpAzerbaijan export its gas via a pipelinethat will continue diversification of secure energy supply routes.
★ The NEPD Group recommends thatthe President direct appropriate federal agencies to complete the currentcycle of oil spill response readinessworkshops and to consider further appropriate steps to ensure the implementation of the workshops’ recommendations.
★ The NEPD Group recommends thatthe President direct the Secretary ofState to encourage Greece and Turkeyto link their gas pipeline systems to allow European consumers to diversifytheir gas supplies by purchasingCaspian gas.
★ The NEPD Group recommends thatthe President direct the Secretaries ofCommerce, Energy, and State todeepen their commercial dialoguewith Kazakhstan, Azerbaijan, andother Caspian states to provide astrong, transparent, and stable business climate for energy and related infrastructure projects.
Russia Russia has about 5 percent of the
world’s proven oil reserves. In 2000, Russia produced an average of 6.7 million barrels of oil and natural gas liquids per day, making it both the world’s third largest producer and second largest exporter at 4.2 million barrels of oil per day. Russia’s oil production in 2000 represented an increase of 7 percent over 1999, the first increase since the dissolution of the Soviet Union. A similar rate of increase is projected for 2001. New fields are being developed, including those with U.S. and other foreign investors.
Nevertheless, substantial infrastructure investment is still needed, as well as legislation and a stable and reliable regime of contracting to finalize the Production Sharing Agreement (PSA) mechanism for private-sector participation and actions to improve the general investment climate. Russian oil firms are increasingly active on a global scale, with upstream and downstream investments in the Caspian, the United States, Africa, South Asia, and Europe, enhancing Russia’s ability to develop its own and international oil reserves.
Russia holds 33 percent of the world’s natural gas reserves, exporting a full 35 percent of its production to Europe and Central Asia in 1999. Russian natural gas exports can increase regional fuel diversification and advance environmental goals. With production declines now evident in existing fields, development of new reserves that require substantial new investments will be necessary.
Recommendations:
★ The NEPD Group recommends thatthe President direct the Secretaries ofState, Commerce, and Energy todeepen the focus of the discussionswith Russia on energy and the investment climate.★ The NEPD Group recommends thatthe President direct the Secretaries ofCommerce, State, and Energy to assistU.S. companies in their dialogue onthe investment and trade climate with
8-13 NATIONAL ENERGY POLICY

Russian officials, to encourage reform of the PSA law and other regulations and related tax provisions, as well as general improvements in the overall investment climate. This will help expand private investment opportunities in Russia and will increase the international role of Russian firms.
Asia Asia holds less than 5 percent of
world proven oil reserves, but accounts for more than 10 percent of oil production and about 30 percent of world oil consumption. The developing countries of the Pacific Rim are expected to increase their total petroleum imports by almost 43 percent between 1997 and 2020. The developing countries of Asia are expected to remain heavily dependent on Middle East imports.
China is a critical player in global energy security issues, since its net oil imports are expected to rise from approximately 1 million barrels of oil per day at present to possibly 5 to 8 million barrels of oil per day by 2020, with a predominant (over 70 percent) dependence on Middle East imports. China moved in the mid-1990s from being a net oil exporter to a net oil importer.
About 7 percent of the world’s proven natural gas reserves are located in Asia. Asian gas production represents about 11 percent of the world total, and consumption is less than 3 percent of world natural gas demand. Other natural gas producers, such as Malaysia, Myanmar, and Australia, are net gas exporters. Currently Japan, South Korea, and Taiwan are the major gas importers in Asia. China, in addition to accelerating domestic exploration and development of natural gas resources, is planning to import gas via pipeline from Central Asia. India, likewise, is considering several potential LNG import projects (Figure 8-11).
Figure 8-11 Energy Consumption in China and India: 1970–2020
(Quadrillion Btus)
1970 75 80 85 90 95 2000 05 10 15 20
China and India account for the bulk of projected growth in oil demand in non-OECD countries.______Source: U.S. Department of Energy, Energy Information Administration.
Recommendations:
★ The NEPD Group recommends thatthe President direct the Secretaries ofState, Commerce, and Energy to continue to work in the APEC EnergyWorking Group to examine oil marketdata transparency issues and the variety of ways petroleum stocks can beused as an option to address oil market disruptions.★ The NEPD Group recommends thatthe President direct the Secretaries ofState and Energy to work with India’sMinistry of Petroleum and Natural Gasto help India maximize its domestic oiland gas production.
Diversification of Fuel Mix The growing demand for more fuel
efficient technologies offers U.S. businesses significant trade and investment opportunities overseas, while addressing rising world oil demand. The United States supports a practical, market-based approach that en
120
100
History Projections
China 80
60
40
India
20
0
Chapter 8 • Strengthening Global Alliances: Enhancing National Energy Security and International Relationships 8-14
courages the adoption of efficient technologies, including those relating to natural gas, nuclear energy, and renewable energy. This approach takes into account existing national and international programs and has the potential to energize both public action and private involvement. Introduction of these technologies abroad also supports U.S. national interests by reducing competition for the oil resources on which the global economy continues to rely. Overall, the U.S. government’s goal is to adopt policies that support innovative finance and market mechanisms that will provide U.S. businesses and consumers greater incentives to make more cost effective, energy efficient investment and consumption decisions.
Increased use of renewable energy technologies would improve U.S. energy security, yield global environmental benefits, improve social and economic stability in the developing world, and provide significant trade and investment opportunities to U.S. businesses. Promotion of clean energy technology exports can mitigate international dependence on oil supplies from volatile regions, help lower energy costs for U.S. consumers, bring U.S. firms greater access to large foreign markets, and enhance U.S. integration with global sources of innovation. In consultation with U.S. industry, the U.S. government is participating in efforts of the IEA, the G-8, the OECD, the United Nations, and multilateral development banks to formulate effective strategies for accelerated market penetration of renewable energy technologies. Significant market penetration will depend on further reducing the costs of deploying these technologies.
The Clean Energy Technology Exports Working Group, a Federal interagency task force comprised of USAID and the Departments of Commerce and Energy, is creating a strategic plan that will provide a roadmap for future exports of U.S. clean energy technologies. Through its international trade programs, the Department of Commerce will showcase market-ready U.S. technologies that generate a cleaner environment and increase energy efficiency.
Recommendation:
★ The NEPD Group recommends that the President direct the Secretaries of Commerce, State, and Energy to promote market-based solutions to environmental concerns; support exports of U.S. clean energy technologies and encourage their overseas development; engage bilaterally and multilaterally to promote best practices; explore collaborative international basic research and development in energy alternatives and energy efficient technologies; and explore innovative programs to support the global adoption of these technologies.
Climate Change The President is committed to ad
dressing the issue of global climate change in a manner that protects our environment and economy. Toward this end, the Administration is undertaking a Cabinet-level review of domestic and international policies for addressing this issue.
The United States invited other nations to re-examine global climate change issues, including technologies and market-based systems. Increasing our understanding of the most recent science and further research into the science of climate change will be essential to developing the optimal strategy.
There is increasing awareness of global competition for fossil fuels and their potential threats to the global environment. The United States can diminish both risks by becoming more energy efficient at home, by working with other nations, and by encouraging developing countries to use the cleanest and most energy-efficient technologies. Through educational programs, the United States can encourage developing countries to use advanced U.S. energy technologies, energy management practices, and market-based policies. The United States is uniquely positioned to help emerging nations build energy and institutional capacity and to finance energy-related activities and services. Doing so could prove to be a costeffective investment, for both the United States and emerging economies.
8-15 NATIONAL ENERGY POLICY

Recommendation:
★ The NEPD Group recommends that the President direct federal agencies to support continued research into global climate change; continue efforts to identify environmentally and cost-effective ways to use market mechanisms and incentives; continue development of new technologies; and cooperate with allies, including through international processes, to develop technologies, market-based incentives, and other innovative approaches to address the issue of global climate change.
Oil Consumption Although U.S. energy security can be
reinforced by domestic efforts to enhance supply and use energy more efficiently, growth in international oil demand will exert increasing pressure on global oil availability. Worldwide oil consumption is projected to grow by 2.1 percent a year over the next two decades. However, oil demand is projected to grow three times as fast in non-OECD countries as in OECD countries, which will increase worldwide competition for global oil supplies and put increased pressure on our shared environment. Accordingly, non-OECD countries’ share of oil demand is expected to rise from 41 percent to 52 percent (Figure 812). China and India will be major contributors to this growth in demand and will rely heavily on imports to meet their needs. This growth will increase the stake that many developing countries have in ensuring access to significant energy resources, as well as their incentive to pursue energy efficiency.
Transportation has been responsible for nearly all the growth in OECD oil consumption over the last twenty years, and is projected to be the leading source of future growth in oil consumption through 2020. Transportation-related fuel consumption in the developing world is expected to more than double by 2020, growing at an annual average rate of 4 percent. Therefore, both OECD and developing countries will need
to increase their focus on efficiencies in the transportation sector. The momentum to create market mechanisms supporting alternative-fuel vehicles will increase. Best practices that seek to reduce the cost of these technologies and to promote market penetration should be pursued. Without additional efforts to reduce this growth in consumption, the transportation sector’s fuel needs will force an increasing dependence on oil in the developed and developing worlds.
Recommendations:
★ The NEPD Group recommends thatthe President seek to increase international cooperation on finding alternatives to oil, especially for the transportation sector.★ The NEPD Group recommends thatthe President direct the Secretary ofState to reinvigorate its dialogue withthe European Union on energy issues,and resume the consultative processthis year in Washington.★ The NEPD Group recommends thatthe President promote a coordinatedapproach to energy security by callingfor an annual meeting of G-8 EnergyMinisters or their equivalents.
Emergency Preparedness for Oil Supply Disruption
U.S. and world exposure to oil supply disruptions increases as the size of strategic and commercial stocks relative to demand declines. This vulnerability is a result of rising global demand, tight supplies, and inadequate efforts to establish or expand oil stockpiles. Such a situation magnifies the importance of U.S. coordination with other members of the IEA, comprised of most OECD member governments. Each IEA member that is a net oil importer is required to hold stocks equal to 90 days or more of its net imports. The IEA maintains agreed mechanisms for coordinating the use of these stocks in responding to a physical supply disruption. Collectively, the net oil-importing members of the IEA currently hold
Figure 8-12 Projected Oil Consumption Rates in Three Economic Regions: 1999–2020 (Percent)
OECD Countries
Developing Countries
Eurasia (Former Soviet Union, Eastern
Europe, and China)
3
2
1
0
2.9%
2.6%
0.2%
Over the next two decades, oil consumption in developing countries and Eurasia will grow three times faster than in the rest of the world.
______ Source: U.S. Department of Energy, Energy Information Administration.
Chapter 8 • Strengthening Global Alliances: Enhancing National Energy Security and International Relationships 8-16

Figure 8-13 Stocks of IEA Net Importers: 1975–2000
(Days 0f Net Imports)
Industry
Government
1975
fig 13
180
150
120
90
60
30
0
IEP minimum stockholding requirement for all IEA members that are net oil importers.
00
The International Energy Agency, of which the United States is a member, closely tracks the amount of strategic and commercial petroleum stocks maintained by its member states. The International Energy Program (IEP) Agreement “binds Participating Countries to make specific measures to meet any oil supply emergency and, over the long term, to reduce dependence on oil.” _______Source: International Energy Agency.
approximately 113 days worth of strategic and commercial stocks. U.S. stocks, which include both government and commercial stocks, are slightly above the IEA average. While this is more than required, it is far below the peak coverage of 157 days reached in 1986. Moreover, several member states have fallen below the 90-day threshold (Figure 8-13).
The United States meets part of its IEA obligation through government-owned stocks held in the U.S. Strategic Petroleum Reserve (SPR). The SPR currently holds 541 million barrels of oil, which is enough to cover the loss of all U.S. imports for 54 days or a partial disruption for much longer. Close to 33 million barrels of oil will be deposited in the SPR by the fourth quarter of 2002, returning oil that had been “exchanged” out of the reserve last year. SPR oil can be withdrawn at a maximum rate of over 4 million barrels of oil per day initially and could reach the market within fifteen days of a Presidential directive. Because of increased net oil imports, the days of oil import coverage provided by the SPR have declined considerably over the past decade. In 1990, the SPR contained enough oil to compensate for the loss of 82 days worth of U.S. imports—substantially more than today’s 54-day supply. As domestic production and import patterns evolve, the Administration will work to inform Congress about changing coverage levels provided by the SPR. It should be noted that the United States also counts on the SPR as a national defense fuel reserve.
The oil market’s day-to-day operation and its ability to respond to supply problems depend heavily on the availability of information on supply, demand, and price. The oil market volatility of the past two years has emphasized the need for more comprehensive and timely oil market information.
Recommendations:
★ The NEPD Group recommends that the President reaffirm that the SPR is designed for addressing an imminent or actual disruption in oil supplies, and not for managing prices. ★ The NEPD Group recommend that the President direct the Secretary of Energy to work within the International Energy Agency (IEA) to ensure that member states fulfill their stockholding. ★ The NEPD Group recommends that the President direct the Secretary of Energy to encourage major oil-consuming countries that are not IEA members to consider strategic stocks as an option for addressing potential supply disruptions. In this regard, we should work closely with Asian economies, especially through APEC. ★ The NEPD Group recommends that the President direct the Secretary of Energy offer to lease excess SPR storage facilities to countries (both IEA and non-IEA members) that might not otherwise build storage facilities or hold sufficient strategic stocks, consistent with statutory authorities. ★ The NEPD Group recommends that the President, at such time that exchanged SPR barrels are returned to the SPR, should determine whether offshore Gulf of Mexico royalty oil deposits to the SPR should be resumed, thereby increasing the size of our reserve. ★ The NEPD Group recommends that the President direct the Secretary of Energy to work closely with Congress to ensure that our SPR protection is maintained. ★ The NEPD Group recommends that the President direct the Secretary of Energy to work with producer and consumer country allies and the IEA to craft a more comprehensive and timely world oil data reporting system.
8-17 NATIONAL ENERGY POLICY

Summary of Recommendations
Strengthening Global Alliances: Enhancing National Energy Security and International Relationships
★ The NEPD Group recommends that the President make energy security a priority of our trade and foreign policy.
★ The NEPD Group recommends the President support initiatives by Saudi Arabia, Kuwait, Algeria, Qatar, the UAE, and other suppliers to open up areas of their energy sectors to foreign investment.
★ The NEPD Group recommends that the President direct the Secretaries of State, Energy and Commerce work to improve dialogue among energy producing and consuming nations.
★ The NEPD Group recommends that the President direct the Secretaries of State, Commerce, and Energy to continue supporting American energy firms competing in markets abroad and use our membership in multilateral organizations, such as the Asia-Pacific Economic Cooperation (APEC) forum, the Organization for Economic Cooperation and Development (OECD), the World Trade Organization (WTO) Energy Services Negotiations, the Free Trade Area of the Americas (FTAA), and our bilateral relationships to implement a system of clear, open, and transparent rules and procedures governing foreign investment; to level the playing field for U.S. companies overseas; and to reduce barriers to trade and investment.
★ The NEPD Group recommends that the President direct the Secretaries of Commerce and Energy, and the U.S. Trade Representative, to support a sectoral trade initiative to expand investment and trade in energy-related goods and services that will enhance exploration, production, and refining, as well as the development of new technologies.
★ The NEPD Group recommends that the President direct the Secretaries of State, Treasury, and Commerce to initiate a comprehensive review of sanctions. Energy security should be one of the factors considered in such a review.
★ The NEPD Group recommends that the President direct the Secretaries of State, Commerce, and Energy to engage in a dialogue through the North American Energy Working Group to develop closer energy integration among Canada, Mexico, and the United States and identify areas of cooperation, fully consistent with the countries’ respective sovereignties.
★ The NEPD Group recommends that the President direct the Secretaries of Energy and State, in consultation with the Federal Energy Regulatory Commission, to review their respective oil, natural gas, and electricity cross-boundary “Presidential Permitting” authorities, and to propose reforms as necessary in order to make their own regulatory regimes more compatible for cross-border trade.
★ The NEPD Group recommends that the President direct the Secretaries of Energy and State, coordinating with the Secretary of the Interior and the Federal Energy Regulatory Commission, to work closely with Canada, the State of Alaska, and all other interested parties to expedite the construction of a pipeline to deliver natural gas to the lower 48 states. This should include proposing to Congress any changes or waivers of law pursuant to the Alaska Natural Gas Transportation Act of 1976 that may be required.
Chapter 8 • Strengthening Global Alliances: Enhancing National Energy Security and International Relationships 8-18

★ The NEPD Group recommends that the President direct the Secretaries of State and Commerce to conclude negotiations with Venezuela on a Bilateral Investment Treaty, and propose formal energy consultations with Brazil, to improve the energy investment climate for the growing level of energy investment flows between the United States and each of these countries.
★ The NEPD Group recommends that the President direct the Secretaries of Energy, Commerce, and State to work through the Summit of the Americas Hemispheric Energy Initiative to develop effective and stable regulatory frameworks and foster reliable supply sources of all fuels within the region.
★ The NEPD Group recommends that the President direct the Secretaries of State, Energy, and Commerce to reinvigorate the U.S.-Africa Trade and Economic Cooperation Forum and the U.S.-African Energy Ministerial process; deepen bilateral and multilateral engagement to promote a more receptive environment for U.S. oil and gas trade, investment, and operations; and promote geographic diversification of energy supplies, addressing such issues as transparency, sanctity of contracts, and security.
★ The NEPD Group recommends that the President direct the Secretaries of State, Commerce, and Energy to support more transparent, accountable, and responsible use of oil resources in African producer countries to enhance the stability and security of trade and investment environments.
★ The NEPD Group recommends that the President direct the Secretaries of State, Commerce, and Energy to support the BTC oil pipeline as it demonstrates its commercial viability.
★ The NEPD Group recommends that the President direct the Secretaries of Commerce, State, and Energy to continue working with relevant companies and countries to establish the commercial conditions that will allow oil companies operating in Kazakhstan the option of exporting their oil via the BTC pipeline.
★ The NEPD Group recommends that the President direct the Secretaries of State, Commerce, and Energy to support the efforts of private investors and regional governments to develop the Shah Deniz gas pipeline as a way to help Turkey and Georgia diversify their natural gas supplies and help Azerbaijan export its gas via a pipeline that will continue diversification of secure energy supply routes.
★ The NEPD Group recommends that the President direct appropriate federal agencies to complete the current cycle of oil spill response readiness workshops and to consider further appropriate steps to ensure the implementation of the workshops’ recommendations.
★ The NEPD Group recommends that the President direct the Secretary of State to encourage Greece and Turkey to link their gas pipeline systems to allow European consumers to diversify their gas supplies by purchasing Caspian gas.
8-19 NATIONAL ENERGY POLICY
★ The NEPD Group recommends that the President direct the Secretaries of Commerce, Energy, and State to deepen their commercial dialogue with Kazakhstan, Azerbaijan, and other Caspian states to provide a strong, transparent, and stable business climate for energy and related infrastructure projects.
★ The NEPD Group recommends that the President direct the Secretaries of State, Commerce, and Energy to deepen the focus of the discussions with Russia on energy and the investment climate.
★ The NEPD Group recommends that the President direct the Secretaries of Commerce, State, and Energy to assist U.S. companies in their dialogue on the investment and trade climate with Russian officials, to encourage reform of the PSA law and other regulations and related tax provisions, as well as general improvements in the overall investment climate. This will help expand private investment opportunities in Russia and will increase the international role of Russian firms.
★ The NEPD Group recommends that the President direct the Secretaries of State, Commerce, and Energy to continue to work in the APEC Energy Working Group to examine oil market data transparency issues and the variety of ways petroleum stocks can be used as an option to address oil market disruptions.
★ The NEPD Group recommends that the President direct the Secretaries of State and Energy to work with India’s Ministry of Petroleum and Natural Gas to help India maximize its domestic oil and gas production.
★ The NEPD Group recommends that the President direct the Secretaries of Commerce, State, and Energy to promote market-based solutions to environmental concerns; support exports of U.S. clean energy technologies and encourage their overseas development; engage bilaterally and multilaterally to promote best practices; explore collaborative international basic research and development in energy alternatives and energy-efficient technologies; and explore innovative programs to support the global adoption of these technologies.
★ The NEPD Group recommends that the President direct federal agencies to support continued research into global climate change; continue efforts to identify environmentally and cost-effective ways to use market mechanisms and incentives; continue development of new technologies; and cooperate with allies, including through international processes, to develop technologies, market-based incentives, and other innovative approaches to address the issue of global climate change.
★ The NEPD Group recommends that the President seek to increase international cooperation on finding alternatives to oil, especially for the transportation sector.
★ The NEPD Group recommends that the President direct the Secretary of State to reinvigorate its dialogue with the European Union on energy issues, and resume the consultative process this year in Washington.
Chapter 8 • Strengthening Global Alliances: Enhancing National Energy Security and International Relationships 8-20

★ The NEPD Group recommends that the President promote a coordinated approach to energy security by calling for an annual meeting of G-8 Energy Ministers or their equivalents.
★ The NEPD Group recommends that the President reaffirm that the SPR is designed for addressing an imminent or actual disruption in oil supplies, and not for managing prices.
★ The NEPD Group recommend that the President direct the Secretary of Energy to work within the International Energy Agency (IEA) to ensure that member states fulfill their stockholding.
★ The NEPD Group recommends that the President direct the Secretary of Energy to encourage major oil-consuming countries that are not IEA members to consider strategic stocks as an option for addressing potential supply disruptions. In this regard, we should work closely with Asian economies, especially through APEC.
★ The NEPD Group recommends that the President direct the Secretary of Energy offer to lease excess SPR storage facilities to countries (both IEA and non-IEA members) that might not otherwise build storage facilities or hold sufficient strategic stocks, consistent with statutory authorities.
★ The NEPD Group recommends that the President, at such time that exchanged SPR barrels are returned to the SPR, should determine whether offshore Gulf of Mexico royalty oil deposits to the SPR should be resumed, thereby increasing the size of our reserve.
★ The NEPD Group recommends that the President direct the Secretary of Energy to work closely with Congress to ensure that our SPR protection is maintained.
★ The NEPD Group recommends that the President direct the Secretary of Energy to work with producer and consumer country allies and the IEA to craft a more comprehensive and timely world oil data reporting system.
8-21 NATIONAL ENERGY POLICY

SUMMARY OF RECOMMENDATIONS
CHAPTER ONE
Taking Stock:Energy
Challenges Facing the
United States
★ The NEPD Group recommends that the President issue an Executive Order to direct all federal agencies to include in any regulatory action that could significantly and adversely affect energy supplies, distribution, or use, a detailed statement on: (1) the energy impact of the proposed action, (2) any adverse energy effects that cannot be avoided should the proposal be implemented, and (3) alternatives to the proposed action. The agencies would be directed to include this statement in all submissions to the Office of Management and Budget of proposed regulations covered by Executive Order 12866, as well as in all notices of proposed regulations published in the Federal Register.
★ The NEPD Group recommends that the President direct the executive agencies to work closely with Congress to implement the legislative components of a national energy policy.
★ The NEPD Group recommends to the President that the NEPD Group continue to work and meet on the implementation of the National Energy Policy and explore other ways to advance dependable, affordable, and environmentally responsible production and distribution of energy.
Note: All recommendations in this report are subject to execution in accordance with appli
cable law. Legislation would be sought where needed. Also, any recommendations that in
volve foreign countries would be executed in accordance with the customs of international
relations, including appropriate diplomatic consultation.
NATIONAL ENERGY POLICY

SUMMARY OF RECOMMENDATIONS
CHAPTER TWO
Striking HomeThe Impacts of
High Energy Prices on Families,
Communities,and Businesses
★ The NEPD Group recommends that the President direct the Secretary of Energy to explore potential opportunities to develop educational programs related to energy development and use. This should include possible legislation to create public education awareness programs about energy. Such programs should be long-term in nature, should be funded and managed by the respective energy industries, and should include information on energy’s compatibility with a clean environment.
★ The NEPD Group recommends that the President take steps to mitigate impacts of high energy costs on low-income consumers. These steps would include: • Strengthening the Low Income Home Energy Assistance Program by making $1.7 bil
lion available annually. This is an increase of $300 million over the regular FY 2001 appropriation.
• Directing the Secretaries of Interior and Health and Human Services to propose legislation to bolster LIHEAP funding by using a portion of oil and gas royalty payments.
• Redirecting royalties above a set trigger price to LIHEAP, whenever crude oil and natural gas prices exceed that trigger price, as determined by the responsible agencies.
★ The NEPD Group recommends that the President increase funding for the Weatherization Assistance Program by $1.2 billion over ten years. This will roughly double the spending during that period on weatherization. Consistent with that commitment, the FY 2002 Budget includes a $120 million increase over 2001. The Department of Energy will have the option of using a portion of those funds to test improved implementation approaches for the weatherization program.
★ The NEPD Group recommends that the President support legislation to allow funds dedicated for the Weatherization and State Energy Programs to be transferred to LIHEAP if the Department of Energy deems it appropriate.
★ The NEPD Group recommends the President recognize unique regional energy concerns by working with the National Governors Association and regional governor associations to determine how to better serve the needs of diverse areas of the country.
★ The NEPD Group recommends the President direct FEMA to prepare for potential energy emergencies. • FEMA should work with states’ Offices of Emergency Management as they expand
existing emergency operations plans to identify potential problems and address consequences of the power shortages. FEMA should use its current Regional Incident Reporting System to identify any situations that might demand immediate attention.
• Using the structure of the already existing Federal Response Plan, FEMA should conduct Regional Interagency Steering Committee (RISC) meetings for states affected by the energy shortfalls. The RISC is a FEMA-led interagency committee comprised of agencies and departments that support the Federal Response Plan. Either an upcoming, scheduled RISC meeting or a special-focus RISC meeting can be held to identify the short-term energy outlook, as well as any expected consequences, in each of the states during the peak summer season.
Appendix One

SUMMARY OF RECOMMENDATIONS
CHAPTERTHREE
Protecting America’s
Environment: Sustaining the
Nation’s Health and
Environment
★ The NEPD Group recommends that the President direct the Administrator of the Environmental Protection Agency (EPA) to propose multi-pollutant legislation. The NEPD Group recommends that the President direct the EPA Administrator to work with Congress to propose legislation that would establish a flexible, market-based program to significantly reduce and cap emissions of sulfur dioxide, nitrogen oxides, and mercury from electric power generators. Such a program (with appropriate measures to address local concerns) would provide significant public health benefits even as we increase electricity supplies. • Establish mandatory reduction targets for emissions of three main pollutants: sulfur
dioxide, nitrogen oxides, and mercury. • Phase in reductions over a reasonable period of time, similar to the successful acid
rain reduction program established by the 1990 amendments to the Clean Air Act. • Provide regulatory certainty to allow utilities to make modifications to their plants
without fear of new litigation. • Provide market-based incentives, such as emissions trading credits to help achieve
the required reductions.
★ The NEPD Group recommends the President direct the Secretary of the Interior to work with Congress to create the “Royalties Conservation Fund.” • This fund will earmark potentially billions of dollars in royalties from new oil and
gas production in ANWR to fund land conservation efforts. • This fund will also be used to eliminate the maintenance and improvements backlog
on federal lands.
★ The NEPD Group recommends the President issue an Executive Order to rationalize permitting for energy production in an environmentally sound manner by directing federal agencies to expedite permits and other federal actions necessary for energyrelated project approvals on a national basis. This order would establish an interagency task force chaired by the Council on Environmental Quality to ensure that federal agencies responsible for permitting energy-related facilities are coordinating their efforts. The task force will ensure that federal agencies set up appropriate mechanisms to coordinate federal, state, tribal, and local permitting activity in particular regions where increased activity is expected.
NATIONAL ENERGY POLICY

SUMMARY OF RECOMMENDATIONS
CHAPTER FOUR
Using Energy Wisely:
Increasing Energy
Conservation and Efficiency
★ The NEPD Group recommends that the President direct the Office of Science and Technology Policy and the President’s Council of Advisors on Science and Technology to review and make recommendations on using the nation’s energy resources more efficiently.
★ The NEPD Group recommends that the President direct the Secretary of Energy to conduct a review of current funding and historic performance of energy efficiency research and development programs in light of the recommendations of this report. Based on this review, the Secretary of Energy is then directed to propose appropriate funding of those research and development programs that are performance-based and are modeled as public-private partnerships.
★ The NEPD Group recommends that the President direct the Secretary of Energy to promote greater energy efficiency.
• Expand the Energy Star program beyond office buildings to include schools, retail buildings, health care facilities, and homes.
• Extend the Energy Star labeling program to additional products, appliances, and services.
• Strengthen Department of Energy public education programs relating to energy efficiency.
★ The NEPD Group recommends that the President direct the Secretary of Energy to improve the energy efficiency of appliances.
• Support the appliance standards program for covered products, setting higher standards where technologically feasible and economically justified.
• Expand the scope of the appliance standards program, setting standards for additional appliances where technologically feasible and economically justified.
★ The NEPD Group recommends that the President direct heads of executive departments and agencies to take appropriate actions to conserve energy use at their facilities to the maximum extent consistent with the effective discharge of public responsibilities. Agencies located in regions where electricity shortages are possible should conserve especially during periods of peak demand. Agencies should report to the President, through the Secretary of Energy, within 30 days on the conservation actions taken.
★ The NEPD Group recommends that the President direct the Secretary of the Treasury to work with Congress to encourage increased energy efficiency through combined heat and power (CHP) projects by shortening the depreciation life for CHP projects or providing investment tax credits.
★ The NEPD Group recommends that the President direct the Administrator of the Environmental Protection Agency (EPA) to work with local and state governments to promote the use of well-designed CHP and other clean power generation at brownfields sites, consistent with the local communities’ interests. EPA will also work to clarify liability issues if they are raised at a particular site.
Appendix One

SUMMARY OF RECOMMENDATIONS
CHAPTER FOUR ★ The NEPD Group recommends that the President direct the EPA Administrator to promote CHP through flexibility in environmental permitting.
★ The NEPD Group recommends that the President direct the Secretary of Transportation to:
• Review and provide recommendations on establishing Corporate Average Fuel Economy (CAFE) standards with due consideration of the National Academy of Sciences study to be released in July 2001. Responsibly crafted CAFE standards should increase efficiency without negatively impacting the U.S. automotive industry. The determination of future fuel economy standards must therefore be addressed analytically and based on sound science.
• Consider passenger safety, economic concerns, and disparate impact on the U.S. versus foreign fleet of automobiles.
• Look at other market-based approaches to increasing the national average fuel economy of new motor vehicles.
★ The new NEPD Group recommends that the President direct the Secretary of Transportation to review and promote congestion mitigation technologies and strategies and work with Congress on legislation to implement these strategies.
★ The NEPD Group recommends that the President direct the Secretary of the Treasury to work with Congress on legislation to increase energy efficiency with a tax credit for fuel-efficient vehicles. The NEPD Group recommends that a temporary, efficiencybased income tax credit be available for purchase of new hybrid fuel cell vehicles between 2002 and 2007.
★ The NEPD Group recommends that the President direct all agencies to use technological advances to better protect our environment.
• The Administration remains committed to investing in Intelligent Transportation Systems (ITS) and encourages the private sector to invest in ITS applications. This Department of Transportation (DOT) program funds the development of improved transportation infrastructure that will reduce congestion, such as traveler information/navigation systems, freeway management, and electronic toll collection. ITS applications reduce fuel associated with travel.
• The Administration remains committed to the DOT’s fuel-cell-powered transit bus program, authored by the Transportation Equity Act for the 21st Century (TEA-21). This program demonstrates the viability of fuel-cell power plants for transit bus applications.
• The Administration remains committed to the Clean Buses program. TEA-21 establishes a new clean fuel formula grant program, which provides an opportunity to accelerate the introduction of advanced bus propulsion technologies into the mainstream of the nation’s transit fleet.
NATIONAL ENERGY POLICY

SUMMARY OF RECOMMENDATIONS
★ The NEPD Group recommends that the President direct the EPA and DOT to develop ways to reduce demand for petroleum transportation fuels by working with the trucking industry to establish a program to reduce emissions and fuel consumption from long-haul trucks at truck stops by implementing alternatives to idling, such as electrification and auxiliary power units at truck stops along interstate highways. EPA and DOT will develop partnership agreements with trucking fleets, truck stops, and manufacturers of idle-reducing technologies (e.g., portable auxiliary packs, electrification) to install and use lowemission-idling technologies.
★ The NEPD Group recommends that the President direct the Secretary of Energy to establish a national priority for improving energy efficiency. The priority would be to improve the energy intensity of the U.S. economy as measured by the amount of energy required for each dollar of economic productivity. This increased efficiency should be pursued through the combined efforts of industry, consumers, and federal, state, and local governments.
★ The NEPD Group recommends that the President direct the EPA Administrator to develop and implement a strategy to increase public awareness of the sizable savings that energy efficiency offers to homeowners across the country. Typical homeowners can save about 30 percent (about $400) a year on their home energy bill by using Energy Starlabeled products.
Appendix One

SUMMARY OF RECOMMENDATIONS
Chapter FiveEnergy for a
New Century:Increasing Domestic
Energy Supplies
★ The NEPD Group recommends that the President direct the Secretaries of Energy and the Interior to promote enhanced oil and gas recovery from existing wells through new technology.
★ The NEPD Group recommends that the President direct the Secretary of Energy to improve oil and gas exploration technology through continued partnership with public and private entities.
★ The NEPD Group recommends that the President direct the Secretary of the Interior to examine land status and lease stipulation impediments to federal oil and gas leasing, and review and modify those where opportunities exist (consistent with the law, good environmental practice, and balanced use of other resources).
• Expedite the ongoing Energy Policy and Conservation Act study of impedi- m e n t s to federal oil and gas exploration and development.
• Review public lands withdrawals and lease stipulations, with full public consultation, especially with the people in the region, to consider modifications where appropriate.
★ The NEPD Group recommends that the President direct the Secretary of the Interior to consider economic incentives for environmentally sound offshore oil and gas development where warranted by specific circumstances: explore opportunities for royalty reductions, consistent with ensuring a fair return to the public where warranted for enhanced oil and gas recovery; for reduction of risk associated with production in frontier areas or deep gas formations; and for development of small fields that would otherwise be uneconomic.
★ The NEPD Group recommends that the President direct the Secretaries of Commerce and Interior to re-examine the current federal legal and policy regime (statutes, regulations, and Executive Orders) to determine if changes are needed regarding energy-related activities and the siting of energy facilities in the coastal zone and on the Outer Continental Shelf (OCS).
★ The NEPD Group recommends that the President direct the Secretary of the Interior continue OCS oil and gas leasing and approval of exploration and development plans on predictable schedules.
★ The NEPD Group recommends that the President direct the Secretary of the Interior to consider additional environmentally responsible oil and gas development, based on sound science and the best available technology, through further lease sales in the National Petroleum Reserve-Alaska. Such consideration should include areas not currently leased within the Northeast corner of the Reserve.
★ The NEPD Group recommends that the President direct the Secretary of the Interior work with Congress to authorize exploration and, if resources are discovered, development of the 1002 Area of ANWR. Congress should require the use of the best available technology and should require that activities will result in no significant adverse impact to the surrounding environment.
★ The NEPD Group recommends that the President direct the Secretary of the Interior to work with Congress and the State of Alaska to put in place the most expeditious process for renewal of the Trans-Alaska Pipeline System rights-of-way to ensure that Alaskan oil continues to flow uninterrupted to the West Coast of the United States.
NATIONAL ENERGY POLICY

SUMMARY OF RECOMMENDATIONS
★ The NEPD Group recommends that the President direct the Secretary of Energy to propose comprehensive electricity legislation that promotes competition, protects consumers, enhances reliability, promotes renewable energy, improves efficiency repeals the Public Utility Holding Company Act, and reforms the Public Utility Regulatory Policies Act.
★ The NEPD Group recommends that the President encourage FERC to use its existing statutory authority to promote competition and encourage investment in transmission facilities.
★ The NEPD Group recognizes the importance of looking to technology to help us meet the goals of increasing electricity generation while protecting our environment. To that end, the NEPD Group recommends that the President direct the Department of Energy to continue to develop advanced clean coal technology by:
• Investing $2 billion over 10 years to fund research in clean coal technologies. • Supporting a permanent extension of the existing research and development tax credit. • Directing federal agencies to explore regulatory approaches that will encourage ad
vancements in environmental technology.
★ The NEPD Group recommends that the President direct federal agencies to provide greater regulatory certainty relating to coal electricity generation through clear policies that are easily applied to business decisions.
★ The NEPD Group recommends that the President support the expansion of nuclear energy in the United States as a major component of our national energy policy. Following are specific components of the recommendation:
• Encourage the Nuclear Regulatory Commission (NRC) to ensure that safety and environmental protection are high priorities as they prepare to evaluate and expedite applications for licensing new advanced-technology nuclear reactors.
• Encourage the NRC to facilitate efforts by utilities to expand nuclear energy generation in the United States by uprating existing nuclear plants safely.
• Encourage the NRC to relicense existing nuclear plants that meet or exceed safety standards.
• Direct the Secretary of Energy and the Administrator of the Environmental Protection Agency to assess the potential of nuclear energy to improve air quality.
• Increase resources as necessary for nuclear safety enforcement in light of the potential increase in generation.
• Use the best science to provide a deep geologic repository for nuclear waste. • Support legislation clarifying that qualified funds set aside by plant owners for eventual
decommissioning will not be taxed as part of the transaction. • Support legislation to extend the Price–Anderson Act.
★ The NEPD Group recommends that, in the context of developing advanced nuclear fuel cycles and next generation technologies for nuclear energy, the United States should reexamine its policies to allow for research, development and deployment of fuel conditioning methods (such as pyroprocessing) that reduce waste streams and enhance proliferation resistance. In doing so, the United States will continue to discourage the accumulation of separated plutonium, worldwide.
★ The United States should also consider technologies (in collaboration with international partners with highly developed fuel cycles and a record of close cooperation) to develop reprocessing and fuel treatment technologies that are cleaner, more efficient, less wasteintensive, and more proliferation-resistant.
Appendix One

SUMMARY OF RECOMMENDATIONS
CHAPTER FIVE ★ The NEPD Group recognizes there is a need to reduce the time and cost of the hydropower licensing process. The NEPD Group recommends that the President encourage the Federal Energy Regulatory Commission (FERC) and direct federal resource agencies to make the licensing process more clear and efficient, while preserving environmental goals. In addition, the NEPD Group recognizes the importance of optimizing the efficiency and reliability of existing hydropower facilities and will encourage the Administration to adopt efforts toward that end.
• Support administrative and legislative reform of the hydropower licensing process. • Direct federal resource agencies to reach interagency agreement on conflicting manda
tory license conditions before they submit their conditions to FERC for inclusion in a license.
• Encourage FERC to adopt appropriate deadlines for its own actions during the licensing process.
NATIONAL ENERGY POLICY

SUMMARY OF RECOMMENDATIONS
CHAPTER SIX
Nature’s Power:
Increasing America’s Use of Renewable
and Alternative
Energy
★ The NEPD Group recommends that the President direct the Secretaries of the Interior and Energy to re-evaluate access limitations to federal lands in order to increase renewable energy production, such as biomass, wind, geothermal, and solar.
★ The NEPD Group supports the increase of $39.2 million in the FY 2002 budget amendment for the Department of Energy’s Energy Supply account that would provide increased support for research and development of renewable energy resources.
★ The NEPD Group recommends that the President direct the Secretary of Energy to conduct a review of current funding and historic performance of renewable energy and alternative energy research and development programs in light of the recommendations of this report. Based on this review, the Secretary of Energy is then directed to propose appropriate funding of those research and development programs that are performance-based and are modeled as public-private partnerships.
★ The NEPD Group recommends that the President direct the Secretary of the Treasury to work with Congress on legislation to expand the section 29 tax credit to make it available for new landfill methane projects. The credit could be tiered, depending on whether a landfill is already required by federal law to collect and flare its methane emissions due to local air pollution concerns.
★ The NEPD Group recommends that the President direct the Secretary of the Interior to determine ways to reduce the delays in geothermal lease processing as part of the permitting review process.
★ The NEPD Group recommends that the President direct the Administrator of the Environmental Protection Agency to develop a new renewable energy partnership program to help companies more easily buy renewable energy, as well as receive recognition for the environmental benefits of their purchase, and help consumers by promoting consumer choice programs that increase their knowledge about the environmental benefits of purchasing renewable energy.
★ The NEPD Group recommends that the President direct the Secretary of the Treasury to work with Congress on legislation to extend and expand tax credits for electricity produced using wind and biomass. The President’s budget request extends the present 1.7 cents per kilowatt hour tax credit for electricity produced from wind and biomass; expands eligible biomass sources to include forest-related sources, agricultural sources, and certain urban sources; and allows a credit for electricity produced from biomass co-fired with coal.
★ The NEPD Group recommends that the President direct the Secretary of the Treasury to work with Congress on legislation to provide a new 15 percent tax credit for residential solar energy property, up to a maximum credit of $2,000.
★ The NEPD Group recommends that the President direct the Secretaries of the Interior and Energy to work with Congress on legislation to use an estimated $1.2 billion of bid bonuses from the environmentally responsible leasing of ANWR for funding research into alternative and renewable energy resources, including wind, solar, geothermal, and biomass.
★ The NEPD Group recommends that the President direct the Secretary of the Treasury to work with Congress to continue the ethanol excise tax exemption.
Appendix One

SUMMARY OF RECOMMENDATIONS
CHAPTER SIX ★ The NEPD Group recommends that the President direct the Secretary of Energy to develop next-generation technology—including hydrogen and fusion. • Develop an education campaign that communicates the benefits of alternative forms of energy, including hydrogen and fusion. • Focus research and development efforts on integrating current programs regarding hydrogen, fuel cells, and distributed energy. • Support legislation reauthorizing the Hydrogen Energy Act.
★ The NEPD Group recommends that the President direct the Secretary of the Treasury to work with Congress to develop legislation to provide for a temporary income tax credit available for the purchase of new hybrid or fuel-cell vehicles between 2002 and 2007.
★ The NEPD Group recommends that the President direct the Administrator of the Environmental Protection Agency to issue guidance to encourage the development of well-designed combined heat and power (CHP) units that are both highly efficient and have low emissions. The goal of this guidance would be to shorten the time needed to obtain each permit, provide certainty to industry by ensuring consistent implementation across the country, and encourage the use of these cleaner, more efficient technologies.
NATIONAL ENERGY POLICY

SUMMARY OF RECOMMENDATIONS
CHAPTER SEVEN
America’s Energy
Infrastructure: A
Comprehensive Delivery System
★ The NEPD Group recommends that the President direct the Secretary of Energy to work with the Federal Energy Regulatory Commission (FERC) to improve the reliability of the interstate transmission system and to develop legislation providing for enforcement by a self-regulatory organization subject to FERC oversight.
★ The NEPD Group recommends that the President direct the Secretary of Energy to expand the Department’s research and development on transmission reliability and superconductivity.
★ The NEPD Group recommends that the President direct the Secretary of Energy to authorize the Western Area Power Administration to explore relieving the “Path 15” bottleneck through transmission expansion financed by nonfederal contributions.
★ The NEPD Group recommends that the President direct the appropriate federal agencies to take actions to remove constraints on the interstate transmission grid and allow our nation’s electricity supply to meet the growing needs of our economy. • Direct the Secretary of Energy, by December 31, 2001, to examine the benefits of
establishing a national grid, identify transmission bottlenecks, and identify measures to remove transmission bottlenecks.
• Direct the Secretary of Energy to work with FERC to relieve transmission constraints by encouraging the use of incentive rate-making proposals.
• Direct the federal utilities to determine whether transmission expansions are necessary to remove constraints. The Administration should review the Bonneville Power Administration’s (BPA’s) capital and financing requirements in the context of its membership in a regional RTO, and if additional Treasury financing appears warranted or necessary in the future, the Administration should seek an increase in BPA’s borrowing authority at that time.
• Direct the Secretary of Energy, in consultation with appropriate federal agencies and state and local government officials, to develop legislation to grant authority to obtain rights-of-way for electricity transmission lines, with the goal of creating a reliable national transmission grid. Similar authority already exists for natural gas pipelines in recognition of their role in interstate commerce.
★ The NEPD Group recommends that the President direct the Secretary of the Interior to work with Congress and the State of Alaska to put in place the most expeditious process for renewal of the Trans-Alaskan Pipeline System lease to ensure that Alaskan oil continues to flow uninterrupted to the West Coast of the United States.
★ The NEPD Group recommends that the President direct the Secretaries of Energy and State, coordinating with the Secretary of the Interior and the Federal Energy Regulatory Commission, to work closely with Canada, the State of Alaska, and all other interested parties to expedite the construction of a pipeline to deliver natural gas to the lower 48 states. This should include proposing to Congress any changes or waivers of law pursuant to the Alaska Natural Gas Transportation Act of 1976 that may be required.
★ The NEPD Group recommends that the President support legislation to improve the safety of natural gas pipelines, protect the environment, strengthen emergency preparedness and inspections and bolster enforcement.
Appendix One

SUMMARY OF RECOMMENDATIONS
CHAPTER SEVEN ★ The NEPD Group recommends that the President direct agencies to continue their interagency efforts to improve pipeline safety and expedite pipeline permitting in an environmentally sound manner and encourage FERC to consider improvements in the regulatory process governing approval of interstate natural gas pipeline projects.
★ The NEPD Group recommends that the President direct the Administrator of the EPA to study opportunities to maintain or improve the environmental benefits of state and local “boutique” clean fuel programs while exploring ways to increase the flexibility of the fuels distribution infrastructure, improve fungibility, and provide added gasoline market liquidity. In concluding this study, the Administrator shall consult with the Departments of Energy and Agriculture, and other agencies as needed.
★ The NEPD Group recommends that the President direct the Administrator of the Environmental Protection Agency and the Secretary of Energy to take steps to ensure America has adequate refining capacity to meet the needs of consumers. • Provide more regulatory certainty to refinery owners and streamline the permitting
process where possible to ensure that regulatory overlap is limited. • Adopt comprehensive regulations (covering more than one pollutant and require
ment) and consider the rules’ cumulative impacts and benefits.
★ The NEPD Group recommends that the President direct the Administrator of the Environmental Protection Agency, in consultation with the Secretary of Energy and other relevant agencies, to review New Source Review regulations, including administrative interpretation and implementation, and report to the President within 90 days on the impact of the regulations on investment in new utility and refinery generation capacity, energy efficiency, and environmental protection.
★ The NEPD Group recommends that the President direct the Attorney General to review existing enforcement actions regarding New Source Review to ensure that the enforcement actions are consistent with the Clean Air Act and its regulations.
★ The NEPD Group supports the President’s budget proposal to provide $8 million to maintain the two-million-barrel Northeast Heating Oil Reserve. Operated by the private sector, the Reserve helps ensure adequate supplies of heating oil in the event that colder than normal winters occur in the Northeast United States.
NATIONAL ENERGY POLICY

SUMMARY OF RECOMMENDATIONS
CHAPTER 8 Strengthening
Global Alliances:
Enhancing National
Energy Security and International Relationships
★ The NEPD Group recommends that the President make energy security a priority of our trade and foreign policy.
★ The NEPD Group recommends the President support initiatives by Saudi Arabia, Kuwait, Algeria, Qatar, the UAE, and other suppliers to open up areas of their energy sectors to foreign investment.
★ The NEPD Group recommends that the President direct the Secretaries of State, Energy and Commerce work to improve dialogue among energy producing and consuming nations.
★ The NEPD Group recommends that the President direct the Secretaries of State, Commerce, and Energy to continue supporting American energy firms competing in markets abroad and use our membership in multilateral organizations, such as the Asia-Pacific Economic Cooperation (APEC) forum, the Organization for Economic Cooperation and Development (OECD), the World Trade Organization (WTO) Energy Services Negotiations, the Free Trade Area of the Americas (FTAA), and our bilateral relationships to implement a system of clear, open, and transparent rules and procedures governing foreign investment; to level the playing field for U.S. companies overseas; and to reduce barriers to trade and investment.
★ The NEPD Group recommends that the President direct the Secretaries of Commerce and Energy, and the U.S. Trade Representative, to support a sectoral trade initiative to expand investment and trade in energy-related goods and services that will enhance exploration, production, and refining, as well as the development of new technologies.
★ The NEPD Group recommends that the President direct the Secretaries of State, Treasury, and Commerce to initiate a comprehensive review of sanctions. Energy security should be one of the factors considered in such a review.
★ The NEPD Group recommends that the President direct the Secretaries of State, Commerce, and Energy to engage in a dialogue through the North American Energy Working Group to develop closer energy integration among Canada, Mexico, and the United States and identify areas of cooperation, fully consistent with the countries’ respective sovereignties.
★ The NEPD Group recommends that the President direct the Secretaries of Energy and State, in consultation with the Federal Energy Regulatory Commission, to review their respective oil, natural gas, and electricity cross-boundary “Presidential Permitting” authorities, and to propose reforms as necessary in order to make their own regulatory regimes more compatible for cross-border trade.
★ The NEPD Group recommends that the President direct the Secretaries of Energy and State, coordinating with the Secretary of the Interior and the Federal Energy Regulatory Commission, to work closely with Canada, the State of Alaska, and all other interested parties to expedite the construction of a pipeline to deliver natural gas to the lower 48 states. This should include proposing to Congress any changes or waivers of law pursuant to the Alaska Natural Gas Transportation Act of 1976 that
Appendix One

SUMMARY OF RECOMMENDATIONS
CHAPTER EIGHT may be required.
★ The NEPD Group recommends that the President direct the Secretaries of State and Commerce to conclude negotiations with Venezuela on a Bilateral Investment Treaty, and propose formal energy consultations with Brazil, to improve the energy investment climate for the growing level of energy investment flows between the United States and each of these countries.
★ The NEPD Group recommends that the President direct the Secretaries of Energy, Commerce, and State to work through the Summit of the Americas Hemispheric Energy Initiative to develop effective and stable regulatory frameworks and foster reliable supply sources of all fuels within the region.
★ The NEPD Group recommends that the President direct the Secretaries of State, Energy, and Commerce to reinvigorate the U.S.-Africa Trade and Economic Cooperation Forum and the U.S.-African Energy Ministerial process; deepen bilateral and multilateral engagement to promote a more receptive environment for U.S. oil and gas trade, investment, and operations; and promote geographic diversification of energy supplies, addressing such issues as transparency, sanctity of contracts, and security.
★ The NEPD Group recommends that the President direct the Secretaries of State, Commerce, and Energy to support more transparent, accountable, and responsible use of oil resources in African producer countries to enhance the stability and security of trade and investment environments.
★ The NEPD Group recommends that the President direct the Secretaries of State, Commerce, and Energy to support the BTC oil pipeline as it demonstrates its commercial viability.
★ The NEPD Group recommends that the President direct the Secretaries of Commerce, State, and Energy to continue working with relevant companies and countries to establish the commercial conditions that will allow oil companies operating in Kazakhstan the option of exporting their oil via the BTC pipeline.
★ The NEPD Group recommends that the President direct the Secretaries of State, Commerce, and Energy to support the efforts of private investors and regional governments to develop the Shah Deniz gas pipeline as a way to help Turkey and Georgia diversify their natural gas supplies and help Azerbaijan export its gas via a pipeline that will continue diversification of secure energy supply routes.
★ The NEPD Group recommends that the President direct appropriate federal agencies to complete the current cycle of oil spill response readiness workshops and to consider further appropriate steps to ensure the implementation of the workshops’ recommendations.
★ The NEPD Group recommends that the President direct the Secretary of State to encourage Greece and Turkey to link their gas pipeline systems to allow European consumers to diversify their gas supplies by purchasing Caspian gas.
NATIONAL ENERGY POLICY

SUMMARY OF RECOMMENDATIONS
★ The NEPD Group recommends that the President direct the Secretaries of Commerce, Energy, and State to deepen their commercial dialogue with Kazakhstan, Azerbaijan, and other Caspian states to provide a strong, transparent, and stablebusiness climate for energy and related infrastructure projects.
★ The NEPD Group recommends that the President direct the Secretaries of State,Commerce, and Energy to deepen the focus of the discussions with Russia on energyand the investment climate.
★ The NEPD Group recommends that the President direct the Secretaries of Commerce, State, and Energy to assist U.S. companies in their dialogue on the investmentand trade climate with Russian officials, to encourage reform of the PSA law and otherregulations and related tax provisions, as well as general improvements in the overallinvestment climate. This will help expand private investment opportunities in Russiaand will increase the international role of Russian firms.
★ The NEPD Group recommends that the President direct the Secretaries of State,Commerce, and Energy to continue to work in the APEC Energy Working Group to examine oil market data transparency issues and the variety of ways petroleum stockscan be used as an option to address oil market disruptions.
★ The NEPD Group recommends that the President direct the Secretaries of State andEnergy to work with India’s Ministry of Petroleum and Natural Gas to help India maximize its domestic oil and gas production.
★ The NEPD Group recommends that the President direct the Secretaries of Commerce, State, and Energy to promote market-based solutions to environmental concerns; support exports of U.S. clean energy technologies and encourage their overseasdevelopment; engage bilaterally and multilaterally to promote best practices; explorecollaborative international basic research and development in energy alternatives andenergy-efficient technologies; and explore innovative programs to support the globaladoption of these technologies.
★ The NEPD Group recommends that the President direct federal agencies to supportcontinued research into global climate change; continue efforts to identify environmentally and cost-effective ways to use market mechanisms and incentives; continuedevelopment of new technologies; and cooperate with allies, including through international processes, to develop technologies, market-based incentives, and other innovative approaches to address the issue of global climate change.
★ The NEPD Group recommends that the President seek to increase international cooperation on finding alternatives to oil, especially for the transportation sector.
★ The NEPD Group recommends that the President direct the Secretary of State to reinvigorate its dialogue with the European Union on energy issues, and resume the consultative process this year in Washington.
★ The NEPD Group recommends that the President promote a coordinated approachto energy security by calling for an annual meeting of G-8 Energy Ministers or theirequivalents.
Appendix One

SUMMARY OF RECOMMENDATIONS
CHAPTER EIGHT
★ The NEPD Group recommends that the President reaffirm that the SPR is designed for addressing an imminent or actual disruption in oil supplies, and not for managing prices.
★ The NEPD Group recommend that the President direct the Secretary of Energy to work within the International Energy Agency (IEA) to ensure that member states fulfill their stockholding.
★ The NEPD Group recommends that the President direct the Secretary of Energy to encourage major oil-consuming countries that are not IEA members to consider strategic stocks as an option for addressing potential supply disruptions. In this regard, we should work closely with Asian economies, especially through APEC.
★ The NEPD Group recommends that the President direct the Secretary of Energy offer to lease excess SPR storage facilities to countries (both IEA and non-IEA members) that might not otherwise build storage facilities or hold sufficient strategic stocks, consistent with statutory authorities.
★ The NEPD Group recommends that the President, at such time that exchanged SPR barrels are returned to the SPR, should determine whether offshore Gulf of Mexico royalty oil deposits to the SPR should be resumed, thereby increasing the size of our reserve.
★ The NEPD Group recommends that the President direct the Secretary of Energy to work closely with Congress to ensure that our SPR protection is maintained.
★ The NEPD Group recommends that the President direct the Secretary of Energy to work with producer and consumer country allies and the IEA to craft a more comprehensive and timely world oil data reporting system.
NATIONAL ENERGY POLICY

Glossary Barrel (Oil): A unit of volume equal to 42 U.S. gallons.
Barrels per Day (Operable Refinery Capacity): The maximum number of barrels of input that can be processed during a 24-hour period after making allowances for the following limitations: the capability of downstream facilities to absorb the output of crude oil processing facilities of a given refinery (no reduction is made when a planned distribution of intermediate streams through other than downstream facilities is part of a refinery’s normal operation); the types and grades of inputs to be processed; the types and grades of products to be manufactured; the environmental constraints associated with refinery operations; the reduction of capacity for scheduled downtime, such as routine inspection, mechanical problems, maintenance, repairs, and turnaround; and the reduction of capacity for unscheduled downtime, such as mechanical problems, repairs, and slowdowns.
Biomass: Organic nonfossil material of biological origin constituting a renewable energy source.
British Thermal Unit (Btu): The quantity of heat needed to raise the temperature of 1 pound of water by 1°F at or near 39.2°F.
Coal: A readily combustible black or brownish-black rock whose composition, including inherent moisture, consists of more than 50 percent by weight and more than 70 percent by volume of carbonaceous material. It is formed from plant remains that have been compacted, hardened, chemically altered, and metamorphosed by heat and pressure over geologic time.
Cogeneration: The production of electricity and another form of useful energy (such as heat or steam) used for industrial, commercial, heating, or cooling purposes.
Commercial Building: A building with more than 50 percent of its floor space used for commercial activities. Commercial buildings include stores, offices, schools, churches, gymnasiums, libraries, museums, hospitals, clinics, warehouses, and jails. Government buildings are also included, except buildings on military bases or reservations.
Commercial Sector: Business establishments that are not engaged in transportation or in manufacturing or other types of industrial activity (agriculture, mining, or construction). Commercial establishments include hotels, motels, restaurants, wholesale businesses, retail stores, laundries, and other service enterprises; religious and nonprofit organizations; health, social, and educational institutions; and federal, state, and local governments. Streetlights, pumps, bridges, and public services are also included if the establishment operating them is considered commercial.
Conversion Factor: A number that translates units of one system into corresponding values of another system. Conversion factors can be used to translate physical units of measure for various fuels into Btu equivalents.
Glossary • Appendix Two

Crude Oil: A mixture of hydrocarbons that exists in liquid phase in natural underground reservoirs and remains liquid at atmospheric pressure after passing through surface separating facilities. Crude oil may also include:
• Small amounts of hydrocarbons that exist in the gaseous phase in natural underground reservoirs but are liquid at atmospheric pressure after being recovered from oil well (casing head) gas in lease separators and that subsequently are commingled with the crude stream without being separately measured.
• Small amounts of nonhydrocarbons produced with the oil, such as sulfur and other compounds
Crude Oil Stocks: Stocks of crude oil and lease condensate held at refineries, in pipelines, at pipeline terminals, and on leases.
District Heat: Steam or hot water from an outside source used as an energy source in a building. The steam or hot water is produced in a central plant and is piped into the building. District heat may be purchased from a utility or provided by a physical plant in a separate building that is part of the same facility (for example, a hospital complex or university).
Electric Power Plant: A station containing prime movers, electric generators, and auxiliary equipment for converting mechanical, chemical, and/or fission energy into electric energy.
Electricity Generation: The process of producing electric energy or transforming other forms of energy into electric energy. Also, the amount of electric energy produced or expressed in watt-hours (Wh).
End-Use Sectors: The residential, commercial, industrial, and transportation sectors of the economy.
Energy: The capacity for doing work as measured by the capability of doing work (potential energy), or the conversion of this capability to motion (kinetic energy). Energy has several forms, some of which are easily convertible and can be changed to another form useful for work. Most of the world’s convertible energy comes from fossil fuels that are burned to produce heat that is then used as a transfer medium to mechanical or other means in order to accomplish tasks. Electrical energy is usually measured in kilowatt-hours, while heat energy is usually measured in British thermal units.
Energy Consumption: The use of energy as a source of heat or power or as an input in the manufacturing process.
Energy Source: A substance, such as oil, natural gas, or coal, that supplies heat or power. Electricity and renewable forms of energy, such as wood, waste, geothermal, wind, and solar, are considered to be energy sources.
Exports: Shipments of goods from the 50 states and the District of Columbia to foreign countries and to Puerto Rico, the Virgin Islands, and other U.S. possessions and territories.
Federal Energy Regulatory Commission (FERC): The federal agency with jurisdiction over interstate electricity sales, wholesale electric rates, hydroelectric licensing, natural gas pricing, oil pipeline rates, and gas pipeline certification. FERC is an independent regulatory agency within the Department of Energy and is the successor to the Federal Power Commission.
NATIONAL ENERGY POLICY

Fossil Fuel: Any naturally occurring organic fuel formed in the Earth’s crust, such as oil, coal, and natural gas.
Fuel Ethanol: An anhydrous, denatured aliphatic alcohol intended for motor gasoline blending.
Gas-Turbine Electric Power Plant: A plant in which the prime mover is a gas turbine. A gas turbine typically consists of an axial-flow air compressor and one or more combustion chambers where liquid or gaseous fuel is burned. The hot gases expand to drive the generator and then are used to run the compressor.
Geothermal Energy: Energy from the internal heat of the Earth, which may be residual heat, friction heat, or a result of radioactive decay. The heat is found in rocks and fluids at various depths and can be extracted by drilling or pumping.
Gross Domestic Product (GDP): The total value of goods and services produced by labor and property located in the United States.
Hydrocarbon: An organic chemical compound of hydrogen and carbon in the gaseous, liquid, or solid phase. The molecular structure of hydrocarbon compounds varies from the simplest (methane, a constituent of natural gas) to the very heavy and very complex.
Hydropower: The production of electricity from the kinetic energy of falling water.
Hydropower Plant: A plant in which the turbine generators are driven by falling water.
Independent Power Producer: Wholesale electricity producers (other than qualifying facilities under the Public Utilities Regulatory Policies Act of 1978) that are unaffiliated with franchised utilities in the area in which the independent power producers are selling power and that lack significant marketing power. Unlike traditional electric utilities, independent power producers do not possess transmission facilities that are essential to their customers and do not sell power in any retail service territory where they have a franchise.
Industrial Sector: Manufacturing industries, which make up the largest part of the sector, along with mining, construction, agriculture, fisheries, and forestry. Establishments in this sector range from steel mills, to small farms, to companies assembling electronic components.
Jet Fuel: A refined petroleum product used in jet aircraft engines. It includes kerosenetype jet fuel and naphtha-type jet fuel.
Methane: Hydrocarbon gas, which is the major component of natural gas.
Methanol: A light, volatile alcohol eligible for motor gasoline blending.
Methyl Tertiary Butyl Ether (MTBE): An ether, intended for motor gasoline blending.
Glossary • Appendix Two

Natural Gas: A gaseous mixture of hydrocarbon compounds, primarily methane, delivered via pipeline for consumption. It is used as a fuel for electricity generation, a variety of uses in buildings, and as raw material input and fuel for industrial processes. Note: This product, also referred to as dry natural gas or consumer-grade natural gas, is the product that remains after wet natural gas has been processed at lease facilities and/or natural gas processing plants. This processing removes nonhydrocarbon gases (e.g., water vapor, carbon dioxide, helium, hydrogen sulfide, and nitrogen) that would otherwise make the gas unmarketable and natural gas liquids.
Natural Gas, Dry: The marketable portion of natural gas production, which is obtained by subtracting extraction losses, including natural gas liquids removed at natural gas processing plants, from total production.
Natural Gas, Wet: A mixture of hydrocarbon compounds and small quantities of various nonhydrocarbons existing in the gaseous phase or in solution with crude oil in porous rock formations at reservoir conditions. The principal hydrocarbons normally contained in the mixture are methane, ethane, propane, butane, and pentanes. Typical nonhydrocarbon gases that may be present in reservoir natural gas are water vapor, carbon dioxide, helium, hydrogen sulfide, and nitrogen. Under reservoir conditions, natural gas and the liquefiable portions occur either in a single gaseous phase in the reservoir or in solution with oil and are not distinguishable at the time as separate substances.
Nitrogen Oxides (NOx): Compounds of nitrogen and oxygen produced by the burning of fossil fuels.
North American Electric Reliability Council (NERC): A council formed in 1968 by the electric utility industry to promote the reliability and adequacy of bulk power supply in the electric utility systems of North America. The NERC consists of ten regional reliability councils and encompasses essentially all the power systems of the contiguous United States and Canada.
Nuclear Electric Power: Electricity generated by an electric power plant whose turbines are driven by steam generated in a reactor by heat from the fissioning of nuclear fuel.
Organization for Economic Cooperation and Development (OECD): Current members are Australia, Austria, Belgium, Canada, Czech Republic, Denmark and its territories (Faroe Islands and Greenland), Finland, France, Germany, Greece, Greenland, Hungary, Iceland, Ireland, Italy, Japan, Luxembourg, Mexico, the Netherlands, New Zealand, Norway, Poland, Portugal, South Korea, Spain, Sweden, Switzerland, Turkey, United Kingdom, and United States and its territories (Guam, Puerto Rico, and Virgin Islands).
Organization of Petroleum Exporting Countries (OPEC): Countries that have organized for the purpose of negotiating with oil companies on matters of oil production, prices, and future concession rights. Current members are Algeria, Indonesia, Iran, Iraq, Kuwait, Libya, Nigeria, Qatar, Saudi Arabia, United Arab Emirates, and Venezuela.
Photovoltaic Energy: Direct-current electricity generated from sunlight through solidstate semiconductor devices that have no moving parts.
NATIONAL ENERGY POLICY

Pipeline, Natural Gas: A continuous pipe conduit, complete with such equipment as valves, compressor stations, communications systems, and meters, for transporting natural gas and/or supplemental gaseous fuels from one point to another, usually from a point in or beyond the producing field or processing plant to another pipeline or to points of use. Also refers to a company operating such facilities.
Pipeline, Oil: Oil and product pipelines (including interstate, intrastate, and intracompany pipelines) used to transport oil and petroleum products, respectively, within the 50 states and the District of Columbia.
Proved Reserves, Oil: The estimated quantities of all liquids defined as crude oil that geological and engineering data demonstrate with reasonable certainty to be recoverable in future years from known reservoirs under existing economic and operating conditions.
Proved Reserves, Natural Gas: The estimated quantities of natural gas that analysis of geological and engineering data demonstrates with reasonable certainty to be recoverable in future years from known reservoirs under existing economic and operating conditions.
Refinery (Oil): An installation that manufactures finished fuels from oil, unfinished oils, natural gas liquids, other hydrocarbons, and alcohol.
Renewable Energy: Energy obtained from sources that are essentially inexhaustible (unlike, for example, fossil fuels, of which there is a finite supply). Renewable sources of energy include conventional hydroelectric power, wood, waste, geothermal, wind, photovoltaic, and solar thermal energy.
Spot Price: The price for a one-time open market transaction for immediate delivery of the specific quantity of product at a specific location where the commodity is purchased “on the spot” at current market rates.
Strategic Petroleum Reserve (SPR): Petroleum stocks maintained by the federal government for use during periods of major supply interruption.
Stocks: Supplies of fuel or other energy source(s) stored for future use. Stocks are reported as of the end of the reporting period.
Sulfur Dioxide (SO2): A toxic, colorless gas soluble in water, alcohol, and ether. Used as
a chemical intermediate in paper pulping and ore refining, and as a solvent.
Transportation Sector: Private and public vehicles that move people and commodities. Included are automobiles, trucks, buses, motorcycles, railroads, and railways (including streetcars), aircraft, ships, barges, and natural gas pipelines.
Wellhead Price: The price of oil or natural gas at the mouth of the well.
Wind Energy: The kinetic energy of wind converted into mechanical energy by wind turbines (i.e., blades rotating from a hub) that drive generators to produce electricity.
Wood Energy: Wood and wood products used as fuel, including round wood (cord wood), limb wood, wood chips, bark, sawdust, forest residues, charcoal, pulp waste, and spent pulping liquor.
Glossary • Appendix Two
