national food security mission executive committee meeting date: 16 th may, 2012 gujarat state
DESCRIPTION
National Food Security Mission Executive Committee Meeting Date: 16 th May, 2012 GUJARAT STATE Presented by : S.J. Solanki Jt. Dir. Agri (Pulse), Guj . State., Gandhinagar. Area Production and Productivity statistics for NFSM districts of Gujarat State from 2006-07 to 2011-12. - PowerPoint PPT PresentationTRANSCRIPT

NationalFood
SecurityMission
Executive Committee Meeting
Date: 16th May, 2012
GUJARAT STATE
Presented by :S.J. Solanki
Jt. Dir. Agri(Pulse),Guj. State., Gandhinagar.

Area Production and Productivity statistics
for NFSM districts of Gujarat State from 2006-07 to 2011-12

Area, Production and Yield statistics of Gujarat State(Area in lakh ha, Prod. In lakh MT & Yield in Kg/ha)
Year DistrictsRice Wheat Pulses
A P Y A P Y A P Y
2006-07 NFSM Districts 1.17 0.90 783 3.61 8.28 2294 3.08 1.79 632
Non-NFSM Districts 5.73 10.51 1025 7.11 19.63 2760 5.18 3.72 739
2007-08 NFSM Districts 1.18 1.23 1042 4.17 10.40 2492 6.63 5.69 858
Non-NFSM Districts 6.41 13.52 2109 8.57 27.98 3266 2.18 1.75 803
2008-09 NFSM Districts 1.09 0.78 715 3.50 6.57 1876 5.61 4.32 771
Non-NFSM Districts 6.39 12.25 1918 7.41 19.36 2611 2.23 1.77 793
2009-10 NFSM Districts 0.91 0.38 419 3.34 8.22 2458 5.32 3.86 725
Non-NFSM Districts 5.88 12.55 2133 5.44 15.30 2813 2.04 1.34 659
2010-11 NFSM Districts 1.07 0.93 872 5.49 14.60 26618.90 7.22 811
Non-NFSM Districts 7.01 15.73 2242 10.40 35.53 3417
2011-12* NFSM Districts 1.06 0.92 863 5.13
15.89
3100
9.43 7.58 804 Non-NFSM
Districts 6.22 13.32 2142 8.03 24.89 3100
Note: Data of Area , Production & Yield is based on final forecast.
*as per 3rd advance estimates year 2011-12.
# All districts of Gujarat State are covered under pulses from 2010-11


Physical & Financial
Progress Report
NFSM
Year 2011-12

Grant Received During Year 2011-12 & Achievement
(Rs. In lakh)
Sr No Year CropTotal grant available
Grant Utilized
% Achievemen
t
1
2011-12
NFSM-Rice 189.50 193.66 102.20
2 NFSM-Wheat 613.39 534.34 87.11
3 NFSM-Pulse 1351.62 1445.87 106.97
4 A3P 803.00 748.78 93.25
TOTAL 2957.51 2922.64 98.82

Financial Statement of Year 2011-12 (NFSM scheme)
Rs. In lakh
CROP
Total Provision for 2011-
12
Unspent as on
01/04/2011
Fund Released in year 2011-
12
Total Fund
available
Expenditure during year
2011-12
Rice 189.50 71.00 118.50 189.50 193.66
Wheat 614.89 6.00 607.39 613.39 534.34
Pulse 1351.62 -199.00 1550.62 1351.62 1445.87
SUBTOTAL 2156.01 -122.00 2276.51 2154.51 2173.87
A3P 870.30 248.00 555.00 803.00 748.78
TOTAL 3026.31 126.00 2831.51 2957.51 2922.64
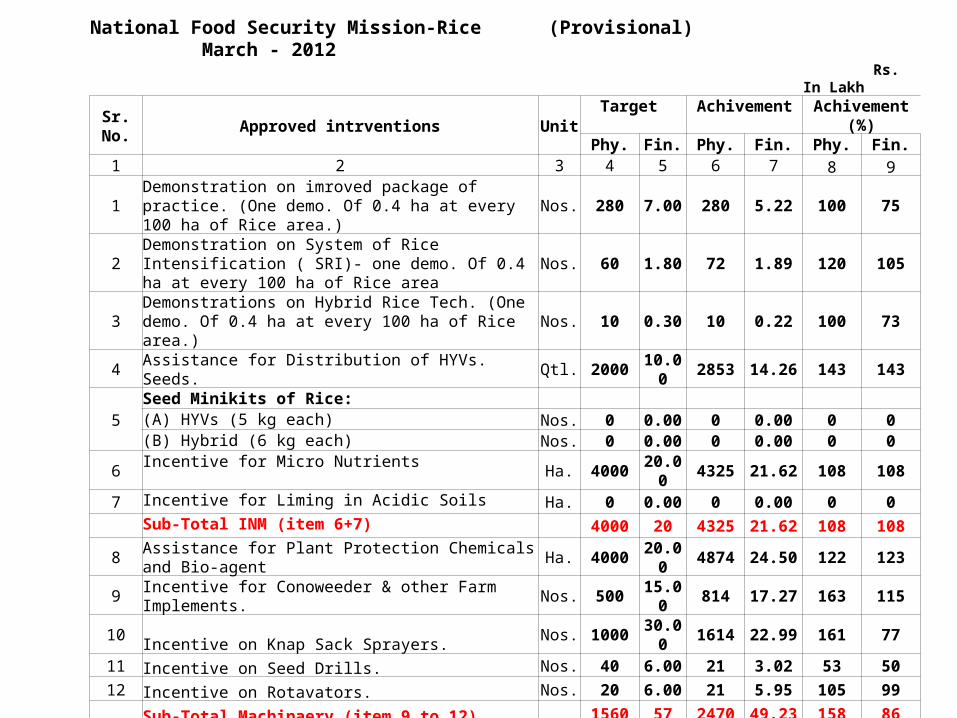
National Food Security Mission-Rice (Provisional) March - 2012 Rs. In Lakh
Sr. No. Approved intrventions UnitTarget Achivement Achivement (%)
Phy. Fin. Phy. Fin. Phy. Fin.1 2 3 4 5 6 7 8 9
1Demonstration on imroved package of practice. (One demo. Of 0.4 ha at every 100 ha of Rice area.) Nos. 280 7.00 280 5.22 100 75
2 Demonstration on System of Rice Intensification ( SRI)- one demo. Of 0.4 ha at every 100 ha of Rice area
Nos. 60 1.80 72 1.89 120 105
3 Demonstrations on Hybrid Rice Tech. (One demo. Of 0.4 ha at every 100 ha of Rice area.)
Nos. 10 0.30 10 0.22 100 73
4 Assistance for Distribution of HYVs. Seeds. Qtl. 2000 10.00 2853 14.26 143 143
5Seed Minikits of Rice: (A) HYVs (5 kg each) Nos. 0 0.00 0 0.00 0 0(B) Hybrid (6 kg each) Nos. 0 0.00 0 0.00 0 0
6 Incentive for Micro Nutrients Ha. 4000 20.00 4325 21.62 108 1087 Incentive for Liming in Acidic Soils Ha. 0 0.00 0 0.00 0 0 Sub-Total INM (item 6+7) 4000 20 4325 21.62 108 1088 Assistance for Plant Protection Chemicals and Bio-agent Ha. 4000 20.00 4874 24.50 122 1239 Incentive for Conoweeder & other Farm Implements. Nos. 500 15.00 814 17.27 163 115
10 Incentive on Knap Sack Sprayers. Nos. 1000 30.00 1614 22.99 161 7711 Incentive on Seed Drills. Nos. 40 6.00 21 3.02 53 5012 Incentive on Rotavators. Nos. 20 6.00 21 5.95 105 99 Sub-Total Machinaery (item 9 to 12) 1560 57 2470 49.23 158 86
13 Incentive on Pump Sets Nos. 250 25.00 334 33.25 134 13314 Farmers Trainings (One FFS at every 1000 ha.) Nos. 20 3.40 16 2.11 80 6215 Award for Best Performing Districts Nos. 1 5.00 0 016 Local Initiatives (Activity not specified) Rs. 0 40.00 990 41.36 0 103
TOTAL FINANCE 189.50 193.66 102

National Food Security Mission-Wheat (Provisional) March - 2012 Rs. In (Lakhs)
Sr. No. Intrventions UnitTarget Achivement Achivement (%)
Phy. Fin. Phy. Fin. Phy. Fin.1 2 3 4 5 6 7 8 9
1Demonstration on imroved package of practice (One Demonstration of 0.4 ha at every 50 ha of Wheat area ) Nos. 1300 26.00 1261 22.17 97 85
2 Distribution of Certified Seed of HYVs (SRR) Qtl. 46000 230.00 34700 140.13 75 64
3 Distribution of Seed Minikits of HYVs of Wheat (10 kg each) Nos. 0 0.00 1344 0.00 0 0
4 Incentive for Micro Nutrients Ha. 16000 80.00 12602 57.12 79 71
5 Incentive for Gypsum (Salt affected soils). Ha. 10000 50.00 13065 88.96 131 178
Sub-Total INM (Item 4+5) Ha. 26000 130.00 25667 146.08 99 112
6 Incentive on Knap Sack Sprayers. Nos. 500 15.00 834 10.78 167 72
7 Incentive on Zero Till Seed Drills Nos. 0 0.00 0 0.00 0 0
8 Incentive on Multi-crop Planters Nos. 0 0.00 0 0.00 0 0
9 Incentive on Seed Drills. Nos. 90 10.50 66 9.77 73 9310 Incentive on Rotavators Nos. 210 63.00 320 108.94 152 161
Sub-Total Machinary (Item 6+10) Nos. 800 88.50 1220 129.49 153 138
11 Incentive on Pump Sets Nos. 0 0.00 109 10.90 0 012 Incentive for Sprinkler Sets Ha. 100 7.50 70 3.65 70 49
13 Farmers Trainings (One FFS at every 1000 ha) Nos. 50 8.50 48 7.06 96 83
14 Award for Best performing Districts Nos. of Disst.
1 5.00 0 0.00 0 0
15Miscellaneous Expenses (a) PMT & Other expen. at Dist. level Nos. of
Disst.5 25.52 0 21.90 0 86
(b) PMT & Other expen.at State level Nos. of State
1 13.87 0 2.69 0 19
16 Local Initiative (Activity-wise) Rs. 0 80.00 50 50.27 0 63 TOTAL FINANCE 614.89 534.34 87

National Food Security Mission-Pulses (Provisonal) March - 2012 Rs. In lakhs
Sr. No. Approved intrventions UnitTarget Achivement Achivement (%)
Phy. Fin. Phy. Fin. Phy. Fin.1 2 3 4 5 6 7 8 9
1
Seeds: (i) Purchase of Breeder Seeds of Pulses from ICAR Qtl. 200 10.47 53 4.25 27 41(ii) Production of Foundation Seeds. Qtl. 8000 80.00 1198 11.98 15 15(iii) Production of Certified Seeds. Qtl. 15000 150.00 22736 227.36 152 152Sub-Total (ii+iii) Qtls. 23200 240.47 23987 243.59 103 101(iv) Distribution of Certified seeds Qtl. 20000 240.00 23662 194.44 118 81
2 Organisation of Technology Demo. 0.4 ha. Nos. 0 0.00 978 15.15
3
Intigrated Nutrient Management 0 0 (a) Lime/Gypsum Ha. 10000 75.00 19312 134.75 193 180(b) Micro- Nutrients Ha. 10000 50.00 16909 79.36 169 159(c ) Rizobium Culture/PSB distribution Ha. 10000 10.00 16779 4.38 168 44Sub-Total INM (3-a to 3-c) Ha. 30000 135.00 53000 218.49 177 162
4 Intigrated Pest Management (IPM) Ha. 13000 97.50 14623 77.77 112 805 Assistance for Distribution of P P Chemicals Ha. 13000 65.00 14494 61.64 111 956 weedicide Ha. 500 2.50 595 2.35 119 94 Sub-Total IPM (4 to 6) 26500 165.00 29712 141.76 112 867 Incentive for Knap Sack Sprayers Nos. 500 15.00 1253 15.4 251 1038 Distribution of Seed Drills. Nos. 200 30.00 163 23.63 82 799 Zeero Tillage Seed Drills 10 1.50 2 0.55 20 37
10 Distribution of Rotavators Nos. 300 90.00 450 134.99 150 15011 Lazer Land Leveler Nos. 0 0.00 30 45.00 Sub-Total Machinery (Items 7 to 10) Nos. 1010 136.5 1898 219.57 188 161
12 Distribution of Sprinkler Sets. Ha. 200 15.00 145 7.38 73 4913 Incentive for Pump sets Nos. 500 50.00 895 85.94 179 17214 Insentive for open pipeline Nos. 350 52.50 1377 79.47 393 151
15
(a) Extension, Training including Award to Best Performing District 0 0 (i) Training on Patter of FFS Nos. 110 18.70 412 17.99 375 96(ii) State Level Training of Trainers Nos. 3 3.00 0 0 0 0(iii) Award for Best Performing District No. 1 5.00 0 0 0 0
16 Local Initiative (Activity Not Specified) Rs. 0 220.00 1695 171.95 0 78
17
Miscellaneous Expenses & PMT 0 0 (a)District level (Existing NFSM Disrtict) Rs. 11 49.17 0 23.29 0 47(b)State level Rs. 1 6.28 0 3.56 0 57(c ) Misc. expenses to State for other disrtict 15 15.00 0 23.29 0 155
TOTAL FINANCE 1351.62 1445.87 107

Sr.No. Item Amount (Rs. In lakh)
1 Opening Balance as on 1/4/2011 274.07
2 Fund Received 2831.51
3 Other receipt including interest 2570.66
4 Total Fund 3131.29
5 Provisional expenditure up to 31/3/2012 2934.66
6 Closing Balance as on 31/3/2012 196.63
NFSM Provisional Utilization Certificate for the Year 2011-12 GUJARAT State (Provided by ATMA)
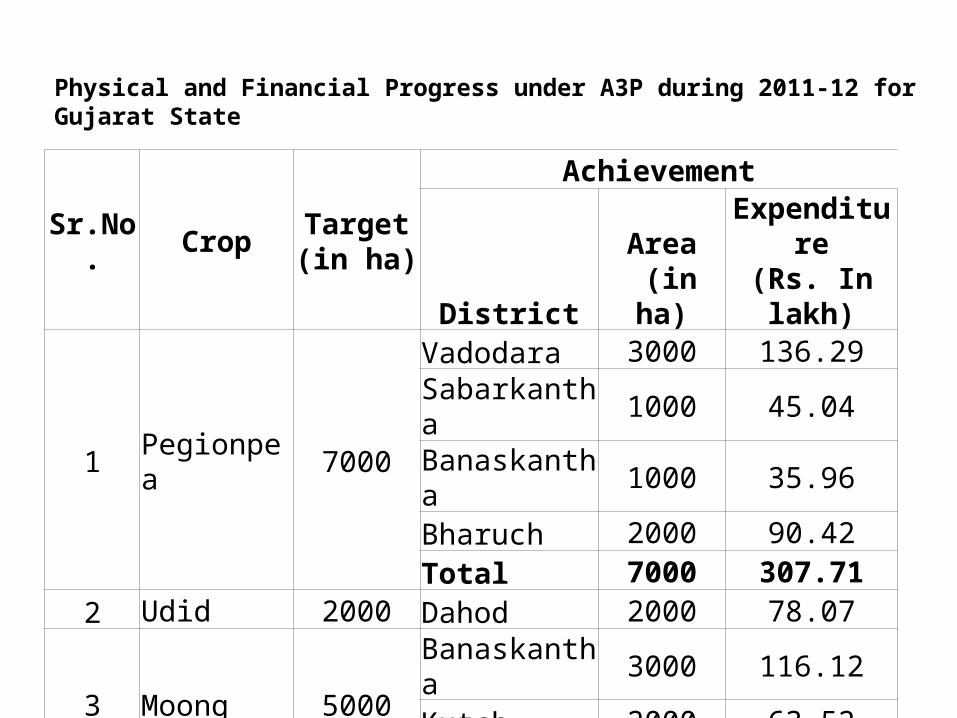
Sr.No. Crop Target(in ha)
Achievement
DistrictArea
(in ha)Expenditure(Rs. In lakh)
1 Pegionpea 7000
Vadodara 3000 136.29Sabarkantha 1000 45.04Banaskantha 1000 35.96Bharuch 2000 90.42Total 7000 307.71
2 Udid 2000 Dahod 2000 78.07
3 Moong 5000Banaskantha 3000 116.12Kutch 2000 63.52Total 5000 179.64
4 Gram 2000 Dahod 2000 105.88 State Total 16000 16000 671.30
Physical and Financial Progress under A3P during 2011-12 for Gujarat State

PMT (Technical Assistants) for NFSM at District Level
Sr. No Districts
Wheat Pulses Total
Sanctioned post
Filled post
Vaccant post
Sanctioned post
Filled post
Vaccant post
Sanctioned post
Filled post
Vaccant post
1 Jamnagar 0 - - 2 0 2 2 0 2
2 Palanpur 4 1 3 2 1 1 6 2 4
3 Himmatnagar 4 1 3 2 0 2 6 1 5
4 Dahod 0 - - 2 0 2 2 0 2
5 Gandhinagar(H.Q.) 2 1 1 2 2 0 4 3 1
6 Bharuch 0 - - 2 0 2 2 0 2
7 Bhuj 0 - - 2 0 2 2 0 2
8 Patan 0 - - 2 2 2 0 2
9 A'bad 4 2 2 0 - - 4 2 2
10 Mahesana 4 2 2 0 - - 4 2 2
11 Vadodara 0 - - 2 2 0 2 2 0
12 Godhara 0 - - 2 1 1 2 1 1
13 Rajpipla 0 - - 2 1 1 2 1 1
14 Surat 0 - - 2 0 2 2 0 2
Total 18 7 11 24 7 17 42 14 28

Proposed Annual Action Plan for 2012-13 for Gujarat State
Sr.No. Component Targets worked out by GOI
Targets suggested by State
1 Rice 238.18 239.01
2 Pulse 1931.90 1994.20
3 Wheat 687.703 752.71
4 A3P 1994.00 1994.00
Total 4851.78 4979.92
(Rs. In lakh)

Special Initiatives and overall impact of NFSM
Timely supply of inputs by periodically co-ordination and monitoring. Well in advance target allocation to district levels. Deputing district level nodal officer of the rank of Joint Director who monitor the progress and implementation of the scheme on weekly bases. Established separate NFSM Cell at State level. Separate bank accounts for NFSM at state and district level. Identification of beneficiaries during Krushi Mahotsav in consultation with village level bodies. Overall production has increased with implementation of NFSM. Farmers welcomed A3P concept

Strategies under NFSM during 2012-13 and input planning for Kharif- 2012
Timely allocation of targets. Instruction for the identifying the beneficiaries during Krushimahotsav- 2012. Meeting for input Planning for Kharif-2012 with the stake holders. Finalization of input package for A3P 2012 with the SAU’s. Efforts for making available PMT at state as well as district level.
Issues to be looked in
Revision in the basic education qualification and experience criteria, highly needed
Relaxation in the age criteria for the certified seed distribution component.
Contegency or miscellaneous expenditure provision should be raised up to 3 lakh and 5 lakh for district and state respectively per year and per crop.
PMT should be provided to all districts and crops in respective of allocation.

Thanks