national hazard exposure worker surveillance · 2020-03-30 · national hazard exposure worker...
TRANSCRIPT

NatioNal Hazard ExposurE WorkEr survEillaNcE: Noise exposure aNd the provisioN of Noise coNtrol measures iN australiaN workplaces
JaNuarY 2010
National Hazard Exposure Worker Surveillance – Noise exposure and the provision of noise control measures in Australian workplaces
Acknowledgement
This report was commissioned and developed by the Australian Safety and Compensation Council (ASCC), which is now known as Safe Work Australia. The survey was administered and data collected by Sweeney Research. The data analyses were undertaken and the report written by Dr Fleur de Crespigny, Safe Work Australia. Dr Warwick Williams provided a peer review of the report.
Disclaimer
The information provided in this document can only assist you in the most general way. This document does not replace any statutory requirements under any relevant State and Territory legislation. Safe Work Australia is not liable for any loss resulting from any action taken or reliance made by you on the information or material contained on this document. Before relying on the material, users should carefully make their own assessment as to its accuracy, currency, completeness and relevance for their purposes, and should obtain any appropriate professional advice relevant to their particular circumstances.
To the extent that the material on this document includes views or recommendations of third parties, such views or recommendations do not necessarily reflect the views of Safe Work Australia or indicate its commitment to a particular course of action.
Copyright Notice
© Commonwealth of Australia 2009 ISBN: 978-0-642-32937-0 [PDF] 978-0-642-32938-7 [RTF]
This work is copyright. Apart from any use as permitted under the Copyright Act 1968, no part may be reproduced by any process without prior written permission from the Commonwealth available from the Attorney-General’s Department. Requests and inquiries concerning reproduction and rights should be addressed to:
Commonwealth Copyright Administration
Attorney-General’s Department
3 - 5 National Circuit
Barton ACT 2600
Email: [email protected]
Web: www.ag.gov.au
i
Foreword
The Australian Safety and Compensation Council (ASCC) (now Safe Work Australia) requested the development and fielding of the National Hazard Exposure Worker Surveillance (NHEWS) survey to determine the current nature and extent of Australian workers’ exposure to selected occupational disease causing hazards. The survey also collected information from workers about the controls that were provided in workplaces to eliminate or reduce these hazards. The results of the NHEWS survey will be used to identify where workplace exposures exist that may contribute to the onset of one or more of the eight priority occupational diseases identified by the National Occupational Health and Safety Commission (NOHSC) in 2004. These diseases are; occupational cancer, respiratory diseases, noise-induced hearing loss, musculoskeletal disorders, mental disorders, cardiovascular disease, infectious and parasitic diseases and contact dermatitis.
The NHEWS survey was developed by the ASCC in collaboration with Australian OHS regulators and a panel of experts. These included Dr Tim Driscoll, Associate Professor Anthony LaMontagne, Associate Professor Wendy Macdonald, Dr Rosemary Nixon, Professor Malcolm Sim and Dr Warwick Williams. The NHEWS survey was the first national survey on exposure to workplace hazards in Australia.
In 2008, Sweeney Research was commissioned to conduct the NHEWS survey using computer assisted telephone interviews (CATI). The data, collected from 4500 workers, forms a national data set of occupational exposures across all Australian industries. The survey was conducted in two stages. The first stage (n=1900) focussed on the five national priority industries as determined by NOHSC in 2003 and 2005. These industries were selected to focus the work under the National Strategy 2002-2012 relating to reducing high incidence and high severity risks. The priority industries are Manufacturing, Transport and storage, Construction, Health and community services and Agriculture, forestry and fishing. The second stage (n = 2600) placed no restrictions on industry.
An initial report on the results of the NHEWS survey can be found on the Safe Work Australia website1. It contains a descriptive overview of the prevalence of exposure to the nine studied occupational hazards within industries and the provision of the various hazard control measures.
This report focuses on the exposure of Australian workers to loud noise and the control measures that are provided in workplaces that eliminate, reduce or control worker exposure to loud noise. The aims of this report are threefold. The first is to describe patterns of exposure to loud noise in conjunction with patterns of noise exposure control provision with respect to industry, occupation and other relevant demographic and employment variables. The second is to make recommendations, where possible, for the development of OHS and workers’ compensation policy. The final aim of this report is to provide researchers in this field with clear and constructive directions for future research.
1 http://www.safeworkaustralia.gov.au/swa/AboutUs/Publications/2008ResearchReports.htm

ii

iii
Contents
Foreword ..............................................................................................................................i
Executive Summary............................................................................................................1
Main findings .....................................................................................................................1
Policy implications.............................................................................................................2
Future research considerations.........................................................................................2
Occupational noise-induced hearing loss: background, data limitations and research objectives ............................................................................................................4
Noise exposure .................................................................................................................5
Noise control measures ....................................................................................................6
Research objectives..........................................................................................................6
Overview of the survey methodology...............................................................................7
NHEWS survey results .......................................................................................................8
Employment and demographic characteristics of Australian workers exposed to loud noise..................................................................................................................................8
Duration of exposure to loud noise .................................................................................16
Employment factors that affected the duration of exposure to loud noise...................17
Noise control measures provided in the workplace.........................................................19
Duration of exposure to loud noise and noise control measures.................................20
What employment factors are important predictors of the provision of noise control measures in the workplace?........................................................................................22
Summary of results ..........................................................................................................29
Policy implications and recommendations....................................................................31
Young workers ................................................................................................................31
Hierarchy of noise control measures...............................................................................31
Workplace size................................................................................................................31
Industry and occupation specific policy implications .......................................................32
Future research...............................................................................................................32
Recommendations for future occupational noise exposure research ........................34
References ........................................................................................................................37
Appendix 1. NHEWS survey methodology.....................................................................39
Survey design .................................................................................................................39
Noise exposure and noise exposure control measures questions ..............................40
iv
Survey administration......................................................................................................40
Data analyses .................................................................................................................41
Duration of exposure data ...........................................................................................41
Noise exposure controls data ......................................................................................42
Multinomial Logistic Regressions ................................................................................42
Appendix 2. Results: statistical analyses and model output .......................................44
Employment and demographic characteristics of Australian workers exposed to loud noise................................................................................................................................44
Duration of exposure to loud noise .................................................................................46
Employment factors that affected the duration of exposure to loud noise...................46
Noise control measures provided in the workplace.........................................................46
Duration of exposure to loud noise and noise control measures.................................46
What employment factors are important predictors of the provision of noise control measures in the workplace?........................................................................................47
List of Figures...................................................................................................................58
List of Tables.....................................................................................................................59
Noise exposure and the provision of noise control measures in Australian workplaces 1
Executive Summary
Occupational noise-induced hearing loss is an entirely preventable but irreversible condition that affects many Australians. The National Hazard Exposure Worker Surveillance (NHEWS) survey gathered nationally representative data on the exposure of Australian workers to loud noise and, for those workers exposed to loud noise, data on the provision of noise exposure control measures in workplaces. It was hoped that this information would enable researchers to identify workers at risk of occupational noise-induced hearing loss and ultimately lead to a reduction in the incidence of this condition with better targeted occupational health and safety (OHS) policy, compliance and information / education campaigns.
This report describes the demographic and employment characteristics of the workers who reported they were exposed to loud noise and the employment characteristics of workers with respect to the types of noise control measures that were provided in their workplace. Only workers in the five national priority industries, Manufacturing, Construction, Agriculture, forestry and fishing, Transport and storage and Health and community services were considered in these analyses. It was beyond the scope of this research to measure the actual exposures of workers to loud noise. Therefore, it is important to note that the data contained in this report cannot be used to assess the risk the reported noise exposures posed to hearing, nor whether or not the control measures provided in workplaces were appropriate for the noise exposure involved.
The main findings and policy implications of these findings are summarised below.
Main findings
1. Between 28% and 32% of the Australian workforce are likely to work in an environment where they are exposed to non-trivial [≥85dB(A)] loud noise generated during the course of their work.
2. Worker sex, age, night work, industry and occupation affected the likelihood that a worker reported exposure to loud noise.
Male workers were more likely to report exposure to loud noise than female workers.
Young workers were more likely to report exposure to loud noise than older workers.
Workers who worked at night were more likely to report that they were exposed to loud noise than workers who worked during the day.
The main industries in which workers reported they were exposed to loud noise were Manufacturing and Construction.
The main occupations in which workers reported they were exposed to loud noise were Technicians and trades workers, Machinery operators and drivers and Labourers.
3. Training on how to prevent hearing damage appears to be underprovided in workplaces: only 41% of exposed workers reported they had received training.
4. There appears to be a reliance on the provision of personal protective equipment (PPE) for reducing exposure to loud noise.

Noise exposure and the provision of noise control measures in Australian workplaces 2
5. The types of control measures provided in a workplace were affected by industry, occupation and the number of workers in the workplace.
Workers in workplaces that contained fewer than 200 workers were less likely to report that they had comprehensive noise control measures (Engineering / Administrative / Training control measures and PPE) in place than workers in workplaces with 200 or more workers.
6. In general, industries and occupations with high likelihood of noise exposure also had higher likelihood of providing comprehensive noise exposure controls (Engineering / Administrative / Training control measures and PPE).
7. Research that links self-reported durations of exposure to loud noise to actual measured noise exposure levels is required in order to assess the risk of noise-induced hearing loss and to determine whether or not the noise control measures that are in place are appropriate.
Policy implications
1. The awareness of occupational hearing loss and the risk posed by high noise levels must be raised and accepted in young people. Young workers were more likely to report exposure to loud noise than older workers but the long latency of the hearing loss condition means that it is mostly older workers who apply for workers’ compensation. Other research suggests that hearing loss is most rapid in the first few years of exposure, which indicates that many people will not become aware of the issue until after the damage is significant. To prevent future incidents of occupational hearing loss, efforts should be made to detect hearing loss in the younger age groups.
2. The hierarchy of noise exposure control is probably not being followed appropriately in many Australian workplaces. Noise should be eliminated or reduced with engineering or administrative controls before PPE is provided. However, many workers reported that they were provided with PPE only. Others reported that they did not receive any training on how to reduce noise exposure. Better compliance with these noise control measures will reduce worker exposure to loud noise and thereby reduce the incidence of occupational noise-induced hearing loss.
3. The workers most at risk of hearing loss probably work in small to medium sized workplaces. Small and medium-sized workplaces should be targeted as a priority in compliance campaigns because these workplaces are less likely to provide noise control measures than large workplaces with 200 or more workers.
4. Targeted research is required to evaluate whether or not particular industries and occupations provide and utilise appropriate noise controls for the sorts of noise exposures reported in this survey. Industries and occupations that have been identified in this report as requiring such further research include the Health and community services and Transport and storage industries and Machinery operators and drivers.
Future research considerations
1. Future research must link self-reported exposures to actual measured exposures to loud noise and expert observations of noise control provision and use. It should also gather data on noise exposure durations on a common time scale and delve

Noise exposure and the provision of noise control measures in Australian workplaces 3
more deeply into the nature and source of noise exposure, management and worker attitudes and health effects of noise exposure.
2. Given the difficulties and expenses associated with obtaining representative samples of measured exposures to noise, for policy purposes it may be more useful to focus research on noise exposure control provision and utilisation. Improving noise control provision and use will lead to a reduction in work-related noise exposure from which it could be expected that there will be a decline in occupational noise-induced hearing loss.
3. Surveys of noise control measures provided in the workplace based on self reported exposure to loud noise must include workers who report that they are not exposed to loud noise in order to obtain information about the use of engineering controls that reduce the equivalent continuous A-weighted noise levels below 85dB. These surveys should also include questions on risk management and monitoring, such as annual audiometric tests and sound tests on machinery.

Noise exposure and the provision of noise control measures in Australian workplaces 4
Occupational noise-induced hearing loss: background, data limitations and research objectives
Occupational noise-induced hearing loss is an entirely preventable but irreversible condition that affects many Australian workers (Kurmis and Apps 2007). In 2007-08 it led to more than 3600 compensated workers’ compensation claims. This represented 2.8% of all workers’ compensation claims and almost 11% of all occupational disease claims (including musculoskeletal disorders). Furthermore, it amounted to $41 million in workers’ compensation payments and had an estimated total economic cost of around $240 million (Safe Work Australia 2009). However, because occupational deafness is typically a long latency condition, workers’ compensation claims are complicated by difficulties associated with determining responsibility and the impact of non-occupational noise exposure. It is therefore thought that the workers’ compensation figures probably underestimate the prevalence of occupational noise-induced hearing loss in Australian workers. Due to the seriousness of this condition, occupational noise-induced hearing loss has been designated as a priority occupational disease under the National Occupational Health and Safety Strategy 2002-2012.
Long term exposure to loud noise is the most common preventable cause of sensorineural hearing loss (hearing loss related to the inner ear and associated neurological structures). The extent of hearing loss depends on the duration of exposure and the intensity of the sound the worker is exposed to. The Australian national standard for exposure to loud noise in the occupational environment is an average daily (8 hour equivalent) exposure level of 85dB of A-weighted sound [LAeq, 8h 85dB(A)] with a peak noise no greater than 140dB(C) at any time during the day. There is overwhelming scientific evidence that exposures in excess of 85dB represent an unacceptable risk to worker hearing (Lutman 2000; Rubak et al. 2006). The relationship between sound level and duration of exposure for risk of hearing damage is logarithmic (Table 1) according to the equal energy principle. For every three decibel increase in noise, the exposure time needs to be halved in order not to exceed the exposure standard of LAeq, 8h 85dB(A). Therefore, very short exposures to very loud noise may be more damaging to hearing than very long exposures to less loud noise.
Table 1 The maximum length of time (minutes) a worker can be exposed to sound without exceeding LAeq, 8h 85dB(A) and typical sound levels of common occupational noises
Sound level (dB)
Maximum exposure time (minutes)
Sound level (dB)
Equivalent noise sources
85 480 (8 hours) 65 Normal conversation 88 240 (4 hours) 80 Hair dryer 91 120 (2 hours) 85 Smoke alarm / hand saw 94 60 (1 hour) 90 Lawn mower 97 30 95 Loud crying / hand circular saw 100 15 100 Jackhammer at 10m 103 7.5 105 Chainsaw at 1m 106 3.75 110 Siren at 10m 109 1.88 115 Sandblasting / rock concert 112 0.94 120 Threshold of pain 115 0.47 118 0.23 121 0.12 124 0.06

Noise exposure and the provision of noise control measures in Australian workplaces 5
Noise exposure
Although it is clear what levels of and exposures to sound pose substantial risks to worker hearing, there is very little information available on the actual exposures of Australian workers to loud noise. This is partially due to the substantial costs and difficulties associated with obtaining representative data on the sound levels experienced by workers and the durations of their exposure but it is also due to the lack of centralised repositories for the information that is gathered. This paucity of information on worker exposure limits the ability of occupational health and safety (OHS) organisations, such as Safe Work Australia, to develop policy and target compliance and information campaigns towards those workers most at risk of hearing loss, and therefore reduce the incidence of this debilitating condition.
The National Hazard Exposure Worker Surveillance (NHEWS) survey represents a first attempt at obtaining this crucial information. Participants in the survey were asked to estimate their occupational exposure to loud noise. The data were collected in terms of how many hours per day or per week workers were exposed to loud noise. Loud noise was defined as noise loud enough that a person would have to raise their voice to be heard when speaking to people who are at one arm’s length away from them. Research suggests that this definition corresponds roughly to an A-weighted background noise level of 85dB(A) (Ahmed et al. 2004; Neitzel et al. 2009).
One of the main assumptions of this research is that the loud noise exposures reported by workers are non-trivial, i.e. at least 85dB(A). This is an essential assumption because no measures of the level of noise workers were actually exposed to were taken in conjunction with the self reported exposures. However, the noise question was specifically designed to record non-trivial exposures; survey participants were only asked about noise that would require them to raise their voice. Although it is thought that this definition corresponds to 85dB(A) (Ahmed et al. 2004; Neitzel et al. 2009), because this was not confirmed in the NHEWS survey it is possible that some exposures to loud noise were below 85dB(A). For instance, this opinion is supported by a Danish study where it was found that although childcare workers were exposed to high levels of noise [LAeq 84dB(A)], these workers did not have higher hearing thresholds (hearing loss) (Rubak et al. 2006). Also, despite reports of non-trivial exposures, advisors (2 for example) consider it unlikely that Childcare workers (in the Health and community services industry) would be exposed to noise levels surpassing 85dB(A) for long enough durations to cause hearing damage.
Nevertheless, there is good evidence from many industries that self-reported noise exposures in the NHEWS data set are likely to be for non-trivial noise. For instance, sound tests on workers using common types of machinery in the Manufacturing and Construction industries recorded levels of noise of at least 85dB(A) and often considerably higher (Neitzel et al. 1999; Kock et al. 2004; Seneviratne and Phoon 2006). Furthermore, workers are often exposed above the exposure standard for noise of 85dB(A) averaged over an eight hour working day in these industry sectors (Rubak et al. 2006).
2 Personal communication: Marion Burgess, Acoustic & Vibration Unit, University of NSW at the Australian Defence Force Academy.

Noise exposure and the provision of noise control measures in Australian workplaces 6
Noise control measures
There are different types of noise control measures that can be provided and implemented in workplaces to reduce worker exposure to loud noise. The type of noise control measure required depends on many different characteristics of the noise exposure e.g. noise level, noise source, noise nature (intermittent / constant) and the risk exposure to loud noise poses for hearing loss. Therefore, not all types of noise exposure controls are appropriate or suitable for all workplaces or tasks.
Australian regulations describe a hierarchy of risk management that employers should follow to prevent occupational hearing loss in their workplaces. As a general rule, employers should attempt to eliminate, control or reduce exposure to loud noise before resorting to providing workers with personal protective equipment (PPE) (Williams 2007). PPE is thought to be the least effective way of reducing exposure to noise hazards because it relies on workers using it appropriately and, in many cases, changing behaviours (Daniell et al. 2006; Williams 2007). Workers should also be informed and consulted about the hazards of loud noise in their workplace and trained in the use of strategies or tools that reduce their exposure. The National Code of Practice for Noise Management and the Protection of Hearing at Work3 recommends that employers should monitor risks to workers and review preventative measures after conducting regular hearing tests on workers and sound tests on machinery.
When workers reported that they were exposed to loud noise, the NHEWS survey collected information on the types of control measures against noise exposure that were provided in workplaces. Survey participants were asked to stipulate whether or not a range of preventative measures were provided4. The options were phrased in such a way that the participant was not asked whether or not they personally utilised the control measures, but simply whether or not they were present / occurred in their workplace. The data can therefore be used to determine the likelihood of the provision of controls rather than the use of controls against loud noise per se. Because the actual noise levels workers were exposed to were not measured in the NHEWS survey, it is not possible to determine the risk to worker hearing posed by particular exposures to loud noise. It is therefore impossible to determine the appropriateness of the noise exposure control measures provided in workplaces. This means that the data in this study can only be used to describe the factors that affect the provision of noise control measures assuming the noise levels experienced by workers are non-trivial.
Research objectives
This report has three main objectives. The first objective is to determine the percentage of Australian workers who are exposed to loud noise and to describe the various employment and demographic characteristics of Australian workers who reported that they are exposed to loud noise. The second objective is to examine patterns in the provision of noise control measures to workers who reported they were exposed to loud noise, with reference to the employment and demographic characteristics of the workers. It is hoped that the information arising from the first two research objectives will inform OHS and workers’ compensation policy and in the long term lead to a decline in the incidence of hearing loss in Australian workers.
3 http://www.safeworkaustralia.gov.au/NR/rdonlyres/6EE85D16-7D1C-4FFC-99E7-E611B7290E18/0/Noise_COP.pdf 4 Refer to Appendix 1 for full details of the survey question

Noise exposure and the provision of noise control measures in Australian workplaces 7
The third objective of this report is to provide researchers in this field with clear and constructive directions for future research. While the results of this survey have advanced the body of knowledge so far, considerable research in this field is warranted. It is important that any subsequent research builds on what is currently known and provides policy makers with the information they require. Recommendations in this report will stipulate what information is required and in particular, what information should be collected together in order to develop a full understanding of Australian workers’ exposures to loud noise.
Overview of the survey methodology
The NHEWS survey collected loud noise exposure data from 4500 Australian workers using computer assisted telephone interviews (CATI). Survey participants were asked to estimate the duration (hours per day or hours per week) they were exposed to noise so loud they would have to raise their voice to speak to people one arm’s length away. Research suggests this corresponds well to a sound level of 85dB(A) (Ahmed et al. 2004; Neitzel et al. 2009). Workers who reported that they were exposed to loud noise were then asked about the noise control measures provided in their workplace. Specifically, they were asked to indicate whether a range of specific noise control measures, such as ear plugs / muffs, training, job rotation and equipment isolation or upgrading, were provided or undertaken in their workplace.
The data collected in the NHEWS survey were analysed using multinomial logistic regression models. These models describe the odds of reporting exposure to loud noise and the odds of exposed workers being provided with particular types of noise control measures with respect to the employment and demographic characteristics of the workers. Only workers in the national priority industries (Manufacturing, Construction, Transport and storage, Agriculture forestry and fishing and Health and community services) (n = 3033) were included in the multinomial logistic regression models. This was due to small sample sizes in the remaining industries rather than any expectation concerning noise exposure. Therefore, some industries (e.g. Mining or Electricity, gas and water supply) with high noise exposure have not been included in these analyses. This means that the results of this report do not describe the complete picture of occupational noise exposure for Australian workers. Future research should endeavour to obtain larger samples of workers in the excluded industries.
With the exception of the estimate of the percentage of Australian workers who are exposed to loud noise during the course of their work, the data presented in this report are unweighted and are therefore only representative of the survey sample. Non-parametric tests were undertaken when data on the duration of exposure to loud noise were used in the analyses.
Full details of the survey design, fielding methodology and the data analysis methodology can be found in Appendix 1 of this report.
Noise exposure and the provision of noise control measures in Australian workplaces 8
NHEWS survey results
This section provides an overview of the main results of the NHEWS survey. Detailed statistical information such as model output, test statistics and p-values are presented in Appendix 2. All the results presented here are supported by formal statistical analyses and are statistically significant at the 0.05 level. Except where otherwise stated (with ‘all workers’), the data presented here pertain only to workers in the five national priority industries; Manufacturing, Construction, Transport and storage, Agriculture forestry and fishing and Health and community services. A descriptive overview of the results for the remaining industries is published on the Safe Work Australia website5.
Employment and demographic characteristics of Australian workers exposed to loud noise
Overall, 32% of the workers who participated in the NHEWS survey reported that they were exposed to loud noise during the course of their work. When these data were weighted to reflect the Australian working population, the results indicated that 28% of the Australian workforce was exposed to loud noise during the course of work. The difference between the survey estimate of exposure and the weighted estimate of exposure is likely to be due to the survey being biased towards the national priority industries, some of which are noisy industries. Indeed, when considering only the national priority industries, 39% of workers surveyed reported exposure to loud noise. The remainder of analyses in this report were undertaken using the unweighted survey data.
These estimates of noise exposure may include workers who consider themselves exposed to loud noise, but for whom the actual sound levels are below the 85dB(A) level targeted by this survey. It is not possible to evaluate how much this issue may affect the noise exposure estimate without in situ measurement of noise exposures. However, research suggests that the question phrasing typically elicits the correct response from most workers (Ahmed et al. 2004; Neitzel et al. 2009). Conversely, the noise exposure estimate is unlikely to include workers for whom noise control measures, such as engineering controls, have reduced the sound levels in their workplace below 85dB(A). This is not really a problem for the exposure estimates since these workers would not be exposed to damaging noise, but it could lead to bias in the data on noise exposure control provision presented later in this report.
The national priority industries accounted for approximately 82% of the workers in the NHEWS survey who reported they were exposed to loud noise. When considering only workers in these five priority industries, a multinomial logistic regression model showed that there were several key employment and demographic characteristics that predicted whether or not workers reported exposure to loud noise. These included worker sex, age, occupation of main employment, industry of main employment and whether or not the worker worked at night (Table 2).
Male workers were more likely to report exposure to loud noise than female workers. Approximately 80% of the workers in the priority industries who reported they were exposed to loud noise were male. Or, expressed another way, 52% of all male workers in the priority industries reported they were exposed to loud noise compared to just 20% of the female workers. These findings are reflected in Australian workers’ compensation
5 http://www.safeworkaustralia.gov.au/swa/AboutUs/Publications/2008ResearchReports.htm
Noise exposure and the provision of noise control measures in Australian workplaces 9
statistics6, which show that male workers have higher incidence rates of compensated deafness claims than female workers. This gender imbalance is not unique to Australian workers. International studies estimate that perhaps as many as 97% of sufferers of occupational noise-induced hearing loss are male (Meyer et al. 2002; Kurmis and Apps 2007). The gender imbalance is largely attributable to the traditional male domination of noisy fields of work, such as construction or mining or heavy manufacturing.
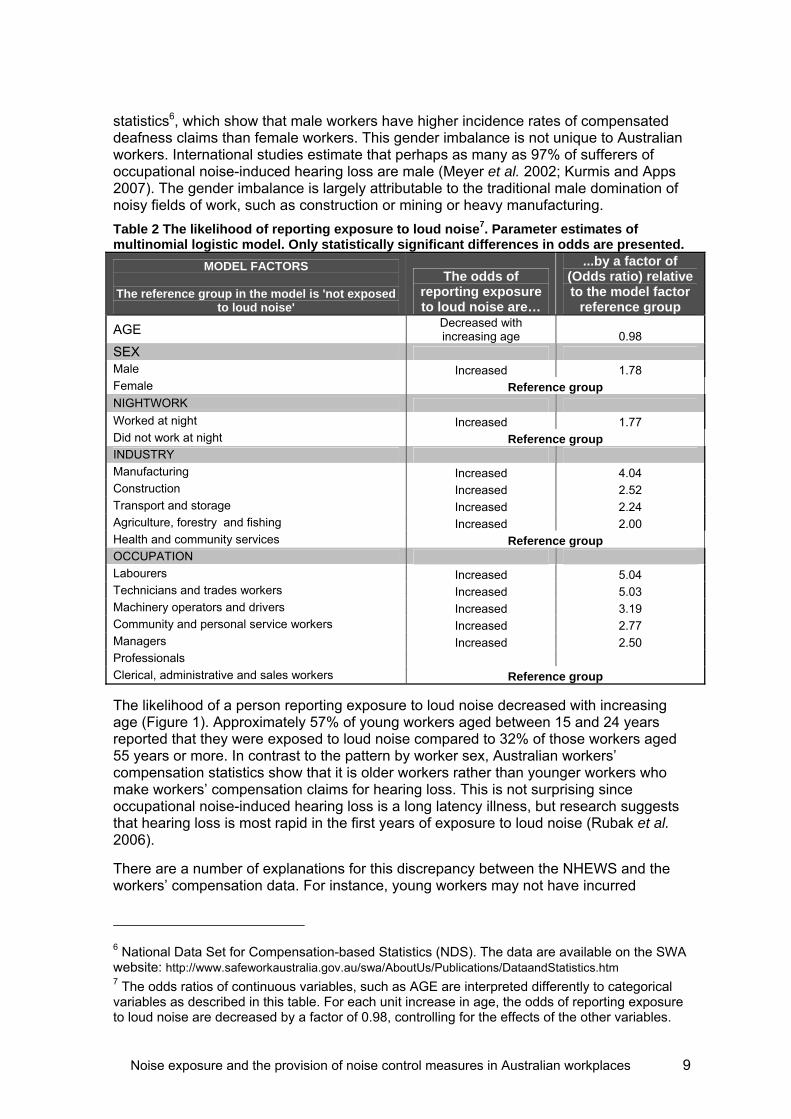
Table 2 The likelihood of reporting exposure to loud noise7. Parameter estimates of multinomial logistic model. Only statistically significant differences in odds are presented.
MODEL FACTORS
The reference group in the model is 'not exposed to loud noise'
The odds of reporting exposure to loud noise are…
...by a factor of (Odds ratio) relative to the model factor
reference group
AGE Decreased with increasing age 0.98
SEX Male Increased 1.78 Female Reference group NIGHTWORK Worked at night Increased 1.77 Did not work at night Reference group INDUSTRY Manufacturing Increased 4.04 Construction Increased 2.52 Transport and storage Increased 2.24 Agriculture, forestry and fishing Increased 2.00 Health and community services Reference group OCCUPATION Labourers Increased 5.04 Technicians and trades workers Increased 5.03 Machinery operators and drivers Increased 3.19 Community and personal service workers Increased 2.77 Managers Increased 2.50 Professionals Clerical, administrative and sales workers Reference group
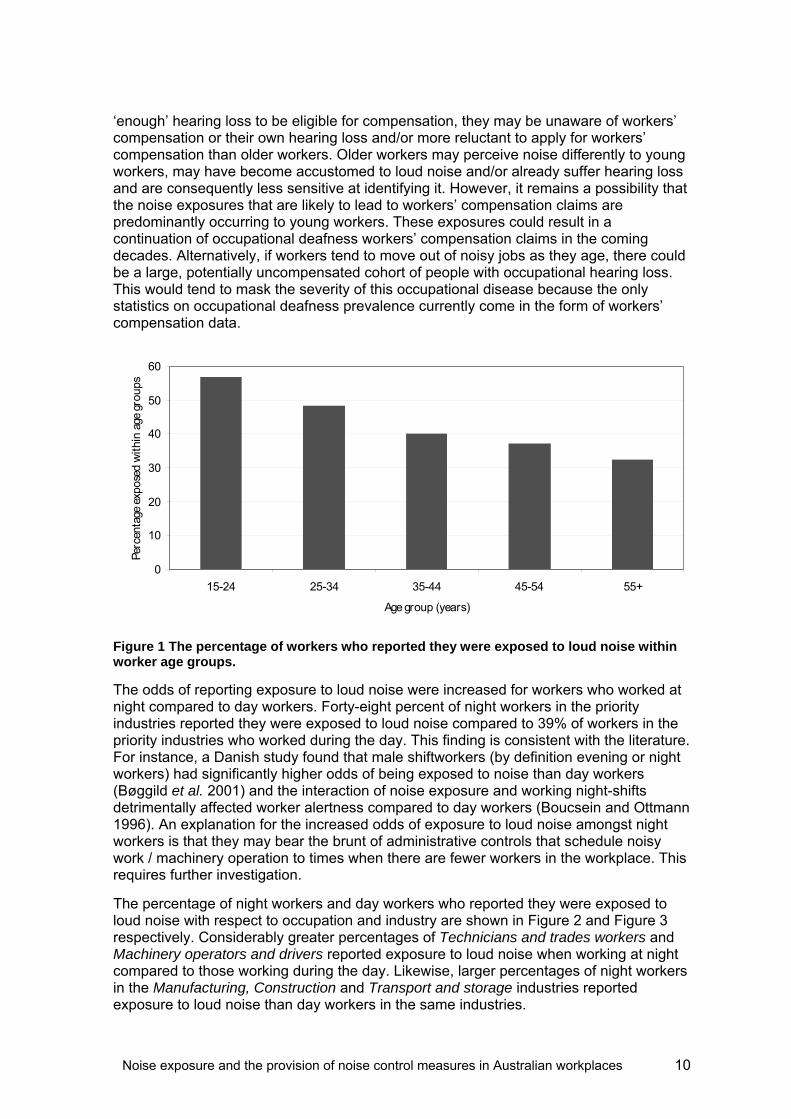
The likelihood of a person reporting exposure to loud noise decreased with increasing age (Figure 1). Approximately 57% of young workers aged between 15 and 24 years reported that they were exposed to loud noise compared to 32% of those workers aged 55 years or more. In contrast to the pattern by worker sex, Australian workers’ compensation statistics show that it is older workers rather than younger workers who make workers’ compensation claims for hearing loss. This is not surprising since occupational noise-induced hearing loss is a long latency illness, but research suggests that hearing loss is most rapid in the first years of exposure to loud noise (Rubak et al. 2006).
There are a number of explanations for this discrepancy between the NHEWS and the workers’ compensation data. For instance, young workers may not have incurred
6 National Data Set for Compensation-based Statistics (NDS). The data are available on the SWA website: http://www.safeworkaustralia.gov.au/swa/AboutUs/Publications/DataandStatistics.htm 7 The odds ratios of continuous variables, such as AGE are interpreted differently to categorical variables as described in this table. For each unit increase in age, the odds of reporting exposure to loud noise are decreased by a factor of 0.98, controlling for the effects of the other variables.
Noise exposure and the provision of noise control measures in Australian workplaces 10
‘enough’ hearing loss to be eligible for compensation, they may be unaware of workers’ compensation or their own hearing loss and/or more reluctant to apply for workers’ compensation than older workers. Older workers may perceive noise differently to young workers, may have become accustomed to loud noise and/or already suffer hearing loss and are consequently less sensitive at identifying it. However, it remains a possibility that the noise exposures that are likely to lead to workers’ compensation claims are predominantly occurring to young workers. These exposures could result in a continuation of occupational deafness workers’ compensation claims in the coming decades. Alternatively, if workers tend to move out of noisy jobs as they age, there could be a large, potentially uncompensated cohort of people with occupational hearing loss. This would tend to mask the severity of this occupational disease because the only statistics on occupational deafness prevalence currently come in the form of workers’ compensation data.
0
10
20
30
40
50
60
15-24 25-34 35-44 45-54 55+
Age group (years)
Perc
enta
ge e
xpos
ed w
ithin
age
gro
ups
Figure 1 The percentage of workers who reported they were exposed to loud noise within worker age groups.
The odds of reporting exposure to loud noise were increased for workers who worked at night compared to day workers. Forty-eight percent of night workers in the priority industries reported they were exposed to loud noise compared to 39% of workers in the priority industries who worked during the day. This finding is consistent with the literature. For instance, a Danish study found that male shiftworkers (by definition evening or night workers) had significantly higher odds of being exposed to noise than day workers (Bøggild et al. 2001) and the interaction of noise exposure and working night-shifts detrimentally affected worker alertness compared to day workers (Boucsein and Ottmann 1996). An explanation for the increased odds of exposure to loud noise amongst night workers is that they may bear the brunt of administrative controls that schedule noisy work / machinery operation to times when there are fewer workers in the workplace. This requires further investigation.
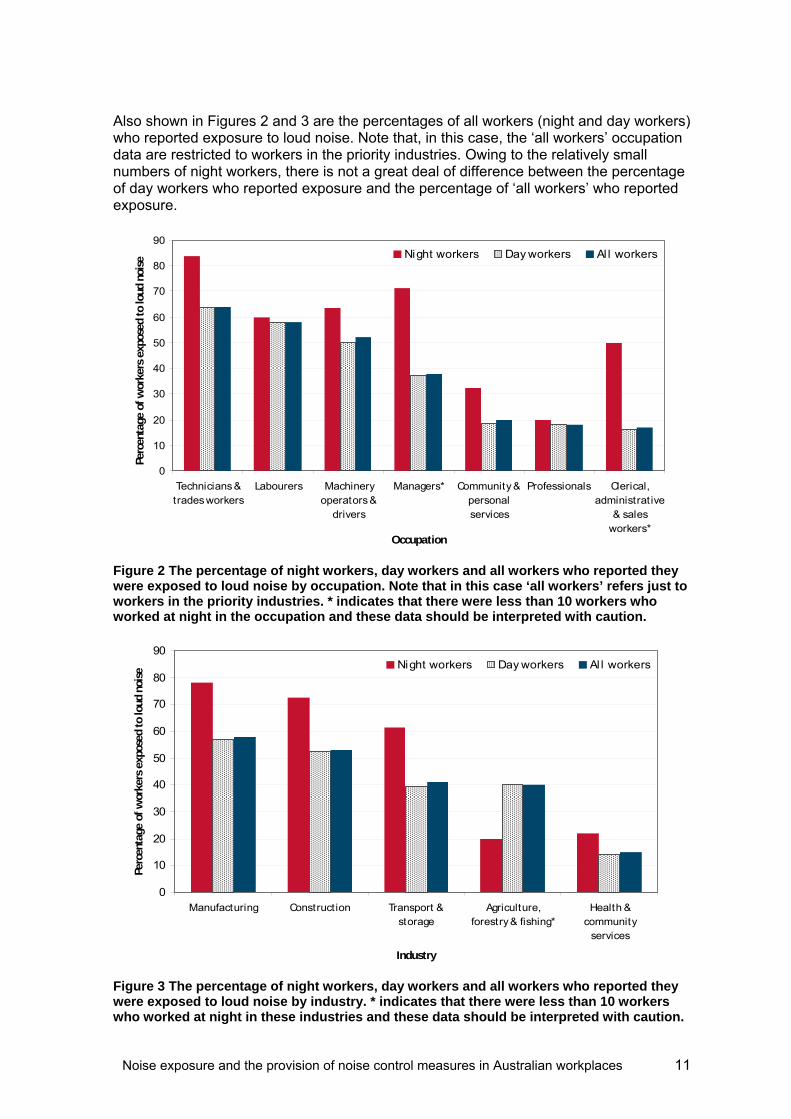
The percentage of night workers and day workers who reported they were exposed to loud noise with respect to occupation and industry are shown in Figure 2 and Figure 3 respectively. Considerably greater percentages of Technicians and trades workers and Machinery operators and drivers reported exposure to loud noise when working at night compared to those working during the day. Likewise, larger percentages of night workers in the Manufacturing, Construction and Transport and storage industries reported exposure to loud noise than day workers in the same industries.
Noise exposure and the provision of noise control measures in Australian workplaces 11
Also shown in Figures 2 and 3 are the percentages of all workers (night and day workers) who reported exposure to loud noise. Note that, in this case, the ‘all workers’ occupation data are restricted to workers in the priority industries. Owing to the relatively small numbers of night workers, there is not a great deal of difference between the percentage of day workers who reported exposure and the percentage of ‘all workers’ who reported exposure.
0
10
20
30
40
50
60
70
80
90
Technicians &trades workers
Labourers Machineryoperators &
drivers
Managers* Community &personalservices
Professionals Clerical,administrative
& salesworkers*
Occupation
Perc
enta
ge o
f w
orke
rs e
xpos
ed to
loud
noi
se
Night workers Day workers Al l workers
Figure 2 The percentage of night workers, day workers and all workers who reported they were exposed to loud noise by occupation. Note that in this case ‘all workers’ refers just to workers in the priority industries. * indicates that there were less than 10 workers who worked at night in the occupation and these data should be interpreted with caution.
0
10
20
30
40
50
60
70
80
90
Manufacturing Construction Transport &storage
Agriculture,forestry & fishing*
Health &community
services
Industry
Perc
enta
ge o
f w
orke
rs e
xpos
ed to
loud
noi
se
Night workers Day workers Al l workers
Figure 3 The percentage of night workers, day workers and all workers who reported they were exposed to loud noise by industry. * indicates that there were less than 10 workers who worked at night in these industries and these data should be interpreted with caution.
Noise exposure and the provision of noise control measures in Australian workplaces 12
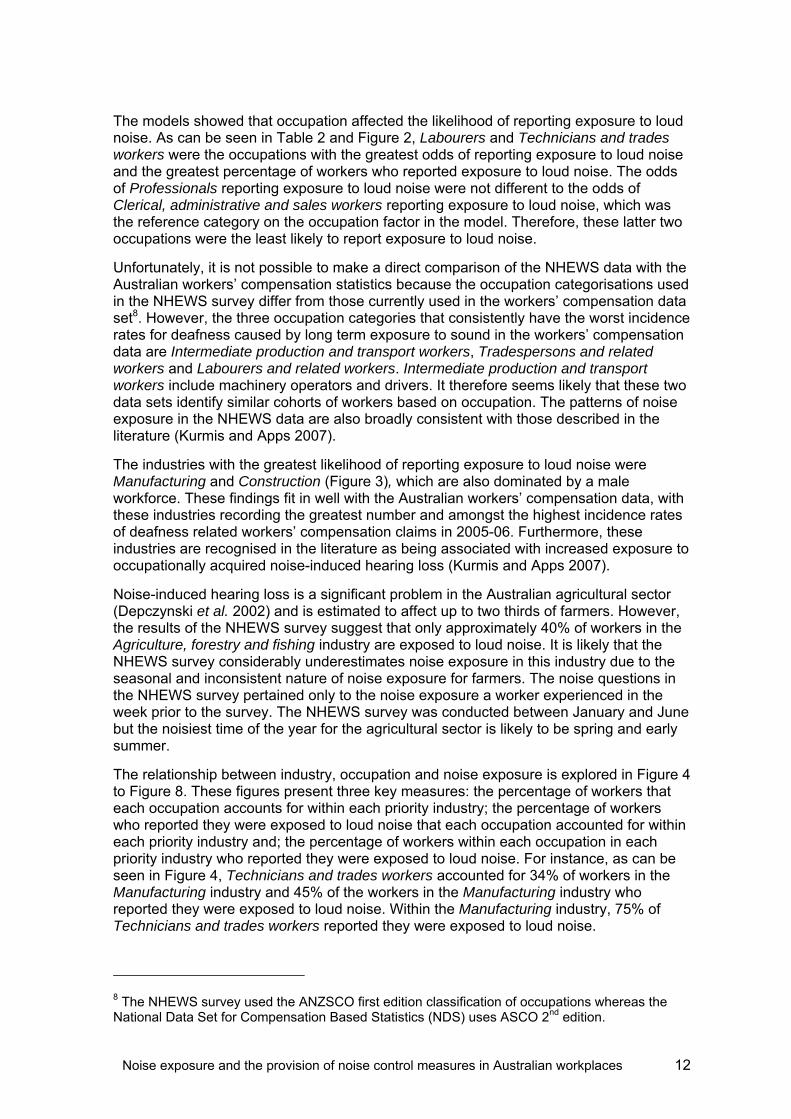
The models showed that occupation affected the likelihood of reporting exposure to loud noise. As can be seen in Table 2 and Figure 2, Labourers and Technicians and trades workers were the occupations with the greatest odds of reporting exposure to loud noise and the greatest percentage of workers who reported exposure to loud noise. The odds of Professionals reporting exposure to loud noise were not different to the odds of Clerical, administrative and sales workers reporting exposure to loud noise, which was the reference category on the occupation factor in the model. Therefore, these latter two occupations were the least likely to report exposure to loud noise.
Unfortunately, it is not possible to make a direct comparison of the NHEWS data with the Australian workers’ compensation statistics because the occupation categorisations used in the NHEWS survey differ from those currently used in the workers’ compensation data set8. However, the three occupation categories that consistently have the worst incidence rates for deafness caused by long term exposure to sound in the workers’ compensation data are Intermediate production and transport workers, Tradespersons and related workers and Labourers and related workers. Intermediate production and transport workers include machinery operators and drivers. It therefore seems likely that these two data sets identify similar cohorts of workers based on occupation. The patterns of noise exposure in the NHEWS data are also broadly consistent with those described in the literature (Kurmis and Apps 2007).
The industries with the greatest likelihood of reporting exposure to loud noise were Manufacturing and Construction (Figure 3), which are also dominated by a male workforce. These findings fit in well with the Australian workers’ compensation data, with these industries recording the greatest number and amongst the highest incidence rates of deafness related workers’ compensation claims in 2005-06. Furthermore, these industries are recognised in the literature as being associated with increased exposure to occupationally acquired noise-induced hearing loss (Kurmis and Apps 2007).
Noise-induced hearing loss is a significant problem in the Australian agricultural sector (Depczynski et al. 2002) and is estimated to affect up to two thirds of farmers. However, the results of the NHEWS survey suggest that only approximately 40% of workers in the Agriculture, forestry and fishing industry are exposed to loud noise. It is likely that the NHEWS survey considerably underestimates noise exposure in this industry due to the seasonal and inconsistent nature of noise exposure for farmers. The noise questions in the NHEWS survey pertained only to the noise exposure a worker experienced in the week prior to the survey. The NHEWS survey was conducted between January and June but the noisiest time of the year for the agricultural sector is likely to be spring and early summer.
The relationship between industry, occupation and noise exposure is explored in Figure 4 to Figure 8. These figures present three key measures: the percentage of workers that each occupation accounts for within each priority industry; the percentage of workers who reported they were exposed to loud noise that each occupation accounted for within each priority industry and; the percentage of workers within each occupation in each priority industry who reported they were exposed to loud noise. For instance, as can be seen in Figure 4, Technicians and trades workers accounted for 34% of workers in the Manufacturing industry and 45% of the workers in the Manufacturing industry who reported they were exposed to loud noise. Within the Manufacturing industry, 75% of Technicians and trades workers reported they were exposed to loud noise.
8 The NHEWS survey used the ANZSCO first edition classification of occupations whereas the National Data Set for Compensation Based Statistics (NDS) uses ASCO 2nd edition.

Noise exposure and the provision of noise control measures in Australian workplaces 13
It is clear from these figures that industry affects the percentage of workers within occupations who reported they were exposed to loud noise. For instance, more than 60% of Machinery operators and drivers reported they were exposed to noise in the Manufacturing, Construction and Agriculture, forestry and fishing industries but less than 40% reported they were exposed to loud noise in the Transport and storage industry (Figure 6).
Although Machinery operators and drivers, Labourers and Technicians and trades workers often had very high exposures to loud noise, they were not always the largest cohorts of workers within each industry, either in terms of numbers of workers or numbers of workers exposed to loud noise in the industry. This serves to highlight that the workers exposed to loud noise and therefore at risk of occupational noise-induced hearing loss can be relatively minor groups of workers within industries. Furthermore, these figures show that noise exposure can be overrepresented and concentrated within particular occupations in the priority industries. This serves to highlight the importance of occupation driven research and compliance campaigns as they relate to noise exposure.
0
10
20
30
40
50
60
70
80
Occupations in the Manufacturing industry
Perc
enta
ge
% of workers each occupation accounts forwithin industry
34 17 13 12 11 10
% of workers exposed to noise eachoccupation acccounts for within industry
45 20 5 13 10 4
% of workers exposed to noise within eachoccupation in industry
75 71 22 63 49 25
Technicians & trades workers
LabourersClerical,
administrative & sales
Machinery operators &
driversManagers Professionals
Figure 4 Noise exposure and employment characteristics of the main occupations in the Manufacturing industry

Noise exposure and the provision of noise control measures in Australian workplaces 14
0
10
20
30
40
50
60
70
80
Occupations in the Construction industry
Perc
enta
ge
% of workers each occupation accounts forwithin industry
48 13 12 9 9 8
% of workers exposed to noise eachoccupation acccounts for within industry
53 11 16 5 12 2
% of workers exposed to noise within eachoccupation in industry
58 44 73 28 70 12
Technicians & trades
workersManagers Labourers Professionals
Machinery operators &
drivers
Clerical, administrative
& sales
Figure 5 Noise exposure and employment characteristics of the main occupations in the Construction industry
0
10
20
30
40
50
60
70
80
90
Occupations in the Transport and storage industry
Perc
enta
ge
% of workers each occupation accounts forwithin industry
40 22 13 10 6 5
% of workers exposed to noise eachoccupation acccounts for within industry
37 14 26 6 9 7
% of workers exposed to noise within eachoccupation in industry
37 27 82 24 64 52
Machinery operators &
drivers
Clerical, administrative
& sales
Technicians & trades workers
Managers Labourers Professionals
Figure 6 Noise exposure and employment characteristics of the main occupations in the Transport and storage industry

Noise exposure and the provision of noise control measures in Australian workplaces 15
0
10
20
30
40
50
60
70
Occupations in the Agricuture, forestry and fishing industry
Perc
enta
ge
% of workers each occupation accounts forwithin industry
42 24 14 7 7 5
% of workers exposed to noise eachoccupation acccounts for within industry
42 22 18 11 3 2
% of workers exposed to noise within eachoccupation in industry
40 37 51 61 18 13
Managers LabourersTechnicians & trades workers
Machinery operators &
driversProfessionals
Clerical, administrat ive
& sales
Figure 7 Noise exposure and employment characteristics of the main occupations in the Agriculture, forestry and fishing industry
0
10
20
30
40
50
Occupations in the Health and community services industry
Perc
enta
ge
% of workers each occupation accounts forwithin industry
44 28 13 5 3 3
% of workers exposed to noise eachoccupation acccounts for within industry
40 36 6 4 5 5
% of workers exposed to noise within eachoccupation in industry
13 19 6 13 21 21
ProfessionalsCommunity &
personal service
Clerical, administrative
& sales Managers
Technicians & trades workers
Labourers
Figure 8 Noise exposure and employment characteristics of the main occupations in the Health and community services industry
Noise exposure and the provision of noise control measures in Australian workplaces 16
Duration of exposure to loud noise
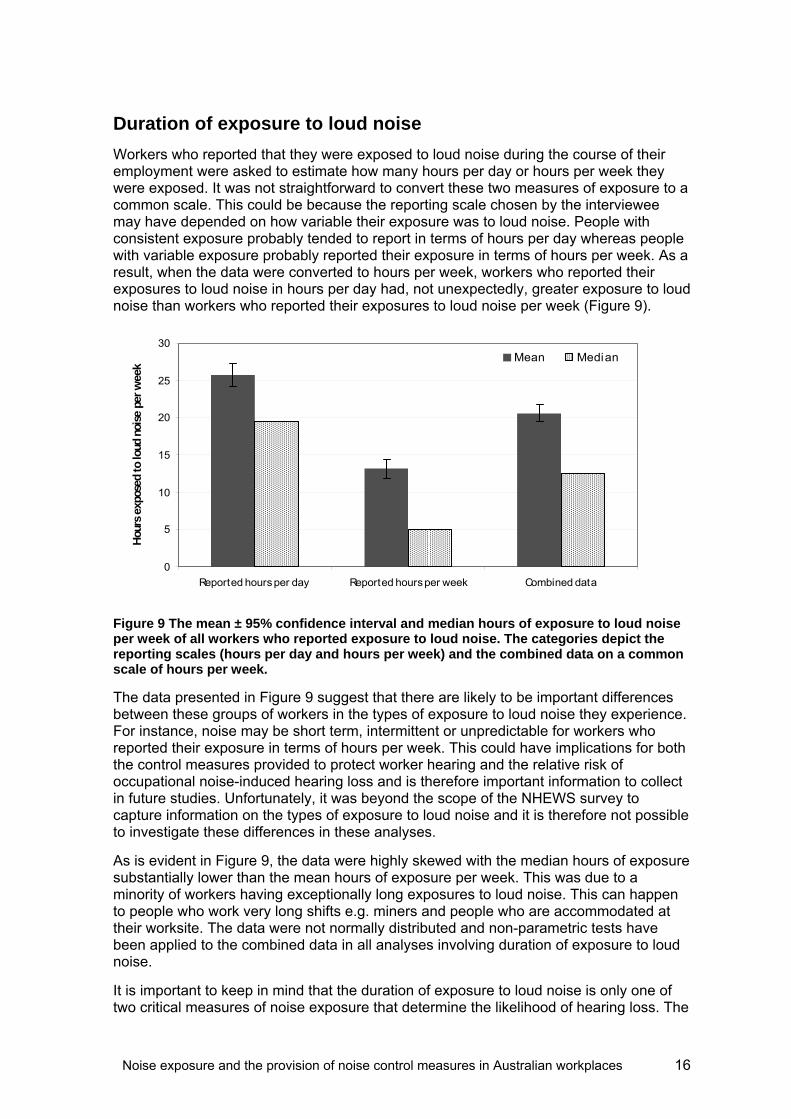
Workers who reported that they were exposed to loud noise during the course of their employment were asked to estimate how many hours per day or hours per week they were exposed. It was not straightforward to convert these two measures of exposure to a common scale. This could be because the reporting scale chosen by the interviewee may have depended on how variable their exposure was to loud noise. People with consistent exposure probably tended to report in terms of hours per day whereas people with variable exposure probably reported their exposure in terms of hours per week. As a result, when the data were converted to hours per week, workers who reported their exposures to loud noise in hours per day had, not unexpectedly, greater exposure to loud noise than workers who reported their exposures to loud noise per week (Figure 9).
0
5
10
15
20
25
30
Reported hours per day Reported hours per week Combined data
Hou
rs e
xpos
ed t
o lo
ud n
oise
per
wee
k
Mean Median
Figure 9 The mean ± 95% confidence interval and median hours of exposure to loud noise per week of all workers who reported exposure to loud noise. The categories depict the reporting scales (hours per day and hours per week) and the combined data on a common scale of hours per week.
The data presented in Figure 9 suggest that there are likely to be important differences between these groups of workers in the types of exposure to loud noise they experience. For instance, noise may be short term, intermittent or unpredictable for workers who reported their exposure in terms of hours per week. This could have implications for both the control measures provided to protect worker hearing and the relative risk of occupational noise-induced hearing loss and is therefore important information to collect in future studies. Unfortunately, it was beyond the scope of the NHEWS survey to capture information on the types of exposure to loud noise and it is therefore not possible to investigate these differences in these analyses.
As is evident in Figure 9, the data were highly skewed with the median hours of exposure substantially lower than the mean hours of exposure per week. This was due to a minority of workers having exceptionally long exposures to loud noise. This can happen to people who work very long shifts e.g. miners and people who are accommodated at their worksite. The data were not normally distributed and non-parametric tests have been applied to the combined data in all analyses involving duration of exposure to loud noise.
It is important to keep in mind that the duration of exposure to loud noise is only one of two critical measures of noise exposure that determine the likelihood of hearing loss. The
Noise exposure and the provision of noise control measures in Australian workplaces 17
other measure is the intensity of the sound / sound level that the worker is exposed to. This information is impossible to obtain without in situ measured exposures for each worker. This is a logistically difficult and expensive exercise that was beyond the scope of the NHEWS survey. However, without this information it is impossible to determine the risk a particular exposure to loud noise poses to hearing. This is because the relationship between sound level and duration of exposure for risk of hearing damage is logarithmic. For every three decibel increase in noise, the safe exposure time halves. Therefore, very short exposures to very loud noise may be more damaging to hearing than very long exposures to less loud noise. For instance, 30 minutes of exposure to 97dB(A) has a similar risk of hearing damage as eight hours of exposure to 85dB(A). Furthermore, it is impossible to determine whether or not the noise control measures provided in the workplace are adequate for the noise exposure concerned. Therefore, the data collected in the NHEWS survey can only be used to estimate exposures to ‘non-trivial’ loud noise of approximately 85dB(A) or more.
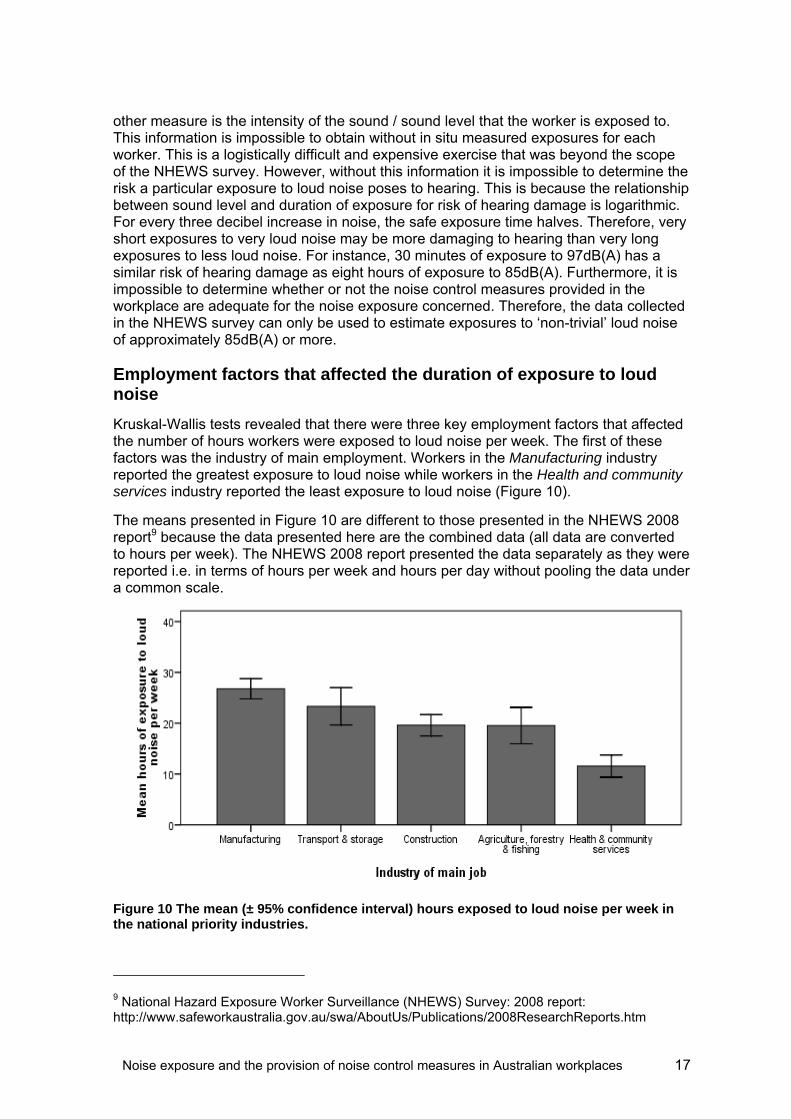
Employment factors that affected the duration of exposure to loud noise
Kruskal-Wallis tests revealed that there were three key employment factors that affected the number of hours workers were exposed to loud noise per week. The first of these factors was the industry of main employment. Workers in the Manufacturing industry reported the greatest exposure to loud noise while workers in the Health and community services industry reported the least exposure to loud noise (Figure 10).
The means presented in Figure 10 are different to those presented in the NHEWS 2008 report9 because the data presented here are the combined data (all data are converted to hours per week). The NHEWS 2008 report presented the data separately as they were reported i.e. in terms of hours per week and hours per day without pooling the data under a common scale.
Figure 10 The mean (± 95% confidence interval) hours exposed to loud noise per week in the national priority industries.
9 National Hazard Exposure Worker Surveillance (NHEWS) Survey: 2008 report: http://www.safeworkaustralia.gov.au/swa/AboutUs/Publications/2008ResearchReports.htm
Noise exposure and the provision of noise control measures in Australian workplaces 18
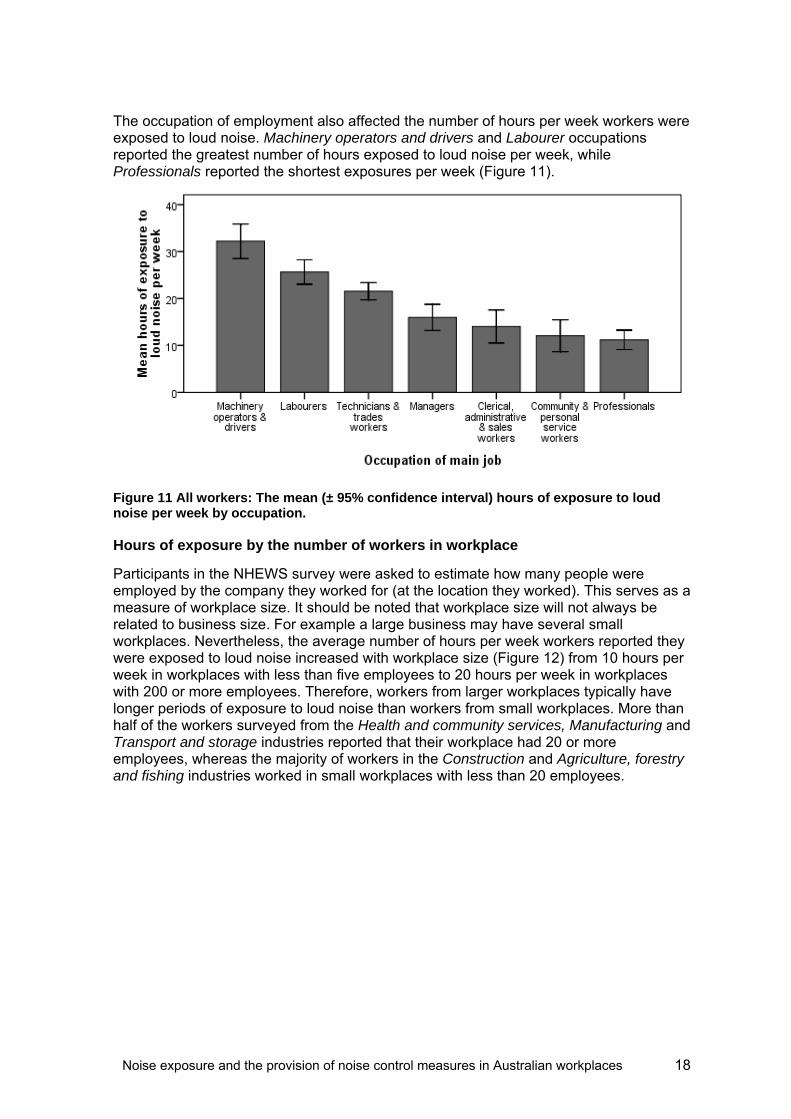
The occupation of employment also affected the number of hours per week workers were exposed to loud noise. Machinery operators and drivers and Labourer occupations reported the greatest number of hours exposed to loud noise per week, while Professionals reported the shortest exposures per week (Figure 11).
Figure 11 All workers: The mean (± 95% confidence interval) hours of exposure to loud noise per week by occupation.
Hours of exposure by the number of workers in workplace
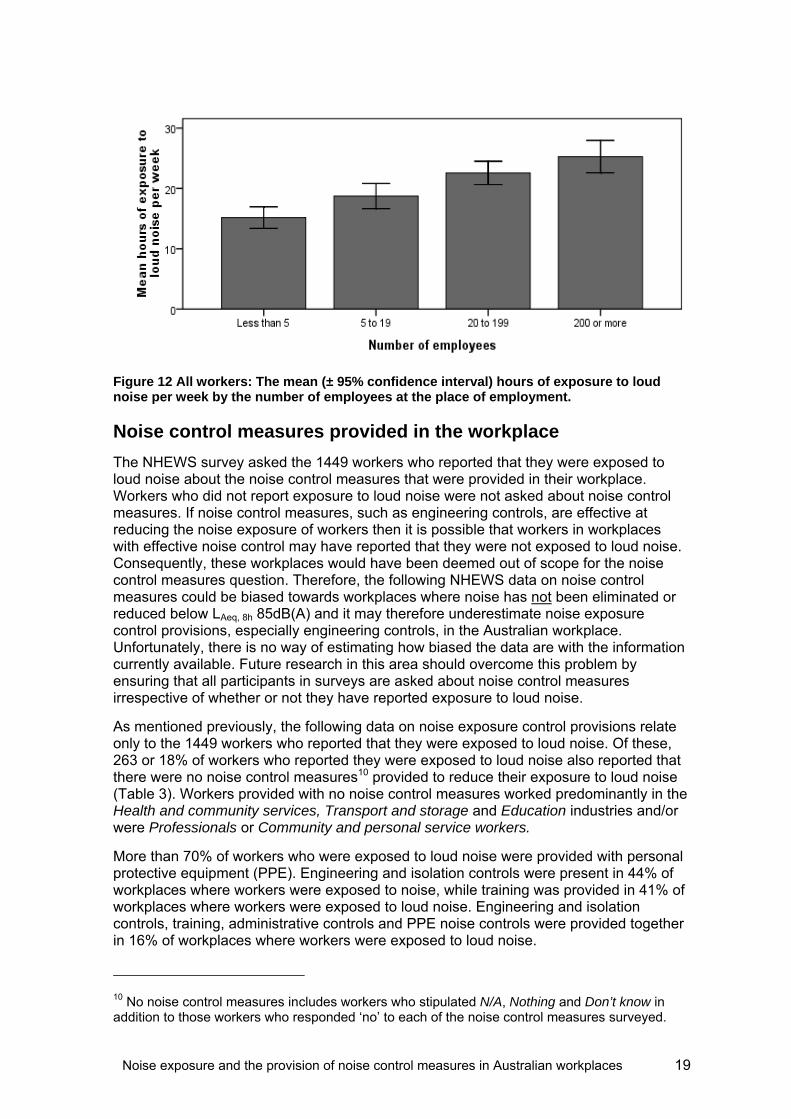
Participants in the NHEWS survey were asked to estimate how many people were employed by the company they worked for (at the location they worked). This serves as a measure of workplace size. It should be noted that workplace size will not always be related to business size. For example a large business may have several small workplaces. Nevertheless, the average number of hours per week workers reported they were exposed to loud noise increased with workplace size (Figure 12) from 10 hours per week in workplaces with less than five employees to 20 hours per week in workplaces with 200 or more employees. Therefore, workers from larger workplaces typically have longer periods of exposure to loud noise than workers from small workplaces. More than half of the workers surveyed from the Health and community services, Manufacturing and Transport and storage industries reported that their workplace had 20 or more employees, whereas the majority of workers in the Construction and Agriculture, forestry and fishing industries worked in small workplaces with less than 20 employees.
Noise exposure and the provision of noise control measures in Australian workplaces 19
Figure 12 All workers: The mean (± 95% confidence interval) hours of exposure to loud noise per week by the number of employees at the place of employment.
Noise control measures provided in the workplace
The NHEWS survey asked the 1449 workers who reported that they were exposed to loud noise about the noise control measures that were provided in their workplace. Workers who did not report exposure to loud noise were not asked about noise control measures. If noise control measures, such as engineering controls, are effective at reducing the noise exposure of workers then it is possible that workers in workplaces with effective noise control may have reported that they were not exposed to loud noise. Consequently, these workplaces would have been deemed out of scope for the noise control measures question. Therefore, the following NHEWS data on noise control measures could be biased towards workplaces where noise has not been eliminated or reduced below LAeq, 8h 85dB(A) and it may therefore underestimate noise exposure control provisions, especially engineering controls, in the Australian workplace. Unfortunately, there is no way of estimating how biased the data are with the information currently available. Future research in this area should overcome this problem by ensuring that all participants in surveys are asked about noise control measures irrespective of whether or not they have reported exposure to loud noise.
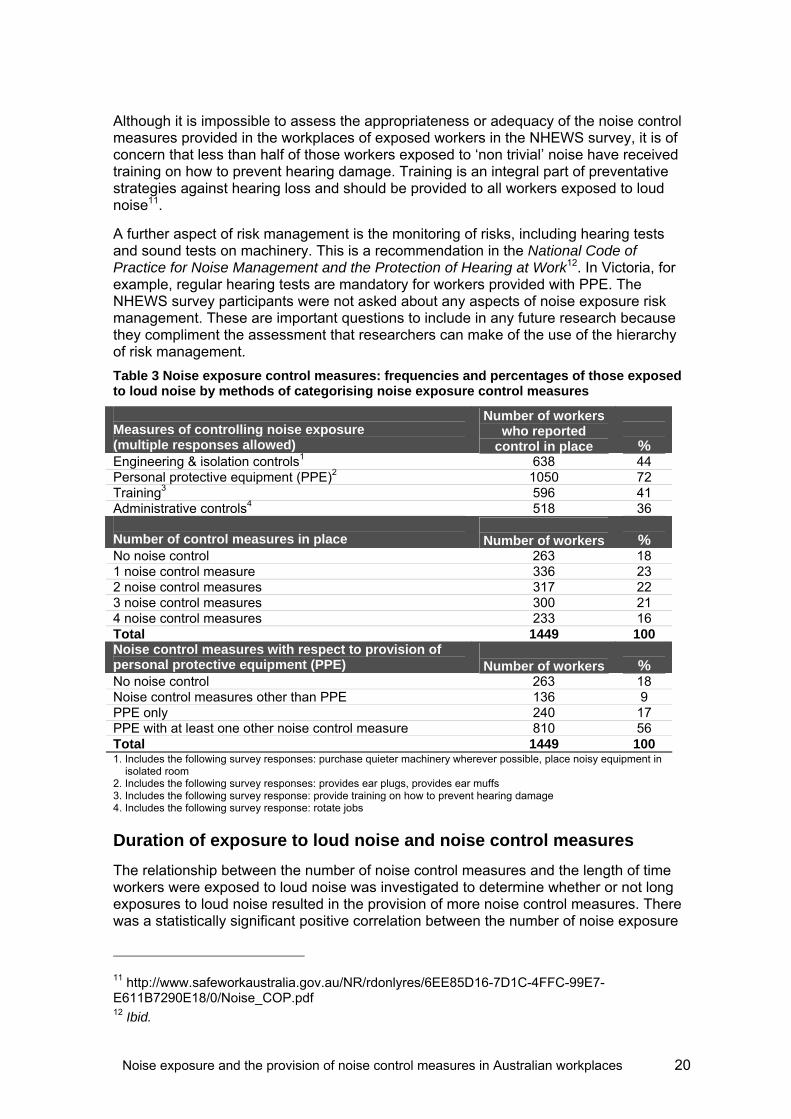
As mentioned previously, the following data on noise exposure control provisions relate only to the 1449 workers who reported that they were exposed to loud noise. Of these, 263 or 18% of workers who reported they were exposed to loud noise also reported that there were no noise control measures10 provided to reduce their exposure to loud noise (Table 3). Workers provided with no noise control measures worked predominantly in the Health and community services, Transport and storage and Education industries and/or were Professionals or Community and personal service workers.
More than 70% of workers who were exposed to loud noise were provided with personal protective equipment (PPE). Engineering and isolation controls were present in 44% of workplaces where workers were exposed to noise, while training was provided in 41% of workplaces where workers were exposed to loud noise. Engineering and isolation controls, training, administrative controls and PPE noise controls were provided together in 16% of workplaces where workers were exposed to loud noise.
10 No noise control measures includes workers who stipulated N/A, Nothing and Don’t know in addition to those workers who responded ‘no’ to each of the noise control measures surveyed.
Noise exposure and the provision of noise control measures in Australian workplaces 20
Although it is impossible to assess the appropriateness or adequacy of the noise control measures provided in the workplaces of exposed workers in the NHEWS survey, it is of concern that less than half of those workers exposed to ‘non trivial’ noise have received training on how to prevent hearing damage. Training is an integral part of preventative strategies against hearing loss and should be provided to all workers exposed to loud noise11.
A further aspect of risk management is the monitoring of risks, including hearing tests and sound tests on machinery. This is a recommendation in the National Code of Practice for Noise Management and the Protection of Hearing at Work12. In Victoria, for example, regular hearing tests are mandatory for workers provided with PPE. The NHEWS survey participants were not asked about any aspects of noise exposure risk management. These are important questions to include in any future research because they compliment the assessment that researchers can make of the use of the hierarchy of risk management.
Table 3 Noise exposure control measures: frequencies and percentages of those exposed to loud noise by methods of categorising noise exposure control measures
Measures of controlling noise exposure (multiple responses allowed)
Number of workers who reported
control in place
% Engineering & isolation controls1 638 44 Personal protective equipment (PPE)2 1050 72 Training3 596 41 Administrative controls4 518 36 Number of control measures in place
Number of workers
%
No noise control 263 18 1 noise control measure 336 23 2 noise control measures 317 22 3 noise control measures 300 21 4 noise control measures 233 16 Total 1449 100 Noise control measures with respect to provision of personal protective equipment (PPE)
Number of workers
%
No noise control 263 18 Noise control measures other than PPE 136 9 PPE only 240 17 PPE with at least one other noise control measure 810 56 Total 1449 100 1. Includes the following survey responses: purchase quieter machinery wherever possible, place noisy equipment in
isolated room 2. Includes the following survey responses: provides ear plugs, provides ear muffs 3. Includes the following survey response: provide training on how to prevent hearing damage 4. Includes the following survey response: rotate jobs
Duration of exposure to loud noise and noise control measures
The relationship between the number of noise control measures and the length of time workers were exposed to loud noise was investigated to determine whether or not long exposures to loud noise resulted in the provision of more noise control measures. There was a statistically significant positive correlation between the number of noise exposure
11 http://www.safeworkaustralia.gov.au/NR/rdonlyres/6EE85D16-7D1C-4FFC-99E7-E611B7290E18/0/Noise_COP.pdf 12 Ibid.

Noise exposure and the provision of noise control measures in Australian workplaces 21
control measures in place and the number of hours workers were exposed to loud noise per week. However, there was considerable variation in the data, which made the relationship very weak. This variation is likely to be due in part to the under-provision of noise exposure controls and to inaccurate estimations of hours exposed by the survey participants. For instance, it is thought that the type of noise (e.g. constant, intermittent, highly variable) affects workers’ ability to estimate their exposure. Estimations of exposure to loud noise are most accurate for workers whose exposure is constant and least accurate for workers with intermittent exposure (Neitzel et al. 2009).
It is highly likely that the main reason for the variation in these data is that duration of exposure to noise is an insufficient and poor measure of the risk posed to hearing. Without measures of actual noise levels it is impossible to determine the level of noise control provisions required. For instance, short durations of very loud noise may pose more risk to hearing than long durations of less loud noise, and therefore warrant more protective measures. Furthermore, some types of noise control measures are inappropriate or impossible to implement for certain types of noise exposure. For example, there are no ‘after purchase’ engineering controls that can prevent operator exposure to the extremely loud noise generated by a chainsaw [105dB(A)].
Another approach is to examine the types of noise control measures provided relative to the duration of exposure to loud noise. Long durations of exposure to loud noise may be associated with different noise control provision than short exposures. Kruskall-Wallis tests revealed that the types of noise control measures relative to the provision of PPE were associated with different durations of exposure to loud noise (Figure 13). Workers provided with PPE only or PPE with other control measures were, on average, exposed to loud noise for the greatest number of hours per week. There was no statistical difference between workers provided with PPE only and those workers provided with PPE and other control measures, despite the mean hours of exposure per week being greatest for those workers provided with PPE only. Therefore, although in the context of the NHEWS study duration of exposure is not a good estimate of risk of hearing damage, this finding raises the possibility that there may be some workers for which little effort, beyond the provision of PPE, has been made to limit or reduce exposure to long durations of loud noise.
Figure 13 All workers: The mean (± 95% confidence interval) hours of exposure to loud noise per week by the provision of noise control measures.
In workplaces where control measures other than PPE were provided, the most common control measure against noise exposure was engineering and isolation controls (60% of these workplaces had engineering and isolation controls in place). For the purposes of

Noise exposure and the provision of noise control measures in Australian workplaces 22
these analyses, engineering and isolation controls included placing noisy equipment in an isolated room and/or purchasing quieter equipment wherever possible. Only 26% of workers who were provided with noise control measures other than PPE reported that they had received training on how to prevent hearing damage. In contrast, when PPE together with other control measures were provided, training and engineering and isolation controls were provided in 69% of workplaces. Administrative controls (job rotation) were provided in 47% of workplaces where noise controls other than PPE were provided and 56% of workplaces where PPE together with other noise control measures were provided.
As mentioned previously, the low levels of training on how to prevent hearing damage are a concerning finding of the NHEWS survey. The increase in the provision of training seems to be associated with the provision of PPE and it is possible that the training provided to workers is focussed on how to use PPE. Whilst this is important, it is only part of the education workers require in order to reduce the incidence of occupational noise-induced hearing loss. Further research is required in this area in order to determine the scope and content of the training provided to workers and to confirm the link with the provision of PPE.
What employment factors are important predictors of the provision of noise control measures in the workplace?
Individual noise control measures
The provision of noise control measures in the workplaces within the national priority industries were examined to determine what factors predict the provision of particular types and levels of noise control. It is important to note that the results of the models presented here do not take into account the requirements or necessity for noise control measures. As mentioned previously in this report, without knowing the actual sound levels workers were exposed to or the particular working situation, it is impossible to determine whether or not the noise control provisions are appropriate or adequate. Therefore, these results must not be interpreted in terms of a performance / compliance measure.
Five logistic models examined the provision of each of the types of noise control measure (any noise controls, PPE, engineering and isolation controls, training and administrative controls) with respect to occupation, industry and workplace size. Of these five models, only the ‘any noise control measures’ and the PPE model produced reliable results. The remaining three models explained very little of the variance in the data and should therefore be considered as indicative of trends only. Further investigation is required to determine the relationship between the explanatory factors and the provision of these control measures. With this in mind, Table 4 presents the parameter estimates of the four models. These are the odds (likelihood) of reporting that the control was not provided relative to the reference group within each factor, while controlling for the effects of the remaining factors. Only statistically significantly different odds are presented.
The first model examined the provision of any type of noise control measure. This model simply examined whether any noise control measure was provided or not. Workers had greater odds of not being provided with any noise control if they worked in a Professional or Machinery operator and driver occupation compared to working as a Technician or trades worker. Workers in the Manufacturing industry were the least likely of the priority industries to be provided with no noise control measures. Workplace size also affected the odds of being provided with any form of noise control measure. Compared to the largest workplaces (those with 200 or more employees), smaller workplaces had
Noise exposure and the provision of noise control measures in Australian workplaces 23
increased odds of not providing any form of noise control measures. The odds of not providing noise controls tended to be greatest for the smallest workplaces. This relationship between workplace size and the odds of not providing control measures was similar for all the types of noise control measure individually examined by the models.
The patterns seen in the ‘any noise control measure’ model were largely replicated in the model examining the provision of PPE. This is likely to be due to the strong influence of the provision of PPE in the ‘any noise control measure’ model since the provision of PPE was the most common form of noise control measure provided to the workers in the NHEWS survey (72% of workers were provided with PPE). There were, however, a few differences between the two models. In the PPE model, Clerical, administrative or sales workers had the greatest odds of not being provided with PPE, followed by Machinery operator and drivers and Professionals. The Construction industry was the only industry where the odds of not providing PPE were the same as in the Manufacturing industry. The other priority industries each had increased odds of not providing PPE relative to the Manufacturing industry. In the case of the Health and community services industry, the increased likelihood of not providing PPE (and indeed any noise control measure) was dramatic. Workers in this industry were 55 times more likely than Manufacturing workers to not be provided with PPE and 17 times more likely to not be provided with any form of noise control.

Noise exposure and the provision of noise control measures in Australian workplaces 24
Table 4 The odds of not providing the following noise controls in the workplace13: Any controls, PPE, Engineering, Training & Administrative controls.
Any controls PPE Engineering & isolation Training Administrative
MODEL FACTORS
The reference group in the model is 'controls provided'
The odds of not being
provided with any noise controls are…
… by a factor of (Odds
ratio) relative to the factor reference
group
The odds of PPE not
being provided
are…
… by a factor of (Odds
ratio) relative to the factor reference
group
The odds of engineering /
isolation controls not
being provided
are…
… by a factor of (Odds
ratio) relative to the factor reference
group
The odds of training not
being provided
are…
… by a factor of (Odds
ratio) relative to the factor reference
group
The odds of administrative controls not
being provided
are…
… by a factor of (Odds
ratio) relative to the factor reference
group
Exposure duration (h/week) Increased 1.0
OCCUPATION
Managers Decreased 0.6 Decreased 0.6
Professionals Increased 2.6 Increased 2.1 Increased 1.8
Clerical, admin. & sales workers Increased 3.9
Labourers
Machinery operators & drivers Increased 2.0 Increased 2.3
Community & personal services
Technicians & trades workers Reference group
INDUSTRY
Health & community services Increased 17.5 Increased 55.1 Increased 2.6 Increased 7.5 Increased 2.0
Transport & storage Increased 6.6 Increased 4.8 Increased 1.7 Increased 1.7
Construction Increased 2.2
Agriculture, forestry & fishing Increased 5.0 Increased 3.3 Increased 2.1
Manufacturing Reference group
WORKPLACE SIZE
Less than 5 employees Increased 2.2 Increased 3.0 Increased 1.6 Increased 4.8 Increased 1.9
5 to 19 employees Increased 2.2 Increased 3.1 Increased 1.5 Increased 2.7 Increased 1.7
20 to 199 employees Increased 1.8 Increased 2.1 Increased 1.4 Increased 1.8
200 or more employees Reference group
13 The odds ratios of continuous variables, such as ‘exposure duration’ are interpreted differently to categorical variables as described in this table. For each unit increase in hours of exposure, the odds of engineering controls being provided increased by a factor of 1.0, controlling for the effects of the other variables. Only statistically significant differences in odds are presented in this table.
Noise exposure and the provision of noise control measures in Australian workplaces 25
The odds of not providing training were only affected by industry and workplace size. The Health and community services, Transport and storage and Agriculture, forestry and fishing industries all had increased odds of not providing training relative to the Manufacturing industry. There was no difference between the Construction and the Manufacturing industries in terms of the likelihood of providing training to their workers.
Relative to Technicians and trades workers, Managers were more likely to report that engineering and isolation controls or administrative controls were provided in workplaces. This may be due to Managers being more aware of the provision of these sorts of controls than regular employees.
Provision of noise control measures relative to the provision of PPE
To overcome the modelling constraints of the individual noise control measures, the provision of noise control measures relative to the provision of PPE was examined with respect to employment characteristics. This categorisation was used because of the wide provision of PPE to workers in this study and it resulted in four types of noise control provision: no noise control measures, noise control measures other than PPE, PPE only and PPE together with other noise control measures. It is important to bear in mind that although it is not possible to determine the adequacy of the noise control measures, provision of noise control measures other than PPE or PPE together with other noise control measures would generally be considered better practice for noise control than the provision of PPE only.
Similar to the individual models discussed previously, this model showed that industry, occupation and the number of workers employed in the workplace all affected the types of noise control measures provided in the workplace. Key findings drawn from the parameter estimates of the model are presented in Table 5. Readers should refer to the model output in Appendix two for further clarification of the impact of particular factors on the provision noise control measures.
Workplace size
Small workplaces were more likely than large workplaces to provide no noise control measures for their workers: workplaces with fewer than 20 employees had odds of providing no noise control measures almost 4 times greater than workplaces with 200 or more workers. The relationship between workplace size and noise control provision described above was consistent across the other different types of control measures provided. The odds of providing control measures other than PPE or PPE only, rather than PPE together with other noise control measures were increased by working with less than 200 other workers.
The relationship between workplace size and noise control provision is probably not surprising. Larger workplaces are likely to have more resources to devote to OHS and improving conditions for their workers, stronger union involvement and more frequent OHS inspection by authorities, which leads to greater OHS compliance. Similar results were found in a recent American study, where ‘more complete’ hearing loss programmes were positively associated with the percentage of workers exposed to loud noise (≥85dB(A)) and the presence of a union. In addition, companies with relatively larger workforces (>200 employees) also tended to have ‘more complete’ hearing loss programmes (Daniell et al. 2006).
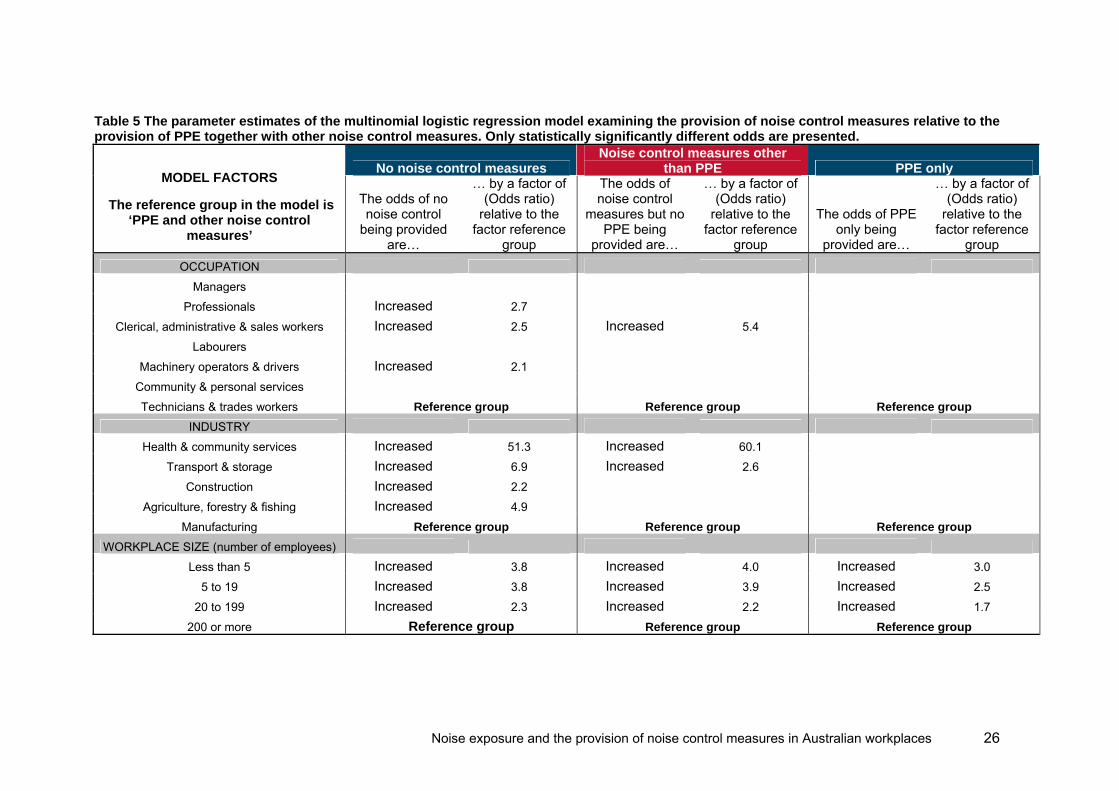
Noise exposure and the provision of noise control measures in Australian workplaces 26
Table 5 The parameter estimates of the multinomial logistic regression model examining the provision of noise control measures relative to the provision of PPE together with other noise control measures. Only statistically significantly different odds are presented.
No noise control measures Noise control measures other
than PPE PPE only MODEL FACTORS
The reference group in the model is ‘PPE and other noise control
measures’
The odds of no noise control
being provided are…
… by a factor of (Odds ratio)
relative to the factor reference
group
The odds of noise control
measures but no PPE being
provided are…
… by a factor of (Odds ratio)
relative to the factor reference
group
The odds of PPE only being
provided are…
… by a factor of (Odds ratio)
relative to the factor reference
group
OCCUPATION
Managers
Professionals Increased 2.7
Clerical, administrative & sales workers Increased 2.5 Increased 5.4
Labourers
Machinery operators & drivers Increased 2.1
Community & personal services
Technicians & trades workers Reference group Reference group Reference group
INDUSTRY
Health & community services Increased 51.3 Increased 60.1
Transport & storage Increased 6.9 Increased 2.6
Construction Increased 2.2
Agriculture, forestry & fishing Increased 4.9
Manufacturing Reference group Reference group Reference group
WORKPLACE SIZE (number of employees)
Less than 5 Increased 3.8 Increased 4.0 Increased 3.0
5 to 19 Increased 3.8 Increased 3.9 Increased 2.5
20 to 199 Increased 2.3 Increased 2.2 Increased 1.7
200 or more Reference group Reference group Reference group

Noise exposure and the provision of noise control measures in Australian workplaces 27
Industry
There were differences between the industries in terms of the odds of providing different types of noise control measures. The odds of providing no noise control measures rather than providing PPE together with other noise control measures were significantly increased by working in any priority industry compared to the Manufacturing industry. For instance, the industry most likely to provide no control measures was the Health and community services industry, where the odds of providing no control measures were increased by a factor of 51 relative to the Manufacturing industry (Figure 14). Likewise, the odds of providing no noise control measures were increased by a factor of seven by working in the Transport and storage industry compared to the Manufacturing industry.
Similar patterns were evident in the provision of noise controls other than PPE. The odds of being provided with control measures other than PPE rather than being provided with PPE together with other noise control measures were increased by a factor of 60 by working in the Health and community services industry rather than the Manufacturing industry and by a factor of 2.6 by working in the Transport and storage industry rather than the Manufacturing industry.
Figure 14 illustrates the patterns of noise exposure control provision in the national priority industries. Workers in the Manufacturing industry were least likely to report that there were no control measures for loud noise exposure in place and most likely to report that PPE were provided in addition to other control measures in their workplace. Workers in the Construction industry were the most likely to report PPE as the only control measure against exposure to loud noise. However, there was no statistical difference between industries in the odds of providing PPE only compared to PPE and other noise control measures.
0
10
20
30
40
50
60
70
80
Health & communityservices
Transport & storage Agriculture, forestry& fishing
Construction Manufacturing
National priority industries
Perc
enta
ge w
ithi
n in
dust
ry
No noise controls Noise controls other than PPE PPE only PPE with other noise controls
Figure 14 The provision of noise control measures to workers exposed to loud noise in the national priority industries
It is important to reiterate that it would be incorrect to assume that because the Health and community services industry had greater odds of workers reporting that there were no control measures in place, it is failing in its duty to protect workers against occupational noise-induced hearing damage. These workers may not be exposed to loud

Noise exposure and the provision of noise control measures in Australian workplaces 28
enough noise for long enough duration to endanger hearing or require noise control measures. Indeed, the mean duration of exposure to loud noise for workers in this industry was shortest of all the national priority industries (Figure 10). Further research that specifically examines the noise control requirements of workers in the Health and community services industry and the Transport and storage industry is needed to determine the significance of the findings described above. It is possible that the noise controls that are in place are sufficient for the noise exposure experienced by these workers.
Occupation
The types of noise control measures provided to employees who were exposed to loud noise also depended on worker occupation. The odds of being provided with no noise control measures rather than being provided with PPE together with other noise control measures were increased by a factor of 2.7 by working in a Professional occupation, by a factor of 2.5 by working as a Clerical, administrative or sales worker and by a factor of 2.1 by working as a Machinery operator or driver compared to working as a Technician or trades worker.
The odds of being provided with control measures other than PPE rather than being provided with PPE together with other noise control measures were increased by a factor of 5.4 by working in a Clerical, administrative and sales worker occupation rather than working as a Technician or trades worker.
The odds of being provided with PPE only rather than being provided with PPE together with other control measures were unaffected by industry or occupation. Therefore, except for the effect of workplace size, there is very little difference between workplaces that provide PPE and those that provide PPE together with other control measures. This raises the possibility that many workers who are exposed to potentially harmful noise in the workplace are only provided with PPE, supposedly the control measure of last resort. Instead, workplace size, as estimated by the number of workers, had a strong effect on the odds of being provided with PPE only (or any other type of noise control measure).

Noise exposure and the provision of noise control measures in Australian workplaces 29
Summary of results
The data analyses in this report can be synthesised into the following key results:
Noise exposure
1. Between 28% and 32% of Australian workers are exposed to loud noise while at work.
2. Worker sex, age, night work, industry and occupation affected the likelihood of reporting exposure to loud noise:
Male workers were more likely to be exposed to loud noise than female workers.
Young workers were more likely to report exposure to loud noise than older workers.
Workers who worked at night were more likely to report that they were exposed to loud noise than workers who worked during the day.
The main industries in which workers were exposed to loud noise were Manufacturing and Construction.
The main occupations in which workers were exposed to loud noise were Technicians and trades workers, Machinery operators and drivers and Labourers.
3. The duration of exposure to loud noise was affected by industry, occupation and the number of workers in the workplace.
Mean hours per week of exposure to loud noise were greatest in the Manufacturing and Transport and storage industries but least in the Health and community services industry.
Mean hours per week of exposure to loud noise were greatest in Machinery operator and driver and Labourer occupations and least in Professional occupations.
The mean hours of exposure to loud noise per week increased with increasing workplace size.
Noise exposure controls
4. Some types of noise exposure mitigation measures, e.g. training on how to prevent hearing damage, appear to be underutilised in Australian workplaces.
5. There was a weak positive relationship between the duration of exposure to loud noise and the number of control measures against loud noise in place, however duration of exposure to loud noise is a poor estimate of the risk of hearing damage.
6. Workers provided with PPE were exposed to loud noise for more hours per week on average than workers who were not provided with PPE. There was no difference in the mean number of hours exposed to loud noise per week between

Noise exposure and the provision of noise control measures in Australian workplaces 30
workers provided with PPE only and those provided with PPE together with other noise control measures.
7. There is a heavy reliance on PPE as either the only control measure or in conjunction with other control measures.
8. The types of control measures provided in a workplace were affected by industry, occupation and the number of workers in the workplace.
Workplaces that contained less than 200 workers were less likely to provide PPE together with other noise control measures than workplaces with 200 or more workers.

Noise exposure and the provision of noise control measures in Australian workplaces 31
Policy implications and recommendations
The analyses in this report identify several key issues related to noise exposure and noise exposure controls that are relevant for OHS and workers’ compensation policy and regulations. These are outlined below.
Young workers
The first outcome of relevance for workers’ compensation policy and regulations is the finding that young workers are more likely to report they are exposed to loud noise than older workers. The long latency of the occupational noise-induced hearing loss condition means that it is mostly older workers who apply for workers’ compensation. However, research suggests that loss of hearing is most rapid in the first years of exposure (Rubak et al. 2006). Therefore, it is possible that noise exposures that occur to young workers are compensated when they become older. Furthermore, young workers who move out of noisy occupations are unlikely to ever receive compensation for the hearing loss they incurred during their first years in the workforce.
Awareness of the consequences of loud noise exposure needs to be raised and stressed in young people and measures should be taken to ensure that hearing loss is more rapidly detected in the younger age groups.
Hierarchy of noise control measures
The second finding of relevance to OHS and workers’ compensation policy is that the hierarchy of noise exposure control is probably not being followed appropriately in many workplaces. The national code of practice recommends that employers eliminate, reduce or control noise before resorting to the provision of PPE. Employers are also advised to provide training and to monitor noise risks. However, the NHEWS data showed that many workers are provided with PPE only and many workers do not receive any training on how to reduce noise exposure. A recent American study found that, independent of noise levels, employee awareness of hearing loss prevention efforts and appropriate use of PPE was greatest in companies that had ‘more complete’ hearing loss programs in place (Daniell et al. 2006).
Participants in this survey were not asked whether or not their hearing was tested or monitored. Recognising that this is currently not a requirement in all jurisdictions, future research should endeavour to capture this information because hearing tests provide evidence of the efficacy of noise control measures in workplaces to employers. Participants could be asked about the outcome of their hearing tests and what was done to address noise exposure if declining hearing thresholds were detected in employees. Another outcome of undertaking hearing tests (and surveillance of machinery) is that it raises awareness of, and reinforces, preventative measures (Rubak et al. 2006). Research strongly suggests that better compliance with recommended noise control measures in Australian workplaces could reduce worker exposure to loud noise (Kurmis and Apps 2007) and thereby reduce the incidence of occupational noise-induced hearing loss.
Workplace size
Another clear result of the NHEWS analyses with implications for policy is that small and medium sized workplaces are less likely than workplaces with more than 200 workers to have comprehensive noise exposure control measures in place. Therefore, the Australian workers with the greatest current risk of hearing loss may be employed in
Noise exposure and the provision of noise control measures in Australian workplaces 32
workplaces where there is potentially less exposure to noise (in terms of percentage of workers exposed or duration of exposure). This is consistent with recent international findings (Daniell et al. 2006). Small and medium-sized workplaces should be targeted as a priority in compliance campaigns. Research should be directed towards determining and overcoming the barriers of implementing noise exposure control in smaller businesses.
Industry and occupation specific policy implications
The NHEWS data show that workers in industries and occupations with a high likelihood of exposure to loud noise (e.g. the Manufacturing industry or Technicians and trades workers) generally also have high odds of providing comprehensive types of noise exposure control. Comprehensive noise controls are considered to be Engineering and/or Administrative controls and/or Training together with PPE. However, the provision of noise controls other than PPE is also a good outcome provided that these measures satisfactorily control noise levels. Most of the noisy industries and occupations had similar odds of providing noise control measures other than PPE. Therefore, provided the noise controls are used properly and are sufficient and appropriate for the particular situation, this implies that workers in these industries and occupations are probably at lower risk of developing occupational noise-induced hearing loss.
Although duration of exposure to loud noise, as obtained in the NHEWS survey, is a poor estimate of risk for hearing loss, the occupation with the longest mean duration of exposure to loud noise, Machinery operators and drivers, also had increased odds of being provided with no noise control measures and increased odds of not being provided with PPE. Similar patterns were seen in the Transport and storage industry. The Health and community services industry also had a higher probability of not providing noise control measures but the risk of exposure to loud noise was much smaller in this industry. More research is required to determine whether or not the noise levels these workers are exposed to are likely to affect hearing and whether or not the noise controls provided in these workplaces are sufficient for the exposures concerned.
It is important to keep in mind that these analyses were restricted to the priority industries and that the priority industries were selected because of sample size constraints rather than any expectations concerning noise exposure. Therefore, workers from some industries, such as the Mining or Electricity, gas and water supply industries, which are known to be noisy, have not been included despite large percentages of workers in both these industries (68% and 30% respectively) reporting they were exposed to loud noise. It is important that these industries in particular and the other non priority industries in general must not be overlooked either in terms of policy initiatives or future research.
Future research
Although the NHEWS data are subject to various limitations, the NHEWS survey has provided one of the only national estimates of worker exposure to loud noise by industry, occupation and other key demographic and employment characteristics. Most other noise surveillances have focussed on key industries or occupations that are known to be noisy (Kock et al. 2004; Daniell et al. 2006), or on the incidence of hearing loss (Meyer et al. 2002; Palmer et al. 2002; Rubak et al. 2006), rather than noise exposure per se. Obtaining regularly updated noise exposure surveillance data is a key and important source of information for OHS and workers’ compensation policy. It enables interventions to be focussed effectively, before the onset of this irreversible occupational disease. Although the data on noise exposures could be improved in a number of ways (some of which are outlined in the next section of this report) it is recommended that surveillance
Noise exposure and the provision of noise control measures in Australian workplaces 33
is continued. It would be helpful if sound tests on machinery and audiometric tests on ‘at risk’ workers were accessible to researchers as this would greatly enhance the quality of the data available.

Noise exposure and the provision of noise control measures in Australian workplaces 34
Recommendations for future occupational noise exposure research
Obtaining nationally representative data on noise exposures in Australian workplaces is hampered by the great expense and physical difficulties of undertaking measured exposures of the noise levels experienced by workers. Obtaining measured exposures is difficult and expensive because they need to be undertaken on large numbers of workers across a range of industries and occupations to obtain the statistical power required to identify workers at risk of occupational noise-induced hearing loss. Furthermore, the measured exposure needs to encompass all the tasks a worker usually performs. This may change depending on the day of the week, month or over the course of a year. For instance, Agricultural workers may be exposed to specific machinery-related noise during sowing and harvesting but not at other times of the year.
Simply relying on self-reported durations of exposure, such as in the NHEWS survey, is insufficient because the risk occupational noise poses for hearing loss depends on both the duration of exposure and the precise level of noise workers are exposed to. Without measured exposures it is impossible to determine the risk of hearing damage or whether or not the noise exposure controls in place are sufficient for the task at hand. This reduces the ability of researchers and policy makers to use the data to effectively drive and implement initiatives that will ultimately reduce the occurrence of this occupational disease.
In order to advance the body of knowledge in this field it is important that future research marries self reported duration of exposure with measured exposures of the noise workers are actually exposed to. If the research methodology involves a combination of self reported exposures and measured exposures, then obtaining more information about the workers’ exposures to noise would enable researchers to match similar cases to measured exposures. Researchers should determine a) the source(s) of the noise workers are exposed to and b) the nature of the noise exposure – is it constant, intermittent throughout the day, short extreme bursts etc? In addition, exposure duration data should be collected on one time scale to avoid conversion of data and the associated assumptions. One method would be to ask workers to describe their exposure to sound on each day they worked during a reference week.
In conjunction with measured noise exposures it is critical that the provision and use of noise exposure controls is assessed by qualified people. For instance, it is well established that despite workers reporting that they use PPE when necessary, workers often fail to use PPE appropriately or consistently (Daniell et al. 2006; Kurmis and Apps 2007; Williams 2007; Griffin et al. 2009). Not wearing PPE for even short periods of time can result in significant noise exposures and damage to hearing (Williams 2007). It is also important to ensure that data on the provision of all relevant noise controls is collected and distinguishable. There are, for instance, many different types of engineering controls, e.g. plant or process modifications or sound transmission controls such as barriers and absorption on walls and ceilings. Only collecting data on one type of engineering control does not present a complete picture of the use of engineering controls.
Another issue relating to the provision of noise controls is that some workers may not be aware of some of the noise control measures in place to protect their hearing. For example, workers on the floor of a manufacturing plant may not be aware that their management has invested in the quietest machinery or that regular sound tests are performed. In the NHEWS survey, Managers, who in many cases will be responsible for OHS in their workplace, had increased odds of reporting engineering and administrative

Noise exposure and the provision of noise control measures in Australian workplaces 35
noise control measures were in place compared to other workers. This may also indicate a lack of awareness and training amongst workers about noise controls. It is therefore essential to survey managers in addition to employees even when management may not be exposed to noise.
In addition to this, it is important to collect information on noise control provision from workers who report that they are not exposed to loud noise. This will ensure that workplaces where engineering controls reduce noise levels below 85dB(A) are not excluded from the survey. It will also capture those workers who utilise noise controls and therefore consider themselves unexposed to loud noise, and workers who do not realise that they are exposed to loud noise. Including these workers results in less biased noise control measures data.
Given that it is very difficult and expensive to collect measured exposures to noise in the workplace, it may be of greater benefit to direct research towards the provision and use of noise control measures. Researchers could focus on discovering what the barriers and enablers are for control implementation and use, or what characteristics of workers, industries and occupations affect the implementation and use of noise control measures. Work of this nature is currently being undertaken by Safe Work Australia on behalf of the Australian Department of Health and Aging.
Both noise exposure and noise exposure control measures oriented research could be supplemented by worker and management attitude and health effects research. This would enable researchers to directly relate occupational exposures to behavioural and health changes in workers. This type of information could be useful for the development of OHS and workers’ compensation policy.
In an ideal world, researchers would also have access to hearing tests performed on workers. This would enable rates of hearing loss to be linked to particular occupations or industries and other employment and demographic factors (if the information was available).
Areas of required research arising from NHEWS analyses
It is clear that in order to advance the body of knowledge in this field, researchers need to undertake comprehensive measured exposures and assessment of noise exposure control measures provision and usage. This is large scale, expensive, difficult and time consuming research. The NHEWS noise analyses have tentatively identified some groups of workers where it is important that noise exposure and controls are assessed because they may be at risk of occupational noise-induced hearing loss.
1. Machinery operators and drivers appear to have increased odds (relative to Technicians and trades workers) of being provided with no controls and increased odds of not being provided with PPE. Further research needs to be undertaken to determine whether or not these workers have and utilise noise exposure controls appropriate to the level of noise they are exposed to. If not, resources need to be directed towards ensuring that the hearing of these workers is protected.
2. Similarly, assessments of noise exposures and noise control measures should be undertaken in the Health and community services industry and Transport and storage industry. These industries had increased odds of being provided with no controls or noise controls other than PPE rather than being provided with PPE together with other control measures.
3. Data should be collected on the occurrence of hearing tests and tests on machinery to evaluate how well employers monitor risks in the workplace.

Noise exposure and the provision of noise control measures in Australian workplaces 36
4. Data should be collected on the occurrence and types of training that are provided to educate workers on how to protect their hearing.
5. Data should be collected on the types of exposure to loud noise that workers experience. This would enable matching of similar cases and could potentially be used to match measured exposures to reported exposures.

Noise exposure and the provision of noise control measures in Australian workplaces 37
References
Ahmed, H. O., J. H. Dennis, and S. G. Ballal 2004. The accuracy of self-reported high noise exposure level and hearing loss in a working population in Eastern Saudi Arabia. International Journal of Hygiene and Environmental Health 207:227-234.
Bøggild, H., H. Burr, F. Tüchsen, and H. J. Jeppesen 2001. Work environment of Danish shift and day workers. Scandinavian Journal of Work, Environment and Health 27:97-105.
Boucsein, W., and W. Ottmann 1996. Psychophysiological stress effects from the combination of night-shift work and noise. Biological Psychology 42:301-322.
Daniell, W. E., S. S. Swan, M. M. McDaniel, J. E. Camp, M. A. Cohen, and J. G. Stebbins 2006. Noise exposure and hearing loss prevention programmes after 20 years of regulations in the United States. Occupational and Environmental Medicine 63:343-351.
Depczynski, J., R. C. Franklin, K. Challinor, W. Williams, and L. J. Fragar 2002. Farm Noise Hazards: noise emissions during common agricultural practices. Australian Centre for Agricultural Health and Safety (ACAHS) and Rural Industries Research and Development Corporation (RIRDC).
Griffin, S., R. Neitzel, W. Daniell, and N. Seixas 2009. Indicators of hearing protection use: self-report and researcher observation. Journal of Occupational and Environmental Hygiene 6:639-647.
Kock, S., T. Andersen, H. A. Kolstad, B. Kofoed-Nielsen, F. Wiesler, and J. P. Bonde 2004. Surveillance of noise exposure in the Danish workplace: a baseline survey. Occupational and Environmental Medicine 61:838-843.
Kurmis, A. P., and S. A. Apps 2007. Occupationally-acquired noise-induced hearing loss: a senseless workplace hazard. International Journal of Occupational Medicine and Environmental Health 20:127-136.
Lutman, M. E. 2000. What is the risk of noise-induced hearing loss at 80, 85, 90 dB(A) and above? . Occupational Medicine 50:274-275.
Meyer, J. D., Y. Chen, J. C. McDonald, and N. M. Cherry 2002. Surveillance for work-related hearing loss in the UK: OSSA and OPRA 1997-2000. Occupational Medicine 52:75-79.
Neitzel, R., W. Daniell, L. Sheppard, H. Davies, and N. Seixas 2009. Comparison of perceived and quantitative measures of occupational noise exposure. The Annals of Occupational Hygiene 53:41-54.
Neitzel, R., N. S. Seixas, J. Camp, and M. Yost 1999. An assessment of occupational noise exposures in four construction trades. American Industrial Hygiene Association Journal 60:807-817.
Palmer, K. T., M. J. Griffin, H. E. Syddall, A. Davis, B. Pannett, and D. Coggan 2002. Occupational exposure to noise and the attributable burden of hearing difficulties in Great Britain. Occupational and Environmental Medicine 59:634-639.
Rubak, T., S. A. Kock, B. Koefoed-Nielsen, J. P. Bonde, and H. A. Kolstad 2006. The risk of noise-induced hearing loss in the Danish workforce. Noise and Health 8:80-87.
Noise exposure and the provision of noise control measures in Australian workplaces 38
Safe Work Australia 2009. The Cost of Work-related Injury and Illness for Australian Employers, Workers and the Community: 2005-06. http://www.safeworkaustralia.gov.au/NR/rdonlyres/EAD5247E-98E7-4750-A35E-A6BC9B1E7781/0/CostsofWorkRelatedInjuryAndDisease_Mar2009.pdf
Seneviratne, M., and W. O. Phoon 2006. Exposure assessment in SMEs: A low-cost approach to bring OHS services to small-scale enterprises. Industrial Health 44:27-30.
Williams, W. H. 2007. Barriers to Occupational Noise Management. Ph D thesis, School of Safety Science, University of New South Wales.

Noise exposure and the provision of noise control measures in Australian workplaces 39
Appendix 1. NHEWS survey methodology
Survey design
The purpose of the NHEWS survey was to gather information to guide decision makers in developing prevention initiatives that ultimately lead to a reduction in occupational disease. Therefore, the survey was designed to collect demographic (e.g. sex, age, educational qualifications) and employment information (occupation, industry, employment conditions, size of workplace) in addition to worker exposure to a variety of different occupational hazards and information about the hazard controls provided in the workplace.
The design and wording of the survey was undertaken by the ASCC in consultation with Australian OHS regulators and a panel of experts. It was based on existing Australian and international hazard exposure survey instruments. For example, these included the European Working Condition Survey, the National Exposures at Work Survey (NIOSH, USA), the Swedish Workplace and Environment Survey and the Victorian WorkCover Authority Worker Survey amongst others.
A draft of the survey was reviewed by Dr Rebbecca Lilley, Preventative and Social Medicine, Injury Prevention and Research Unit, University of Otago, New Zealand who is an expert on occupational hazard exposure. Comments and feedback from her review were incorporated into the survey instrument.
Skirmish testing (undertaken on ASCC staff) and cognitive testing on eleven workers, who were of a low literacy or non-English speaking background, and worked in several industries, was undertaken in face to face interviews.
The survey was piloted by the Victorian WorkCover Authority on 160 workers using the Computer Assisted Telephone Interview (CATI) technique. This assisted in revising the survey length and correcting CATI programming issues.
Feedback from the cognitive and pilot testing was incorporated into the final survey instrument. Of particular relevance to the noise data was the recommendation that noise exposure be collected on two different scales (hours per day and hours per week) since many workers had difficulty describing a typical day at work.
The NHEWS research design and survey instrument were submitted to the University of Sydney Human Research Ethics Committee. The approval reference number is: 02-2008/10506. The research design and instrument met the National Statistical Clearing House guidelines. The research design and instrument were also in accordance with the Australian Market and Social Research Society (AMSRS) guidelines and the research company that undertook the CATI is a member of the AMRSRS and met all privacy and other guidelines.
More information, including the full survey instrument for all occupational hazards and their controls, can be found in the National Hazard Exposure Worker Surveillance (NHEWS): Survey Handbook and the National Hazard Exposure Worker Surveillance (NHEWS) Survey: 2008 Results, which are published on the Safe Work Australia website14.
14 http://www.safeworkaustralia.gov.au/swa/AboutUs/Publications/2008ResearchReports.htm

Noise exposure and the provision of noise control measures in Australian workplaces 40
Noise exposure and noise exposure control measures questions
The specific questions relating to exposure to loud noise were as follows:
1. On a typical day at work last week, how long (hours per day / hours per week) did you work in loud noise?
2. Does your employer (or, in the case of self employed / contractors etc, do you) do any of the following to prevent hearing being damaged by loud noise?
a. provide ear muffs
b. provide ear plugs
c. provide training on how to prevent hearing damage
d. rotate jobs
e. place noisy equipment in an isolated room, or
f. purchase quieter machinery whenever possible.
Loud noise was defined as noise so loud that a person would have to raise their voice to be heard when speaking to people who are at one arm’s length away from them. All questions (except screening and demographics) related to the respondent’s main job, which was the job in which the respondent worked the most hours.
Survey administration
The NHEWS survey was conducted by Sweeney Research Pty Ltd using computer assisted telephone interviews (CATI). The survey obtained an Australia-wide sample of 4500 workers across all seventeen Australian industries. Households were randomly selected using the desk top marketing systems (DTMS) database, which collects its information from directories such as the White / Yellow pages. To be eligible for the research, respondents were required to have worked in the last week and to have earned money from the work. Where more than one individual was eligible for the research, the person whose birthday came next was selected. Overall, the survey achieved a 42.3% response rate.
The sampling scheme for the NHEWS can be considered as two stages with three waves of data collection. The first wave resulted in 1900 completed interviews which met quotas by sex within industry (five national priority industries: Manufacturing, Transport and storage, Construction, Health and community services and Agriculture, forestry and fishing) within state (1300 interviews), plus an additional sample coming from state contributions (600 interviews).
The second and third waves of the survey (ntotal = 2600) placed no restrictions on industry and differed only in that some additional questions were asked. The second wave involved recontacting those households that had not been interviewed in the first wave due to being out of scope (e.g. had no persons working in the priority industries) or quotas already being met, and had given permission to be recontacted for further studies. This wave resulted in 485 completed interviews. The third wave (n=2115) resulted in the balance of the 4500 interviews, meeting sex within state quotas.
For reporting purposes the following industries were collapsed into two integrated industries: 1) Wholesale and Retail trade and 2) Cultural and recreational services and Personal and other services.

Noise exposure and the provision of noise control measures in Australian workplaces 41
Data analyses
The data were analysed using SPSS 16.0. All data were inspected prior to formal analysis for missing cases or unusual values. Kolmogorov-Smirnov tests were applied to all continuous data to determine whether or not the data were normally distributed. The duration of exposure to loud noise data (see below) were not normally distributed and log10 transformations did not improve the fit of the data. Therefore, these data were analysed with non-parametric tests. Note that multinomial logistic regressions do not assume that the data has a normal distribution. The data are presented with means ± standard errors and medians for comparison, owing to the skewed nature of the data.
Duration of exposure data
The analysis of the duration of exposure data was complicated by the fact that workers reported their exposure to loud noise either in terms of hours per day (n=859) or in terms of hours per week (n=590). Conversion of these two scales of measurement to one common scale was not straightforward owing to probable differences in the patterns of noise exposure between those workers who reported daily durations of exposure and those who reported weekly patterns of exposure. Hours of exposure per day were converted to hours of exposure per week because it was assumed that reports of daily durations of exposure were more accurate. This assumption was made on the premise that people reported daily exposures to noise because their exposure to loud noise was more regular. Conversion of hours per day to hours per week was achieved using the following formula:
Eweek = Eday*(Hweek / 8)
where Eweek is the number of hours exposed to loud noise per week, Eday is the number of hours exposed to loud noise per day and Hweek is the number of hours worked per week. Dividing Hweek by 8 gives the number of standard 8 hour working days worked per week. This calculation assumes that workers have the same exposure to loud noise every day they work per week.
Dividing by standard 8 hour working days gives the data more sensitivity to workers who normally work less than or more than a standard day. An alternative method of calculating hours per week (or day) would be to add up the number of days worked15. These methods produce highly correlated data (Pearson: r = 0.69, n = 4491, P = 0.00). However, since noise exposure is regulated in 8 hour blocks, the method that is most sensitive to short or long working hours is the most appropriate for analyses.
Nevertheless, for comparison, hours of exposure to loud noise per week were also converted to hours of exposure per day. This was achieved using the following formula:
Eday = Eweek/(Hweek / 8)
15 Survey participants were asked to indicate which days of the reference week they worked
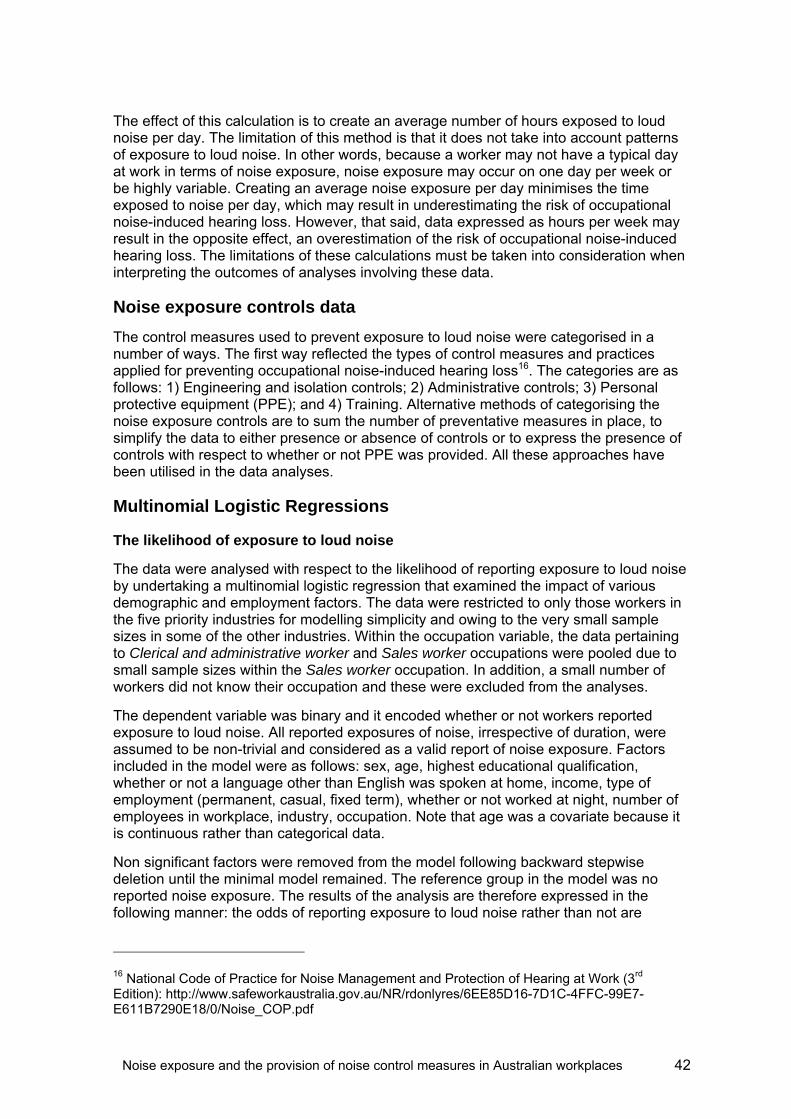
Noise exposure and the provision of noise control measures in Australian workplaces 42
The effect of this calculation is to create an average number of hours exposed to loud noise per day. The limitation of this method is that it does not take into account patterns of exposure to loud noise. In other words, because a worker may not have a typical day at work in terms of noise exposure, noise exposure may occur on one day per week or be highly variable. Creating an average noise exposure per day minimises the time exposed to noise per day, which may result in underestimating the risk of occupational noise-induced hearing loss. However, that said, data expressed as hours per week may result in the opposite effect, an overestimation of the risk of occupational noise-induced hearing loss. The limitations of these calculations must be taken into consideration when interpreting the outcomes of analyses involving these data.
Noise exposure controls data
The control measures used to prevent exposure to loud noise were categorised in a number of ways. The first way reflected the types of control measures and practices applied for preventing occupational noise-induced hearing loss16. The categories are as follows: 1) Engineering and isolation controls; 2) Administrative controls; 3) Personal protective equipment (PPE); and 4) Training. Alternative methods of categorising the noise exposure controls are to sum the number of preventative measures in place, to simplify the data to either presence or absence of controls or to express the presence of controls with respect to whether or not PPE was provided. All these approaches have been utilised in the data analyses.
Multinomial Logistic Regressions
The likelihood of exposure to loud noise
The data were analysed with respect to the likelihood of reporting exposure to loud noise by undertaking a multinomial logistic regression that examined the impact of various demographic and employment factors. The data were restricted to only those workers in the five priority industries for modelling simplicity and owing to the very small sample sizes in some of the other industries. Within the occupation variable, the data pertaining to Clerical and administrative worker and Sales worker occupations were pooled due to small sample sizes within the Sales worker occupation. In addition, a small number of workers did not know their occupation and these were excluded from the analyses.
The dependent variable was binary and it encoded whether or not workers reported exposure to loud noise. All reported exposures of noise, irrespective of duration, were assumed to be non-trivial and considered as a valid report of noise exposure. Factors included in the model were as follows: sex, age, highest educational qualification, whether or not a language other than English was spoken at home, income, type of employment (permanent, casual, fixed term), whether or not worked at night, number of employees in workplace, industry, occupation. Note that age was a covariate because it is continuous rather than categorical data.
Non significant factors were removed from the model following backward stepwise deletion until the minimal model remained. The reference group in the model was no reported noise exposure. The results of the analysis are therefore expressed in the following manner: the odds of reporting exposure to loud noise rather than not are
16 National Code of Practice for Noise Management and Protection of Hearing at Work (3rd Edition): http://www.safeworkaustralia.gov.au/NR/rdonlyres/6EE85D16-7D1C-4FFC-99E7-E611B7290E18/0/Noise_COP.pdf

Noise exposure and the provision of noise control measures in Australian workplaces 43
increased/decreased by a factor x as a result of being employed in y industry/occupation/demographic as opposed to the reference group (z industry/occupation/demographic), while controlling for the effects of the other variables.
The likelihood of providing control measures
The data were analysed with respect to the likelihood of providing control measures that reduce the exposure of workers to loud noise by undertaking multinomial logistic regressions. Two approaches were undertaken. The first approach individually examined the likelihood that each of five categories of noise exposure controls (Any noise control, PPE, Engineering and isolation controls, Training and Administrative controls) were provided in the workplace with respect to a standard set of employment characteristics (industry, occupation and workplace size) and the duration of exposure to loud noise per week. The purpose of these analyses is to identify those workers for whom particular noise control measures are not provided. Therefore, the reference group in these models was ‘control provided’. The results of the analyses are expressed in the following way: the odds of not being provided with particular noise exposure control rather than being provided with said control are increased/decreased by a factor x as a result of being employed in y industry/occupation/demographic as opposed to the reference group (z industry/occupation/demographic), while controlling for the effects of other variables.
The second approach modelled the provision of noise control measures with respect to the provision of PPE. There were four outcome levels in the dependent variable: no noise control measures, noise control measures other than PPE, PPE only and PPE together with other noise control measures. A range of employment variables were modelled and factors that did not significantly affect the model were removed following backwards stepwise deletion until the minimal model remained. Because the purpose of these analyses is to attempt to identify groups of workers with no or few control measures against loud noise, the reference group in the model was PPE together with other control measures. The results of the analyses are therefore expressed in the following manner: the odds of having a particular level of control rather than ‘PPE with other control measures’ is increased / decreased by a factor x as a result of being employed in y industry/occupation/demographic as opposed to the reference group (z industry/occupation/demographic), while controlling for the effects of other variables.
Both approaches examined a restricted data set – only those workers in the priority industries and with known occupation. In addition, the analyses included only workers who had reported they were exposed to loud noise. All reported exposures were assumed to be non-trivial and therefore were included in the analyses (except where it was impossible to convert exposures to a common scale owing to missing hours normally worked data [a small number of cases]).

Noise exposure and the provision of noise control measures in Australian workplaces 44
Appendix 2. Results: statistical analyses and model output
Appendix 2 presents the statistical output of the various models and data analyses that underpin the findings of this report. This section should be read in conjunction with the Results section in the main part of this report because the Results section contains additional descriptive analyses and graphical representations of the data.
Employment and demographic characteristics of Australian workers exposed to loud noise
A multinomial logistic model was used to determine the factors that distinguish workers who reported they were exposed to loud noise from those that reported that they were not exposed to loud noise. There were significant differences in the demographic and employment characteristics of those exposed and unexposed to loud noise (Multinomial logistic regression: χ2 = 694.4, df = 13, P = 0.000). Neither the type of employment (permanent, fixed term, casual), highest educational achievement, number of employees in workplace, whether or not spoke a language other than English at home, nor income affected the likelihood of exposure to loud noise (all P values > 0.05). However, sex, age, whether or not the worker worked at night, industry and occupation all had a significant impact on the likelihood of reporting exposure to loud noise (Table 6).
It is important to recognise that these factors have only been considered in the form of main effects within the multinomial logistic regression presented in Table 6 and Table 7 because including interaction terms caused unexpected singularities in the Hessian matrix. This meant that the validity of models that included interactions was uncertain. The reader should therefore bear in mind that there may be interactions between some of these factors and that main effects of factors are likely to be a simplification of their relationship with the likelihood of reporting exposure to loud noise.
Table 6 Likelihood ratio tests of the multinomial logistic regression: the factors that had a significant impact on the likelihood of reporting exposure to loud noise
Likelihood ratio tests Model factors Chi-square df P
Sex 24.73 1 0.000
Age 27.22 1 0.000
Night work 10.80 1 0.001
Industry 81.73 4 0.000
Occupation 143.56 6 0.000
Nagelkerke Pseudo R-square = 0.284
Goodness of fit: Pearson Chi-square P = 0.192
Controlling for all other variables in the model, the following key findings can be drawn from the analysis (these and other results are presented in Table 7):
1. The odds of reporting exposure to loud noise were increased by a factor of 1.8 if the worker was male rather than female (Wald = 24.86, df = 1, P = 0.000).
2. The odds of reporting exposure to loud noise decreased with increasing age: For every year increase in age the odds of reporting exposure to loud noise decreased by a factor of 0.98 (Wald = 26.88, df = 1, P = 0.000).
3. The odds of reporting exposure to loud noise were increased by a factor of 1.8 by working at night rather than during the day (Wald = 10.79, df = 1, P = 0.001).

Noise exposure and the provision of noise control measures in Australian workplaces 45
4. The odds of reporting exposure to loud noise were increased by a factor of 4.0 by being employed in the Manufacturing industry rather than the Health and community services industry (Wald = 71.45, df = 1, P = 0.000). Working in the Transport and storage, the Construction and the Agriculture, forestry and fishing industries rather than the Health and community services industry also significantly increased the odds of reporting exposure to loud noise.
5. The odds of reporting exposure to loud noise were increased by being employed in all occupations except Professionals relative to Clerical, administrative and sales workers. For instance, the odds of reporting exposure to loud noise were increased by a factor of 5 by being a Technician and trades worker (Wald = 81.04 df = 1, P = 0.000) or a Labourer (Wald = 69.95, df = 1, P = 0.000) rather than a Clerical, administrative and sales worker.
Table 7 The parameter estimates of the minimal multinomial logistic model exploring the likelihood of reporting exposure to loud noise
95% Confidence Interval for Exp(B) MODEL FACTORS
The reference group in this model is ‘did not report exposure’. B Wald df
P value
Odds ratio
Exp(B) Lower Bound
Upper Bound
Intercept -1.753 48.830 1 0.000 AGE -0.019 26.879 1 0.000 0.981 0.974 0.988
SEX Male 0.576 24.856 1 0.000 1.779 1.418 2.231 Female Reference group NIGHT WORK Worked at night 0.571 10.786 1 0.001 1.771 1.259 2.490 Did not work at night Reference group INDUSTRY Manufacturing 1.396 71.446 1 0.000 4.039 2.922 5.584 Transport & storage 0.808 17.955 1 0.000 2.243 1.544 3.259 Construction 0.923 28.202 1 0.000 2.516 1.790 3.538 Agriculture, forestry & fishing 0.694 13.010 1 0.000 2.002 1.373 2.919 Health & community services Reference group OCCUPATION Managers 0.915 22.307 1 0.000 2.496 1.708 3.649 Professionals 0.385 3.858 1 0.050 1.470 1.001 2.159 Technicians & trades workers 1.616 81.041 1 0.000 5.034 3.541 7.158 Labourers 1.617 69.949 1 0.000 5.037 3.449 7.358 Machinery operators & drivers 1.159 35.366 1 0.000 3.188 2.176 4.672 Community & personal service workers 1.018 17.889 1 0.000 2.769 1.727 4.439 Clerical, administrative & sales workers Reference group

Noise exposure and the provision of noise control measures in Australian workplaces 46
Duration of exposure to loud noise
Employment factors that affected the duration of exposure to loud noise17
Participants in the NHEWS survey estimated how many hours per day or per week they were exposed to loud noise. These data were converted to a common scale (hours per week) and the relationship between various employment characters and the duration of exposure to loud noise was explored.
The industry of the workers’ main job had a significant effect on the number of hours workers reported they were exposed to loud noise per week (Kruskal Wallis χ2 = 80.48, df = 4, P = 0.00) (Figure 10). Workers in the Manufacturing industry reported the greatest exposure to loud noise per week while workers in the Health and community services industry reported the least exposure to loud noise.
The occupation of employment also affected the number of hours per week workers reported they were exposed to loud noise (Kruskal Wallis χ2 = 167.7, df = 7, P = 0.00) (Figure 11). Machinery operators and drivers reported the longest exposure to loud noise per week while Professionals reported the shortest exposure to loud noise per week.
Workplace size, as estimated by the number of employees in the workplace, also affected the duration of exposure to loud noise per week. The mean number of hours exposed to loud noise per week increased with workplace size (Kruskal Wallis χ2 = 37.56, df = 3, P = 0.00) (Figure 12).
Noise control measures provided in the workplace
The following analyses pertain to the 1449 workers who reported exposure to loud noise. Workers who reported that they were not exposed to loud noise were not asked about the noise control measures provided in their workplace. Therefore the cohort of data on noise control measures analysed here does not include workers for whom noise control measures have already eliminated noise or reduced noise in their workplace below 85dB(A). This means that the sample may not be representative of workplaces that utilise engineering control measures to eliminate, reduce or regulate loud noise.
Duration of exposure to loud noise and noise control measures
The relationship between the number of noise control measures and the length of time workers were exposed to loud noise was investigated to determine whether or not long exposures to loud noise resulted in the provision of more noise control measures. In support of this, there was a very weak but significant positive correlation between the number of noise exposure control measures in place and the duration of exposure to loud noise per week (Spearmans rs =0.110, n = 1447, P = 0.000). However, there was a large amount of variance in the data and duration of exposure to loud noise is therefore a poor predictor of the number of noise control measures provided in the workplace.
Another approach is to examine the types of noise control measures provided relative to the duration of exposure to loud noise. Long durations of exposure to loud noise may be associated with different noise control provision than short exposures. This was supported by the data in that there was a significant relationship between the type of
17 Median tests confirmed the Kruskal Wallis test findings in cases.

Noise exposure and the provision of noise control measures in Australian workplaces 47
noise control measures used with respect to personal protective equipment (PPE) and the duration of exposure to loud noise (Hours per week: Kruskal Wallis18 χ2 = 51.5, df = 3, P = 0.00). Workers who were provided with PPE were exposed to more loud noise per week than either those who had no noise control measures provided or those who were provided with noise control measures but not PPE (Figure 13). There was no statistical difference between the hours of exposure to loud noise of workers provided with PPE only and the hours of exposure of workers provided with PPE and other control measures. Although, in the NHEWS survey, duration of exposure is not a good estimate of risk of hearing damage, this finding raises the possibility that there may be some workers for which little effort, beyond the provision of PPE, has been made to limit or reduce exposure to long durations of loud noise. PPE is recommended as a measure of last resort when controlling worker exposure to loud noise.
What employment factors are important predictors of the provision of noise control measures in the workplace?
Individual noise control measures
In order to determine what employment factors affect the provision of noise control measures in the workplace, four multinomial logistic regressions were undertaken that individually examined the provision of any control measure, PPE, Engineering and isolation controls, Training and Administrative controls. The statistical output of each of the models is presented in Tables 7-11. The same employment factors (occupation, industry and workplace size) in addition to duration of exposure to loud noise were modelled for each control measure. There was varying success in the ability of the models to explain the variance in the data. While each model was statistically significant and the Pearson goodness of fit adequate, two of the models (Engineering and isolation controls and Administrative controls) had pseudo r-squares of less than 0.06. Therefore, these models in particular need to be interpreted with caution.
Controlling for all other variables in the model, the following key findings can be drawn from the analyses:
1. The odds of not providing any noise control measures as opposed to providing at least one noise control measure were increased by a factor of 2.6 by working in a Professional occupation (Wald = 6.90, df = 1, P = 0.009) and by a factor of 2.0 by working as a Machinery operator and driver (Wald = 4.35, df = 1, P = 0.037) compared to working as a Technician and trades worker (Table 8).
2. All the priority industries had increased odds of not providing any noise control measures as opposed to providing at least one noise control measure compared to the Manufacturing industry. Likewise, workplaces with less than 200 workers had significantly increased odds of not providing any noise control measures compared to workplaces with 200 or more workers (Table 8).
3. The odds of not providing PPE to workers who reported exposure to loud noise were increased by a factor of 3.9 by working in a Clerical, administrative and sales occupation (Wald = 14.43, df = 1, P = 0.000), by a factor of 2.3 by working as a Machinery operator or driver (Wald = 8.55, df = 1, P = 0.003) and by a factor of 2.1 by having a Professional occupation (Wald = 4.36, df = 1, P = 0.037) relative to working as a Technician or trades worker (Table 9).
18 Median tests confirmed these results.

Noise exposure and the provision of noise control measures in Australian workplaces 48
4. The odds of not providing PPE to workers who reported exposure to loud noise were increased by a factor of 55 by working in the Health and community services industry (Wald = 104.16, df = 1, P = 0.000), by a factor of 4.8 by working in the Transport and storage industry (Wald = 30.73, df = 1, P = 0.000) and by a factor of 3.3 by working in the Agriculture, forestry and fishing industry (Wald = 12.57, df = 1, P = 0.000) relative to the Manufacturing industry. There was no difference in the odds of not providing PPE between workers in Construction and Manufacturing industries (Table 9).
5. Workplaces with less than 200 employees had significantly increased odds of not providing PPE to workers who reported they were exposed to loud noise relative to workplaces with 200 or more employees (Table 9). This pattern was consistent for all the noise control measures. Generally, the smallest workplaces had the most increased odds of not providing the noise controls.
6. The provision of engineering and isolation controls was affected by duration of exposure to loud noise and industry, but not occupation or workplace size (Table 10). However, only workers in the Health and community services industry (Wald = 10.80, df = 1, P = 0.001) had increased odds of not providing engineering controls relative to the Manufacturing industry.
7. The odds of not providing training to workers who reported exposure to loud noise were affected by industry and workplace size but not occupation (Table 11). The Health and community services (Wald = 36.22, df = 1, P = 0.000), Transport and storage (Wald = 6.61, df = 1, P = 0.010) and Agriculture, forestry and fishing (Wald = 8.38, df = 1, P = 0.004) industries all had increased odds of not providing training relative to the Manufacturing industry.
8. The odds of not providing administrative controls were increased by a factor of 2 by working in the Health and community services industry (Wald = 4.74, df = 1, P = 0.029) and by a factor of 1.7 by working in the Transport and storage industry (Wald = 6.12, df = 1, P = 0.013) relative to the Manufacturing industry (Table 12).
9. Relative to Technicians and trades workers, Managers had increased odds of reporting that engineering and isolation (Wald = 4.28, df = 1, P = 0.039) or administrative (Wald = 6.36, df = 1, P = 0.012) controls were provided in workplaces.

Noise exposure and the provision of noise control measures in Australian workplaces 49
Table 8 The model output of the multinomial logistic regression examining the provision of any noise control measure in workplaces where workers reported exposure to loud noise
Any noise control measure
Model information
Chi-square df P Minimal model 194.543 14 0.000
Likelihood Ratio Tests Model factors
Chi-square df P Intercept 0.000 Hours exposed to loud noise per week 1.001 1 0.317 Occupation 14.124 6 0.028 Industry 71.653 4 0.000 Workplace size (number of employees) 7.831 3 0.050 Goodness of fit Chi-square df P Pearson 861.182 912 0.884 Nagelkerke Pseudo R-square 0.278
Parameter estimates
95% Confidence interval of Exp B
MODEL FACTORS
The reference group in the model is 'a noise control
measure provided' B Wald df P
Odds ratio
(Exp B) Lower bound
Upper bound
Intercept -4.071 97.019 1 0.000 Hours exposed to loud noise per week -0.005 0.970 1 0.325 0.995 0.984 1.005
OCCUPATION
Managers -0.355 0.762 1 0.383 0.701 0.316 1.556
Professionals 0.958 6.903 1 0.009 2.608 1.276 5.330
Clerical, administrative & sales workers 0.626 2.204 1 0.138 1.871 0.818 4.277
Labourers 0.470 2.036 1 0.154 1.601 0.839 3.054
Machinery operators & drivers 0.669 4.353 1 0.037 1.952 1.041 3.658
Community & personal services 0.786 3.047 1 0.081 2.194 0.908 5.301
Technicians & trades workers Reference group
INDUSTRY
Health & community services 2.862 48.742 1 0.000 17.494 7.834 39.067
Transport & storage 1.884 27.991 1 0.000 6.579 3.274 13.219
Construction 0.792 4.908 1 0.027 2.207 1.096 4.447
Agriculture, forestry & fishing 1.605 15.512 1 0.000 4.980 2.240 11.072
Manufacturing Reference group
WORKPLACE SIZE (number of employees)
Less than 5 0.782 5.449 1 0.020 2.186 1.134 4.215
5 to 19 0.798 6.358 1 0.012 2.221 1.194 4.130
20 to 199 0.589 4.110 1 0.043 1.802 1.020 3.186
200 or more Reference group
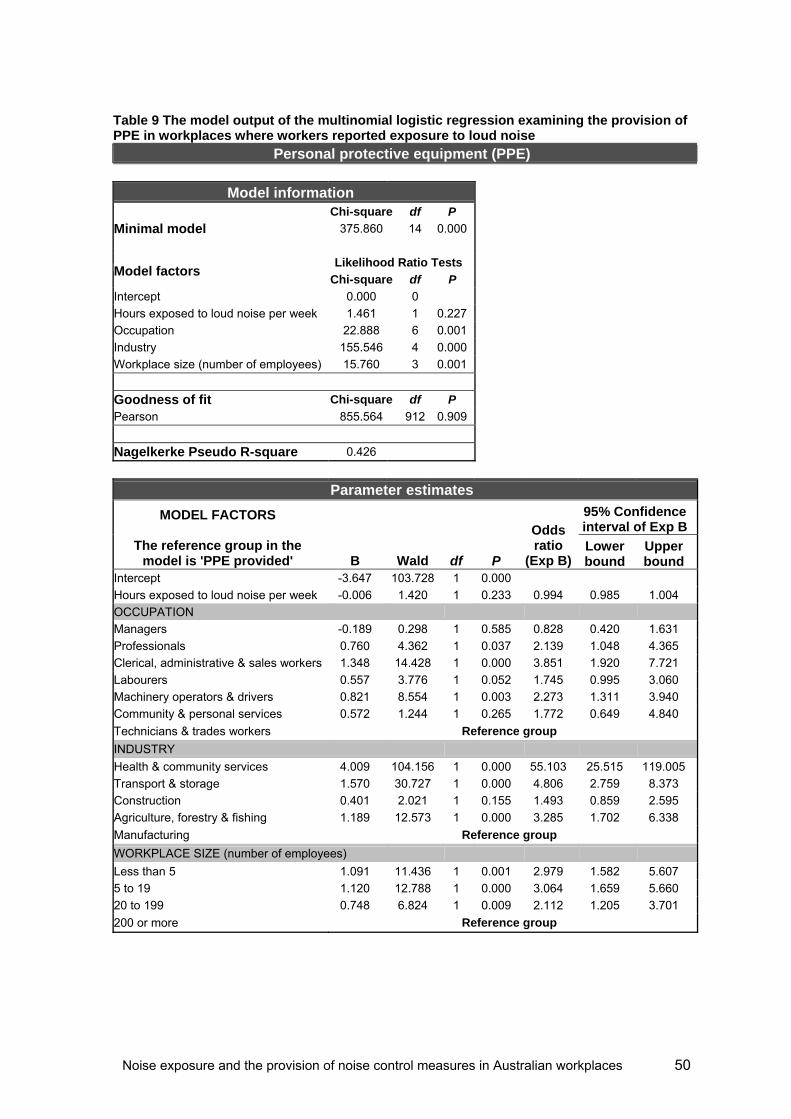
Noise exposure and the provision of noise control measures in Australian workplaces 50
Table 9 The model output of the multinomial logistic regression examining the provision of PPE in workplaces where workers reported exposure to loud noise
Personal protective equipment (PPE)
Model information
Chi-square df P Minimal model 375.860 14 0.000
Likelihood Ratio Tests Model factors
Chi-square df P Intercept 0.000 0 Hours exposed to loud noise per week 1.461 1 0.227 Occupation 22.888 6 0.001 Industry 155.546 4 0.000 Workplace size (number of employees) 15.760 3 0.001 Goodness of fit Chi-square df P Pearson 855.564 912 0.909 Nagelkerke Pseudo R-square 0.426
Parameter estimates
95% Confidence interval of Exp B
MODEL FACTORS
The reference group in the model is 'PPE provided' B Wald df P
Odds ratio
(Exp B) Lower bound
Upper bound
Intercept -3.647 103.728 1 0.000 Hours exposed to loud noise per week -0.006 1.420 1 0.233 0.994 0.985 1.004
OCCUPATION
Managers -0.189 0.298 1 0.585 0.828 0.420 1.631
Professionals 0.760 4.362 1 0.037 2.139 1.048 4.365
Clerical, administrative & sales workers 1.348 14.428 1 0.000 3.851 1.920 7.721
Labourers 0.557 3.776 1 0.052 1.745 0.995 3.060
Machinery operators & drivers 0.821 8.554 1 0.003 2.273 1.311 3.940
Community & personal services 0.572 1.244 1 0.265 1.772 0.649 4.840
Technicians & trades workers Reference group
INDUSTRY
Health & community services 4.009 104.156 1 0.000 55.103 25.515 119.005
Transport & storage 1.570 30.727 1 0.000 4.806 2.759 8.373
Construction 0.401 2.021 1 0.155 1.493 0.859 2.595
Agriculture, forestry & fishing 1.189 12.573 1 0.000 3.285 1.702 6.338
Manufacturing Reference group
WORKPLACE SIZE (number of employees)
Less than 5 1.091 11.436 1 0.001 2.979 1.582 5.607
5 to 19 1.120 12.788 1 0.000 3.064 1.659 5.660
20 to 199 0.748 6.824 1 0.009 2.112 1.205 3.701
200 or more Reference group
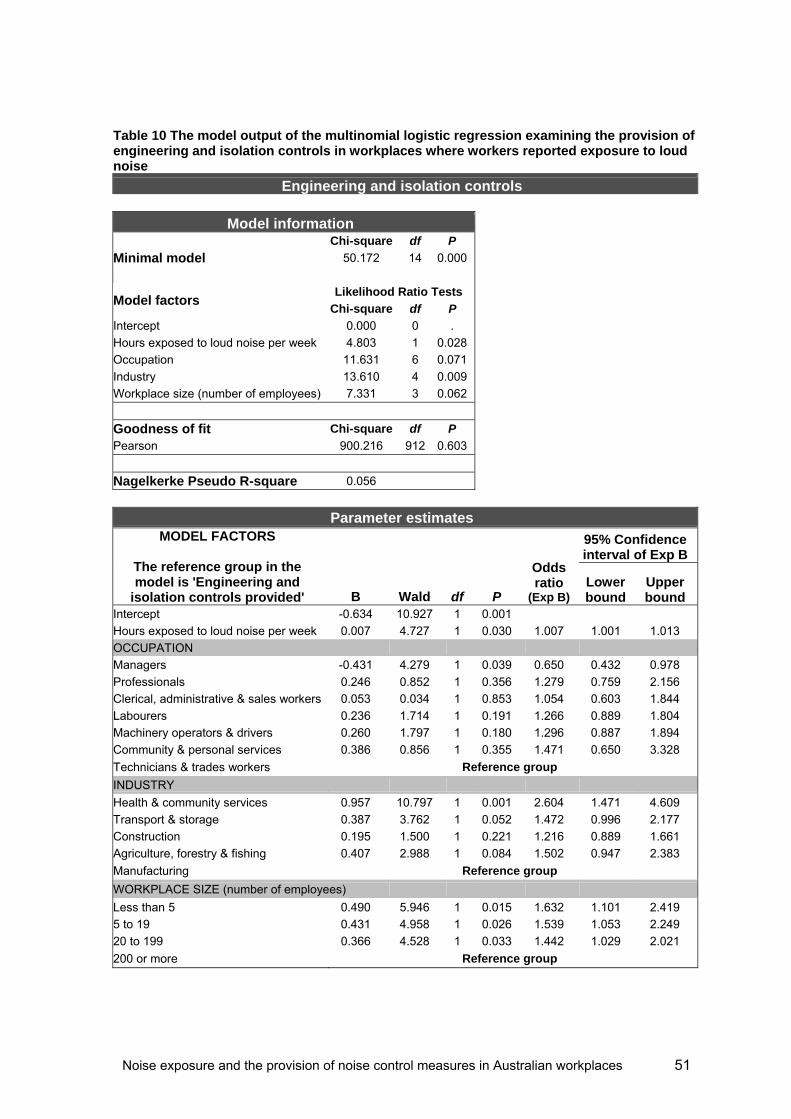
Noise exposure and the provision of noise control measures in Australian workplaces 51
Table 10 The model output of the multinomial logistic regression examining the provision of engineering and isolation controls in workplaces where workers reported exposure to loud noise
Engineering and isolation controls
Model information Chi-square df P Minimal model 50.172 14 0.000
Likelihood Ratio Tests Model factors
Chi-square df P Intercept 0.000 0 . Hours exposed to loud noise per week 4.803 1 0.028 Occupation 11.631 6 0.071 Industry 13.610 4 0.009 Workplace size (number of employees) 7.331 3 0.062 Goodness of fit Chi-square df P Pearson 900.216 912 0.603 Nagelkerke Pseudo R-square 0.056
Parameter estimates
95% Confidence interval of Exp B
MODEL FACTORS
The reference group in the model is 'Engineering and
isolation controls provided' B Wald df P
Odds ratio
(Exp B) Lower bound
Upper bound
Intercept -0.634 10.927 1 0.001 Hours exposed to loud noise per week 0.007 4.727 1 0.030 1.007 1.001 1.013
OCCUPATION
Managers -0.431 4.279 1 0.039 0.650 0.432 0.978
Professionals 0.246 0.852 1 0.356 1.279 0.759 2.156
Clerical, administrative & sales workers 0.053 0.034 1 0.853 1.054 0.603 1.844
Labourers 0.236 1.714 1 0.191 1.266 0.889 1.804
Machinery operators & drivers 0.260 1.797 1 0.180 1.296 0.887 1.894
Community & personal services 0.386 0.856 1 0.355 1.471 0.650 3.328
Technicians & trades workers Reference group
INDUSTRY
Health & community services 0.957 10.797 1 0.001 2.604 1.471 4.609
Transport & storage 0.387 3.762 1 0.052 1.472 0.996 2.177
Construction 0.195 1.500 1 0.221 1.216 0.889 1.661
Agriculture, forestry & fishing 0.407 2.988 1 0.084 1.502 0.947 2.383
Manufacturing Reference group
WORKPLACE SIZE (number of employees)
Less than 5 0.490 5.946 1 0.015 1.632 1.101 2.419
5 to 19 0.431 4.958 1 0.026 1.539 1.053 2.249
20 to 199 0.366 4.528 1 0.033 1.442 1.029 2.021
200 or more Reference group
Noise exposure and the provision of noise control measures in Australian workplaces 52
Table 11 The model output of the multinomial logistic regression examining the provision of Training in workplaces where workers reported exposure to loud noise
Training
Model information Chi-square df P Minimal model 141.364 14 0.000
Likelihood Ratio Tests Model factors
Chi-square df P Intercept 0.000 0 Hours exposed to loud noise per week 0.009 1 0.922 Occupation 6.946 6 0.326 Industry 48.362 4 0.000 Workplace size (number of employees) 58.169 3 0.000 Goodness of fit Chi-square df P Pearson 926.267 912 0.364 Nagelkerke Pseudo R-square 0.153
Parameter estimates
95% Confidence interval of Exp B
MODEL FACTORS
The reference group in the model is 'Training provided' B Wald df P
Odds ratio
(Exp B) Lower bound
Upper bound
Intercept -0.905 20.423 1 0.000 Hours exposed to loud noise per week 0.000 0.009 1 0.922 1.000 0.994 1.007 OCCUPATION Managers -0.370 2.888 1 0.089 0.691 0.451 1.058 Professionals -0.213 0.554 1 0.457 0.809 0.462 1.415 Clerical, administrative & sales workers 0.062 0.045 1 0.832 1.064 0.597 1.897 Labourers 0.208 1.218 1 0.270 1.231 0.851 1.781 Machinery operators & drivers 0.139 0.486 1 0.486 1.149 0.777 1.700 Community & personal services -0.277 0.348 1 0.555 0.758 0.302 1.903 Technicians & trades workers Reference group INDUSTRY Health & community services 2.017 36.216 1 0.000 7.515 3.896 14.495 Transport & storage 0.525 6.614 1 0.010 1.690 1.133 2.520 Construction 0.182 1.240 1 0.265 1.199 0.871 1.652 Agriculture, forestry & fishing 0.727 8.378 1 0.004 2.068 1.264 3.383 Manufacturing Reference group WORKPLACE SIZE (number of employees) Less than 5 1.560 52.173 1 0.000 4.759 3.117 7.268 5 to 19 0.997 24.192 1 0.000 2.711 1.822 4.034 20 to 199 0.579 10.475 1 0.001 1.784 1.257 2.534 200 or more Reference group

Noise exposure and the provision of noise control measures in Australian workplaces 53
Table 12 The model output of the multinomial logistic regression examining the provision of Administrative controls in workplaces where workers reported exposure to loud noise
Administrative controls
Model information
Chi-square df P Minimal model 50.107 14 0.000
Likelihood Ratio Tests Model factors
Chi-square df P Intercept 0.000 0 . Hours exposed to loud noise per week 0.128 1 0.720 Occupation 18.258 6 0.006 Industry 9.642 4 0.047 Workplace size (number of employees) 10.576 3 0.014 Goodness of fit Chi-square df P Pearson 923.455 912 0.389 Nagelkerke Pseudo R-square 0.057
Parameter estimates
95% Confidence interval of Exp B
MODEL FACTORS
The reference group in the model is 'Administrative
controls provided' B Wald df P
Odds ratio
(Exp B) Lower bound
Upper bound
Intercept -0.120 0.386 1 0.534 Hours exposed to loud noise per week 0.001 0.128 1 0.720 1.001 0.995 1.008
OCCUPATION
Managers -0.525 6.361 1 0.012 0.592 0.394 0.890
Professionals 0.574 3.912 1 0.048 1.775 1.005 3.134
Clerical, administrative & sales workers 0.228 0.572 1 0.450 1.256 0.696 2.266
Labourers -0.125 0.474 1 0.491 0.882 0.618 1.260
Machinery operators & drivers 0.335 2.702 1 0.100 1.397 0.938 2.082
Community & personal services 0.069 0.027 1 0.870 1.072 0.467 2.458
Technicians & trades workers Reference group
INDUSTRY
Health & community services 0.671 4.743 1 0.029 1.956 1.069 3.578
Transport & storage 0.521 6.120 1 0.013 1.684 1.114 2.546
Construction 0.127 0.610 1 0.435 1.136 0.825 1.563
Agriculture, forestry & fishing 0.287 1.421 1 0.233 1.332 0.831 2.134
Manufacturing Reference group
WORKPLACE SIZE (number of employees)
Less than 5 0.624 9.094 1 0.003 1.867 1.244 2.800
5 to 19 0.534 7.276 1 0.007 1.705 1.157 2.514
20 to 199 0.322 3.396 1 0.065 1.380 0.980 1.943
200 or more Reference group

Noise exposure and the provision of noise control measures in Australian workplaces 54
Provision of noise control measures relative to the provision of PPE
To overcome the modelling constraints of the individual noise control measures and to reflect multiple control provision, the provision of noise control measures relative to the provision of PPE was examined with respect to employment characteristics. This categorisation resulted in four types of noise control provision: no noise control, noise controls other than PPE, PPE only and PPE together with other noise control measures. Night work and the duration of exposure to loud noise did not have a significant effect on the likelihood of provision of the different types of noise control measures (all P-values > 0.05). However, industry, occupation and the number of workers employed in the workplace all affected the types of noise control measures provided in the workplace (Table 13).
Controlling for all other variables, the following key findings can be drawn from the parameter estimates of this model, which are presented in Table 13:
1. Larger workplaces are less likely than smaller workplaces to provide no noise control measures for their workers: The odds of providing no control measures rather than providing PPE together with control measures were increased by a factor of 3.8 by working with less than 5 other workers or 5-19 workers and by a factor of 2.3 by working with 20-199 workers compared to working with 200 or more workers (all P-values ≤0.008).
2. The relationship between workplace size and noise control provision described above was consistent across the other different types of control measures provided. The odds of providing control measures other than PPE or PPE only rather than providing PPE together with other control measures were increased by working with less than 200 other workers.
3. The odds of being provided with no noise control measures rather than being provided with PPE together with other noise control measures were significantly increased by working in any priority industry compared to the Manufacturing industry (all P-values ≤0.033). For instance, the industry most likely to provide no control measures was the Health and community services industry, where the odds of providing no control measures were increased by a factor of 51.3 relative to the Manufacturing industry.
4. The odds of being provided with no noise control measures rather than being provided with PPE together with other noise control measures were increased by a factor of 2.7 by working in a Professional occupation (Wald = 5.93, df = 1, P = 0.015), by a factor of 2.5 by working as a Clerical, administrative or sales worker (Wald = 4.19, df = 1, P = 0.041) and by a factor of 2.1 by working as a Machinery operator and driver (Wald = 4.95, df = 1, P = 0.026) compared to working as a Technician or trades worker.
5. The odds of being provided with noise control measures other than PPE rather than being provided with PPE together with other noise control measures were increased by a factor of 60 by working in the Health and community services industry rather than the Manufacturing industry (Wald = 63.13, df = 1, P = 0.000) and by a factor of 2.6 by working in the Transport and storage industry rather than the Manufacturing industry (Wald = 4.78, df = 1, P = 0.029).
6. The odds of being provided with noise control measures other than PPE rather than being provided with PPE together with other noise control measures were increased by a factor of 5.4 by working in a Clerical, administrative or sales

Noise exposure and the provision of noise control measures in Australian workplaces 55
occupation rather than working as a Technician or trades worker (Wald = 12.22, df = 1, P = 0.000).
7. The odds of being provided with PPE only as opposed to PPE together with other control measures were unaffected by industry or occupation. Therefore, except for the effect of workplace size (described above in point 2) there is very little difference between workplaces that provide PPE and those that provide PPE together with other noise control measures.

Noise exposure and the provision of noise control measures in Australian workplaces 56
Table 13 The model output of the multinomial logistic regression examining the factors that affected the likelihood of the provision of noise control measures with respect to the provision of PPE
Noise control measures relative to the provision of PPE
Model information Chi-square df P Minimal model 417.97 39 0.00
Likelihood Ratio Tests Model factors Chi-square df P Intercept 0.00 0 Occupation 170.72 12 0.00 Industry 34.85 18 0.01 Workplace size (number of employees) 36.50 9 0.00 Goodness of fit Chi-square df P Pearson 326.58 300 0.14 Nagelkerke Pseudo R-square 0.339
Parameter estimates 95% Confidence interval of Exp B
MODEL LEVELS AND FACTORS The reference group in the
model is ‘PPE and other noise control measures’ B Wald df P
Odds ratio
(Exp B) Lower bound
Upper bound
NO NOISE CONTROLS Intercept -4.26 103.65 1 0.00
OCCUPATION
Managers -0.42 1.00 1 0.32 0.66 0.29 1.49
Professionals 0.98 5.93 1 0.01 2.67 1.21 5.87
Clerical, administrative & sales workers 0.90 4.19 1 0.04 2.46 1.04 5.83
Labourers 0.54 2.55 1 0.11 1.72 0.88 3.33
Machinery operators & drivers 0.72 4.95 1 0.03 2.06 1.09 3.90
Community & personal services 0.91 2.41 1 0.12 2.49 0.79 7.88
Technicians & trades workers Reference group
INDUSTRY
Health & community services 3.94 69.41 1 0.00 51.31 20.32 129.58
Transport & storage 1.94 28.46 1 0.00 6.95 3.41 14.16
Construction 0.77 4.56 1 0.03 2.17 1.07 4.40
Agriculture, forestry & fishing 1.59 14.40 1 0.00 4.89 2.15 11.11
Manufacturing Reference group WORKPLACE SIZE (number of employees) Less than 5 1.33 13.40 1 0.00 3.80 1.86 7.76
5 to 19 1.32 14.16 1 0.00 3.76 1.89 7.49
20 to 199 0.85 6.93 1 0.01 2.33 1.24 4.37
200 or more Reference group

Noise exposure and the provision of noise control measures in Australian workplaces 57
Parameter estimates 95% Confidence interval of Exp B
MODEL LEVELS AND FACTORS The reference group in the
model is ‘PPE and other noise control measures’ B Wald df P
Odds ratio
(Exp B) Lower bound
Upper bound
NOISE CONTROLS BUT NO PPE Intercept -4.38 79.60 1 0.00
OCCUPATION
Managers -0.06 0.01 1 0.91 0.94 0.34 2.64
Professionals 0.28 0.27 1 0.61 1.32 0.46 3.78
Clerical, administrative & sales workers 1.69 12.22 1 0.00 5.40 2.10 13.89
Labourers 0.55 1.45 1 0.23 1.74 0.71 4.27
Machinery operators & drivers 0.80 3.13 1 0.08 2.22 0.92 5.37
Community & personal services 0.33 0.24 1 0.63 1.39 0.37 5.15
Technicians & trades workers Reference group
INDUSTRY
Health & community services 4.10 63.13 1 0.00 60.10 21.88 165.06
Transport & storage 0.95 4.78 1 0.03 2.58 1.10 6.01
Construction -0.15 0.12 1 0.73 0.86 0.36 2.07
Agriculture, forestry & fishing 0.68 1.67 1 0.20 1.97 0.71 5.47
Manufacturing Reference group
WORKPLACE SIZE (number of employees) Less than 5 1.39 9.13 1 0.00 4.02 1.63 9.90
5 to 19 1.36 10.36 1 0.00 3.88 1.70 8.87
20 to 199 0.79 4.08 1 0.04 2.21 1.02 4.78
200 or more Reference group
PPE ONLY
Intercept -1.83 56.06 1 0.00
OCCUPATION
Managers -0.28 1.12 1 0.29 0.76 0.45 1.27
Professionals 0.00 0.00 1 0.99 1.00 0.46 2.14
Clerical, administrative & sales workers -0.64 1.61 1 0.20 0.53 0.20 1.42
Labourers 0.16 0.55 1 0.46 1.18 0.76 1.82
Machinery operators & drivers 0.06 0.05 1 0.82 1.06 0.65 1.72
Community & personal services 0.77 0.78 1 0.38 2.17 0.39 12.09
Technicians & trades workers Reference group
INDUSTRY
Health & community services -0.62 0.73 1 0.39 0.54 0.13 2.24
Transport & storage -0.15 0.29 1 0.59 0.86 0.49 1.50
Construction 0.01 0.00 1 0.95 1.01 0.69 1.48
Agriculture, forestry & fishing -0.05 0.03 1 0.86 0.95 0.53 1.69
Manufacturing Reference group
WORKPLACE SIZE (number of employees)
Less than 5 1.11 16.32 1 0.00 3.05 1.77 5.23
5 to 19 0.93 11.34 1 0.00 2.54 1.48 4.36
20 to 199 0.55 4.63 1 0.03 1.74 1.05 2.88
200 or more Reference group
Noise exposure and the provision of noise control measures in Australian workplaces 58
List of Figures
Figure 1 The percentage of workers who reported they were exposed to loud noise within worker age groups. ............................................................................................................10
Figure 2 The percentage of night workers, day workers and all workers who reported they were exposed to loud noise by occupation. Note that in this case ‘all workers’ refers just to workers in the priority industries. * indicates that there were less than 10 workers who worked at night in the occupation and these data should be interpreted with caution.11
Figure 3 The percentage of night workers, day workers and all workers who reported they were exposed to loud noise by industry. * indicates that there were less than 10 workers who worked at night in these industries and these data should be interpreted with caution........................................................................................................................11
Figure 4 Noise exposure and employment characteristics of the main occupations in the Manufacturing industry ......................................................................................................13
Figure 5 Noise exposure and employment characteristics of the main occupations in the Construction industry .........................................................................................................14
Figure 6 Noise exposure and employment characteristics of the main occupations in the Transport and storage industry..........................................................................................14
Figure 7 Noise exposure and employment characteristics of the main occupations in the Agriculture, forestry and fishing industry............................................................................15
Figure 8 Noise exposure and employment characteristics of the main occupations in the Health and community services industry ...........................................................................15
Figure 9 The mean ± 95% confidence interval and median hours of exposure to loud noise per week of all workers who reported exposure to loud noise. The categories depict the reporting scales (hours per day and hours per week) and the combined data on a common scale of hours per week. .....................................................................................16
Figure 10 The mean (± 95% confidence interval) hours exposed to loud noise per week in the national priority industries. .......................................................................................17
Figure 11 All workers: The mean (± 95% confidence interval) hours of exposure to loud noise per week by occupation. ..........................................................................................18
Figure 12 All workers: The mean (± 95% confidence interval) hours of exposure to loud noise per week by the number of employees at the place of employment. .......................19
Figure 13 All workers: The mean (± 95% confidence interval) hours of exposure to loud noise per week by the provision of noise control measures. .............................................21
Figure 14 The provision of noise control measures to workers exposed to loud noise in the national priority industries ............................................................................................27
Noise exposure and the provision of noise control measures in Australian workplaces 59
List of Tables
Table 1 The maximum length of time (minutes) a worker can be exposed to sound without exceeding LAeq, 8h 85dB(A) and typical sound levels of common occupational noises ..................................................................................................................................4
Table 2 The likelihood of reporting exposure to loud noise. Parameter estimates of multinomial logistic model. Only statistically significant differences in odds are presented.9
Table 3 Noise exposure control measures: frequencies and percentages of those exposed to loud noise by methods of categorising noise exposure control measures......20
Table 4 The odds of not providing the following noise controls in the workplace: Any controls, PPE, Engineering, Training & Administrative controls. .......................................24
Table 5 The parameter estimates of the multinomial logistic regression model examining the provision of noise control measures relative to the provision of PPE together with other noise control measures. Only statistically significantly different odds are presented.26
Table 6 Likelihood ratio tests of the multinomial logistic regression: the factors that had a significant impact on the likelihood of reporting exposure to loud noise............................44
Table 7 The parameter estimates of the minimal multinomial logistic model exploring the likelihood of reporting exposure to loud noise ...................................................................45
Table 8 The model output of the multinomial logistic regression examining the provision of any noise control measure in workplaces where workers reported exposure to loud noise ..................................................................................................................................49
Table 9 The model output of the multinomial logistic regression examining the provision of PPE in workplaces where workers reported exposure to loud noise.............................50
Table 10 The model output of the multinomial logistic regression examining the provision of engineering and isolation controls in workplaces where workers reported exposure to loud noise ..........................................................................................................................51
Table 11 The model output of the multinomial logistic regression examining the provision of Training in workplaces where workers reported exposure to loud noise .......................52
Table 12 The model output of the multinomial logistic regression examining the provision of Administrative controls in workplaces where workers reported exposure to loud noise53
Table 13 The model output of the multinomial logistic regression examining the factors that affected the likelihood of the provision of noise control measures with respect to the provision of PPE ................................................................................................................56