health hazard assessment for gluten exposure in individuals with
TRANSCRIPT

Health Hazard Assessment for Gluten Exposure
in Individuals with Celiac Disease:
Determination of Tolerable Daily Intake Levels
and Levels of Concern for Gluten
Office of Food Safety
Center of Food Safety and Applied Nutrition
Food and Drug Administration
May 2011

The following document is a health hazard assessment for gluten exposure in a sensitive subpopulation group, specifically individuals with celiac disease (CD). It consists of several components1. The introductory hazard identification section examines and provides an overview of the nature and characteristics of the adverse effects associated with CD found in susceptible individuals and also that of gluten proteins involved in inducing these effects. The hazard assessment section first describes the nature of the evaluation performed on the available health effects data associated with CD. This evaluation includes both a dose-response assessment and a safety assessment derived from data from individuals in this sensitive subpopulation. The former assessment describes and characterizes the dose-effect data examined for morphological and clinical adverse effects that are reflective of CD, and the latter determines the tolerable daily intake (TDI) levels of exposure for each of these types of adverse effects in sensitive individuals. The hazard assessment section also includes an exposure assessment in which a number of estimates of gluten consumption from food products are determined and presented. The final risk characterization section addresses the uncertainty issues associated with the data available and the estimates derived, and identifies the TDI of primary focus for adverse morphological and clinical effects in this assessment. In addition, these TDIs, along with the exposure estimates, were employed to derive various levels of concern (LOC) for gluten in food for individuals with CD.
Hazard Identification Health Effects Celiac Disease Exposure to certain grains or certain protein components of them can result in adverse health consequences, particularly the development of celiac disease (CD), in genetically predisposed individuals (Maki and Collin, 1997; AGA, 2001; Farrell and Kelly, 2002; Green and Jabri, 2003; Dickson et al., 2006). A significant part of the genetic predisposition to CD is associated with specific human leukocyte antigen (HLA) class II genes in the major histocompatibility complex (MHC) of chromosome 6 (Godkin and Jewell, 1998; Fasano and Catassi, 2001; Green and Jabri, 2003). For the most part, individuals with CD express either the HLA-DQ2 or the HLA-DQ8 haplotypes (Green and Jabri, 2003; Konig, 2005; Kagnoff, 2005). The majority (90 – 95%) of those who develop CD encode the HLA-DQ2 molecules, while the rest of those who suffer from CD
1 Examples of sources that address the components of this process follow: National Research Council. Risk Assessment in the Federal Government: Managing the Process. National Academy Press, Washington, DC, 1983 Merrill RA. Chapter 30: Regulatory Toxicology. Casarett and Doull’s Toxicology: The Basic Science of Poisons, Fourth edition. MO Ambur, J Doull, CD Klassen, Editors. New York: Pergamon Press, Inc., pp. 1011-1023, 1996 Faustman EM, Omenn GS. Chapter 4: Risk Assessment. Casarett and Doull’s Toxicology: The Basic Science of Poisons, Fourth edition. MO Ambur, J Doull, CD Klassen, Editors. New York: Pergamon Press, Inc., pp. 75- 88, 1996
2

typically express the HLA-DQ8 molecules (Dewar et al., 2004; Konig, 2005; Kagnoff, 2005). The presence and expression of these HLA-DQ alleles are recognized as necessary for the development of CD but not alone sufficient for the disease to occur (Green and Jabri, 2003; Dewar et al., 2004; Kagnoff, 2005). The contribution of other non-HLA genes, some not yet defined, also has emerged as pivotal in the genetic susceptibility associated with the development of CD (Godkin and Jewell, 1998; Fasano and Catassi, 2001; Green and Jabri, 2003; Dewar et al., 2004; Hunt, 2008). Finally, other factors may also have a determining influence on disease susceptibility (Murray, 1999; Green and Jabri, 2003). They include environmental factors (e.g., breast-feeding, infections), abnormalities in the immune system (e.g., selective IgA deficiency), and certain genetic-based syndromes (e.g., Down syndrome, Turner’s syndrome) (Murray, 1999; Fasano and Catassi, 2001; Green and Jabri, 2003; AGA, 2006). CD is a permanent hypersensitivity reaction triggered by ingestion of wheat, barley, or rye2, or the plant storage proteins of these grains (Farrell and Kelly, 2002; Green and Jabri, 2003; Dickson et al., 2006) that can occur at any age (Marsh, 1992; AGA, 2001; Fasano and Catassi, 2001). It results in an immune-mediated enteropathy which is associated with damage to the lining of the small intestine (AGA, 2001; Fasano and Catassi, 2001; Dickson et al., 2006). The mucosal lesion in the small intestine that is characteristic of CD typically involves abnormal morphology such as inflammatory cell infiltrate in the lamina propria, influx of lymphocytes in the epithelium, flattened or irregular epithelial cells, hyperplasia of crypts, stunted and disorganized microvilli and ultimately, a significant degree of villous atrophy (Marsh, 1992; AGA, 2001; Fasano and Catassi, 2001; Farrell and Kelly, 2002; Green and Jabri, 2003; Dickson et al., 2006). The most significant histological abnormalities are usually found in the proximal small intestine (e.g., duodenum) with the abnormalities less severe distally along the small intestine, but the disorder can progress distally (e.g., jejunum), and even involve the entire small intestine in some individuals (MacDonald et al., 1964; Dickson et al., 2006; Murray et al., 2008).
A diverse array of clinical signs and symptoms are often associated with untreated CD (Fasano and Catassi, 2001). Many are tied, at least in part, to the enteropathy associated with CD. However, the manifestation of the clinical responses in CD, along with their severity, are not associated with the extent of this enteropathy in the small intestine or the degree of mucosal damage seen (Rostom et al., 2006; Brar et al., 2007; Murray et al., 2008; Murray and Rubio-Tapia, 2008). The extent and emergence of clinical responses seen is thought to be related to the length of the small intestine affected by enteropathic changes with more symptomatology present as mucosal histopathology progresses distally starting from the duodenum (Fasano and Catassi, 2001; Farrell and Kelly, 2002; Green and Jabri, 2003; Dickson et al., 2006). The so-called “classic” signs and symptoms of CD include chronic diarrhea or constipation, steatorrhea, recurrent abdominal distension or abdominal pain, nausea and/or vomiting (Maki and Collin, 1997; AGA,
2 Reference to the 3 principal CD-inducing grains of wheat, rye and/or barley in the “Hazard Identification” section (and later in a general sense in the “Summary and Conclusions” section) of this document implies the inclusion of associated cross-bred hybrid grains like triticale (which is a hybrid of wheat and rye) and their gluten-related proteins.
3

2001; Fasano and Catassi, 2001; Green et al., 2001; Farrell and Kelly, 2002; Green and Jabri, 2003; Dickson et al., 2006). Often seen with the enteropathy of CD are aspects of malabsorption and related sequelae associated with substantial morbidity such as anemia, nutritional deficiencies, growth disturbances, weight loss and osteopenia or osteoporosis (Maki and Collin, 1997; AGA, 2001; Fasano and Catassi, 2001; Green et al., 2001; Meyer et al., 2001; Farrell and Kelly, 2002; Green and Jabri, 2003; Dickson et al., 2006). Other signs and symptoms that have been reported in those afflicted by CD are, among many others, fatigue, irritability, malaise, anorexia, mouth ulcers, headaches, mood changes, depression, pain and various neurological responses (Maki and Collin, 1997; AGA, 2001; Fasano and Catassi, 2001; Green et al., 2001; Farrell and Kelly, 2002; Green and Jabri, 2003). However, these clinical reactions are not always exhibited in CD. Many individuals can have underlying histological abnormalities in the small intestine mucosa that characterizes them as having CD but they remain asymptomatic or “subclinical” (Maki and Collin, 1997; AGA, 2001; Fasano and Catassi, 2001; Green and Jabri, 2003; Dickson et al., 2006). This disease status is sometimes referred to as “silent” CD (Maki and Collin, 1997; Green and Jabri, 2003). Further, in some cases of CD, individuals appear to be asymptomatic or they do not report the classic CD-related gastrointestinal symptoms (Fasano and Catassi, 2001), but closer evaluation of their clinical state reveals they often experience some degree of atypical CD-related condition(s) (e.g., anemia, fatigue, neurological problems, short stature) not always readily recognized, at least initially, by the patients or their physicians as CD (Ventura et al., 1999; Fasano and Catassi, 2001; Green and Jabri, 2003). This often leads to a delayed diagnosis of many years (often >10 years) for CD sufferers with contributing factors to this delay being adherence first to one or more alternate diagnoses and/or consultation with more than one physician prior to receiving a correct diagnoses of their illness (Green and Jabri, 2003; Green et al., 2001) . Finally, some investigators (Maki and Collin, 1997; Fasano and Catassi, 2001; Murray et al., 2003) have noted a change in the nature and/or pattern of the presentation of the signs and symptoms in those afflicted with CD in recent decades. A greater proportion of newly diagnosed cases exhibit atypical clinical features of the disease than seen in the past where the typical, classic CD-associated gastrointestinal symptoms were more likely identified.
Dermatitis Herpetiformis
Dermatitis herpetiformis (DH) is another chronic condition associated with exposure to wheat gluten and related protein derivatives in rye and barley (Fasano and Catassi, 2001; Farrell and Kelly, 2002). It is an autoimmune skin disease in genetically susceptible individuals that results in clusters of an intensely pruritic skin rash characterized by papules and vesicles (Farrell and Kelly, 2002; Green and Jabri, 2003) . These lesions are typically located in a symmetrical fashion on the extensor surface of the elbows and knees in addition to the lower back or buttocks, scalp of the back of the head and posterior neck (Fasano and Catassi, 2001; Farrell and Kelly, 2002; Green and Jabri, 2003). DH usually has a gradual onset and usually emerges in adulthood (Merck Manual, 2006). Those with a family history of DH have an increased risk of developing DH. Almost all patients with DH have some degree of gluten-sensitive enteropathy (Fasano and Catassi, 2001; Farrell and Kelly, 2002; Green and Jabri, 2003), but it is typically not accompanied by intestinal symptoms (Maki and Collin, 1997; Fasano and Catassi, 2001).
4

Thus, it is considered a subclinical and/or asymptomatic enteropathy. Finally, DH is thought of by some clinicians as a variant of or a type of manifestation of CD rather than an associated disease (Maki and Collin, 1997; Fasano and Catassi, 2001). Other Health Effects Other medical conditions or states have also emerged as a part of the spectrum of clinical presentations associated with CD (and also with DH) (Fasano and Catassi, 2001). A brief overview of some of the significant secondary adverse health effects associated with CD is presented below. Autoimmune Diseases A number of autoimmune diseases are more likely to occur in patients with CD than in the general population (Collins et al., 1994; Fasano and Catassi, 2001; Farrell and Kelly, 2002; Green and Jabri, 2003). Some examples of these autoimmune diseases are Type 1 diabetes mellitus, autoimmune thyroiditis, autoimmune hepatitis, Sjogren’s syndrome, Addison’s disease, and rheumatoid arthritis, among a number of others (Collin et al., 1994; Maki and Collin, 1997; Ventura et al., 1999; Fasano and Catassi, 2001; Green et al., 2001; Farrell and Kelly, 2002; Green and Jabri, 2003). Factors suggested as important in this relationship between CD and the development of autoimmune diseases are the duration of exposure to diets containing the relevant cereal proteins or the age at diagnosis of CD (Ventura et al., 1999; Green and Jabri, 2003; Peters et al., 2003). Some have put forth the notion that the increased risk of individuals with CD developing these types of diseases is proportional to the time of exposure to gluten (Fasano and Catassi, 2001; Farrell and Kelly, 2002; Green and Jabri, 2003). Children with CD diagnosed and treated at a young age show no increased frequency of autoimmune disorders (Ventura et al., 1999; Green and Jabri, 2003); whereas, those diagnosed with and treated for CD as older children or adults do (Ventura et al., 1999; Collin et al., 1994; Guidetti et al., 2001). However, others have not found an association between the prevalence of autoimmune diseases in adults and an index of duration of gluten exposure (Guidetti et al., 2001) or in adults when their age of diagnosis was assessed across different decades of life grouped together (Biagi et al., 2002). Possibly the relationship between gluten exposure and the development of autoimmune disease is a factor in the first few decades of life but not in older adults. However, because only indirect indices of actual total gluten exposure before and after CD occurrence have been examined to date, a clear delineation of the relationship between gluten exposure and the development of autoimmune disease in those individuals with CD is difficult at this time until more precise dietary exposure analyses over time (and maybe age), including on GFDs, are performed. Next, when the presence of CD is “silent,” the autoimmune disorder is often diagnosed first (Ventura et al., 1999; Green and Jabri, 2003), and thus the detrimental effects of continued intake of significant grain proteins are unrecognized until if or when CD is ultimately diagnosed. Finally, the emergence of CD sometimes follows the development of an autoimmune disease. At least one example of this is found with Type I diabetes mellitus, where in some cases CD is not present at the time of diagnosis of diabetes but emerges later (Glastras et al., 2005; Barton and Murray, 2008).
5

Bone Diseases CD is often accompanied by secondary diseases that reflect the existence of abnormalities in bone metabolism (Green and Jabri, 2003; Bianchi and Bardella, 2002; Capriles et al., 2009). A high risk of developing the bone diseases of osteopenia, osteoporosis and/or the less common osteomalacia is associated with individuals with CD (Valdimarsson et al., 1996; Meyer et al., 2001; Bianchi and Bardella, 2002; Bernstein et al., 2003; Bianchi, 2010). Osteopathic complications of CD are thought to be the most frequently occurring of the secondary health effects associated with CD (McGough and Cummings, 2005; Cranney et al., 2007). The bone pathogenesis that can emerge as an outcome of CD is multifactorial in nature (Meyer et al., 2001; Green and Jabri, 2003; Stazi et al., 2008; Capriles et al., 2009) and attributed to a complex cascade of aberrant effects linked to the compromised state of the gastrointestinal mucosa in CD (Corazza et al., 1995; Bernstein et al., 2003; Capriles et al., 2009; Bianchi, 2010). Chronic malabsorption of dietary calcium and vitamin D, along with the activation of intestine mucosal inflammatory responses (e.g., cytokine release), contributes to the reduced bone mineral density (BMD) and/or bone mineral content (BMC) that is often found in individuals with CD (Corazza et al., 1995; Bianchi and Bardella, 2002; Bernstein et al., 2003; Stazi et al., 2008; Capriles et al., 2009; Bianchi, 2010). The abnormalities in the regulation of calcium homeostasis associated with CD-related bone loss and/or weakness also includes elevated levels of the hypercalcemic parathyroid hormone and altered levels of plasma vitamin D metabolites (e.g., 1,25(OH)2 vitamin D) which are two humeral factors that typically play a significant and coordinated role in maintaining normal serum calcium levels, and equilibrium in, and thus normal, bone turnover and bone remodeling levels (Corazza et al., 1995; Bianchi and Bardella, 2002; McGough and Cummings, 2005; Stazi et al., 2008; Capriles et al., 2009; Bianchi, 2010). Reduced BMD levels are commonly found in individuals at the time of diagnosis with CD (Valdimarsson et al., 1996; Meyer et al., 2001; Green and Jabri, 2003; Goddard and Gillett, 2006). It is seen in those diagnosed as adults as well as those diagnosed as children or in adolescence (Meyer et al., 2001; Green and Jabri, 2003; Goddard and Gillett, 2006; Capriles et al., 2009). Although the findings are limited in nature, some evidence also suggests that a reduced bone mineral content (BMC) can also be observed at the time of diagnosis of CD (Bianchi and Bardella, 2002; Bianchi, 2010). This increased risk of CD-associated low BMD, and possibly of low BMC, serves to also increase the likelihood of individuals with CD not reaching the typical “optimal peak bone mass” (Corazza et al., 1995; Meyer et al., 2001; Bianchi, 2010), a state that is normally achieved by bone mass gains made by ages 20 to 30 years old and that is critical as a basis for maintaining bone health throughout life and during aging (Corazza et al., 1995; Bernstein et al., 2003; Stazi et al., 2008; Capriles et al., 2009). In addition, attaining a lower (i.e., less than optimal) peak bone mass during growth and maturation potentially leads to a higher risk of developing osteopenia and/or osteoporosis (and/or probably osteomalacia) as well as fractures in later years (Stazi et al., 2008; Capriles et al., 2009; Bianchi, 2010). The bone disorder of osteopenia has been observed in children and adults at the time of diagnosis with CD with a large proportion of diagnosed adults presenting with osteopenia
6

(Bianchi and Bardella, 2002; Bernstein et al., 2003; Capriles et al., 2009; Bianchi, 2010). Osteopenia is found in individuals with CD who are symptomatic as well as those with CD who are asymptomatic (Corazza et al., 1995; Valdimarsson et al., 1996; Cellier et al., 2000; Bianchi and Bardella, 2002; Bianchi, 2010). Individuals who have silent CD are also susceptible to developing osteopenia (Maki and Collin, 1997; Bianchi, 2010). Osteoporosis, a state that reflects a progression to a more severe reduction in BMD along with alteration in bone microarchitecture (Capriles et al., 2009; Bianchi, 2010), is also observed in young and adult celiac patients (McFarlane et al., 1995; Bernstein et al., 2003; Goddard and Gillett, 2006; Capriles et al., 2009) and includes both symptomatic and asymptomatic patients (Bernstein et al., 2003; Bianchi and Bardella, 2002; Bianchi, 2010). The likelihood of its presence at the time of diagnosis of CD is greater than is seen for the occurrence of this disease in the general population (Bernstein et al., 2003) where it is typically an affliction associated with middle to elder age. Next, osteomalacia is another bone-related clinical manifestation of CD (Ciclitira et al., 2001; Bianchi and Bardella, 2002; Bernstein et al., 2003; Murray, 2005; Bianchi, 2010). It reflects a reduced mineralization of the collagen matrix component of bone and leads to “softening” of bone (Stazi et al., 2008; Bianchi, 2010). This less common condition was more often recognized as a complication of CD in earlier studies (Corazza et al., 1995; Bianchi and Bardella, 2002; Bianchi, 2010) but direct assessment (by biopsy) of its presence has not been routinely performed in recent years (Ciclitira et al., 2001; Meyer et al., 2001; Bianchi, 2010). The low bone mass seen in CD may be due at times at least in part to osteomalacia (Corazza et al., 1995; Murray, 2005). The consequence of osteoporosis and/or osteomalacia for celiac sufferers is an increased susceptibility to bone fragility fractures, an affect seen in both children and adults (Bernstein et al., 2003, Cranney et al, 2007; Ludvigsson et al., 2007; Stazi et al., 2008; Capriles et al., 2009; Bianchi, 2010). The association between CD and bone fractures is supported by findings of increases in bone fractures experienced by those with CD in comparison to individuals without CD when considerations such as fractures of all bone types total or of certain specific bones (e.g., wrist, hip), or history of previous fractures were assessed (Bianchi and Bardella, 2002; Bernstein et al., 2003; Goddard and Gillett, 2006; Ludvigsson et al., 2007; Olmos et al., 2008; Capriles et al., 2009; Bianchi, 2010). Finally, the metabolic bone derangement found in CD is often accompanied by elevated levels of the hypercalcemic parathyroid hormone which leads to a persistent state of hyperparathyroidism (Corazza et al., 1995; Bianchi and Bardella, 2002; Capriles et al., 2009; Bianchi, 2010). This can in some instances become a chronic, irreversible condition which is referred to as “secondary hyperparathyroidism” that remains even after CD treatment is employed and that negatively influences skeletal improvements observed with a gluten-free diet (Bernstein et al., 2003; Bianchi, 2010). Last, exposure to gluten plays a significant role in the development of metabolic bone disease in CD. Treatment of CD with a gluten-free diet over an extended time (1 - 5 years) can lead to improvement in a proportion of individuals with CD that are afflicted by the range of gluten-induced bone abnormalities (e.g., less than optimal peak bone mass, reduced BMD, osteopenia, osteoporosis) (McFarlane et al., 1995; Valdimarsson et al., 1996; Fasano and Catassi, 2001; Ciclitira et al., 2001; Bianchi and Bardella, 2002; Bernstein et al., 2003; McGough and Cummings, 2005; Capriles et al., 2009), but a large
7

individual variability is seen in the nature and degree of responsiveness to an avoidance diet with respect to bone health effects (Corazza et al., 1995; Meyer et al., 2001; Goddard and Gillett, 2006; Capriles et al., 2009). Instances of complete reversal to attain optimal peak bone mass and to accrual normal BMD are typically only seen in young children diagnosed with CD who chronically adhere to a strict gluten-free diet (Corazza et al., 1995; Bernstein et al., 2003; Capriles et al., 2009; Bianchi, 2010). No information on the lowest levels of exposure to gluten associated with induction of abnormalities in bone metabolism is available. However, the gluten avoidance diet typically employed to date has not been found to counter in a significant number of cases, particularly in adults and at times in adolescents, all adverse effects on bone and long-term skeletal health associated with CD (Corazza et al., 1995; Meyer et al., 2001; Ciclitira et al., 2001 and 2003; Capriles et al., 2009; Bianchi, 2010). Malignancies Next, a number of malignancies also occur more often in celiac patients than in others without the disease (Maki and Collin, 1997; Green et al., 2001; Green and Jabri, 2003). Many of the cancers associated with CD are gastrointestinal malignancies such as enteropathy-associated T-cell lymphoma, small bowel adenocarcinoma, and esophageal and oropharyngeal squamous carcinoma (Logan et al, 1989; Maki and Collin, 1997; Fasano and Catassi, 2001; Green et al., 2001; Farrell and Kelly, 2002; Green and Jabri, 2003; Peters et al., 2003; Catassi et al., 2005). An increase incidence of primary liver cancer and an increase occurrence of extra-intestinal lymphomas and B-cell lymphomas have also been reported in patients with CD (Green and Jabri, 2003; Peters et al., 2003; Catassi et al., 2005). As with many autoimmune diseases, an increased risk of developing cancer, especially gastrointestinal malignancies, is proportional to the time of exposure to grains linked to CD (Logan et al, 1989; Fasano and Catassi, 2001; Peters et al., 2003; Catassi et al., 2005) or degree of compliance with GFD (Fasano and Catassi, 2001; Catassi et al., 2005). Correspondingly, children diagnosed at a young age and maintained on a strict celiac prevention diet to control CD show no increased risk of cancer versus the general population. Mortality Rate Third, a higher mortality rate is reported for individuals with CD than for the general population (Logan et al, 1989; Corrao et al., 2001; Peters et al., 2003), which has been attributed to both the associations between CD and autoimmune disease(s) and/or malignancies (Logan et al, 1989; AGA, 2001; Corrao et al., 2001; Fasano and Catassi, 2001; Green and Jabri, 2003; Peters et al., 2003; Catassi et al., 2005). There is also some suggestion that the association between CD and osteoporosis and bone fractures is a potential contributing factor (Ciclitira et al., 2001; Bianchi and Bardella, 2002). Supporting these findings with respect to autoimmune disease(s) and malignancies is that an increased mortality rate is not seen in individuals that are diagnosed in childhood (Logan et al, 1989; Fasano and Catassi, 2001; Green and Jabri, 2003; Catassi et al., 2005) and particularly not in those children that chronically maintain a strict celiac protective diet (Fasano and Catassi, 2001; Catassi et al., 2005). Furthermore, mortality is seen to increase in CD patients that experienced a delay in diagnosis after onset of symptoms (Corrao et al., 2001) or that exhibited poor compliance with the dietary regimen treatment (Corrao et al., 2001). Lastly, the association between long-term or chronic ingestion of a
8

very low level or trace amount of cereal protein in an avoidance diet and the subsequent development of cancer, autoimmune diseases or bone diseases has not been systematically investigated in any comprehensive fashion (Chartrand et al., 1997; Catassi et al., 2005). Dietary Effects Gluten Nature and Characteristics of the Components of Gluten Gluten is a component of wheat that consists of complex mixture of heterogeneous plant storage proteins (Stern et al., 2001; Howdle, 2006). A traditional classification of the polypeptide fractions of wheat gluten protein divides these fractions into two major components, gliadin and glutenin, based on their solubility in aqueous alcohol (Stern et al., 2001; Howdle, 2006). Gliadin is the fraction of wheat proteins soluble in alcohol (or prolamin category of proteins), and glutenin is the fraction of wheat proteins insoluble in alcohol (or glutelin category of proteins) (AGA, 2001; Kasarda, 2005b; Howdle, 2006). The gliadin fraction can be subdivided further into several closely related groups of peptide subfractions, being the -gliadin, -gliadin, -gliadin and -gliadin subfractions (Ciclitira et al., 1984b; Marsh, 1992; Stern et al., 2001; Kasarda, 1994; Howdle, 2006). A range of work conducted over many years has established that each of these subfractions can be enterotoxic in sensitive individuals (Kendall et al., 1972; Ciclitira et al., 1984b; Stern et al., 2001). In contrast, at least in part because of problems inherent in the separation and purification of the glutenin subcomponent of gluten, it was originally thought not to be significantly toxic (Kasarda, 1994; Dewar et al, 2006; Howdle, 2006). However, some more recent evidence suggests glutenin also has adverse effects on the intestinal mucosa. In vitro and in vivo studies indicate that exposure to glutenin leads to immunostimulatory and/or histopathological changes in the tissue of the small intestine of sensitive individuals, or in related cell systems (Vader et al., 2002; Dewar et al., 2006; Howdle, 2006). The classification of wheat into the gliadin and glutenin components as described above represents the “classic” delineation of gluten protein that is most commonly referenced in the literature, and the distinctions associated with them are the ones most often addressed (Howdle, 2006). Subsequently, other approaches in classifying gluten protein have been put forth. Instead of using chemical solubility properties as the basis of making delineations, the criterion that other classifications systems have employed are based on primary structure of the gluten protein (e.g., amino acid composition and sequences) (Stern et al., 2001; Howdle, 2006), or on molecular weight subunits (Shewry et al., 1986). This latter classification system allowed the glutenin fraction of gluten to be further subdivided into covalent aggregate protein subfractions consisting of a low molecular weight (LMW) subunit and a high molecular weight (HMW) subunit (HMW subunits x and y) (Shewry et al., 1986; Howdle, 2006). These other approaches have revealed that although there is great heterogeneity in the complex mixture of wheat proteins, similarities between and overlap in the primary amino acid peptide structures for the different gliadin and glutenin proteins and their subfractions exist (Howdle, 2006).
9

Similar repetitive amino acid sequences suggest that a significant degree of homology between the different types of proteins within wheat gluten probably exist (Stern et al., 2001; Howdle, 2006). Howdle (2006) indicated that this information from the other classification systems provides additional support for the notion that glutenins are also toxic to individuals sensitive to wheat gluten even though limited in vivo challenge studies are available directly demonstrating this. In addition, some recent findings suggest that the sensitivity of celiac patients and/or their small intestine tissue to the differing array of gluten protein peptides derived from gliadin and glutenin subfractions varies across individuals and appears to be heterogeneous for, but specific to, each individual (Vader et al., 2002; Dewar et al., 2006). Nature of the Definition of Gluten A significant discrepancy is found in the use and thus “definition” of the term gluten. For the most part, except for a few instances very recently, in the medical literature that has examined the role of grains in conditions such as CD (or DH) and in a substantial portion of the basic science literature that has investigated gluten protein, gluten is considered as a component of each of the grains, wheat, rye and barley (Kasarda, 2005a; Kasarda, 2005b). Gluten is commonly referred to as the protein in these grains (prolamin and glutelin category proteins) responsible for adverse health effects in susceptible individuals (Kasarda, 2005b). This broad use of the term gluten has also carried over into its meaning to celiac patients and their physicians (Kasarda, 2005a; Kasarda, 2005b). Those afflicted with CD are thought of as “gluten-sensitive” and described as maintaining “gluten-free diets.” Technically, however, gluten is a protein moiety found only in wheat grain (Kasarda, 2005a; Kasarda, 2005b). Like wheat, rye and barley also contain major plant storage proteins that are thought to trigger enteropathy reactions, but again technically, they are not gluten (Kasarda, 2004; Kasarda, 2005a). For example, comparable to the prolamin category protein of gliadin in wheat, rye and barley have the prolamin-like proteins secalin and hordein, respectively (AGA, 2001; Green and Jabri, 2003). But no significant direct study of the clinical and toxic effects of these and other relevant rye and barley proteins and their subfractions (e.g., glutelin category proteins or the like) has been performed (Kasarda, 1994; Kasarda, 2001; Kasarda, 2004). The pathogenesis of the specific proteins of these two grains is principally inferred from two sources of information. First, the findings of clinical studies and anecdotal medical reports indicating that those diagnosed with CD (or DH) and confirmed to be sensitive to wheat also react to the ingestion of rye and barley cereal and also improve with removal these cereals (in addition to wheat) from their diet (Kasarda, 1994; Stern et al., 2001; Kasarda, 2005a). Second, plant taxonomy classifications reveal that the cereal plants of wheat, rye and barley are all members of the grass family, Gramineae, in the single tribe, Tricticeae (or Hordeae) (Kasarda, 1994; Kasarda, 2001; Kasarda, 2004; Kasarda, 2005a; Dickson et al., 2006). This close relation in plant taxonomy schemes is put forth as indirect evidence that some similarities are present in the constituent amino acid peptide sequences of the storage proteins of these different cereals and that they would be associated with some degree of similarity in toxic effects (Marsh, 1992; Stern et al., 2001; Kasarda, 2004; Kasarda, 2005a). Taken together, the discrepancy that exists in the meaning and use of the term “gluten” contributes to confusion in the interpretation of the results of experiments and of human challenge studies investigating the nature of the
10

properties and effects of gluten. Many of the specifics of the findings and conclusions of the research on “gluten” can only be assumed to apply to wheat gluten and its protein components. Information on the nature and effects of the relevant proteins of wheat, rye and barley in relation to each other is lacking (e.g., toxic equivalency factors) (Kasarda, 2004). Hence, without information on the relative potency of the respective protein derivatives of these different cereals, the appropriateness of extrapolation of quantitative data derived from wheat gluten studies, for instance, dose-response effects, to other toxic grains is problematic at this time. Gluten-Free Diet The only effective treatment currently available for the sensitive subpopulation of individuals that develop CD and other associated conditions is to avoid the trigger of the disease (AGA, 2001). This is achieved by permanently eliminating the cereals of wheat, rye and barley (AGA, 2001; Green and Jabri, 2003) and all their respective disease-inducing protein constituents from the diet of CD-diagnosed individuals (Marsh, 1992; Maki and Collin, 1997; Kasarda, 2005a). The dietary regimen is commonly called a “gluten-free diet” (or GFD)3. Although the rate of recovery varies between individuals, this treatment is associated with decreases in clinical signs and symptoms, resolution of histopathologic morphology of the small intestine, and reports of improved quality of life in individuals with CD (AGA, 2001; Green et al., 2001; Green and Jabri, 2003). The improvements seen in CD sufferers on a GFD relapse upon re-introduction of dietary gluten (Farrell and Kelly, 2002; Kasardi, 2001). Hazard Assessment A health hazard assessment was performed to determine a tolerable intake level of gluten in individuals susceptible to its adverse effects. Exposure to dietary gluten in a “normal,” healthy individual causes no detrimental health effects. Only individuals who are sensitive to gluten ingestion because of having developed CD or DH have the potential to react adversely to exposure to this substance in a fashion that characterizes an active state of these diseases. The adverse health effect that was the primary focus of this assessment was CD4. It is a serious illness that is directly tied to gluten intake and that is associated with significant overt and covert toxicological effects. It also has a secondary connection to a number of other disorders and diseases. Thus, individuals with CD are the subgroup
3 Although gluten is technically only found in the grain wheat, a “gluten-free diet” (GFD) typically refers to avoidance of all the following grains, wheat, rye and barley, and their relevant offending proteins. When used in this document, the GFD term will refer to avoiding all the dietary content described here (not just that related to wheat). 4 The development of CD in response to gluten exposure is the so-called “critical effect” of focus in this hazard assessment. Although it can emerge as a separate disease in response to gluten ingestion, the development of DH alone subsequent to gluten exposure (without the apparent presence of CD) was not the focus of the dose-response analyses in this assessment. However, the occurrence of DH as an adverse condition associated with gluten ingestion in CD-diagnosed subjects was one of the clinical effects considered in this assessment. See also information on “clinical effects” in sections that follow in this document and in Appendix B.
11

of concern within the general population, in other words, the “sensitive subgroup” and the focus of this evaluation. The examination of the development of CD in this sensitive subpopulation in response to gluten exposure was executed by assessing CD-diagnosed subjects on a GFD and thus, for the most part, in an “inactive” state of the disease who were challenged with doses of gluten resulting in the development of “active” CD. The resulting available dose-response data that characterized the occurrence and nature of the adverse effects associated with CD in this sensitive subgroup served as the basis of the hazard assessment performed. Dose-Response Assessment Nature of Studies and Data Evaluated Study Design and Related Data Characteristics A survey of the available published literature that included dose-response information on the adverse health effects of gluten (or toxic protein derivatives of gluten) in individuals with CD was conducted. The primary source of health effects information was food challenge tests which to date were principally used in humans for diagnostic purposes, or to characterize the nature of CD itself, of the effects of gluten and/or of the sensitive subpopulation. The “food”, in this case, gluten (or a derivative of it), when administered orally, was ingested directly, in another food vehicle or as a constituent of a food product (e.g., bread). The majority of food challenges performed were open challenge tests, meaning all involved in the test (subjects, test administrators etc.) are aware of the food (or placebo) being tested. Only a few studies conducted tests that were single blind, meaning only the subject is unaware of the food (or placebo) being tested, or were double blind, meaning both the subject and test administrators are unaware of the food (or placebo) being tested. Most of the studies did not include a placebo challenge group, but some did include control subjects and/or control substances for comparison. Double-blind, placebo-controlled food challenges (DBPCFC) are often thought of as the “gold standard” with respect to design of a challenge study. It is especially useful to have a placebo challenge as a control when evaluating clinical symptoms of a subjective nature in test subjects. However, in instances when the challenge-induced adverse responses of subjects tend to be individualistic in nature and to greatly differ between individuals, a very large number of subjects per treatment group is needed in DBPCFC studies to obtain measures of central tendency (e.g., means) that are representative of the treatment effects. Arranging, justifying and/or maintaining participation of very large number of human subjects to such challenges that induce a disease state is often very difficult. Aspects of the design of open challenge studies include a “within subject” control phase(s) as a comparison for the results of the challenge period, along with possible comparison to control subjects and/or control substances. The majority of the open challenge studies that investigated CD did collect pre-challenge (GFD) data or samples for various measures (e.g., small intestine mucosa) as a baseline, followed by collection of experimental gluten challenge data or samples (AB experimental design5). Some studies
5 “AB experimental design” refers to a study protocol were experimental measures are taken under different conditions on the same subjects. First, the “A” represents the pre-test state when a baseline measure(s) of a dependent variable(s) is taken on study subjects prior to introduction of the independent experimental
12

also included collection of post-challenge (GFD) data (ABA experimental design6). In other words, in these types of designs, subjects serve as their own controls which can be of value when the responses of subjects tend to be individualistic in nature which appears to be the nature of the adverse reactions to gluten in CD. In addition, many of the toxic endpoints in open challenge studies that were evaluated in this assessment were underlying changes in morphological or physiological measures which would be more difficult for a subject’s biases to influence. Also, in a number of studies, the morphological evaluations of the small intestine histology samples were analyzed in a “blind” fashion by the study pathologists. Clinical responses reported by subjects after an open challenge was also considered in this assessment, and the issue of the subjects being aware, and not “blind,” that they received gluten or gluten protein is a factor to be noted. This is particularly the case with clinical responses of a subjective, covert nature (e.g., abdominal pain, nausea, fatigue) in contrast to clinical effects of an overt nature (e.g., diarrhea, vomiting, DH). In sum, the findings from prospective, open challenge studies, along with available single- or double-blind challenge studies, were considered in this hazard assessment because they were available and provided a significant amount of quantitative data to assist in the determination of levels of toxicological importance with respect to gluten exposure and CD. The evaluation of the relevance of findings of the quantitative dose-effects studies included consideration of the weight-of-evidence of these challenge studies in supporting the levels of toxicological importance or concern identified (see the section “Basis of Weight-of-Evidence Evaluations and Determinations” that follows for more details on the weight-of-evidence approach and specific weight-of-evidence considerations employed in this assessment). Routes of Exposure The challenge studies examined administered gluten (or related compound) via oral ingestion, or via infusion or perfusion directly into the small intestine. Dose-response information was considered from both types of routes of administration to obtain as many of data points of reference and sources of comparison as possible. However, the data from studies that used oral routes of administration were considered the most relevant7 and ultimately of primary focus in this assessment and in identifying critical dose-response studies.
variable. The “B” represents the experimental state when a measure(s) of a dependent variable(s) is taken on study subjects during application of the independent experimental variable. 6 “ABA experimental design” refers to a study protocol were experimental measures are taken under different conditions on the same subjects. The first “A” and ”B” referred to in the ABA experimental design reflect the experimental conditions described in the footnote above that references the AB design. The second “A” in the ABA experimental design represents the post-test state when a measure(s) of a dependent variable(s) is taken on study subjects after the removal of the independent experimental variable. 7 Exposure to gluten via the oral route of administration in studies was considered to best reflect the nature of exposure to gluten that would be experienced through normal dietary exposure. Some types of oral administration of gluten such as via capsules may not approximate dietary exposure as closely as other manners of oral administration, so this factor was also considered in assessing study findings.
13

Nature and Characteristics of the Toxic Responses Evaluated Timing of Adverse Response Several significant characteristics of the nature of the toxicity of gluten in CD emerge from a review of the published findings of gluten challenge studies. These characteristics, in turn, play a role in the approach taken in this health hazard assessment to delineate and to evaluate the available data. First, tremendous variability in the timing of the adverse reaction to gluten existed between individuals. The reactions to gluten (or related protein subfractions) occur after acute8, subacute2, subchronic9 and long-term or chronic10 exposure durations to these substances (Klaasen and Eaton, 1991). These differences in reaction timeframes for gluten are exhibited both between subjects within the same study, and across subjects in different studies. To date the findings within a gluten-challenge study have been assessed together as a whole without any consideration of the differences in the time of occurrence of the adverse reaction, meaning the data on a measurement of a response that occurred after an acute exposure was grouped together and analyzed along with data measuring its occurrence after chronic gluten exposure. In contrast, in this hazard assessment, the toxicities associated with different exposure durations were separately analyzed within each study. Data on acute reactions, defined here as reactions that occurred within hours to about 14 days, were grouped together, as were the data on subchronic, and on long-term to chronic reactions. Subchronic reactions were considered toxic responses that occurred after about 14 days to 3 months of gluten exposure, and long-term to chronic11 toxic reactions were considered those that occurred after 3 or more months of exposure to gluten or its toxic protein derivatives. Next, if individual subjects within a study reacted after different durations of exposure to gluten (or related compound), and if separate data for each individual subject were available in the study, the data within each single study were reorganized12 and reanalyzed13 in accordance with
8 According to Klaasen and Eaton (1991), acute toxicological exposures are traditionally defined as exposures of < 24 hours. Subacute toxicological exposures are defined as repeated exposures of a duration of about 14 days or sometimes 21 days. In this assessment, these types of exposure duration were combined and referred to as “acute” exposures. See the text above for the specific delineations made in defining the “exposure duration” terms used in this assessment. 9 Subchronic toxicological exposures are considered repeated exposures lasting up to 3 months duration (Klaasen and Eaton, 1991). 10 Long-term or chronic toxicological exposures are defined as repeated exposures of longer than 3 months (Klaasen and Eaton, 1991). 11 From this point on in this document, studies of long-term to chronic length are referred to only as “chronic” studies and their defined duration are as noted here in the text. Also, these long-term duration periods appeared to best capture the timeframes of the available data. 12 For example, for an individual study, the data of subjects that reacted to a gluten challenge with an adverse effect in an acute timeframe were grouped and considered together, while the data of those that reacted after a subchronic duration were grouped together and considered separately. 13 For the most part, reanalyzed means for an individual study the average of measurement value(s) for the newly organized group categories (e.g., acute, subchronic, chronic) were determined, and pre- and post-challenge “mean” values were compared for the various measurements associated with each group category. In some instances, the measurement value(s) associated with the post-challenge response were compared to a control group. (Also see the discussion of further approaches used in evaluating data in the section titled “Basis of Weight-of-Evidence Evaluations and Determinations.)
14

the duration type of the toxicity associated with each subject14. If individual subject data were not available in a study, the results were considered for the duration type that most closely approximates the timeframe of the adverse effect of the group of subjects. The studies identified as having dose-response adverse effect data for the acute, subchronic, and/or chronic categories of toxicity were listed under these respective categories in Appendix A. Each referenced study was reviewed and information on the relevant characteristics of each study was also presented in this appendix. Type of Adverse Responses A difference in the nature of the toxic responses elicited by individuals with CD is another significant characteristic that emerges from the review of the adverse effects literature. The responses exhibited by subjects in challenge tests varied widely. Some subjects exhibited clinical signs and symptoms (e.g., diarrhea, constipation, abdominal pain, nausea, fatigue) to a gluten challenge, and others did not. The adverse clinical reactions reported were themselves also different for each subject. For some subjects, the only adverse reaction exhibited was morphological (e.g., small intestine mucosa), or possibly physiological (e.g., gastrointestinal absorption measures, immune response), in nature. And, for some subjects, a combination of types of adverse reactions was exhibited. In this assessment, information on clinical and morphological and/or physiological types of toxic reactions were considered, and when possible evaluated separately15. This assessment of clinical and/or morphological/physiological effects exhibited within a study was made in conjunction with the respective timing (e.g., acute, subchronic) of each type of these adverse reactions16. It should be kept in mind, however, that information on clinical and morphological and/or physiological reactions are not always collected or reported in every study. A clinical toxic endpoint can also be one or more of a group of signs or symptoms. Also, the endpoint(s) with respect to morphological or physiological responses that are available in a study is driven to some degree on the analytical techniques, methodologies and measures available at the time the challenge test was performed17. For instance, newer challenge studies were found to
14 Of the approximately 46 references with dose-response data that were reviewed, about 13 studies had adverse effects that were exhibited by subjects over more than one type of duration of gluten exposure (i.e., acute, subchronic and/or chronic). Only 5 of these studies were considered to contain low-dose gluten challenge data and thus, subsequently assessed in detail in Appendix B. 15 Of the approximately 46 references with dose-response data that were reviewed, about 30 studies had findings on both morphological and/or physiological and clinical adverse effects in subjects in response to a gluten challenge. Only 11 of these studies were considered to contain low-dose gluten challenge data and thus, subsequently assessed in detail in Appendix B. 16 These delineations were done separately for clinical and for morphological/physiological effects. 17 It is important to note that biopsies of the small intestine collected and analyzed in the challenge studies reviewed for dose-response information in this assessment were taken from different locations along the small intestine. Many studies collected samples from the jejunum (usually more proximal part of), while a few did so from the duodenum (usually more distal part of). Several studies also noted doing so at the juncture of the two small intestine sections (e.g., duodenojejunal flexure, at ligament of Treitz). Some of these differences in the source of the biopsy may be related to the time periods in which the study was performed. Earlier studies tended to take samples from the jejunum and some more recent studies sometimes took them from the duodenum. The biopsy techniques for sample collection available at the time of the study are also a factor in the location. Finally, Dickson et al. (2006) indicated that evidence suggests that the histological CD characteristics observed in the duodenum strongly correlates with that seen in the jejunum.
15

measure different parameters, probably being more sophisticated in meeting criteria associated with CD, than older challenge studies18. In this assessment, the dose-effect relationship with respect to most of these different parameters was considered. They contributed to the body of available dose-effect information. They also allowed for the evaluation of the weight-of-evidence of the various findings both within studies and across studies in determining levels of gluten exposure associated with adverse effects in CD sufferers and in assessing the studies that characterize the lower dose levels of adverse reactivity (see the section “Basis of Weight-of-Evidence Evaluations and Determinations” that follows for more details on the weight-of-evidence approach and specific weight-of-evidence considerations employed in this assessment). Age Groups of Subjects Evaluated Also noted in the literature were differences in the toxic reactions to gluten exposure seen between children and adults with CD. For example, the clinical manifestations of CD and the morphological changes to treatment are found to differ between these two age groups (Kumar et al., 1979; Maki and Collin, 1997; Fasano and Catassi, 2001; Wahab et al., 2001; Farrell and Kelly, 2002; Green and Jabri, 2003). Also the occurrence of other CD-associated diseases differs between these groups (Logan et al, 1989; Ventura et al., 1999; Green and Jabri, 2003; Capriles et al., 2009). Other age-related factors associated with differences in disease responsiveness (e.g., autoimmune disease prevalence) or outcome (e.g., mortality) of secondary conditions associated with CD patients include “age at diagnosis” and “age at initial hospitalization"(Ventura et al., 1999; Peters et al., 2003). Thus, in this health hazard assessment, the dose-response data for children (<18 years) and adults (> 18 years) were analyzed separately19, 20. The challenge study findings for children and adults were presented in different section groupings in Appendix A and in separate sections of Tables 1-3 and 5-7 in Appendix B. Other Relevant Dose-Response Data Characteristics Some other considerations were made in conducting this health hazard assessment for gluten. First, most challenge studies only tested one dose of gluten or gluten protein constituent. Thus, the ranges of doses of exposure with respect to each type and category of toxicity were collected to try to assess the nature of the dose-response effect that exists across different levels of exposure across different studies. Second, subjects in the different challenge studies were administered wheat gluten, one of its offending protein
18 An example of this difference in physiological measures is between early studies that assessed fecal fat levels and gastrointestinal absorption versus subsequent ones that assessed various antibody levels. Another example is seen with morphological assessments that evaluated the histopathological nature of small intestine morphology after gluten exposure. Early studies described the characteristics of the resulting changes in gastrointestinal morphology, while later ones enlisted established rating systems with specific criteria to characterize and distinguish these gluten-induced changes. 19 In a few cases, this delineation was done as the closest approximation to these age groups that the information in the study allowed. 20 Of the approximately 46 references with dose-response data that were reviewed, 2 studies had gluten challenge findings for adverse effects in both children and adults where the results for each age group were assessed separately within each study. Only 1 of these studies were considered to contain low-dose gluten challenge data and thus, subsequently assessed in detail in Appendix B. This particular study described separate data on the effects of a gluten challenge in individual subjects, so grouping data by age group in this case was not warranted.
16

subfractions such as gliadin, or other related compound such as Frazer’s peptic-tryptic digest of gluten (FF3). The doses of exposure for each study were expressed as an amount of gluten to allow for comparison of values across studies. These gluten levels were sometimes obtained by utilizing conversion factors that were available, such as converting a dose of gliadin to its comparable gluten dose (More details on the basis of this latter conversion with respect to this assessment are presented in the following paragraph.).21, 22, 23 Third, only the challenge results from subjects recognized as having CD24 within a study were considered in this hazard analysis. The data for other subjects whose diagnosis of CD was not confirmed or supported were excluded from dose-response consideration. This required reorganization and reanalysis of the data in some instances within some studies25. Fourth, in the gluten exposure studies examined, the results are not presented or interpreted within a toxicological risk assessment framework. For this hazard/safety analysis, they were reinterpreted within this frame of reference. The no observable adverse effect level (NOAEL) and the lowest observable adverse effect level (LOAEL) for each study were derived from both information contained in the experimental protocol of the study about the administered dose(s) of exposure, and in the experimental results about the adverse effect response(s) that is associated with a particular dose(s). The NOAEL, if available and the LOAEL for both clinical effects and morphological and/or physiological effects were identified. The basis of the conversion factor to equate exposures of gliadin and gluten applied in this hazard assessment was the quantitative value for the relationship between levels of
21 The gluten-related agent and its dosage(s) administered to the subject(s) in each challenge study is indicated in Appendix A. Information on the conversion factors used, if any, in determining the dosage of gluten itself for a particular study is also provided in Appendix A. 22 The conversion factors for FF3 were derived from information available in each study about the methods and/or procedure used in the preparation of this fraction (e.g., Frazer et al., 1959; Leigh et al., 1985). See Appendix A for source and/or details about conversion factor determined for each study. 23 At least one study with some dose-effect information on the high molecular weight glutenin subunits (HMW-GS) subfraction of glutenin was identified (e.g., Dewar et al., 2006). However, a conversion factor for this peptide with respect to gluten was not located. See Appendix A for information on conversion factors associated with each study. 24 The subjects were diagnosed as having CD by the study authors. These criteria for diagnosis included morphological assessments, responses to dietary factors, and/or the presence or absence of symptoms. The diagnostic criteria varied between studies for reasons such as the time period the study was performed or its location. See discussion of various criteria for the medical diagnosis of CD in the section titled “Nature and History of Diagnostic Definition of CD” that follows. 25 Of the approximately 46 references with dose-response data that were reviewed, about 4 studies required this type of reorganization of data. Because in some studies, especially earlier ones (e.g., Rolles and McNeish, 1976; Packer et al, 1978; Kumar et al, 1979), the study subjects were initially assessed using less rigorous criteria to define the presence of CD or the subjects were diagnosed as very young children, the studies challenged the subjects with gluten for a subsequent biopsy analysis and confirmation of CD. Gluten challenge-induced abnormal CD-related biopsies did not emerge in all the re-tested GFD-treated subjects within each study and this held even after exposure to gluten was continued in this subset of subjects in some cases for 10-24 months. The possibility exists that the time for relapse of CD in these subjects is greater than the challenge duration of the study. However, in this analysis, this subset of subjects was not considered to have confirmed CD and not included in the group of CD subjects whose dose-response data was evaluated. Last, none of the studies that this reorganization of data pertained to were considered to contain low-dose gluten exposure data and thus, subsequently assessed in detail in Appendix B.
17

exposure of gliadin and gluten frequently noted in the literature (i.e., 100 mg gliadin : 200 mg gluten). This reflects the 50:50 ratio for the two major fractions of gluten, gliadin and glutenin, that has been cited for many years. Reference to this gluten fraction ratio (gliadin:glutenin) and/or 2-fold conversion factor (gliadin:gluten) has been the predominant one found in a number and range of references and sources in the literature. This includes references that contain gluten-related challenge findings (e.g., Catassi et al., 1993 and 2005), that examined the chemical composition of gluten (e.g., Pomeranz, 1987), that to date has served as the basis of conversions involved in ELISA gluten test kits calculations (e.g., Ridascreen Fast Gliadin, R-Biopharm AG; Prolamins Transia Plate, Diffchamb), and finally, the one stated and presumed by Codex in addressing their “gluten” considerations (e.g., Codex, 2006). To be consistent with this information, all conversions for gliadin performed in this assessment to express exposure levels as a uniform “amount of gluten” were based on these same ratios. Last, recent work has suggested the possibility the ratio of the gliadin:glutenin fractions of gluten may differ from the commonly applied 50:50 ratio value (Wieser, 2007; Thompson and Mendez, 2008). For comparison, a sensitivity analysis was performed latter in this assessment to examine the potential affect of this possible alternative ratio on the final principal estimated exposure levels of toxicological importance and of concern (e.g., TDIs, LOCs) for gluten determined in the hazard/safety assessment. This analysis is located in the latter subsection titled “Sensitivity Analysis Associated with Gluten Chemical Compositions” under the “Risk Characterization” section. Nature of Morphological Adverse Effects that Characterize CD An integral initial component of a traditional safety assessment is determination of the critical health effect elicited by exposure to the toxic agent of concern. It is followed by identification of the NOAEL and/or LOAEL, depending on the data available, associated with the adverse effect. Typically in a safety assessment, the critical health effect of focus is a distinct and discrete adverse effect. In contrast, the nature of the critical effect, CD, associated with exposure to gluten is multidimensional in nature. The histopathology that characterizes the development of CD consists of a progressive spectrum of adverse changes in the small intestine mucosa (Marsh, 1992; Dewar and Ciclitira, 2004; Dickson et al., 2006). These adverse changes occur in interrelated phases that progress sequentially with each phase comprising characteristics that reflect additional degrees of abnormalities and/or deterioration of the mucosa. Over time, with increased knowledge about and improved techniques to measure gluten-induced histopathology, efforts to characterize and define each phase in a more distinct fashion to allow for consistent interpretation of morphological findings have occurred (Marsh, 1992; Dickson et al., 2006). One of the most recognized classification systems for histopathological changes associated with the development of CD was put forth by Marsh (1992). Marsh classified the histological abnormalities or “lesions” associated with CD into 5 types, these being “pre-infiltrative” (type 0), “infiltrative” (type 1), “hyperplastic” (type 2), “destructive” (type 3), and “hypoplastic” (type 4). The basic characteristics that define each type or grade are as follows: type 0 - mucosa appears normal; type 1 – epithelial cells of the villi are infiltrated by lymphocytes; type 2 - intraepithelial lymphocytosis plus enlargement or hyperplasia of crypts; type 3 – accumulated lesions of types 1 and 2 plus villous atropy (flattening of mucosa); and type 4 – total villous atrophy without inflammation or
18

atropic-hypoplastic lesion. Oberhurber et al. (1999), along with additional contributions by others (Dickson et al., 2006), subsequently revised this grading system to a degree by subclassifying the Marsh type 3 lesion into three types of villous atrophy, partial (or mild) villous atrophy (type 3a), subtotal (or marked) villous atrophy (type 3b), and total villous atrophy (type 3c). This revised classification system is sometimes referred to as the Marsh-Oberhurber grading system and is thought to assist in refining evaluation of the nature and status of disease development in CD (Dickson et al., 2006). These well-defined classification system(s) for the evaluation of histologic changes in the small intestine in CD were developed to allow for standardization of the assessment of biopsy pathology in addition to the associated pathology reports (NIH, 2004; Dickson et al, 2006). Nature and History of Diagnostic Definition of CD Over the last several decades, different medical societies, associations and groups have promulgated varying criteria that are used to define CD and to establish the presence of this disease in patients. These criteria for a clinical diagnosis of CD typically have several components to be met. A significant initial component of these various diagnostic criteria is the performance of a small intestinal biopsy while individuals are consuming a gluten-containing diet, and the determination of the presence of abnormal mucosal morphology. The histopathological biopsy critieria development by the European Society for Paediatric Gastroenterology (ESPG) in the 1970’s (1970, 1974 and 1978 Diagnostic Criteria in CD) and later reevaluated by this society (subsequently known as the European Society for Paediatric Gastroenterology and Nutrition, ESPGAN) in 1990 (Meeuwisse, 1970; Walker-Smith et al., 1990) required the presence of hyperplastic villous atrophy as one component in a positive diagnosis of CD. Other investigators subsequently indicated this histological state described in the ESPG/ESPGAN criteria for CD diagnosis corresponds to Marsh 3 lesions (Wahab et al., 2001; Tursi et al., 2003; Dickson et al., 2006). Accordingly, other medical groups delineated the criteria for histopathologic results of an initial biopsy in individuals suspected of CD and consuming gluten. In their 2001 medical position statement, the American Gastroenterological Association (AGA) described the histopathological component of their CD criteria as the presence of “abnormal small intestinal mucosa” with the damage characterized by aberrant changes in mucosal morphology such as in villous height to crypt depth ratio, enterocyte height and lymphocyte infiltration (AGA, 2001; also Ciclitira et al., 2001). In an updated 2006 medical position statement, the AGA Institute26 indicated the small intestine biopsy remains the “gold standard” in establishing a diagnosis of CD and included additional details of characteristic gluten-induced histological changes reflective of the presence CD (AGA, 2006; also Rostom et al., 2006). These duodenal mucosa changes include “a spectrum of change from total to partial villous atrophy, and crypt lengthening with an increase in lamina propria and intraepithelial lymphocytes.” The North American Society for Pediatric Gastroenterology, Hepatology and Nutrition
26 This subsequent updated 2006 medical position statement (AGA, 2006) and supporting technical review document (Rostom et al., 2006) put forth by the AGA were referred to in these 2006 publications as products of the “AGA Institute” instead of as the work of the AGA alone as indicated in the 2001 versions of these documents.
19

(NASPGHN) has also formulated guidelines specific for the diagnosis of CD in children and adolescents which also includes confirmation of a diagnosis of CD with intestinal biopsy as a requirement (Hill et al., 2005). The presence of villous atrophy (Marsh type 3) was a histopathologic feature considered definitively characteristic of the presence of CD. Finally, a 2004 NIH consensus group suggested the demonstration of some degree of villous atrophy with gluten exposure assists in confirming a medical diagnosis of CD, but a less distinctly severe biopsy result (e.g. intraepithelial lymphocyte infiltration, crypt hyperplasia without villous blunting) can be assessed within the context of and supported by other laboratory results and clinical responses (NIH, 2004; Dewar and Ciclitira, 2004). Others have also suggested that the likelihood of the diagnosis of CD being associated with the presence of less severe histopathological changes in a biopsy of the small intestine (e.g., Marsh type 1or 2 morphological characteristics) of individuals suspected of CD is potentially strengthened with the findings of supplemental analyses (e.g., serologic or genetic tests) (AGA, 2006; NASPGHN: Hill et al., 2005), or of repeat biopsy tests while still consuming gluten over time (NASPGHN: Hill et al., 2005). A second component in the various diagnostic medical criteria involves assessment of the result of patient responses to a GFD. The resolution of clinical symptoms in patients within weeks (ESPGAN: Walker-Smith et al., 1990) or months (AGA, 2001; AGA Institute: Rostom et al., 2006) on a GFD provides additional support to the diagnosis of CD. The necessity of a second biopsy showing improvement in villous architecture with removal of gluten in the diet is a required step in some, especially earlier, diagnostic criteria schemes for CD (1970, 1974, 1978 ESPG/ESPGAN and also AGA, 2001 and 2006), but not all of them. Some such schemes only deem its necessity for diagnosis if other responses on a GFD are equivocal (ESPGAN: Walker-Smith et al., 1990; NIH, 2004; NASPGHN: Hill et al., 2005). Another component of the diagnostic criteria for CD found in the requirements of some medical groups involves a formal gluten challenge. Demonstration of a relapse in symptoms and/or morphology coincident with the gluten challenge was a requirement in the original diagnostic criteria (1970, 1974, 1978 ESPG/ESPGAN), but was subsequently regarded as only required in circumstances when there is doubt about the correct diagnosis (ESPGAN: Walker-Smith et al., 1990; and AGA, 2001 and 2006). Last, some additional measures and tests have been suggested for use in the determination of a CD diagnosis over time. ESPGAN (1990; Walker-Smith et al., 1990) proposed the use of antibody tests as adjunct measures to support such a diagnosis. The NIH consensus group promulgated the use of serologic tests (e.g., IgA antihuman tissue transglutaminase, IgA endomysial antibody immunofluorescence) as a first screening diagnostic step in individual suspected of CD, followed then by an initial biopsy of the small intestine. (NIH, 2004; Dewar and Ciclitira, 2004). Most recently, the AGA Institute made additions to their recommendations for CD diagnosis criteria some what comparable to these in their 2006 update (AGA, 2006; AGA Institute: Rostom et al., 2006). They suggested that the improved sensitivity and specificity for CD of the serologic test, IgA tissue transglutaminase antibodies as compared to others available in the past warrants its use as an efficient single initial screen serologic test for CD in those
20

suspected of having this disease and still consuming gluten. This corresponds with the recommendation made by NASPGHN (Hill et al., 2005) in their guidelines for CD diagnosis in children and adolescents which additionally included considerations of repeat serologic testing at intervals for undiagnosed individuals in specific groups at special risk for the development of CD. Also another possible determination included in the NIH consensus criteria, as well as for the AGA Institute (AGA, 2006) and the NASPGHN (Hill et al., 2005) recommendations for confirmation of a CD diagnosis, was the use of tests for genetic markers (e.g., HLA haplotypes: HLA-DQ2 or –DQ8) when some uncertainty exists in its diagnosis. Basis of the Evaluation and Determination of Adverse Morphological Effects As revealed above, the pathogenesis of CD consists of a progressive sequence of an array of relevant adverse effects that lead to the deterioration of small intestine mucosa culminating into the “final” disease state (i.e. Marsh, or Marsh-Oberhurber type 3 or 4 grade lesions). In this hazard evaluation, the various mucosal morphological abnormalities associated with the different phases of the pathogenesis process and linked to exposure to gluten in sensitive individuals were considered adverse effects, and not solely the occurrence of the endstage of the disease process. Because the subjects of the various studies evaluated in this hazard analysis were diagnosed with CD and treated with a GFD prior to their study, the subsequent phases of pathogenesis elicited by these subjects upon a gluten test challenge were assessed as significant adverse effects with respect to the development of CD. This approach to identification of critical adverse effects is supported by the work of investigators that demonstrated patients with “borderline enteropathy” (i.e., Marsh type 1 or 2 lesions) react adversely to a gluten challenge or find improvement on a GFD (Wahab et al., 2001; Tursi and Brandmarte, 2003, Kurppa et al., 2009). A range of morphological measures were examined for abberant changes in this assessment and include intraepithelial lymphocyte cell count (IEL), villous height (Vh), crypt depth (Cd), Vh/Cd ratios and epithelial surface cell height (E-SCH), along with descriptions of enteropathic characteristics or grades (AGA, 2001; Dickson et al., 2006). The changes in these measures that emerged in response to a gluten challenge in a study and that were characteristic of CD served as the basis of the determination of the presence of adverse morphological effects and in turn, the critical adverse effect levels for morphological effects. This adverse effect information is extensively depicted in Tables 1-3 in Appendix B where the NOAEL and/or LOAEL findings for morphological and/or physiological effects from each low-dose study are summarized in the “Type of Adverse Effects” column. As described earlier, abberrant changes in various physiological measures such as antibody levels (e.g. Catassi et al., 1993; Chartrand et al., 1997; Laurin et al., 2002), intestinal absorption and/or permeability (e.g. Ciclitira et al., 1985; Mayer et al., 1989; Catassi et al., 1993), and fecal fat content (e.g. Frazer et al., 1959; Meeuwisse, 1970; Ciclitira et al., 1980), that often occur concurrently with the morphological progression associated with CD, were also found in studies of CD, and were also evaluated in this assessment of hazard with respect to dose-response adverse effects. The results derived from these physiological measures contributed to characterizing the low-dose levels of exposure to gluten of relevance to CD sufferers, and
21

to providing weight-of-evidence support for dose effect levels identified from morphological adverse effects. In this assessment, the overall critical “morphological/physiological” NOAEL and/or LOAEL values chosen were not based on physiological measures alone. The basis of the critical overall observable adverse effect levels identified in determining the tolerable levels of oral intake of gluten had to include relevant changes in morphological measures. In general, the LOAEL-related adverse effects identified for each study and depicted in Tables 1-3 in Appendix B under the “Type of Adverse Effects” were determined in the following manner. The change(s) in morphological and/or physiological effects, typically represented as an increase or decrease, attributed to a gluten challenge in a particular study in response to a low dose of exposure (i.e., LOAEL), or the absence of a dose-effect change(s) (i.e., NOAEL) were based on the statistical analysis of results provided in a particular study. For the few instances where the data within a study were reorganized as previously described, the newly calculated mean values of these measures were assessed for the existence of significant gluten-related changes. If the original data of a study or the reorganized data in a study involved reports on single individual subjects or had a small number of subjects within a group such that group comparison were not possible, then gluten-induced changes was noted as an “adverse effect” if the change in the value of the measurement went from a value considered to be “normal” to one considered to be “abnormal” post-challenge (or possibly “abnormal” versus a “control” value). This consideration of a change from pre-challenge “normal” characteristics to post-challenge “abnormal” characteristics also holds in the case of the assessment of the effects of gluten challenge in the small intestine that sometimes involves non-quantitative descriptive analyses. Finally, the findings on morphological and/or physiological effects on a study were also evaluated within the context of “within study” weight-of-evidence considerations (see discussion in “weight-of-evidence” section that follows). Basis of the Present Evaluation and Determination of Adverse Clinical Effects The body of available gluten challenge studies was examined for any information on clinical adverse effects associated with CD. The dose level(s) of exposure that were associated with the onset of these adverse responses were determined. The LOAEL doses, and if available the corresponding NOAEL dose, for the clinical effects reported were identified and presented in Tables 5-7 in Appendix B for the low-dose challenge studies. The LOAEL-associated with clinical effect(s) and related characteristics of these effects for each identified study are listed in the column titled “Adverse Clinical Effects” in these tables. Some of these adverse effects included the following: diarrhea (D), nausea (N), abdominal pain (AP), vomiting (V) and dermatitis herpetiformis (DH). Lists of additional clinical adverse effects exhibited in the low-dose studies examined are located in footnote #6 in each of the Tables 5, 6 and 7 (see Appendix B). The nature of the characteristics of the occurrence of the adverse clinical effect(s) exhibited in each study in response to a gluten challenge was considered in identifying its NOAEL and/or LOAEL. This includes consideration of factors like the pattern, timing and consistency of the response with respect to the gluten challenge, and to control subjects and/or substances. Aspects of the weight-of-evidence considerations that comprised the
22

evaluation of the dose-response relationship for clinical effects in the gluten challenge studies are presented in detail in the following section. Basis of Weight-of-Evidence Evaluations and Determinations
To assess the toxicity and/or detrimental health effects of an agent, the safety (or risk) assessment approach involves the evaluation of the entire body of available dose-response adverse effects data, with particular focus on low dose studies. A component of the assessment of the data set is the consideration of the weight-of-evidence. It plays a particularly useful and important role when assessments involve the evaluation and comparison of studies and their data that vary in nature and differ in design and original purpose. One aspect of the evaluation of a data set with regard to the weight-of-evidence involves examination of the findings of the body of studies taken together for consistency and biological plausibility of the effect of focus and for evidential support for the likely presence of a direct or systematic relationship. It includes the identification of reliable indicators and measures and of factors regarded as support of the likelihood of effects (e.g., dose-response relationship, similarity of effect, temporal relationship). Another aspect of a weight-of-evidence evaluation includes determining the relevance, importance and contribution of a particular study and its findings to the overall body of work. In the case of a safety assessment, it also encompasses determining the dose level(s) of exposure that best characterizes the “threshold(s)” of toxic reactivity to an agent. The major weight-of-evidence considerations made in this assessment with respect to evaluating the results of gluten challenge studies fall into two categories. First, they were made in evaluating the findings within studies for morphological and/or physiological effects, and for clinical effects and in assessing their relevance as a whole. The analysis for adverse morphological and/or physiological effects in gluten challenge studies included whether (a) gluten-induced changes exhibited across the different individual morphological measures (e.g., IEL count, Vh, Cd), and if provided, descriptions of enteropathic characteristics or grades (e.g., Marsh-Oberhurber grading system) were reflective of and consistent with the adverse morphological effects that characterize CD27; and/or (b) aberrant changes in various physiological measures (e.g., antibody levels, intestinal absorption and/or permeability, fecal fat content) were each reflective of CD and were, if available, consistent with and support the morphological changes found with a gluten challenge within a particular study; and/or (c) a temporal relationship between exposure to gluten and the adverse morphological and/or physiological effect(s) was demonstrated, meaning the adverse effects that emerged occurred when gluten was administered but did not occur (or diminished) during the pre- (and/or post-) challenge periods28; and/or (d) the morphological and/or physiological adverse effect(s) exhibited in response to gluten challenges were demonstrated to be dose-dependent29 in nature;
27 For example, this point, and also for the next in (b), reflect gluten-induced changes to “abnormal” measurement values (e.g., elevated IEL counts, decreased Vh) that characterize the presence of CD. 28 This evaluation includes the assessment of the change from a pre-challenge (and possibly also post-challenge) “normal” measurement value to a gluten challenge-induced “abnormal “measurement” value. 29 A “dose-dependent effect” reflects the demonstration in an experiment that the level of a “response” or “effect” (i.e. dependent variable) exhibited is related to the magnitude of the dosage administered (i.e., independent variable) over several different doses. Establishing the existence of this type of “dose-effect”
23

and/or (e) no morphological and/or physiological adverse effect(s) were exhibited in the control subjects during the gluten challenge test in contrast to the responses seen in gluten-challenged CD subjects; and/or (f) no morphological and/or physiological adverse effect(s) were exhibited with the administration of a control substance (or placebo) during the gluten challenge test in contrast to the responses seen in gluten-challenged CD subjects. A summary of the “within study” morphological and/or physiological effect(s) for each low-dose study evaluated is listed under the “Type of Adverse Effects” column in Table 1-3 in Appendix B and also for certain studies of particular relevance it is discussed in the text of the “Safety Assessment” section. This type of weight-of-evidence analysis, meaning “within study” assessment, for adverse clinical effects in gluten challenge studies included some or all of the following determinations: (a) the nature and constellation of the clinical response(s) for each challenged individual subject is consistent over time and does not emerge as inconsistently varied and random over the test period; (b) a temporal relationship between exposure to gluten and adverse clinical effects was demonstrated, meaning the clinical effect(s) emerged when gluten was administered but not during the pre- or post-challenge period(s) (e.g., follows AB, or ABA experimental design patterns); (c) the clinical adverse effects were accompanied by relevant abnormal morphological and/or physiological effects30; (d) no clinical adverse effect responses were reported in the control subjects during the gluten challenge test in contrast to the responses seen in gluten-challenged CD subjects; (e) no clinical adverse effect responses were reported in subjects administered a control substance (or placebo) during the gluten challenge test contrasting the responses seen in gluten-challenged CD subjects. A summary of aspects of “within study” clinical effects for each low-dose study evaluated is listed under the “Type of Clinical Adverse Effects” column and possibly, also the “Other Information” column in Tables 5-7 in Appendix B and also for certain studies of particular relevance it is discussed in the text of the “Safety Assessment” section. The second major category of weight-of-evidence considerations in this assessment were made in determining the relevance and importance of the findings of a study with respect to the context of all available studies. This type of weight-of-evidence analysis involves comparing findings across studies. It is employed when assessing lower limits of dosage levels of toxic reactivity and in turn, all available NOAEL and/or LOAEL values available in determining the overall “critical” NOAEL and/or LOAEL value(s). The existence of findings from other additional studies that are similar in nature and in dose range provide support for the overall critical NOAEL and/or LOAEL values(s) identified and chosen. This serves to contribute to the strength of the evidence and provide a degree of confidence regarding the studies of focus in the hazard and safety analysis. relationship is considered support for the exhibited response(s) reflecting an underlying biological-based mechanism(s) and thus, being a “true” response or effect. 30 The emergence of morphological and/or physiological effects that accompany the occurrence of clinical responses served to support the relationship between gluten exposure and CD-related clinical effects. However, this was not considered necessary for adverse clinical effects that occurred alone in conjunction with gluten exposure in a study to be considered and evaluated. Other factors in, characteristics of and determinations about the particular study also contributed to their assessment.
24

Other general characteristics of studies that at least in part contribute to weight-of-evidence consideration when evaluating the findings of studies include facets of the nature, type and design of a study or studies, and of the nature of the subjects used in a study or studies. The relevance and importance of these facets of the studies and their subjects that were assessed as a factor of the weight-of-evidence consideration have been addressed elsewhere in this document and/or the appendices. For instance, they included gluten challenge study design (e.g., open, single-blind or double-bind challenge studies), inclusion of control subjects and/or substances, blind evaluation of gastrointestinal biopsies, clinical assessments, etc., and route and vehicle of exposure to a challenge agent. Examples of facets of the subjects tested in studies also considered included the number of study subjects, the type of pre- and post-test GFD, and criteria and method for selection or elimination of subjects evaluated in a study. Last, a significant factor that is also incorporated into the various aspects of a weight-of-evidence evaluation and its related considerations is the application of informed, scientific judgments in assessing the available data set as a whole along with the quality of a particular study and its relevance and contribution to the overall analysis, by an experienced expert(s) in health hazard evaluation and the safety assessment procedure, and in toxicological assessment. Safety Assessment
The safety assessment approach was employed to identify the lowest level(s) of adverse response sensitivity and to determine the TDI levels of exposure for gluten for morphological and clinical adverse effects in CD-sensitive individuals. The information from the studies listed in Appendix A was evaluated and the studies that characterize the margins of the low dose-response adverse effects data for acute, subchronic and chronic exposure to gluten were identified31. The findings from these key low-dose studies for both morphological/physiological and clinical effects in children and adults are summarized in Tables 1-3 and Tables 5-7, respectively, of Appendix B. In the assessment of morphological effects, inclusion of relevant low dose information from studies with adverse effects that included villous atrophy was attempted where possible. Several critical studies that can be utilized in a safety assessment emerged from examination of all the individual adverse effect level values for exposure to gluten from the different studies presented in Tables 1-3 and 5-7 of Appendix B. These studies were determined to exhibit the findings with the most reflective, and thus, relevant “lowest” overall effect level values for the NOAEL and/or LOAEL for acute, subchronic and chronic durations of exposures to gluten. The overall critical NOAEL and/or LOAEL values for each of these durations of exposure are listed in Table 4 for morphological effects, and Table 8 for clinical effects. These adverse effect levels for ingestion of gluten were the principal ones utilized to derive the different TDIs exposure levels for individuals sensitive to
31 Reference to the term “gluten” and related protein components of gluten in the discussion of challenge studies and dose-effect findings that follow in this document (including related tables in Appendix B) represent the gluten protein moiety found in wheat grain. It does not specifically reflect the corresponding protein derivatives in other toxic grains (i.e., rye, barley) associated with CD. See previous discussion on these distinctions in this document under the section titled “Gluten”.
25

gluten. The selection of the critical studies32 and thus related overall critical NOAEL and/or LOAEL values that characterize the lowest limits of response sensitivity was based on the principles of the safety assessment approach and its procedures, and the scientific judgments typical of this type of evaluation. This includes weight-of-evidence considerations and determinations. (See weight-of-evidence discussion in preceding section). Morphological Adverse Effects
Acute Exposure Key dose-effect information for acute exposure (see Table 1 in Appendix B) was derived from an apparently single-blind controlled challenge study by Leigh et al. (1985) that orally administered a single dose of the gluten digest, FF3, to 22 gluten-sensitive adults at 4 different dose levels (n=5-6 CD subjects each) or a control substance, -lactoglobulin (n=6 CD subjects). A significant dose-dependent increase in mean jejunal IEL count versus baseline was seen in response to the FF3 at 12 hours post-challenge (associated LOAEL= 625 mg gluten). This acute morphological response to the single dose was time-related as it waned by 36 hours post-challenge. The NOAEL for this acute morphological response was 125 mg gluten. Healthy control subjects were also challenged with 2 of the higher doses of FF3 and the control substance, -lactoglobulin (n=3-6 control subjects each). The gluten-induced changes seen in the IEL counts of CD subjects were not demonstrated in healthy control subjects, or in response to the -lactoglobulin control agent in either the subjects suffering from CD or healthy control ones. The data from several other open challenge studies in individuals with CD support the mg dose range of the acute NOAEL and acute LOAEL values for gluten (125 and 625 mg gluten/day, respectively) derived from this critical study. A LOAEL of approximately <830 mg gluten/day was found in an open challenge study by Ciclitira et al. (1980) that orally administered gliadin in bread to an adult for 4 days. The adverse responses associated with the LOAEL found in this study were increased IEL counts and fecal fat, and decreased Vh/Cd and epithelial surface cell height in addition to subtotal villous atrophy in the jejunum by 24 hours after acute exposure began. An acute study that administered gliadin directly in the small intestine of an adult via intraduodenal infusion (Ciclitira et al., 1984b) resulted, in an NOAEL of 20 mg gluten. This study demonstrated low effect level (LOAEL=1200 mg gluten) adverse changes in measures that included jejunal IEL count, Vh/Cd, and E-SCH along with abnormal mucosal morphology. Two other acute studies in CD subjects demonstrated a LOAEL of 24 mg gluten (n=10) (Lavo et al., 1990a) and 30 mg gluten (n=7) (Lavo et al., 1990b) after intrajejunal perfusion of gliadin33. The adverse effects that resulted at these respective LOAELs were first
32 Reference to the “critical study” and the corresponding “critical” NOAEL and/or LOAEL values derived from the study reflects terminology commonly associated with the safety assessment approach. 33 It appears that some but not all of the subjects with CD tested in each of these studies by Lavo and colleagues were the same individuals. However, different physiological responses to gluten challenge tests were measured in each of these published studies. In addition, each study included 1 or 2 subjects of the challenged subjects (1 of n=7, or 2 of n=10) that were on a normal diet instead of a GFD prior to the challenge test. Because the study results were expressed as group mean values with no discernible
26

increased mean jejunal prostaglandin E2 secretion, and second, a 2-fold increased mean jejunal appearance rates of beta2-microglobulin, albumin and hyaluronan, substances thought to reflect inflammatory damage in the mucosa. Jejunal responses to gliadin in these two perfusion challenge studies were not seen in the normal healthy controls subjects also included in each study. Although not used to determine the critical LOAEL, it is important to note the existence of another low dose acute exposure open challenge study. This one was performed by Ciclitira et al. (1984a) that administered the gluten derivative of gliadin in bread daily for one week to 7 adult subjects confirmed to be gluten-sensitive. The subjects had been on a GFD for a least a year post-diagnosis with CD but on a strict GFD (i.e., no commercial gluten-free products) for only one week prior to the challenge test. The findings of this study were equivocal in nature. Some findings suggested adverse effects are associated with a dose of exposure of 2.4 - 4.8 mg gluten/day; whereas, other findings do not or are not clear. A statistically significant gluten-related decrease in the mucosal morphology measure of mean Vh/Cd was seen, but no significant changes in mean IEL count or mean epithelial surface cell height (E-SCH) were found. However, some researchers have suggested that a change in the Vh/Cd ratio is one of the most sensitive measures for determining the presence of gluten-induced enteropathy (Catassi et al, 2007). Furthermore, the pre-challenge mean IEL count (mean + standard deviation, 37 + 3/100 enterocytes) for the group already bordered on being considered elevated (Dickson et al., 2006, abnormal: IEL > 30/100 enterocytes; earlier abnormal standard: IEL > 40/100 enterocytes). Changes in histological mucosal appearance to gluten exposure were also evaluated in general descriptive terms (because it was performed prior to the development of the Marsh classification system) in this study. The authors noted “deterioration” in the jejunal mucosa of one subject that went from a “leaves and fingers” appearance to an appearance of “broad villi and ridges” after gluten exposure. Another subject went from an appearance of “ridges” to a post-challenge one of “broad villi.” A closer examination reveals that 3 other subjects who the authors noted as not responding to gluten already began the study with a morphological status characterized as “broad villi” or “broad villi and ridges,” so additional negative changes to their morphological status appears to be less likely. Thus, it should be kept in mind that based on this study the possibility exists that the acute LOAEL for gluten could instead be 2 orders of magnitude (~100-fold) lower than the critical LOAEL value chosen above. Subchronic Exposure A critical study with subchronic dose information was also identified for morphological adverse effects (see Table 2 in Appendix B). A NOAEL for subchronic exposure was derived from a open challenge study by Ciclitira et al. (1985) that administered about 4 mg34 daily dose of gluten via gliadin treatments for a period of 6 weeks to 10 adult
information on individual subjects available, the findings of these 1-2 subjects in these cases were considered together with subjects on a pre-test GFD. Finally, Lavo et al (1990a) indicated there were no differences in maximum increases to peak PGE2 between subjects with active or inactive CD. 34 The information on the dose administered in this study was a range of exposure that represented 2.4 - 4.8 mg gluten. An average of these numbers is 3.6 mg gluten which was rounded to 4 mg and presented above as the approximate dose administered.
27

subjects diagnosed with CD and on a GFD. No significant gluten-related changes were seen in a number of measures, mean IEL counts, mean Vh/Cd ratio and mean epithelial surface cell height in the jejunum, along with intestinal permeability. The results from another study provide support for a critical NOAEL at this dose level. A subchronic NOAEL of 10 mg gluten/day was found in a prospective, randomized DBPC study that treated CD-confirmed adults via daily gluten-filled capsules for a 3-month duration study (Catassi et al., 2007). No significant changes were found at this dose in a number of indices that assessed duodenal morphology (e.g., medians: IEL count, Vh, Vh/Cd, Marsh-Oberhurber grading scores). Also, it appears possible that the most sensitive celiac patients were not considered for analysis in this latter study, because those with any initial small intestine mucosal abnormalities after a one month pre-challenge strict GFD period (n=4 subjects), and a few subjects that experienced acute clinical symptoms in response to the gluten challenge, were excluded from consideration. Chronic Exposure Limited low dose information is available on the morphological/physiological effects of chronic exposure to gluten in sensitive individuals (Table 3 in Appendix B). Nevertheless, a chronic LOAEL was determined from the available study findings. Laurin and colleagues (2002) collected data from 13 children confirmed to have CD and on a GFD who underwent an experimental challenge of long-term oral exposure each to different amounts of gluten (range: 0.2 – 4.3 g/day) (administered by their parents in bread with the children self-selecting levels of intake in accordance with their comfort) for 13 to 51 weeks. A dose-related trend between exposure level and degree of severity of adverse response (e.g., IEL count, mucosal morphology) was suggested. A low dose of 200 mg gluten/day for 39 weeks produced an elevated small intestine mucosal IEL count above normal (IEL count: increased from 32 to 62 per 100 epithelial cells), and an elevated level of a number of gluten-related antibodies (e.g., IgA-AGA, IgA-EmA)35 in one child who also exhibited the clinical symptom of vomiting. However, the morphological nature of the small intestine biopsy samples taken at baseline and at 39 weeks in this child did not change; both were classified as “infiltrative.” Two additional CD subjects elicited adverse responses to exposure elicited adverse responses to exposure to gluten at a dose of 700 mg gluten/day after its ingestion from 13 to 16 weeks. Elevated mucosal IEL counts and relevant antibody levels were demonstrated by these children along with the symptoms of abdominal pain or irritability. In addition, the nature of the change in small intestine mucosa for both children was from “infiltrative” prior to the gluten challenge to “hyperplastic” at the end of it. From these findings taken together, the chronic LOAEL value arrived at was 700 mg gluten/day. Tolerable Daily Intake Levels for Morphological Effects In a traditional safety assessment approach, uncertainty factors (UF) are employed to arrive at estimations of tolerable intake levels. These UFs address certain types of variability that exist in the data and provide a margin of exposure (or safety) with respect to the effects levels identified as significant. Typically, an UF of 10 is used for addressing
35 The antibody, IgA-AGA, represents the immunoglobin A anti-gliadin antibodies. The antibody, IgA-EmA, represents the immunoglobin A endomysium antibodies.
28

inter-individual differences between humans, and an additional UF of 10 is used for extrapolation from a LOAEL to a NOAEL. Utilizing the appropriate UF for a NOAEL (UF=10) or a LOAEL (UF=10 x 10) associated with morphological effects, tolerable intake levels for acute, subchronic and chronic ingestion of gluten were determined and presented in Table 4 in Appendix B. The resulting estimated tolerable acute intake level for gluten for morphological effect is 12.5 mg/d36, and the TDI for subchronic exposure is 0.4 mg gluten/day and for chronic exposure is 7.0 mg gluten/day. Possible reasons that the TDI is lower for subchronic exposure than for chronic exposure may be due to the fact that the former is based on data from adults, while the latter is based on data from children. Evidence suggests that adults may be a sensitive subgroup within the subpopulation of individuals affected adversely by exposure to gluten (Logan et al, 1989; Ventura et al., 1999; Farrell and Kelly, 2002; Green and Jabri, 2003; Peters et al., 2003). Second, it may be attributed, at least in part, to the limited amount of chronic exposure data available. Slope of the Dose-Response Curve The nature of the slope of the dose-response curve for morphological effects was assessed by examining any studies with relevant information that characterized this aspect of the nature of this relationship. The study by Laurin et al. (2002) measured post-challenge IEL counts in subjects with CD exposed to different doses of gluten and was identified as one that allowed for an determination or assessment of the slope of the dose-response curve. The study authors graphed the correlation (best-fit) between gluten intake (expressed as g gluten/kg body weight/day) and the number of IEL in the post-challenge biopsy specimens. The slope of the “best fit” line of these measures in this particular reference was approximately m = 340, where slope m = y/ x. In this case, the plotted dose-response data found in the Laurin et al. (2002) study suggest a steep slope and thus support the use of a 10-fold UF for converting the LOAEL to NOAEL for morphological effects. Clinical Adverse Effects Clinical signs and symptoms have been reported in children and adults after exposure to gluten or related derivatives. The duration of exposure to gluten compounds that occurs prior to the emergence of signs and symptoms varies widely. They can occur within an acute, subchronic, or chronic timeframe. Acute Exposure Dose-effect information for clinical effects for an acute exposure duration (Table 5 in Appendix B) was derived from an open challenge study by Chartrand et al. (1997) in
36 Corresponding to the discussion above about the possibility of a lower acute LOAEL value, the acute TDI could also possibly be 2 orders of magnitude lower than calculated here.
29

which 2 of 17 adults37 diagnosed as having CD by ESPGN criteria reacted with adverse clinical effects to a gliadin challenge within an acute time period. These experimental asymptomatic CD subjects had only consumed a strict GFD since being diagnosed and had no prior exposure to food products made with wheat starch, a source of small amounts of gliadin. In the study, they underwent a gluten challenge of 1.5 mg gluten/day38 by ingesting portioned food products made with wheat starch (e.g., primarily bread slice(s) but also equivalent portions of other products like muffins and pancakes). Their response was compared to a group of CD control subjects39 (n=14) who already had been consuming daily amounts of wheat starch food products for at least one year without apparent symptoms. This latter group was defined as the “wheat starch clinically tolerant” control group. The 2 challenged CD subjects that reacted to the gluten challenge in an acute timeframe did so within about 2 weeks of exposure40 and exhibited the symptoms of fatigue/irritability and abdominal pain (acute LOAEL= 1.5 mg gluten/day) which lead to their also discontinuing the wheat starch-based food challenge. The adverse symptoms resolved when the wheat starch food products were removed from the diet of these experimental CD subjects. No such adverse clinical reactions emerged in the control CD subjects during the same challenge and time period. Although the 2 CD groups reacted differently to the acute dietary gluten challenge, no significant wheat starch-induced changes in the measures of antigliadin antibodies (IgA and IgG) and antiendomysium antibody levels emerged in either group41. No morphological measures were assessed in this study. Three other acute exposure studies provide support for an acute LOAEL for clinical effects in the low mg dose range. In one open challenge study where 10 adult subjects with CD were assessed for symptoms during 2 weeks of daily gliadin treatments, the LOAEL for clinical adverse effects was as low as about 4 mg gluten/day42 (Ciclitira et
37 The 17 gluten-challenged experimental CD subjects in this study consisted of 15 adults and 2 children. The age of the individual subjects associated with specific findings could not be distinguished in the information provided to allow for their separate consideration. The mean age of the study subjects was 36.5 years old (range: 7.8 – 54.3). Thus, the results of this study were categorized in this assessment as “adult” findings. 38 This represents an average daily portion of gluten exposure. It ranged from 0.75 to 3.38 mg gluten per day. 39 The 14 CD control subjects in this study consisted of 8 adults and 6 children. Specific, detailed data for each individual control subject were not available. The mean age of the control subjects was 34.2 (range: 5.6 – 71.2). As with the results of the experimental subjects of this study, these corresponding control subjects were considered under the “adult” category grouping. 40 The onset of symptoms for these 2 subjects was presented in a table in this reference as occurring in a “< 1 month” period of gliadin exposure. However, adverse clinical responses were noted in the text as beginning “within 2 weeks.” It was thus assumed that the symptoms were exhibited in these 2 subjects within this acute time period. 41 It should be kept in mind that certain antibody level changes are suggestive of the presence of the sensitivity to gluten in CD but are not considered absolute, definitive measures of this disease. For example, morphological effects in response to a low dose gluten challenge have been reported without being accompanied by increases in gluten-related antibodies (Catassi et al., 2007). Also, the presence of antibodies are not reliable markers of slight dietary transgressions while on a GFD (Troncone et al., 1995), or their absence (or disappearance) on a GFD does not necessary correspond to complete histological recovery (Dickey et al., 2000). 42 See footnote 34 for specific information on the nature of this dosage of gluten administered in this study.
30

al., 1985). The mean symptom composite score that accounted for certain symptoms and their severity was elevated for the group at week 1 and 2 of the challenge. Also 6 of these 10 CD subjects had increased 2-week mean symptom composite scores. However, no significant changes in a range of morphological measures were demonstrated in the challenged group of subjects after 6 weeks of this gliadin challenge. Two other studies perfused a single dose of gliadin into the jejunum of adult subjects with CD at doses comparable to 24 mg gluten (n=10) and 30 mg gluten (n=7)43. The first of these respective studies resulted in the LOAEL clinical effects of abdominal pain, abdominal distention or nausea within 40 to 100 minutes of exposure in 5 of 10 CD subjects (Lavo et al., 1990a)44. This gluten challenge was also associated with an increase in mean jejunal prostaglandin E2 secretion rate in the 10 challenged CD subjects and a greater absolute increase in CD subjects with symptoms than those that did not exhibit them. In addition, a time dependency was exhibited between the peak PGE2 levels and onset of symptoms. In the second respective jejunal perfusion study, 2 of 7 subjects reported the LOAEL (30 mg gluten) clinical effects of burning pain or nausea (Lavo et al., 1990b). Accompanying these responses were increases in the mean of the challenged group gliadin-induced release of a number of intraduodenal substances (e.g., beta2-microglobulin, albumin, hyaluronan) associated with inflammation of the mucosa. Finally, in each of the perfusion studies, no symptoms or changes in mucosal secretion of these various substances in response to gliadin were elicited in similarly challenged normal control subjects. Subchronic Exposure A critical study with subchronic dose information on adverse clinical effects was also identified (see Table 6 in Appendix B). A subchronic LOAEL of 1.5 mg/day for clinical effects was identified in an open challenge study by Chartrand et al. (1997). This study administered this dose via gliadin in wheat starch food products for a subchronic exposure duration to 15 individuals diagnosed with CD who had never previously included these types of food products in their GFD treatment45. The onset of adverse symptoms occurred within 1 to 3 months of daily consumption of portioned amounts of the test food products in 11 of these challenged subjects with CD. The clinical effects seen were diarrhea (n=10 subjects), dermatitis herpetiformis (n=2 subjects), abdominal pain (n=5 subjects), flatulence (n=7 subjects), fatigue and/or irritability (n=5 subjects), increased appetite (n=2 subjects) and bone pain and/or myalgias (n=2 subjects) with almost all subjects exhibiting a combination of some of these, and although being varied in nature, these effects were noted as being “consistent for each individual subject”. The subjects that experienced these effects stopped participation in this study within 1 to 8 months of their onset because of the persistence and intolerable nature of these symptoms46. Their symptoms resolved after the study wheat starch challenge was
43 See information about Lavo et al., 1990a and b in previous footnote 33. 44 All 5 of the subjects that exhibited adverse clinical symptoms in response to the gluten challenge were on a pre-test GFD. 45 See description of Chartrand et al. (1997) study above in the acute clinical effects discussion for additional details of the study. 46 The majority of the experimental CD subjects newly exposed to food products containing wheat starch in the challenge reported liking the more palatable options they provided their GFD. Because of this, many of subjects despite experiencing subchronic symptoms tried to continue consuming the wheat starch food
31

stopped. The diet-induced clinical effects were not accompanied by changes in serological antibody measures (antigliadin-IgA and IgG and antiendomysium). No adverse symptoms or changes in serology measures were reported in the control “clinically wheat starch tolerant” CD subjects to the experimental gluten food challenge performed in this study during this subchronic time period. The results of additional studies provide weight-of-evidence support for the subchronic LOAEL for clinical effects derived from the critical study discussed above. First, a LOAEL for subchronic exposure of about 4 mg47 gluten per day was found in an open challenge study by Ciclitira et al. (1985) that administered this dose via gliadin treatments for a period of 6 weeks to 10 gluten-sensitive adults on a GFD. Each day these subjects recorded symptoms and their severity which were used to determine a weekly composite symptom score. The mean score value (n=10 subjects) was greater for the 6-week gluten exposure period in contrast to a 6-week strict GFD control period. The symptoms scored were abdominal pain, diarrhea, vomiting and increased bowel sounds. In addition, 6 of the 10 experimental subjects exhibited an increase in their individual composite symptom score during the gluten challenge period versus their score in the control period. Second, a LOAEL for subchronic exposure of about 10 mg gluten/day was found in a DBPCFC study by Catassi et al. (2007) in which 14 CD-diagnosed adults on a strict GFD were challenged daily with gluten via oral capsules. After 6 – 8 weeks of this challenge, one subject experienced the symptoms of vomiting, diarrhea and abdominal distension. This subject did not complete the study because of this reaction and refused a post-reaction biopsy. It also appears the most sensitive subjects may not have been tested in the food challenge in this study because subjects with persistent morphological abnormalities after a strict GFD pre-challenge period were not included as study subjects. Chronic Exposure Very few prospective, challenge studies are available that contain information on clinical effects associated with chronic exposure to gluten in sensitive individuals (see Table 7 in Appendix A). In an open challenge study by Chartrand et al. (1997),48 four CD-diagnosed subjects were exposed daily to gliadin from consumption of portioned food products containing wheat starch for a chronic duration of 6 to 10 months. Two of these subjects eventually experienced symptoms with their onset occurring after 6 to 8 months of exposure to the challenge of 1.5 mg gluten per day, making this value the LOAEL for chronic exposure. The symptoms that emerged in these subjects who had no exposure to this type of food product prior to this challenge were diarrhea, abdominal pain, flatulence and increased appetite. The two subjects that reacted withdrew from participation in the study after 8 to 9 months of gluten treatments because of the persistent symptoms that they experienced. The removal of this source of exposure to dietary gluten was
products until the adverse reactions became intolerable leading them to eventually withdraw from the challenge test. This factor may also hold for subjects in this study who experienced clinical symptoms after chronic exposure to the food products and who are discussed in the next section. 47 The information on the dose administered in this study was a range of exposure that represented 2.4 - 4.8 mg gluten per day. An average of these numbers is 3.6 mg gluten which was rounded to 4 mg and presented above as the approximate dose administered. 48 See description of Chartrand et al. (1997) study above in the acute and subchronic clinical effects discussions for additional details of the study.
32

accompanied by the resolution of their symptoms. Two of the four experimental subjects challenged with food products containing wheat starch remained asymptomatic after 10 months of exposure when the challenge study was terminated. Control subjects considered to be “wheat starch clinically tolerant” reported no adverse symptoms in response to the experimental gluten challenge over this extended duration. Tolerable Daily Intake Levels for Clinical Effects Critical LOAEL values for clinical signs and symptoms were identified for acute, subchronic and chronic exposure durations. They were each derived from the same study (Chartrand et al., 1997) in which the onset of adverse clinical effects emerged after varying lengths of exposure for individual CD-diagnosed subjects in response to a daily gliadin challenge. The validity of the reported symptoms associated with the acute, subchronic and chronic LOAELs of 1.5 mg gluten/day is supported by the fact that the nature of the clinical effects for each individual subject was consistent over time and resolved after the gluten challenge test was stopped49. Also, no random or spurious symptoms to the challenge were reported in the “clinical tolerant” CD control subjects during the experimental period in this study. Furthermore, in the case of the critical LOAEL for acute and particularly, subchronic exposure, the findings of several additional studies, including a DBPCFC study, support the existence of a LOAEL for clinical effects in the low mg dose level. Using an UF of 100 (10-fold each for inter-individual differences and for extrapolation from a NOAEL to LOAEL) with the LOAELs for clinical effects, tolerable intake levels for acute, subchronic and chronic ingestion of gluten were determined and presented in Table 8 in Appendix B. The resulting tolerable daily intake levels for each of these exposure durations were 0.015 mg gluten/day. Case Reports Two case reports of individuals diagnosed with CD who exhibited adverse reactions to the regular consumption of communion host wafers have been identified in the literature50. The information found in these reports supports the notion that exposure to gluten in the low milligram dose range is associated with clinical and morphological CD-related adverse effects. The first case involved a female patient diagnosed as an adult with CD based on strong clinical, morphological, immune and genetic evidence (Biagi et al., 2004). This individual first consumed a GFD (that included ingesting a communion wafer daily and some unintentional dietary lapses) for about a 16 month period during which some, but not all, the signs and symptoms of CD improved. Then, after diet counseling, she went on a strict GFD (confirmed via diary), apart from one exception, and periodically underwent gastrointestinal small intestine biopsy and serological analyses over the next 18 months. The one “exception” to her strict GFD was daily intake 49 For some subjects, it took time for some of the symptoms to diminish and resolve after the gluten challenge period was terminated, but all adverse clinical effects eventually ceased (“within 1 to 3 weeks in all cases”) in the post-challenge period. 50 Findings from case reports that involved ingestion of communion host wafers were considered for comparison and support in this assessment because these wafers represent a fairly uniform and consistent source of gluten intake across exposures over time.
33

of a fragment of a gluten-containing host wafer during daily Holy Communion. The direct analysis of the gliadin content of the host wafer revealed that the fragment exposed this patient to an estimated intake of approximately 1 mg gluten per day. While clinical and other physiological adverse effects of gluten exposure resolved on this “strict” GFD, multiple duodenal mucosal biopsies during this time showed an elevated number of IELs and persistent severe VA (classified as Marsh 3), along with levels of a few, but not all, celiac-related antibodies (e.g., TTA, tissue transglutaminase; IgG AGA, anti-gliadin antibodies) noted as “borderline.” The second case report involved an 8-year-old boy who was diagnosed with CD because of exhibiting “growth retardation and a flat intestinal mucosa” (Scotta et al., 1982). After 6 months on a strict GFD (based on “detailed dietary inquiry”), the child commenced participation in a holy communion ritual that included ingestion of one communion host wafer per week. After this added gluten exposure the child showed “unsatisfactory growth” and at 6 months of this exposure an intestinal biopsy revealed the presence of “partial villous atrophy.” After terminating the intake of communion host wafers for 3 months, a third intestinal biopsy found the mucosa to be "normal." Auricchio and Troncone (1991) referring to this case report later went back and estimated the exposure to gliadin of this communicant with CD who consumed host wafers. They suggested an exposure of about 5 mg gliadin per wafer (per day of exposure) which represents an exposure of 10 mg gluten per wafer51. In the case of this boy who reacted to one host per week host ingestion, this reflects an exposure of 10 mg gluten (one time) per week, or if averaged over a week, it would reflect about a 1.4 mg gluten exposure per day52. Hence, the information provided in these published case reports also document individuals with CD reacting adversely to estimated exposures to gluten at the low mg per day level via consumption of communion host wafers. These cases support the lowest doses associated with adverse effect levels identified in the findings from the dose-response studies described in the safety assessment above, and in turn, add to the weight-of-evidence for the existence of sensitivity to gluten during at least extended exposure in the very low mg level of intake. Finally, sensitivity to exposure to low levels of gluten via host wafers does not appear to be unique to these specific individuals discussed here as the need of and requests for the use of gluten-free host wafers for CD suffers has been expressed in recent years in a number of CD-related sources (e.g., Catholic Celiac Society; Gluten Intolerance Group of North America; Benedictine Sisters of Adoration). Age-Related Effects Age is suggested as a factor in the responsiveness of individuals with CD. An examination of the low dose NOAEL and LOAEL values for morphological and/or
51 In their paper, Auricchio and Troncone (1991) derived their estimate of gliadin exposure from communion host wafers based on information from another source. The cited source was as follows: Moriarty KJ, Brookes S, Loft D, Mpoko CN, Garner V, Marsh MN. International Coeliac Symposium. London, UK. 4-6 September 1988 52 Using the value for the gliadin content of host wafers determined by the direct analysis of hosts by Biagi et al. (2004) to calculate the gluten exposure experienced by the boy in this case report, the child’s exposure estimated to be 4.2 mg gluten (one time) per week, or if averaged over a week, it would represent an average of about 0.6 mg gluten per day.
34

physiological, and clinical adverse effects presented in Tables 1-3 and 5-7 (Appendix B), respectively, reveals that the lowest adverse effect dose values tend to be associated with studies that tested adult subjects in contrast to studies with subjects that were children. In addition, 5 of the 6 critical NOAEL and/or LOAEL values identified and thus, in turn, the derived TDI levels for morphological and clinical effects were based on studies that challenged adult subjects. The one exception is the study from which the chronic TDI for morphological effects was derived and this may possibly be related to the fact that very few low dose chronic exposure studies in either age group are available. Some of the apparent age differences in responsiveness to gluten by individuals with CD may be a function of the existing studies available in the published literature and/or to the year that the study was performed. However, as discussed earlier in this document, other findings also suggest age differences in aspects of the responsiveness and toxic reaction to gluten exposure exist (e.g., Ventura et al., 1999; Wahab et al., 2001; Farrell and Kelly, 2002; Green and Jabri, 2003; Capriles et al., 2009) with older individuals tending to be affected in a more significant way than younger ones. In sum, the available dose-effect information supports the notion that adults may be a sensitive subpopulation within the population of individuals diagnosed with CD. However, additional investigation and further characterization of the differences that may exist between age groups in responsiveness to gluten in CD is needed. Exposure Assessment Food Consumption Estimates53 Gluten or corresponding gluten-like proteins are found in foods made from wheat, rye, and barley. Individuals with CD are advised to avoid consuming these grains, and foods made from these grains or derivatives of them. Estimates of the typical consumption levels of these foods containing gluten or gluten-like proteins, irrespective of this dietary avoidance, were determined from the United States Department of Agriculture (USDA) Continuing Survey of Food Intake by Individuals (CSFII) for the combined survey years of 1994-96 and 1998. During this survey, dietary data were collected for 2 non-consecutive days for most survey participants. Consumption estimates of foods associated with CD were determined from all foods reported in the survey that included as ingredients the grain, flour or germ of wheat, rye or barley. The food consumption estimates reflect the gram (g) weight of the food consumed and not the gram weight of their gluten-containing ingredient(s) or the like. These estimates were considered to approximate the amount of food that a person with CD would have to replace with so-called “gluten-free” versions of the food to maintain similar caloric and nutrient intakes. Because the health hazard assessment for gluten was based upon studies that examined the health effects of challenge test doses of gluten proteins derived from only wheat, the consumption estimates were calculated according to two separate food categories: one category included all foods that contained wheat grain, flour or germ excluding foods that contained only rye and/or barley without wheat also present (referred to as “wheat gluten
53 The derivations of the food consumption estimates in the “Exposure Assessment” section were performed and provided by the Office of Food Additive Safety (DiNovi, 2009).
35

foods”) and the other category included all foods that contain wheat, rye and/or barley grain, or the flour or germ derived from these grains (referred to as “all CD grain foods”). For each food category, “wheat gluten foods” and “all CD grain foods,” both mean and 90th percentile estimates of food consumption were determined for the two population subgroups that were delineated in the health hazard assessment: children (individuals from 1-18 years of age), and adults (all individuals older than 18 years of age). In addition to considering the 2 different age groups, both mean and 90th percentile exposure estimates were determined for three different consumption time periods: per eating occasion (EO) (i.e., meals or snacks), per single day (i.e., 24 hours), and per average consumption over 2 days54. These different types of consumption estimates were employed as measures that most adequately reflect and correspond to the durations of exposure evaluated in the hazard/safety assessment, those being respectively the exposures of acute, subchronic and chronic duration. All of the various estimates are presented in Table 9 located at the end of this health hazard assessment document. Virtually one hundred percent of the American population over the age of 1 year consumes one or more food(s) that contain some wheat gluten and/or gluten-like proteins in the other grains associated with CD primarily because of the wide use of these ingredients in foods. As presented in Table 9, consumption estimates of “wheat gluten foods” per EO (i.e., acute exposure) for children are 100 g/EO and 300 g/EO for mean and 90th percentile consumption, respectively. For this same age group, the mean EO consumption level is 100 g/EO and for the EO consumption at the 90th percentile level is 300 g/EO for “all CD grain foods.” Next, EO consumption estimates of “wheat gluten foods” for adults are 200 and 400 g/EO for the mean and 90th percentile consumption, respectively. For this same age group, the EO consumption estimate for mean intake is 200 g/EO and for the 90th percentile intake is 500 g/EO for “all CD grain foods.” The estimates of consumption per single day (or 24 hours) (i.e., subchronic exposure) of the two food categories of “wheat gluten foods” and “all CD grain foods” for children are the same at the mean (400 g/day) and at the 90th percentile (700 g/day) consumption levels. In comparison, total daily consumption estimates for “wheat gluten foods” for adults are 400 g/day at the mean and 900 g/day at the 90th percentile consumption levels, while the total daily consumption estimates of “all CD grain foods” per person for this same subpopulation are 500 g/day at the mean and 1100 g/day at the 90th percentile consumption levels. Last, for children, the 2-day average (i.e., chronic) mean and 90th percentile consumption levels, respectively, are 400 g/day and 650 g/day for “wheat gluten foods.” Similarly, the chronic mean and 90th percentile consumption levels, respectively, are 400 g/day and 700 g/day for this same age group for “all CD grain foods.” In comparison, for adults, the mean chronic consumption is 400 g/day and the 90th percentile chronic consumption is 800 g/day for “wheat gluten foods.” For this same age group, the mean chronic consumption is 500 g/day and chronic consumption at the 90th percentile level is 900 g/day for “all CD grains foods.” Because so many foods are formulated with wheat-, rye-
54 The value is derived from data from individuals for which 2 different days of consumption survey data was collected.
36

and/or barley-based ingredients and consumers typically eat multiple foods containing them during a single day, the exposure estimates for chronic consumption are high in relation to EO exposure estimates. In addition, the chronic consumption estimates are similar to the single day consumption estimates because of the common inclusion of foods that contain wheat gluten and/or corresponding gluten-like proteins in rye and barley in the typical American diet. Finally, the estimated values determined in this exposure assessment for the average daily consumption in adults of gluten-containing foods for the subchronic and chronic exposure durations are in line with the level of daily consumption of commercially available gluten-free food products in adults found in a study by Catassi et al. (2007). A 30-day record of all special products consumed that was maintained by each CD subject (n=46) determined the daily average intake of gluten-free products to be 332 + 98 g.
Risk Characterization Uncertainty Issues in the Hazard Assessment Inter-Individual55 Variability and Related Uncertainty Issues In a traditional safety assessment, an UF is employed to account for differences between individuals that contribute to variability in their responsiveness to a toxic agent. It is typically reflected in use of a 10-fold UF for inter-individual variability when determining a tolerable intake level. It is noteworthy that arguments could be made that inter-individual variability in the gluten-sensitive population may be greater than that accounted for in the derivation of a tolerable intake level based on a single 10-fold UF and that this 10-fold factor may not be adequate in this case to determine the TDI. Available evidence suggests that many aspects of the response of those afflicted with CD to a gluten challenge vary widely. First, the type of clinical signs and symptoms seen, and the timing of their emergence vary to a significant degree between sensitive individuals. For instance, symptoms have been reported to occur within hours or days, to many weeks or as long as 15 months after a gluten challenge in sensitive subjects (e.g., Hamilton et al., 1972; Ciclitira et al., 1980; Chartrand et al., 1997; Laurin et al., 2002). Also some patients exhibit gluten-induced symptoms, while some gluten-sensitive patients show no overt clinical effects. Next, differences exist in aspects of the toxic response to gluten ingestion seen in CD sufferers across varying ages. Great variability across individuals with CD has been demonstrated in the timing of the development and the degree of severity of the pathogenesis of the small intestine mucosa that occurs upon exposure to gluten. In addition, those afflicted with CD may vary in the “background” or even “refractory” nature of their disease state. Accordingly, some may be diagnosed with CD, but vary on the length of time on a GFD, vary on the strictness of their GFD, or vary in the degree of consistent adherence or compliance to this treatment diet. The rate and
55 In the safety assessment approach, two of the major UFs considered are typically referred to as accounting for intra-species and inter-species differences. Because all the data evaluated in the safety assessment were derived from gluten challenge tests performed only in the “human” species, the UF for “intra-species” differences was instead referred to in this document as addressing “inter-individual” differences.
37

degree of recovery on the GFD also may vary. For instance, some evidence suggests that an increased responsiveness to gluten challenges is associated with prior pre-test exposure to a less strict GFD or to a strict GFD for a short duration (e.g., Ciclitira et al., 1984a; Ciclitira et al., 1985). Finally, the “threshold” dose of exposure that elicits morphological and/or clinical adverse effects varies between individuals with CD. For example, a 22-fold difference in this dose of reactivity (mean g gluten/day) was demonstrated within a single study where children with CD self-selected their dietary exposure level to gluten in food (Laurin et al., 2002). An underlying basis of aspects of the large range in the inter-individual differences seen in the nature and characteristic of the responsiveness to gluten in those afflicted with CD may be attributed at least in part to the differences in the CD-related genetic make-up of individuals. Some have suggested that those who are homozygous for HLA-DQ2 molecules may exhibit greater sensitivity and reactivity to gluten than HLA-DQ2 heterozygous individuals (Murray, 1999; Vader et al., 2003; Konig, 2005). Finally, in general, the sensitivity and responsiveness of CD sufferers to gluten is complex and multidimensional, and appears to be “individualistic” in nature. Taken together, these points suggest the possibility that an UF of 10 for inter-individual differences, and associated TDI estimates, may not be adequate for the protection of the population of individuals with CD. Additional uncertainty factors are a consideration in the derivation of tolerable intake levels that reflect the variability issues discussed here. In this case in particular, it is a consideration of significance in addressing uncertainty at the risk management stage. Other Uncertainty Issues Other serious medical conditions are part of the spectrum of clinical presentations associated with CD. Those with CD have an increased risk of development of a number of autoimmune diseases, bone diseases and malignancies. Also attributed to the relationship between CD and these other disease states is a higher mortality rate tied to those with CD than in the general population. Information on the level of gluten ingestion, particularly with respect to long-term ingestion of very low levels of gluten or related cereal proteins, in an avoidance diet, and its association with the development of these secondary diseases is lacking. The employment of additional UFs to account for the absence of substantial dose-response relationship information between gluten exposure and the occurrence of these additional illnesses in those with CD is another possible consideration to make in this safety assessment, or in subsequent risk management decisions that consider this issue and the uncertainty related to it. Analysis and Determination of the TDIs of Primary Focus Morphological Adverse Effects One role of the health hazard analysis is to characterize the nature of all available low dose-response data. The dose-response assessment performed in this work revealed that the onset of morphological and/or clinical adverse reactions in individuals with CD may occur subsequent to acute, subchronic or chronic exposure to gluten. The lowest levels of adverse response sensitivity for each duration of exposure from this available data were
38

identified and accordingly, the morphological and clinical TDIs for each duration were determined in the safety assessment. To allow for the practical application of this information, the identification of the single representative TDI value for morphological and for clinical effects was deemed appropriate. A further evaluation and analysis of the three resulting morphological TDIs and the data sets on which each were based suggests that the subchronic TDI be considered of primary focus for the overall tolerable level of gluten intake for those with CD. This determination is based on a number of factors and considerations. First, as indicated above in the safety assessment above, limited dose-response data in general and low-dose data in particular are available for chronic exposure to gluten in those with CD. The lowest dosages of gluten used in a challenge protocol of a chronic duration was 200 and 700 mg gluten/day which are about 1 to 2 orders of magnitude higher than were administered in low-dose challenge tests that have been performed for the other two durations of exposure. Also only 3 studies of the 7 total chronic studies in children and adults examined for morphological (and/or physiological) adverse effect(s) results administered dosages of less than 2.5 g gluten/day and only 1 study administered dosages less than 500 – 1000 mg gluten per day. Because of the current limitations that exist in low-dose challenge data in CD sufferers for chronic gluten exposure, the resulting chronic TDI derived from the available data may not reflect the lowest margins of the threshold of CD reactivity to chronic gluten intake. In turn, the paucity of chronic gluten low-dose challenge studies available at this time introduces additional uncertainty into the current determination of the chronic morphological TDI and thus, serves to lessen confidence in the resulting value. Next, the TDI for acute exposure to gluten was determined to be 12.5 mg gluten/day. It was based on a study that was assessed as having the best quality characteristics and data at this time to provide estimate of the TDI for acute exposure. However, as indicated in the discussion in the safety assessment above, this estimate was accompanied by a few caveats. Some other studies that administered gluten for an acute duration suggested the possibility that acute NOAEL and LOAEL for gluten could be 1 to 2 orders of magnitudes lower than the ones associated with the acute TDI arrived at in the safety assessment. But, aspects of the nature of these other studies and their findings did not allow for their selection as the “critical” one on which to base an acute TDI derivation (again see discussion above in the “Acute Exposure” subpart of the “Morphological Adverse Effects” subsection of the safety assessment above). These factors in the nature of the acute challenge study data available affect the degree of certainty and thus, confidence in whether the low-dose margins of the adverse effect levels for acute exposure were identified and chosen in deriving the final acute TDI. Another consideration is the role of the acute TDI for gluten in protecting individuals from the detrimental effects of gluten intake. Identifying the occurrence of acute adverse morphological responses to gluten intake of a brief duration, along with their seemingly transient nature,56 is an important component of this hazard/safety assessment. However,
56 More information is needed on whether the acute morphological (and/or clinical adverse effects) that are associated with intermittent episodes of acute gluten exposure can be accompanied by long-term adverse health effects and also the dose(s) of exposure that would be involved in the effect.
39

this type of exposure to gluten is probably less reflective of the dietary patterns exhibited by individuals with CD attempting to maintain a daily GFD, but may routinely encounter food products in the GFD that potentially contain some small or trace amounts of gluten protein. Taken together, the factors and considerations addressed here suggest that the derived TDI for an acute duration of exposure to gluten should not be the one of primary focus in the final steps of the determination of the gluten exposure levels of concern in food. Last, this final analysis of the derivations of the different TDIs for morphological effects and the studies and data on which they are based converge to leave the subchronic TDI of 0.4 mg gluten per day the one determined overall to best reflect the TDI for morphological effects from the data currently available. Several factors and considerations related to the subchronic gluten challenge data available lead to this determination. First, the critical study from which the critical NOAEL was a solid challenge study administered in a systematic fashion (e.g., ~ ABA design) to a reasonable number of CD subjects (n=10) over several weeks and that accounted for relevant factors (e.g., type of background pre-test GFD). Also a number of morphological and physiological measures (statistically analyzed group means) were examined in the response to the challenge substance and its absence, and the gluten-related no effects level (i.e., NOAEL= 4 mg gluten/day) was consistent across all these different measures. This low mg no adverse effect level was supported by another subchronic gluten challenge study (NOAEL = 10 mg gluten/day) that was performed in a DBPC fashion that also examined a number of indices that assessed duodenal morphology (see related details and discussion of these 2 studies in the “Adverse Morphological Effects” subsection in the “Safety Assessment” section). In addition, as previously noted, some low-dose acute gluten challenge studies (see Table 1 in Appendix B) are consistent with the possibility of existence of thresholds of reactivity to gluten in the low mg dose range as well as instances of case reports of adverse morphological effects induced by gluten intake at about this mg level of exposure (LOAEL~1 mg gluten/day) (see “Exposure Assessment” section that follows) for an extended time (see description of instances in “Case Reports” subsection above) provide added weight-of-evidence support for this critical dose level of gluten. Next, because of the nature of the two data sets currently available that examined extended low-dose exposure to gluten (i.e., subchronic versus chronic exposure durations), the findings from dose-response data associated with subchronic gluten exposure serves to best reflect to a reasonable degree the exposure that individuals with CD may encounter while navigating a daily GFD. Also the total daily consumption estimates for gluten (see “Exposure Assessment” and Table 9 that follow) for subchronic and chronic durations are the same at the mean intake levels and very similar at the 90th percentile intake levels for both the children and adult age groups. Finally, the goal of the safety assessment approach is to attempt to protect the most sensitive individuals (and in turn, all other sensitive individuals) from the detrimental health effects of a toxic substance, in this case gluten, by identifying the lower limits of reactivity to it. To this end, the subchronic TDI of 0.4 mg gluten per day for adverse morphological effects was selected as the overall principal critical morphological TDI
40

because it was the lowest overall morphological TDI that resulted in this analysis, along with the other factors and considerations noted above. A final consideration is that typically, in the safety assessment approach, when a TDI derived for chronic exposure to a substance is based on the data from a subchronic study because of the absence of adequate chronic dose-response data, an additional 10-fold UF is included to account for extrapolation from subchronic to chronic durations of exposure. However, in the case of the principal morphological TDI identified in this HHA, this added UF was not applied. This factor, among others (e.g., large inter-individual differences in gluten responsiveness), suggests that the principal morphological TDI value discussed above should not be considered an overly conservative estimate in protecting individuals with CD. Clinical Adverse Effects An evaluation of the resulting clinical TDIs across the three durations of exposure reveals that TDI of primary focus (and thus, the overall principal TDI) in the final analysis of tolerable levels of gluten intake with respect to adverse clinical effects was found to be a single value of 0.015 mg gluten per day. The same value for the LOAEL and thus, TDI for each duration of exposure emerged because each were derived from the single dosage (1.5 mg gluten/day) administered from the same study (see detailed discussion above in the “Clinical Adverse Effects” subsection in the “Safety Assessment” section). Several other studies that administered gluten in the low mg dose range for acute and subchronic durations also saw clinical responses. This serves to support the emergence of clinical adverse effects seen at the critical low dose-effect level (LOAEL = 1.5 mg gluten/day) (see also Tables 5 and 6 in Appendix B; also see “Case Report" subsection). Levels of Concern for Gluten The concentrations of gluten in food that corresponds to the TDIs identified as of primary focus were determined. These values were derived from the estimate of the level of exposure to “gluten-free” foods (which were based on an assumed comparable intake to the similar food that would have normally contained gluten) (i.e., kg food/day) for the subchronic and chronic57 durations of exposure (see “Exposure Assessment” section above and Table 9) and the principal TDIs (i.e., mg gluten/day) for morphological and clinical adverse effects (see “Analysis and Determination of the TDI of Primary Focus” subsection above). The resulting calculated concentration of gluten in food (mg gluten/kg food or ppm) is considered the “Level of Concern” (or LOC). The LOCs for gluten were determined for the consumption estimates for gluten-free “replacement” food58 in those with CD at the mean and 90th percentile intake levels of exposure for 2 different age
57 Food consumption estimates for subchronic and chronic durations were used both because they potentially reflect the nature of dietary exposures on a GFD, and the principal morphological TDI was derived from subchronic dose-response data. Food consumption estimates for chronic exposure were employed because they are reflective of dietary patterns of exposure for individuals on a GFD. 58 The term “replacement” food refers to gluten-free food ingested by consumers with CD for which an intake estimate was based on and assumed to be the comparable to the gluten-containing version of the food.
41

groups, children (1-18 years old) and adults (over 18 years old)59. The LOC values for morphological and clinical adverse effects were estimated, first, for intake of gluten in wheat-related replacement food, meaning the associated food consumption estimates based on only foods containing wheat or wheat-based subcomponents. These gluten values are referred to as “wheat gluten foods” LOCs in Table 10 in Appendix B. As discussed earlier in the document in the “Hazard Identification” section (see the “Gluten” subpart under the “Dietary Effects” subsection), the low-dose challenge studies that were the basis the dose-response effects characterized and described in this hazard/safety assessment all administered wheat gluten or related wheat protein subfractions. Thus, the TDIs derived and discussed in the “Safety Assessment” section and also above in the “Risk Characterization” section represent the TDIs associated only with exposure to wheat gluten and not to exposure to the respective “gluten-like” proteins in rye (e.g., secalin) and barley (e.g., hordein), the other grains of importance in CD. Because no information is available on the relative potency of the respective gluten-like protein derivatives of these latter grains to wheat gluten proteins, the extrapolation of quantitative data from wheat gluten challenge studies to dose-response effects in these other toxic grains can not be executed at this time. In turn, TDI values specifically accounting for the adverse effects of exposure to gluten-like proteins in rye and barley, if they differ from the one(s) derived from wheat gluten CD data alone, can not be determined at this time. So, for the purposes of this hazard/safety analysis, it was assumed that the potencies of gluten-like proteins in rye and barley are each comparable to that of wheat gluten proteins and thus, the TDIs derived from wheat gluten dose-response challenge data were also representative of TDIs associated with the CD-related adverse effects of relevant rye and barley proteins. To calculate LOCs that encompassed exposures to CD-inducing proteins in all three grains together, food consumption estimates for foods that contained wheat, rye and barley and/or components of these grains that contain gluten-like protein derivations were considered along with the TDIs of primary focus. The resulting LOCs derived from this information reflect the gluten-related protein content of replacement foods associated with these three grains in the GFD of individuals with CD. These values were referred to as “all CD grain foods” LOCs in Table 11 in Appendix B. The LOCs presented in Tables 10 and 11 (Appendix B) are estimates of concentrations of wheat gluten in “wheat gluten foods” and of relevant gluten-like proteins in all three CD-related grains foods (i.e., “all CD grain foods”) above which adverse effects associated with CD could potentially occur. The LOC for gluten in replacement “wheat gluten food” for adverse morphological effects at the mean and the 90th percentile levels is approximately 1.0 ppm and 0.6 ppm, respectively, in children (1-18 year olds). Similar morphological LOC values at both the mean and the 90th percentile levels are seen in children for the consumption of all 3 CD-inducing grains or, in other words the “all CD grain foods.” In adults (18+ years old), the LOC for gluten in replacement “wheat gluten food” for adverse morphological effects at the mean and 90th percentile levels is approximately 1.0 ppm and 0.4 ppm, respectively. The morphological LOC for gluten-
59 The LOC values are predicated on the food consumption estimates provided in the “Exposure Assessment” section.
42

related proteins at the mean and the 90th percentile intake levels in adults for the consumption of all 3 CD-inducing grains or, in other words, the “all CD grain foods” is 0.8 ppm and 0.4 ppm, respectively. Finally, the estimates for the LOC for adverse morphological effects at each percentile level of consumption were essentially the same for exposures of a subchronic and chronic duration. The assessment of adverse clinical effects reveal that the LOC values for gluten and/or gluten-related proteins in food are about 1-2 orders of magnitude lower than are found for morphological effects. The LOC for gluten and/or gluten-like proteins in both “wheat gluten foods” and “all CD grain foods” for adverse clinical effects at the mean and the 90th percentile levels is 0.04 ppm and 0.02 ppm, respectively, in children (1-18 year olds). These LOC values hold for both subchronic and chronic exposure estimates in children. In adults (18+ years old), the LOC for gluten in replacement “wheat gluten food” for adverse clinical effects at the mean and the 90th percentile levels is approximately 0.04 ppm and 0.02 ppm, respectively, for exposures of subchronic and chronic durations. The clinical LOC for gluten-related proteins at the mean and the 90th percentile intake levels in adults for the consumption of all 3 CD-inducing grains (i.e., “all CD grain foods”) is approximately 0.03 ppm and 0.01 ppm, respectively. Finally, for the most part, the estimates for the LOC for adverse clinical effects at each percentile level of consumption were the same for exposures of a subchronic and chronic duration. Last, it should be kept in mind that several factors suggest the possibility that the TDI contribution to the morphological LOC estimates may not be a value that is “conservative” in nature. A 10-fold UF for inter-individual variability was applied to a morphological NOAEL in determining the TDI that was of primary focus. However a fairly large inter-individual variability in sensitivity to gluten between individuals with CD has been demonstrated in the dose-response data evaluated. Also demonstrated was the occurrence of adverse morphological responses at dose levels lower than the subchronic NOAEL associated with the TDI of primary focus (e.g., acute morphological LOAEL study, case reports). They suggest that this principal morphological TDI and corresponding LOCs may not be completely protective of the most sensitive individuals with CD. The significance and role of the inter-individual differences are elements of the outcome of hazard/safety assessment to be weighed in interpreting its results, and possibly factors to deliberate at the risk management stage. Sensitivity Analysis Associated with Gluten Chemical Compositions
The critical studies from which the morphological and clinical TDIs of primary focus were derived in this safety assessment administered gliadin. To express the levels of exposure to gliadin as gluten levels, a conversion factor of two-fold was used. This conversion factor reflects a ratio of 2:1 gliadin:gluten, or that of a 50:50 gliadin:glutenin ratio of molecular composition, and was identified as the most commonly used and best supported estimate at this time (for additional details see earlier subsection “Other Relevant Dose-Response Data Characteristics” under the section titled “Nature and Characteristics of the Toxic Responses Evaluated”). However, recent research that evaluated and characterized the chemical structure of gluten and its protein subfractions indicated that the gliadin:glutenin ratio of structural composition is approximately 68:32
43

(Wieser, 2007).60,61 A sensitivity analysis was performed to examine the nature of the effect on LOC values if the protein subfractions that comprised gluten were in the proportions suggested in this more recent chemical structure analysis of this compound. This analysis found that the TDIs of primary focus for adverse morphological effects and for adverse clinical effects, respectively, would be 0.29 mg gluten/day and 0.011 mg gluten/day. This contrasts and is lower than the morphological and clinical primary TDI values of 0.4 mg gluten/day and 0.015 mg gluten/day, respectively, determined in the safety assessment by assuming a 50:50 gliadin:glutenin ratio. The LOCs for gluten and/or gluten-like proteins derived in this assessment also would be lower as a result of gluten challenge study dosages and TDI calculations that would be based on the chemical structure ratio more recently put forth. For example, the LOC for gluten for morphological effects in adults at the mean and 90th percentile intake levels of “wheat gluten foods” would be about 0.73 ppm and 0.32 ppm, respectively, contrasting the originally derived values of 1.0 ppm and 0.4 ppm, respectively. This pattern of lowered LOCs seen for adverse morphological effects in adults is also seen for LOC values for adverse clinical effects, for children and for “all CD grain foods” (data not shown). Last, the findings from the sensitivity analysis presented here provides information on an additional factor that suggests the final TDI and LOC values that resulted from the safety/risk assessment may not be as conservative in nature as thought and thus, possibly, should not be viewed or interpreted as such. Summary and Conclusions Exposure to wheat, barley or rye, or the plant storage proteins of these grains, leads to the development of CD in genetically predisposed individuals. CD is a permanent hypersensitivity reaction that results in an immune-mediated enteropathy of the small intestine. The morphological damage and deterioration of the small intestine mucosa associated with CD is characterized by multipartite and specific histopathological changes and abnormalities in the mucosal architecture that typically occur in phases that progress sequentially until the endstage of mucosal villous atrophy. The enteropathy found in CD is tied, at least in part, to an array of clinical signs and symptoms (e.g., diarrhea, constipation, abdominal pain, nausea and/or vomiting), and also with other sequelae (e.g., anemia, nutritional deficiencies, growth disturbances, weight loss) that are associated with enteropathy-induced malabsorption. However, not all of those afflicted with CD exhibit clinical responses or these other possible sequelae in response to cereal
60 The gluten protein subtypes characterized by Wieser (2007) were presented as a range of the proportion or percentages of total gluten proteins. The total gliadin protein type subfraction ranged from 58-77%, while the total glutenin protein type subfraction ranged from 26-38%. Each respective range was averaged to arrive at a proportion ratio of 68:32 gliadin:glutenin. This was the protein composition ratio for gluten utilized in the sensitivity analysis performed above. 61 Others have interpreted the Wieser (2007) paper as demonstrating the gluten composition ratio of gliadin:glutenin as 65:35 and noted it as so (Thompson and Mendez, 2008). As revealed above, the interpretation by FDA of the gluten protein information in the Wieser (2007) paper slightly differed from this one. The gluten protein subtype structure ratio employed by FDA in this sensitivity analysis was based on our direct evaluation and interpretation of the Wieser (2007) work (see previous footnote).
44

grain triggers. Also part of the clinical presentations associated with CD and exposure to toxic cereal grains is increased risk of development of secondary disorders and diseases that include a number of autoimmune conditions, bone diseases and malignancies. The effect of exposure to gluten on individuals with CD varies in a significant number of ways. Gluten can be an acute, subchronic and/or chronic toxin in those afflicted with CD. In turn, acute, subchronic and chronic adverse effects can be clinical and/or morphological in nature. Evidence suggests that for those with CD, significant individual variability exists in the nature of their responsiveness to gluten. The type of clinical signs and symptoms seen, if any, and the timing of their emergence vary to a significant degree between sensitive individuals. Also, great variability across individuals with CD is seen in the timing of the development and the degree of severity of the pathogenesis of the small intestine mucosa that occurs upon exposure to gluten. In addition, age differences are suggested to play a role in the nature of the toxic reaction to gluten ingestion seen in CD sufferers. This includes the suggestion that adults may be a sensitive subpopulation of those afflicted with CD. The estimated TDIs for gluten in individuals with CD across the different durations of exposure are in the low mg level (or possibly lower) range for morphological effects, and in the low ug level range for clinical effects. Because of the significant degree of individual variability in the sensitivity and responsiveness to gluten found in those with CD and the apparently narrow margin in the dose level between the no and low adverse effect levels, the UFs used in the safety assessment may not be adequate. Other UFs may be warranted to provide a sufficient level of protection for gluten-sensitive individuals, especially those who are the most sensitive within this subgroup of individuals with CD, and possibly to account for the limited dose-effect information available on the risk of secondary gluten-induced medical conditions. Next, the TDI values derived for gluten in this health hazard assessment apply only to exposure to wheat gluten. In turn, the “wheat gluten food” LOCs was derived from the overall principal TDI that was based on data that directly assessed and quantified the toxicological effects of wheat gluten in CD. Thus, these LOC values are reflective of the adverse effects associated with CD that are directly attributed to exposure to this wheat cereal protein. Information on the relative potency of relevant CD-inducing storage proteins in wheat, rye and barley is lacking; thus, extrapolation of quantitative data and estimates derived from wheat gluten studies to other toxic grains is problematic at this point. But, if it is the case that the toxic potency of wheat gluten is comparable to the gluten-like proteins in rye and barley as assumed in this assessment, then the LOC values that also account for exposure to rye and barley are similar to those that considered only the consumption of wheat. Additional research that investigates the low dose-response adverse effects data of relevant rye and barley proteins involved in CD along with information on their relative toxic potency to wheat gluten is needed. Last, after the evaluation of all low dose-response data available on the adverse CD-related health effects of gluten, the tolerable daily intake level for gluten in individuals with CD was determined in a safety assessment to be 0.4 mg gluten/day for adverse morphological effects and 0.015 mg gluten/day for adverse clinical effects. Some evidence suggests that the possibility that the TDI for morphological effects based on a derivation that incorporated a 10-fold UF for inter-individual differences may not include
45

a margin of error (or safety) that protects all individuals with CD. The LOC values for gluten in food that correspond with these TDI values at the 90th percentile level of intake are less than 1 ppm for both morphological (~0.5 ppm) and clinical (~0.02 ppm) adverse effects. In sum, these findings indicate that a less than 1 ppm level of gluten in foods is the level of exposure for individuals with CD on a GFD that protects the most sensitive individuals with CD and thus, also protects the most number of individuals with CD from experiencing any detrimental health effects from extended to long-term exposure to gluten.
46

References62 American Gastroenterological Association (AGA). American Gastroenterological Association medial position statement: celiac sprue. Gastroenterol 120(6): 1522-1525, 2001 American Gastroenterological Association (AGA). AGA Institute medical position statement on the diagnosis and management of celiac disease. Gastroenterol 131(6): 1977-1980, 2006 Auricchio S, Troncone R. Effects of small amounts of gluten in the diet of celiac patients. Panminerva Med 33: 83-85, 1991 Barton SH, Murray JA. Celiac disease and autoimmunity in the gut and elsewhere. Gastroenterol Clin N Am 37: 411-428, 2008 Benedictine Sisters of Adoration, www.benedictinesisters.org, 2009 Bernstein CN, Leslie WD, Leboff MS. AGA technical review on osteoporosis in gastrointestinal diseases. Gastroenterol 124: 795-841, 2003 Biagi F, Campanella J, Martucci S, Pezzimenti D, Ciclitira PJ, Ellis HJ, Corazza GR. A milligram of gluten a day keeps the mucosal recovery away: a case report. Nutr Rev 62(9): 360-363, 2004 Biagi F, Pezzimenti D, Campanella J, Corazza GR. Gluten exposure and risk of autoimmune disorders. (Letter) Gut 50: 140-142, 2002 Bianchi ML, Bardella MT. Bone and celiac disease. Calcif Tissue Int 71: 465-471, 2002 Bianchi ML. Inflammatory bowel diseases, celiac disease, and bone. Arch Biochem Biophys 503: 54-65, 2010 Brar P, Kwon GY, Egbuna II, Holleran S, Ramakrishnan R, Bhagat G, Green PHR. Lack of correlation of degree of villous atrophy with severity of clinical presentation of celiac disease. Dig Liver Dis 39(1): 26-29, 2007 Capriles VD, Martini LA, Areas JAG. Metabolic osteopathy in celiac disease: importance of a gluten-free diet. Nutr Rev 67(10): 599-606, 2009 Catassi C, Bearzi I, Holmes GKT. Association of celiac disease and intestinal lymphomas and other cancers. Gastroenterol 128: S79-S89, 2005
62 The references listed in this section are specifically cited in the narrative of the written text of this main “Health Hazard Assessment” document. Additional gluten challenge studies that contained dose-response data were reviewed and evaluated but not noted in the main text or this reference list. All gluten-challenge studies examined for toxicological dose-response information in this assessment are listed in Appendix A.
47

Catassi C, Fabiani E, Iacono G, D’Agate C, Francavilla R, Biagi F, Volta U, Accomando S, Picarelli A, De Vitis I, Pianelli G, Gesuita R, Carle F, Mandolesi A, Bearzi I, Fasano A. A prospective, double-blind, placebo-controlled trial to establish a safe gluten threshold for patients with celiac disease. Am J Clin Nutr 85: 160-166, 2007 Catassi C, Rossini M, Ratsch I-M, Bearzi I, Santinelli A, Castanani R, Pisani E, Coppa GV, Giorgi PL. Dose dependent effects of protracted ingestion of small amounts of gliadin in celiac disease children: a clinical and jejunal morphometric study. Gut 34: 1515-1519, 1993 Catholic Celiac Society, www.catholicceliacs.org, 2009 Cellier C, Flobert C, Cormier C, Roux C, Schmitz J. Severe osteopenia in symptom-free adults with a childhood diagnosis of celiac disease. Lancet 355: 806, 2000 Chartrand L, Russo PA, Duhaime AG, Seidmain EG. Wheat starch intolerance in patients with celiac disease. J Am Diet Assoc 97(6): 612-618, 1997 Ciclitira PJ, King Al, Fraser JS. AGA Technical Review on Celiac Sprue. Gastroenter 120(6): 1526-1540, 2001 Ciclitira PJ, Cerio R, Ellis HJ, Maxton D, Nelufer JM, Macartney JM. Evaluation of gliadin-containing gluten-free product in coeliac patients. Hum Nutr Clin Nutr 39C: 303-308, 1985 Ciclitira PJ, Ellis HJ, Fagg NLK. Evaluation of gluten free product containing wheat gliadin in patients with coeliac disease. Br Med J 289: 83, 1984a Ciclitira PJ, Evans DJ, Fagg NLK, Lennox ES, Dowling RH. Clinical testing of gliadin fractions in celiac patients. Clin Sci 66: 357-364, 1984b Ciclitira PJ, Hunter JO, Lennox ES. Clinical testing of bread made from nullisomic A wheats in coeliac patients. Lancet 2: 234- 236, 1980 Codex, Joint Food and Agriculture Organization of the United Nations, World Health Organization, Food Standards Program. Report of the 28th Session of the Codex Committee on Nutrition and Foods for Special Dietary Uses. Rome, Italy. pp 11-13, 2006 Collin P, Reunala T, Pukkala E, Laippala P, Keyrilainen O, Pasternack A. Coeliac disease: associated disorders and survival. Gut 35: 1215-1218, 1994 Corrao G, Corazza GR, Bagnardi V, Brusco G, Ciacci C, Cottone M, Cottone M, Guidetti CS, Usai P, Cesari P, Pelli MA, Loperfido S, Volta U, Calabro A, Certo M. Mortality in patients with coeliac disease and their relatives: a chort study. Lancet 358: 356-361, 2001
48

Corazza GR, DiSario A, Cecchetti L, Tarozzi C, Corrao G, Bernardi M, Gasbarrin G. Bone mass and metabolism on patients with celiac disease. Gastroenterol 109(1): 122-128, 1995 Cranney A, Zarkadas M, Graham ID, Butzner JD, Rashid M, Warren R, Molloy M, Case S, Burrows V, Switzer C. The Canadian Celiac Health Survey. Dig Dis Sci 52: 1087-1095, 2007 Dewar DH, Amato M, Ellis HJ, Pollock EL, Gonzalez-Cinca N, Wieser H, Ciclitira PJ. The toxicity of high molecular weight glutenin subunits of wheat to pateints with coeliac disease. Eur J Gastroenterol Hepatol 18: 483-491, 2006 Dewar DH, Ciclitira PJ. The pathology of celiac disease. National Institutes of Health (NIH) Consensus Development Conference on Celiac Disease, NIH, Bethesda, MD, pp. 23-25, June 28-30, 2004 Dewar DH, Pereira SP, Ciclitira PJ. The pathogenesis of coeliac disease. Int J Biochem Cell Biol 36: 17-24, 2004 Dickey W, Huges DF, McMillan SA. Disappearance of endomysial antibodies in treated CD does not indicate histological recovery. Am J Gastroenterol 95: 712-714, 2000 Dickson BC, Streutker CJ, Chetty R. Coeliac disease: an update for pathologists. J Clin Pathol 59: 1008-1016, 2006 DiNovi M. Exposure assessment: Food consumption estimates for the grains associated with celiac disease. Office of Food Additive Safety, Center of Food Safety and Applied Nutrition, Food and Drug Administration, 2009. Farrell RJ, Kelly CP. Celiac sprue. N Engl J Med 346(3): 180-188, 2002 Fasano A, Catassi C. Current approaches to diagnosis and treatment of celiac disease: A evolving spectrum. Gastroenterol 120: 636-651, 2001 Frazer AC, Fletcher RF, Ross CAC, Shaw B, Sammons HG, Schneider R. Gluten-induced enteropathy: The effect of partially digested gluten. Lancet 2: 252-255, 1959 Glastras SJ, Craig ME, Verge CF, Chan AK, Cusumano JM, Donaghue KC. The role of autoimmunity at diagnosis of type 1 diabetes in the development of thyroid and celiac disease and microvascular complications. Diabetes Care 28(9): 2170-2275, 2005 Gluten Intolerance Group of North America, www.gluten.net, 2009 Goddard CJR, Gillett HR. Complications of celiac disease: are all patients at risk? Postgrad Med J 82: 705-712, 2006
49

Godkin A, Jewell D. The pathogenesis of celiac disease. Gastroenterol 115(1): 206-210, 1998 Green PHR, Jabri B. Coeliac disease. Lancet 362: 383-391, 2003 Green PHR, Stravropoulos SN, Panagi SG, Goldstein SL, McMahon DJ, Absan H, Neugut AI. Characteristics of adult celiac disease in the USA: results of a national survey. Am J Gastroenterol 96(1): 126-131, 2001 Guidetti CS, Solerio E, Scaglione N, Aimo G, Mengozzi G. Duration of gluten exposure in adult celiac disease does not correlate with the risk for autoimmune disorders. Gut 49: 502-505, 2001 Hamilton JR, McNeill, LK. Childhood celiac disease: Response of treated patients to a small uniform daily dose of wheat gluten. J Pediatr 81(5): 885-893, 1972 Hill ID, Dirks MH, Liptak GS, Colletti RB, Fasano A, Guandalini S, Hoffenberg EJ, Horvath K, Murray JA, Pivor M, Seidman EG. Guideline for the diagnosis and treatment of celiac disease in children: Recommendations of the North American Society for Pediatric Gastroenterology, Hepatology and Nutrition. J Pediatr Gastroenterol Nutr 40(1): 1-19, 2005 Howdle PD. Gliadin, glutenin or both? The search for the Holy Grail in coeliac disease. Eur J Gastroenterol Hepatol 18: 7003-7006, 2006 Hunt KA, Zhernakova A, Turner G, Heap GAR, Franke L, Bruinenberg M, Romanos J, Dinesen LC, Ryan AW, Panesar D, Gwilliam R, Takeuchi F, McLaren WM, Holmes GKT, Howdle PD, Walter JRF, Sanders DS, Playford RJ, Trynka G, Mulder CJJ, Mearin ML, Verbeek WHM, Trimble V, Stevens FM, O’Morain C, Kennedy NP, Kelleher D, Pennington DJ, Strachan DP, McArdle WL, Mein CA, Wapenaar MC, Deloukas P, McGinnis R, McManus R, Wijmenga C, van Heel DA. Newly identified genetic risk variants for celiac disease related to the immune response. Nature Genetics 40(4): 395-402, 2008 Kagnoff MF. Overview and pathogenesis of celiac disease. Gastroenterol 128(4): S10-S18, 2005 Kasarda DD. Celiac disease and safe grains. http://wheat.pw.usda.gov/ggpages/topics/Celiac.vs.grains.html, pp 1-8, 2005a Kasarda DD. Grains in relation to celiac disease. Cereal Foods World 46(5): 209-201, 2001 Kasarda DD. Memorandum of phone call between RR Kane and DD Kasarda. CFSAN, FDA. January 22, 2005b
50

Kasarda DD. Toxic cereal grains in celiac disease. From: Gastrointestinal Immunology and gluten-sensitive disease. Proceedings of the Sixth International Symposium on Coeliac Disease, edited by C Feighery and C O’Farelly. Dublin: Oak Tree Press, pp203-222, 1994 Kasarda DD. What we know about grain safety. Paper presented at the Columbia University Celiac Disease and Other Food Intolerances Conference, Columbia University Medical Center, New York, NY, Program Description & Objectives, pp 23-33, October 22, 2004 Kendall MJ, Schneider R, Cox PS, Hawkins CF. Gluten subfractions in coeliac disease. Lancet 2: 1065-1067, 1972 Klaassen CD, Eaton DL. Principles of Toxicology, Chapter 2. Casarett and Doull’s Toxicology: The Basic Science of Poisons, Fourth edition. MO Amdur, J Doull, CD Klaassen, Editors. New York: Pergamon Press, Inc. pp 12-49, 1991 Koning F. Celiac disease: Caught between a rock and a hard place. Gastroenterol 129(4): 1294-1301, 2005 Kumar PJ, O’Donoghue DP, Stenson K, Dawson AM. Reintroduction of gluten in adults and children with treated celiac disease. Gut 20: 743-749, 1979 Kurppa K, Collin P, Viljamaa M, Haimila K, Saavalainen P, Partanen J, Laurila K, Huhtala H, Paasikivi K, Maki M, Kaukinen K. Diagnosing mild enteropathy celiac disease: A randomized, controlled clinical study. Gastroenterol 136: 816-823, 2009 Laurin P, Wolving M, Falth-Magnusson K. Even small amounts of gluten cause relapse in children with celiac disease. J Pediatr Gastroenterol Nutr 34: 26-30, 2002 Lavo B, Knutson L, Loof L, Hallgren R. Gliadin-induced jejunal prostaglandin E2 secretion in celiac disease. Gastroenterol 99(3): 703-707, 1990a Lavo B, Knutson L, Loof L, Odlind B, Hallgren R. Signs of increased leakage over the jejunal mucosa during gliadin challenge of patients with celiac disease. Gut 31: 153-157, 1990b Leigh RJ, Marsh MN, Crowe P, Kelly C, Garner V, Gordon D. Studies of intestinal lymphoid tissue IX: Dose-dependent, gluten-induced lymphoid infiltration of coeliac jejunal epithelium. Scand J Gastroenterol 20: 715-719, 1985 Logan RFA, Rifkind EA, Turner ID, Ferguson A. Mortality in celiac disease. Gastroenterol 97(2): 265-271, 1989
51

Ludvigsson JF, Michaelsson K, Ekbom A, Montgomery SM. Coeliac disease and risk of fractures – a general population-based cohort study. Aliment Pharmacol Ther 25: 273-285, 2007 MacDonald WC, Brandborg LL, Flick AL, Trier JS, Rubin CE. Studies of celiac sprue. IV. The response of the whole length of the small bowel to gluten-free diet. Gastroenterol 47(6): 573-589, 1964 Maki M, Collin P. Coeliac disease. Lancet 349: 1755-1759, 1997 Marsh MN. Gluten, major histocompatibility complex and the small intestine: A molecular and immunobiologic approach to the spectrum of gluten sensitivity (“celiac sprue”). Gastroenterol 102: 330-354, 1992 Mayer M, Greco L, Troncone R, Grimaldi M, Pansa G. Early prediction of relapse during gluten challenge in childhood celiac disease. J Pediatr Gastroenterol Nutr 8: 474-479, 1989 McFarlane XA, Bhalla AK, Reeves DE, Morgan LM, Robertson DAF. Osteoporosis in treated adult coeliac disease. Gut 36: 710-714, 1995 McGough N, Cummings JH. Coeliac disease: a diverse clinical syndrome caused by intolerance of wheat, barley and rye. Proc Nutr Soc 64: 434-450, 2005 Meeuwisse GW. Diagnostic criteria in celiac disease. Acta Paediatr Scand 59: 461-463, 1970 Merck Manual of Diagnosis and Therapy, The - 18th Edition, Chapter 112, Bullous Diseases. online.statref.com, 2006 Meyer D, Stravropoulos SN, Diamond B, Shane E, Green PHR. Osteoporosis in North American adult population with celiac disease. Am J Gastroenterol 96 (1): 112-119, 2001 Murray JA. Celiac disease in patients with an affected member, Type 1 diabetes, iron-deficiency, or osteoporosis? Gastroenterol 128(4): S52-S56, 2005 Murray JA. The widening spectrum of celiac disease. Am J Clin Nutr 69: 354-365, 1999 Murray JA, Rupio-Tapia AR. Author reply to Letter to the Editor (Mucosal atrophy extent and clinical correlation in celiac disease) Clin Gastroenter Hepatol 6(2):186-193, 2008 Murray JA, Rupio-Tapia A, Van Dyke CT, Brogan DL, Knipschield MA, Lahr B, Rumalla A, Zinsmeister AR, Gostout CJ. Mucosal atrophy in celiac disease: Extent of involvement, correlation with clinical presentation, and response to treatment. Gastroenter Hepatol 6(9):1061, 2008
52

Murray JA, Van Dyke C, Plevak MF, Dierkhising RA, Zinsmeister AR, Melton LJ. Trends in the identification and clinical features of celiac disease in a North American community, 1950-2001. Clin Gastroenterol Hepatol 1: 19-27, 2003 National Institutes of Health (NIH), NIH Consensus Development Conference Statement: Celiac Disease. June 28-30, 2004 NIH Consensus Development Conference on Celiac Disease, NIH, Bethesda, MD, pp. 1-15, Final Statement: August 9, 2004 Oberhuber G, Grandistsch G, Vogelsang H. The histopathology of celiac disease: time for a standardized report scheme for pathologists Eur J Gastroenterol Hepatol 11: 1185-1194, 1999 Olmos M, Antelo M, Vazquez H, Smecuol E, Maurino E, Bai JC. Systematic review and meta-analysis of observational studies on prevalence of fractures in celiac disease. Dig Liv Dis 40: 46-53, 2008 Packer SM, Charlton V, Keeling JW, Risdon RA, Oglilvie D, Rowlatt RJ, Larcher VF, Harries JT. Gluten challenge in treated celiac disease. Arch Dis Child 53: 449-455, 1978 Peters U, Askling J, Gridley G, Ekbom A, Linet M. Causes of death in patients with celiac disease in a population-based Swedish cohort. Arch Intern Med 163: 1566-1572, 2003 Pomeranz Y. Chapter 4. Composition. In: Modern Cereal Science and Technology. New York, New York: VCH Publishing, Inc., pp 40-53, 1987 Rolles CJ, McNeish AS. Standardised approach to gluten challenge in diagnosing childhood celiac disease. Br Med J 1: 1309-1311, 1976 Rostom A, Murray JA, Kagnoff MF. American Gastroenterological Association (AGA) Institute technical review on diagnosis and management of celiac disease. Gastroenterol 131(6): 1981-2002, 2006 Scotta MS, De Giacomo C, Maggiore G, Siena S, Ugazio AG. Eucharistic problems for celiac patients. N Engl J Med 307(14): 898, 1982 Shewry PR, Tatham AS, Forde J, Kreis M, Miflin BJ. The classification and nomenclature of wheat gluten proteins: a reassessment. J Cereal Sci 4: 97-106, 1986 Stazi AV, Trecca A, Trinti B. Osteoporosis in celiac disease and in endocrine and reproductive disorders. World J Gastroenterol 14(4): 498-505, 2008 Stern M, Ciclitira PJ, van Eckert R, Feighery C, Janssen FW, Mendez E, Mothes T, Troncone R, Wieser H. Analysis and clinical effects of gluten in celiac disease. Eur J Gastroenterol Hepatol 13: 741-747, 2001
53

Thompson T, Mendez E. Commercial assays to assess gluten content of gluten-free foods: Why they are not created equal. J Am Diet Assoc 108(10):1682-1687, 2008 Troncone R, Mayer M, Spagnuolo F, et al. Endomysial antibodies as unreliable markers for slight dietary transgression in adolescents with CD. J Pediatr Gastroenterol Nutr 21: 69-72, 1995 Tursi A, Brandimarte G. The symptomatic and histologic response to a gluten-free diet in patients with borderline enteropathy. J Clin Gastroenterol 36(1): 13-17, 2003 Vader W, Kooy Y, Van Veelen P, De Ru A, Harris D, Benckhuijsen W, Pena S, Mearin L, Drijfhout JW, Konig F. The gluten response in children with celiac disease is directed toward multiple gliadin and glutenin peptides. Gastroenterol 122: 1729-1737, 2002 Vader W, Stepniak D, Kooy Y, Mearin L, Thompson A, van Rood JJ, Spaenij L, Konig F. The HLA-DQ2 gene dose effect in celiac disease is directly related to the magnitude and breadth of gluten-specific T cell responses. Proc Natl Acad Sci 100(21): 12390-12395, 2003 Valdimarsson T, Lofman O, Toss G, Strom M. Reversal of osteopenia with diet in adult coeliac disease. Gut 38: 322-327, 1996 Ventura A, Magazzu G, Greco L. Duration of exposure to gluten and risk for autoimmune disorders in patients with celiac disease. Gastroenterol 117: 297-303, 1999 Wahab PJ, Crusius BA, Meijer JWR, Mulder CJJ. Gluten challenge in borderline gluten-sensitive enteropathy. Am J Gastroenterol 96: 1464-1469, 2001 Walker-Smith JA, Guandalini S, Schmitz J, Shmerling DH, Visakorpi JK. Revised criteria for diagnosis of celiac disease. Arch Dis Child 65: 909-911, 1990 Wieser H. Chemistry of gluten proteins. Food Microbiol 24: 115-119, 2007
54

55
Table 9. Summary of Consumption Estimates for Foods Containing Grains and/or Their Constituents Associated with CD
All CD Grain Foods Wheat Gluten Foods Chronic
(2-day average) g/day
Subchronic (1-day average) g/day
Acute (Eating Occasion) g/EO
Chronic (2-day average) g/day
Subchronic (1-day average) g/day
Acute (Eating Occasion) g/EO
mean 400 400 100 400 400 100 1-18 Year olds
90th 700 700 300 650 700 300
mean 500 500 200 400 400 200 >18 Year olds
90th 900 1100 500 800 900 400
Units = grams (g) weight of food consumed per time period (either day(s) or eating occasion, EO)

Health Hazard Assessment for Gluten Exposure in Individuals with Celiac Disease
A-1
Appendix A This appendix lists the all identified studies that contained dose-response data associated with the adverse effects of exposure to gluten or related compounds in individuals with celiac disease (CD). The references are listed under the experimental categories that they were examined for this information. Characteristics specific to each reviewed study are also noted under its reference. The references identified with a * symbol represent studies with low-dose gluten exposure data that were evaluated and considered in further depth and that were presented in detail in the corresponding table in Appendix B. Morphological and/or Physiological Adverse Effects Acute exposure data sources: Children *Frazer AC, Fletcher RF, Ross CAC, Shaw B, Sammons HG, Schneider R. Gluten-induced enteropathy: The effect of partially digested gluten. Lancet 2: 252-255, 1959 1Challenge Type: Open challenge 2Challenge Agent: Peptic-tryptic partial digest of gluten (primarily food; sometimes water) 3Challenge Dose: 8 g/day fraction III or fraction IV & V mixture; or 5 g/day fraction IIIA 4Challenge Route: Oral 5Conversion factor: Noted in reference 6Other Information: Subjects on “strict gluten-free diet (GFD) regime” prior to challenge Greco L, D’Adamo G, Truscelli A, Parrilli G, Mayer M, Budillon G. Intestinal permeability after single dose of gluten challenge in celiac disease. Arch Dis Child 66(7): 870-872, 19917 Challenge Type: Open challenge [normal matched controls also tested] Challenge Agent: Gluten powder (food) Challenge Dose: 50 g gluten powder Challenge Route: Oral *Hamilton JR, McNeill, LK. Childhood celiac disease: Response of treated patients to a small uniform daily dose of wheat gluten. J Pediatr 81(5): 885-893, 1972 Challenge Type: Open challenge Challenge Agent: Gluten (food)
1 This describes the type of challenge test that was determined to be performed in the study from the information available in the reference. Additional information on the study characteristics or design are sometimes noted in the [] that follows. 2 This describes the type of gluten-related agent administered to subject(s) in the challenge study. The type of vehicle in which the challenge agent is administered is noted in the () that follows. 3 This describes the dosage of the challenge agent administered in the study. 4 This describes the type of route of administration of the challenge agent employed in the study. 5 This denotes information on or the location of conversion factors used to express the dosage(s) of exposure of the gluten-related agent administered in the study as dosage of gluten exposure. 6 This study characteristic item notes additional information about the study that may be relevant and/or significant to its evaluation and assessment. 7 The study subjects in the experimental CD and control groups consisted of both children and adults (up to 24 years old). Specific, detailed age data for each individual subject were not available, so age group differences could not be distinguished. The mean age for both the CD (12.3 years, range: 7 - 21 years) and control subjects (13.8 years, range: 5 - 24 years) fell within and thus, was considered under the “children” category grouping.

Morphological/Physiological Adverse Effects, Acute exposure, continued
Challenge Dose: 2.25 g gluten/day Challenge Route: Oral Other Information: Most sensitive CD subjects likely not challenged Jansson UHG, Gudjonsdottir AH, Ryd W, Kristiansson B. Two different doses of gluten show a dose-dependent response of enteropathy but not of serological markers during gluten challenge in children with coeliac disease. Acta Paediatr 90: 255-259, 2001a Challenge Type: Open challenge [2 doses; randomized dose grouping] Challenge Agent: Gluten powder (food) Challenge Dose: 0.2 g gluten/kg bw/day (or 2.6 g gluten/day) or 0.5 g gluten/kg bw/day (or 6.5 g gluten/day) Challenge Route: Oral Conversion factor: 1-3 years children body weight (bw)= 13 kg8 Other Information: Blind biopsy; Most sensitive CD subjects likely not evaluated Kumar PJ, O’Donoghue DP, Stenson K, Dawson AM. Reintroduction of gluten in adults and children with treated celiac disease. Gut 20: 743-749, 1979 Challenge Type: Open challenge Challenge Agent: Gluten (food) Challenge Dose: >10 g gluten/day Challenge Route: Oral *Mayer M, Greco L, Troncone R, Grimaldi M, Pansa G. Early prediction of relapse during gluten challenge in childhood celiac disease. J Pediatr Gastroenterol Nutr 8: 474-479, 1989 Challenge Type: Open challenge [at least to adult administering to child] Challenge Agent: Gluten (food or drink) Challenge Dose: 10 g gluten/day Challenge Route: Oral Other Information: Blind biopsy; Most sensitive CD subjects likely not challenged Rolles CJ, Anderson CM, McNeish AS. Confirming persistence of gluten intolerance in children diagnosed as having coeliac disease in infancy: Usefulness of one-hour blood xylose test. Arch Dis Child 50: 259-263, 1975 Challenge Type: Open challenge [normal control subject also tested] Challenge Agent: Gluten Challenge Dose: 20 g gluten/day Challenge Route: Oral Shiner M. Ultrastructural changes suggestive of immune reactions in the jejunal mucosa of celiac children following gluten challenge. Gut 14: 1-12, 1973 Challenge Type: Open challenge [3 doses administered; non-CD control subjects also tested] Challenge Agent: Gluten (water or solution) Challenge Dose: 7, 10 or 20 g gluten Challenge Route: Oral or intraduodenal Shiner M, Ballard J. Antigen-antibody reactions in jejunal mucosa in childhood celiac disease after gluten challenge. Lancet 1: 1202-1205, 1972
8 Body weight estimates derived from Table of “Recommended Daily Allowances,” Food and Nutrition Board, National Academy of Sciences, National Research Council, 1989. Also Table of “Reference Heights and Weights for Children and Adults in the United States,” Dietary Reference Intakes, A Report of the Panel of Micronutrients, Food and Nutrition Board, Institute of Medicine, National Academy Press, Washington , DC, 2001
A-2

Morphological/Physiological Adverse Effects, Acute exposure, continued
Challenge Type: Open challenge [normal control subject also tested] Challenge Agent: Gluten (water) Challenge Dose: 20 g gluten Challenge Route: Oral or intraduodenal Townley RRW, Bhathal PS, Cornall HJ, Mithchell JD. Toxicity of wheat gliadin fractions in celiac disease. Lancet 1: 1362- 1364, 1973 Challenge Type: Open, or possibly single-blind, challenge [“other fractions pooled” administered as control] Challenge Agent: Peptic-tryptic-pancreatinic digest of gliadin (or Fraction 9) Challenge Dose: 12 mg gliadin digest/kg bw/day Challenge Route: Oral (probably, as noted performing “feeding tests”) Conversion factors: None available on gliadin digest; also no specific age or body weight information provided Troncone R, Caputo N, Micillo M, Maiuri L, Poggi V. Immunologic and intestinal permeability tests as predictors of relapse during gluten challenge in childhood coeliac disease. Scand J Gastroenterol 29(2): 144-147, 1994 Challenge Type: Open challenge [at least to adult administering to child] Challenge Agent: Gluten (food) Challenge Dose: 10 g gluten/day Challenge Route: Oral Adults Anand BS, Piris J, Jerrome DW, Offord RE, Truelove SC. The timing of histological damage following a single challenge with gluten in treated celiac disease. Quart J Med, New Series L, No 197: 83-94, 1981 Challenge Type: Open challenge [normal, healthy control also tested] Challenge Agent: Fraction B of gluten (solution) Challenge Dose: 40 g fraction B gluten Challenge Route: Intraduodenal infusion Conversion factor: Not available Other Information: Subjects on “strict GFD regime” prior to challenge Bramble MG, Zucoloto S, Wright NA, Record CO. Acute gluten challenge in treated adult celiac disease: a morphometric and enzymatic study. Gut 26: 169-174, 1985 Challenge Type: Open challenge [normal, healthy controls also tested] Challenge Agent: Peptic-tryptic digest of gluten [or gluten fraction 3] (solution) Challenge Dose: 25 g gluten digest Challenge Route: Intraduodenal infusion Conversion factor: Referenced as derived from Frazer et al., 1959 Other Information: Blind biopsy analysis and quantification *Ciclitira PJ, Ellis HJ, Fagg NLK. Evaluation of gluten free product containing wheat gliadin in patients with coeliac disease. Br Med J 289: 83, 1984a Challenge Type: Open challenge Challenge Agent: Gliadin (food) Challenge Dose: 1.2 - 2.4 mg gliadin/day Challenge Route: Oral Conversion factor: 0.2-0.4 mg gliadin per 30g slice made from GF bread mix; 100 mg gliadin = 200 mg gluten Other Information: Blind biopsy; Subject on strict wheat starch-free GFD 1 pre-test week *Ciclitira PJ, Evans DJ, Fagg NLK, Lennox ES, Dowling RH. Clinical testing of gliadin fractions in celiac patients. Clin Sci 66: 357-364, 1984b
A-3

Morphological/Physiological Adverse Effects, Acute exposure, continued
Challenge Test 1: Challenge Type: Open challenge [3 agent doses administered on separate days with 2-3 recovery days between] Challenge Agent: Unfractionated gliadin (solution) Challenge Dose: 10, 600 and 1000 mg gliadin Challenge Route: Intraduodenal infusion Conversion factor: 100 mg gliadin = 200 mg gluten Other Information: Blind biopsy; Subject on strict GFD prior to challenge Challenge Test 2: Challenge Type: Open challenge [4 subfractions administered on separate days at intervals of 3-11 days] Challenge Agent: Gliadin subfractions (solution) Challenge Dose: 1000 mg α, β, γ and ω subfractions of gliadin Challenge Route: Intraduodenal infusion Conversion factor: Not available Other Information: Blind biopsy; One subject on strict GFD prior to challenge *Ciclitira PJ, Hunter JO, Lennox ES. Clinical testing of bread made from nullisomic A wheats in coeliac patients. Lancet 2: 234- 236, 19809 Challenge Type: Open challenge Challenge Agent: Gluten (food) Challenge Dose: <0.83 g or <5.0 g gluten /day Challenge Route: Oral Conversion factor: 30 g standard slice bread = 2.5 g gluten = 1.25 g gliadin Dewar DH, Amato M, Ellis HJ, Pollock EL, Gonzalez-Cinca N, Wieser H, Ciclitira PJ. The toxicity of high molecular weight glutenin subunits of wheat to pateints with coeliac disease. Eur J Gastroenterol Hepatol 18: 483-491, 2006 Challenge Type: Open challenge [compared to positive control (peptic/tryptic digest of gliadin) and to negative control (synthetic casein peptide)] Challenge Agent: Glutenin (solution) Challenge Dose: 500 mg high molecular weight glutenin subunits (HMW-GS) Challenge Route: Intraduodenal infusion Conversion factor: No direct information available; some dosage comparisons of gluten-related agents referenced Other Information: Blind biopsy analysis Dissanayake AS, Jerrome DW, Offord RE, Truelove SC, Whitehead R. Identifying toxic fractions of wheat gluten and their effect on the jejunal mucosa in celiac disease. Gut 15: 931-946, 1974 Challenge Type: Open challenge [inactive fraction A serve to some degree as control] Challenge Agent: Fractions A, B and C of peptic-tryptic digest of gluten (food or drink) Challenge Dose: 5, 10 and 20 g/day fraction A, B or C or 20 – 60 g/day fraction B or 40 g fraction B Challenge Route: Oral Conversion factor: Not available for toxic fractions B and C Frazer AC, Fletcher RF, Ross CAC, Shaw B, Sammons HG, Schneider R. Gluten-induced enteropathy: The effect of partially digested gluten. Lancet 2: 252-255, 1959 Challenge Type: Open challenge Challenge Agent: Peptic-tryptic partial digest of gluten (primarily food; sometimes water) Challenge Dose: 4.3 g unmodified fraction IIIA or ~8.0 g modified fraction IIIA Challenge Route: Oral Conversion factor: Noted in reference
9 As indicated in the results section of the study, Patient A was interpreted as consuming 10 g of bread per day. This “challenge” bread was made with wheat that was thought to contain -gliadin in relative amounts less than in standard wheat. Patient B was interpreted as consuming 60 g of bread per day.
A-4

Morphological/Physiological Adverse Effects, Acute exposure, continued
Other Information: Subjects on “strict GFD regime” prior to challenge Frazer JS, Engel W, Ellis HJ, Moodie SJ, Pollock EL, Wieser H, Ciclitira PJ. Coeliac disease: in vivo toxicity of the putative immunodominant epitope. Gut 52: 1698-1702, 2003 Challenge Type: Probably open challenge but possibly single-blind challenge [3 doses of C1, casein-based peptide as negative
control; 3 doses of G8 administered on separate days with > 2 weeks recovery between] Challenge Agent: G8, -gliadin peptide; peptic-tryptic partial digest of gliadin [as positive control] (solution) Challenge Dose: 20, 50 or 100 mg G8; 1 g peptic-tryptic partial digest of gliadin Challenge Route: Intraduodenal infusion Conversion factor: Some information on dosage comparisons of gluten-related agents referenced Freedman AR, Macartney JC, Nelufer JM, Ciclitira PJ. Timing of infiltration of T lymphocytes induced into the small intestine in coeliac disease. J Clin Pathol 40: 741-745, 1987 Challenge Type: Open challenge [non-CD and untreated controls; water-only challenge negative control] Challenge Agent: Gluten (water) Challenge Dose: 10 g gluten Challenge Route: Oral Hamilton I, Cobden I, Rothwell J, Axon ATR. Intestinal permeability in coeliac disease: the response to gluten withdrawal and single-dose gluten challenge. Gut 23: 202-210, 1982 Challenge Type: Open challenge [normal controls] Challenge Agent: Gluten (drink) Challenge Dose: 30 g gluten/day Challenge Route: Oral Kendall MJ, Schneider R, Cox PS, Hawkins CF. Gluten subfractions in coeliac disease. Lancet 2: 1065-1067, 1972 Challenge Type: Open, or possibly single-blind, challenge [compared to challenges of pre- and post--gliadin bulk fractions] Challenge Agent: -Gliadin (“feeding experiment”) Challenge Dose: 5 g -gliadin Challenge Route: Oral Conversion factor: None found or available Kontakou M, Przemioslo RT, Sturgess RP, Limb GA, Ellis HJ, Day P, Ciclitira PJ. Cytokine mRNA expression in the mucosa of treated celiac patients after wheat peptide challenge Gut 37: 52-57, 1995 Challenge Type: Probably open challenge but possibly single-blind challenge [3 “control” A-gliadin peptide fractions; peptides
administered in random order on separate days with > 1 week recovery between tests] Challenge Agent: Unfractionated gliadin (solution) Challenge Dose: 1 g unfractionated gliadin Challenge Route: Intraduodenal infusion Conversion factor: 100 mg gliadin = 200 mg gluten Other Information: Blind biopsy analysis and quantification Kumar PJ, O’Donoghue DP, Stenson K, Dawson AM. Reintroduction of gluten in adults and children with treated celiac disease. Gut 20: 743-749, 1979 Challenge Type: Open challenge Challenge Agent: Gluten (food) Challenge Dose: >10 g gluten/day Challenge Route: Oral
A-5

Morphological/Physiological Adverse Effects, Acute exposure, continued
Lancaster-Smith M, Kumar PJ, Dawson AM. The cellular infiltrate of the jejunum in adult coeliac disease and dermatitis herpetiformis following the reintroduction of dietary gluten. Gut 16: 683-688, 1975 Challenge Type: Open challenge [results compared to control normal biopsy from non-CD subjects and to
challenged dermatitis herpetiformis (DH) subjects] Challenge Agent: Gluten (food) Challenge Dose: 10-20 g gluten/day or 25 g gluten Challenge Route: Oral *Lavo B, Knutson L, Loof L, Hallgren R. Gliadin-induced jejunal prostaglandin E2 secretion in celiac disease. Gastroenterol 99(3): 703-707, 1990a
Challenge Type: Open challenge [healthy controls also tested] Challenge Agent: Gliadin (solution) Challenge Dose: ~12 mg gliadin Challenge Route: Intrajejunal perfusion Conversion factor: 100 mg gliadin = 200 mg gluten *Lavo B, Knutson L, Loof L, Odlind B, Hallgren R. Signs of increased leakage over the jejunal mucosa during gliadin challenge of patients with celiac disease. Gut 31: 153-157, 1990b10 Challenge Type: Open challenge [normal control subjects also tested] Challenge Agent: Gliadin (solution) Challenge Dose: 15 mg gliadin Challenge Route: Intrajejunal perfusion Conversion factor: 100 mg gliadin = 200 mg gluten Other Information: CD subjects on GFD with differing strictness *Leigh RJ, Marsh MN, Crowe P, Kelly C, Garner V, Gordon D. Studies of intestinal lymphoid tissue IX: Dose-dependent, gluten-induced lymphoid infiltration of coeliac jejunal epithelium. Scand J Gastroenterol 20: 715-719, 198511 Challenge Type: Apparently single-blind food challenge12 [4 agent doses plus control substance administered; normal
control subjects tested] Challenge Agent: Peptic-tryptic digest of gluten [or Frazier’s fraction 3, FF3] Challenge Dose: 100, 500, 1000 or 1500 mg FF3 Challenge Route: Oral Conversion factor: Noted in reference as derived from Frazer et al., 1959 Mantzaris G, Jewell DP. In vivo toxicity of a synthetic dodecapeptide from A gliadin in patients with celiac disease. Scand J Gastroenterol 26: 392-396, 1991 Challenge Type: Open challenge [normal, healthy controls also tested] Challenge Agent: Dodecapeptide of A gliadin (solution)
10 It appears that some but not all of the subjects with CD tested in the previous Lavo et al., 1990a referenced study were the same individuals as challenged in the study noted here in Lavo et al., 1990b. However, different physiological responses to gluten challenge tests were measured in each of these published studies. 11 Because the individual subjects were noted each as giving written consent to participate in the study, it is assumed that the subjects were adults as the specific age of the subjects were not noted. Studies that used children as subjects typically note that written consent for participation was provided by the parents of the subjects. 12 The design of this study involved administration of a number of different dosages of the gluten digest and a dose of a control substance (-lactoglobin) to different groups of experimental and control subjects. In experimental studies designed in this fashion, the experimental subjects typically are not provided information on the exact agents and/or doses that they are administered, meaning the subjects are “blind” with respect to the exact nature of experimental variable(s). Hence, this study was interpreted in this case as apparently being (at least) a “single-blind study” with respect to the subjects’ knowledge of the challenge substance that they encountered, although this type of descriptive terminology per se is not explicitly stated in this reference.
A-6

Morphological/Physiological Adverse Effects, Acute exposure, continued
A-7
Challenge Dose: 100 mg A gliadin peptide Challenge Route: Intraduodenal infusion Conversion factor: Not available Other Information: Subjects on strict GFD prior to challenge Marsh MN, Loft DE, Garner VG, Gordon D. Time/dose responses of celiac mucosae to graded oral challenges with Frazer’s fraction III of gliadin. Eur J Gastroenterol Hepatol 4: 667-673, 1992 Challenge Type: Possibly single-blind challenge [6 agent doses plus control substance administered] Challenge Agent: Peptic-tryptic partial digest of gluten [Frazer’s fraction 3, or FF3] (water) Challenge Dose: 0.1, 0.5, 1.0, 1.5, 3.6 or 12 g FF3 Challenge Route: Oral Conversion factor: Noted in reference Other Information: Quantitative computerized analysis of biopsy Rubin CE, Brandborg LL, Flick AL, Phelps P, Parmentier C, van Niel S. Studies of celiac sprue. III. The effect of repeated wheat instillation into the proximal ileum of patients on a gluten free diet. Gastroenterol 43(6): 621-641, 1962 Challenge Type: Open challenge [normal healthy control subjects also tested] Challenge Agent: High gluten wheat (slurry of) Challenge Dose: 150 g wheat/day (50 g wheat, 3 times/day) Challenge Route: Intragastrointestinal at jejunoileal junction Conversion factor: No information on gluten content of wheat slurry Other Information: Blind biopsy analysis by 6 clinicans; CD subjects on strict GFD Sturgess R, Day P, Ellis HJ, Lundin KEA, Gjertsen HA, Kontakou M, Ciclitira PJ. Wheat peptide challenge in coeliac disease. Lancet 343: 758-761, 1994 Challenge Type: Probably open challenge but possibly single-blind challenge [3 “control” A-gliadin fractionated peptides;
peptides administered in random order on separate days with no testing recovery days included] Challenge Agent: Unfractionated gliadin (solution) Challenge Dose: 1 g unfractionated gliadin Challenge Route: Intraduodenal infusion Conversion factor: 100 mg gliadin = 200 mg gluten Subchronic exposure data sources: Children *Catassi C, Rossini M, Ratsch I-M, Bearzi I, Santinelli A, Castanani R, Pisani E, Coppa GV, Giorgi PL. Dose dependent effects of protracted ingestion of small amounts of gliadin in celiac disease children: a clinical and jejunal morphometric study. Gut 34: 1515-1519, 1993 Challenge Type: Open challenge [Possibly blind to dose level; randomized dose grouping of subjects] Challenge Agent: Gliadin (sugar) Challenge Dose: 100 and 500 mg gliadin/day Challenge Route: Oral Conversion factor: 100 mg gliadin = 200 mg gluten Other Information: Quantitative computerized analysis of biopsy Frazer AC, Fletcher RF, Ross CAC, Shaw B, Sammons HG, Schneider R. Gluten-induced enteropathy: The effect of partially digested gluten. Lancet 2: 252-255, 1959 Challenge Type: Open challenge Challenge Agent: Peptic-tryptic partial digest of gluten (primarily food; sometimes water) Challenge Dose: 8 g/day fraction III or fraction IV & V mixture

Morphological/Physiological Adverse Effects, Subchronic exposure, continued
Challenge Route: Oral Conversion factor: Noted in reference Other Information: Subjects on “strict GFD regime” prior to challenge Hamilton JR, McNeill, LK. Childhood celiac disease: Response of treated patients to a small uniform daily dose of wheat gluten. J Pediatr 81(5): 885-893, 1972 Challenge Type: Open challenge Challenge Agent: Gluten (food) Challenge Dose: 2.25 g gluten/day Challenge Route: Oral Other Information: Most sensitive CD subjects likely not challenged Jansson UHG, Gudjonsdottir AH, Ryd W, Kristiansson B. Two different doses of gluten show a dose-dependent response of enteropathy but not of serological markers during gluten challenge in children with coeliac disease. Acta Paediatr 90: 255-259, 2001a Challenge Type: Open challenge [2 doses; randomized dose grouping] Challenge Agent: Gluten powder (food) Challenge Dose: 0.2 g gluten/kg bw/day (or 2.6 g gluten/day) or 0.5 g gluten/kg bw/day (or 6.5 g gluten/day) Challenge Route: Oral Conversion factor: 1-3 years children body weight = 13 kg13 Other Information: Blind biopsy; Most sensitive CD subjects likely not evaluated Jansson UHG, Kristiansson B, Magnusson P, Larsson L, Albertsson-Wikland K, Bjarnason R. The decrease of IGF-I, IGF-binding protein-3 and bone alkaline phosphatase isoforms during gluten challenge correlates with small intestinal inflammation in children with coeliac disease. Eur J Endocrin 144: 417-423, 2001b Challenge Type: Open challenge [2 doses; randomized dose grouping] Challenge Agent: Gluten (food) Challenge Dose: 0.2 g gluten/kg bw/day (or 2.6 g gluten/day) or 0.5 g gluten/kg bw/day (or 6.5 g gluten/day) Challenge Route: Oral Conversion factor: 1-3 years children body weight = 13 kg14 Other Information: Most sensitive CD subjects likely not evaluated Kumar PJ, O’Donoghue DP, Stenson K, Dawson AM. Reintroduction of gluten in adults and children with treated celiac disease. Gut 20: 743-749, 1979 Challenge Type: Open challenge Challenge Agent: Gluten (food) Challenge Dose: >10 g gluten/day Challenge Route: Oral *Laurin P, Wolving M, Falth-Magnusson K. Even small amounts of gluten cause relapse in children with celiac disease. J Pediatr Gastroenterol Nutr 34: 26-30, 2002 Challenge Type: Open Challenge [at least to adult administering to child] Challenge Agent: Gluten (food) Challenge Dose: 0.7 – 3.7 g gluten/day15
13 See information cited above in footnote 8. 14 See information cited above in footnote 8. 15 The original gluten exposure goal of the study investigators was for the children (n=24) to gradually increase their gluten intake to 10 g daily after about 4 weeks. However, the children couldn’t consume and/or tolerate this suggested level of gluten exposure and instead self-selected the level of gluten intake for themselves. Thus, the study subjects each consumed different levels of gluten ranging from 0.2 to 4.3 g gluten/day and included 18 total different daily levels within this range. The dose range for gluten consumed by the specific subjects (n=10) that
A-8

Morphological/Physiological Adverse Effects, Subchronic exposure, continued
Challenge Route: Oral Other Information: Blind biopsy; Blind blood samples; Blind clinical assessment by MD Mayer M, Greco L, Troncone R, Grimaldi M, Pansa G. Early prediction of relapse during gluten challenge in childhood celiac disease. J Pediatr Gastroenterol Nutr 8: 474-479, 1989 Challenge Type: Open challenge [at least to adult administering to child] Challenge Agent: Gluten (food or drink) Challenge Dose: 10 g gluten/day Challenge Route: Oral Other Information: Blind biopsy; Most sensitive CD subjects likely not challenged Packer SM, Charlton V, Keeling JW, Risdon RA, Oglilvie D, Rowlatt RJ, Larcher VF, Harries JT. Gluten challenge in treated celiac disease. Arch Dis Child 53: 449-455, 1978 Challenge Type: Open challenge Challenge Agent: Gluten (food) Challenge Dose: 10 g gluten/day Challenge Route: Oral Rolles CJ, Anderson CM, McNeish AS. Confirming persistence of gluten intolerance in children diagnosed as having coeliac disease in infancy: Usefulness of one-hour blood xylose test. Arch Dis Child 50: 259-263, 1975 Challenge Type: Open challenge [normal control subject also tested] Challenge Agent: Gluten Challenge Dose: 20 g gluten/day Challenge Route: Oral Rolles CJ, McNeish AS. Standardised approach to gluten challenge in diagnosing childhood celiac disease. Br Med J 1: 1309-1311, 1976 Challenge Type: Open Challenge Challenge Agent: Gluten (food or drink) Challenge Dose: 20 g gluten/day Challenge Route: Oral Other Information: Strict pre-challenge GFD Troncone R, Caputo N, Micillo M, Maiuri L, Poggi V. Immunologic and intestinal permeability tests as predictors of relapse during gluten challenge in childhood coeliac disease. Scand J Gastroenterol 29(2): 144-147, 1994 Challenge Type: Open challenge [at least to adult administering to child] Challenge Agent: Gluten (food) Challenge Dose: 10 g gluten/day Challenge Route: Oral Wauters EAK, Jansen J, Houwen RH, Veenstra J, Ockhuizen T. Serum IgG and IgA antibodies as markers of mucosal damage in children with suspected celiac disease upon gluten challenge. J Pediatr Gastroenterol Nutr 13: 192-196, 1991 Challenge Type: Open Challenge Challenge Agent: Gluten (food or drink) Challenge Dose: 750 mg gluten/kg bw/d to maximum of 20 g gluten/day Challenge Route: Oral Conversion factor: Children body weight for different ages to convert to mg gluten from other sources16
exhibited morphological effects in approximately a subchronic timeframe was 0.7 – 3.7 g gluten/day and consisted of 8 different daily dosage levels. 16 Body weight estimates derived from:
A-9

Morphological/Physiological Adverse Effects, Subchronic exposure, continued
Other Information: Most sensitive CD subjects likely not challenged Young WF, Pringle EM. 110 children with coeliac disease, 1950-1969. Arch Dis Child 46: 421-436, 1971 Challenge Type: Open Challenge Challenge Agent: Gluten powder (food) Challenge Dose: 20 g gluten/day Challenge Route: Oral Adults *Catassi C, Fabiani E, Iacono G, D’Agate C, Francavilla R, Biagi F, Volta U, Accomando S, Picarelli A, De Vitis I, Pianelli G, Gesuita R, Carle F, Mandolesi A, Bearzi I, Fasano A. A prospective, double-blind, placebo-controlled trial to establish a safe gluten threshold for patients with celiac disease. Am J Clin Nutr 85: 160-166, 2007 Challenge Type: Double-blind placebo-control (DBPC) [randomized dose grouping of subjects] Challenge Agent: Gluten (capsule) Challenge Dose: 10 or 50 mg gluten/day Challenge Route: Oral Other Information: Blind biopsy along with computerized image analyzer; Subjects maintained a strict GFD 1
month prior to and during study; Most sensitive CD subjects likely not challenged Catassi C, Fabiani E, Mandolesi A, Bearzi I, Iacono G, D’Agate C, Francavilla R, Corazza GR, Volta U, Accomando S, Picarelli A, De Vitis I, Nardote G, Bardilla MT, Fasano A, Pucci A. The Italian study on gluten microchallenge: preliminary results. Chapter II, Clinical research reports. Proceedings of the 19th Meeting of the Working Group on Prolamin Analysis and Toxicity, edited by Martin Stern, Verlag Wissenschaftliche Scripten, Germany: Zwickau, pp 109-116, 200517 Challenge Type: Double-blind placebo-control (DBPC) [randomized dose grouping of subjects] Challenge Agent: Gluten (capsule) Challenge Dose: 10 or 50 mg gluten/day Challenge Route: Oral Other Information: Most sensitive CD subjects likely not challenged; Subjects maintained a strict GFD 1 month
prior to and during study *Ciclitira PJ, Cerio R, Ellis HJ, Maxton D, Nelufer JM, Macartney JM. Evaluation of gliadin-containing gluten-free product in coeliac patients. Hum Nutr Clin Nutr 39C: 303-308, 1985 Challenge Type: Open challenge [includes GFD “control” periods in same subjects] Challenge Agent: Gliadin (food) Challenge Dose: 1.2 – 2.4 mg gliadin/day Challenge Route: Oral
Table of “Recommended Daily Allowances,” Food and Nutrition Board, National Academy of Sciences, National Research Council, 1989. AlsoTable of “Reference Heights and Weights for Children and Adults in the United States,” Dietary Reference Intakes, A Report of the Panel of Micronutirents, Food and Nutrition Board, Institute of Medicine, National Academy Press, Washington , DC, 2001 Pennington, JA, Wilson DB. Daily intake of nine nutritional elements: analyzed vs. calculated values. J Am Diet Assoc 90(3): 375-381, 1990 17 This study, Catassi et al., 2005, represents the published preliminary results of a larger DBPC food challenge study. The results of the final completed study that included additional subjects were published in Catassi et al., 2007. Hence, some, but not all, of the subjects that participated in each study and that were excluded from each study are the same individuals with CD.
A-10

Morphological/Physiological Adverse Effects, Subchronic exposure, continued
A-11
Conversion factor: 0.2 - 0.4 mg gliadin per 30g slice made from GF bread mix; 100 mg gliadin = 200 mg gluten Kumar PJ, O’Donoghue DP, Stenson K, Dawson AM. Reintroduction of gluten in adults and children with treated celiac disease. Gut 20: 743-749, 1979 Challenge Type: Open challenge Challenge Agent: Gluten (food) Challenge Dose: >10 g gluten/day Challenge Route: Oral Pyle GG, Paaso B, Anderson BE, Allen D, Marti T, Khosla C, Gray GM. Low-dose gluten challenge in celiac sprue: Malabsorptive and antibody responses. Clin Gastroenterol Hepatol 3(7): 679-686, 2005 Challenge Type: Open challenge [randomized dose grouping of subjects] Challenge Agent: Pepsin-trypsin-chymotrypsin-proteolyzed gluten (drink) Challenge Dose: 5 or 10 g partially proteolyzed gluten Challenge Route: Oral Conversion factor: No direct information available Other Information: All subjects asymptomatic on pre-test GFD *Srinivasan U, Leonard N, Jones E, Kasarda DD, Weir DG, O’Farrelly C, Feighery C. Absence of oats toxicity in adult celiac disease. Br Med J 313:1300-1301, 1996 Challenge Type: Open challenge Challenge Agent: Gluten (food) Challenge Dose: 500 mg gluten/day Challenge Route: Oral Wahab PJ, Crusius BA, Meijer JWR, Mulder CJJ. Gluten challenge in borderline gluten-sensitive enteropathy. Am J Gastroenterol 96(5): 1464-1469, 2001 Challenge Type: Open challenge [non-responders serve to some degree as controls] Challenge Agent: Gluten (food) Challenge Dose: >30 to ~44 g gluten/day Challenge Route: Oral Other Information: Two independent reviewers of biopsy; Follow-up GFD biopsy Chronic exposure data sources: Children Hamilton JR, McNeil, LK. Childhood celiac disease: Response of treated patients to a small uniform daily dose of wheat gluten. J Pediatr 81(5): 885-893, 1972 Challenge Type: Open challenge Challenge Agent: Gluten (food) Challenge Dose: 2.25 g gluten/day Challenge Route: Oral Other Information: Most sensitive CD subjects likely not challenged Kumar PJ, O’Donoghue DP, Stenson K, Dawson AM. Reintroduction of gluten in adults and children with treated celiac disease. Gut 20: 743-749, 1979 Challenge Type: Open challenge Challenge Agent: Gluten (food) Challenge Dose: >10 g gluten/day Challenge Route: Ora

Morphological/Physiological Adverse Effects, Chronic exposure, continued
*Laurin P, Wolving M, Falth-Magnusson K. Even small amounts of gluten cause relapse in children with celiac disease. J Pediatr Gastroenterol Nutr 34: 26-30, 2002 Challenge Type: Open challenge [at least to adult administering to child] Challenge Agent: Gluten (food) Challenge Dose: 0.2 – 4.3 g gluten/day18 Challenge Route: Oral Other Information: Blind biopsy; Blind blood samples; Blind clinical assessment by MD Mayer M, Greco L, Troncone R, Grimaldi M, Pansa G. Early prediction of relapse during gluten challenge in childhood celiac disease. J Pediatr Gastroenterol Nutr 8: 474-479, 1989 Challenge Type: Open challenge [at least to adult administering to child] Challenge Agent: Gluten (food or drink) Challenge Dose: 10 g gluten/day Challenge Route: Oral Other Information: Blind biopsy; Most sensitive CD subjects likely not challenged Packer SM, Charlton V, Keeling JW, Risdon RA, Oglilvie D, Rowlatt RJ, Larcher VF, Harries JT. Gluten challenge in treated celiac disease. Arch Dis Child 53: 449-455, 1978 Challenge Type: Open challenge Challenge Agent: Gluten (food) Challenge Dose: 10 g gluten/day Challenge Route: Oral Rolles CJ, McNeish AS. Standardised approach to gluten challenge in diagnosing childhood celiac disease. Br Med J 1: 1309-1311, 1976 Challenge Type: Open challenge Challenge Agent: Gluten (food or drink) Challenge Dose: 20 g gluten/day Challenge Route: Oral Other Information: Strict pre-challenge GFD Troncone R, Caputo N, Micillo M, Maiuri L, Poggi V. Immunologic and intestinal permeability tests as predictors of relapse during gluten challenge in childhood coeliac disease. Scand J Gastroenterol 29(2): 144-147, 1994 Challenge Type: Open challenge [at least to adult administering to child] Challenge Agent: Gluten (food) Challenge Dose: 10 g gluten/day Challenge Route: Oral Young WF, Pringle EM. 110 children with coeliac disease, 1950-1969. Arch Dis Child 46: 421-436, 1971 Challenge Type: Open challenge Challenge Agent: Gluten (food) Challenge Dose: 7.5 to 10.0 g gluten/day or 27.5 g gluten/day Challenge Route: Oral Conversion factor: 1 slice normal bread = 2.5 g gluten
18 See footnote 15 for a complete description of the nature of the administered doses (0.2 – 4.3 g gluten/day) in this study. The dose range for gluten consumed by the specific subjects (n=14) that exhibited morphological effects in approximately a chronic timeframe was 0.2 – 4.3 g gluten/day and consisted of 13 different daily dosage levels.
A-12

Morphological/Physiological Adverse Effects, Chronic exposure, continued
A-13
Adults *Montgomery AMP, Goka AKJ, Kmar PJ, Farthing MJG, Clark ML. Low gluten diet in the treatment of adult celiac disease: effect on jejunal morphology and serum anti-gluten antibodies Gut 29: 1564-1568, 1988 Challenge Type: Open challenge [untreated and GFD-treated CD controls and normal controls] Challenge Agent: Gluten (food) Challenge Dose: 2.5 or 5.0 g gluten/day Challenge Route: Oral

Clinical Adverse Effects Acute exposure data sources: Children *Frazer AC, Fletcher RF, Ross CAC, Shaw B, Sammons HG, Schneider R. Gluten-induced enteropathy: The effect of partially digested gluten. Lancet 2: 252-255, 1959 Challenge Type: Open challenge Challenge Agent: Peptic-tryptic partial digest of gluten (primarily food; sometimes water) Challenge Dose: 8 g fraction III; or 3, 3.7, or 8 g/d fraction IIIA Challenge Route: Oral Conversion factor: Noted in reference Other Information: Subjects on “strict GFD regime” prior to challenge Greco L, D’Adamo G, Truscelli A, Parrilli G, Mayer M, Budillon G. Intestinal permeability after single dose of gluten challenge in celiac disease. Arch Dis Child 66(7): 870-872, 199119 Challenge Type: Open challenge [normal matched controls also tested] Challenge Agent: Gluten powder (food) Challenge Dose: 50 g gluten powder Challenge Route: Oral *Hamilton JR, McNeil, LK. Childhood celiac disease: Response of treated patients to a small uniform daily dose of wheat gluten. J Pediatr 81(5): 885-893, 1972 Challenge Type: Open challenge Challenge Agent: Gluten (food) Challenge Dose: 2.25 g gluten/day Challenge Route: Oral Other Information: Most sensitive CD subjects likely not challenged Jansson UHG, Gudjonsdottir AH, Ryd W, Kristiansson B. Two different doses of gluten show a dose-dependent response of enteropathy but not of serological markers during gluten challenge in children with coeliac disease. Acta Paediatr 90: 255-259, 2001a Challenge Type: Open challenge [2 doses; randomized dose grouping] Challenge Agent: Gluten powder (food) Challenge Dose: 0.2 g gluten/kg bw/day (or 2.6 g gluten/day) or 0.5 g gluten/kg bw/day (or 6.5 g gluten/day) Challenge Route: Oral Conversion factor: 1-3 year old children body weight = 13 kg20 Other Information: Blind biopsy; Most sensitive CD subjects likely not evaluated Jansson UHG, Kristiansson B, Magnusson P, Larsson L, Albertsson-Wikland K, Bjarnason R. The decrease of IGF-I, IGF-binding protein-3 and bone alkaline phosphatase isoforms during gluten challenge correlates with small intestinal inflammation in children with coeliac disease. Eur J Endocrin 144: 417-423, 2001b Challenge Type: Open challenge [2 doses; randomized dose grouping] Challenge Agent: Gluten (food) Challenge Dose: 0.2 g gluten/kg bw/day (or 2.6 g gluten/day) or 0.5 g gluten/kg bw/day (or 6.5 g gluten/day) Challenge Route: Oral
19 See information cited above in footnote 7. 20 See information cited above in footnote 8.
A-14

Clinical Adverse Effects, Acute exposure, continued
Conversion factor: 1-3 years children body weight = 13 kg21 Other Information: Most sensitive CD subjects likely not evaluated Kumar PJ, O’Donoghue DP, Stenson K, Dawson AM. Reintroduction of gluten in adults and children with treated celiac disease. Gut 20: 743-749, 1979 Challenge Type: Open challenge Challenge Agent: Gluten (food) Challenge Dose: >10 g gluten/day Challenge Route: Oral *Laurin P, Wolving M, Falth-Magnusson K. Even small amounts of gluten cause relapse in children with celiac disease. J Pediatr Gastroenterol Nutr 34: 26-30, 2002 Challenge Type: Open challenge [at least to adult administering to child] Challenge Agent: Gluten (food) Challenge Dose: 0.6 – 0.96 g gluten/day22 Challenge Route: Oral Other Information: Blind biopsy; Blind blood samples; Blind clinical assessment by MD *Mayer M, Greco L, Troncone R, Grimaldi M, Pansa G. Early prediction of relapse during gluten challenge in childhood celiac disease. J Pediatr Gastroenterol Nutr 8: 474-479, 1989 Challenge Type: Open challenge [at least to adult administering to child] Challenge Agent: Gluten (Food or drink) Challenge Dose: 10 g gluten/day Challenge Route: Oral Other Information: Blind biopsy; Most sensitive CD subjects likely not challenged Rolles CJ, Anderson CM, McNeish AS. Confirming persistence of gluten intolerance in children diagnosed as having coeliac disease in infancy: Usefulness of one-hour blood xylose test. Arch Dis Child 50: 259-263, 1975 Challenge Type: Open challenge [normal control subject also tested] Challenge Agent: Gluten Challenge Dose: 20 g gluten/day Challenge Route: Oral Shiner M, Ballard J. Antigen-antibody reactions in jejunal mucosa in childhood celiac disease after gluten challenge. Lancet 1: 1202-1205, 1972 Challenge Type: Open challenge [normal control subject also tested] Challenge Agent: Gluten (water) Challenge Dose: 20 g gluten Challenge Route: Oral or intraduodenal
21 See information cited above in footnote 8. 22 See footnote 15 for a complete description of the nature of the administered doses (0.2 – 4.3 g gluten/day) in this study. The dose range for gluten associated with the specific subjects (n=13) that exhibited clinical effects in an acute chronic timeframe was 0.6 - 0.96 g gluten/day and consisted of 4 different daily dosage levels at the time the initial clinical responses occurred. These doses are an estimate of the mg/day of exposure experienced by the subjects at the time that clinical effects were first exhibited because subjects gradually and systematically increased their gluten intake over the first 4 weeks of the study. An adjustment was made to account for the specific day of onset of clinical signs and symptoms for each individual subject.
A-15

Clinical Adverse Effects, Acute exposure, continued
Troncone R, Caputo N, Micillo M, Maiuri L, Poggi V. Immunologic and intestinal permeability tests as predictors of relapse during gluten challenge in childhood coeliac disease. Scand J Gastroenterol 29(2): 144-147, 199423 Challenge Type: Open challenge [at least to adult administering to child] Challenge Agent: Gluten (food) Challenge Dose: 10 g gluten/day Challenge Route: Oral Adults Anand BS, Piris J, Jerrome DW, Offord RE, Truelove SC. The timing of histological damage following a single challenge with gluten in treated celiac disease. Quart J Med, New Series L, No 197: 83-94, 1981 Challenge Type: Open challenge [normal, healthy control also tested] Challenge Agent: Fraction B of gluten (solution) Challenge Dose: 40 g fraction B of gluten Challenge Route: Intraduodenal infusion Conversion factor: Not available Other Information: Subjects on “strict GFD regime” prior to challenge *Chartrand L, Russo PA, Duhaime AG, Seidmain EG. Wheat starch intolerance in patients with celiac disease. J Am Diet Assoc 97(6): 612-618, 1997 Challenge Type: Open challenge Challenge Agent: Gliadin (food) Challenge Dose: 0.75 mg gliadin/day Challenge Route: Oral Conversion factor: 100 mg gliadin = 200 mg gluten *Ciclitira PJ, Cerio R, Ellis HJ, Maxton D, Nelufer JM, Macartney JM. Evaluation of gliadin-containing gluten-free product in coeliac patients. Hum Nutr Clin Nutr 39C: 303-308, 1985 Challenge Type: Open challenge [includes GFD “control” periods in same subjects] Challenge Agent: Gliadin (food) Challenge Dose: 1.2 – 2.4 mg gliadin/day Challenge Route: Oral Conversion factor: 100 mg gliadin = 200 mg gluten *Ciclitira PJ, Evans DJ, Fagg NLK, Lennox ES, Dowling RH. Clinical testing of gliadin fractions in celiac patients. Clin Sci 66: 357-364, 1984b Challenge Type: Open challenge [3 agent doses administered on separate days with 2-3 recovery days between] Challenge Agent: Unfractionated gliadin (solution) Challenge Dose: 10, 600 and 1000 mg gliadin Challenge Route: Intraduodenal infusion Conversion factor: 100 mg gliadin = 200 mg gluten Other Information: Blind biopsy; Subject on strict GFD prior to challenge *Ciclitira PJ, Hunter JO, Lennox ES. Clinical testing of bread made from nullisomic A wheats in coeliac patients. Lancet 2: 234- 236, 198024
23 Specific information about the exact duration of exposure associated with the clinical symptoms noted in the study was not provided, but the possibility of a clinical reaction in an acute timeframe is suggested.
A-16

Clinical Adverse Effects, Acute exposure, continued
Challenge Type: Open challenge Challenge Agent: Gluten (food) Challenge Dose: <0.83 g or <5.0 g gluten /day Challenge Route: Oral Conversion factor: 30g standard slice bread = 2.5 g gluten = 1.25 g gliadin Dissanayake AS, Jerrome DW, Offord RE, Truelove SC, Whitehead R. Identifying toxic fractions of wheat gluten and their effect on the jejunal mucosa in celiac disease. Gut 15: 931-946, 1974 Challenge Type: Open challenge [inactive fraction A serve to some degree as control] Challenge Agent: Fractions A, B and C of peptic-tryptic digest of gluten (food or drink) Challenge Dose: 5, 10 and 20 g/day fraction A, B or C or 20 – 60 g/day fraction B or 40 g fraction B Challenge Route: Oral Conversion factor: Not available for toxic fractions B and C Frazer JS, Engel W, Ellis HJ, Moodie SJ, Pollock EL, Wieser H, Ciclitira PJ. Coeliac disease: in vivo toxicity of the putative immunodominant epitope. Gut 52: 1698-1702, 2003 Challenge Type: Probably open challenge but possibly single-blind challenge [3 doses of C1, casein-based peptide as
negative control; 3 doses of G8 administered on separate days with > 2 weeks recovery between] Challenge Agent: G8, -gliadin peptide; peptic-tryptic partial digest of gliadin [as positive control] (solution) Challenge Dose: 20, 50 or 100 mg G8; 1 g peptic-tryptic partial digest of gliadin Challenge Route: Intraduodenal infusion Conversion factor: Noted in reference Kumar PJ, O’Donoghue DP, Stenson K, Dawson AM. Reintroduction of gluten in adults and children with treated celiac disease. Gut 20: 743-749, 1979 Challenge Type: Open challenge Challenge Agent: Gluten (food) Challenge Dose: >10 g gluten/day Challenge Route: Oral *Lavo B, Knutson L, Loof L, Hallgren R. Gliadin-induced jejunal prostaglandin E2 secretion in celiac disease. Gastroenterol 99(3): 703-707, 1990a Challenge Type: Open challenge [healthy controls also tested] Challenge Agent: Gliadin (solution) Challenge Dose: ~12 mg gliadin Challenge Route: Intrajejunal perfusion Conversion factor: 100 mg gliadin = 200 mg gluten *Lavo B, Knutson L, Loof L, Odlind B, Hallgren R. Signs of increased leakage over the jejunal mucosa during gliadin challenge of patients with celiac disease. Gut 31: 153-157, 1990b25 Challenge Type: Open challenge [normal control subjects also tested] Challenge Agent: Gliadin (solution) Challenge Dose: 15 mg gliadin Challenge Route: Intrajejunal perfusion Conversion factor: 100 mg gliadin = 200 mg gluten Other Information: CD subjects on GFD with differing strictness
24 See information noted in footnote 9. 25 See information cited about in footnote 10.
A-17

Clinical Adverse Effects, Acute exposure, continued
A-18
Pyle GG, Paaso B, Anderson BE, Allen D, Marti T, Khosla C, Gray GM. Low-dose gluten challenge in celiac sprue: Malabsorptive and antibody responses. Clin Gastroenterol Hepatol 3(7): 679-686, 2005 Challenge Type: Open challenge [randomized dose grouping of subjects] Challenge Agent: Pepsin-trypsin-chymotrypsin-proteolyzed gluten (drink) Challenge Dose: 5 or 10 g partially proteolyzed gluten Challenge Route: Oral Conversion factor: No direct information available Other Information: All subjects asymptomatic on pre-test GFD Rubin CE, Brandborg LL, Flick AL, Phelps P, Parmentier C, van Niel S. Studies of celiac sprue. III. The effect of repeated wheat instillation into the proximal ileum of patients on a gluten free diet. Gastroenterol 43(6): 621-641, 1962 Challenge Type: Open challenge [normal healthy control subjects also tested] Challenge Agent: High gluten wheat (slurry of) Challenge Dose: 150 g wheat/day (50 g wheat, 3 times/day) Challenge Route: Intragastrointestinal at jejunoileal junction Conversion factor: No information on gluten content of wheat slurry Other Information: Blind biopsy analysis by 6 clinicans; CD subjects on strict GFD Subchronic exposure data sources: Children *Catassi C, Rossini M, Ratsch I-M, Bearzi I, Santinelli A, Castanani R, Pisani E, Coppa GV, Giorgi PL. Dose dependent effects of protracted ingestion of small amounts of gliadin in celiac disease children: a clinical and jejunal morphometric study. Gut 34: 1515-1519, 1993 Challenge Type: Open challenge [Possibly blind to dose level; randomized dose grouping of subjects] Challenge Agent: Gliadin (sugar) Challenge Dose: 100 and 500 mg gliadin/day Challenge Route: Oral Conversion factor: 100 mg gliadin = 200 mg gluten Other Information: Quantitative computerized analysis of biopsy Frazer AC, Fletcher RF, Ross CAC, Shaw B, Sammons HG, Schneider R. Gluten-induced enteropathy: The effect of partially digested gluten. Lancet 2: 252-255, 1959 Challenge Type: Open challenge Challenge Agent: Peptic-tryptic partial digest of gluten (primarily food; sometimes water) Challenge Dose: 8 g/day fraction III; or 3.7 g/day fraction IIIA Challenge Route: Oral Conversion factor: Noted in reference Other Information: Subjects on “strict GFD regime” prior to challenge *Jansson UHG, Gudjonsdottir AH, Ryd W, Kristiansson B. Two different doses of gluten show a dose-dependent response of enteropathy but not of serological markers during gluten challenge in children with coeliac disease. Acta Paediatr 90: 255-259, 2001a Challenge Type: Open challenge [2 doses; randomized dose grouping of subjects] Challenge Agent: Gluten powder (food)

Clinical Adverse Effects, Subchronic exposure, continued
Challenge Dose: 0.2 g gluten/kg/day (or 2.6 g gluten/day) or 0.5 g gluten/kg/day (or 6.5 g gluten/day) Challenge Route: Oral Conversion factor: 1-3 years children body weight = 13 kg26 Other Information: Blind biopsy; Most sensitive CD subjects likely not evaluated Jansson UHG, Kristiansson B, Magnusson P, Larsson L, Albertsson-Wikland K, Bjarnason R. The decrease of IGF-I, IGF-binding protein-3 and bone alkaline phosphatase isoforms during gluten challenge correlates with small intestinal inflammation in children with coeliac disease. Eur J Endocrin 144: 417-423, 2001b Challenge Type: Open challenge [2 doses; randomized dose grouping] Challenge Agent: Gluten (food) Challenge Dose: 0.2 g gluten/kg/day (or 2.6 g gluten/day) or 0.5 g gluten/kg/day (or 6.5 g gluten/day) Challenge Route: Oral Conversion factor: 1-3 years children body weight = 13 kg27 Other Information: Most sensitive CD subjects likely not evaluated Kumar PJ, O’Donoghue DP, Stenson K, Dawson AM. Reintroduction of gluten in adults and children with treated celiac disease. Gut 20: 743-749, 1979 Challenge Type: Open challenge Challenge Agent: Gluten (food) Challenge Dose: > 10 g gluten/day Challenge Route: Oral *Laurin P, Wolving M, Falth-Magnusson K. Even small amounts of gluten cause relapse in children with celiac disease. J Pediatr Gastroenterol Nutr 34: 26-30, 2002 Challenge Type: Open challenge [at least to adult administering to child] Challenge Agent: Gluten (food) Challenge Dose: 0.2 – 1.8 g gluten/day28 Challenge Route: Oral Other: Blind biopsy; Blind blood samples; Blind clinical assessment by MD Packer SM, Charlton V, Keeling JW, Risdon RA, Oglilvie D, Rowlatt RJ, Larcher VF, Harries JT. Gluten challenge in treated celiac disease. Arch Dis Child 53: 449-455, 1978 Challenge Type: Open challenge Challenge Agent: Gluten (food) Challenge Dose: 10 g gluten/day Challenge Route: Oral Rolles CJ, McNeish AS. Standardised approach to gluten challenge in diagnosing childhood celiac disease. Br Med J 1: 1309-1311, 1976 Challenge Type: Open challenge Challenge Agent: Gluten (food or drink) Challenge Dose: 20 g gluten/day 26 See information cited above in footnote 8. 27 See information cited above in footnote 8. 28 See footnote 15 for a complete description of the nature of the administered doses (0.2 – 4.3 g gluten/day) in this study. The dose range for gluten associated with the specific subjects (n=8) that exhibited clinical effects in a subchronic timeframe was approximately 0.2 – 1.8 g gluten/day and consisted of 7 different daily dosage levels. These doses in some cases are an estimate of the mg/day of exposure experienced by the subjects at the time that clinical effects were first exhibited because subjects gradually and systematically increased their gluten intake over the first 4 weeks of the study. An adjustment was made to account for the specific day of onset of clinical signs and symptoms for each individual subject.
A-19

Clinical Adverse Effects, Subchronic exposure, continued
Challenge Route: Oral Other Information: Strict pre-challenge GFD Troncone R, Caputo N, Micillo M, Maiuri L, Poggi V. Immunologic and intestinal permeability tests as predictors of relapse during gluten challenge in childhood coeliac disease. Scand J Gastroenterol 29(2): 144-147, 199429 Challenge Type: Open challenge [at least to adult administering to child] Challenge Agent: Gluten (food) Challenge Dose: 10 g gluten/day Challenge Route: Oral Wauters EAK, Jansen J, Houwen RH, Veenstra J, Ockhuizen T. Serum IgG and IgA antibodies as markers of mucosal damage in children with suspected celiac disease upon gluten challenge. J Pediatr Gastroenterol Nutr 13: 192-196, 1991 Challenge Type: Open Challenge Challenge Agent: Gluten (food or drink) Challenge Dose: 750 mg gluten/kg/d to maximum of 20 g gluten/day Challenge Route: Oral Conversion factor: Children body weight for different ages to convert to mg gluten from other sources30 Other Information: Most sensitive CD subjects likely not challenged Young WF, Pringle EM. 110 children with coeliac disease, 1950-1969. Arch Dis Child 46: 421-436, 1971 Challenge Type: Open challenge Challenge Agent: Gluten powder (food) Challenge Dose: 20 g gluten/day Challenge Route: Oral Conversion factor: 1 slice normal bread = 2.5 g gluten Adults *Catassi C, Fabiani E, Iacono G, D’Agate C, Francavilla R, Biagi F, Volta U, Accomando S, Picarelli A, De Vitis I, Pianelli G, Gesuita R, Carle F, Mandolesi A, Bearzi I, Fasano A. A prospective, double-blind, placebo-controlled trial to establish a safe gluten threshold for patients with celiac disease. Am J Clin Nutr 85: 160-166, 2007 Challenge Type: Double-blind placebo-control (DBPC) [randomized dose grouping of subjects] Challenge Agent: Gluten (capsule) Challenge Dose: 10 or 50 mg gluten/day Challenge Route: Oral Other Information: Blind biopsy along with computerized image analyzer; Subjects maintained a strict GFD
1 month prior to and during study; Most sensitive CD subjects likely not challenged *Catassi C, Fabiani E, Mandolesi A, Bearzi I, Iacono G, D’Agate C, Francavilla R, Corazza GR, Volta U, Accomando S, Picarelli A, De Vitis I, Nardote G, Bardilla MT, Fasano A, Pucci A. The Italian study on gluten microchallenge: preliminary results. Chapter II, Clinical research reports. Proceedings of the 19th Meeting of the Working
29 Specific information about the exact duration of exposure associated with the clinical symptoms noted in the study was not provided, but the possibility of a clinical reaction in a subchronic timeframe is suggested. 30 See information cited above in footnote 16.
A-20

Clinical Adverse Effects, Subchronic exposure, continued
Group on Prolamin Analysis and Toxicity, edited by Martin Stern, Verlag Wissenschaftliche Scripten, Germany: Zwickau, pp 109-116, 200531 Challenge Type: Double-blind placebo-control (DBPC) [randomized dose grouping of subjects] Challenge Agent: Gluten (capsule) Challenge Dose: 10 or 50 mg gluten/day Challenge Route: Oral Other Information: Blind biopsy along with computerized image analyzer; Subjects maintained a strict GFD
1 month prior to and during study *Chartrand L, Russo PA, Duhaime AG, Seidmain EG. Wheat starch intolerance in patients with celiac disease. J Am Diet Assoc 97(6): 612-618, 1997 Challenge Type: Open challenge Challenge Agent: Gliadin (food) Challenge Dose: 0.75 mg gliadin/day Challenge Route: Oral Conversion factor: 100 mg gliadin = 200 mg gluten *Ciclitira PJ, Cerio R, Ellis HJ, Maxton D, Nelufer JM, Macartney JM. Evaluation of gliadin-containing gluten-free product in coeliac patients. Hum Nutr Clin Nutr 39C: 303-308, 1985 Challenge Type: Open challenge [includes GFD “control” periods in same subjects] Challenge Agent: Gliadin (food) Challenge Dose: 1.2 – 2.4 mg gliadin/day Challenge Route: Oral Conversion factor: 100 mg gliadin = 200 mg gluten Kumar PJ, O’Donoghue DP, Stenson K, Dawson AM. Reintroduction of gluten in adults and children with treated celiac disease. Gut 20: 743-749, 1979 Challenge Type: Open challenge Challenge Agent: Gluten (food) Challenge Dose: >10 g gluten/day Challenge Route: Oral Pyle GG, Paaso B, Anderson BE, Allen D, Marti T, Khosla C, Gray GM. Low-dose gluten challenge in celiac sprue: Malabsorptive and antibody responses. Clin Gastroenterol Hepatol 3(7): 679-686, 2005 Challenge Type: Open challenge [randomized dose grouping of subjects] Challenge Agent: Pepsin-trypsin-chymotrypsin-proteolyzed gluten (drink) Challenge Dose: 5 or 10 g partially proteolyzed gluten Challenge Route: Oral Conversion factor: No direct information available Other Information: All subjects asymptomatic on pre-test GFD Srinivasan U, Leonard N, Jones E, Kasarda DD, Weir DG, O’Farrelly C, Feighery C. Absence of oats toxicity in adult celiac disease. Br Med J 313:1300-1301, 1996 Challenge Type: Open challenge Challenge Agent: Gluten (food) Challenge Dose: 500 mg gluten/day Challenge Route: Oral Other Information: Morphology measures assessed by 2 independent observers or computerized image analysis
31 See footnote 17 for description of nature of this study and the subjects participating in it.
A-21
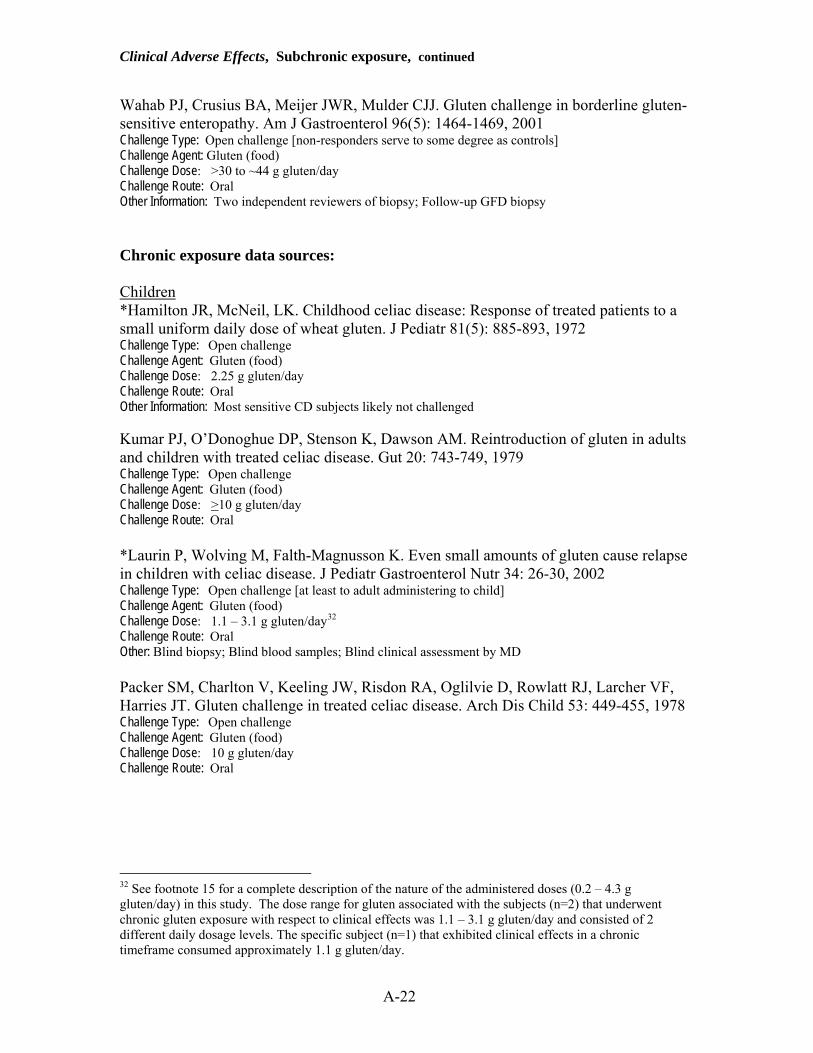
Clinical Adverse Effects, Subchronic exposure, continued
A-22
Wahab PJ, Crusius BA, Meijer JWR, Mulder CJJ. Gluten challenge in borderline gluten-sensitive enteropathy. Am J Gastroenterol 96(5): 1464-1469, 2001 Challenge Type: Open challenge [non-responders serve to some degree as controls] Challenge Agent: Gluten (food) Challenge Dose: >30 to ~44 g gluten/day Challenge Route: Oral Other Information: Two independent reviewers of biopsy; Follow-up GFD biopsy Chronic exposure data sources: Children *Hamilton JR, McNeil, LK. Childhood celiac disease: Response of treated patients to a small uniform daily dose of wheat gluten. J Pediatr 81(5): 885-893, 1972 Challenge Type: Open challenge Challenge Agent: Gluten (food) Challenge Dose: 2.25 g gluten/day Challenge Route: Oral Other Information: Most sensitive CD subjects likely not challenged Kumar PJ, O’Donoghue DP, Stenson K, Dawson AM. Reintroduction of gluten in adults and children with treated celiac disease. Gut 20: 743-749, 1979 Challenge Type: Open challenge Challenge Agent: Gluten (food) Challenge Dose: >10 g gluten/day Challenge Route: Oral *Laurin P, Wolving M, Falth-Magnusson K. Even small amounts of gluten cause relapse in children with celiac disease. J Pediatr Gastroenterol Nutr 34: 26-30, 2002 Challenge Type: Open challenge [at least to adult administering to child] Challenge Agent: Gluten (food) Challenge Dose: 1.1 – 3.1 g gluten/day32 Challenge Route: Oral Other: Blind biopsy; Blind blood samples; Blind clinical assessment by MD Packer SM, Charlton V, Keeling JW, Risdon RA, Oglilvie D, Rowlatt RJ, Larcher VF, Harries JT. Gluten challenge in treated celiac disease. Arch Dis Child 53: 449-455, 1978 Challenge Type: Open challenge Challenge Agent: Gluten (food) Challenge Dose: 10 g gluten/day Challenge Route: Oral
32 See footnote 15 for a complete description of the nature of the administered doses (0.2 – 4.3 g gluten/day) in this study. The dose range for gluten associated with the subjects (n=2) that underwent chronic gluten exposure with respect to clinical effects was 1.1 – 3.1 g gluten/day and consisted of 2 different daily dosage levels. The specific subject (n=1) that exhibited clinical effects in a chronic timeframe consumed approximately 1.1 g gluten/day.

Clinical Adverse Effects, Chronic exposure, continued
Troncone R, Caputo N, Micillo M, Maiuri L, Poggi V. Immunologic and intestinal permeability tests as predictors of relapse during gluten challenge in childhood coeliac disease. Scand J Gastroenterol 29(2): 144-147, 199433 Challenge Type: Open challenge [at least to adult administering to child] Challenge Agent: Gluten (food) Challenge Dose: 10 g gluten/day Challenge Route: Oral Young WF, Pringle EM. 110 children with coeliac disease, 1950-1969. Arch Dis Child 46: 421-436, 1971 Challenge Type: Open challenge Challenge Agent: Gluten (food) Challenge Dose: 7.5 - 10 g gluten/day or 27.5 g gluten/day Challenge Route: Oral Conversion factor: 1 slice normal bread = 2.5 g gluten Adults *Chartrand L, Russo PA, Duhaime AG, Seidmain EG. Wheat starch intolerance in patients with celiac disease. J Am Diet Assoc 97(6): 612-618, 1997 Challenge Type: Open challenge Challenge Agent: Gliadin (food) Challenge Dose: 0.75 mg gliadin/day Challenge Route: Oral Conversion factor: 100 mg gliadin = 200 mg gluten
33 Specific information about the exact duration of exposure associated with the clinical symptoms noted in the study was not provided, but the possibility of a clinical reaction in a chronic timeframe is suggested.
A-23

B-1
Health Hazard Assessment for Gluten Exposure in Individuals with Celiac Disease
This appendix presents detailed information in Tables 1-3 and 5-7 from the studies listed in Appendix A that were identified as having relevant low-dose gluten exposure data. The data summarized from these studies were examined with regard to the duration of exposure, the age of subjects and the type of adverse response exhibited. Estimates for tolerable daily intakes levels for gluten are included in Tables 4 and 8 in this appendix. Estimates for levels of concern for gluten and related compounds in food are presented in Tables 10-11. (See the main text of assessment for Table 9)
Appendix B: Tables 1 - 8 and 10 - 11

Type of Effect2 NOAEL3 LOAEL4
Exposure
Duration5 Ss Tested6
No. Ss (Rx) Type of Adverse Effects7 Reference
Any adverse effect 2,250 mg/d 6 days 13 Ss (1)a) 1 Ss of 13 Ss "developed mucosal lesion" @ day 7; b) dec mucosal disaccharidase activity @ day 6
Hamilton and McNeil, 19729
Any adverse effect 6,250 mg 1 time 1 Ss a) inc fecal fat Frazer et al., 1959
Adverse effect plus VA 10,000 mg/d 14 days 30 Ss (3)
a) dec mean intestinal sugar absorption; b) inc mean serum gliadin IgA and IgG antibodies; c) predominately subtotal VA
Mayer et al., 19899
Any adverse effect 125 mg 625 mg 1 time 5 Ss each
LOAEL Ss: a) inc mean IEL @ 12 hr vs. T0 ; b) inc mean IEL vs. control substance, and vs. healthy control Ss; c) =dose-dependent inc (4 doses given)
Leigh et al., 1985
Any adverse effect ~24 mg 1 time, ~1 hr 10 Ss11
a) inc mean jejunal PGE2 secretion rate in CD Ss vs. normal control Ss; b) inc PGE2 @ 20 -100 min vs. T0; c) response similar in active vs. inactive CD Ss
Lavo et al., 1990a8b, 13
Any adverse effect 30 mg 1 time, 20 min 7 Ss12
a) inc mean jejunal appearance rates beta2-microglobulin, albumin, hyaluronan; b) maximal appearance rates of substances at 40-120 min; c) no inc these substances in jejunum of normal controls
Lavo et al., 1990b8b, 13
Any adverse effect 20 mg 1200 mg 1 time, 2-6 hr10 1 Ss (1)
LOAEL Ss: a) inc IEL @ ~8 -10 hr vs. T0 ; b) dec Vh/Cd + E-SCH @ ~ 8 - 10 hr vs. T0; c) broad villi + mucosal ridges of moderate height
Ciclitira et al., 1984b8a, 9
Adverse effect plus VA <830 mg/d 5 days 1 Ss (1)
a) inc IEL + fecal fat @ 24 hr vs. T0 ; b) dec Vh/Cd + E-SCH @ 24 hr vs. T0 ; c) subtotal VA @ 24 hr; d) continued "jejunal-biopsy abnormality" @ day 5
Ciclitira et al., 1980
Adverse effect plus VA 2.4 - 4.8 mg/d 7 days 7 Ssa) dec mean Vh/Cd ratio vs.T0; b) ~2 Ss change in mucosa morphological appearance to "broad villi +/or ridges"
Ciclitira et al., 1984a
CH
ILD
RE
N
Page B-2
Table 1: Acute low-dose oral1 gluten exposure data for morphological and/or physiological adverse effects in celiac disease
1 The route of administration of gluten for each study was by oral ingestion unless otherwise noted. The data from studies that administered gluten (or related derivatives) intraduodenally or intrajejunally were also examined to obtain additional dose-response information. The use of the latter routes of administration in a study is indicated separately.
2 The information in this column describes the type of morphological and/or physiological adverse effect found in a study distinguishing whether villous atrophy (VA) is included in the results observed. “Any adverse effect” denotes that the adverse effect results were based on morphological and/or physiological effects without the presence of VA or information on it. “Any adverse effect plus VA” denotes that the resulting morphological and/or physiological effects included the presence of some degree of VA in the morphological changes seen or that can be clearly interpreted as such by the morphological descriptions provided in the study.
3 “NOAEL” represents the no observable adverse effect level expressed as mg gluten. Additonal information on the nature of the challenge substance (e.g., gluten derivative) administered for each specific study is located in Appendix A.
AD
ULT
S

9 The most sensitive Ss with celiac disease likely not tested in this study.
5 The information in this column represents the duration of time an oral (or possibly intraduodenal or intrajejunal) dosage of gluten or a related derivative was administered in each study. Abbreviations are as follows: hr=hour(s), min=minute(s)
6 This ”Ss Tested” column provides information on the subjects (Ss) with celiac disease (CD) tested at the NOAEL and/or LOAEL dose of each study. “No. Ss” represents the number of subjects with CD challenged at these adverse effect level dose(s). It is not necessarily the number of Ss tested in the study per se. The value found in the parentheses that follows, i.e. (Rx), represents the number of CD subjects that exhibited an adverse reaction(s) at the LOAEL if data for individual Ss was available in the study. The notation of "Ss each" means the number of CD subjects that were tested at each dose level, i.e., the NOAEL and LOAEL doses for the study.
8 The gluten derivative was administered in this study via (a) intraduodenal infusion, or (b) intrajejunal perfusion.
Table 1, continued
10 Three dosages of unfractionated gliadin (10 mg, 600 mg and 1000 mg) were each administered intraduodenally over a duration of 2 or 6 hours and mucosal samples were taken at 30-60 minute intervals for a period up to 6-8 hours. Each dose was administered one time on separate days with 48-72 hours between test dose challenges.
4 “LOAEL” represents the lowest observable adverse effect level expressed as mg gluten. Additonal information on the nature of the challenge substance (e.g., gluten derivative) administered for each specific study is located in Appendix A.
7 Information in this column describes the adverse effects observed at the LOAEL. The morphological effects noted refer to those associated with the small intestine, particularly its mucosa. When challenge-induced changes in test measures were compared to values found at baseline levels, it was denoted as “vs. T 0.” The time during the study that the measure was taken, i.e., “@ hr, day etc.,” may also be noted. When the challenge-induced changes noted represented a “mean” (or average) or “median” value of the results for a study Ss group, they were referred to as such. Descriptive phrases expressed in quotations are noted in the table as they are presented in the reference. Other abbreviations found in this column follow: inc=increase; dec=decrease; CD=celiac disease; IEL=intraepithelial lymphocyte cell count; Vh=villous height; Cd=crypt depth; E-SCH=epithelial surface-cell height; IgA=immunoglobulin A; IgG=immunoglobin G; vs. T 0= versus time zero or baseline value; PGE2= prostaglandin E2.
11 In this study, 2 Ss of the 10 challenged subjects were on a normal diet instead of a GFD prior to the challenge test. Because the results of the physiological measures in the study were expressed as group mean values with no discernible information on individual Ss available, the findings of these 2 Ss in this case were considered together with the 8 Ss on a pre-test GFD.
12 In this study, 1 Ss of the 7 challenged subjects were on a normal diet instead of a GFD prior to the challenge test. Because the results of the physiological measures in the study were expressed as group mean values with no discernible information on individual Ss available, the findings of the1 Ss in this case were considered together with the 6 Ss on a pre-test GFD.
13 It appears that some but not all of the Ss with CD tested in each of these studies by Lavo and colleagues were the same individuals. However, different physiological responses to gluten challenge tests were measured in each of these published studies.
B-3

Table 2: Subchronic low-dose oral1 gluten exposure data for morphological and/or physiological adverse effects in celiac disease
Type of Effect2 NOAEL3 LOAEL4
Exposure
Duration5 Ss Tested6
No. Ss (Rx) Type of Adverse Effects7 Reference
Any adverse effect 200 mg/d 4 weeks 10 Ss
a) inc IEL vs. T0 @ 200mg (dose-dependent effect); b)
dec Vh/Cd ratio vs. T0 @ 200 mg (dose-dependent
effect); c) ns trends in: Vh, Cd, intestinal permeability, AGA-IgA; d) discrimination analysis supports above changes
Catassi et al, 1993
Any adverse effect 700 mg/d 9 weeks 1 Ss
a) 1 Ss @ LOAEL of 10 Ss subchronic exposure; b) inc IEL vs. T0; c) morphology from "pre-infiltrative" @ T0 to
"hyperplastic" @ week 9; d) symptom start @ < day 1: V
Laurin et al., 2002
800 mg/d 5 weeks 1 Ss
a) 1 Ss of 10 Ss subchronic exposure; b) inc AGA-IgA @ week 5; c) no change IEL vs. T0; d) morphology
"infiltrative" @ T0 and week 5; e) symptom start @ day 4:
AP
1000 - 1200 mg/d10 5 - 11 weeks11 4 Ss
a) 4 Ss of 10 Ss subchronic exposure; b) inc IEL vs. T0; c)
morphology from "pre-infiltrative (n=2)" or "infiltrative (n=2)" @ T0 to "hyperplastic (n=3)" or "destructive (n=1)"
@ week 5 - 11; e) symptoms start @ day 0 to day 79: AP, D, ADT
Any adverse effect 2.4 - 4.8 mg/d 6 weeks 10 Ss NOAEL: a) no change in mean @ 6 weeks vs. T0: IEL,
Vh/Cd ratio, E-SCH, intestinal permeability
Ciclitira et al., 1985
Any adverse effect 10 mg/d 50 mg/d 12 weeks 13 Ss each
50 mg LOAEL: medians values a) dec Vh/Cd index vs.T0;
b) dec %Ss improve Vh/Cd vs. PC; c) dec % change Vh/Cd vs.T0; d) inc %Ss IEL vs. T0; e) ns trends: % inc
IEL vs. T0, % dec Vh vs.T0; worst M-O grading score vs.
T0 and vs. PC
Catassi et al., 20078,9
Adverse effect plus VA 500 mg/d 6 weeks 2 Ss (2)
a) 2 Ss "developed histological evidence of relapse"; b) 1 or 2 Ss "lymphocyte infiltration of surface epithelium"; c) 1 Ss "positive antibody tests" (gliadin, endomysium)
Srinivasan et al., 1996
AD
UL
TS
1 See footnote 1 in Table 1.
2 See footnote 2 in Table 1.
3 “NOAEL” represents the no observable adverse effect level expressed as mg gluten per day within a study. Additonal information on the nature of the challenge substance (e.g., gluten derivative) administered for each specific study is located in Appendix A.
B-4
CH
ILD
RE
N

8 Gluten was administered in this study via a capsule.
Table 2, continued
4 “LOAEL” represents the lowest observable adverse effect level expressed as mg gluten per day within a study. Additonal information on the nature of the challenge substance (e.g., gluten derivative) administered for each specific study is located in Appendix A.
B-5
10 This range of dosages includes the 3 dose levels, 1000 mg/d (n=2 Ss), 1100 mg/d (n=1 Ss) and 1200 mg/d (n=1 Ss), consumed by 4 of the 10 CD Ss that underwent a subchronic exposure to gluten.
11 This represents a range of durations of exposure for 4 CD Ss that were exposed to the dose of gluten noted in this row and in footnote 10. One Ss each underwent subchronic exposure of the following durations: 5 weeks, 6 weeks, 7 weeks and 11 weeks.
5 The information in this column represents the duration of time that an oral dosage of gluten or a related derivative was administered in each study.
6 See footnote 6 in Table 1.
9 The most sensitive Ss with celiac disease likely not tested in this study.
7 See footnote 7 in Table 1. Additional abbreviations also found in this column follow: ns=non-significant; AGA-IgA= anti-gliadin antibodies; %= percent; M-O= Marsh-Oberhuber; vs. PC = versus placebo control.

Type of Effect2 NOAEL3 LOAEL4
Exposure
Duration5 Ss Tested6
No. Ss (Rx) Type of Adverse Effects7 Reference
Any adverse effect 200 mg/d 39 weeks 1 Ss (1)
a) 1 Ss @ LOAEL of 14 Ss chronic exposure; b) inc IEL vs. T0; c) inc antibodies @ week 4; d) morphology
"infiltrative" @ T0 and week 39; e) symptoms start @ day
29 : V
Laurin et al., 2002
700 mg/d 13-16 weeks 2 Ss (2)
a) 2 Ss @ 700 mg of 14 Ss chronic exposure; b) inc IEL vs. T0; c) morphology "infiltrative" @ T0 vs. "hyperplastic"
@ week 13 or 16; d) inc antibodies @ week 4 or 8; e) symptoms start @ day 4 or 9: I or AP, respectively
1100 - 1400 mg/d8 15-21 weeks9 3 Ss (3)10
a) 3 Ss of 14 Ss chronic exposure; b) inc IEL @ week 18 or 21 vs. T0; c) morphology "infiltrative (n=2)" @ T0 vs.
"hyperplastic (n=2)" @ week 18 or 21; d) inc AGA-IgA @ week 8 (n=2); e) symptoms start @ day 7 to day 105: AP, D, C, I
AD
UL
TS
Any adverse effect 2,500 or 5,000 mg/d 3-14 mos 13 Ss
a) inc median IEL vs. GFD CD controls + vs. normal unrestricted controls; b) dec trend median VH vs. normal unrestricted controls; c) inc median Cd vs. normal unrestricted controls
Montgomery et al., 1988
B-6
6 See footnote 6 in Table 1.
7 See footnote 7 in Table 1. Additional abbreviations also found in this column follow: V= vomiting; I= irritable; AP= abdominal pain; GFD= gluten-free diet.
4 “LOAEL” represents the lowest observable adverse effect level expressed as mg gluten per day within a study. Additonal information on the nature of the challenge substance (e.g., gluten derivative) administered for each specific study is located in Appendix A.
5 The information in this column represents the duration of time that an oral dosage of gluten or a related derivative was administered in each study.
Table 3: Chronic low-dose oral1 gluten exposure data for morphological and/or physiological adverse effects in celiac disease
1 See footnote 1 in Table 1.
2 See footnote 2 in Table 1.
3 “NOAEL” represents the no observable adverse effect level expressed as mg gluten per day within a study. Additonal information on the nature of the challenge substance (e.g., gluten derivative) administered for each specific study is located in Appendix A.
CH
ILD
RE
N
9 This represents a range of durations of exposure for 3 CD Ss that were exposed to the dose of gluten noted in this row and in footnote 8. One Ss each underwent subchronic exposure of the following durations: 15 weeks, 18 weeks and 21 weeks.
10 For 1 Ss each, the post-challenge evaluation of IEL counts and associated biopsy descriptive category, and of antibody measures were not available. Thus, only information for 2 different Ss were available for these assessed measures.
8 This range of dosages includes the 3 dose levels, 1100 mg/d (n=1 Ss), 1200 mg/d (n=1), 1400 mg/d (n=1), consumed by 3 of 10 Ss that underwent a chronic exposure to gluten.

Exposure Type1 NOAEL2 LOAEL3 UF4TDI
Acute 125 mg/d5 10 12.5 mg/d
Subchronic 4 mg/d 10 0.4 mg/d
Chronic 700 mg/d 100 7.0 mg/d
B-7
5 The value is based on critical study with an acute exposure duration of < 24 hrs. In expressing the acute TDI as mg/day based on this finding, it is assumed that the adverse effects would be associated with comparable daily gluten exposure for an acute duration. The findings from the other acute studies noted in the text of the hazard assessment and in Table 1 of this appendix support this notion.
4 Uncertainty factor (UF) employed in determining the TDI. A single 10-fold factor represents an UF for inter-individual differences. A 100-fold (10 x 10) factor represents an UF of 10 for inter-individual differences and UF of 10 for extrapolation from a LOAEL to a NOAEL value.
Table 4: Estimates of tolerable daily intake (TDI) levels for gluten for morphological effects for acute, subchronic and chronic oral exposure in celiac disease
1 See text of the main health hazard assessment document for definition of each of these types of exposure.
2 “NOAEL” represents the no observable adverse effect level expressed as mg gluten per day.
3 “LOAEL” represents the lowest observable adverse effect level expressed as mg gluten per day.

Table 5: Acute low-dose oral1 gluten exposure data for clinical adverse effects in celiac disease
NOAEL2 LOAEL3
Exposure
Duration4 Ss Tested5
No. Ss (Rx) Type of Clinical Adverse Effects 6 Other Information7 Reference
600 mg/d10 0 - 10 days 10 Ss
a) 10 Ss @ LOAEL of 13 Ss acute exposure; b) symptoms @ LOAEL: V, AP, I, D
LOAEL Ss, 5 - 21 weeks later: inc IEL, morphology "hyperplastic (n=6)", "destructive (n=2)", or "infiltative" or NA (n=1 each)" vs. T 0
"pre-infiltrative (n=3)" or "infiltative (n=7)", inc antibodies @ week 4
Laurin et al., 2002
700 - 750 mg/d10 8 - 9 days 2 Ssa) 2 Ss of 13 Ss acute exposure; b) symptoms @ day 8 or 9: D, AP
2 Ss, 16 or 21 weeks exposure: inc IEL, morphology "hyperplastic" vs. T0 "infiltrative", inc antibodies @ week 4
960 mg/d10 10 days 1 Ssa) 1 Ss of 13 Ss acute exposure; b) symptoms @ day 10: AP
1 Ss, 8 weeks exposure: inc IEL, morphology "hyperplastic" vs. T 0
"infiltrative", inc antibodies @ week 4
<1000 mg/d 1 day 2-4 Ss (2)a) "acute reaction" within 12 hr; b) [symptoms @ 10 g: V, D, PR ]
re-test of Ss @ <1000 mg after 1 yr earlier Ss had severe reaction at 10 g dose
Mayer et al., 19899
2250 mg/d 2 weeks 12 Ss (1)a) symptom @ 2 weeks: D 12 Ss of group started with "normal mucosa"; 1 Ss @ LOAEL
"mucosal lesion" @ ~1 monthHamilton and McNeil, 19729
2250 mg/d 6 days 10 Ss (1)a) symptom @ 4 days: D 10 Ss of group started with "abnormal mucosa"
3750-4630 mg/d 2 - 12 days 1 Ssa) symptoms: I, M, AN, WL 1 day prior to LOAEL dose: Ss given 10 g resulted in V at 2 hr vs.
T0Frazer et al., 1959
1200 mg 2000 mg 1 time, 2-6 hr11 1 Ss a) LOAEL symptoms @ 6 hr : ADC, V, stopped challenge
LOAEL Ss : morphological abnormalities and deterioration @ hr 2-6
Ciclitira et al., 1984b 8a, 9
1.5 mg/d < 2 weeks 17 Ss (2)
a) symptoms @ < 2 weeks: F/I, AP; b) LOAEL Ss stopped study with onset of symptoms; c) symptoms resolved after stopped challenge; d) symptoms "consistent for each individual Ss" over time
17 Ss tested had no prior exposure to products containing wheat starch; no symptoms seen in 14 challenged "wheat starch clinically tolerant" control CD Ss; no changes in AGA-IgA, AGA-IgG, EmA to challenge in LOAEL or control CD Ss; no morphological measures taken
Chartrand et al., 1997
2.4 - 4.8 mg/d 2 weeks 10 Ss (6)
a) mean of 10 Ss @ week 1 and 2: >symptom composite score vs. control period; b) 6 of 10 Ss inc 2-week mean symptom composite score vs. control period
"symptom composite score" assesses clinical symptoms and severity; no change in mean IEL, Vh/Cd ratio, E-SCH, intestinal permeability @ 6 weeks
Ciclitira et al., 1985
~24 mg 1 time, ~1 hr 10 Ss (5)12
a) symptoms @ 40-100 min: AP, ADT, N; b) symptoms seen in 3 CD Ss with pre-challenge partial VA and 2 CD Ss with pre-challenge normal villous architecture
no symptoms to challenge in normal control Ss (n=5); inc mean jejunal PGE2 secretion rate in 10 challenged CD Ss vs. normal
control Ss; CD Ss with symptoms: time dependency between peak PGE2 level and onset of symptoms; greater absolute inc mean
jejunal PGE2 secretion vs. CD Ss with no symptoms
Lavo et al., 1990a8b, 14
30 mg 1 time, 20 min 7 Ss (2)13
a) 1 Ss reported "burning pain" same as experienced in past after "accidental gluten ingestion"; b) 1 Ss reported N
no symptoms to challenge in normal control Ss (n=3); inc mean jejunal appearance rates beta2-microglobulin, albumin, hyaluronan
over 60-120 min post-challenge
Lavo et al., 1990b8b, 14
<830 mg/d 5 days 1 Ss
a) symptoms @ 1.5 hrs: V, D, AP, F; b) symptoms @ 5 days: "severe symptoms", lead to stopped challenge
LOAEL Ss @ 24 hr vs. T0: inc IEL, inc fecal fat, dec E-SCH, dec
Vh/Cd ratio, subtotal VA; LOAEL Ss @ day 5: continued jejunum mucosal "abnormality"
Ciclitira et al., 1980
<5000 mg/d 1 week 1 Ss a) symptoms @ 1 week: D, F, ADC, BS LOAEL Ss @ 1 week vs. T0: partial VA, inc IEL, dec VH/Cd ratio,
dec E-SCH, inc fecal fat
CH
ILD
RE
NA
DU
LT
S
1 The route of administration of gluten for each study was by oral ingestion unless otherwise noted. The data from studies that administered gluten (or related derivatives) intraduodenally or intrajejunally were also examined to obtain additional dose-response information. The use of the latter routes of administration in a study is indicated separately.
2 “NOAEL” represents the no observable adverse effect level expressed as mg gluten. Additonal information on the nature of the challenge substance (e.g., gluten derivative) administered for each specific study is located in Appendix A.
Page B-8

B-9
Table 5, conitnued
14 It appears that some but not all of the Ss with CD tested in each of these studies by Lavo and colleagues were the same individuals. However, different physiological responses to gluten challenge tests were measured in each of these published studies.
12 In this study, 2 Ss of the 10 challenged subjects were on a normal diet instead of a GFD prior to the challenge test. Because the results of the physiological measures in the study were expressed as group mean values with no discernible information available for these measures on individual Ss, the findings of these 2 Ss in this case were considered together with the 8 Ss on a pre-test GFD. However, of the 5 Ss that exhibited adverse clinical symptoms in response to the gluten challenge, all of them were on a pre-test GFD.
13 In this study, 1 Ss of the 7 challenged subjects were on a normal diet instead of a GFD prior to the challenge test. Because the results of the physiological measures in the study were expressed as group mean values with no discernible information on individual Ss available, the findings of the1 Ss in this case were considered together with the 6 Ss on a pre-test GFD.
10 This is an estimate of the mg/day of exposure experienced by the Ss at the time that clinical effects were exhibited because Ss gradually and systematically increased their gluten intake over the first 4 weeks of the study. An adjustment was made to account for the specific day of occurrence of clinical signs and symptoms for each individual Ss.
11 Three dosages of unfractionated gliadin (10 mg, 600 mg and 1000mg) were each administered intraduodenally over a duration of 2 or 6 hours and mucosal samples were taken at 30-60 minute intervals for a period up to 6-8 hours. Each dose was administered one time on separate days with 48-72 hours between test dose challenges.
9 The most sensitive Ss with celiac disease likely not tested in this study.
8 The gluten or its derivative was administered in this study via (a) intraduodenal infusion, or (b) intrajejunal perfusion.
3 “LOAEL” represents the lowest observable adverse effect level expressed as mg gluten. Additonal information on the nature of the challenge substance (e.g., gluten derivative) administered for each specific study is located in Appendix A.
4 The information in this column represents the duration of time an oral (or possibly intraduodenal or intrajejunal) dosage of gluten or a related derivative was administered in each study, or in some instances, the duration of time until the onset of symptoms. Abbreviations are as follows: hr=hour(s), min=minute(s)
5 This ”Ss Tested” column provides information on the subjects (Ss) with celiac disease (CD) tested at the NOAEL and/or LOAEL dose of each study. “No. Ss” represents the number of subjects with CD challenged at these adverse effect level dose(s). It is not necessarily the number of Ss tested in the study per se.The value found in the parentheses that follows, i.e. (Rx), represents the number of CD subjects that exhibited an adverse reaction(s) at the LOAEL if data for individual Ss was available in the study. The notation of "Ss each" means the number of CD subjects that were tested at each dose level, i.e., the NOAEL and LOAEL doses for the study.
6 Information in this column describes the clinical adverse effects observed at the LOAEL. The time during the study that the measure was taken, i.e., “@ hr, day etc.,” may also be noted. When the challenge-induced changes noted represented a “mean” (or average) or “median” value of the results for a study Ss group, they were referred to as such. Descriptive phrases expressed in quotations are noted in the table as they are presented in the reference. Other abbreviations found in this column follow: D=diarrhea; V=vomiting; I=irritable; AP=abdominal pain; PR=severe prostation; M=malaise; AN=anorexia; WL=weight loss; ADC=abdominal discomfort, distress, cramps; F=fatigue; BS=bowel sounds, "gurgling"; ADT=abdominal distention; N=nausea; F/I=fatigue/irritability; []=contains adverse effect description at dose other than LOAEL.
7 See Table 1 and 2, footnote 7 for the meaning of and abbreviations associated with the information found in this column. Additional abbreviations also found in this column follow: AGA-IgA= anti-gliadin immunoglobulin A; AGA-IgG= anti-gliadin immunoglobulin G; EmA= antiendomysium antibody; min= minutes.

Table 6: Subchronic low-dose oral1 gluten exposure data for clinical adverse effects in celiac disease
NOAEL2 LOAEL3
Exposure
Duration4 Ss Tested5
No. Ss (Rx) Type of Clinical Adverse Effects6 Other Information7 Reference
200 mg/d 1000 mg/d 4 weeks 10 Ss each (3)
a) Ss @ LOAEL symptoms during 4 weeks: AN, PS 1000 mg/d group mean @ 4 weeks: inc IEL, dec Vh, inc Cd, dec Vh/Cd ratio, inc urinary recovery, inc trend AGA-IgA
Catassi et al., 1993
200 mg/d 29 days 1 Ss
a) 1 Ss @ LOAEL of 8 Ss subchronic exposure; b) symptom @ LOAEL day 29: V
LOAEL Ss @ week 39: inc IEL, morphology "infiltative" vs. T0 "infiltative", inc antibodies @ week 4
Laurin et al., 2002
1000 - 1100 mg/d 16 - 79 days 2 Ssa) 2 Ss of 8 Ss subchronic exposure; b) symptoms @ day 16 (n=1): D, AP and @ day 79 (n=1): D, ADT
2 Ss, 5 or 11 weeks exposure: inc IEL, morphology "hyperplastic" vs. T0 "pre-infiltrative", inc antibodies
1300 - 1450 mg/d10 17- 24 days 4 Ss
a) 4 Ss of 8 Ss subchronic exposure; b) symptoms @ day 17 or 24: V, D, F
4 Ss, 13-21 weeks exposure: inc IEL, morphology "hyperplastic (n=3)" or "destructive (n=1)" vs. T0 "pre-
infiltrative (n=2)" or "infiltative (n=2)", inc antibodies
1800 mg/d 55 days 1 Ss a) 1 Ss of 8 Ss subchronic exposure; b) symptom @ day 55: I
1 Ss, 16 weeks exposure: inc IEL, morphology "hyperplastic" vs. T0 "pre-infiltrative", inc antibodies
2600 mg/d <4 weeks 27 Ss (<10)
a) Ss @ LOAEL @ < 4 weeks: "intense symptoms" stopped challenge
2600 mg/d group Ss @ < 4 weeks: 88% morphological "relapse", inc enteropathy score (based on IEL, Vh/Cd, surface epithelium damage, inflammatory infiltrate); inc AGA-IgA, EmA
Jansson et. al., 20019
2.4 - 4.8 mg/d 6 weeks 10 Ss (6)
a) LOAEL symptoms during 6 weeks : D, AP, V, BS; b) mean of 10 Ss @ 6 weeks: >symptom composite score vs. control period; c) 6 of 10 Ss: inc 6-week mean score vs. control period; d) 4 of 10 Ss "complained of D"
"symptom composite score" assesses clinical symptoms and severity; no change in mean IEL, Vh/Cd ratio, E-SCH, intestinal permeability @ 6 weeks
Ciclitira et al., 1985
1.5 mg/d 1-3 mo 15 Ss (11)
a) symptoms onset @ 1-3 mo; b) LOAEL Ss symptoms: D, DH, AP, FL, F/I, BP/MP, APP; c) LOAEL Ss stopped study between 2-9 mo because of symptoms; d) symptoms resolved after stopped challenge; e) symptoms "consistent for each individual Ss" over time
15 Ss challenged had no prior exposure to products containing wheat starch; no symptoms reported in 14 challenged "wheat starch clinically tolerant" control CD Ss; no changes in AGA-IgA, AGA-IgG, EmA to challenge in LOAEL or control CD Ss; no morphological measures taken
Chartrand et al., 1997
10 mg/d 6-8 weeks 14 Ss (1)
a) LOAEL symptoms @ 6-8 weeks: V, D, ADT; b) LOAEL Ss quit study because of adverse clinical reactions
LOAEL Ss refused post-reaction biopsy; 4 Ss excluded from study because of severe enteropathy at T0, even
after 1 mo. on pre-test strict GFD
Catassi et al., 20078, 9
10 mg/d 50 mg/d < 12 weeks 12-13 Ss each (2)
a) 2 of 13 Ss @ 50 mg LOAEL: "developed symptoms"; b)2 LOAEL Ss quit full study because of adverse clinical reactions
NOAEL/LOAEL Ss no post-reaction biopsy; 4 Ss excluded from study because of severe enteropathy at T0, even after 1 mo. on pre-test strict GFD
Catassi et al., 20058, 9
CH
ILD
RE
NA
DU
LTS
1 The route of administration of gluten for each study was by oral ingestion unless otherwise noted.
Page B-10
2 “NOAEL” represents the no observable adverse effect level expressed as mg gluten per day. Additonal information on the nature of the challenge substance (e.g., gluten derivative) administered for each specific study is located in Appendix A.

5 See footnote 5 in Table 5.
Table 6, continued
B-11
10 This is an estimate of the mg/day of exposure experienced by the Ss at the time that clinical effects were exhibited because Ss gradually and systematically increased their gluten intake over the first 4 weeks of the study. An adjustment was made to account for the specific day of occurrence of clinical signs and symptoms for each individual Ss.
7 See Table 1 and 2, footnote 7 for the meaning of and abbreviations associated with the information found in this column. Additional abbreviations also found in this column follow: AGA-IgA= anti-gliadin antibody immunoglobulin A; AGA-IgG= anti-gliadin antibody immunoglobulin G; EmA= antiendomysium antibody.
8 Gluten was administered in this study via a capsule.
9 The most sensitive Ss with celiac disease likely not tested in this study.
6 See footnote 6 in Table 5. Additional abbreviations also found in this column follow: FL=flatulence; BP/MP=bone pain/myalgias; APP=inc appetite; DH=dermatitis herpetiformis.
3 “LOAEL” represents the lowest observable adverse effect level expressed as mg gluten per day. Additonal information on the nature of the challenge substance (e.g., gluten derivative) administered for each specific study is located in Appendix A.
4 See footnote 4 in Table 5.

Table 7: Chronic low-dose gluten oral1 exposure data for clinical adverse effects in celiac disease
NOAEL2 LOAEL3
Exposure
Duration4 Ss Tested5
No. Ss (Rx) Type of Clinical Adverse Effects6 Other Information7 Reference
1100 mg/d 15 weeks 1 Ss
a) 1 Ss @ LOAEL of 2 Ss chronic exposure; b) symptoms @ LOAEL @ week 15: C, I
LOAEL Ss @ week 18: inc IEL, morphology "hyperplastic" vs. T0
"infiltrative"
Laurin et al., 2002
2250 mg/d 6-15 months 12 Ss (5)
a) 5 Ss @ LOAEL symptoms reported: D, ADT, "symptoms"; b) symptoms timing: 6 mos (2 Ss), 12 mos. (2 Ss), 15 mos (1 Ss)
LOAEL Ss @ 6-15 months: "mucosal lesion typical of CD"
Hamilton and McNeil, 19728
AD
UL
T
1.5 mg/d 6-10 months 4 Ss (2)
a) symptoms onset @ 6-8 mo; b) LOAEL Ss symptoms: D, AP, FL, APP; c) LOAEL Ss stopped study between 8-9 mo because of symptoms; d) symptoms resolved after stopped challenge; d) symptoms "consistent for each individual Ss" over time
4 Ss challenged had no prior exposure to products containing wheat starch; no symptoms seen in 14 challenged "wheat starch clinically tolerant" control CD Ss; no changes in AGA-IgA, AGA-IgG, EmA to challenge in LOAEL or control CD Ss; no morphological measures taken
Chartrand et al., 1997
3 “LOAEL” represents the lowest observable adverse effect level expressed as mg gluten per day. Additonal information on the nature of the challenge substance (e.g., gluten derivative) administered for each specific study is located in Appendix A.
4 See footnote 4 in Table 5.5 See footnote 5 in Table 5.
CH
ILD
RE
N
1 See footnote 1 in Table 6.
2 “NOAEL” represents the no observable adverse effect level expressed as mg gluten per day. Additonal information on the nature of the challenge substance (e.g., gluten derivative) administered for each specific study is located in Appendix A.
B-12
8 The most sensitive Ss with celiac disease likely not tested in this study.
6 See footnote 6 in Table 5 and 6. Additional abbreviation also found in this column follow: C=constipation, obstipation
7 See Table 1 and 2, footnote 7 for the meaning of and abbreviations associated with the information found in this column. Additional abbreviations also found in this column follow: AGA-IgA= anti-gliadin antibody immunoglobulin A; AGA-IgG= anti-gliadin antibody immunoglobulin G; EmA= antiendomysium antibody
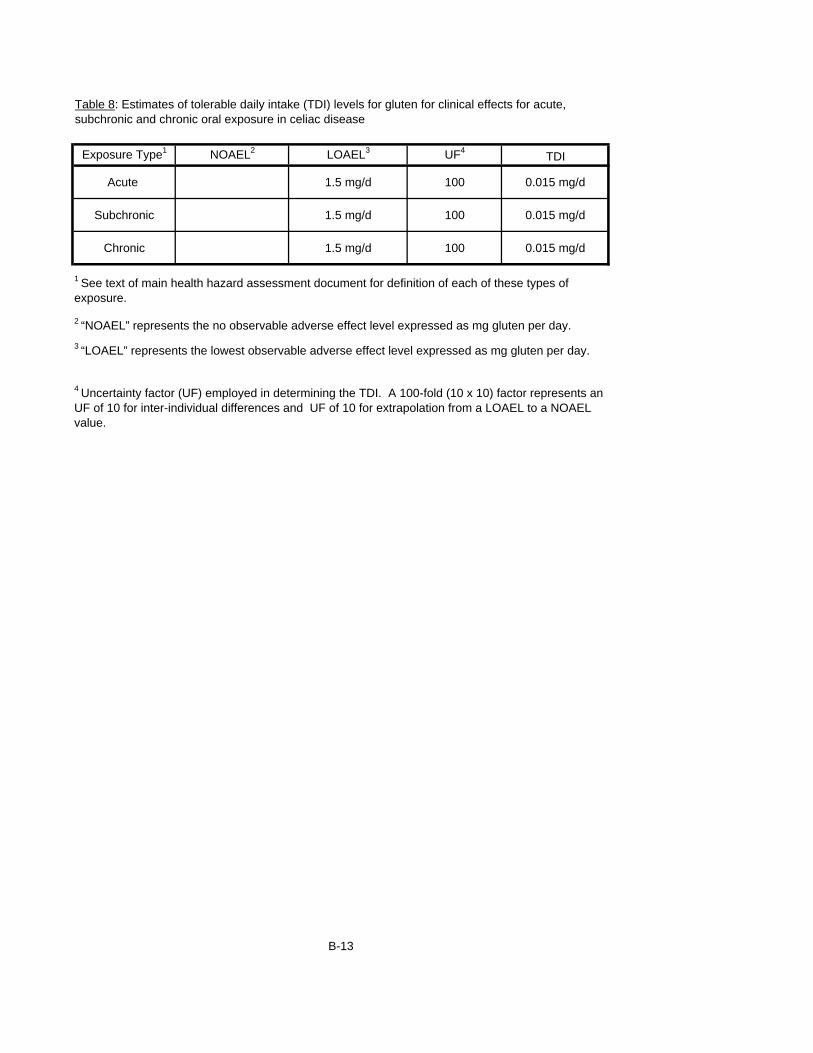
Exposure Type1 NOAEL2 LOAEL3 UF4TDI
Acute 1.5 mg/d 100 0.015 mg/d
Subchronic 1.5 mg/d 100 0.015 mg/d
Chronic 1.5 mg/d 100 0.015 mg/d
B-13
4 Uncertainty factor (UF) employed in determining the TDI. A 100-fold (10 x 10) factor represents an UF of 10 for inter-individual differences and UF of 10 for extrapolation from a LOAEL to a NOAEL value.
Table 8: Estimates of tolerable daily intake (TDI) levels for gluten for clinical effects for acute, subchronic and chronic oral exposure in celiac disease
1 See text of main health hazard assessment document for definition of each of these types of exposure.
2 “NOAEL” represents the no observable adverse effect level expressed as mg gluten per day.
3 “LOAEL” represents the lowest observable adverse effect level expressed as mg gluten per day.

Exposure Type2
Consumption
Estimate3
(kg food/day)
Morphological Clinical Morphological Clinical
Subchronic
mean 0.40 0.4 0.015 1.0 0.04
90th 0.70 0.4 0.015 0.6 0.02
Chronic
mean 0.40 0.4 0.015 1.0 0.04
90th 0.65 0.4 0.015 0.6 0.02
Subchronic
mean 0.40 0.4 0.015 1.0 0.04
90th 0.90 0.4 0.015 0.4 0.02
Chronic
mean 0.40 0.4 0.015 1.0 0.04
90th 0.80 0.4 0.015 0.5 0.02
5 The LOC is the concentration of gluten in food that corresponds to the morphological and clinical TDIs identified as of primary focus, or i.e., the "principal TDIs."
1 The term "wheat gluten foods" reflects the gluten-free foods ingested by consumers with CD as a replacement for only foods that normally contained wheat and/or relevant wheat-based subcomponents. This delineation was included because the derived TDIs were determined from dose-response effects data in challenge studies that adminstered wheat gluten or its derivatives. See text of main document for additional explanation and details associated with this point.
2 Subchronic and chronic exposure durations were considered in derivation of LOCs because they are reflective of dietary patterns of exposure for individuals on a GFD. Also the prinicipal morphological TDI was derived from subchronic dose-response data. The "mean" (i.e., 50th percentile) and the "90th" percentile intake levels of exposure were those for which the food consumption estimates and the corresponding gluten LOC values were determined.
B-14
Table 10: Levels of Concern (LOC) for gluten associated with the consumption of replacement "Wheat
Gluten Foods1"
AD
ULT
S
Principal TDI4
(mg gluten/day)LOC5
(mg gluten/kg food or ppm)
CH
ILD
RE
N
3 These values are estimates of the level of consumption of "gluten-free" foods which are based on an assumed comparable intake to similar foods that would normally contained wheat-based gluten for each "exposure type" duration. (See Table 9 in main text.) Also see "Exposure Assessment" subsection in main text for specific details about this estimation.
4 These values reflect the single representative TDI values for morphological and clinical effects identified upon analysis to be of primary focus as the overall tolerable level of gluten intake for those with CD. See text of the main document text for details and explanation of this analysis.

Exposure Type2
Consumption
Estimate3
(kg food/day)
Morphological Clinical Morphological Clinical
Subchronic
mean 0.40 0.4 0.015 1.0 0.04
90th 0.70 0.4 0.015 0.6 0.02
Chronic
mean 0.40 0.4 0.015 1.0 0.04
90th 0.70 0.4 0.015 0.6 0.02
Subchronic
mean 0.50 0.4 0.015 0.8 0.03
90th 1.10 0.4 0.015 0.4 0.01
Chronic
mean 0.50 0.4 0.015 0.8 0.03
90th 0.90 0.4 0.015 0.4 0.02
B-15
Table 11: Levels of Concern (LOC) for gluten and/or gluten-like proteins associated with the consumption
of replacement "All CD Grain Foods1"
AD
ULT
S
Principal TDI4
(mg gluten/day)LOC5
(mg gluten/kg food or ppm)
CH
ILD
RE
N
3 These values are estimates of the level of consumption of "gluten-free" foods which are based on an assumed comparable intake to similar foods that would normally contained wheat, rye and/or barley, and/or gluten-related protein subcomponents of these grains for each "exposure type" duration. (See Table 9 in main text.) Also see "Exposure Assessment" subsection in main text for specific details about this estimation.
4 See footnote 4 on Table 10.
5 The LOC is the concentration of the gluten and/or gluten-like proteins in food that corresponds to the morphological and clinical TDIs identified as of primary focus, or i.e., the "principal TDIs." In this case, the "gluten" in the units, mg "gluten"/kg food (or ppm), represents wheat gluten along with the gluten-like proteins in rye and barley.
1 The term "All CD Grain Foods" here represent the gluten-free foods ingested by consumers with CD as a replacement for foods that normally contain wheat, rye and/or barley, and/or relevant subcomponents of these grains. This delineation was included to account for wheat gluten and gluten-like proteins in rye and barley. For the purposes of this analysis, it was assumed the potencies of these proteins across the different grains are comparable. See text of main document for a more detailed explanation about this point.
2 See footnote 2 in Table 10.