national master plan for neglected tropical...
TRANSCRIPT

REPUBLIC OF THE GAMBIA
MINISTRY OF HEALTH AND SOCIAL WELFARE
NATIONAL MASTER PLAN
FOR
NEGLECTED TROPICAL DISEASES
2015-2020
December 2014

2
1 Table of Contents
LIST OF FIGURES ................................................................................................................................................. 3
LIST OF TABLES ................................................................................................................................................... 4
LIST OF ANNEXES ................................................................................................................................................ 5
LIST OF ACRONYMS ........................................................................................................................................... 6
FORWARD ................................................................................................................................................................ 9
ACKNOWLEDGMENT ........................................................................................................................................ 10
LIST OF CONTRIBUTORS ................................................................................................................................ 11
INTRODUCTION ................................................................................................................................................... 13
PART 1: SITUATIONAL ANALYSIS .............................................................................................................. 15
PART 2: NTD STRATEGIC AGENDA ........................................................................................................... 41
PART 3: OPERATIONAL FRAMEWORK .................................................................................................... 53
3.1 SCALING UP ACCESS TO NTD INTERVENTIONS, TREATMENT AND SERVICE DELIVERY
CAPACITY .................................................................................................................................................. 53
3.1.1 Scaling up preventive chemotherapy interventions .............................................................................................53
3.3 PHARCOVIGILANCE IN NTD CONTROL ACTIVITIES ..................................................................... 60
3.4 STRENGTHENING CAPACITY AT NATIONAL LEVEL FOR NTD PROGRAMME MANAGEMENT AND
IMPLEMENTATION .................................................................................................................................... 61
3.5 ENHANCING PLANNING FOR RESULTS, RESOURCE MOBILIZATION AND FINANCIAL
SUSTAINABILITY ....................................................................................................................................... 63
3.6 STRENGTHENING GOVERNMENT OWNERSHIP, ADVOCACY, COORDINATION AND
PARTNERSHIPS ........................................................................................................................................ 64
3.8. POST INTERVENTION SURVEILLANCE AND INTEGRATION WITHIN PRIMARY HEALTH CARE66
BUDGET JUSTIFICATION AND ESTIMATES ........................................................................................... 68
ANNEXES ................................................................................................................................................................ 69
PART I SITUATION ANALYSIS ................................................................................................................. 69

3
List of Figures
Figure 1: Administrative Structures of The Republic Of Gambia……………………………………………………….16
Figure 2: Gambia Showing The Population Density. ………………..…………………………………………………..18
Figure 3: Population Size And Growth Of The Gambia ……..…………………………………………………………..18
Fiure 4: Map of PC-NTD coendemicity in Gambia…………………………………………………………….34
4
List of Tables
Table1: National Population Data, Schools,And Health Facilities At District Level ………………..…………………..17
Table 2.1: LF Disease Distribution In The Country ………………..………………………………. ………………………29
Table 2.2: Trachoma Distribution In The Gambia………………..……………………………….. ………………………..30
Table 2.3: Known Disease Distribution Of Urinary Schistosomiasis In The Gambia ………………………………….30
Table 2.4: STH Distribution In The Gambia………………..………………………………………………………………...31
Table 2.5: Number of dog bites per region from 2011 to 2014. Source, HMIS/MOH&SW…...………....31
Table 2.6: Distribution Trends of Leprosy Cases According To Regions In The Gambia (2005- 2010) ………………32
Table 3: NTD Co-Enedmicity………………..……………………………………..…………………………………………...33
Table 4: NTD Mapping Status………………..……………………………………..…………………… ……………….……35
Table 5.1: Summary Of Intervention Information on Existing PCT-NTD Programmes……… …………….…………..36
Table 5.2: Summary Of Intervention Information on Existing CM Programmes ……………… ……………….………..36
Table 6.1: SWOT Analysis: STH / SCH / LF………………..…………………………………………………………….…...38
Table 6.2: SWOT Analysis: Trachoma………………..…………………………………………… ………………….….….38
Table 6.3: SWOT Analysis: Leprosy ………………..………………………………………………………………..……….39
Table 6.4: SWOT Analysis: Rabies………………..…………………………………………………………………….…….40
Table 7: Strategic Framework Summary………………..…………………………………………………………….……....42
Table 8: Summary of NTD Disease Specific Goals and Objectives………………..…………………………….……….44
Table 9: Types of Mass Drug Administration………………..…………………………………………………….………….54
Table 10: Activities For Strategic Priority 1- Scale Up Access To PCT Interventions………………………….…………55
Table 11: Activities For Case Management Interventions………………..……………………………………….…………56
Table 12: Case Management And Chronic Care………………..…………………… …………………………….………..57
Table 13: Intervention Packages For Transmission Control………………..…………………… ………………..………...58
Table 14: Activities For Disease Transmission Control………………..………………………………………….….….…..59
Table 15: Activities For Strengthening Pharmaco-Vigilance In NTD Programme………… ……………………..….……61
Table 16: Activities And Resources Needed For Strengthening Capacity For NTD Programme ……………...………62
Table 17: Scaling Up/Scaling Down Plan. ………………..…………………………………………………………..……….64
Table 18: Activities For Implementing Strategic Priority 1: ………………..…………………………………………………65
Table19: Activities For Implementing Strategic Priority 4: ………………..………………..…………………………….….66
Table 20: Activities For Surveillance And Sustainability………………..……………………………………….……………67
5
List of Annexes
Annex 1.1. Populations, Villages/Communities, Children, Schools, and Health Facilities ……..…………………… ….69
Annex 1.2. : Distances Between Main Cities And District Headquarters of The Country………………………………….69
Annex 1.3: Organisational Chart of The MOH &SW and The NTD National Programme……………………………….70
Annex 1.4: Summary on Available Data Of PCT-NTD Distribution………………..………………………………………71
Annex 1.5: Summary on Available Data On CM-NTD Distribution……………..………………………………………. 71
Annex 1.6: Summary on Status Of Implementation of PCT- NTD Interventions In Districts……………………………72
Annex 1.7: Summary on Status Of Implementation of CM Interventions In Districts …………………………………….73
Annex 2. 1: Package of Preventive Chemotherapy (PCT) - Mass Drug Administration (Mda)…………………………..74
Annex 2.2: Package Of Case Management (CM) and Chronic Care……………………………………………………….74
Annex 2. 3: PCT Algorithm 1……………………………………………………………………………………………………..75
Annex 2.4: PCT Algorithm 2……………………………………………………………………………………………………..75
Annex 2.5: Algorithm For Co-Endemicity Of Cm-Ntds In Countries of the Who African Region…………..……………..76
Annex 2.6: Package Of Transmission Control - Vector/Reservoir Control………………………………………………….77
Annex 2.7: Package Of Improvement of Environment, Supply Of Safe Drinking Water, Sanitation, …………………77
Annex 2.8: What To Do” By District (Operational Unit) By Operational Package…………… ……………………………78
Annex 2.9: Drug Estimates And Logistics……………………………………………………………………………………..79
Annex 2.10: Drug Forecasting And Logistics……………………………………………………………………………………79
Annex 2.11: Summary Of Progressive Scale Up And Phase Out Of PCT Interventions Package ……………………….80
Annex 2.12: Results Framework For The WHO-HQ-AFRO-APOC Strategic Plan, 2010–2015 …………………….……81

6
LIST OF ACRONYMS
CACs Catchment Area Committees
CBI Community Based Initiatives
CBOs Community Based Organizations
CDCP The Centre for Disease Control and Prevention Atlanta
CEO Chief Executive Officer
CHNs Community Health Nurses
CM-NTDs Case Management- Neglected Tropical Diseases
CMDs Chief Medical Directors
CRR Central River Region
DHIS2 District Health Information System version 2
DHPE Directorate of Health Promotion and Education
DHS Directorate of Health Services
DRF Drug Revolving Fund
DSW Directorate of Social Welfare
EDC Epidemiology and Disease Control
DPI Directorate of Planning and Information
EPI Expanded Program on Immunization
FSQHE Directorate of Food Standards, Quality and Hygiene Enforcement
GAVI Global Alliance on Vaccine and Immunization
GBoS Gambia Bureau of Statistic
GDP Gross Domestic Product
GFATM Global Fund for AIDS, TB and Malaria
GRTS Gambia Radio and Television Services
GHW General Health Worker
HDI Human Development Index
HIV/AIDs Human Immune Deficiency Virus
HMIS Health Management Information System
HMIS The Health Information System
HND Higher National Diploma
HRH Human Resources for Health
7
ICT Immunochromatography Test
ICC Inter-Agency Coordinating Committee
IDM Integreted Disease Management
IDSR Integrated Disease Surveillance and Response
IDSR Integrated Disease Surveillance and Response
IEC Independent Electoral Commission
IEC/BCC Information Education Communication/ Behaviour Change Communication
IMF International Monitory Fund
IMR Infant Mortality Rate
IRS Insecticide residual spray (IRS),
IVE Ivermectin
IU International Unit
KMC Kanifing Municipal Council
LDCs Least Developed Countries
LF Lymphatic Filariasis
LEP Leprosy
LGA The Local Government Area
LMIS Logistic Management Information
LRR Lower River Region
MDA Mass Drug Administration
M&E Monitoring and Evaluation
MICS Multiple Indicator Survey
MMR Maternal Mortality Rate
MoBSE Ministry of Basic and Secondary Education
MOFEA, Ministry of Finance and Economic Affairs
MOHSW Ministry of Health and Social Welfare
NaNA National Nutrition Agency
NCD Communicable and Non Communicable Diseases
NCG National Consultative Group
NGO. Non-Governmental Organisation
NPHLS Directorate of National Public Health Laboratory Services
8
PAGE Programme for Accelerated Growth and Employment
PC-NTDs. Preventive Chemotherapy- Neglected Tropical Diseases
PEGEP President Empowerment for Girls Education Program
PRSP Poverty Reduction Strategy Paper
RBF Result Based Financing
RCH Reproductive & Child Health Services
RHD Regional Health Director
SAFE Surgery Antibiotics Face washing Environmental change
SDH Social Determinant of Health Report
SMC Senior Management Committee
STH Soil Transmitted Helminths
TANGO The Association of Non-Governmental Organizations
TAS Transmission Assessment Survey
TB Tuberculosis
TBAs Traditional Birth Attendants
TF Follicular trachoma
THE Total health Expenditure
TIPAC Tool for Integrated Planning and Costing
TRA Trachoma
TT Trachoma Trichiasis
UNFPA United Nation Population Fund
UNICEF United Nation Children’s Fund
URR Upper River Region
UTG University of the Gambia
WASH Water access Sanitation and Hygiene
VHWs Village Health Workers
VSGs Village Support Groups
WCR West Coast Region
WHO World Health Organisation

9
FORWARD
Neglected tropical diseases (NTDs) are a different group of diseases with distinct characteristics that thrive
mainly among the poorest populations. There are 17 NTDs prioritized by WHO and are endemic in 149
countries and affect more than 1.4 billion people, costing developing economies billions of dollars every
year. Many can be treated cost-effectively, yet they have been largely ignored on the global health policy
agenda until recently. In May 2013, the 66th World Health Assembly adopted resolution WHA66.12 which
calls for intensified, integrated measures and planned investments to improve the health and social well-
being of affected populations. WHO is working with Member States to ensure implementation of WHA66.12.
In respond to the global NTDs call for elimination, control and eradication of NTDs by 2020, the situational
analysis of NTDs was conducted in The Gambia. This desk review revealed the need to map endemic
NTDs, and the development of a programme master plan for the elimination, eradication, and control of
NTDs such as lymphatic filariasis, trachoma, soil transmitted helminthes, schistosomiamiasis, leprosy and
rabies. The major objective of this Master Plan is geared towards improving the quality of life and economic
growth of the Gambians by reducing the burden of NTDs, through a well-coordinated national NTD control
and elimination programme and to prevent the occurrence of new infections of all NTDs by 2020; in addition
to initiating appropriate management of all existing cases. This plan will provide a tool that clearly articulates
the strategies for joint planning, budgeting and resource mobilization for NTDs through sustainable
integrated interventions in line with WHO guidelines.
The NTDs master plan was conducted in a consultative and multisectoral approach involving all
stakeholders i.e. the relevant government ministries (Health, Education, Agriculture, Economics, Planning,
Finance and Environment), NGOs, research institutions (MRC and CIAM) and the UN agencies. The entire
process was transparent and open and allowed divergent views to reflect the perceptions of NTDs in The
Gambia. This was of paramount importance, as the Ministry of Health provided leadership, while the
necessary logistic support to guide the process was provided by WHO AFRO.
Ministry of Health & Social Welfare
Gambia
10
ACKNOWLEDGMENT
The Ministry of Health and Social Welfare provided the frame work on NTDs which many stakeholders used
to produce a new five-year comprehensive strategic master plan. This plan is the National response to NTDs
elimination, eradication and control, which will go into effect from 2015 -2020.
Many individuals have contributed immensely to the development of this NTDs master plan by providing time
and technical expertise. In particular the following deserve special mention and appreciation for their
contribution in the development of this NTDs strategic master plan: Dr. Samba Ceesay, Mr. Sana M.
Sambou, Dr. Abdoulie Jack, Mr. Yaya Camara, Mr. Bakary Sanneh, and Dr. Shamila Jah from WHO Gambia
I wish to acknowledge the technical support and contributions of the WHO consultants- Dr.Sammy O. Sam-
Wobo from Nigeria and Dr. Nicholas Tendogfor from Cameroun. We sincerely appreciate all the PARTNERS
who had and are still supporting the Government of Gambia in their resolve to provide good and sustainable
health system and service. Lastly, I wish to extend my sincere thanks and appreciation to the WHO Country
Representative in The Gambia- Dr. Charles Sagoe-Moses for his support in securing the consultants
through WHO to the EDC Team.
Hon. Minister
Ministry of Health & Social Welfare
The Gambia
11
List of contributors
No NAME INSTITUTION
1 Dr. Samba Ceesay Ministry of Health and Social Welfare
2 Yaya Camara Epidemiology Disease Control
3 Sana M. Sambou Epidemiology Disease Control
4 Bakary Sonko Mental Health
5 Dr. Abdoulie Jack Retired WHO Representative
6 Dr. Sammy O. Sam-Wobo WHO Technical Consultant
7 Dr. Tendogfor Nicholas WHO Technical Consultant
8 Dr. Shamila Jah WHO Gambia
9 Alpha Jallow NTD Focal Person, WHO Gambia
10 Lamin F. Manjang Kwinella Health Centre
11 Pa Momodou C. Jaye Retired Lab Scientist
12 Momodou Fatajo Gambia Bureau of Statistics
13 Emmanuel Olabode Edward Francis Small Teaching Hospital
14 Serign J Ceesay Medical Research Council
15 Balla Jatta Epidemiology Disease Control
16 Alieu Wurry National Leprosy TB Programme
17 Sarjo Kanyi National Eye Health Programme
18 Ebrima Bah Directorate Public Health Research
19 Ebrima Joof National Public Health Lab
20 Muhammed Saho Directorate of Health Promotion & Education
21 Musa Jawara Medical Research Council
22 Lamin Manneh Epidemiology Disease Control
23 Fatou O. Sowe Directorate of Health Promotion & Education
24 Tida C. Bojang D.L.S/Ministry of Agriculture
25 Almea Matariock Centers for Disease Control (CDC)
26 Ignatius Baldeh National Public Health Lab
27 Abdoulie Camara Epidemiology Disease Control
28 Iris Cassell Ministry of Basic Senior Education, Lifeskills Edu. Unit
29 Fatoumata Jallow Health Management Information System
30 Bakary Sanneh National Public Health Lab
31 Karamba Keita Regional Health Director/North Bank East
32 Karim Darboe Regional Health Director/Lower River Region
33 Sheriffo MK Darboe Regional Health Director/Western Region 1

12
34 Adama MB Sanneh Epidemiology & Disease Control (Secretary)
35 Ebrima Keita Environmental Health Unit
36 Abdoulie Juum Regional Health Director/Upper River Region
13
INTRODUCTION
Neglected tropical diseases (NTDs) is a group term that encompasses a group of parasitic, bacterial and
viral infections collectively causing a disease burden comparable to that of malaria and HIV (Fenwick et al.,
2005; Hopkins et al., 2008). Out of the 17 global NTDs, 14 are listed to occur in Sub-Saharan Africa. They
include lymphatic filariasis (LF), schistosomiasis, soil transmitted helminthiases, leprosy, buruli ulcer, yaws
and other treponematoses, onchocerciasis, dracunculiasis, blinding trachoma and human African
trypanosomiasis (WHO, 2012a).
Worldwide, one billion people are estimated to be at risk of NTDs, and approximately 534,000 people die of
the diseases annually (WHO, 2012a). NTDs are widespread in Africa, and are the world’s most common
infections of people living in poverty (Hotez and Kamath, 2009). Sub-Saharan Africa has a high prevalence
of NTDs, accounting for approximately one-quarterhree major intestinal helminth infections (namely,
ascariasis, trichuriasis, and hookworm infection), more than one-third of the LF, one-half of the trachoma,
and all or most of the schistosomiasis, onchocerciasis, loiasis, and human African trypanosomaisis (HAT)
(Hotez and Kamath, 2009; Hotez, 2014). The greatest burden of buruli ulcer lies in West and Sub-Saharan
Africa, where it is a significant cause of disability among children and adults in subsistence agricultural
communities (Huang and Johnson, 2014). Visceral leishmaniasis causes substantial morbidity in humans
and leads to about 40,000 deaths annually (Ready, 2014). Due to the high morbidity and mortality that result
from NTDs especially in poor communities, it is important to develop strategies to prevent and reduce their
burden. In 2007, efforts to combat the diseases were redirected to shared commitment to support WHO’s
strategies, goals and targets after the first Global Partners Meeting (WHO, 2007). This move resulted in
tremendous gain to public health, including scale up of control and eradication programmes and improved
access to chemotherapeutic interventions for hundreds of millions of poor and marginalized individuals in an
innovative and cost-effective way (WHO, 2012b).
Recently, there has been a growing momentum towards the control and/or eliminate of NTDs in the African
region (WHO, 2012a), as a road map on NTDs was developed by WHO in 2012. The destination of the road
map is the elimination or control of NTDs to levels at which they will no longer be considered as public health
problems by 2015 and 2020 (WHO, 2012b).
Moreover, The Accra Urgent Call in 2012,the African Ministers of Health resolved to strengthen efforts to
fight NTDs, and recently, the World Health Assembly adopted a resolution to scale up the control of NTDs.
Currently, thirty-six countries in the WHO African Region have developed integrated national multi-year
plans (NTD master plans) (WHO, 2013). Five of these countries (Burkina Faso, Ghana, Mali, Niger, and
Uganda) have already started scale-up activities, since scaling up to national programmes is a goal of NTD
control programmes (Hanson et al., 2012).
In an attempt to meet this global objective of combating NTDs, The Gambia is developing an action plan for
national neglected tropical diseases programmes. In any country, knowledge of local endemicity status of
NTDs is essential for subsequent development of any implementation strategy. However, there is limited

14
information on the current status/endemicity of NTDs in The Gambia. For trachoma, its mapping has been
carried out across the entire country except in one district (Kanifing), under the National Eye Health
Programme. However, there is no specific programme for trachoma, or budgeted funding for its control in the
country. The most recent research data on LF endemicity in the country is from a transmission assessment
survey of primary school children conducted in 2013 by Epidemiology and Disease Control Unit of the
Ministry of Health and Social Welfare (MOHSW) in collaboration with CDC. The data from this survey was
not sufficient to provide reliable information on the prevalence of LF in The Gambia. Available information on
Urinary Schistosomiasis was obtained from the Ph. D thesis of Dr. A. D. Jack (1989), which was based on a
two-year longitudinal study on chemotherapy in 12 PHC villages, located in two regions which were then
known as schisto-endemic areas in the country. This study is not only old, but was also limited in scope, as it
covered only two regions. The only other data source was routine hospital reports, compiled monthly by the
health facilities. Thus, the data available cannot provide reliable and adequate information on the endemicity
of schistosomiasis in The Gambia. Soil-transmitted helminthiasis (STH) is the most neglected of the four
PC-NTDs in The Gambia. It has not been captured under any division of the MOHSW and the only available
data is from hospital routine examinations collated at the regional level. Furthermore for the CM-NTDs in the
Gambia, document from NTDs and vetinary reports has shown pocket incidences of rabies and leprosy
which are case management NTDs.
In the Gambia, there exist a parallel system in the management and control of some NTDs (i.e leprosy under
the NTLP programme, and trachoma under the national eye care unit); but there is no control programme for
schistosomiasis, STH, lymphatic filariasis, and rabies. Therefore, this NTD master plan will provide the
platform for establishing and strengthening the control, elimination and reduction in the burden of NTDs in
the Gambia.

15
PART 1: SITUATIONAL ANALYSIS
1.1 Country Profile
The Republic of Gambia is located on the West African Coast almost surrounded by the Republic of
Senegal on the Northern, Southern and Eastern bordersand the Atlantic Ocean on the Western borders. The
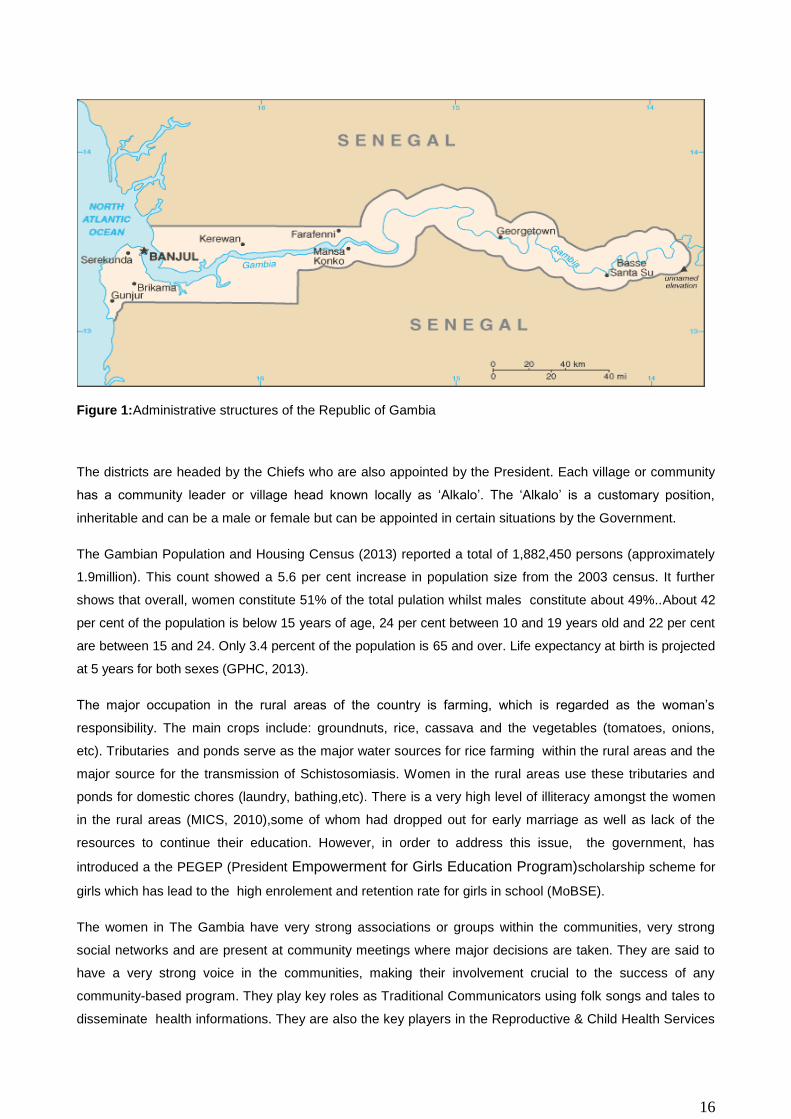
Gambia is a small and narrow country whose borders mirror the meandering Gambia River. It lies between
latitudes 13° and 14°N, and longitudes 13° and 17°W (figure 1).
The Gambia extends about 400 km inland forming a narrow enclave in the Republic of Senegal except for a
short seaboard on the Atlantic Coastline as shown in the map below. The country is less than 48.2 km (30.0
miles) wide at its widest point, with a total area of 11,295 km2 (4,361 sq mi). Approximately 1,300 km2 (500
sq mi) (11.5%) of the Gambia's area is covered by water.It has a population of 1,882,450 people and with a
population density of 176 persons per km2 (GBOS, 2013), makes the country to be one of the highest
densely populated countries in Africa, thus imposing extreme pressure on productive land and the provision
of social services. In addition ,the country has a tropical climate characterized by two seasons: rainy
season(June-October) and dry season (November- May)
1.1.1 ADMINISTRATIVE, DEMOGRAPHIC AND COMMUNITY STRUCTURES;
The Gambia is divided into eight Local Government Areas, including the national capital, Banjul (figre 2).
The Divisions of the Gambia were created by the Independent Electoral Commission in accordance with
Article 192 of the National Constitution.The Local Government Areas or regions are further subdivided into
43 districts (GBoS, 2013). Administratively the country is divided into three tiers: the Central (National),
Regional (Local Government Areas and Municipalities ) and Districts. Within the districts are communities or
villages. The regions are headed by Governors who are appointed by the President of the Republic,and the
municipalities are headed by Mayors who are elected by democratic process. However there are two
municipalities Banjul and Kanifing l ) and five Administrative regions ( West Coast Region (WCR), Lower
River Region (LRR), Central River Region (CRR), North Bank Region (NBR) and Upper River Region
(URR).
16
Figure 1:Administrative structures of the Republic of Gambia
The districts are headed by the Chiefs who are also appointed by the President. Each village or community
has a community leader or village head known locally as ‘Alkalo’. The ‘Alkalo’ is a customary position,
inheritable and can be a male or female but can be appointed in certain situations by the Government.
The Gambian Population and Housing Census (2013) reported a total of 1,882,450 persons (approximately
1.9million). This count showed a 5.6 per cent increase in population size from the 2003 census. It further
shows that overall, women constitute 51% of the total pulation whilst males constitute about 49%..About 42
per cent of the population is below 15 years of age, 24 per cent between 10 and 19 years old and 22 per cent
are between 15 and 24. Only 3.4 percent of the population is 65 and over. Life expectancy at birth is projected
at 5 years for both sexes (GPHC, 2013).
The major occupation in the rural areas of the country is farming, which is regarded as the woman’s
responsibility. The main crops include: groundnuts, rice, cassava and the vegetables (tomatoes, onions,
etc). Tributaries and ponds serve as the major water sources for rice farming within the rural areas and the
major source for the transmission of Schistosomiasis. Women in the rural areas use these tributaries and
ponds for domestic chores (laundry, bathing,etc). There is a very high level of illiteracy amongst the women
in the rural areas (MICS, 2010),some of whom had dropped out for early marriage as well as lack of the
resources to continue their education. However, in order to address this issue, the government, has
introduced a the PEGEP (President Empowerment for Girls Education Program)scholarship scheme for
girls which has lead to the high enrolement and retention rate for girls in school (MoBSE).
The women in The Gambia have very strong associations or groups within the communities, very strong
social networks and are present at community meetings where major decisions are taken. They are said to
have a very strong voice in the communities, making their involvement crucial to the success of any
community-based program. They play key roles as Traditional Communicators using folk songs and tales to
disseminate health informations. They are also the key players in the Reproductive & Child Health Services
17
where they ensure that their children benefit from all available services. The women can, thus, be an
important platform for the implementation of NTD projects in the communities.
Gambia has a crude birth rate estimated at 46 per 1000 of the population while the total fertility rate is 5.4
births per woman (National Health Policy 2012). The high fertility rate has resulted in a very youthful
population structure with nearly 44% of the population below the age of 15 years and 19% between the
ages of 15 to 24 years. The implication of the Gambian age structure is that more than 63% of the youths
are within the vulnerable groups for the PC-NTDs.
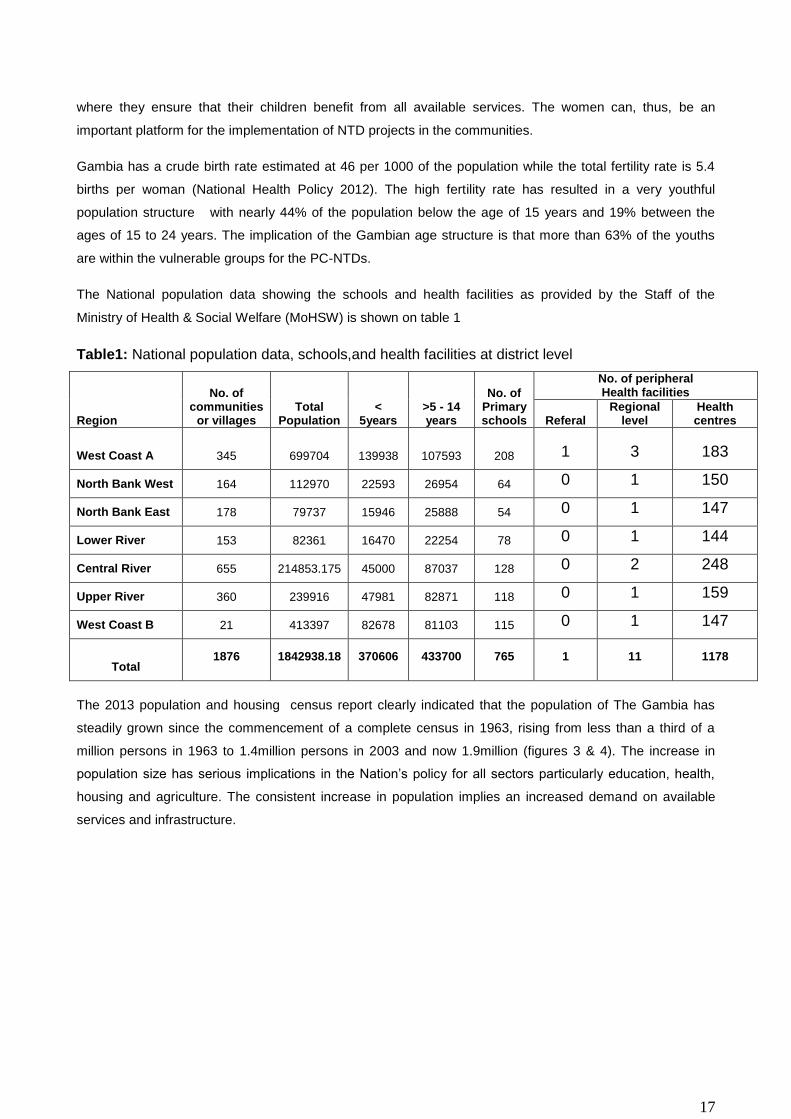
The National population data showing the schools and health facilities as provided by the Staff of the
Ministry of Health & Social Welfare (MoHSW) is shown on table 1
Table1: National population data, schools,and health facilities at district level
Region
No. of communities
or villages Total
Population <
5years >5 - 14 years
No. of Primary schools
No. of peripheral Health facilities
Referal Regional
level Health centres
West Coast A 345 699704 139938 107593 208 1 3 183
North Bank West 164 112970 22593 26954 64 0 1 150
North Bank East 178 79737 15946 25888 54 0 1 147
Lower River 153 82361 16470 22254 78 0 1 144
Central River 655 214853.175 45000 87037 128 0 2 248
Upper River 360 239916 47981 82871 118 0 1 159
West Coast B 21 413397 82678 81103 115 0 1 147
Total 1876 1842938.18 370606 433700 765 1 11 1178
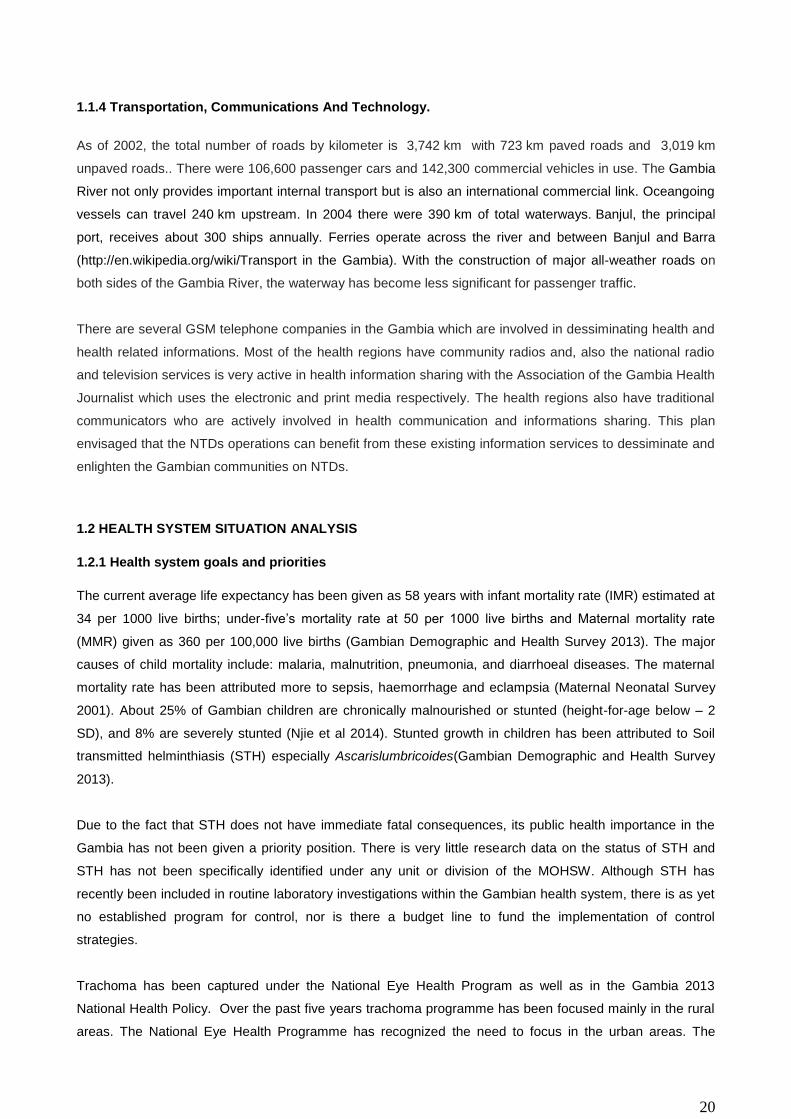
The 2013 population and housing census report clearly indicated that the population of The Gambia has
steadily grown since the commencement of a complete census in 1963, rising from less than a third of a
million persons in 1963 to 1.4million persons in 2003 and now 1.9million (figures 3 & 4). The increase in
population size has serious implications in the Nation’s policy for all sectors particularly education, health,
housing and agriculture. The consistent increase in population implies an increased demand on available
services and infrastructure.
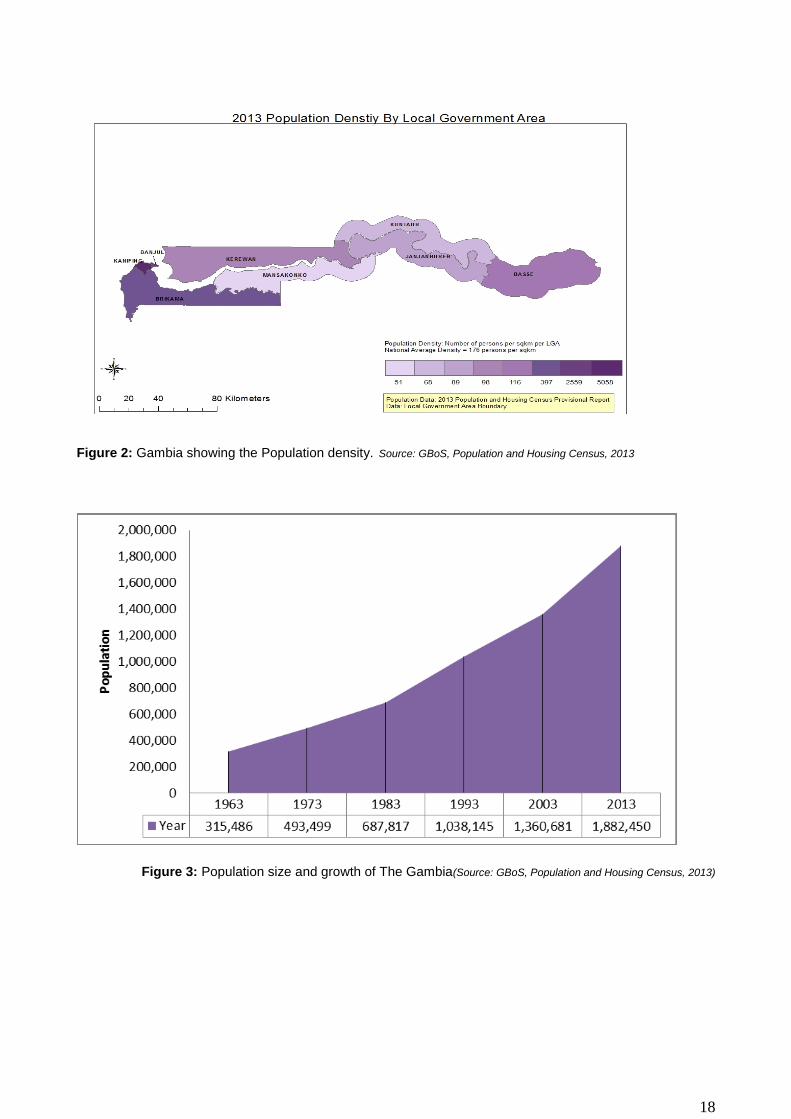
18
Figure 2: Gambia showing the Population density. Source: GBoS, Population and Housing Census, 2013
Figure 3: Population size and growth of The Gambia(Source: GBoS, Population and Housing Census, 2013)

19
1.1.2 Geographical Characteristics
The Gambia is a small West African country surrounded on the three sides by the Republic of Senegal and
on the fourth side by the Atlantic Ocean. It is the smallest country on mainland Africa, spanning only 10,680
km2. The country runs in an East-Westerly wind direction and lies between latitude 13o and 14o degrees
north. The country varies in width from 28 to 50km and is flat, with an altitude not exceeding 50 metres. The
River Gambia divides the country into two halves, North and South Banks.
The country lies in the Sahelian-Sudano Region and it has sahelian climate characterized by two seasons –
a four month rainy season (mid June – mid October), with rainfall highest in August, and an eight-month dry
season (SDH Report, 2013). Hot, humid weather predominates the rest of the year, with a rainy season from
June to October; during this period, temperatures may rise as high as 43 °C (109.4 °F) but are usually
lownear the sea.Mean temperatures range from 23 °C (73.4 °F) in January to 27 °C (80.6 °F) in June along
the coast, and from 24 °C (75.2 °F) in January to 32 °C (89.6 °F) in May inland. The average annual rainfall
ranges from 920 mm (36.2 in) in the interior to 1,450 mm (57.1 in) along the coast
(http://en.wikipedia.org/wiki/Climate_in_the_Gambia).
1.1.3 Socioeconomic Situation And Indicators
The Gambia is amongst the Least Developed Countries (LDCs) with Gross Domestic Product (GDP) per
capita of US$ 560 (IMF Staff report 2011). Agriculture forms the backbone of the economy with about 70%
of the working population involved in the agricultural sector. With regard to GDP, the Service sector are the
biggest contributor with 60%, while agriculture contributes 30%.The national economy is based mainly on
agriculture, with groundnut as the main export crop. The recent upturn in performance of the economy has
however been driven mainly by the service sector including tourism, telecommunication and construction.
The economy grew by 7.2% in 2007 over the preceding fiscal year; national revenue has been increasing
progressively; inflation reducing to low single digit levels and was 2.3% as at end May 2007 (PRSP II, 2007).
According to Ministry of Ffinance and Economic Affairs (MOFEA), the Gambia has been registering annual
GDP growth rates of more than 5% (UNHDI,2008-2011) during the current global economic crisis, and has
maintained a stable macroeconomic environment that is increasingly threatened by a mounting debt burden.
The Gambia is ranked 168 out of 187 countries in the 2011 UN Human Development Index (UNHDI), and
the last poverty survey (2008) revealed that about 55% of the population lives below the poverty line.
The economy suffered a contraction of GDP to 4.3% in 2011 due to drought. This was due to a fall in crop
production of around 45 per cent in that year, despite several non-agricultural sectors of the economy, such
as tourism which has been performing well during 2011. The figures for 2012 shows a rebound in GDP
growth of 5.3 per cent due to a recovery in crop production and strong growth in wholesale and retail trade,
and construction. The services sector saw its total contribution drop 1.8 percentage from 16.3 per cent in
2011 to 14.5 per cent in 2012 (PAGE 2012).
20
1.1.4 Transportation, Communications And Technology.
As of 2002, the total number of roads by kilometer is 3,742 km with 723 km paved roads and 3,019 km
unpaved roads.. There were 106,600 passenger cars and 142,300 commercial vehicles in use. The Gambia
River not only provides important internal transport but is also an international commercial link. Oceangoing
vessels can travel 240 km upstream. In 2004 there were 390 km of total waterways. Banjul, the principal
port, receives about 300 ships annually. Ferries operate across the river and between Banjul and Barra
(http://en.wikipedia.org/wiki/Transport in the Gambia). With the construction of major all-weather roads on
both sides of the Gambia River, the waterway has become less significant for passenger traffic.
There are several GSM telephone companies in the Gambia which are involved in dessiminating health and
health related informations. Most of the health regions have community radios and, also the national radio
and television services is very active in health information sharing with the Association of the Gambia Health
Journalist which uses the electronic and print media respectively. The health regions also have traditional
communicators who are actively involved in health communication and informations sharing. This plan
envisaged that the NTDs operations can benefit from these existing information services to dessiminate and
enlighten the Gambian communities on NTDs.
1.2 HEALTH SYSTEM SITUATION ANALYSIS
1.2.1 Health system goals and priorities
The current average life expectancy has been given as 58 years with infant mortality rate (IMR) estimated at
34 per 1000 live births; under-five’s mortality rate at 50 per 1000 live births and Maternal mortality rate
(MMR) given as 360 per 100,000 live births (Gambian Demographic and Health Survey 2013). The major
causes of child mortality include: malaria, malnutrition, pneumonia, and diarrhoeal diseases. The maternal
mortality rate has been attributed more to sepsis, haemorrhage and eclampsia (Maternal Neonatal Survey
2001). About 25% of Gambian children are chronically malnourished or stunted (height-for-age below – 2
SD), and 8% are severely stunted (Njie et al 2014). Stunted growth in children has been attributed to Soil
transmitted helminthiasis (STH) especially Ascarislumbricoides(Gambian Demographic and Health Survey
2013).
Due to the fact that STH does not have immediate fatal consequences, its public health importance in the
Gambia has not been given a priority position. There is very little research data on the status of STH and
STH has not been specifically identified under any unit or division of the MOHSW. Although STH has
recently been included in routine laboratory investigations within the Gambian health system, there is as yet
no established program for control, nor is there a budget line to fund the implementation of control
strategies.
Trachoma has been captured under the National Eye Health Program as well as in the Gambia 2013
National Health Policy. Over the past five years trachoma programme has been focused mainly in the rural
areas. The National Eye Health Programme has recognized the need to focus in the urban areas. The

21
Gambia is implementing the WHO endorsed SAFE strategy to eliminate trachoma in the Gambia.There is an
existing leprosy intervention program country wide through The National Leprosy and Tuberculosis Control
Programme in the Ministry of Health and Social Welfare. The programme is engaged in surveilence and
case management country wide.
Lymphatic Filariasis and Schistosomiasis have been placed under the Epidemiology and Disease Control
Unit of the Ministry of Health and Social Welfare (MOHSW). Data on these two diseases are scanty,
incomplete or out-dated. As with the other NTDs, no specific control program is in existence and no specific
budget has been earmarked to fund control strategies. The Centre for Disease Control and Prevention
Atlanta (CDCP) has recently begun a technical collaboration with the Epidemiology and Disease Control
Unit of the MOHSW in order to initiate the control of Lymphatic Filariasis. The CDCP sponsored 2013
Transmission Assessment Survey for Lymphatic Filariasis in 46 primary schools using ICT cards. Although
limited in scope, this survey has provided the only recent data on Lf in Gambia.
The strategic priorities are in line with The National Health Policy, the PAGE, MDGs and Vision 2020 targets.
These priorities are:
a. Maternal, neonatal, infant and child health services
b. Surveillance, prevention, control and management of communicable and Non communicable
diseases (NCDs)
c. Improve knowledge and skills of health care providers at all levels
d. Build capacity of the Health Management Information System (HMIS) and data management
system within the health sector
There are improved health infrastructures at primary, secondary and tertiary health care levels
1.2.2 Analysis of the overall health system
Health care services are provided by 7 public hospitals at the tertiary level; 6 major health centres and 41
minor health centres at the secondary level; 40 community clinics and 634 Primary Health Villages at the
primary level.
The public health system is complemented by over 60 other special private, NGO and community managed
health facilities. Formal health services in The Gambia are delivered mostly in health facilities funded by the
Government of The Gambia. These facilities are also supported by a number of donors and NGOs. NGOs
and private practitioners also provide services though most of which are located in the Greater Banjul Area.
In addition, there are large number of private pharmacies, drug stores for selling pharmaceutical products,
and traditional healers that provide health services .
1.2.2.1 Health Service Delivery
The Gambia adopted the Primary Health Care (PHC) Strategy for health delivery in 1979. Primary health
care is delivered through 3 levels of care:
1) The Primary Level – This provides the preventive and curative action through a network of health
posts consisting of Volunteer Village Health Workers (VHWs) and Traditional Birth Attendants

22
(TBAs). The VHWs and TBAs are supervised by trained Community Health Nurses (CHNs). These
work in community owned health centres and public health centres.
2) The Secondary Level – this level provides procedures as well as trained personnel to handle less
complicated health issues. This level has a network of major and minor Health Centres and Clinics
with more specialized staff and equipment located at districts or Local Government Areas.
3) The Tertiary Level – this level provides more specialized services and interventions and is planned
to function as a referral service for the Secondary Level. This level of health care is found at the
Central or National level.
The basic structure of the Primary Health Care system in Gambia has been well laid with the community fully
entrenched in the system. In addition to a network of health posts consisting of the VHWs and TBAs, there
are also strong organisations known as the Village Support Groups (VSGs) and the Community Based
Organisations (CBOs). The VSGs and CBOs have a common understanding of the health issues in their
respective communities. They provide health related services to their communities, including the purchase of
medicines for the VHWs to use, participate in health talks and are the key players in the dissemination of
health information. The VSGs are supervised by trained CHN to manage undernourished children in their
respective communities. In a recently concluded study, the linkage of the VSG with the minor health facilities
in the communities was found to be well-defined and cordial (Njie et al. 2014).
The VGS and CBO are very good platforms already in place for effective implementation and monitoring of
Preventive Chemotherapy for Neglected Tropical Disease (PC-NTD) control project. These should be
involved in the planning, implementation as well as monitoring of the PC-NTDs interventions to ensure
community ownership in line with the Community Directed Intervention (CDI) approach. The VGS and CBO
could be further trained in improved ways of mobilization of community members since they have their trust,
and already understand their local issues. They could also be trained in record keeping so that accurate
records of NTD activities can be available at this level.
The PHC at the primary level in Gambia is one of the most organized level of health care delivery. This
situation can be used by the PC-NTD project for effective MDA implementation on completion of the
mapping exercise. The advantageous coordination at the Primary level of Health delivery in Gambia can to
some extent reduce the huge setback of the non-availability of the NTD program at the National level if
properly utilized while efforts are made to bring the PC-NTDs to the priority list of the Country and be
included in the National budget. The distribution of the population in line with the villages and health facilities
is presented on tables 2 and 3.
Effective and efficient referral services from one level of health care to another (community to secondary and
secondary to tertiary) are important in patient management and disease outcome. However, the current
referral system still has major challenges. Some of the challenges include inadequate and ill equipped
ambulances, intermittent shortage of fuel, inadequate feedback mechanism, inadequate referral protocol
and guidelines and late referrals especially at community level. This situation is further compounded by
limited (only receiving) telecommunication services within health facilities. A referral policy which will improve
the referral system isrequired to enhance speedy and efficiency in safe evacuation of patients.

23
1.2.2. Health Workforce / Human Resources For Health
The Human Resources for Health (HRH) situation in the Ministry has been very critical. The complexity and
challenges associated with human resources such as high attrition rates, shortage of skilled health
professionals (0.1 doctors/1000 populations,0.11 registered nurses/1000, 0.18 enrolled nurses/1000, 0.04
registered nurse midwives/1000, 0.12 enrolled nurse midwives/1000 populations) (MOHSW, 2013 ), low
morale among staff, deteriorating quality of care and other related problems has affected health care
delivery at all levels of the health care delivery system (MOHSW, 2003).
The Directorate of Planning and Information through Human Resources for Health unit (now Directorate of
Human Resources for Health) which was established in 2005 has registered number of achievements since
its inception. These include: Provision of incentive packages (hard to reach, special skills, risk allowance,
teaching allowance, on-call allowances, responsibility allowance) to MOHSW staff through advocacy, HRH
Policy and strategic plan, Health systems strengthening project (accelerated training of health staff),
establishment of HRIS data base, in-service training (management, IT, HR), Off-site provision – Leeds
Metropolitan University, Introduction of masters programs in Public health and Community Health,
introduction of the conversion course and upgrading the midwifery from certificate to diploma (HND), and
expansion of health facilities.
In the face of the successes registered, the Directorate grapples with weak institutional and human
capacity for HRH planning and management. There is still shortage of indigenous skill HRH including health
training institutions, high attrition rate among trained and skilled staff, high dependency on expatriates,
uneven distribution of health workers, remuneration packages which don’t match the high cost of living, lack
of clear guideline for staff promotion, posting guideline and fellowship awards (Training scheme and
priorities), poor motivation and retention packages for staff, poor working environment and accommodation
conditions (MOHSW 2005), inadequate infrastructure and teaching and learning aids for the health training
institutions, weak linkages between MOHSW and Gambia College and UTG, non functional vehicle for the
movement of students to and from practical experiences , unplanned/uncoordinated expansion of health
facilities, poor working environment in terms of availability of essential tools for the service delivery, and
inadequate private sector involvement in the production of health staff (MOHSW 2009). The human resource
directorate is currently focusing on the service areas of Training and Development, Recruitment and
Promotion, Distribution, Retention & Motivation, Planning& Management as well as Resource Mobilization
for HRH.
1.2.3 Health Information:
The Health Information System in The Gambia comprises five main service areas namely Health
Management Information System (HMIS), Health research, Births and deaths registration, Information and
communication technology and Integrated Disease Surveillance and Response (IDSR). These service areas
focus on information generation, validation, analysis, dissemination and utilization for the purpose of
effective and efficient planning and decision making process.
24
Health Management Information System is the programme responsible for collecting, analysing, storing and
disseminating health data. Data generated health service delivery for the Ministry of Health are collected and
punched into an open source software called District Health Information System version 2 (DHIS2) data can
be punched offline but can only be used online in assigned user accounts that have restricted privileges for
each user. The information can easily be accessed as they are punched. There are immediate, weekly,
monthly anr quarterly reporting of vital events such as casse of reportable and notifiable diseases including
NTD (Schistosomiasis, Trachoma and lymphatic filiariasisetc), as well as Epidemic Prone Diseases, and
Vaccine Preventable Disease.Repoorting the above events rewuiires in addition to DHIS 2, the filling of
investigation forms.
Key challenges faced by the HMIS include; inadequate number and skilled capacity to manage data at all
levels, availability of parallel systems, duplication of efforts e.g. use of multiple software to manage the same
system, weak reporting from some hospitals and private sector, inadequate functional ICT equipment at
HMIS and regions, inadequate skilled ICT officers at all levels, poor power supply, inadequate financial
support and poor internet connectivity.
1.2.4 Medical Products:
The Gambia adopted its first National drug policy in 1995 and was revised in July 2007 and a strategic plan
developed in 2009. As a result the pharmaceutical sector in The Gambia registered a number of
achievements that have contributed towards the improvement in the availability and accessibility of
medicines in the country ranging from the establishment of National Pharmaceutical Services Unit,
construction and establishments of six Regional Medical Stores, existing distribution system, construction of
New Central Medical Stores warehouse and administration building under the World Bank (WB) project. In
addition there is an existing LMIS and computerized inventory control system at Central Medical Stores and
increase in skilled human resource. Furthermore there is an available infrastructure that needs to be
developed into a Quality Control laboratory though not functional but limited tests are being conducted
using the minilabs. Efforts to improve the management and utilization of pharmaceuticals had resulted in
development and provision of the Standard Drug Treatment Manual and Essential Medicines List, training of
Health Workers on Rational Use of Drugs and the Management of drugs at the health facility level. A
system to monitor safe use of these medicines and adverse drug reactions is in the process of being
established.
Despite these achievements, there are still constraints and challenges as highlighted in the baseline survey
of the WHO Pharmaceutical Sector assessment done in 2007 e.g. inadequate organizational structure,
inadequate availability of essential medicines and vaccines, lack of sustainable medicines financing,
inadequate logistics, inadequate medicines regulation (structure and processes), lack of a drug quality
control lab and skilled human resources, irrational drug use and weakness in drug management, some of
which are currently being addressed e.g. inadequate medicine legislation. A number of global and national
challenges such as the HIV/AIDs pandemic, the re-emergence of TB, increase prevalence in non
communicable diseases and the increasing medicines resistance to infectious diseases can also negatively
impact on the pharmaceutical sector, as it obviously put further constraint to its limited resources, both

25
financial and technical. This is further aggravated by the problem of counterfeit, fake and substandard
medicines, which is increasingly becoming a major concern within the sub-region and world-wide.
The Gambia government provides support for the provision of routine vaccines for immunization services
and continues to meet its core financing obligation (5%) for the provision of new and under- used life saving
vaccines. The provision of funds for supplementary immunisation activities and purchase of infant welfare
cards as well as surveillance poses major challenge to effective implementation of EPI services.
1.2.5 Health Financing:
In The Gambia, the main sources of financing health care are through the government, donors, NGO, and
private out-of-pocket expenditures. Public sector financing of health has grown over the years but has
mainly favoured investment in tertiary care. According to the first National Health Account Survey that was
conducted in 2007 for the years 2002-2004 showed that the contribution of the Government to the health
sector grew from 18% in 2002 to 24% of the total health expenditure in 2004. However, in the same period,
the total health expenditure as a percentage of Gross Domestic Product (GDP) declined from 16.1% in 2002
to 13.9% in 2003 and rose slightly to 14.9% in 2004. The households, through direct out-of-pocket payments
to health care providers were 12% in 2002, 11% in 2003 and 9% in 2004 to the total health expenditure.
The health sector has increasingly become dependent on donor funds from WHO, UNICEF, UNFPA and
particularly the Global Fund for AIDS, TB and Malaria (GFATM). During the three year period, 2002-2004,
over 66% of the total health funding came from donors including international health development partners.
General Government expenditure on Health as percentage of General Government is still below the Abuja
Declaration Targets of 15%.
As a supplement to the high government expenditure on health, user charges were introduced in 1988 and
the proceeds are paid into a Drug Revolving Fund (DRF) account. These generated funds are used to
complement the government’s budget allocation for drugs. Despite this, health is seriously under-funded
particularly at the primary and secondary levels. The health budget is also disproportionately distributed
favouring the tertiary level and urban over rural areas with hospitals currently accounting for nearly half of
the total government resources and expenditures. Strategies to equalize this imbalance include on-going
advocacy to mobilize resources for health financing from traditional and non-traditional partners/donors and
the strengthening of cost sharing mechanisms for all levels of health care delivery.
1.2.6 Achievements
The Ministry of Health and Social Welfare has its draft Health Financing Policy since 2009 as a guide/tool to
make funding available, ensure choice of cost-effective interventions, set appropriate financial incentives for
providers, and ensure that all individuals have access to effective public health and personal health care. In
addition, it has also conducted its first National Health Account in 2007 which provided information on Health
budgets and expenditures nationally in terms of donors, government and out of pocket expenditures.
In line with attaining Universal Health Coverage, the Ministry has already conducted two feasibility studies
on the introduction of National Health Insurance with the intention of starting with the formal sector (the civil

26
servants) as one of the studies highlighted as a recommendation. Moreover, through the support of the
World Bank MoHSW in collaboration with NaNA has introduced Result Based Financing (RBF) as a pilot in
the NBW region and upon successful implementation, this will be scaled up to other regions (NBE, CRR,
and URR). These financing mechanisms are the most appropriate strategies that can help us achieve
Universal Health Coverage.
In The Gambia, available statistics indicate that over 60% (NHA 2007 Report) of the total health funding
comes from donors (international health development partners) raising high challenges of sustainability and
predictability of funding to the sector. Although there is an impressive revenue collection system in place by
the Gambia Revenue Authority, yet still funding to the health sector is still below the Abuja declaration of
15%.
Moreover, current funding for the health sector is less than optimal as available resources could still not
provide the required quality services for the population due to so many reasons like high administrative cost
especially from GLF component and in addition donor inputs are not well coordinated while issues of
efficiency and equity in use of funds continue to be a challenge.Apart from the above issues, there are other
challenges that the health sector is facing: Low capacities in resource mobilization at the various health
facilities, low cost levied on user fees, inadequate data on health expenditure due to lack of regular studies
of National Health Accounts and Public Expenditure Reviews and the delays in conducting the second round
of National Health Account which suppose to give us current/true picture of the health financing situation of
the country.
Since the Health Financing Policy is still not finalized, there is no holistic health financing mechanisms and
legislation in place, no National Health Insurance Scheme and therefore there is inadequate health financing
schemes in the country (only few private health insurance schemes). Inadequate trained Health Economists
and health planners in the health sector to implement Health Financing Policy, in terms of putting proper
system in place for health expenditure planning, execution, trekking and monitoring. Finally, cost of
providing health care continues to rise due to increasing demand, changes in diagnostic and therapeutic
technologies, inflation and currency fluctuations which are the biggest challenge worldwide.
1.2.6 Leadership and Governance:
Leadership
The Ministry of Health and Social Welfare is responsible for the management of the health sector, which
includes: policy formulation and policy dialogue, resource mobilization, regulation, setting standards, health
service delivery, quality assurance, capacity development and technical support, technical advice to other
government line Ministries on matters of public health importance, provision of nationally coordinated
programmes such as epidemiology and disease control, coordination of health research and monitoring and
evaluation of the overall sector performance.
Due to on-going health system reforms, such as decentralization of health services, some of the functions of
the central level management have been delegated to national semi autonomous institutions including
27
referral hospitals, specialist and general hospitals, professional councils, national drug authority and other
regulatory bodies as well as local government authorities and research activities conducted by some
research institutions.
The Ministry is headed by a Minister who is appointed by the President and head of state, and assisted by a
Permanent Secretary, who serves as the Chief Administrator of the Ministry. The Permanent Secretary is
also assisted by two deputy permanent secretaries; The Deputy Permanent Secretary technical assists the
Permanent Secretary on technical operations of the ministry, while the deputy permanent secretary
Administration and Finance assists the permanent secretary on administrative and financial matters.
The current organizational structure at the Ministry comprises of two departments namely; Medical and
health department and Social welfare department.
The department of Medical and Health comprises of the following directorates:
Directorate of Health Services (DHS)
Directorate of Planning and Information (DPI)
Directorate of Food Standards, Quality and Hygiene Enforcement (FSQHE)
Directorate of National Public Health Laboratory Services (NPHLS)
Directorate of Health Promotion and Education (HPE)
The Department of Social Welfare comprise one directorate which is the Directorate of Social Welfare
(DSW).The public health sector covers 90% of the health facilities in the country, complemented by a few
NGO and private sector run health facilities, mainly located in the Greater Banjul Area. Thus in the Gambia,
the provision of healthcare is dominated by the Government facilities, with a minimum (subsidized) charge
for accessing treatment under the basic care package at the three levels of health service delivery. The
large majority of private health facilities are located in the Greater Banjul Area, making choice in health
services delivery point in the rural community nonexistence.
Governance
The central level is the decision-making point for the health sector’s internal issues. The six directorates of
the two departments plan, direct, manage and coordinate all Government health care activities countrywide
through specialized units. The relationship between these directorates is neither vertical nor horizontal but
interactive.
The country is divided into seven health regions each with a regional health team (RHT) headed by a
Regional Health Director (RHD). The RHTs are responsible for the day-to-day administration, management
and supervision of health services in their respective regions. They have overall responsibility for the primary
and secondary health care facilities and their staff within their regions. The RHDs are assisted by the
Regional Public Health Officer, Regional Public Health Nurse, Senior Administrative Officer and other
support staff. The tertiary level, which comprises the hospitals and teaching hospital on the other hand, has
semi-autonomous boards and headed by CEOs and CMDs respectively.

28
1.2.7 Challenges Health System Structure
The following under-listed factors are Gambia’s apparent challenges in the health care sector:
1. Neglect of the Primary care – about half of the National budget remains at the tertiary level while
only 20% goes to the decentralized level. As a result, many public subsidies for health benefit the
rich in the urban areas more than the poor in the rural areas.
2. Inadequate availability of Maternal and Child Health Nutrition and services – the health care delivery
chain or system is weak with poor quality of care.
3. An absence of a comprehensive human resource strategy that enables recruiting, training,
deploying, maintaining and monitoring sufficient numbers of providers in health facilities and
communities. As a result, the health sector is experiencing high rates of attrition of skilled workers
and inadequate distribution of providers.
4. Inadequate or inconsistent supplies of equipment, medicines, fuel, and commodities in both health
facilities and in communities; electricity, clean water, cold storage capacity for blood, delivery kits,
new growth reference charts, service manuals, consumables including birth control, transportation
means for supervision as well as emergency evacuation and needs forecasting.
5. Socio-cultural barriers and limited community mobilization- the prevailing cultural practises result in
a plethora of harmful practices, delayed treatment seeking and ineffective first contact with health
personnel at the community level.
6. Uneven access to and utilization of nutrition and health services by socio-economic status, and by
geographic regions with the urban and coastal regions faring better than rural and more remote
regions, and under utilization of services by the adolescents.
These factors point to an operationally weakened and underfunded Primary Health Care system in the
Gambia.
29
1.3 NTD SITUATION ANALYSIS 1.3.1 Epidemiology and burden of disease
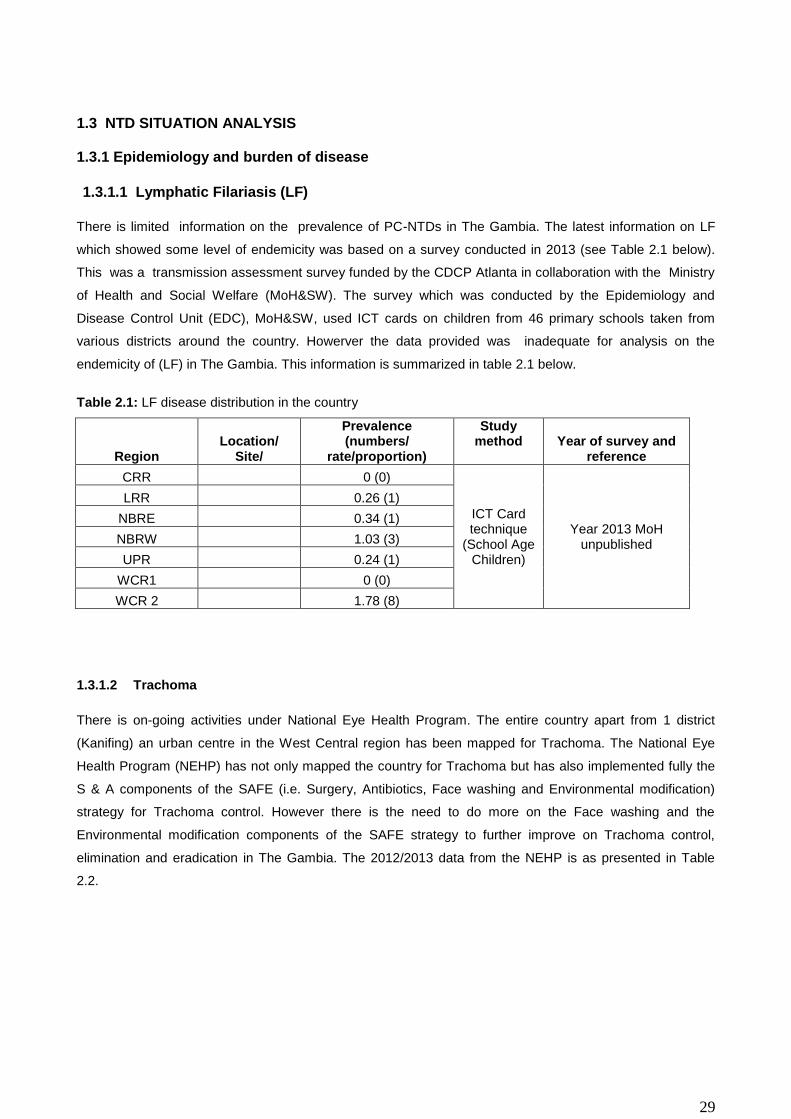
1.3.1.1 Lymphatic Filariasis (LF)
There is limited information on the prevalence of PC-NTDs in The Gambia. The latest information on LF
which showed some level of endemicity was based on a survey conducted in 2013 (see Table 2.1 below).
This was a transmission assessment survey funded by the CDCP Atlanta in collaboration with the Ministry
of Health and Social Welfare (MoH&SW). The survey which was conducted by the Epidemiology and
Disease Control Unit (EDC), MoH&SW, used ICT cards on children from 46 primary schools taken from
various districts around the country. Howerver the data provided was inadequate for analysis on the
endemicity of (LF) in The Gambia. This information is summarized in table 2.1 below.
Table 2.1: LF disease distribution in the country
Region Location/
Site/
Prevalence (numbers/
rate/proportion)
Study method Year of survey and
reference
CRR 0 (0)
ICT Card technique
(School Age Children)
Year 2013 MoH unpublished
LRR 0.26 (1)
NBRE 0.34 (1)
NBRW 1.03 (3)
UPR 0.24 (1)
WCR1 0 (0)
WCR 2 1.78 (8)
1.3.1.2 Trachoma
There is on-going activities under National Eye Health Program. The entire country apart from 1 district
(Kanifing) an urban centre in the West Central region has been mapped for Trachoma. The National Eye
Health Program (NEHP) has not only mapped the country for Trachoma but has also implemented fully the
S & A components of the SAFE (i.e. Surgery, Antibiotics, Face washing and Environmental modification)
strategy for Trachoma control. However there is the need to do more on the Face washing and the
Environmental modification components of the SAFE strategy to further improve on Trachoma control,
elimination and eradication in The Gambia. The 2012/2013 data from the NEHP is as presented in Table
2.2.

30
Table 2.2: Trachoma distribution in The Gambia
Region
Prevalence
Study method Year of survey and
reference (numbers/ rate/proportion)
WCR 1.50%
Ocular examination (evert eyelid)
2012/2013 data from the NEHP
LRR 1.80%
NBW 3.20%
NBE 0.20%
CRRN 0.60%
CRRS 1.1%%
1.3.1.3 Schistosomiasis
Information on Urinary Schistosomiasis was obtained mainly from the Ph.D thesis of Dr. A.D. Jack (1989),
which was based on a two year longitudinal study of chemotherapy in 12 PHC villages, all of which were
located in two regions which were then the known schisto-endemic parts of The Gambia (see Table 2.3
below). Although the data in this thesis may still be relevant, more recent information on the prevalence of
Schistosomiasis is not available. Routine data collected via hospital sources and compiled monthly by the
health facilities is also inadequate. Thus, the data available cannot give an accurate picture of the current
endemicity of Schistosomiasis in The Gambia.
Table 2.3: Known disease distribution of urinary SCHISTOSOMIASIS in The Gambia (Jack , 1989)
Region Villages
Estimated prevalence rates
(%) (8-14 yrs) Study methods
Year of survey and reference
URR
8 73.75 Urine filtration technique
Jack, 1989
32 8.5
Urine Sedimentation by centrifugation
Ceesay et al., 2013 (Unpublished)
CRR 4 81.25
1.3.1.4 Soil Transmitted Helminthiasis (STH)
STH is the most neglected of the four PC-NTDS in The Gambia. It has not been captured under any
programme of the MoH&SW and the only data available was derived from hospital routine examinations
which are collated at the Regional level only. This data does not in any way give a complete picture of the
endemicity of STH in The Gambia. The available data is as presented in Table 2.4.

31
Table 2.4: STH distribution in the Gambia
Region Prevalence (numbers/rate/prop
ortion)
Total number
study method Year of survey and reference
CRR 0.90% 2025
Wet preparations
Routine Data, 2013
LRR 1.20% 996
NBER 0.70% 746
NBWR 0.90% 979
URR 0.30% 827
WHR1 0.40% 3039
WHR2 0.50% 1765
Total 0.50% 9631
1.3.1.5 Rabies
Rabies is a viral infection transmitted through the saliva of an infected animal. Rabies has been present in
the Gambia for a long time. A Major contributing factor for rabies in the country is the increase in the stray
dog population particularly in urban centers culminating in corresponding dog bites in both humans and
animals. This situation is not abating but rather continues to expose lives to clinical cases of rabies.
Between 1970 and 1974, an average 72 cases of caninie rabies were reported annually in the Gambia,
between 2000 and 2004, public health officials reported 123 clinically confirmed human cases. In a study
conducted in 2014 (Thomasa et al., 2014) of 49 cases of dog bites exposures, 6 were from rabies infected
animals. Unfortunately, human rabies are rarely confirmed using laboratory diagnosis but rather on clinical
diagnosis when the patient is in the advanced stage. Epidemiological studies on rabies have been
constrained by the limited capacity of the Central Veterinary Laboratory for its surveillance, sampling and
testing and hence continue to be of great challenge to the Veterinary services as a whole. The Central
Veterinary Laboratory until now is very much dependant on the benevolence of other regional labs for the
diagnosis of rabies which ultimately leaves a gap in the epidemiological data collection of rabies in the
country.
Table 2.5: Number of dog bites per region from 2011 to 2014. Source, HMIS/MOH&SW
Dog bites by Region, 2011 to 2014
Regions 2011 2012 2013 2014
CRR 132 541 154 56
URR 209 565 374 70
WR1 195 317 777 195
WR2 155 246 213
LRR 47 75 41 37
NBWR 72 61 74 84
NDER 78 75 19 39
National 2899 3892 3665 481

32
1.3.1.6 Leprosy
The prevalence and incidence of leprosy in The Gambia is not known. So far, the most reliable indicators to
monitor the extent and the trend of the leprosy disease burden is the registered prevalence of cases
currently on treatment, and the notification of new cases. In 1993, there were 162 cases on register in 1993
with a prevalence rate of 1.57/10,000 and this decreased to 56 cases on register at end of 2010 with a
national prevalence rate of 0.3/10,000). The reported national prevalence rate at end of 2010 (0.3/10,000)
(56cases /1.7m) while the Case detection rate was 0.2/100,000 (38/1.7m) at end of 2010. Even though
these figures show that leprosy is no more a major problem in The Gambia, leprosy scourge is not over until
the last case is detected treated and declared cured.
In 2010, the MB proportion was 84 % among new cases detected (these are the highly infectious type of
leprosy); the proportion of children among the new cases was 15.7%. This indicated some form of
continuing transmission of the infection within the communities. The great majority of new leprosy cases
were found in a few districts in 2 main regions in the Western Region and the Upper river region. Even
though the leprosy number of cases seen annually is very low, as the registered prevalence (1/10,000
population), this does not mean however that leprosy is eradicated. On the contrary, it is more likely that
many early leprosy cases are not detected due to low index of suspicion and skills among the health
workers. The true incidence may be much higher than is currently reported. Table 2.5 below presents the
trend in the distribution of leprosy in Gambia from 2005 to 2010.
Table 2.6: Distribution trends of Leprosy cases according to Regions in the Gambia (2005- 2010)
Region 2005 2006 2007 2008 2009 2010
West Coast Region 26 30 30 27 22 23
Lower River Region 0 0 0 0 0 0
North Bank Esat 3 2 3 2 0 2
North bank West 3 2 4 2 0 0
Central River 10 9 10 6 5 5
Upper River 13 12 14 10 7 8
Total 55 55 61 46 34 38
Source: The Gambia leprosy strategic The Gambia 5-Year National Leprosy ControlStrategic Plan 2012-2017
1.3.2 PC-NTD co-endemicity
The co-endemicity of the PC-NTDs is very difficult to determine for the following reasons:
i) Unavailability of reliable recent data. The only data from Schistosomiasis survey which could have
been used to calculate co-endemicty is more than 25 years old and cannot be relied upon. There is no
data on the distribution of STH.

33
ii) Inconsistency in the study location. The only reliable data so far was from the Trachoma studies with
an almost cross-country survey. The Schistosomiasis survey covered 2 regions only while the
Lymphatic Filariasis survey did not cover all the regions. Secondly, the Trachoma survey gave the
names of the communities and districts where the surveys were done while data from LF was only at
the district level. Schistosomiasis was at village and District level for only 2 regions while STH was
only on Regional basis. Calculating co-endemicity using regions with varying number of districts will
not give an accurate picture of the co-endmicity of these NTDs.Table 3 sumarises the current
endemicity of the NTDs in Gambia.
Table 3: NTD Co-enedmicity
Region
Diseases
Preventive Chemotherapy Diseases Case management Diseases
SCH STH Trachoma LF LEP Rabies
WCR1 ND + + - + +
WCR2 ND + + + + +
LRR ND + + + + +
NBE ND + + - + +
NBW ND + + + - +
CRR + + + + + +
URR + + + - + +
ND: No data available

34
Fiure 4: Map of PC-NTD coendemicity in Gambia
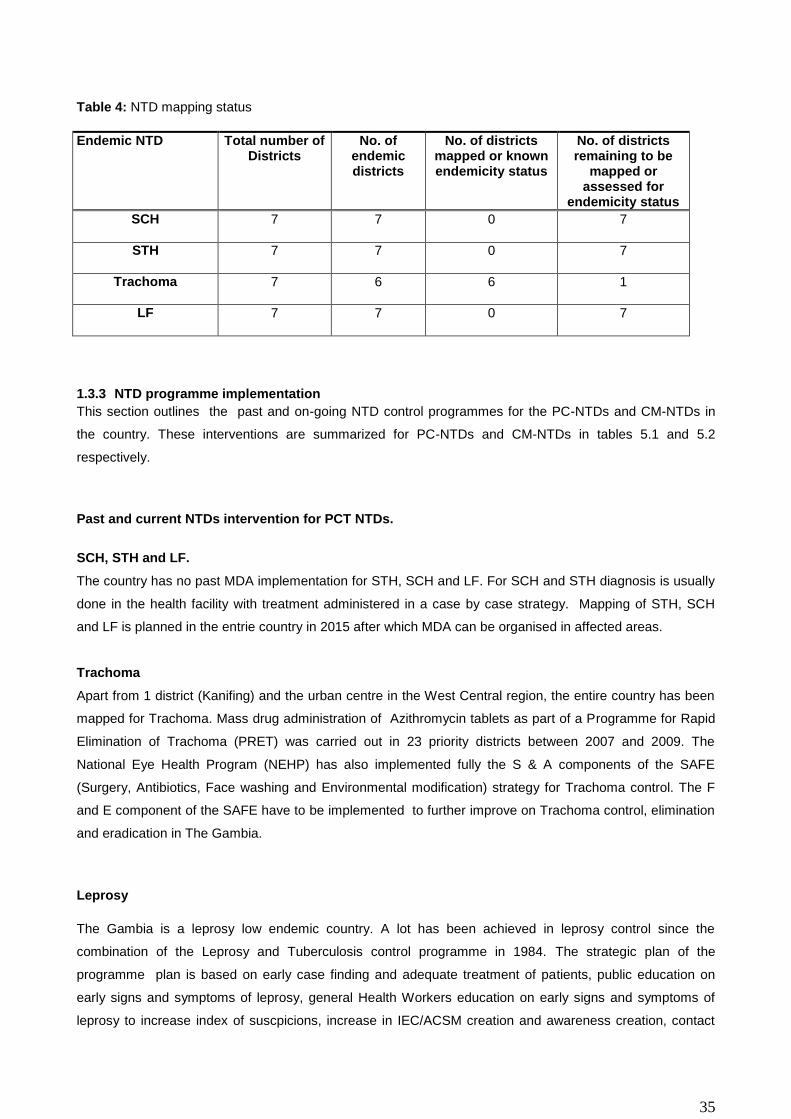
1.3.3.1 NTD mapping status
The absence of reliable data on the occurrence of NTDs in The Gambia makes it imperative that all districts
are mapped in order to ascertain the level of endemicity, particularly of Schistosomiasis, Soil Transmitted
Helminths and Lymphatic Filariasis, occurring either singly or together. Trachoma needs to be mapped in
only one district (Kanifing Municipal Council) and in the urban area of West Central Region. In this district,
children from Senegal study in the schools in Gambia rasing an issue of crossborder transmission. The
mapping outcome will pave the way for the implementation of the Mass Drug Administration intervention
leading to subsequent elimination of PC-NTDs from The Gambia. Table 4 below summarises the mapping
situation of NTDs in The Gambia.
35
Table 4: NTD mapping status
1.3.3 NTD programme implementation
This section outlines the past and on-going NTD control programmes for the PC-NTDs and CM-NTDs in
the country. These interventions are summarized for PC-NTDs and CM-NTDs in tables 5.1 and 5.2
respectively.
Past and current NTDs intervention for PCT NTDs.
SCH, STH and LF.
The country has no past MDA implementation for STH, SCH and LF. For SCH and STH diagnosis is usually
done in the health facility with treatment administered in a case by case strategy. Mapping of STH, SCH
and LF is planned in the entrie country in 2015 after which MDA can be organised in affected areas.
Trachoma
Apart from 1 district (Kanifing) and the urban centre in the West Central region, the entire country has been
mapped for Trachoma. Mass drug administration of Azithromycin tablets as part of a Programme for Rapid
Elimination of Trachoma (PRET) was carried out in 23 priority districts between 2007 and 2009. The
National Eye Health Program (NEHP) has also implemented fully the S & A components of the SAFE
(Surgery, Antibiotics, Face washing and Environmental modification) strategy for Trachoma control. The F
and E component of the SAFE have to be implemented to further improve on Trachoma control, elimination
and eradication in The Gambia.
Leprosy
The Gambia is a leprosy low endemic country. A lot has been achieved in leprosy control since the
combination of the Leprosy and Tuberculosis control programme in 1984. The strategic plan of the
programme plan is based on early case finding and adequate treatment of patients, public education on
early signs and symptoms of leprosy, general Health Workers education on early signs and symptoms of
leprosy to increase index of suscpicions, increase in IEC/ACSM creation and awareness creation, contact
Endemic NTD Total number of Districts
No. of endemic districts
No. of districts mapped or known endemicity status
No. of districts remaining to be
mapped or assessed for
endemicity status
SCH 7 7 0 7
STH 7 7 0 7
Trachoma 7 6 6 1
LF 7 7 0 7
36
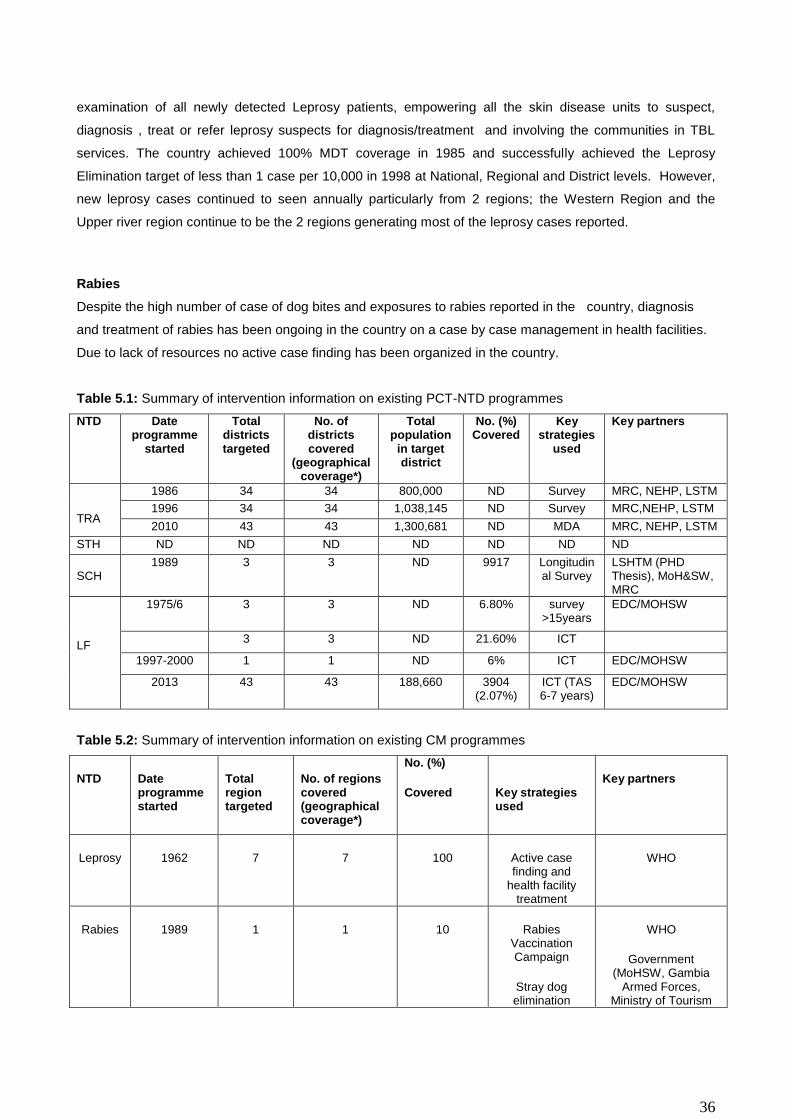
examination of all newly detected Leprosy patients, empowering all the skin disease units to suspect,
diagnosis , treat or refer leprosy suspects for diagnosis/treatment and involving the communities in TBL
services. The country achieved 100% MDT coverage in 1985 and successfully achieved the Leprosy
Elimination target of less than 1 case per 10,000 in 1998 at National, Regional and District levels. However,
new leprosy cases continued to seen annually particularly from 2 regions; the Western Region and the
Upper river region continue to be the 2 regions generating most of the leprosy cases reported.
Rabies
Despite the high number of case of dog bites and exposures to rabies reported in the country, diagnosis
and treatment of rabies has been ongoing in the country on a case by case management in health facilities.
Due to lack of resources no active case finding has been organized in the country.
Table 5.1: Summary of intervention information on existing PCT-NTD programmes
NTD Date programme
started
Total districts targeted
No. of districts covered
(geographical coverage*)
Total population
in target district
No. (%) Covered
Key strategies
used
Key partners
TRA
1986 34 34 800,000 ND Survey MRC, NEHP, LSTM
1996 34 34 1,038,145 ND Survey MRC,NEHP, LSTM
2010 43 43 1,300,681 ND MDA MRC, NEHP, LSTM
STH ND ND ND ND ND ND ND
SCH
1989 3 3 ND 9917 Longitudinal Survey
LSHTM (PHD Thesis), MoH&SW, MRC
LF
1975/6 3 3 ND 6.80% survey >15years
EDC/MOHSW
3 3 ND 21.60% ICT
1997-2000 1 1 ND 6% ICT EDC/MOHSW
2013 43 43 188,660 3904 (2.07%)
ICT (TAS 6-7 years)
EDC/MOHSW
Table 5.2: Summary of intervention information on existing CM programmes
NTD Date programme started
Total region targeted
No. of regions covered (geographical coverage*)
No. (%)
Covered
Key strategies used
Key partners
Leprosy 1962 7 7 100 Active case finding and
health facility treatment
WHO
Rabies 1989 1 1 10 Rabies Vaccination Campaign
Stray dog elimination
WHO
Government (MoHSW, Gambia
Armed Forces, Ministry of Tourism

37
1.3.3 Gaps and priorities
Trachoma
With the exception of the urban region of the the West central region and the district of Kanifing, Trachoma
has been fully mapped in the country with the S and A component of the SAFE implemented. The major
challenges today are to implement the F and E components of SAFE, complete mapping of Trachoma in
some urban areas (West central region) and to address the transborder issues. In fact in some regions that
are boder with Senegal, students leave Senegal to study in Gambia and there is possibility of reinfection of
area considered under control.
STH, LF and SCH
The endemicity of SCH, and STH is poorly known. This poor knowledge of the endemicity of these disease
is favoured by the lack of an NTD control programme in the country as well as the lack of research activities
on these diseases. There is need to carry out mapping of these NTDs in order to have a clear idea about
their endemicity.
Leprosy
The Leprosy programme was established since 1985. This programme is overshadowed by the TB
programme at all levels. There is no clear cut linkages between the leprosy community activities with the
Health facilities. This programme also suffers from a lack of awareness campaigns, lack of funds for special
case finding activities. There is also no leprosy training guidelines for general health workers (GHW)
Rabies
Epidemiological studies on rabies have been constrained by the limited capacity of the Central Veterinary
Laboratory for its surveillance, sampling and testing. These obtacls constitute a major challenge to the
Veterinary services. The Central Veterinary Laboratory is very much dependant on the benevolence of other
regional labs for the diagnosis of rabies which ultimately leaves a gap in the epidemiological data collection
of rabies in the country.There is a need to develop the human capacity in response to this endevour.
SWOT and SWOT counteracting analysis were conducted. The findings are as presented on Tables 7.0 and
7.1. Lymphatic filariasis, Schistosomiasis and Soil Transmitted Helminthiasis in The Gambia did not have
any strength because there are yet to be considered by the Government as priority diseases of public health
importance. These are issues that need to be addressed urgently.

38
Table 6.1: SWOT Analysis: STH / SCH / LF
STRENGTHS WEAKNESS OPPORTUNITIES THREATS
Limited data on the endemicity of STH/SCH/LF
Inadequate trained staff
Identified as a priority diseases under the IDSR strategy Establishment of a Human Resource Directorate
High staff attrition
Absence of a National STH/SCH/LF Control Programs
Availability of a harmonized routine data collection system Existence of a deworming program at the National Nutrition Agency(NaNA) Existence of a Water Sanitation and Hygiene unit under HPD for STH & SCH
Misconceptions about STH/SCH/LF control, treatment and care at National and sub-National levels
There is no budget line for STH/SCH/LF control
Availability of a National Health Strategic Plan
Global economic recession
Limited operational research activities
Establishment of public health research directorate to coordinate NTD research activities
Inadequate laboratory equipment and supplies
Inadequate drugs for STH/SCH control program
An existing PHC system capable of integrating STH/STH intervention
Low community awareness on prevention and control
Table 6.2: SWOT Analysis: TRACHOMA
STRENGTHS WEAKNESS OPPORTUNITIES THREATS
Available data on NTD Inadequate Government Local Funding (GLF)
Funding from international agencies
Staff attrition at the primary level
National coverage Minimal funds for NTD Funding from foreign students
Global economic recession
Partnership is established Establishment of a Human Resource Directorate
PEC integrated with PHC
Regional eye care center established (int.)
Secondary eye care centers established (national)
Training of ophthalmic nurses

39
Table 6.3: SWOT Analysis: LEPROSY
STRENGTHS WEAKNESS OPPORTUNITIES THREATS
MDT services introduced in 1985.
Compromised time management in the combined TB/Leprosy programme by staff at all levels
Joint planning of Training and Field supervision through TB funds
Patient recycling, Delayed Release From Treatment
Co-ordination mechanism established at national and sub national levels
Leprosy programme is overshadowed by the TB programme at all levels
Leveraging some TB budget and plan for some joint activities involving Leprosy programme
High staff attrition
Leprosy services integrated into PHC at village levels
No clear cut linkages of leprosy community activities with the Health facilities
Commemoration of World Leprosy day o 31ST Jan
of every year
Global economic recession
MDT given free of charge
Lack of a curriculum for teaching GHWs on Leprosy topics, especially how to suspect early signs of leprosy.
Opportunity to combined some of the GF
sponsored IEC, and ACSM TB activities at the
village levels exists
National and international training programmes offered to staff
No drugs for reactions
Quality diagnostic services established
Diminished awareness campaigns on Leprosy
National leprosy strategic plan developed
Lack of funds for special case finding activities
Data capture to support the management and treatment of leprosy cases strengthened.
Effective staff supervision in place
Some donor support still available for leprosy control
Training manuals and SOPs developed for leprosy staff
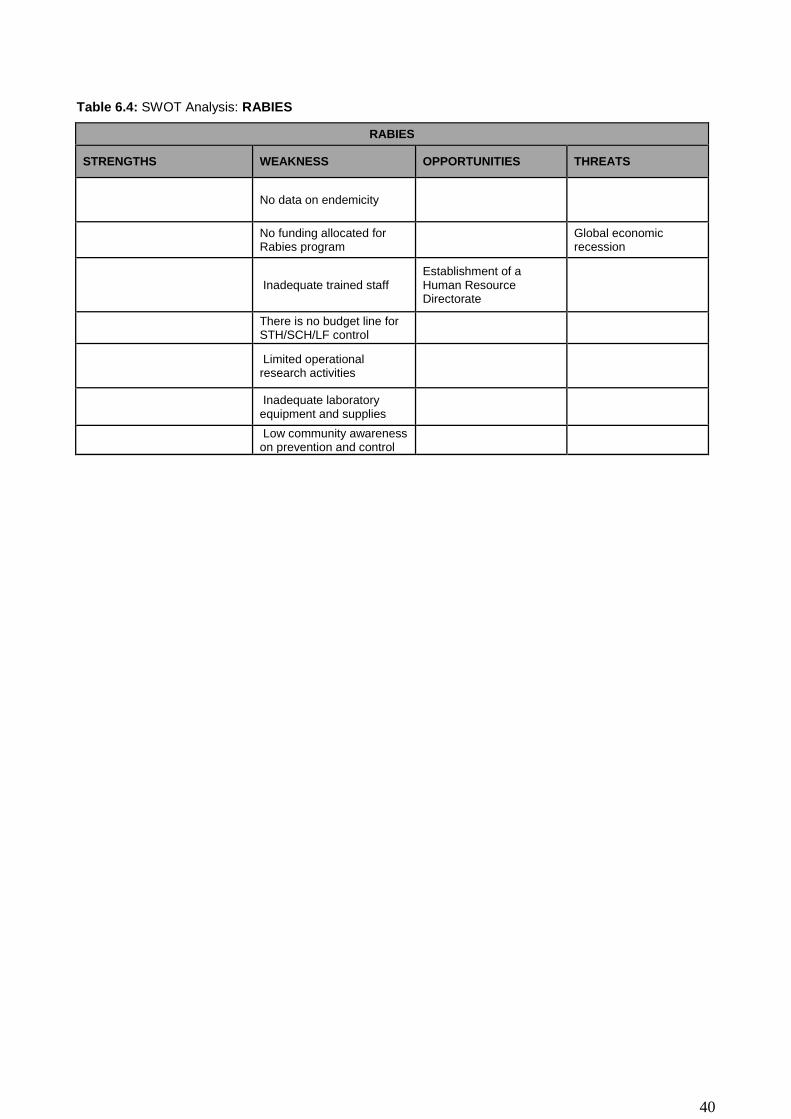
40
Table 6.4: SWOT Analysis: RABIES
RABIES
STRENGTHS WEAKNESS OPPORTUNITIES THREATS
No data on endemicity
No funding allocated for Rabies program
Global economic recession
Inadequate trained staff
Establishment of a Human Resource Directorate
There is no budget line for STH/SCH/LF control
Limited operational research activities
Inadequate laboratory equipment and supplies
Low community awareness on prevention and control
41
PART 2: NTD STRATEGIC AGENDA
2.1 Overall NTD Programme Mission And Goals
Vision: To make The Gambia free of neglected tropical diseases by 2020.
Mission: To implement a cost effective, sustainable and intergrated strategy to control and eliminate
NTDs.
Goals:
1. To improve quality of life and economic growth by reducing the burden of NTDs,
through a well-coordinated national NTD control and elimination program
2. To prevent the occurrence of new infections of all NTDs by 2020 and initiate
appropriate management of all existing cases
2.2 Guiding Principles And Strategic Priorities
The guiding principles for the preparartion of this NTD master plan were the following:
Inclusiveness: a consultantive and multisectoral approach involving all stakeholdres i.e. the
relevant government ministries (Heallth, Education, Agriculture, Economics and Planning, Finance
and Environment) NGOs (Sightsaver, HePDO etc), research institutions (MRC, CIAM) and the UN
agencies.
Transparency: the entire process was transparent and open and allowed divergent views to
reflect the perceptions of NTDs in The Gambia
National ownership: This was considered of paramount importance, with the ministry of health
providing leadership and the necessary logistic support to guide the process.
The plan was informed by the situational analysis which depicted the current status of NTDs in The Gambia,
reviewing existing information on the burden of these diseases and control programmes where they exist.
This formed the basis for determining the strategic priorities for the period 2015 to 2020, outlined in table 7
below.
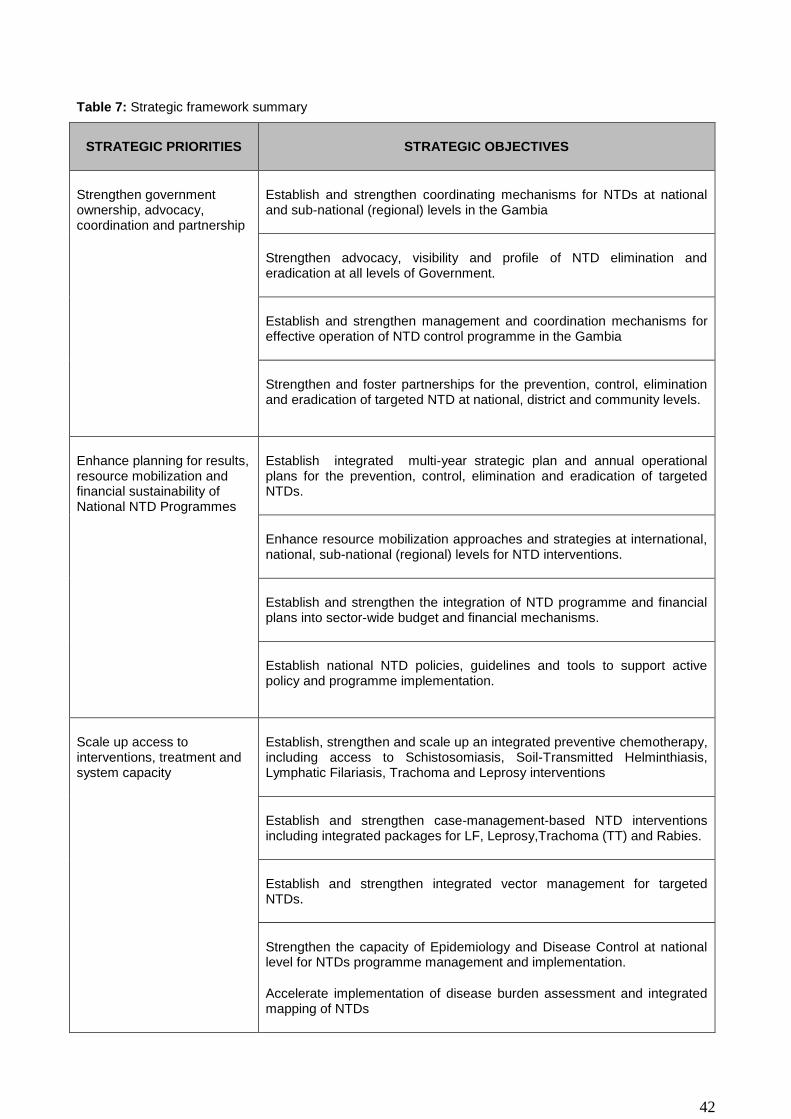
42
Table 7: Strategic framework summary
STRATEGIC PRIORITIES STRATEGIC OBJECTIVES
Strengthen government ownership, advocacy, coordination and partnership
Establish and strengthen coordinating mechanisms for NTDs at national and sub-national (regional) levels in the Gambia
Strengthen advocacy, visibility and profile of NTD elimination and eradication at all levels of Government.
Establish and strengthen management and coordination mechanisms for effective operation of NTD control programme in the Gambia
Strengthen and foster partnerships for the prevention, control, elimination and eradication of targeted NTD at national, district and community levels.
Enhance planning for results, resource mobilization and financial sustainability of National NTD Programmes
Establish integrated multi-year strategic plan and annual operational plans for the prevention, control, elimination and eradication of targeted NTDs.
Enhance resource mobilization approaches and strategies at international, national, sub-national (regional) levels for NTD interventions.
Establish and strengthen the integration of NTD programme and financial plans into sector-wide budget and financial mechanisms.
Establish national NTD policies, guidelines and tools to support active policy and programme implementation.
Scale up access to interventions, treatment and system capacity
Establish, strengthen and scale up an integrated preventive chemotherapy, including access to Schistosomiasis, Soil-Transmitted Helminthiasis, Lymphatic Filariasis, Trachoma and Leprosy interventions
Establish and strengthen case-management-based NTD interventions including integrated packages for LF, Leprosy,Trachoma (TT) and Rabies.
Establish and strengthen integrated vector management for targeted NTDs.
Strengthen the capacity of Epidemiology and Disease Control at national level for NTDs programme management and implementation.
Accelerate implementation of disease burden assessment and integrated mapping of NTDs

43
Enhance NTD monitoring, evaluation, surveillance and operations research
Establish and strengthen the links between National Pharmaceutical Service and Epidemiology and Disease Control for monitoring of for NTD programme performance and outcome including monitoring of adverse drug reaction to NTD medicines and insecticides.
Strengthen the IDSR and HMIS HIMS to ensure effective integration for data management and impact analysis for NTDs in the Gambia.
Strengthen the surveillance of NTDs within PHC for Schistosomiasis, Leprosy, LF sequelae.Post surveillance for HAT,Guinea worm and baseline survey for dengue fever.
Support operational research and documentation of evidence to guide innovative approaches to NTD program interventions

44
Table 8: Summary of NTD disease specific goals and objectives
NTD PROGRAMME AND GLOBAL GOAL
NATIONAL GOAL
OBJECTIVES STRATEGIES DELIVERY CHANNELS
Lymphatic Filariasis Elimination.
Goal:
Elimination of LF as public health problem by 2020.
To eliminate LF in the Gambia by 2020
To Establish LF endemicity maps in the 8 Health Regions by 2015.
To implement MDA in 100% of endemic Regions by 2016.
To achieve 100% therapeutic coverage by the end of 2016.
To reduce morbidity and disability due to LF by 25% (2016)
Conducted first TAS activities in at least 50% of LF endemic regions districts by 2019
To interrupt transmission of LF by 2020.
Mapping of LF
Social mobilization.
Mass drug administration
Surgery, Disability management
Vector control
Surveys
Community
Community
Health facility
Health Facility/Home-based care
Indoor Residual spraying
Aerial Spraying (Destroying breeding sites)
Schistosomiasis Elimination
GOAL:
Elimination of schistosomiasis by 2020
Elimination of schistosomiasis by 2020
To Establish Schistosomiasis endemicity maps in the 8 Health Regions by 2015
To implement MDA in 100% MDA in endemic regions by 2016
Mapping
Social Mobilization
and Mass Drug Administration
Vector control
Survey community (at risk populations e.g. school aged children)
Community
Mollusciding seasonal pools
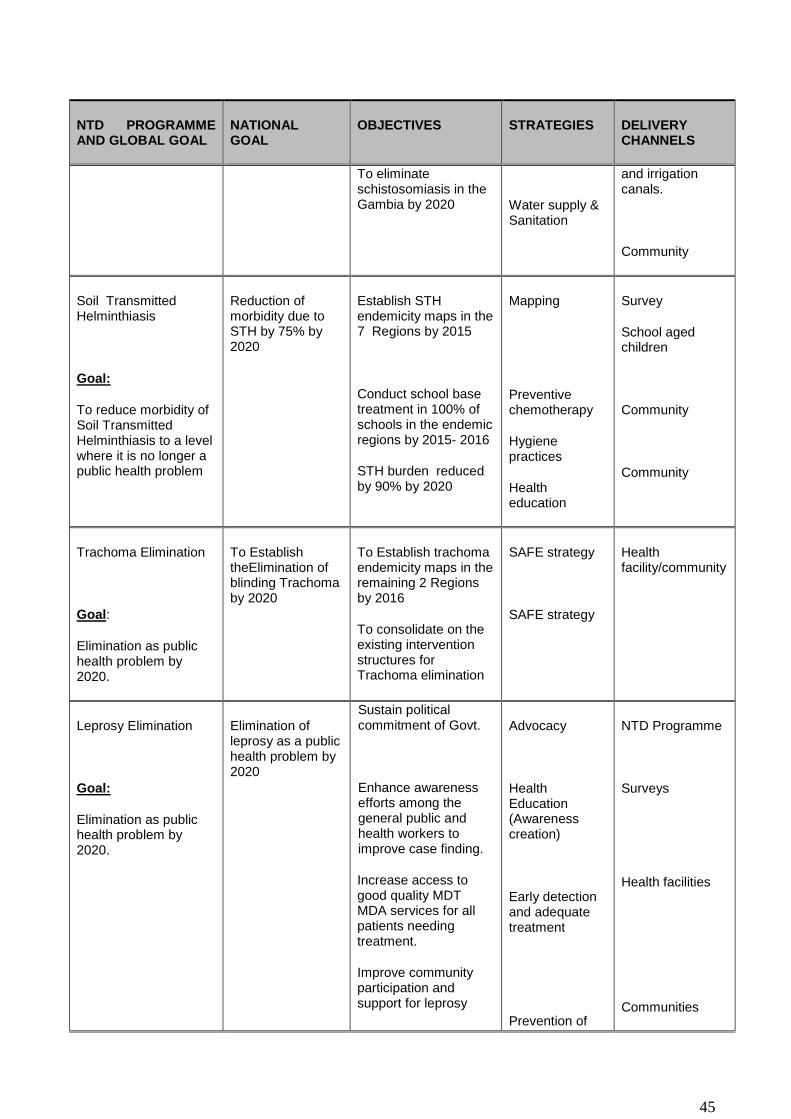
45
NTD PROGRAMME AND GLOBAL GOAL
NATIONAL GOAL
OBJECTIVES STRATEGIES DELIVERY CHANNELS
To eliminate schistosomiasis in the Gambia by 2020
Water supply & Sanitation
and irrigation canals.
Community
Soil Transmitted Helminthiasis
Goal:
To reduce morbidity of Soil Transmitted Helminthiasis to a level where it is no longer a public health problem
Reduction of morbidity due to STH by 75% by 2020
Establish STH endemicity maps in the 7 Regions by 2015
Conduct school base treatment in 100% of schools in the endemic regions by 2015- 2016
STH burden reduced by 90% by 2020
Mapping
Preventive chemotherapy
Hygiene practices
Health education
Survey
School aged children
Community
Community
Trachoma Elimination
Goal:
Elimination as public health problem by 2020.
To Establish theElimination of blinding Trachoma by 2020
To Establish trachoma endemicity maps in the remaining 2 Regions by 2016
To consolidate on the existing intervention structures for Trachoma elimination
SAFE strategy
SAFE strategy
Health facility/community
Leprosy Elimination
Goal:
Elimination as public health problem by 2020.
Elimination of leprosy as a public health problem by 2020
Sustain political commitment of Govt.
Enhance awareness efforts among the general public and health workers to improve case finding.
Increase access to good quality MDT MDA services for all patients needing treatment.
Improve community participation and support for leprosy
Advocacy
Health Education (Awareness creation)
Early detection and adequate treatment
Prevention of
NTD Programme
Surveys
Health facilities
Communities

46
NTD PROGRAMME AND GLOBAL GOAL
NATIONAL GOAL
OBJECTIVES STRATEGIES DELIVERY CHANNELS
activities
Build capacity of health workers on all health facilities to leprosy case finding and management.
Increase collaboration and support of all partners
Strengthen the monitoring, evaluation and supervision of leprosy
Ensure effective integration of Leprosy services and activities to TB component of the NLTBP and to general health services
disabilities
Health Education
Health Promotion and Education
Health Promotion and Education
Training in Mapping of Leprosy
Advocacy
Communities
Training workshops and surveys
NTD Programme
Epidemiological Surveys
Health facilities

47
National Milestones
LF elimination milestones, 2015-2020
Indicators 2015 2016 2017 2018 2019 2020
Completed mapping of LF and determined LF endemic areas and the population at risk
7/7(100%)
Begun implementation of LF MDA in districts requiring LF MDA
7/7 (100%)
Achieving100% geographical coverage in LF endemic districts
7/7
(100%)
7/7
(100%)
7/7 (100%)
7/7 (100%)
7/7 (100%)
Major urban areas with evidence of LF transmission under adequate MDA (Regional coverage more than 65%)
7(100%)
7
(100%)
Conducted more than 5 rounds of MDA in all endemic IUs with regional/State coverage more than 65% and stopped MDA in at least 50% of LF endemic IUs under WHO criteria
7/7
(100%)
7/7 (100%)
Conducted first TAS activities in at least 50% of LF endemic IUs after at least 5 rounds of MDA
7/7(100%)
Conducted and Passed at least 2 TAS activities in 75% of IUs
7 /7 (100%)
Started passive surveillance and vector control activities in at least 75% of IUs.
7/7(100
%) 7/7
(100%)
Present “the dossier “ for in-country verification of absence of LF transmission
7/7 (100%)
Proportion and number of IUs where there is full coverage of morbidity- management services and access to basic care
7/7 (100%)
7/7 (100%)
7/7
(100%)
Proportion and number of IUs where 75% of hydrocele cases benefitted from appropriate surgery
7/7
(100%)
7/7
(100%)
7/7
(100%)
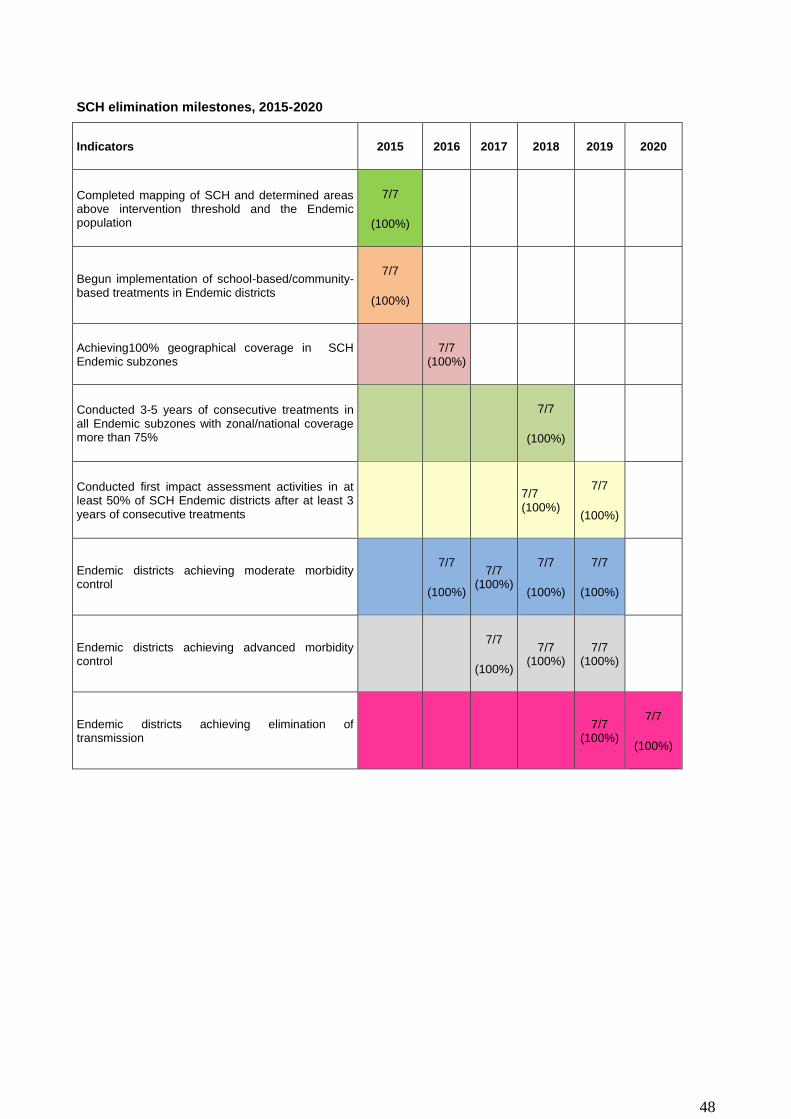
48
SCH elimination milestones, 2015-2020
Indicators 2015 2016 2017 2018 2019 2020
Completed mapping of SCH and determined areas above intervention threshold and the Endemic population
7/7
(100%)
Begun implementation of school-based/community-based treatments in Endemic districts
7/7
(100%)
Achieving100% geographical coverage in SCH Endemic subzones
7/7 (100%)
Conducted 3-5 years of consecutive treatments in all Endemic subzones with zonal/national coverage more than 75%
7/7
(100%)
Conducted first impact assessment activities in at least 50% of SCH Endemic districts after at least 3 years of consecutive treatments
7/7 (100%)
7/7
(100%)
Endemic districts achieving moderate morbidity control
7/7
(100%)
7/7 (100%)
7/7
(100%)
7/7
(100%)
Endemic districts achieving advanced morbidity control
7/7
(100%)
7/7 (100%)
7/7 (100%)
Endemic districts achieving elimination of transmission
7/7 (100%)
7/7
(100%)
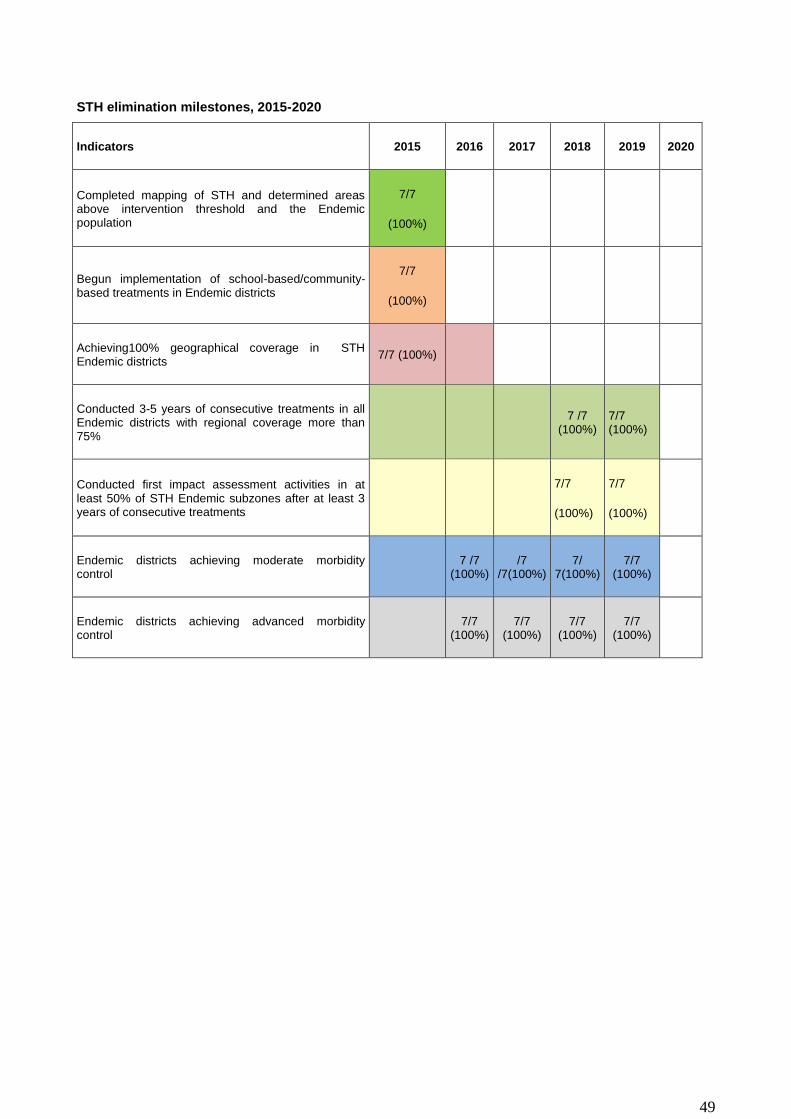
49
STH elimination milestones, 2015-2020
Indicators 2015 2016 2017 2018 2019 2020
Completed mapping of STH and determined areas above intervention threshold and the Endemic population
7/7
(100%)
Begun implementation of school-based/community-based treatments in Endemic districts
7/7
(100%)
Achieving100% geographical coverage in STH Endemic districts
7/7 (100%)
Conducted 3-5 years of consecutive treatments in all Endemic districts with regional coverage more than 75%
7 /7 (100%)
7/7 (100%)
Conducted first impact assessment activities in at least 50% of STH Endemic subzones after at least 3 years of consecutive treatments
7/7
(100%)
7/7
(100%)
Endemic districts achieving moderate morbidity control
7 /7 (100%)
/7 /7(100%)
7/ 7(100%)
7/7 (100%)
Endemic districts achieving advanced morbidity control
7/7 (100%)
7/7 (100%)
7/7 (100%)
7/7 (100%)
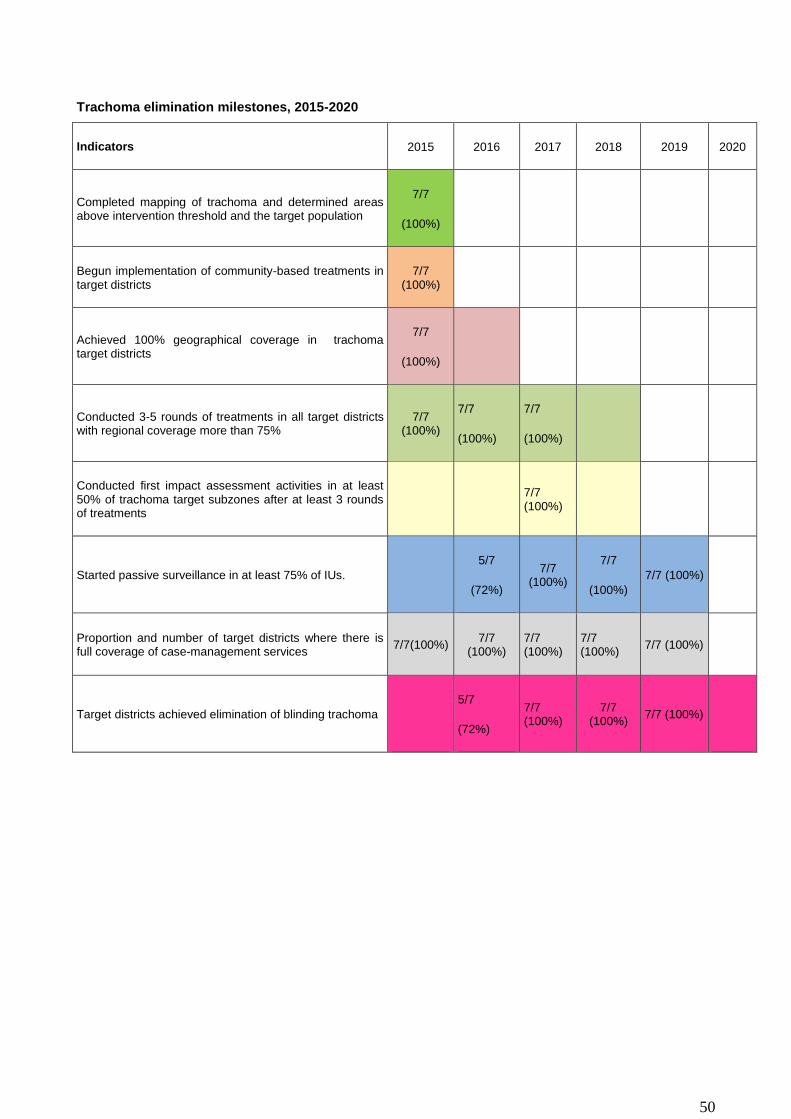
50
Trachoma elimination milestones, 2015-2020
Indicators 2015 2016 2017 2018 2019 2020
Completed mapping of trachoma and determined areas above intervention threshold and the target population
7/7
(100%)
Begun implementation of community-based treatments in target districts
7/7 (100%)
Achieved 100% geographical coverage in trachoma target districts
7/7
(100%)
Conducted 3-5 rounds of treatments in all target districts with regional coverage more than 75%
7/7 (100%)
7/7
(100%)
7/7
(100%)
Conducted first impact assessment activities in at least 50% of trachoma target subzones after at least 3 rounds of treatments
7/7 (100%)
Started passive surveillance in at least 75% of IUs.
5/7
(72%)
7/7 (100%)
7/7
(100%)
7/7 (100%)
Proportion and number of target districts where there is full coverage of case-management services
7/7(100%) 7/7
(100%) 7/7 (100%)
7/7 (100%)
7/7 (100%)
Target districts achieved elimination of blinding trachoma
5/7
(72%)
7/7 (100%)
7/7 (100%)
7/7 (100%)

51
IDM control/elimination milestones, 2015-2020
Indicators 2015 2016 2017 2018 2019 2020
Active Case detection in 100% of Highly endemic districts
7 (100%)
7 (100%)
Passive case detection in 100% of other endemic districts
7 (100%)
7 (100%)
Manage all patients in peripheral health facilities 14
(100%) 14
(100%) 14
(100%)
Refer severe and complicated cases for management at district hospitals and reference centres
7 (100%)
7(100%) 7(100%)
Achieved 100% geographical coverage of SAFE in trachoma target districts
3 (43%) 4 (57%) 7
(100%) 7(100%)
Achieved 100% treatment coverage of identified leprosy cases
7 (100%)
7 (100%)
7 (100%)
7 (100%)
Achieved 100% treatment coverage of identified cases for other CM-NTDs(Rabies)
3 (43%)
4 (57%) 7
(100%) 7
(100%) 7
(100%)
Started passive surveillance in at least 50% of target districts for CM-NTDs targeted for elimination (Leprosy)
3/7 (43%)
4/7 (57%)
7/7 (100%)
7/7 (100%)
7/7 (100%)
Started sentinel site surveillance in at least 50% of target districts for CM-NTDs targeted for elimination (Leprosy)
3/7
(43%)
4/7
(57%)
7/7 (100%)
7/7 (100%)
7 /7 (100%)
Target districts that sustained elimination of leprosy
0/7
(0%)
0/7 (0%)
3/7 (43%)
4/7 (57%)
7/7 (100%)
7/7 (100%)

52
PHASE milestones, 2015-2020
Indicators 2015 2016 2017 2018 2019 2020
1 Proportion and number of Endemic districts with adequate access to clean water for SCH control
2/7 (29%) 2/7 (29%) 2/7
(29%)
3/7 (43%) 4/7 (57%)
5/7 (72%)
2 Proportion and number of Endemic districts with adequate sanitation manipulation for SCH control
3\20 (43%) 7/7 (43%) 7/7 (100%)
7/7
(100%)
7/7
(100%)
7/7 (100%)
3 Proportion and number of Endemic districts with adequate*** environmental manipulation for SCH control
0/7
(0%)
1/7 (14%) 3/7
(43%)
4/7
(57%)
7/7
(100%)
7/7
(100%)
4 Proportion and number of Endemic districts with adequate access to clean water and health education for STH control
2/7
(29%)
3/7 (43%) 4/7
(57%)
7/7 (100%)
7/7 (100%)
7/7 (100%)
5 Proportion and number of Endemic districts with adequate sanitation for STH control
2/7
(29%)
3/7 (43%) 4/7
(57%)
7/7
(100%)
7/7
(100%)
7/7 (100%)
6 Proportion and number of Endemic districts with adequate environmental manipulation for STH control
0 (0%) 2/7
(29%)
3/7
(43%)
4/7
(57%)
7/7
(100%)
7/7
(100%)
7 Proportion and number of Endemic district that certify Open Defecation-free and Health Education for STH control
1/7 (14%) 2/7
(29%)
3/7
(43%)
4/7
(57%)
7/7
(100%)
7/7
(100%)

53
PART 3: OPERATIONAL FRAMEWORK
After outlining the goals, specific objectives and activities of NTDs in part 2 of the master plan, this section
describes how the planned activities will be implemented as well well as the resources needed for the
implementation.
3.1 SCALING UP ACCESS TO NTD INTERVENTIONS, TREATMENT AND SERVICE DELIVERY
CAPACITY
In prelude to the mapping of NTDs that will give a clearer picture of NTDs endemicity in the country this
section gives a detail description of the activities for scaling up the NTD Program. The three main packages
of interventions addressed were developed for the scaling up of NTD programmeincuded Preventive
chemotherapy, Case management/chronic case, Integrated vector management and other “PHASE”*
interventions for the targeted NTDs.
3.1.1 Scaling up preventive chemotherapy interventions
From the paucity of literature available in the country, it is envisaged that after aping of NTDs the most
plausible NTD that will require Mass Drug Administration (MDA) will be Lymphatic Filariasis, STH,
Schistosomiasis and Trachoma. The plan is to use Community and school based campaigns to address the
sub zones that are mapped and found to be positive for these diseases. The type of MDAs to be
implemented is detailed in table 9 and also in annexes 2.3 and 2.4. In addition to the implementing the
proposed MDAs and scaling up the interventions various activities such as training, sensitization,
supervision and drug administration will be conducted (Table 10).
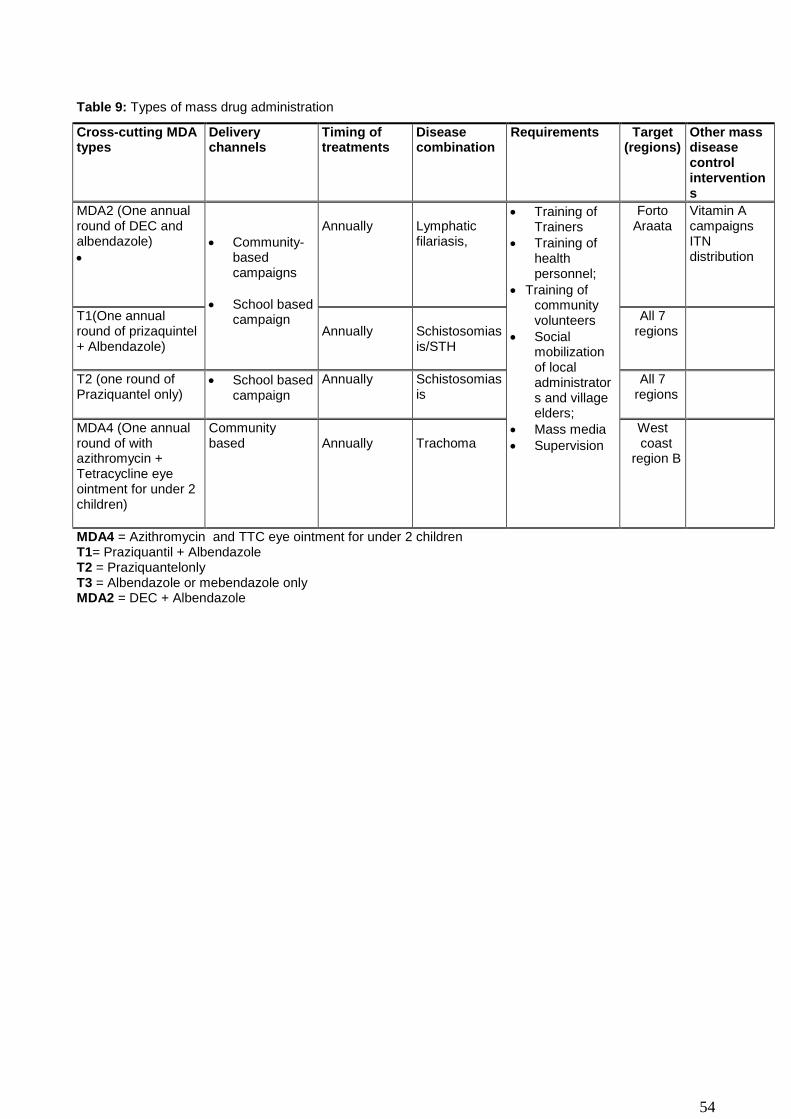
54
Table 9: Types of mass drug administration
Cross-cutting MDA types
Delivery channels
Timing of treatments
Disease combination
Requirements Target (regions)
Other mass disease control interventions
MDA2 (One annual round of DEC and albendazole)
Community-based campaigns
School based campaign
Annually
Lymphatic filariasis,
Training of Trainers
Training of health personnel;
Training of community volunteers
Social mobilization of local administrators and village elders;
Mass media
Supervision
Forto Araata
Vitamin A campaigns ITN distribution
T1(One annual round of prizaquintel + Albendazole)
Annually
Schistosomiasis/STH
All 7 regions
T2 (one round of Praziquantel only)
School based campaign
Annually Schistosomiasis
All 7 regions
MDA4 (One annual round of with azithromycin + Tetracycline eye ointment for under 2 children)
Community based
Annually
Trachoma
West coast
region B
MDA4 = Azithromycin and TTC eye ointment for under 2 children T1= Praziquantil + Albendazole T2 = Praziquantelonly T3 = Albendazole or mebendazole only MDA2 = DEC + Albendazole
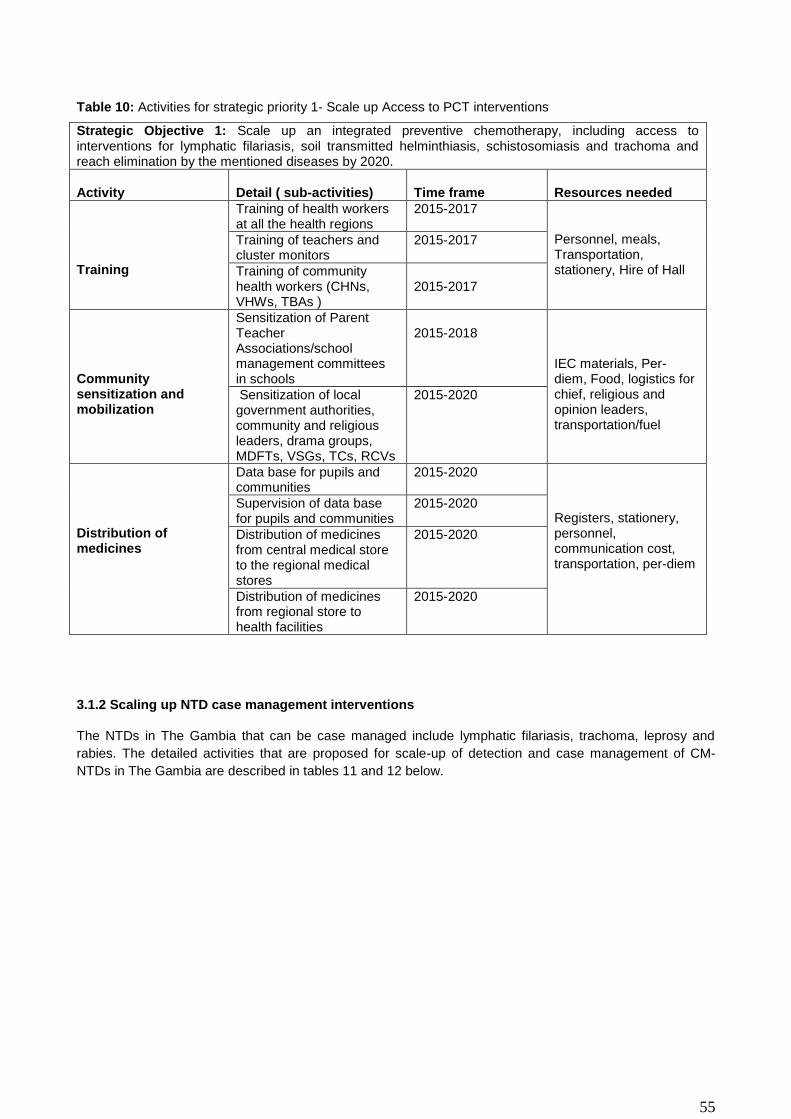
55
Table 10: Activities for strategic priority 1- Scale up Access to PCT interventions
Strategic Objective 1: Scale up an integrated preventive chemotherapy, including access to interventions for lymphatic filariasis, soil transmitted helminthiasis, schistosomiasis and trachoma and reach elimination by the mentioned diseases by 2020.
Activity
Detail ( sub-activities)
Time frame
Resources needed
Training
Training of health workers at all the health regions
2015-2017 Personnel, meals, Transportation, stationery, Hire of Hall
Training of teachers and cluster monitors
2015-2017
Training of community health workers (CHNs, VHWs, TBAs )
2015-2017
Community sensitization and mobilization
Sensitization of Parent Teacher Associations/school management committees in schools
2015-2018
IEC materials, Per-diem, Food, logistics for chief, religious and opinion leaders, transportation/fuel
Sensitization of local government authorities, community and religious leaders, drama groups, MDFTs, VSGs, TCs, RCVs
2015-2020
Distribution of medicines
Data base for pupils and communities
2015-2020 Registers, stationery, personnel, communication cost, transportation, per-diem
Supervision of data base for pupils and communities
2015-2020
Distribution of medicines from central medical store to the regional medical stores
2015-2020
Distribution of medicines from regional store to health facilities
2015-2020
3.1.2 Scaling up NTD case management interventions
The NTDs in The Gambia that can be case managed include lymphatic filariasis, trachoma, leprosy and
rabies. The detailed activities that are proposed for scale-up of detection and case management of CM-
NTDs in The Gambia are described in tables 11 and 12 below.
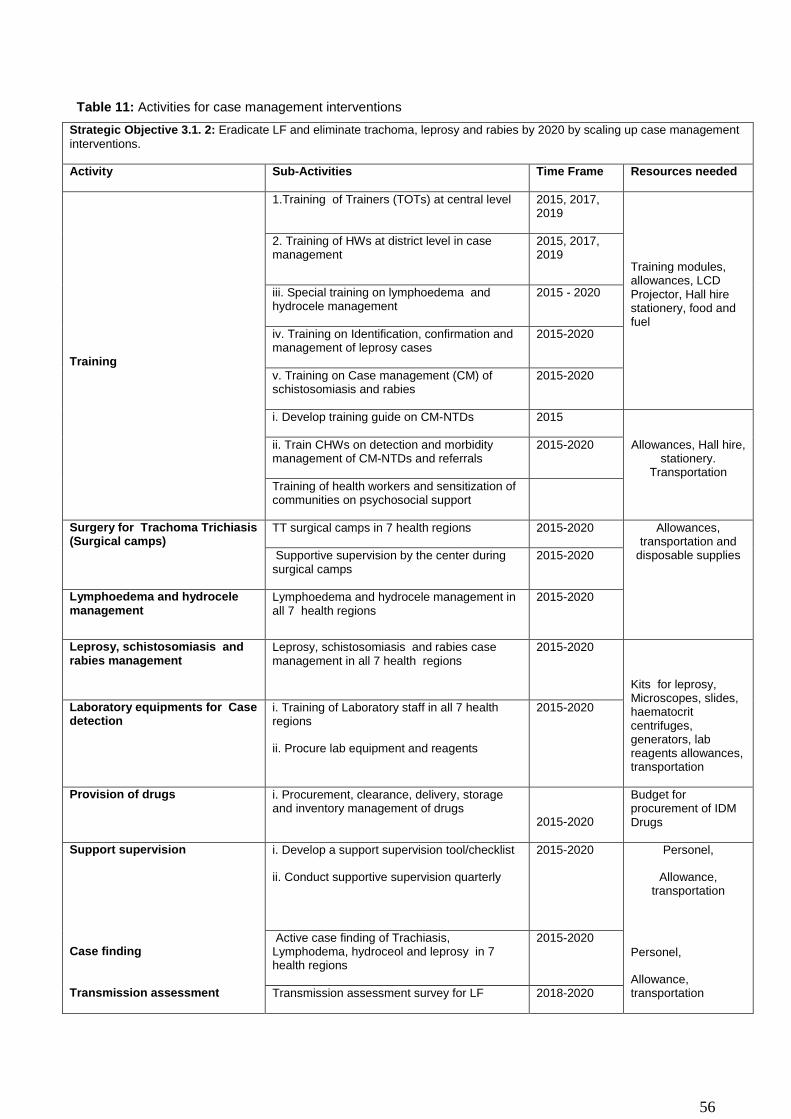
56
Table 11: Activities for case management interventions
Strategic Objective 3.1. 2: Eradicate LF and eliminate trachoma, leprosy and rabies by 2020 by scaling up case management
interventions.
Activity Sub-Activities Time Frame Resources needed
Training
1.Training of Trainers (TOTs) at central level 2015, 2017, 2019
Training modules, allowances, LCD Projector, Hall hire stationery, food and fuel
2. Training of HWs at district level in case management
2015, 2017, 2019
iii. Special training on lymphoedema and hydrocele management
2015 - 2020
iv. Training on Identification, confirmation and management of leprosy cases
2015-2020
v. Training on Case management (CM) of schistosomiasis and rabies
2015-2020
i. Develop training guide on CM-NTDs 2015
Allowances, Hall hire, stationery.
Transportation
ii. Train CHWs on detection and morbidity management of CM-NTDs and referrals
2015-2020
Training of health workers and sensitization of communities on psychosocial support
Surgery for Trachoma Trichiasis (Surgical camps)
TT surgical camps in 7 health regions 2015-2020 Allowances, transportation and
disposable supplies Supportive supervision by the center during surgical camps
2015-2020
Lymphoedema and hydrocele management
Lymphoedema and hydrocele management in all 7 health regions
2015-2020
Leprosy, schistosomiasis and rabies management
Leprosy, schistosomiasis and rabies case management in all 7 health regions
2015-2020
Kits for leprosy, Microscopes, slides, haematocrit centrifuges, generators, lab reagents allowances, transportation
Laboratory equipments for Case detection
i. Training of Laboratory staff in all 7 health regions
ii. Procure lab equipment and reagents
2015-2020
Provision of drugs i. Procurement, clearance, delivery, storage and inventory management of drugs
2015-2020
Budget for procurement of IDM Drugs
Support supervision i. Develop a support supervision tool/checklist
ii. Conduct supportive supervision quarterly
2015-2020 Personel,
Allowance, transportation
Case finding Active case finding of Trachiasis, Lymphodema, hydroceol and leprosy in 7 health regions
2015-2020
Personel,
Allowance, transportation Transmission assessment Transmission assessment survey for LF 2018-2020

57
Table 12: Case management and chronic care
Cross-cutting interventions
NTDs targeted Requirements Other non-NTD opportunities for integration
Hydrocele surgery (hydrocelectomies)
Trichiasis surgery
Lymphatic filariasis hydrocele,
TrachomatousTrichiasis (TT)
Training of Medical Doctors and nurses
Hospitals facilities or appropriate basic facilities with good surgical facilities
Follow up/supervision
Capacity building for basic surgery at the regional level
-Daily hygienic washing of affected limbs.
-Exercise of affected limbs
-Application of antibiotic creams to affected limbs
- skin care
Elephantiasis/lymphedema
Leprosy disability
Washing kits (bucket, towel, soap, clean water, autoclave machines at local health facilities )
Procuring prosthesis for disability due to leprosy
Antibiotics/Vaseline creams
Training of first-line health/community workers, patients and family members
Social support clubs/groups
Follow up/ Supervision
HIV/AIDS social support groups.
Diabetes support groups
Malaria home management
Community TB DOTs
Mental health support groups
Hospitalized treatment (rabies)
Self-administering MDT treatment (leprosy)
Leprosy, Rabies, Hydrocele Specific drugs (tablets and injectables)
Hospitalization facilities
Close monitoring during treatment (in case of schistosomiasis or rabies)
Training of medical staff
Follow up/ supervision
Patient support (financial e.g. transportation to health facility)
Nutritional support
Malaria home case management
Community TB DOTs
HIV/AIDS social support groups.
Community mental health team

58
3.1.3: Scaling up NTD transmission control interventions
Table 13: Intervention packages for Transmission control
Cross-cutting interventions NTDs targeted Requirements Other non-NTD opportunities for integration
Mosquito, snail and dogs control using:
insecticide treated nets (ITN)
In-door residual spraying (IRS)
Mollusciciding
Environmental management
Biological control
Health Education
Culling of rabid dogs
Lymphatic filariasis
Schistosomiasis
Rabies
ITNs, and insecticide treated materials (ITM)
Insecticide chemicals
Larviciding and mollusciciding chemicals
Radio/TV, drama, flyers, posters, leaflets, sms, etc.
Malaria vector control
Improved access and quality of water supply.
Improved sanitations facilities
Environmental management
Health Education
Personal Hygiene
Schistosomiasis
Soil transmitted helminthes
Trachoma
-Sinking bore-holes and pipe-borne water
-Building of proper latrines
-Health Education & Promotion.
-Developmental programmes (e.g. water & sanitation)
-School health and Nutrition programmes
Community Led Total Sanitation (CLTS)
Environmental health
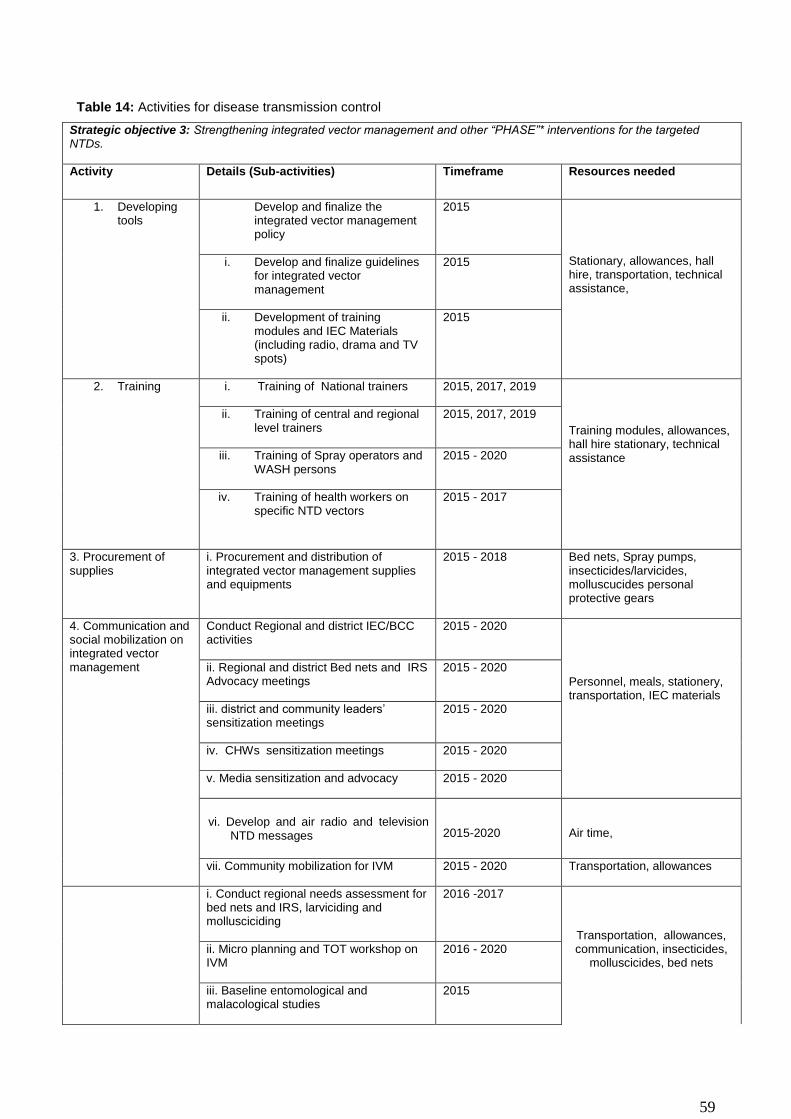
59
Table 14: Activities for disease transmission control
Strategic objective 3: Strengthening integrated vector management and other “PHASE”* interventions for the targeted NTDs.
Activity Details (Sub-activities) Timeframe Resources needed
1. Developing tools
Develop and finalize the integrated vector management policy
2015
Stationary, allowances, hall hire, transportation, technical assistance,
i. Develop and finalize guidelines for integrated vector management
2015
ii. Development of training modules and IEC Materials (including radio, drama and TV spots)
2015
2. Training i. Training of National trainers 2015, 2017, 2019
Training modules, allowances, hall hire stationary, technical assistance
ii. Training of central and regional level trainers
2015, 2017, 2019
iii. Training of Spray operators and WASH persons
2015 - 2020
iv. Training of health workers on specific NTD vectors
2015 - 2017
3. Procurement of supplies
i. Procurement and distribution of integrated vector management supplies and equipments
2015 - 2018 Bed nets, Spray pumps, insecticides/larvicides, molluscucides personal protective gears
4. Communication and social mobilization on integrated vector management
Conduct Regional and district IEC/BCC activities
2015 - 2020
Personnel, meals, stationery, transportation, IEC materials
ii. Regional and district Bed nets and IRS Advocacy meetings
2015 - 2020
iii. district and community leaders’ sensitization meetings
2015 - 2020
iv. CHWs sensitization meetings 2015 - 2020
v. Media sensitization and advocacy 2015 - 2020
vi. Develop and air radio and television NTD messages
2015-2020
Air time,
vii. Community mobilization for IVM 2015 - 2020 Transportation, allowances
i. Conduct regional needs assessment for bed nets and IRS, larviciding and mollusciciding
2016 -2017
Transportation, allowances, communication, insecticides,
molluscicides, bed nets ii. Micro planning and TOT workshop on IVM
2016 - 2020
iii. Baseline entomological and malacological studies
2015

60
5. Conduct Operational Researches
iv. Baseline epidemiological studies 2015
v. Baseline KAP on sanitation and hygiene
2015
vi. Chemical exposure assessment of spray operators
2015 - 2020
vii. Post-IRS and ITNs entomological and malacological studies
2016 - 2020
viii. Post-IRS and ITNs epidemiological studies
2018 - 2020
6. Other PHASE interventions
Conduct source reduction (filling and destroying breeding sites)
2015 - 2020
Transportation, allowances, equipment and supplies,
communication
Larviciding and mollusciciding of breeding sites
2015 - 2020
Health education on vector behavior, sanitation and environmental management
2015 - 2020
Support construction of pit latrines 2015-2020 Collaboration with environmental health division
7. Monitor and evaluate impact of on-going vector control interventions and PHASE activities
i. Monitor quality of ITNs, IRS, larvicides and molluscicides using bio-assay tests
2015 - 2020 Monitoring tools, transportation, allowances, equipment and supplies
ii. Entomological and malacological evaluation studies
2018 Evaluation tools, transportation, allowances,
equipment and supplies iii. Epidemiological evaluation studies
2018
iv. Latrine utilization surveys 2017 Survey tools, transportation, allowances, equipment and supplies v. KAP surveys on hygiene and
sanitation 2017
vi. Conduct dissemination workshops 2017-2020 Stationery, allowances, transportation, airtime
PHASE: Preventive chemotherapy, Health education, Access to safe drinking water, Sanitation and hygiene, and Environmental improvements
3.3 PHARCOVIGILANCE IN NTD CONTROL ACTIVITIES
In order to ensure that good quality of drugs are purchased, properly stored and delivered to the population with satisfactory reporting and management of adverse side effects, the national pharmaco-vigilance system will be strengthened. This section provide detail activities to strengthen pharmacovigilance in the country. These activities are summarised in table 15 below.

61
Table 15: Activities for strengthening pharmaco-vigilance in NTD programme.
Strategic Objective3.3.1: To strengthen the existing functional Pharmacovigilance(PV) to include NTD programme
Activity Details (Sub-activities) Timeframe Resources needed
Sensitization on the role of pharmacovigilance in NTD Control
Train health professionals on Pharmacovigilance principles in the NTD programme.
2015 - 2018 Transportation, DSA, venues, refreshment, meals and stationery materials.
Monitoring and Evaluation of the Pharmacovigilance system
.
Annual National workshop for the PV review
2015 - 2020
Transportation, allowance, and stationary
International meetings, trainings and conferences
Attend regional and international meetings and trainings onpharmacovigilance
2015 - 2020
Accommodation, airfare and DSA for participants
Workshop for integrated work plan
Annual National workshop for integrated work plan between Pharmacovigilance Unit and National NTD programme
2015 - 2019
Accommodation, transportation, DSA, Venues and stationary materials for the workshop participants
Quality Assurance (QA) of Medicines used for MDA in WHO prequalified Laboratories
Send batch samples of the medicines used for MDA in NTD Control to WHO accredited laboratory for quality test
2015 and 2017 Quality test fee & Transportation fee (DHL)
Conduct operational research on patient safety
- Conduct Cohort study on medicines during MDA
2017, 2019
- Develop pre and post questionnaires
- Recruit 10% of the population involved in MDA
- Airtime
Develop Risk Management and Risk minimization plan
- Draft risk minimization plan during MDA
2015 - Stationeries, DSA
3.4 STRENGTHENING CAPACITY AT NATIONAL LEVEL FOR NTD PROGRAMME MANAGEMENT AND IMPLEMENTATION
This section focuses on activities that will be implemented and the resources required to strengthen the
management and operational capacities of the NTD programme staff at various levels.This is required to
scale up and achieve elimination goals. The details are as presented in table 16.Table 17 shows the scaling
up/down of IDM and PCT NTDS.
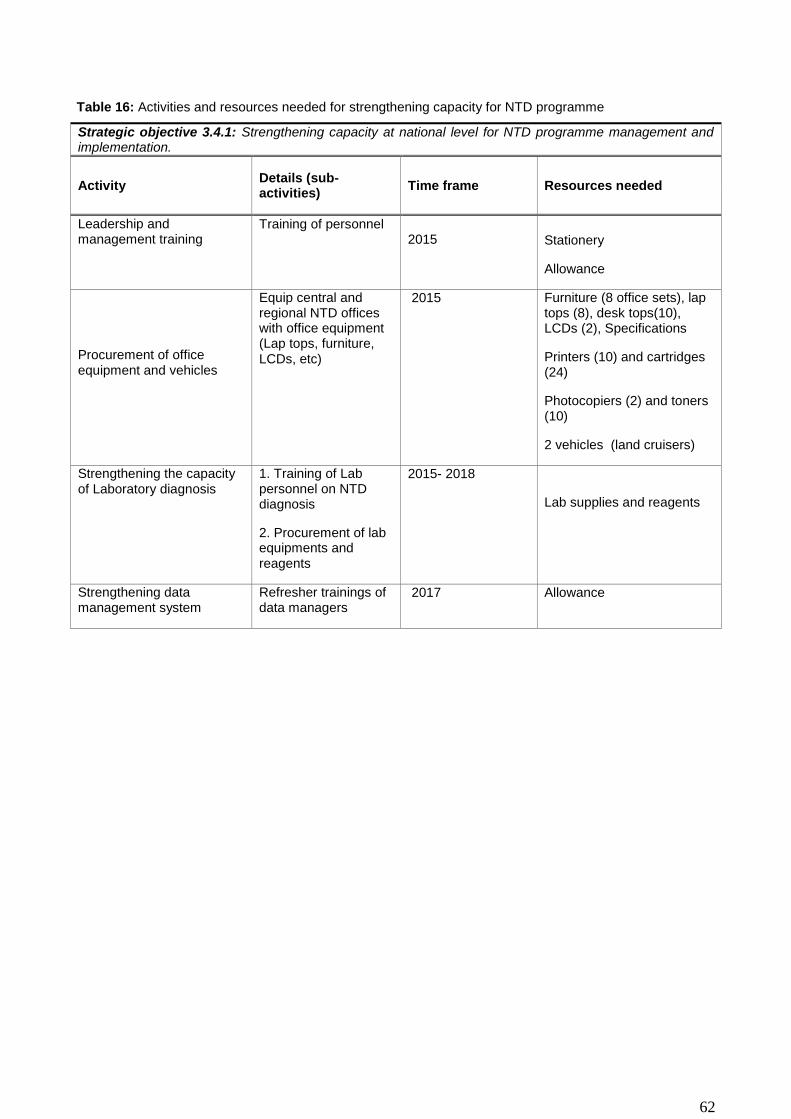
62
Table 16: Activities and resources needed for strengthening capacity for NTD programme
Strategic objective 3.4.1: Strengthening capacity at national level for NTD programme management and implementation.
Activity Details (sub-activities)
Time frame Resources needed
Leadership and management training
Training of personnel 2015 Stationery
Allowance
Procurement of office equipment and vehicles
Equip central and regional NTD offices with office equipment (Lap tops, furniture, LCDs, etc)
2015 Furniture (8 office sets), lap tops (8), desk tops(10), LCDs (2), Specifications
Printers (10) and cartridges (24)
Photocopiers (2) and toners (10)
2 vehicles (land cruisers)
Strengthening the capacity of Laboratory diagnosis
1. Training of Lab personnel on NTD diagnosis
2. Procurement of lab equipments and reagents
2015- 2018
Lab supplies and reagents
Strengthening data management system
Refresher trainings of data managers
2017 Allowance

63
Table 17: Scaling up/scaling down plan.
NTD
Total No. Region requiring MDA
Total at risk population
2015
No. regions
and Total population to be treated
2016
No. regions
and Total population to be treated
2017
No. regions
and Total population to be treated
2018
No. regions
and Total population to be treated
2019
No. regions
and Total population to be treated
2020
No. regions
and Total population to be treated
PCT IMPLEMENTATION (MDA)
LF
5 5 (1628085) 5 (346663) 5 (366076) 5 (386576) 5 (386576) 5 (250000) 5 (1628085)
SCH
7 7(1842938) 7 (433700) 457987 7 (483634) 7 (510718) 7 (250000) 7(1842938)
STH
7 7(1842938) 7 (433700) 457987 7 (483634) 7 (510718) 7 (250000) 7(1842938)
TRA
4 4 (608728) 4(541417) 4 (541417) 4 (571736) 4 (571736) 4 (250000) 4 (608728)
IDM IMPLEMENTATION
Leprosy 5 5 (433700) 5 (34) 5 (40) 5 (43) (5) 39 (5) 37 (5) 41
Rabies 7 7(1882450) 7(200) 7(200) 7(150) 7(100) 7(50 ) 0 (0)
Note: These figureare predictions based on the paucity of information available on NTDs endemicity. These figures may
change after complete mapping of NTDs in the country
3.5 ENHANCING PLANNING FOR RESULTS, RESOURCE MOBILIZATION AND FINANCIAL
SUSTAINABILITY
In order to ensure successful implementation of the NTD Master Plan it will be important to put in place good
strategies to guarantee adequate resource mobilization for financial sustainability. Moreover a good
accountability system for resource monitoring and control in a transparent manner based on justifiable
evidence will be of prime importance. In this section, some key activities have been identified to enable the
achievement of the four strategic objectives for enhancing planning for results, resource mobilization and
financial sustainability of the NTDP. These activities are shown in table 17.
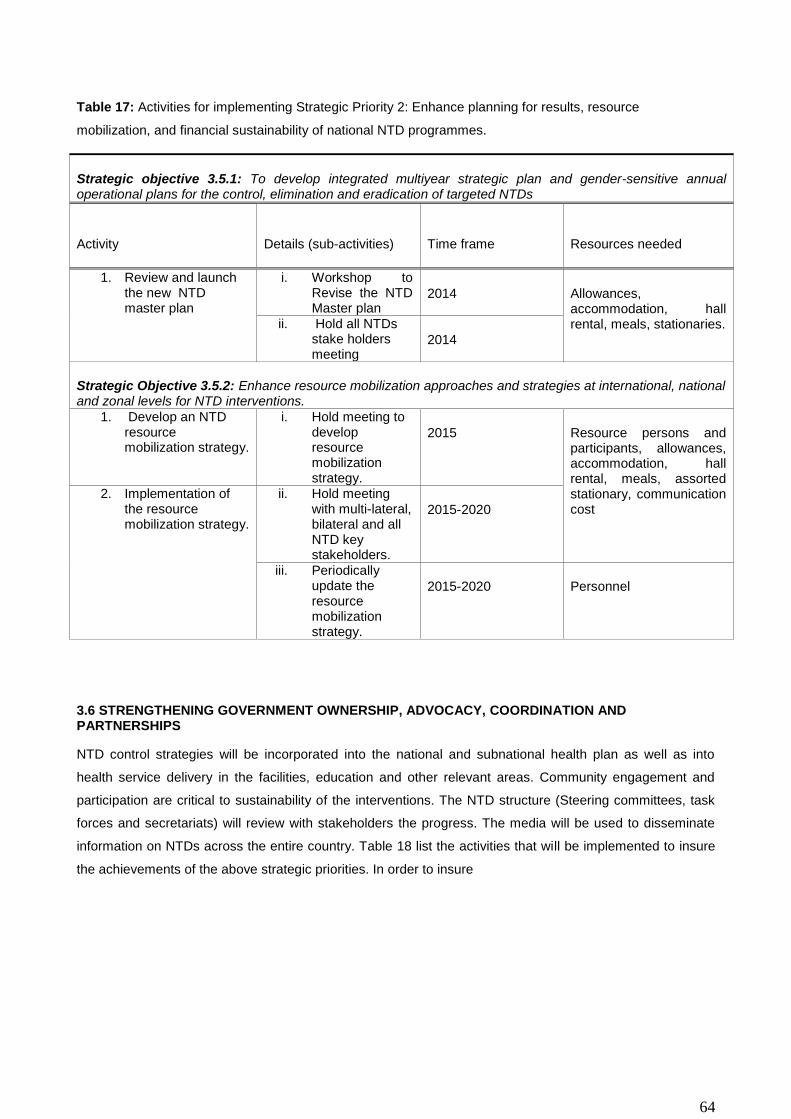
64
Table 17: Activities for implementing Strategic Priority 2: Enhance planning for results, resource
mobilization, and financial sustainability of national NTD programmes.
Strategic objective 3.5.1: To develop integrated multiyear strategic plan and gender-sensitive annual operational plans for the control, elimination and eradication of targeted NTDs
Activity Details (sub-activities) Time frame Resources needed
1. Review and launch the new NTD master plan
i. Workshop to Revise the NTD Master plan
2014 Allowances, accommodation, hall rental, meals, stationaries. ii. Hold all NTDs
stake holders meeting
2014
Strategic Objective 3.5.2: Enhance resource mobilization approaches and strategies at international, national and zonal levels for NTD interventions.
1. Develop an NTD resource mobilization strategy.
i. Hold meeting to develop resource mobilization strategy.
2015 Resource persons and participants, allowances, accommodation, hall rental, meals, assorted stationary, communication cost
2. Implementation of the resource mobilization strategy.
ii. Hold meeting with multi-lateral, bilateral and all NTD key stakeholders.
2015-2020
iii. Periodically update the resource mobilization strategy.
2015-2020 Personnel
3.6 STRENGTHENING GOVERNMENT OWNERSHIP, ADVOCACY, COORDINATION AND PARTNERSHIPS
NTD control strategies will be incorporated into the national and subnational health plan as well as into
health service delivery in the facilities, education and other relevant areas. Community engagement and
participation are critical to sustainability of the interventions. The NTD structure (Steering committees, task
forces and secretariats) will review with stakeholders the progress. The media will be used to disseminate
information on NTDs across the entire country. Table 18 list the activities that will be implemented to insure
the achievements of the above strategic priorities. In order to insure

65
Table 18: Activities for implementing Strategic priority 1: Strengthen government ownership, advocacy,
coordination, and partnership.
Strategic objective 3.6.1: Strengthen coordination mechanism for the NTD control programme at national and sub-national levels
Activity Details (sub-
activities) Time frame Resources needed
1. Establish National coordination mechanisms
Establish NTD steering committees and secretariat at National level
2015
Personnel
Hold quarterly meetings
2015-2020
Allowances, accommodation, hall rental, meals, stationary.
2. National Stakeholders NTD review meeting
All stakeholders meeting including MoH high officials and other line ministry high officials.
2015-2020
Strategic objective 3.6.2: Strengthen and foster partnerships for the control, elimination and eradication of targeted NTDs at national, sub zoba and community levels
Strengthening partnership
Organize advocacy meetings to involve more partners in NTD control
2015-2017
Personnel
Hall rental, meals, assorted stationary
Strategic objective 3.6.3: Enhance high level reviews of NTD programme performance and the use of lessons learnt to enhance advocacy, awareness and effective implementation
1. Conduct annual review meeting.
i. Annual stakeholders meeting for reviewing program performance
2015 -2020 Allowances, accommodation, hall rental, meals, stationary.
ii. Documentation of program performance and dissemination
2015 -2020 Personnel, stationery, communication cost, postal services, printing and dissemination
3.7 MONITORING & EVALUATION
Monitoring and evaluation activities are critical steps in tracking progress of programme implementation. The
NTD Program will be monitored and evaluated periodically to collect data to ensure progress and
achievements. Continuous supervision is required and programme evaluation will be conducted at midterm
and at the end of the programme to assess performance in relation to the goals, objectives and set targets.
Table 19 below describes the activities, sub-activities, time frame and resources needed to achieve the four
strategic objectives.

66
Table19: Strategic priority 4: Enhance NTD monitoring and evaluation, surveillance and operation research.
Strategic Objective 3.7.1: Develop and promote an integrated M&E framework and improve monitoring of NTDs, within the context of national health information systems
Activity
Details (sub-activities)
Time Frame
Resources Needed
Develop an integrated NTD M&E framework
Develop an M&E tool
2015 Experts/honorarium, Stationeries, venues, DSA and Refreshment,
Field testing of the tool
2015
Personnel, stationeries, Airtime, transportation costs,
Monitor drug management inventory and logistics
Supervisory visit on drug management, inventory and logistics
Quarterly personnel, stationeries, transportation costs,
Strategic Objective 3.7.2: Strengthen and foster partnership for the control, elimination and eradication of targeted NTDs at national, regional and communities.
Monitor the coordination and implementation activity of NTD unit
Develop checklist for monitoring indicators, conduct annual monitoring of activities against set indicators
2015-2019
Checklist, stationeries, DSA transportation costs, Airtime,
Monitoring resource use
Tracking of appropriate availability and use of resources; financial report
Annually transportation costs, communication costs,
Strategic Objective 3.7.3: Strengthen surveillance of NTDs and strengthen response and control of epidemic prone NTDs, in particular Dengue and Leishmaniasis, and other IDM NTDs
Strengthen cross border surveillance activities
Cross border advocacy, Identify joint sentinel sites for NTD surveillance; Joint community sensitization; joint supervision,
2017 transportation costs, communication costs, venues, DSA, refreshment,
Strategic Objective 3.7.4: Establish integrated data management systems and support impact analysis for NTD in the WHO African Region as part of the global NTD data management system and global NTD plan
Strengthen integrated data management system (HMIS)
Develop and produce reporting forms, software, field test
2015 Trainings, field testing, Experts/honorarium, printing forms, stationeries, venues, DSA and Refreshment, transportation costs, software, communication costs,
Identify and train NTD Data focal persons
2015
Conduct impact assessment for NTDs
Develop integrated protocol for impact assessment; Conduct treatment coverage impact survey, share best practices
2017 Experts/honorarium, Commodities, (Stationeries, venues, DSA and Refreshment, transportation costs, communication costs); survey cost; dissemination costs of results,
Reporting and submission of results to MoH and WHO/AFRO
Compile report and submit to MoH and WHO
2015-2020 Stationery
3.8. POST INTERVENTION SURVEILLANCE AND INTEGRATION WITHIN PRIMARY HEALTH CARE
The activities to be implemented and the resources needed are elaborated in table 20. Establishing a strong
post-intervention surveillance within the health care system will help to keep in check the diseases
thresholds. Surveillance activities will also be integrated into the national HMIS. The activities that will be
implemented as part of the surveillance of each of the NTDs targeted in this plan are as summarized in
Table 20.

67
Table 20: Activities for surveillance and sustainability
Strategic objectives:3.8.1 Strengthen and sustain the surveillance of NTDs and the response and control epidemic –Prone IDM NTDs(leprosy, Rabies, etc)
Activity Details (Sub-activities) Timeframe Resources needed
Capacity building Review and update
training manuals 2018 Personnel
Strengthen cross
border collaboration
Meeting with NTD affected
neighboring countries
2017-1018 Meeting cost (stationeries,Venues, DSA
and refreshment transportation costs,
Communication costs
Conduct supportive
supervision
Identify sentinel sites for
periodic spots checks
2016-2020 Allowances and refreshment,
transportation cost, communication cost,
printing cost
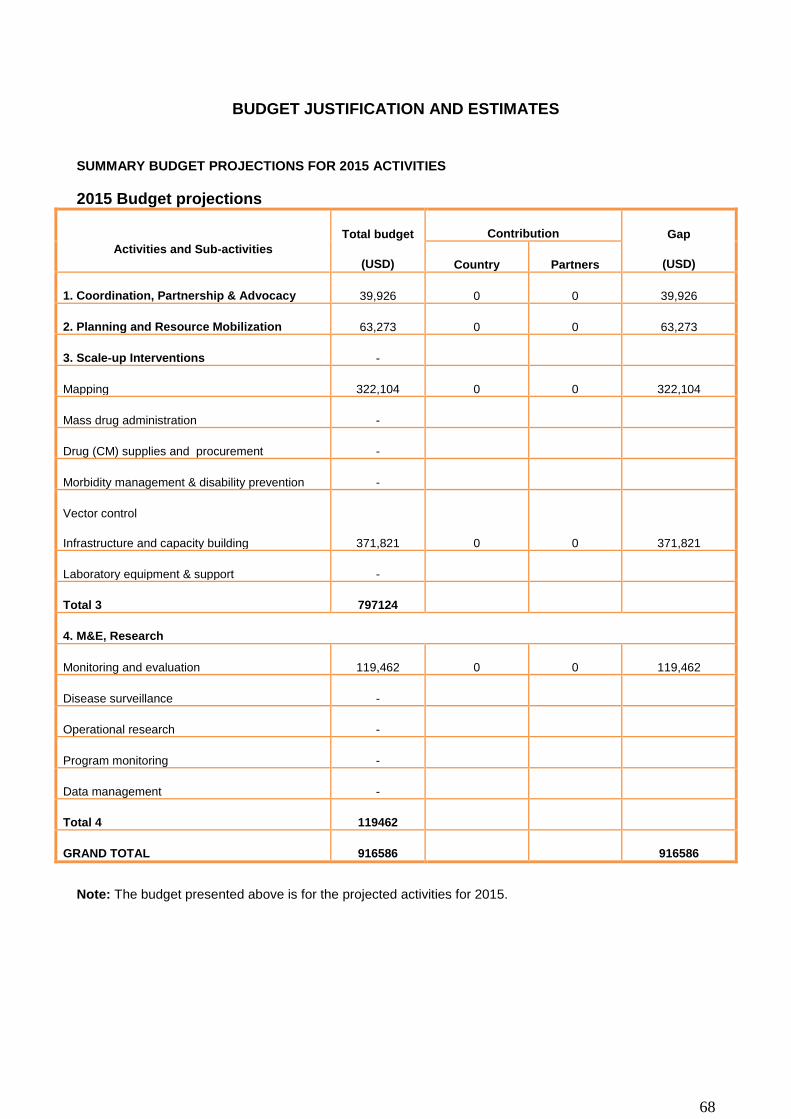
68
BUDGET JUSTIFICATION AND ESTIMATES
SUMMARY BUDGET PROJECTIONS FOR 2015 ACTIVITIES
2015 Budget projections
Activities and Sub-activities
Total budget
(USD)
Contribution Gap
(USD) Country Partners
1. Coordination, Partnership & Advocacy 39,926 0 0 39,926
2. Planning and Resource Mobilization 63,273 0 0 63,273
3. Scale-up Interventions -
Mapping 322,104 0 0 322,104
Mass drug administration -
Drug (CM) supplies and procurement -
Morbidity management & disability prevention -
Vector control
Infrastructure and capacity building 371,821 0 0 371,821
Laboratory equipment & support -
Total 3 797124
4. M&E, Research
Monitoring and evaluation 119,462 0 0 119,462
Disease surveillance -
Operational research -
Program monitoring -
Data management -
Total 4 119462
GRAND TOTAL 916586 916586
Note: The budget presented above is for the projected activities for 2015.

69
ANNEXES
PART I SITUATION ANALYSIS
Annex 1.1. Populations, Villages/communities, Children, Schools, and Health facilities per District and Province or
Region
REGION
No. of communities
or villages Total
Population <
5years >5 - 14 years
Primary schools
No.
Peripheral Health
facilities No.
WEST COAST A 345 699704 139938 107593 208 47
NORTH BANK
WEST 164 112970 22593 26954 64 11
NORTH BANK
EAST 178 79737 15946 25888 54 11
LOWER RIVER 153 82361 16470 22254 78 16
CENTRAL RIVER 655 214853.175 45000 87037 128 22
UPPER RIVER 360 239916 47981 82871 118 21
WEST COAST B 21 413397 82678 81103 115 21
Total 1876 1842938.18 370606 433700 765 149
Annex 1.2. : Distances between main cities and district headquarters of the country
Banjul
15
Kanifing
40
25 Brikama
200
185 145 Mansakonko
60
75 100 70 Kerewan
305
290 255 105 160 Janjabureh
400
385 360 200 255 95 Basse

70
Annex 1.3: Organisational chart of the MoH&SW and the NTD National Programme
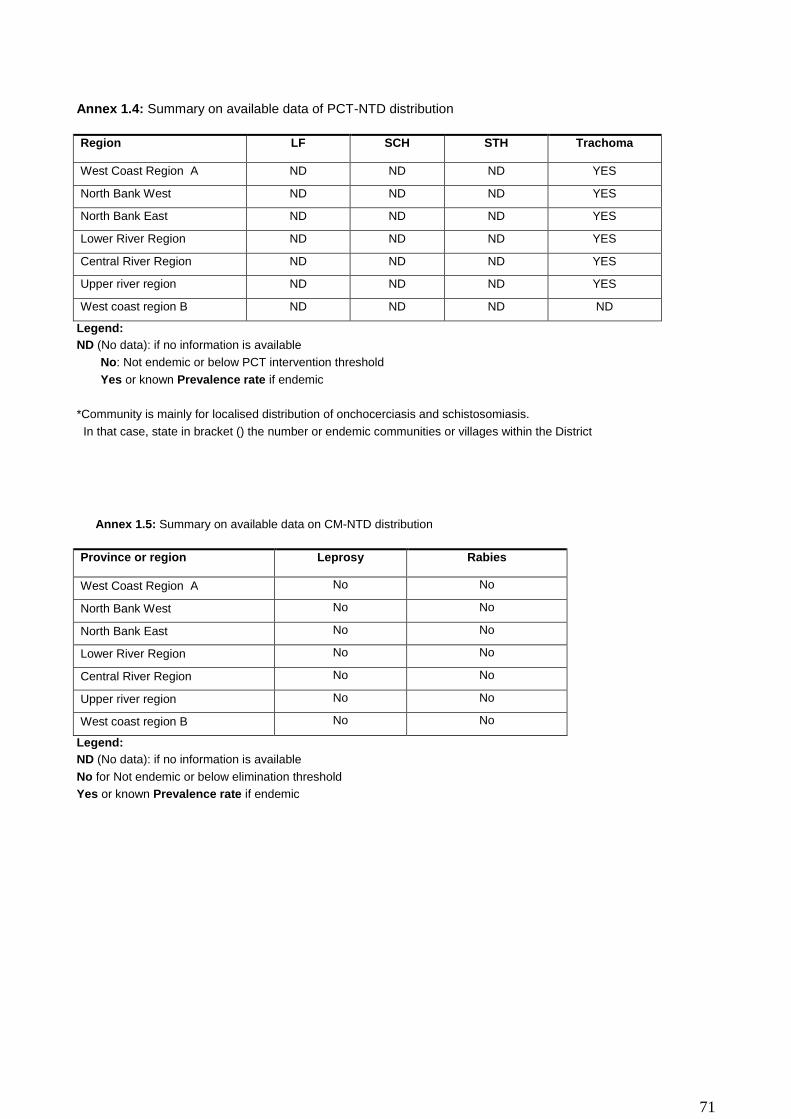
71
Annex 1.4: Summary on available data of PCT-NTD distribution
Region LF SCH STH Trachoma
West Coast Region A ND ND ND YES
North Bank West ND ND ND YES
North Bank East ND ND ND YES
Lower River Region ND ND ND YES
Central River Region ND ND ND YES
Upper river region ND ND ND YES
West coast region B ND ND ND ND
Legend:
ND (No data): if no information is available
No: Not endemic or below PCT intervention threshold
Yes or known Prevalence rate if endemic
*Community is mainly for localised distribution of onchocerciasis and schistosomiasis.
In that case, state in bracket () the number or endemic communities or villages within the District
Annex 1.5: Summary on available data on CM-NTD distribution
Province or region Leprosy Rabies
West Coast Region A No No
North Bank West No No
North Bank East No No
Lower River Region No No
Central River Region No No
Upper river region No No
West coast region B No No
Legend:
ND (No data): if no information is available
No for Not endemic or below elimination threshold
Yes or known Prevalence rate if endemic

72
Annex 1.6: Summary on status of implementation of PCT- NTD interventions in districts
Region LF SCH STH Trachoma
West Coast Region A MAP MAP MAP MAP
North Bank West MAP MAP MAP NO (SAFE)
North Bank East MAP MAP MAP NO (SAFE)
Lower River Region MAP MAP MAP NO (SAFE)
Central River Region MAP MAP MAP NO (SAFE)
Upper river region MAP MAP MAP NO (SAFE)
West coast region B MAP MAP MAP MAP
Legend: ND (No data): if no information is available
No: if no intervention is required
MAP: if mapping is planned or on-going
PCT (1),PCT (2) …PCT (10): if MDA, CDTI or Targeted treatment ison-going. In bracket is the number of round being
conducted. Examples: MDA1 (1) = 1st round of MDA1 (IVM+ALB), T2 (3) = 3rdround of T2 (PZQ in SAC), CDTI (7) =7th
round of IVM in communities for Onchocerciasis

73
Annex 1.7: Summary on status of implementation of CM interventions in districts
Region Leprosy Rabies
West Coast Region A CM1 ACF
North Bank West CM1 ACF
North Bank East CM1 ACF
Lower River Region CM1 ACF
Central River Region CM1 ACF
Upper river region CM1 ACF
West coast region B CM1 ACF
Legend: ND (No data): if no information is available
No: if no active case finding is required (elimination goal is achieved at district level)
ACF: if active case finding is planned or on-going for assessing the disease burden and treating
CM1: if routine case finding and treatment are on-going in peripheral health facilities
CM2: if routine case finding and treatment are on-going and reference to higher levels (hospitals) is organised for
confirmation of diagnosis, treatment and prevention of complications and disabilities
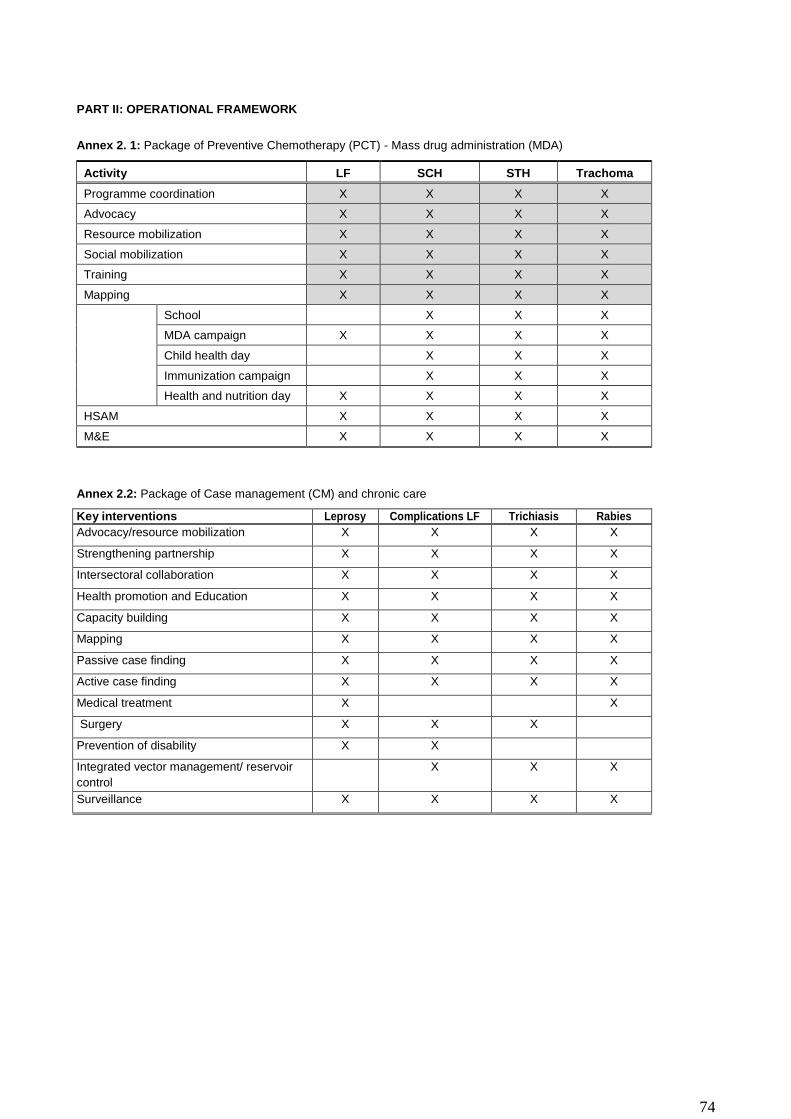
74
PART II: OPERATIONAL FRAMEWORK
Annex 2. 1: Package of Preventive Chemotherapy (PCT) - Mass drug administration (MDA)
Activity LF SCH STH Trachoma
Programme coordination X X X X
Advocacy X X X X
Resource mobilization X X X X
Social mobilization X X X X
Training X X X X
Mapping X X X X
School X X X
MDA campaign X X X X
Child health day X X X
Immunization campaign X X X
Health and nutrition day X X X X
HSAM X X X X
M&E X X X X
Annex 2.2: Package of Case management (CM) and chronic care
Key interventions Leprosy Complications LF Trichiasis Rabies
Advocacy/resource mobilization X X X X
Strengthening partnership X X X X
Intersectoral collaboration X X X X
Health promotion and Education X X X X
Capacity building X X X X
Mapping X X X X
Passive case finding X X X X
Active case finding X X X X
Medical treatment X X
Surgery X X X
Prevention of disability X X
Integrated vector management/ reservoir
control
X X X
Surveillance X X X X
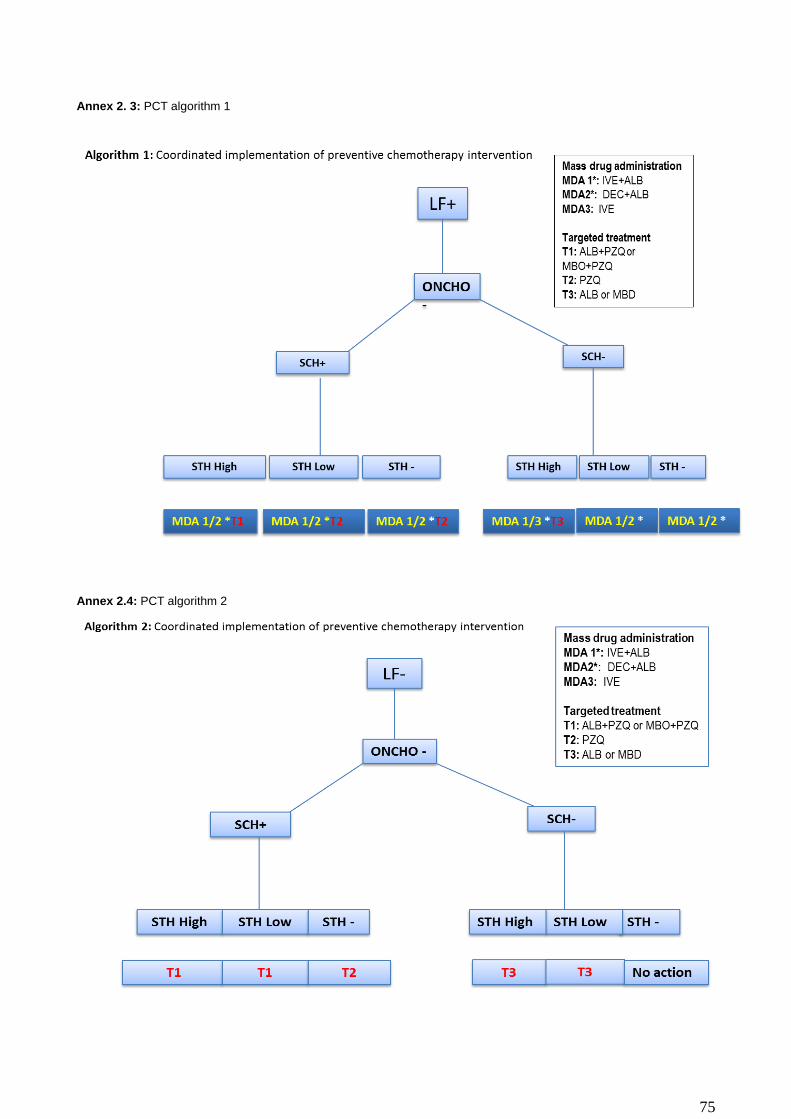
75
Annex 2. 3: PCT algorithm 1
Annex 2.4: PCT algorithm 2
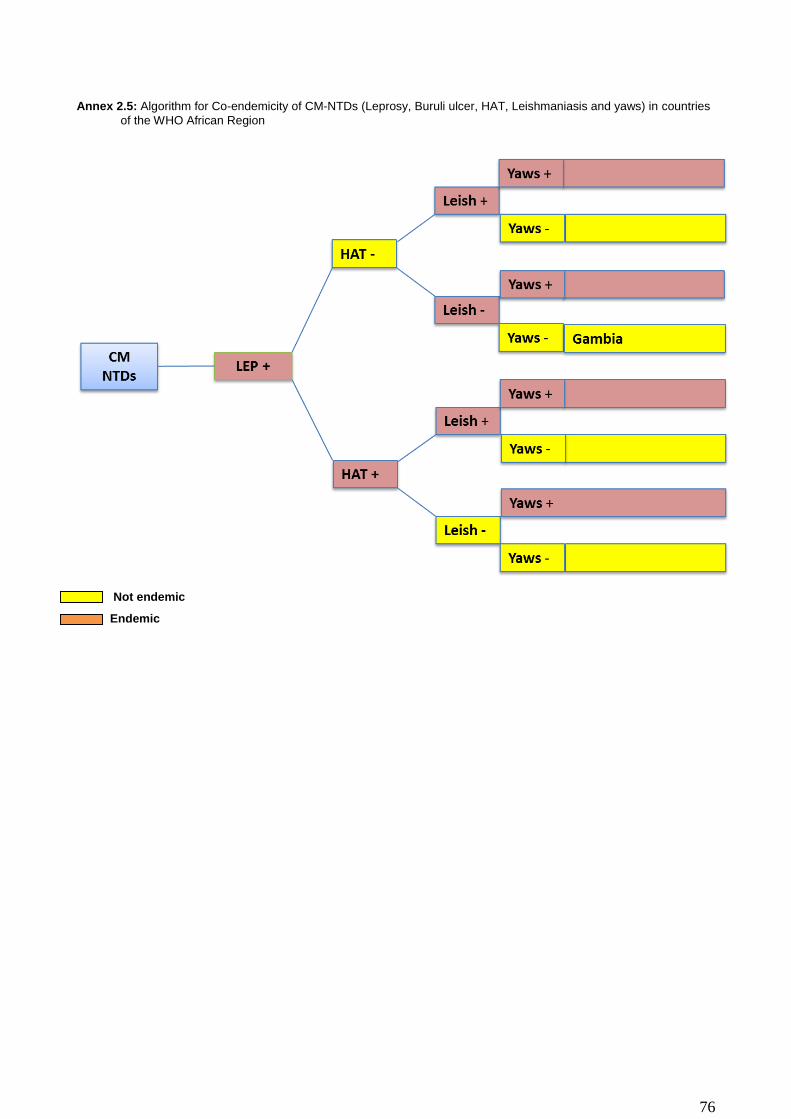
76
Annex 2.5: Algorithm for Co-endemicity of CM-NTDs (Leprosy, Buruli ulcer, HAT, Leishmaniasis and yaws) in countries
of the WHO African Region
Not endemic
Endemic
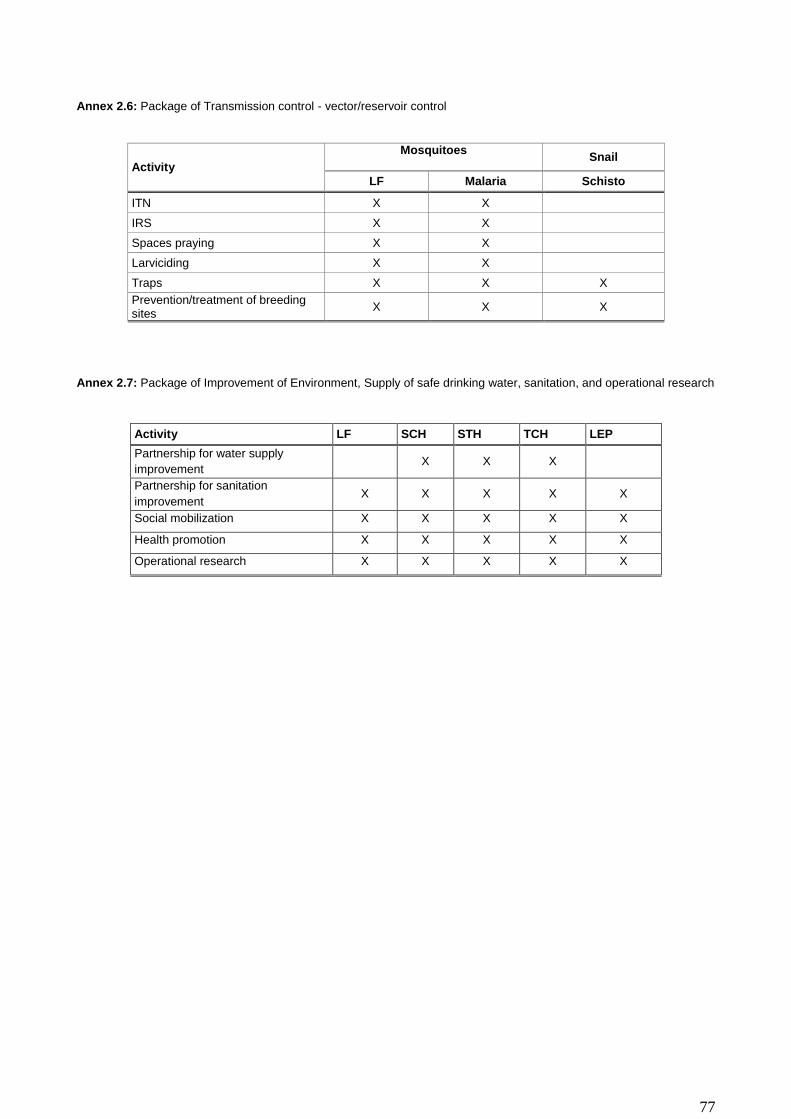
77
Annex 2.6: Package of Transmission control - vector/reservoir control
Activity
Mosquitoes
Snail
LF Malaria Schisto
ITN X X
IRS X X
Spaces praying X X
Larviciding X X
Traps X X X
Prevention/treatment of breeding sites
X X X
Annex 2.7: Package of Improvement of Environment, Supply of safe drinking water, sanitation, and operational research
Activity LF SCH STH TCH LEP
Partnership for water supply
improvement X X X
Partnership for sanitation
improvement X X X X X
Social mobilization X X X X X
Health promotion X X X X X
Operational research X X X X X
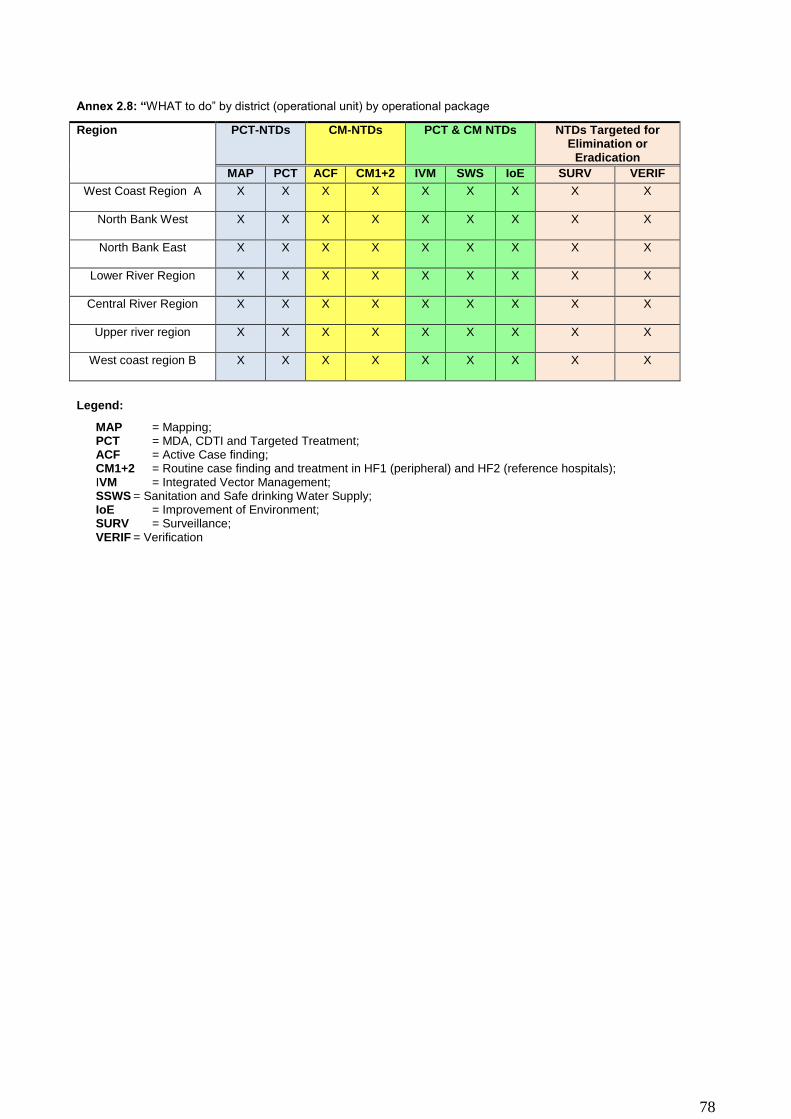
78
Annex 2.8: “WHAT to do” by district (operational unit) by operational package
Region PCT-NTDs CM-NTDs PCT & CM NTDs NTDs Targeted for Elimination or
Eradication
MAP PCT ACF CM1+2 IVM SWS IoE SURV VERIF
West Coast Region A X X X X X X X X X
North Bank West X X X X X X X X X
North Bank East X X X X X X X X X
Lower River Region X X X X X X X X X
Central River Region X X X X X X X X X
Upper river region X X X X X X X X X
West coast region B X X X X X X X X X
Legend:
MAP = Mapping; PCT = MDA, CDTI and Targeted Treatment; ACF = Active Case finding; CM1+2 = Routine case finding and treatment in HF1 (peripheral) and HF2 (reference hospitals); IVM = Integrated Vector Management; SSWS = Sanitation and Safe drinking Water Supply; IoE = Improvement of Environment; SURV = Surveillance; VERIF = Verification
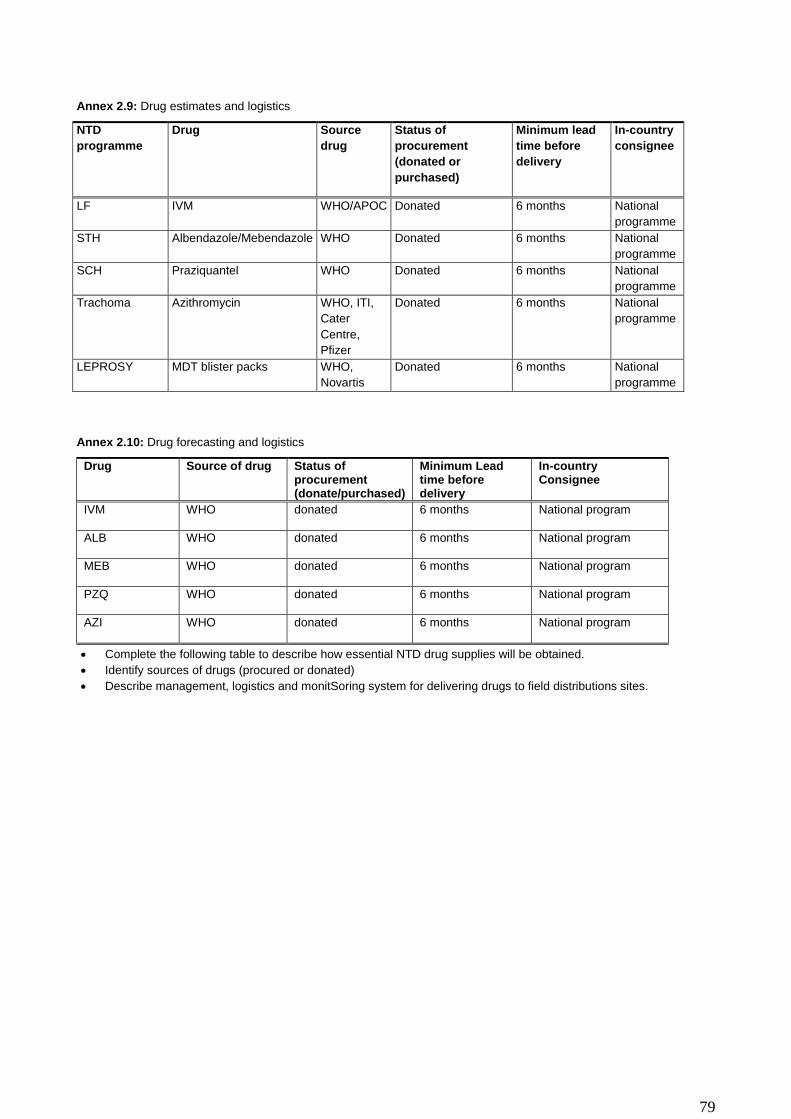
79
Annex 2.9: Drug estimates and logistics
NTD
programme
Drug Source
drug
Status of
procurement
(donated or
purchased)
Minimum lead
time before
delivery
In-country
consignee
LF IVM WHO/APOC Donated 6 months National
programme
STH Albendazole/Mebendazole WHO Donated 6 months National
programme
SCH Praziquantel WHO Donated 6 months National
programme
Trachoma Azithromycin WHO, ITI,
Cater
Centre,
Pfizer
Donated 6 months National
programme
LEPROSY MDT blister packs WHO,
Novartis
Donated 6 months National
programme
Annex 2.10: Drug forecasting and logistics
Drug Source of drug Status of procurement (donate/purchased)
Minimum Lead time before delivery
In-country Consignee
IVM WHO donated 6 months National program
ALB WHO donated 6 months National program
MEB WHO donated 6 months National program
PZQ WHO donated 6 months National program
AZI WHO donated 6 months National program
Complete the following table to describe how essential NTD drug supplies will be obtained.
Identify sources of drugs (procured or donated)
Describe management, logistics and monitSoring system for delivering drugs to field distributions sites.
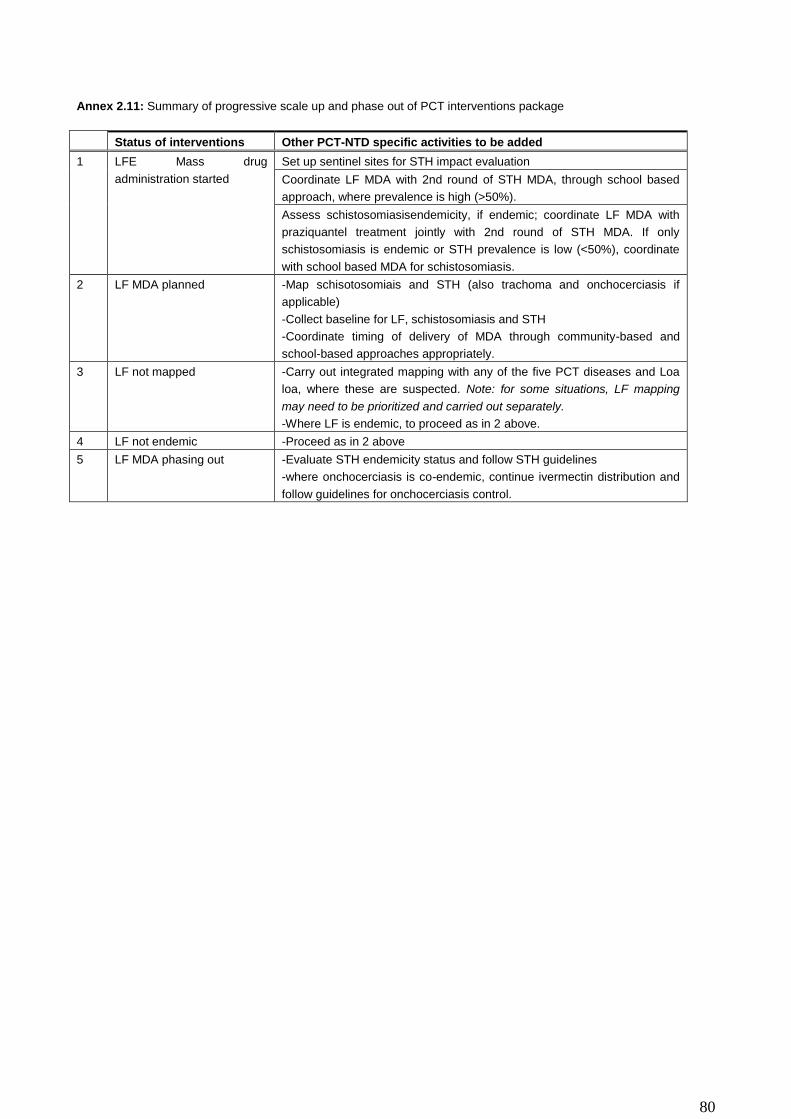
80
Annex 2.11: Summary of progressive scale up and phase out of PCT interventions package
Status of interventions Other PCT-NTD specific activities to be added
1 LFE Mass drug
administration started
Set up sentinel sites for STH impact evaluation
Coordinate LF MDA with 2nd round of STH MDA, through school based
approach, where prevalence is high (>50%).
Assess schistosomiasisendemicity, if endemic; coordinate LF MDA with
praziquantel treatment jointly with 2nd round of STH MDA. If only
schistosomiasis is endemic or STH prevalence is low (<50%), coordinate
with school based MDA for schistosomiasis.
2 LF MDA planned -Map schisotosomiais and STH (also trachoma and onchocerciasis if
applicable)
-Collect baseline for LF, schistosomiasis and STH
-Coordinate timing of delivery of MDA through community-based and
school-based approaches appropriately.
3 LF not mapped -Carry out integrated mapping with any of the five PCT diseases and Loa
loa, where these are suspected. Note: for some situations, LF mapping
may need to be prioritized and carried out separately.
-Where LF is endemic, to proceed as in 2 above.
4 LF not endemic -Proceed as in 2 above
5 LF MDA phasing out -Evaluate STH endemicity status and follow STH guidelines
-where onchocerciasis is co-endemic, continue ivermectin distribution and
follow guidelines for onchocerciasis control.

81
Annex 2.12: Results framework for the WHO-HQ-AFRO-APOC Strategic Plan, 2010–2015
Strategic priorities
Strategic objectives Core indicators
1 Strengthen advocacy, coordination and partnerships
I.Strengthen coordination mechanisms for the NTD control programme at regional, national and subnational levels in the African Region;
II.Strengthen and foster partnerships for the control, elimination and eradication of targeted NTDs at regional, national, district and community levels;
III.Enhance high level reviews of NTD programme performance and the use of lessons learnt to enhance advocacy, awareness and effective implementation of targeted interventions;
IV.Strengthen advocacy, visibility and profile of NTD control elimination and eradication interventions at all levels in the African Region.
Minutes of high-level NTD coordination meetings in countries;
Minutes of partnership events on NTDs;
Number of high level advocacy events on NTDs;
Number of partners involved in NTD programme.
2 Enhance resource mobilization and planning for results in NTD control
I. Support countries to develop integrated multiyear strategic plans and gender-sensitive annual operational plans for the control, elimination and eradication of targeted NTDs
II. Enhance resource mobilization approaches and strategies at regional, national and sub-national levels for NTD interventions
III. Strengthen the integration and linkages of NTD programme and financial plans into sector-wide and national budgetary and financing mechanisms
IV. Support countries to develop and update national NTD policies and elaborate guidelines and tools to guide effective policy and programme implementation
Number of countries with updated national integrated NTD strategic plans;
Number of NTD guidelines and NTD planning and implementation tools developed;
Number of countries with adapted national guidelines and tools;
Presence of NTD budget line;
Total amount of financial resources available for NTD activities;
Percentage of planned NTD funds received.
3 Scale up access to interventions, treatment and NTD service delivery capacity, within the overall health system
I. Scale up an integrated preventive chemotherapy, including access to interventions for lymphatic filariasis, soil transmitted helminthiasis,leprosy, rabies,, schistosomiasis and trachoma;
II. Scale up integrated case-management-based disease interventions, especially do the following: a. Accelerate leprosy elimination activities; b. Intensify schistosomiasis eradication and
surveillance activities in order to interrupt transmission in the two endemic zones (CRR and URR)
c. Enhance Rabies control interventions in humans and dogs;
d. Strengthen national programmes to control leprosy;
e. Strengthen schistosomiasis control and human rabies prevention;
III. Strengthening integrated vector management for targeted NTDs.
IV. Strengthen capacity at the national level for NTD programme management and implementation and accelerate implementation of disease burden assessments and integrated mapping of NTDs;
Number of countries with completed integrated mapping of NTDs;
Drug administration coverage;
National coverage;
Parasitological prevalence;
Percentage of disease-specific targets achieved.
4 Enhance NTD monitoring and evaluation, surveillance and operations research
I.Develop and promote an integrated NTD M&E framework and improve monitoring of NTDs, within the context of national health information systems.This will include strengthening the reporting and response to severe adverse events (SAEs) by leveraging on-going efforts to strengthen pharmacovigilance systems in the African Region;
II.Strengthen surveillance of NTDs and strengthen response and control of epidemic-prone NTDs, in
NTD data completeness and timeliness;
Number of evaluation studies conducted and results disseminated;
Number of operational research studies conducted and results disseminated;
A functional datamanagement
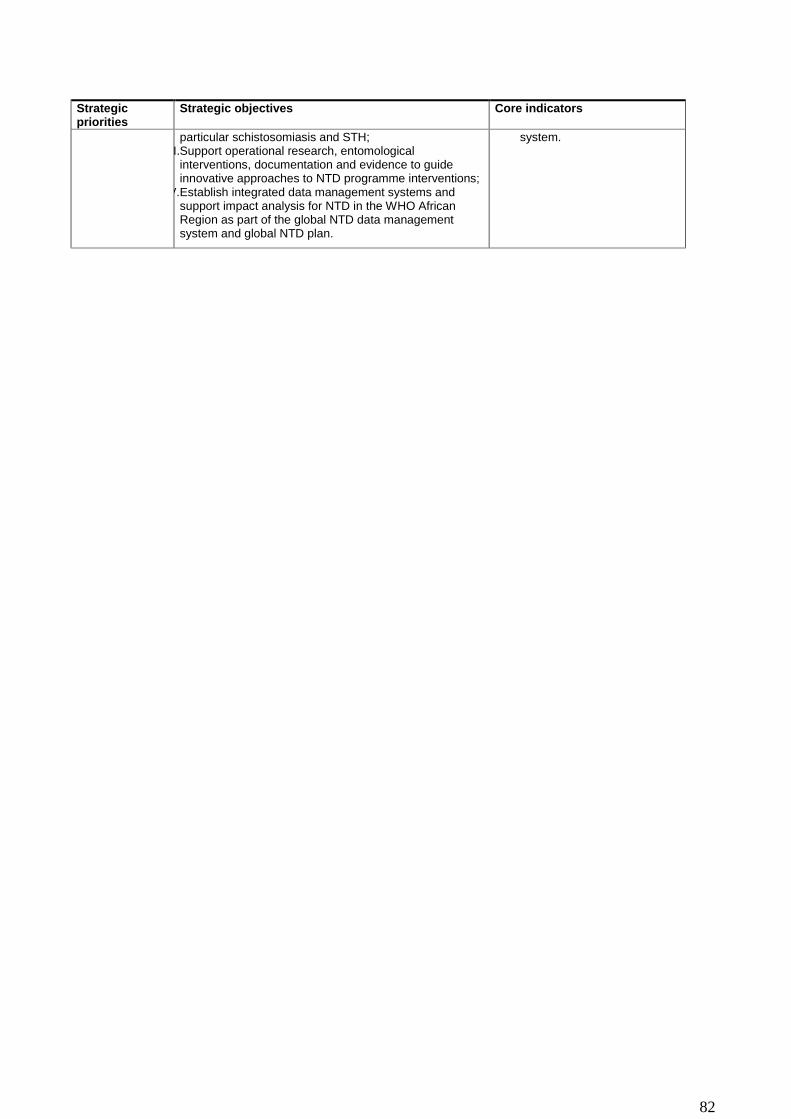
82
Strategic priorities
Strategic objectives Core indicators
particular schistosomiasis and STH; III.Support operational research, entomological
interventions, documentation and evidence to guide innovative approaches to NTD programme interventions;
IV.Establish integrated data management systems and support impact analysis for NTD in the WHO African Region as part of the global NTD data management system and global NTD plan.
system.

83
Bibliography
1. Gambia Government, Maternal Neonatal Survey , 2001
2. Gambia Government, Poverty Reduction Strategy Paper II Report, 2007. 3. Gambia Bureau of Statistic, Multiple Indicator Survey, 2010
4. Gambia Ministry of Health and Social Welfare , National, Health Account Mini Report, NHA 2010
5. Gambia Government, Programme for Accelerated Growth and Employment Report, 2012
6. Gambia Ministry of Health and Social Welfare (2012). Nationwide latrine coverage survey and knowledge, attitude, behavior and practice (KABP) study on water, sanitation and hygiene (WASH)
7. Gambia Ministry of Health and Social Welfare, Health management information system Report, 2012
8. Gambia Ministry of Health and Social Welfare (2012). National Health Policy.
9. Gambia Bureau of Statistic, Demographic and Health Survey, 2013
10. Gambia Bureau of Statistic, Population and Housing Census, 2013
11. Gambia Ministry of Health and Social Welfare, Health Management Information System Report, 2013
12. Gambia Ministry of Health and Social Welfare, Lymphatic Filariasis Transmission Assessment Survey, 2013
13. Gambia Ministry of Health and Social Welfare, Social Determinants of Health Report, 2013.
14. Gambia Ministry of Health and Social Welfare, Summary Report of National trachoma prevalence survey, 2013.
15. Jack, A. D., (1989) ,Chemotherapy in the Control of Schistosoma Haematobium infections in The Gambia: A Primary Health Care Approach. Ph.D thesis, London School of Hygiene and Tropical Medicine.
16. Medical Research Institute, Prevalence of Schistosomiasis Among School Age Children Rural Gambia, 2013
17. Gambia Ministry of Health and Social Welfare (2014). Neglected Tropical Diseases Situational Analysis Report
18. Gambia Ministry of Health and Social Welfare, Health Sector Strategic Plan (NHSSP: 2015-2020), 2014.
19. Gambia Ministry of Health and Social Welfare (2012): The Gambia leprosy strategic The Gambia 5-Year National Leprosy ControlStrategic Plan 2012-2017
20. Njie et al 2014. , (MOHSW, 2013 ), , (MOHSW 2005), (MOHSW 2009).
21. WHO (2012) Guide for preparing a Master Plan for Neglected Tropical Diseases Programme in the African Region,
22. WHO (2013). Regional strategic plan for Neglected Tropical Diseases in the African region 2014-2020. WHO regional office for Africa.
23. WHO (2014). Guide for preparing master plan for national neglected tropical diseases programmes the African region. WHO regional office for Africa.
24. World Bank, International Monetary Fund Staff report, 2011