national transport authority national household … transport authority national household travel...
TRANSCRIPT
Prepared by: Millward Brown for: National Transport Authority, Dun Scèine, Harcourt Lane, Dublin 2. July 2013
National Transport Authority National Household Travel
Survey 2012
Contents Page
National Household Travel Survey 2012 ii
1. Introduction 1
1.1 Background to the Survey 1 1.2 Aims and Objectives 2 1.3 Survey Methodology and Design 3 1.4 Survey Programme 5
2. Survey Sample Details 7
2.1 Household Sample Distribution 7 2.2 Household Sample Demographics 8
3. Analysis of Household Survey Questionnaire 12 3.1 Modes of Transport Used 12 3.2 Trends in Modes Used in Greater Dublin Area 14 3.3 Purpose of Trip 15 3.4 Supporting Details on Household Survey 17 3.5 Long Journeys Taken in Past 3 Months 23
4. Analysis of Travel Diary 25
4.1 Travel Diary Sample 25 4.2 Trip Analysis 28 4.3 Trip Rates 38 4.4 Free Travel Pass Ownership 41 4.5 Trends in Travel Diary Analysis in Greater Dublin Area 42
5. Summary of Key Findings 48
Appendices:
a. Survey Questionnaire b. Travel Diary Example page c. Travel Diary Blank page d. Travel Diary Long Journey page e. Sampling Points f. AECOM Technical Note on diary analysis g. Social Class Definitions h. CSO Data comparisons i. Report on Pilot phase

1 │ Introduction
1
National Household Travel Survey 2012
1. Introduction
1.1 Background to the Survey Between March and November 2012, the National Transport Authority (from here on in referred to as ‘The Authority’) commissioned Millward Brown, supported by AECOM, to undertake a household travel survey throughout the Republic of Ireland. The main purpose of the survey was to obtain essential information on all-day travel patterns and travel behaviour across the country and to build on the information gathered during the 2006 Greater Dublin Area (GDA) Household travel survey. The data collected from the household survey will be used by the Authority in conjunction with travel data from the CSO POWSCAR travel to work and education dataset collected as part of the 2011 Census to update the GDA Transport Model and to update models in the other four regional cities (i.e. Cork, Galway, Limerick and Waterford). The travel data collected from the 2012 National Household Travel Survey, when combined with the Census travel data will provide comprehensive information on travel patterns and travel behaviour across the country for 2012. The all-day travel data obtained from the National Household travel Survey in particular was required to provide information on travel behaviour at off-peak times of the day when trips for purposes other than work or education become more significant. A similar household travel survey was undertaken by the Dublin Transportation Office (DTO) in 2006 covering the GDA only and provided essential travel data for the update of the GDA transport model and the subsequent development of the Draft Transport Strategy for the region. In December 2009, the Authority subsumed the former DTO and later completed the Draft GDA Transport Strategy. Given its national remit, the Authority required the 2012 household survey to provide it with similar travel information to the 2006 survey, but for the country as a whole. Preparations for the 2012 NTA Household Travel Survey began with The Authority appointing Millward Brown, supported by AECOM, to undertake the survey in February 2012. (Millward Brown & AECOM had also undertaken the GDA survey in 2006, albeit under different names). The survey brief included two main survey elements as follows:
The completion of a survey questionnaire through face to face interview with the one person aged 16+ in each household,
A self-completion travel diary of trips made over a two day period, completed by/for all household members aged 4 years and older.
Millward Brown completed the survey work in November 2012 and in March 2013 submitted a full database of trips and survey data to The Authority and presented initial findings to the Board of the Authority. This document is the final report on the survey and includes an analysis of the main survey findings.
1 │ Introduction
2
National Household Travel Survey 2012
1.2 Aims and Objectives Currently the principal source of travel data for the Republic of Ireland is the CSO POWSCAR travel to work and education information from the 2011 Census. However, to be able to plan for all travel needs throughout the day and in particular to enable updates of off-peak transport models in the GDA and the other four regional cities, it was necessary to collect data on all-day travel behaviour throughout the Republic of Ireland and in particular to collect data on travel for purposes other than Work and Education. These include shopping trips, trips on personal business and trips for leisure or sporting purposes. The main aim of the household travel survey was to obtain information on all-day travel behaviour and purposes to complement the information that is available from the 2011 Census. A second aim of the household survey is to obtain essential background information on each household surveyed (including household structure, car ownership, employment status, socio-economic grouping, etc.). This information will be used to better understand travel behaviour when linked to people’s general use of transport modes and their perception of these modes. In early 2012, The Authority drew up a detailed survey brief that included the following specific objectives: to undertake travel surveys in a representative sample of 6,000 households
throughout the Republic of Ireland and in each household to:
complete a survey questionnaire through face to face interview with one member of the household aged 16+, and
distribute self-completion 2-day travel diaries to be completed by members of the household aged 4+,
to ensure that the sample of households surveyed was representative of all
households in terms of geography, household structure, employment status, socio-economic grouping, etc., throughout the Republic of Ireland,
to obtain a representative sample of all-day trips made on all days of the week, including Saturday and Sunday,
to obtain full information on trips made (including trip origin, destination and purpose, trip timing, journey time and travel distance) for all trips over 50 meters or more,
to obtain specific information on longer trips over 30 miles/50km, gathering details for the most resent such trip made,
that completed diaries related to trip making during months when schools are open (March, April, May, June and September, October, November), to avoid peak summer time (July & August) when travel patterns are most affected by holiday activities. Easter holidays were also avoided for the same reason,
through completion of the questionnaire, to obtain general information on the modes of travel people use most often and why, the modes they seldom or never use and their reasons for not using these modes, as well as specific issues such as parking availability and use of car sharing or bike schemes where applicable,
1 │ Introduction
3
National Household Travel Survey 2012
through a combination of travel diary data and questionnaire data to be able to determine the impacts on trip making of household characteristics such as car ownership, employment status, household structure and socio-economic grouping.
1.3 Survey Methodology and Design Research Methodology As stated above, a key aim of the National Household Travel Survey was to obtain a representative sample of all-day every day trip making and to relate travel behaviour to key household characteristics. Following discussions with Millward Brown, it was agreed that the best methodology to obtain this data was to:
Use the most recent available data from the CSO Census data and the An Post GeoDirectory as the basis for selecting a representative sample of 6,000 households across the country, and within each household to:
Complete a survey questionnaire through face to face interview with a nominated person (aged 16+) according to overall population quotas, using a handheld HAPI device for electronic data collection, and to
Distribute self-completion 2-day travel diaries to be completed by members of each household aged 4+, allowing adults to assist younger children. The timing of the placement of these diaries would be such as to give a reasonable distribution of diary entries for each of the seven days of the week.
Design of Questionnaire The household survey questionnaire was designed by Millward Brown in consultation with the Authority. In addition to including questions on the characteristics of the household, it contained questions relating to the general use of transport modes and those they seldom or rarely used. Other topics covered included local services, work/education parking options, use of car clubs, bike schemes, travel tickets and incidence of long trips by mode, as appropriate. Among the topics on the survey questionnaire were:
Gender, age, economic status, socio-economic grouping of the household representative,
Household structure, i.e. the number of household members in different age categories,
Number of cars and vans available for use by household members and the number and type of driving licences owned by household members,
Modes of travel generally used by the respondent categorised by the most often used, those sometimes used and those rarely or never used,
Reasons for rarely or never using specific modes of travel,
A copy of the final household questionnaire is provided in the appendices. Design of Travel Diary As the 2-day travel diaries were to be self-completed by household members aged 4+, careful attention was given to the design of the diaries and the layout and content of diary questions. This design was completed in consultation with AECOM, who are experts in this area. The diaries were designed in the form of an A5 booklet with clear instructions on the back as to how the diaries were to be completed and additional information provided in the accompanying letter. Details were also included on the Authority’s website with a list of
1 │ Introduction
4
National Household Travel Survey 2012
frequently asked questions (FAQs) and examples of how to complete the diary. For each trip to be recorded in the diary, the following data was requested:
The origin and destination of each trip (full address details in each case),
The purpose of the trip (e.g. commute to work or school, shopping, sport, leisure, etc.),
Trip start and end times,
The mode of travel used – if more than one mode was used, the mode used and the distance travelled on each trip leg,
Trip distance in kilometres and time taken,
The number of people who travelled together on each trip: adults, children and those from other households,
For those aged 17 or over: If the trip was made by car, were they a car driver or car passenger and was parking at the destination free or paid for.
For those aged 17 or over: If the trip was not made by car, was a car available to the person to make the trip,
A sample travel diary with examples of how to complete entries is contained in the appendices.
1 │ Introduction
5
National Household Travel Survey 2012
1.4 Survey Programme Pilot Phase Millward Brown were tasked with undertaking a pilot survey in a minimum of 80 selected households in urban, semi urban and rural areas at locations across Ireland during end of March and early April 2012. The final tally amounted to 98 households, with 224 placed and 195 completed household diaries, a diary completion rate of 87% within the limited pilot timeframe. This averaged just under 2 completed valid diaries per household. The purpose of the pilot survey was to test the survey methodology and the wording and content of the questionnaire and travel diary in order to improve the efficiency before the full rollout of the survey programme. The pilot surveys were successful in helping to identify a small number of changes in the wording and content of the questionnaire and travel diaries and clarification on instructions. For example, the interviewers suggest that on the example pages, the examples should be more generic, and a couple of spaces could be left for the interviewers to show how examples should be completed. The completion pages were also amended to make capture of the main addresses easier and the instructions on the long trip pages were enhanced. The survey methodology - face to face interviewer administered completion of the survey questionnaires captured by electronic handled HAPI device and respondent self-completion of the travel diaries - also proved successful, and, as these were in line with the 2006 methodology, no change in survey methodology was required for the main fieldwork phase. A written report on the pilot phase was completed for reporting purposes and is
included in the appendices. Fieldwork Phase The main survey fieldwork began during the second half of April 2012, in order to take on board the pilot findings and to avoid the Easter holiday period. The survey ran throughout May and June and the first phase was completed at the end of June. A total of 2,801 household surveys were completed in this first phase, resulting in a total of 7,001 dairies placed and just under 5,200 diaries returned. Interviewing was not conducted in July and August 2012. The survey fieldwork recommenced in early September, ran throughout October and was completed in November 2012. By the end of interviewing the final tally of household surveys was 6,013 completed surveys, almost 15,000 diaries placed and close to 11,000 returned household diaries. This is a diary completion rate of 72% among householders and a rate of 1.8 per household, well in excess of the completion rate in 2006. Data processing Phase Following the completion of survey fieldwork, the data from the questionnaires and travel diaries was collated into a single database to be provided to the Authority, and an analysis of the household survey and diary travel data was conducted, the results of which are summarised in this report. There was some further editing of data during the collation by AECOM resulting in 10,822 diaries being included in the database from 4,793 households. This produced an 80% household diary completion rate, based on those who participated in the survey also completing and returning usable diaries within the time period allowed.
1 │ Introduction
6
National Household Travel Survey 2012
The remainder of this report presents the results of the detailed analysis by Millward Brown on the household respondent survey questionnaire (Section 3) and by AECOM on the household travel diaries (Section 4). Preceding this, in Section 2, is an analysis of the survey sampling and comparison to CSO population statistics. Section 5 contains Millward Brown’s key findings from the research overall. Subsequent to this report The Authority has undertaken its own detailed analysis of the travel diary part of the household survey. Further editing of the dataset by The Authority has resulted in a slightly different tally of trips when compared to both Millward Brown and AECOM analysis, but the exclusions were minimal and do not affect the overall survey findings. Some of these exclusions are, for example, where blank diary pages have been treated as ‘did not record’ rather than ‘did not travel’ and therefore have been excluded in the Authority’s calculation of daily trip rates. These data checks at the various stages of the Millward Brown survey fieldwork, AECOM data entry and the Authority’s further data editing have resulted in the final total number of trips registered by the Authority as 57,095 from 9,774 valid diaries. In autumn 2013, the Authority will publish a report on its own analysis of the travel diary part of the Household Survey.
2 │ Survey Sample Details
7
National Household Travel Survey 2012
2. Survey Sample Details
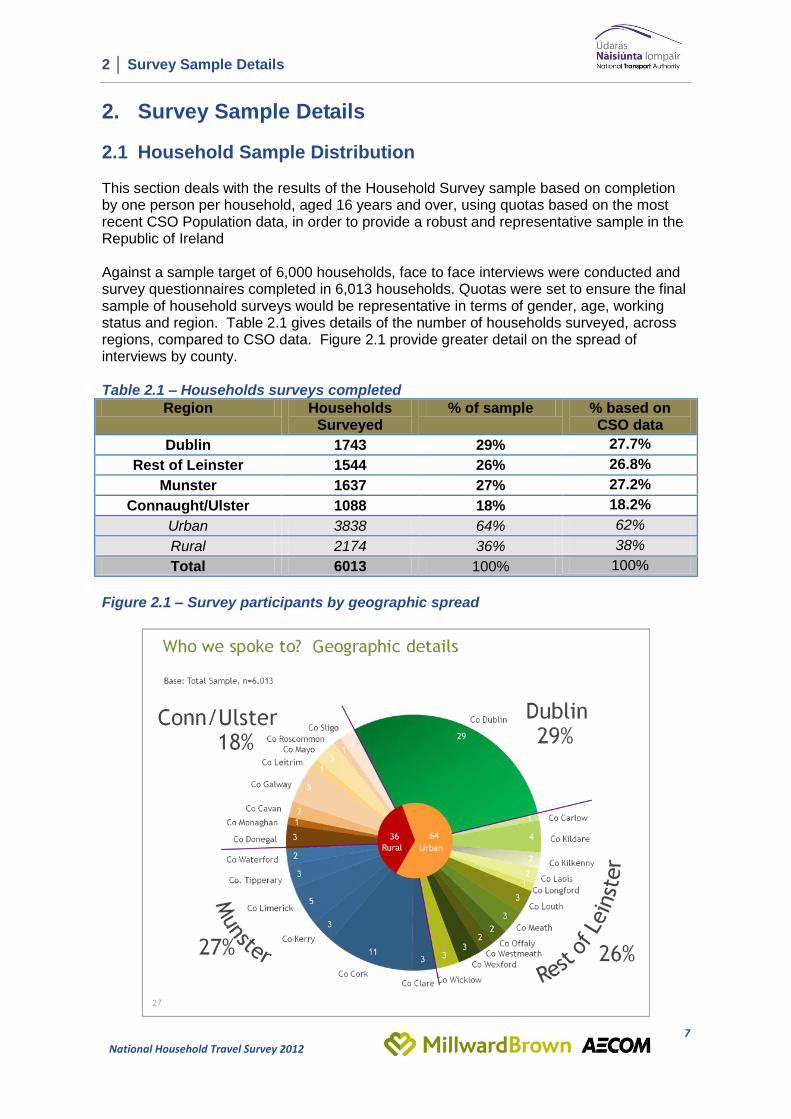
2.1 Household Sample Distribution This section deals with the results of the Household Survey sample based on completion by one person per household, aged 16 years and over, using quotas based on the most recent CSO Population data, in order to provide a robust and representative sample in the Republic of Ireland Against a sample target of 6,000 households, face to face interviews were conducted and survey questionnaires completed in 6,013 households. Quotas were set to ensure the final sample of household surveys would be representative in terms of gender, age, working status and region. Table 2.1 gives details of the number of households surveyed, across regions, compared to CSO data. Figure 2.1 provide greater detail on the spread of interviews by county. Table 2.1 – Households surveys completed
Region Households Surveyed
% of sample % based on CSO data
Dublin 1743 29% 27.7%
Rest of Leinster 1544 26% 26.8%
Munster 1637 27% 27.2%
Connaught/Ulster 1088 18% 18.2%
Urban 3838 64% 62%
Rural 2174 36% 38%
Total 6013 100% 100%
Figure 2.1 – Survey participants by geographic spread
2 │ Survey Sample Details
8
National Household Travel Survey 2012
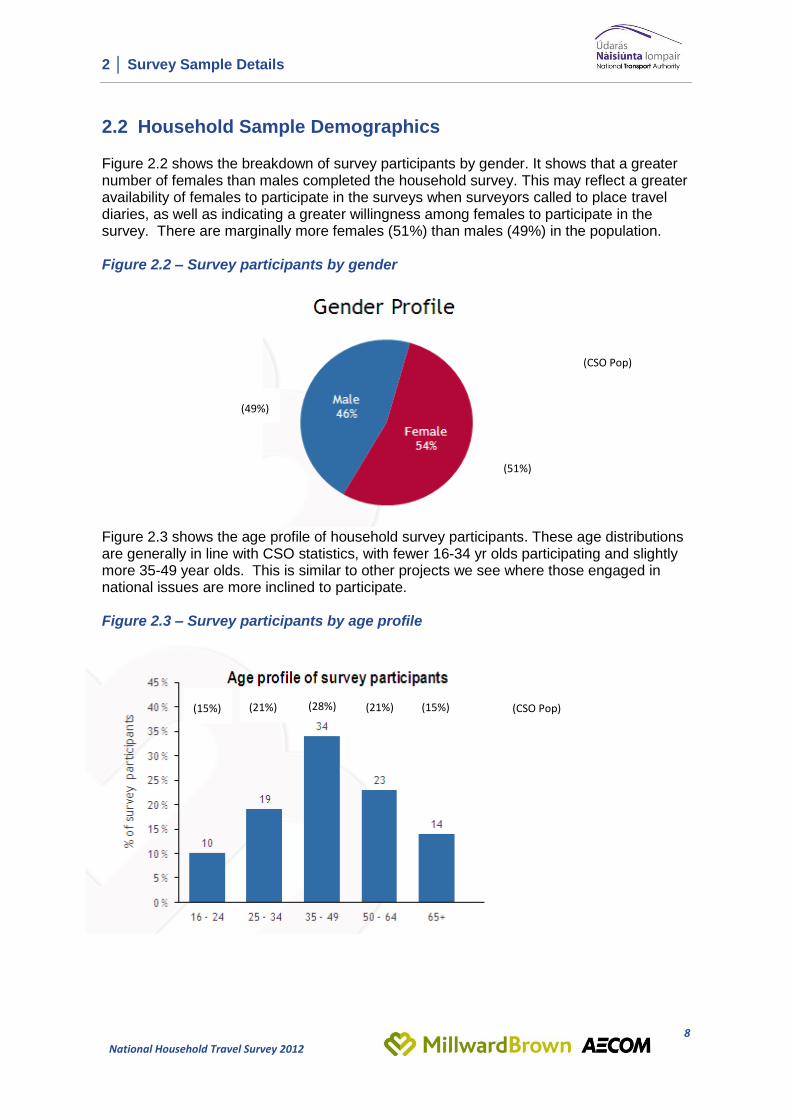
2.2 Household Sample Demographics Figure 2.2 shows the breakdown of survey participants by gender. It shows that a greater number of females than males completed the household survey. This may reflect a greater availability of females to participate in the surveys when surveyors called to place travel diaries, as well as indicating a greater willingness among females to participate in the survey. There are marginally more females (51%) than males (49%) in the population. Figure 2.2 – Survey participants by gender
Figure 2.3 shows the age profile of household survey participants. These age distributions are generally in line with CSO statistics, with fewer 16-34 yr olds participating and slightly more 35-49 year olds. This is similar to other projects we see where those engaged in national issues are more inclined to participate. Figure 2.3 – Survey participants by age profile
(51%)
(49%)
(CSO Pop)
(15%) (21%) (28%) (21%) (15%) (CSO Pop)
2 │ Survey Sample Details
9
National Household Travel Survey 2012
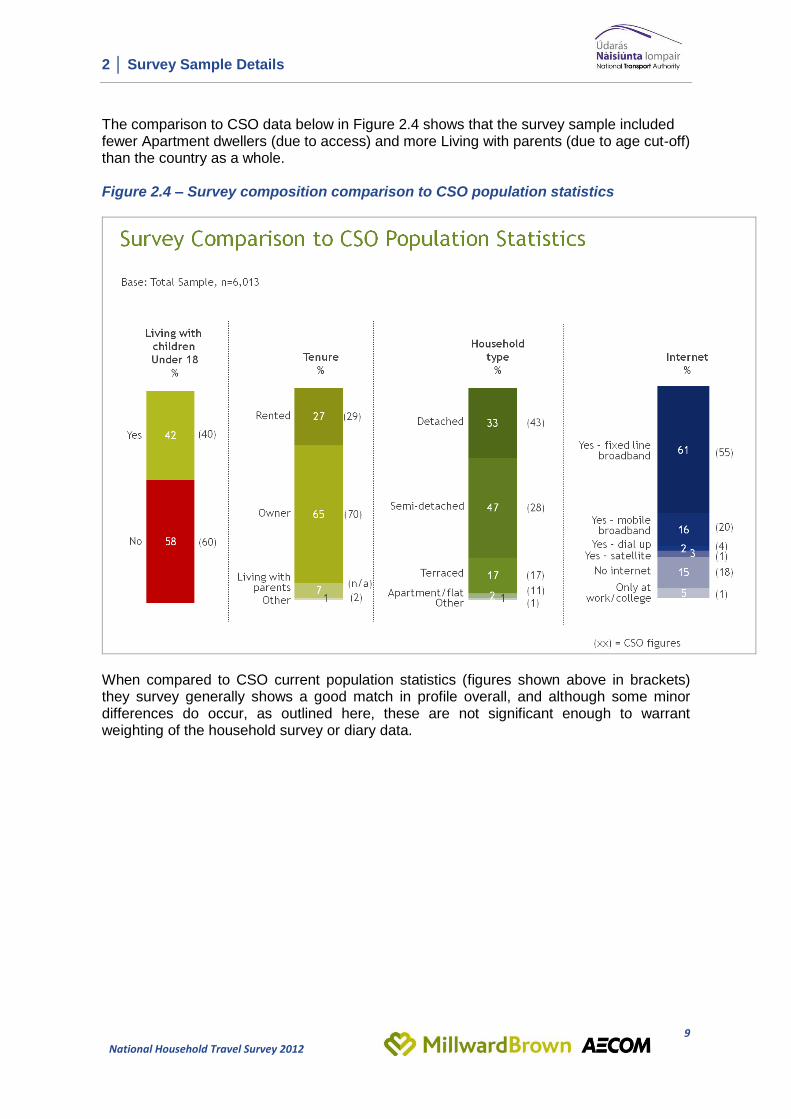
The comparison to CSO data below in Figure 2.4 shows that the survey sample included fewer Apartment dwellers (due to access) and more Living with parents (due to age cut-off) than the country as a whole. Figure 2.4 – Survey composition comparison to CSO population statistics
When compared to CSO current population statistics (figures shown above in brackets) they survey generally shows a good match in profile overall, and although some minor differences do occur, as outlined here, these are not significant enough to warrant weighting of the household survey or diary data.
2 │ Survey Sample Details
10
National Household Travel Survey 2012
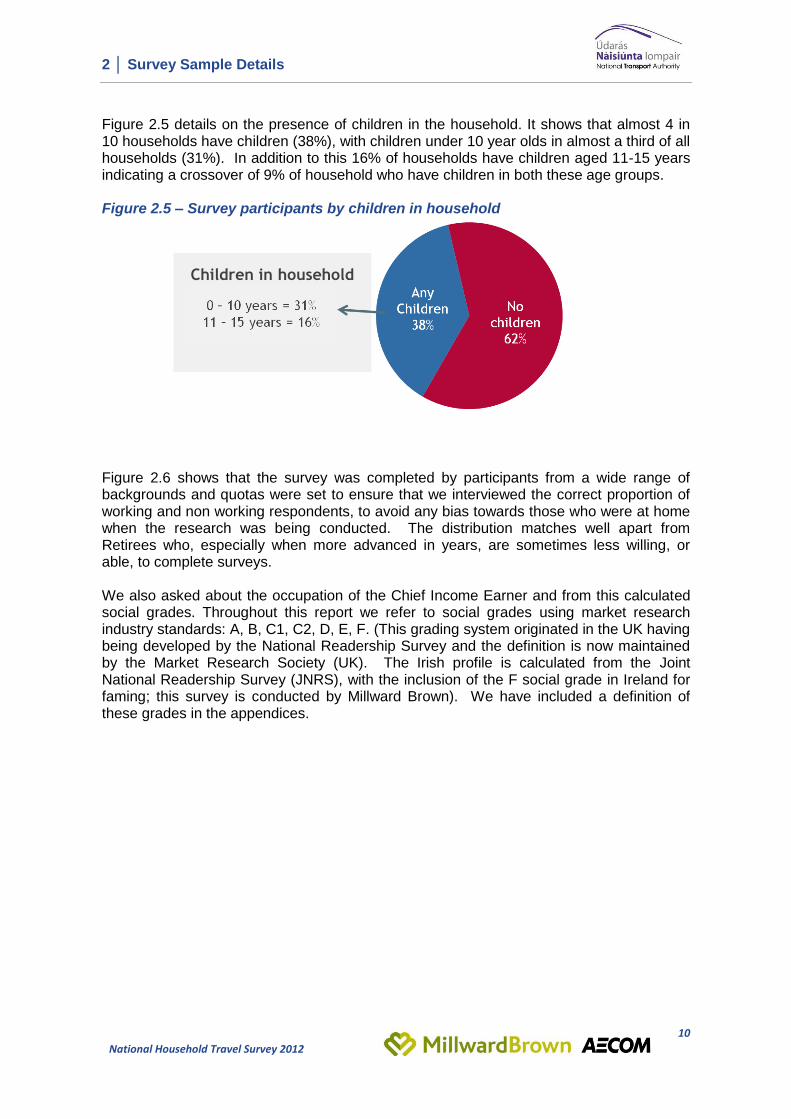
Children in household
who are aged
Figure 2.5 details on the presence of children in the household. It shows that almost 4 in 10 households have children (38%), with children under 10 year olds in almost a third of all households (31%). In addition to this 16% of households have children aged 11-15 years indicating a crossover of 9% of household who have children in both these age groups. Figure 2.5 – Survey participants by children in household Figure 2.6 shows that the survey was completed by participants from a wide range of backgrounds and quotas were set to ensure that we interviewed the correct proportion of working and non working respondents, to avoid any bias towards those who were at home when the research was being conducted. The distribution matches well apart from Retirees who, especially when more advanced in years, are sometimes less willing, or able, to complete surveys. We also asked about the occupation of the Chief Income Earner and from this calculated social grades. Throughout this report we refer to social grades using market research industry standards: A, B, C1, C2, D, E, F. (This grading system originated in the UK having being developed by the National Readership Survey and the definition is now maintained by the Market Research Society (UK). The Irish profile is calculated from the Joint National Readership Survey (JNRS), with the inclusion of the F social grade in Ireland for faming; this survey is conducted by Millward Brown). We have included a definition of these grades in the appendices.
2 │ Survey Sample Details
11
National Household Travel Survey 2012
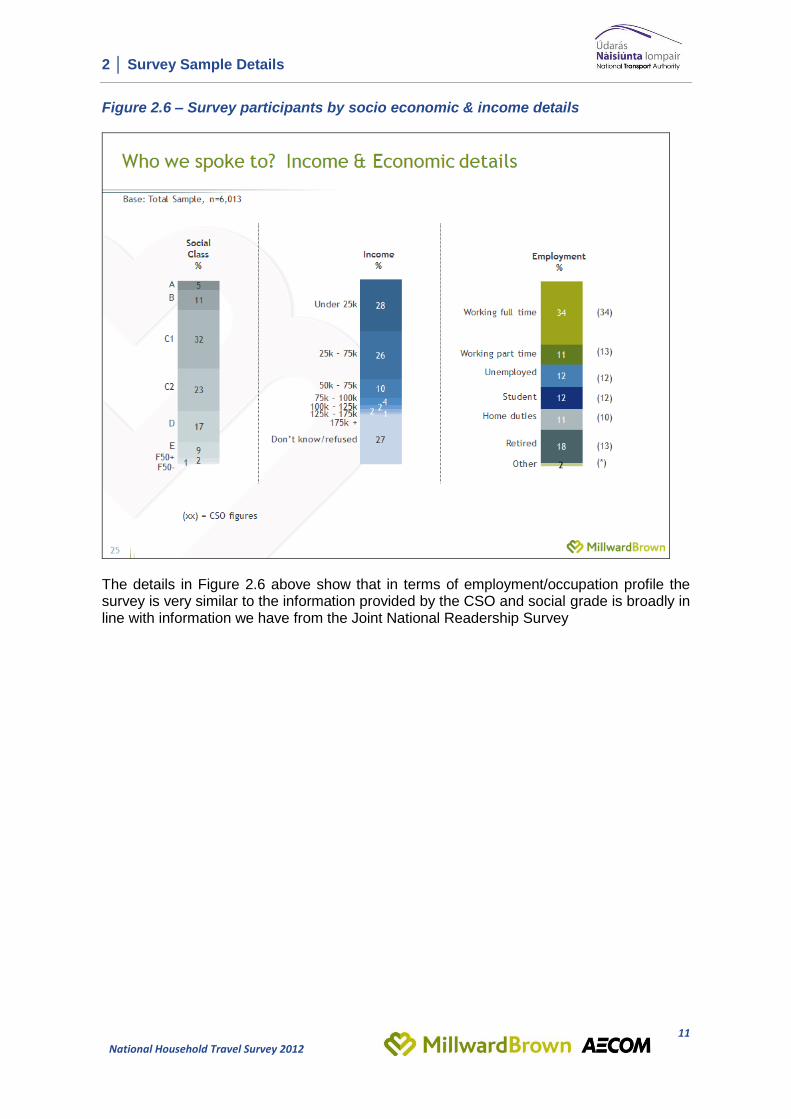
Figure 2.6 – Survey participants by socio economic & income details
The details in Figure 2.6 above show that in terms of employment/occupation profile the survey is very similar to the information provided by the CSO and social grade is broadly in line with information we have from the Joint National Readership Survey
3 │ Analysis of Household Survey Questionnaires
12
National Household Travel Survey 2012
3. Analysis of Household Survey Questionnaires This section of the report includes the results of the household survey conducted with one individual per household in line with national representative quotas (see section 2) by Millward Brown trained interviewers, carried out face-to-face in-home utilising the handheld HAPI devices. The section contains survey results only and follows the general flow of the survey, with the initial focus on Modes used, not used, and why, followed by supporting topics on parking, licences, etc, and finally long journeys
3.1 Modes of Transport Used
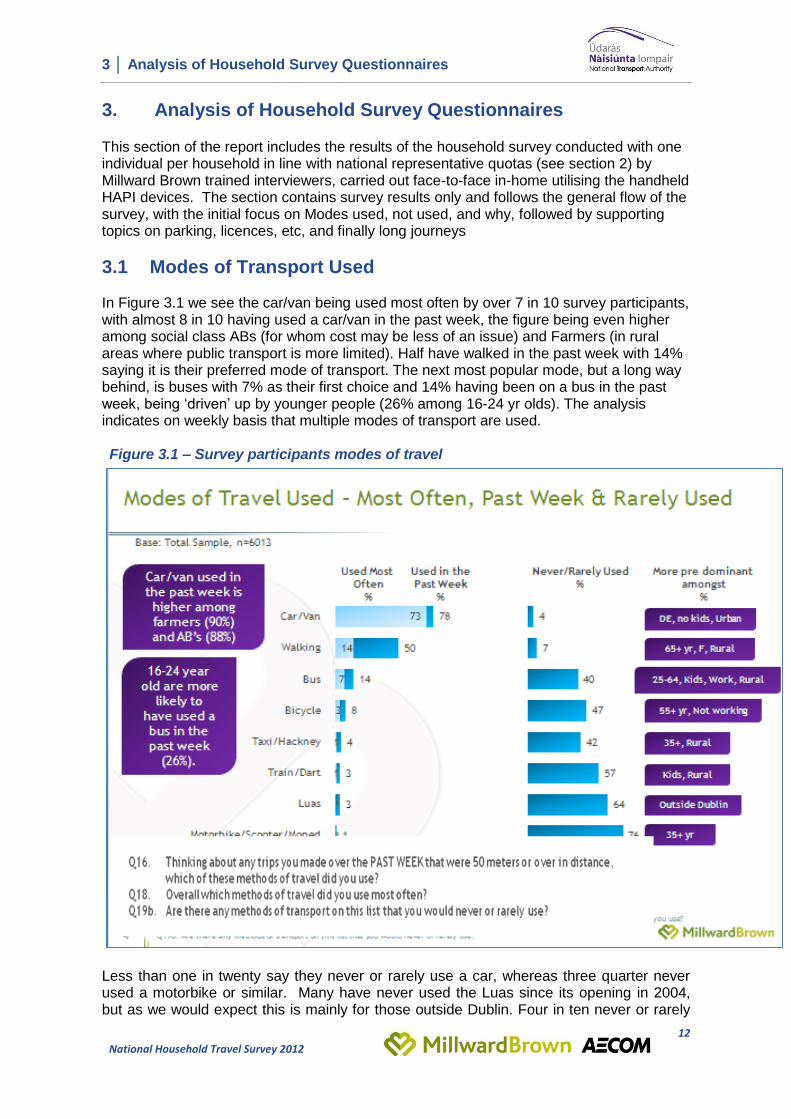
In Figure 3.1 we see the car/van being used most often by over 7 in 10 survey participants, with almost 8 in 10 having used a car/van in the past week, the figure being even higher among social class ABs (for whom cost may be less of an issue) and Farmers (in rural areas where public transport is more limited). Half have walked in the past week with 14% saying it is their preferred mode of transport. The next most popular mode, but a long way behind, is buses with 7% as their first choice and 14% having been on a bus in the past week, being ‘driven’ up by younger people (26% among 16-24 yr olds). The analysis indicates on weekly basis that multiple modes of transport are used. Figure 3.1 – Survey participants modes of travel
Less than one in twenty say they never or rarely use a car, whereas three quarter never used a motorbike or similar. Many have never used the Luas since its opening in 2004, but as we would expect this is mainly for those outside Dublin. Four in ten never or rarely
More pre dominant amongst
3 │ Analysis of Household Survey Questionnaires
13
National Household Travel Survey 2012
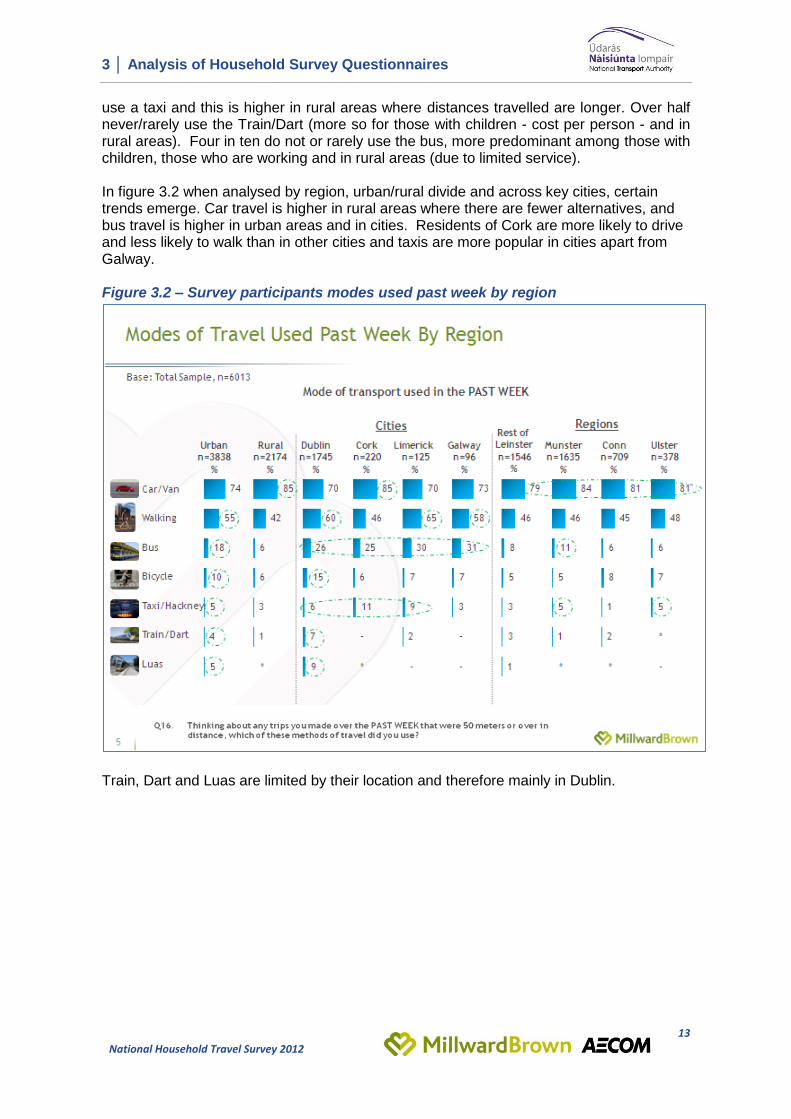
use a taxi and this is higher in rural areas where distances travelled are longer. Over half never/rarely use the Train/Dart (more so for those with children - cost per person - and in rural areas). Four in ten do not or rarely use the bus, more predominant among those with children, those who are working and in rural areas (due to limited service). In figure 3.2 when analysed by region, urban/rural divide and across key cities, certain trends emerge. Car travel is higher in rural areas where there are fewer alternatives, and bus travel is higher in urban areas and in cities. Residents of Cork are more likely to drive and less likely to walk than in other cities and taxis are more popular in cities apart from Galway. Figure 3.2 – Survey participants modes used past week by region
Train, Dart and Luas are limited by their location and therefore mainly in Dublin.
3 │ Analysis of Household Survey Questionnaires
14
National Household Travel Survey 2012
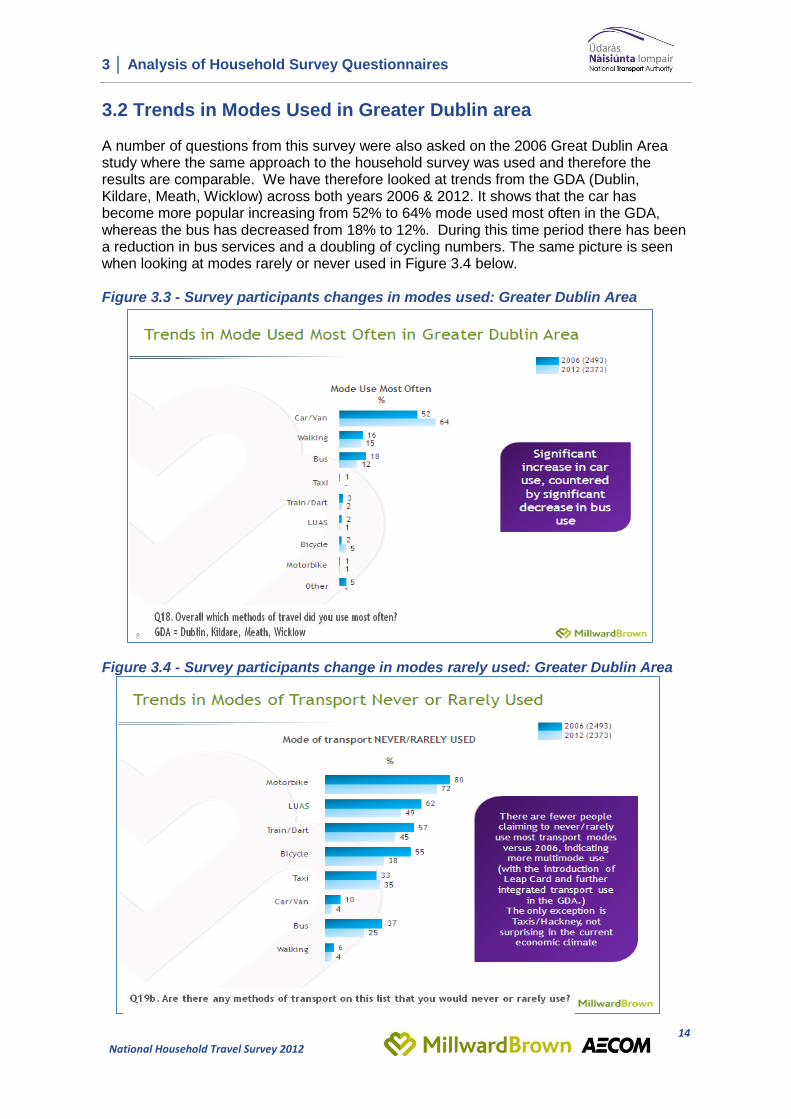
3.2 Trends in Modes Used in Greater Dublin area A number of questions from this survey were also asked on the 2006 Great Dublin Area study where the same approach to the household survey was used and therefore the results are comparable. We have therefore looked at trends from the GDA (Dublin, Kildare, Meath, Wicklow) across both years 2006 & 2012. It shows that the car has become more popular increasing from 52% to 64% mode used most often in the GDA, whereas the bus has decreased from 18% to 12%. During this time period there has been a reduction in bus services and a doubling of cycling numbers. The same picture is seen when looking at modes rarely or never used in Figure 3.4 below. Figure 3.3 - Survey participants changes in modes used: Greater Dublin Area Figure 3.4 - Survey participants change in modes rarely used: Greater Dublin Area
3 │ Analysis of Household Survey Questionnaires
15
National Household Travel Survey 2012
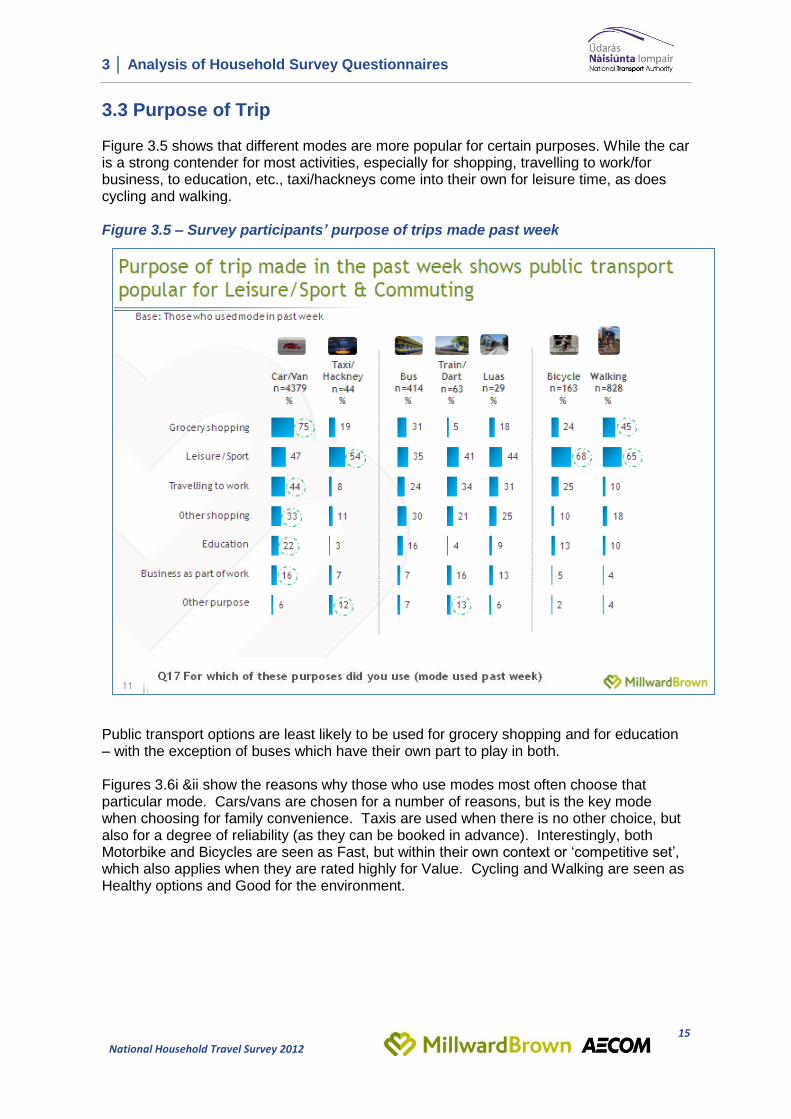
3.3 Purpose of Trip Figure 3.5 shows that different modes are more popular for certain purposes. While the car is a strong contender for most activities, especially for shopping, travelling to work/for business, to education, etc., taxi/hackneys come into their own for leisure time, as does cycling and walking. Figure 3.5 – Survey participants’ purpose of trips made past week
Public transport options are least likely to be used for grocery shopping and for education – with the exception of buses which have their own part to play in both. Figures 3.6i &ii show the reasons why those who use modes most often choose that particular mode. Cars/vans are chosen for a number of reasons, but is the key mode when choosing for family convenience. Taxis are used when there is no other choice, but also for a degree of reliability (as they can be booked in advance). Interestingly, both Motorbike and Bicycles are seen as Fast, but within their own context or ‘competitive set’, which also applies when they are rated highly for Value. Cycling and Walking are seen as Healthy options and Good for the environment.

3 │ Analysis of Household Survey Questionnaires
16
National Household Travel Survey 2012
In terms of the main public transport modes, those who use the Bus most often believe it is good value for money, but some use it when there are no other options and it is noticeably below other modes in terms of being perceived as a fast mode of transport. Those who use the Train/Dart most often see it is a convenient way to get to work and also perceive it as good value. The Luas is seen as comfortable and also good value, .Figure 3.6i & ii – Survey participants’ reason for using modes

3 │ Analysis of Household Survey Questionnaires
17
National Household Travel Survey 2012
3.4 Supporting Details on Household Survey Figure 3.7 shows that 4 in 5 people are within 15 minute walking distance of a shop and two thirds can access many services such as post offices, doctors, chemist and pub/restaurants. There are certain parts of the country which are less well served such as Co. Roscommon, South Tipperary, Co. Clare, Connaught Rural in general, and Famers in rural areas. There also seems to be a dearth of post offices in the midlands generally, falling below the national average. Figure 3.7 – Survey participants facilities within 15 minute radius
(It should be noted that we interviewed respondents on a nationwide basis but the results of this question may be influenced somewhat by the particular sampling points selected – a list of the c420 sampling points used is appended.)

3 │ Analysis of Household Survey Questionnaires
18
National Household Travel Survey 2012
Only 15% would consider using a public bike scheme, driven by those in areas where they currently exist, e.g. Dublin. A similar proportion (14%) would consider car share schemes or car clubs. Figure 3.8 – Survey participants ticket types and travel schemes
3 │ Analysis of Household Survey Questionnaires
19
National Household Travel Survey 2012
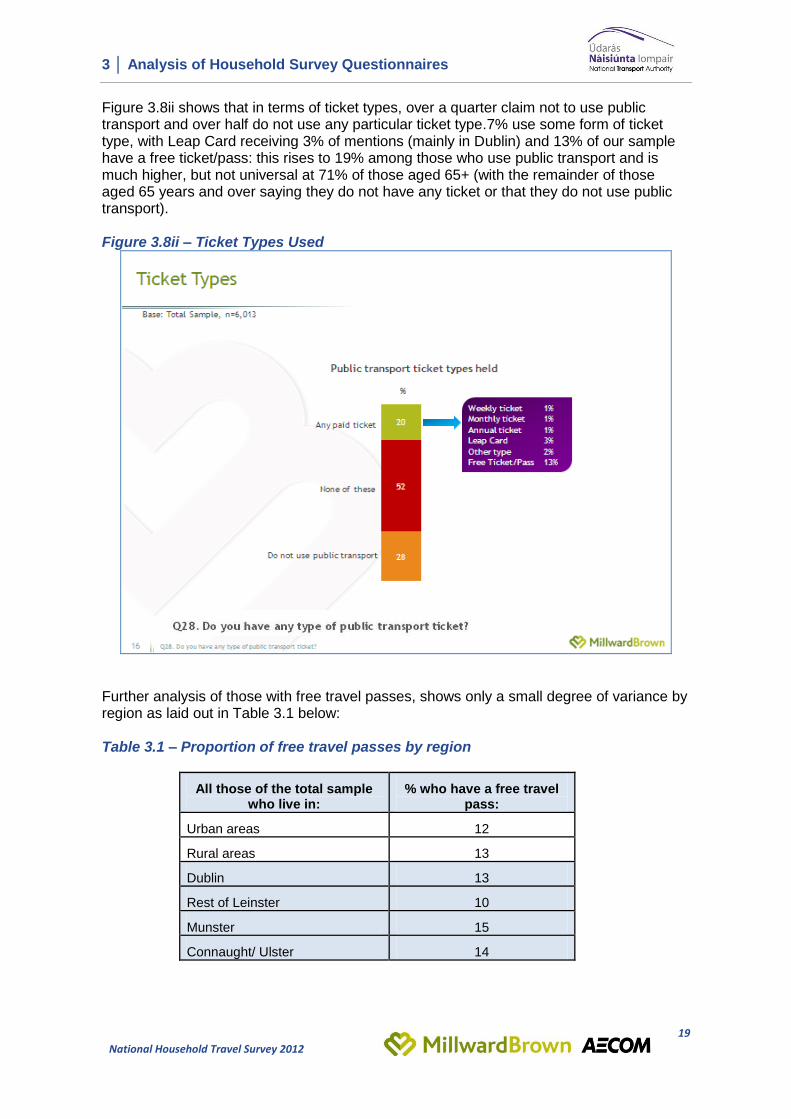
Figure 3.8ii shows that in terms of ticket types, over a quarter claim not to use public transport and over half do not use any particular ticket type.7% use some form of ticket type, with Leap Card receiving 3% of mentions (mainly in Dublin) and 13% of our sample have a free ticket/pass: this rises to 19% among those who use public transport and is much higher, but not universal at 71% of those aged 65+ (with the remainder of those aged 65 years and over saying they do not have any ticket or that they do not use public transport). Figure 3.8ii – Ticket Types Used
Further analysis of those with free travel passes, shows only a small degree of variance by region as laid out in Table 3.1 below: Table 3.1 – Proportion of free travel passes by region
All those of the total sample who live in:
% who have a free travel pass:
Urban areas 12
Rural areas 13
Dublin 13
Rest of Leinster 10
Munster 15
Connaught/ Ulster 14
3 │ Analysis of Household Survey Questionnaires
20
National Household Travel Survey 2012
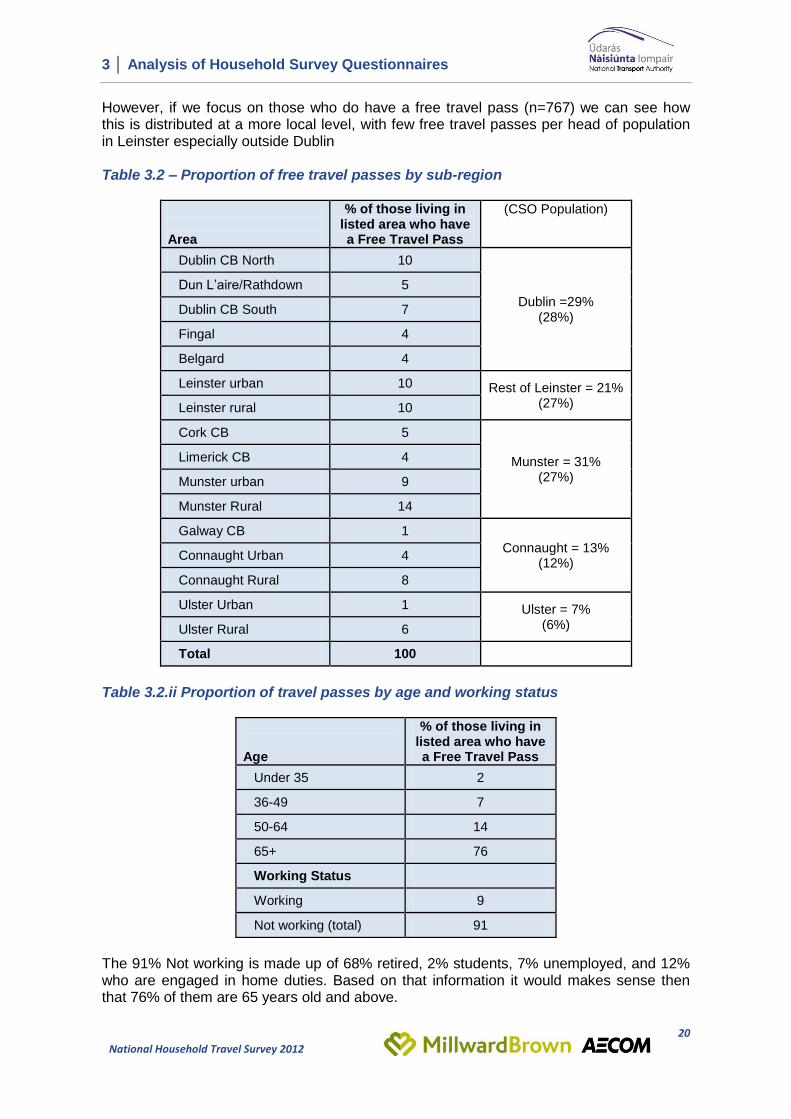
However, if we focus on those who do have a free travel pass (n=767) we can see how this is distributed at a more local level, with few free travel passes per head of population in Leinster especially outside Dublin Table 3.2 – Proportion of free travel passes by sub-region
Area
% of those living in listed area who have a Free Travel Pass
(CSO Population)
Dublin CB North 10
Dublin =29% (28%)
Dun L’aire/Rathdown 5
Dublin CB South 7
Fingal 4
Belgard 4
Leinster urban 10 Rest of Leinster = 21% (27%) Leinster rural 10
Cork CB 5
Munster = 31% (27%)
Limerick CB 4
Munster urban 9
Munster Rural 14
Galway CB 1
Connaught = 13% (12%)
Connaught Urban 4
Connaught Rural 8
Ulster Urban 1 Ulster = 7% (6%) Ulster Rural 6
Total 100
Table 3.2.ii Proportion of travel passes by age and working status
Age
% of those living in listed area who have a Free Travel Pass
Under 35 2
36-49 7
50-64 14
65+ 76
Working Status
Working 9
Not working (total) 91
The 91% Not working is made up of 68% retired, 2% students, 7% unemployed, and 12% who are engaged in home duties. Based on that information it would makes sense then that 76% of them are 65 years old and above.
3 │ Analysis of Household Survey Questionnaires
21
National Household Travel Survey 2012
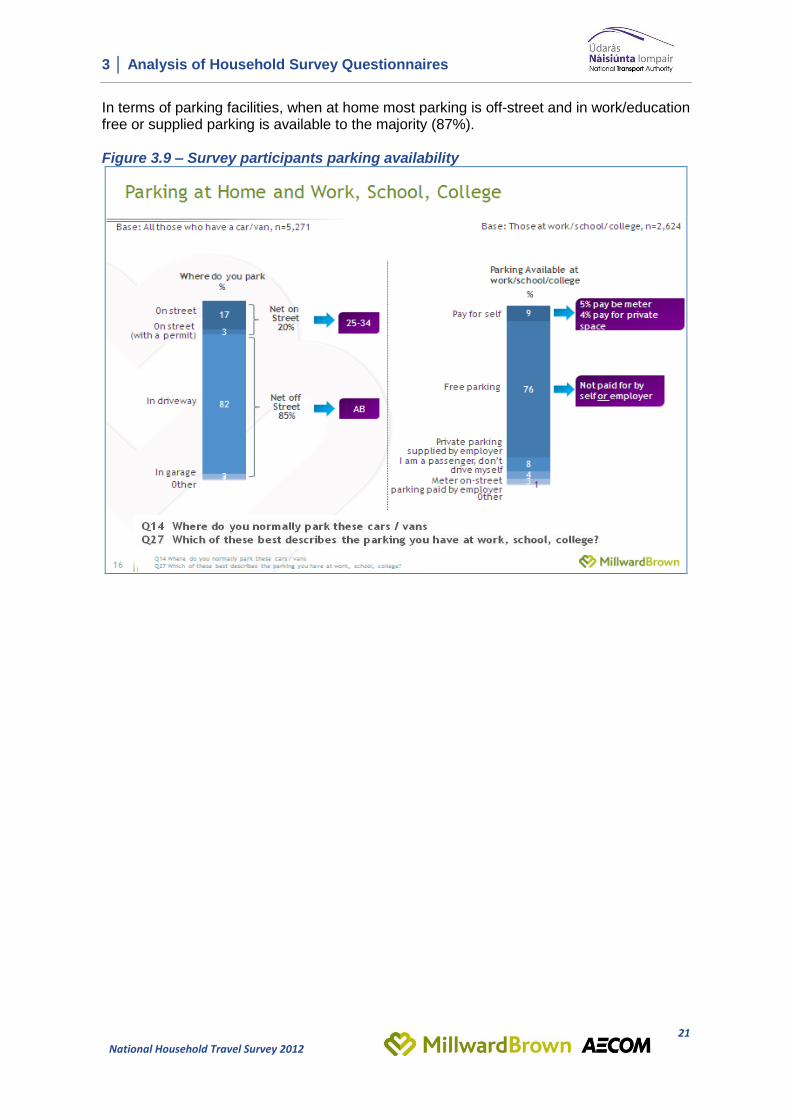
In terms of parking facilities, when at home most parking is off-street and in work/education free or supplied parking is available to the majority (87%). Figure 3.9 – Survey participants parking availability
3 │ Analysis of Household Survey Questionnaires
22
National Household Travel Survey 2012
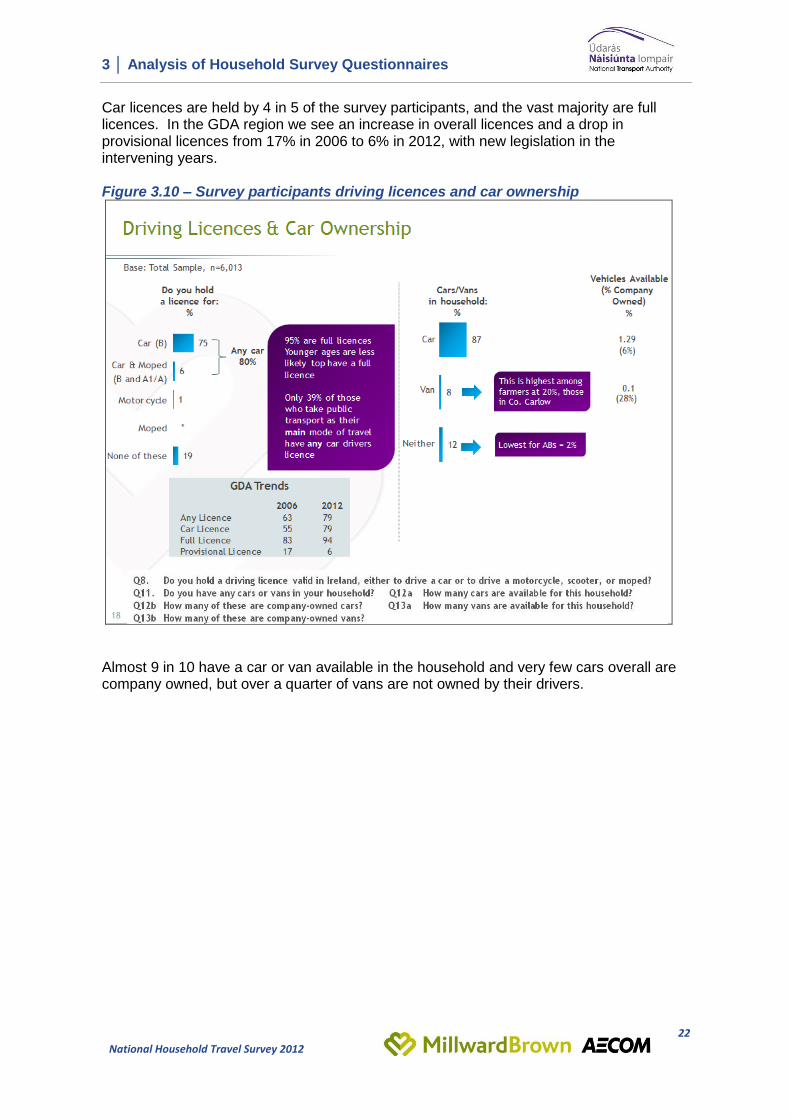
Car licences are held by 4 in 5 of the survey participants, and the vast majority are full licences. In the GDA region we see an increase in overall licences and a drop in provisional licences from 17% in 2006 to 6% in 2012, with new legislation in the intervening years. Figure 3.10 – Survey participants driving licences and car ownership
Almost 9 in 10 have a car or van available in the household and very few cars overall are company owned, but over a quarter of vans are not owned by their drivers.
3 │ Analysis of Household Survey Questionnaires
23
National Household Travel Survey 2012
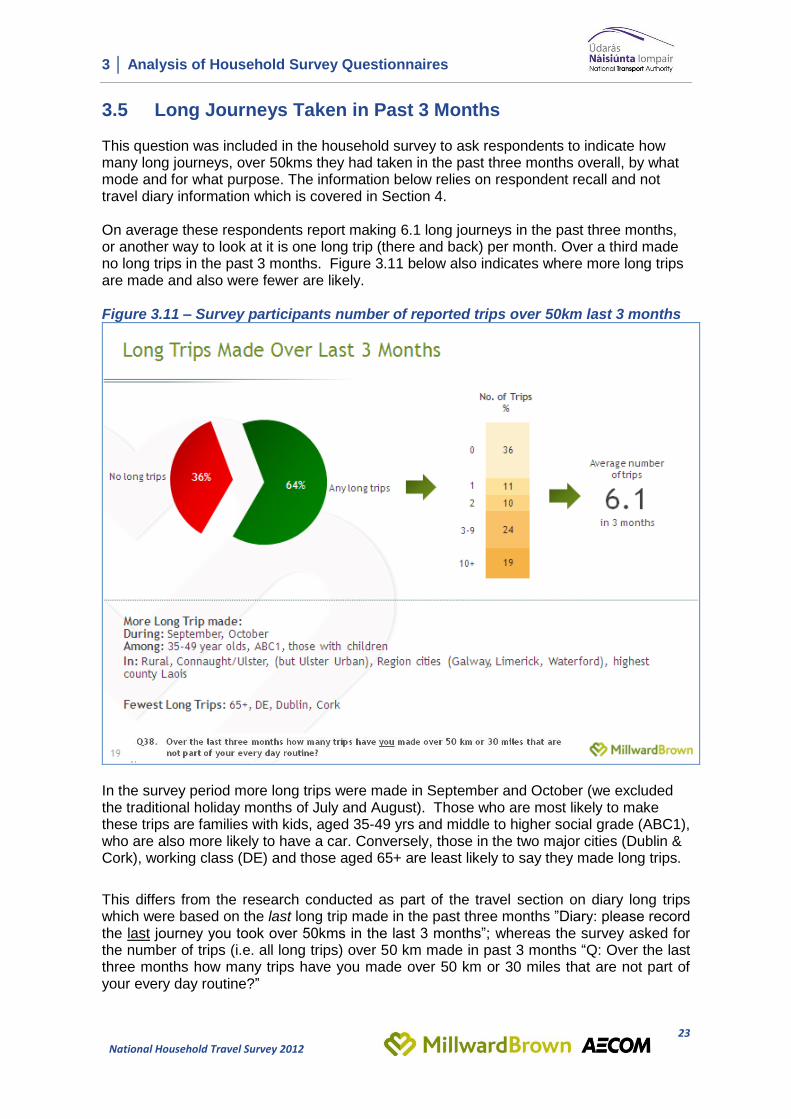
3.5 Long Journeys Taken in Past 3 Months This question was included in the household survey to ask respondents to indicate how many long journeys, over 50kms they had taken in the past three months overall, by what mode and for what purpose. The information below relies on respondent recall and not travel diary information which is covered in Section 4. On average these respondents report making 6.1 long journeys in the past three months, or another way to look at it is one long trip (there and back) per month. Over a third made no long trips in the past 3 months. Figure 3.11 below also indicates where more long trips are made and also were fewer are likely. Figure 3.11 – Survey participants number of reported trips over 50km last 3 months
In the survey period more long trips were made in September and October (we excluded the traditional holiday months of July and August). Those who are most likely to make these trips are families with kids, aged 35-49 yrs and middle to higher social grade (ABC1), who are also more likely to have a car. Conversely, those in the two major cities (Dublin & Cork), working class (DE) and those aged 65+ are least likely to say they made long trips.
This differs from the research conducted as part of the travel section on diary long trips which were based on the last long trip made in the past three months ”Diary: please record the last journey you took over 50kms in the last 3 months”; whereas the survey asked for the number of trips (i.e. all long trips) over 50 km made in past 3 months “Q: Over the last three months how many trips have you made over 50 km or 30 miles that are not part of your every day routine?”

3 │ Analysis of Household Survey Questionnaires
24
National Household Travel Survey 2012
Figure 3.12 and 3.13 below show how these reported long journeys break out in terms of number of trips taken by mode and for what purpose. More long journeys are made by car, the main purpose is to visit friends and family, with an average of almost 5 individual trips (legs) in 3 months, with 16% of all respondents saying they made 10 or more long journeys by car per quarter. The vast majority of people have not made any long trips by Bus or Train in the past 3 months (less than 10% using these modes for long journeys). Figure 3.12 below also shows who is most likely to use which mode for long journeys and it shows those with children are less likely to use public transport opting for car journeys. Figure 3.12 – Survey participants reported long journeys by mode in past 3 months
Figure 3.13 – Average no of long journeys by mode and purpose past 3 months
4 │ Analysis of Travel Diaries
25
National Household Travel Survey 2012
4. Analysis of Travel Diaries This section includes the results of the Household Travel Diary completed by all persons in the household aged 4+, covering two days’ consecutive travel, with additional information gathered on the last long journey in past 3 months. These diaries were placed at the time of the household survey by Millward Brown interviewers, collected by the same interviewer within a few days, returned to Millward Brown offices in Dublin for checking, initial editing and collating. They were then despatched to AECOM in Manchester for comprehensive editing, data entry, processing, robust data cleaning and analysis. A database of Travel Diary trips, merged with the household survey respondent data (processed by Millward Brown), was then supplied to the Authority. This section of the report contains the analysis of the diary data conducted by AECOM, drawing on their considerable expertise of travel research. However, further editing of the Travel diary data has been conducted by The Authority to match previous models and to ensure the best use of the data collected. One of the edits conducted by The Authority was to treat blank diary pages to represent ‘no trips recorded’ rather than ‘no trips made’ unless indicated otherwise, and so metrics such as Average Trip rate will differ in this report from the final metrics to be used in the data modelling. That said, the key” take outs” from this section are seen as a very important input into the overall research findings and differ only marginally from The Authority figures. This section also includes analysis of trend data from the Greater Dublin Area for comparable data captured in 2006 versus 2012.
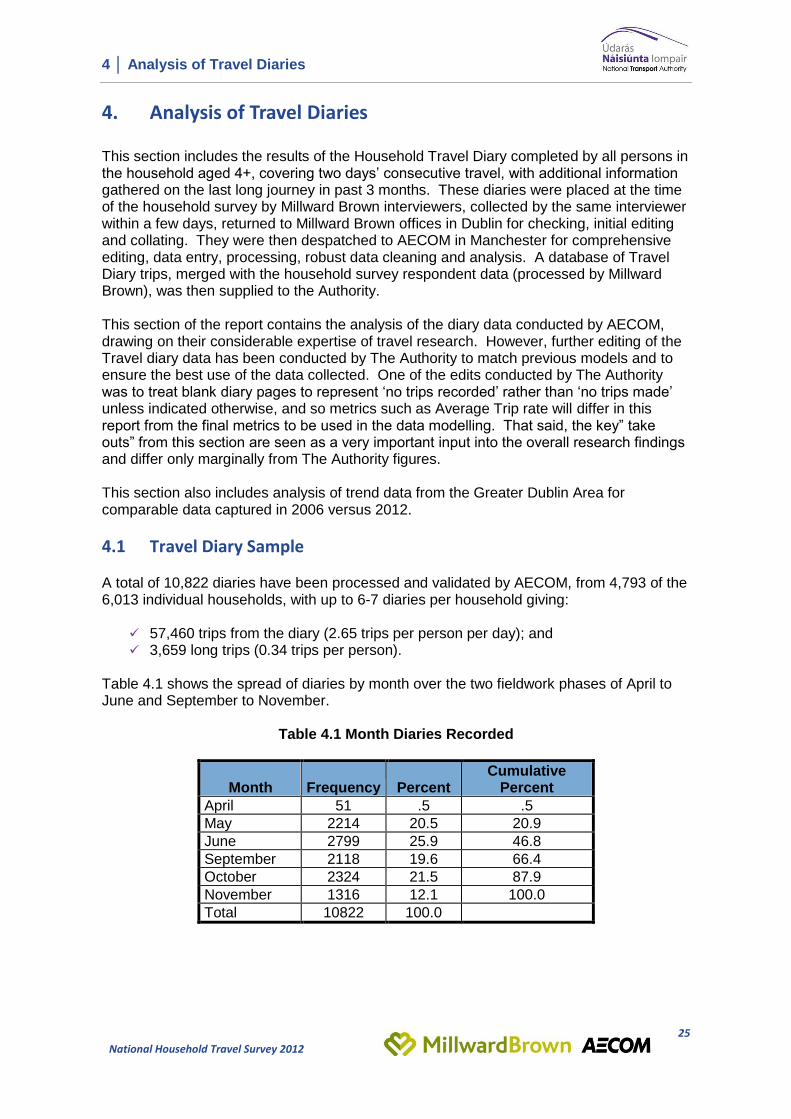
4.1 Travel Diary Sample A total of 10,822 diaries have been processed and validated by AECOM, from 4,793 of the 6,013 individual households, with up to 6-7 diaries per household giving:
57,460 trips from the diary (2.65 trips per person per day); and 3,659 long trips (0.34 trips per person).
Table 4.1 shows the spread of diaries by month over the two fieldwork phases of April to June and September to November.
Table 4.1 Month Diaries Recorded
Month Frequency Percent
Cumulative Percent
April 51 .5 .5
May 2214 20.5 20.9
June 2799 25.9 46.8
September 2118 19.6 66.4
October 2324 21.5 87.9
November 1316 12.1 100.0
Total 10822 100.0
4 │ Analysis of Travel Diaries
26
National Household Travel Survey 2012
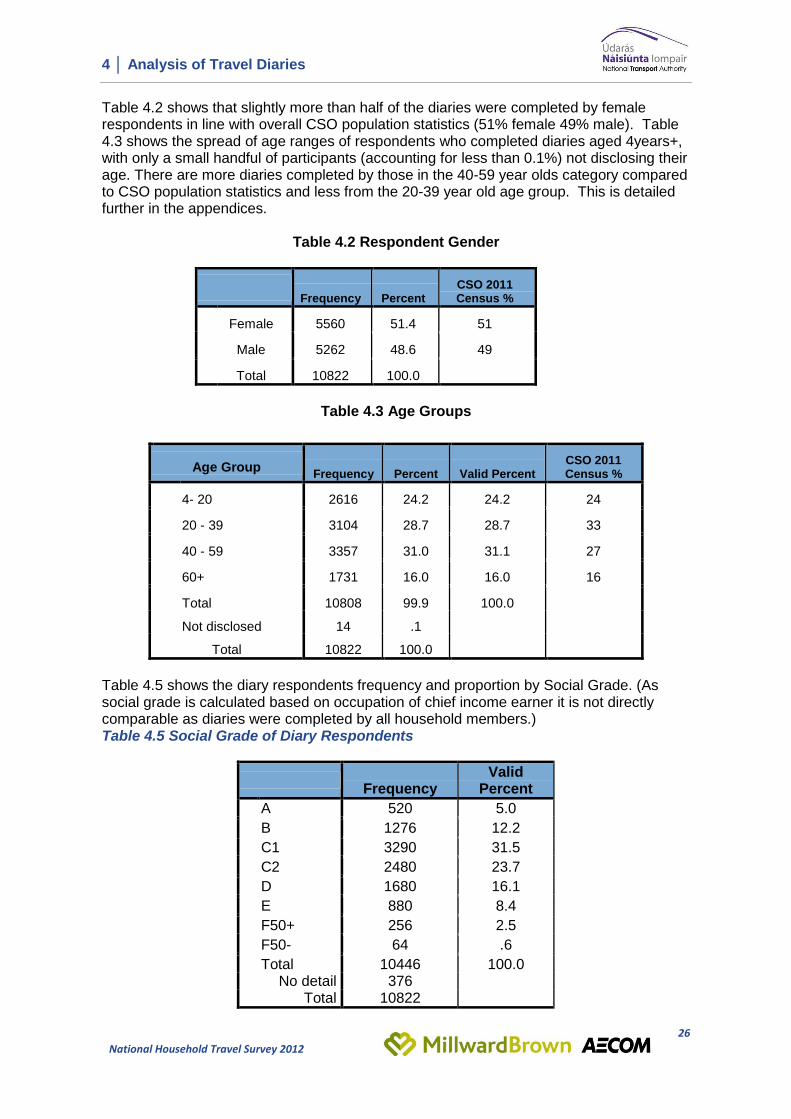
Table 4.2 shows that slightly more than half of the diaries were completed by female respondents in line with overall CSO population statistics (51% female 49% male). Table 4.3 shows the spread of age ranges of respondents who completed diaries aged 4years+, with only a small handful of participants (accounting for less than 0.1%) not disclosing their age. There are more diaries completed by those in the 40-59 year olds category compared to CSO population statistics and less from the 20-39 year old age group. This is detailed further in the appendices.
Table 4.2 Respondent Gender
Frequency Percent
CSO 2011 Census %
Female 5560 51.4 51
Male 5262 48.6 49
Total 10822 100.0
Table 4.3 Age Groups
Age Group Frequency Percent Valid Percent
CSO 2011 Census %
4- 20 2616 24.2 24.2 24
20 - 39 3104 28.7 28.7 33
40 - 59 3357 31.0 31.1 27
60+ 1731 16.0 16.0 16
Total 10808 99.9 100.0
Not disclosed 14 .1
Total 10822 100.0
Table 4.5 shows the diary respondents frequency and proportion by Social Grade. (As social grade is calculated based on occupation of chief income earner it is not directly comparable as diaries were completed by all household members.) Table 4.5 Social Grade of Diary Respondents
Frequency
Valid Percent
A 520 5.0
B 1276 12.2
C1 3290 31.5
C2 2480 23.7
D 1680 16.1
E 880 8.4
F50+ 256 2.5
F50- 64 .6
Total 10446 100.0 No detail 376
Total 10822
4 │ Analysis of Travel Diaries
27
National Household Travel Survey 2012
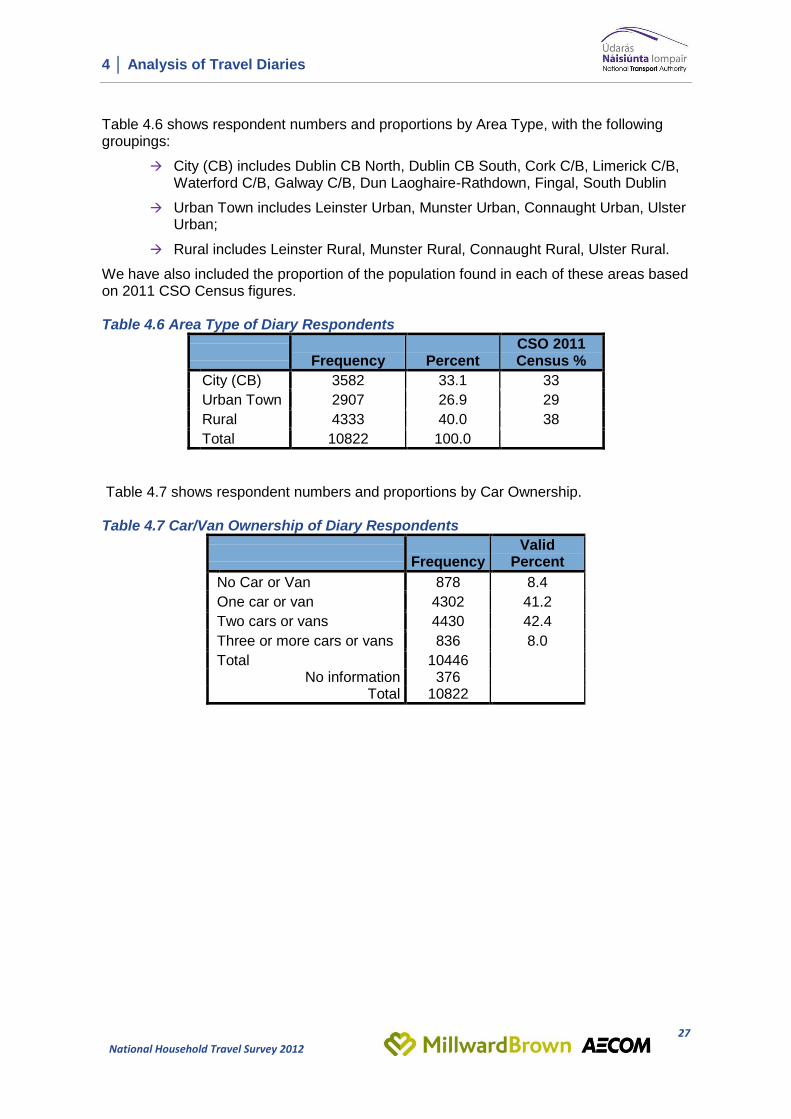
Table 4.6 shows respondent numbers and proportions by Area Type, with the following groupings:
City (CB) includes Dublin CB North, Dublin CB South, Cork C/B, Limerick C/B, Waterford C/B, Galway C/B, Dun Laoghaire-Rathdown, Fingal, South Dublin
Urban Town includes Leinster Urban, Munster Urban, Connaught Urban, Ulster Urban;
Rural includes Leinster Rural, Munster Rural, Connaught Rural, Ulster Rural.
We have also included the proportion of the population found in each of these areas based on 2011 CSO Census figures. Table 4.6 Area Type of Diary Respondents
Frequency Percent
CSO 2011 Census %
City (CB) 3582 33.1 33
Urban Town 2907 26.9 29
Rural 4333 40.0 38
Total 10822 100.0
Table 4.7 shows respondent numbers and proportions by Car Ownership. Table 4.7 Car/Van Ownership of Diary Respondents
Frequency
Valid Percent
No Car or Van 878 8.4
One car or van 4302 41.2
Two cars or vans 4430 42.4
Three or more cars or vans 836 8.0
Total 10446 No information 376
Total 10822
4 │ Analysis of Travel Diaries
28
National Household Travel Survey 2012
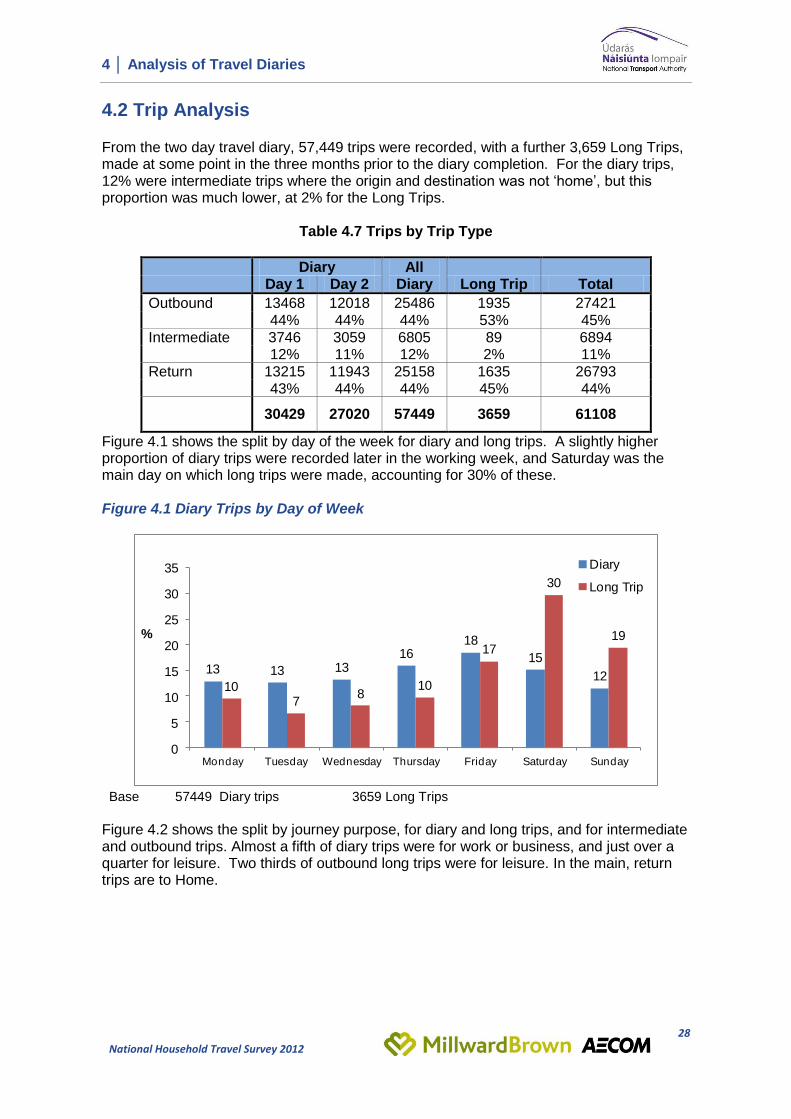
4.2 Trip Analysis From the two day travel diary, 57,449 trips were recorded, with a further 3,659 Long Trips, made at some point in the three months prior to the diary completion. For the diary trips, 12% were intermediate trips where the origin and destination was not ‘home’, but this proportion was much lower, at 2% for the Long Trips.
Table 4.7 Trips by Trip Type
Diary All
Diary Long Trip Total
Day 1 Day 2
Outbound 13468 12018 25486 1935 27421
44% 44% 44% 53% 45%
Intermediate 3746 3059 6805 89 6894
12% 11% 12% 2% 11%
Return 13215 11943 25158 1635 26793
43% 44% 44% 45% 44%
30429 27020 57449 3659 61108
Figure 4.1 shows the split by day of the week for diary and long trips. A slightly higher proportion of diary trips were recorded later in the working week, and Saturday was the main day on which long trips were made, accounting for 30% of these. Figure 4.1 Diary Trips by Day of Week
13 13 1316
18
15
1210
78
10
17
30
19
0
5
10
15
20
25
30
35
Monday Tuesday Wednesday Thursday Friday Saturday Sunday
%
Diary
Long Trip
Base 57449 Diary trips 3659 Long Trips
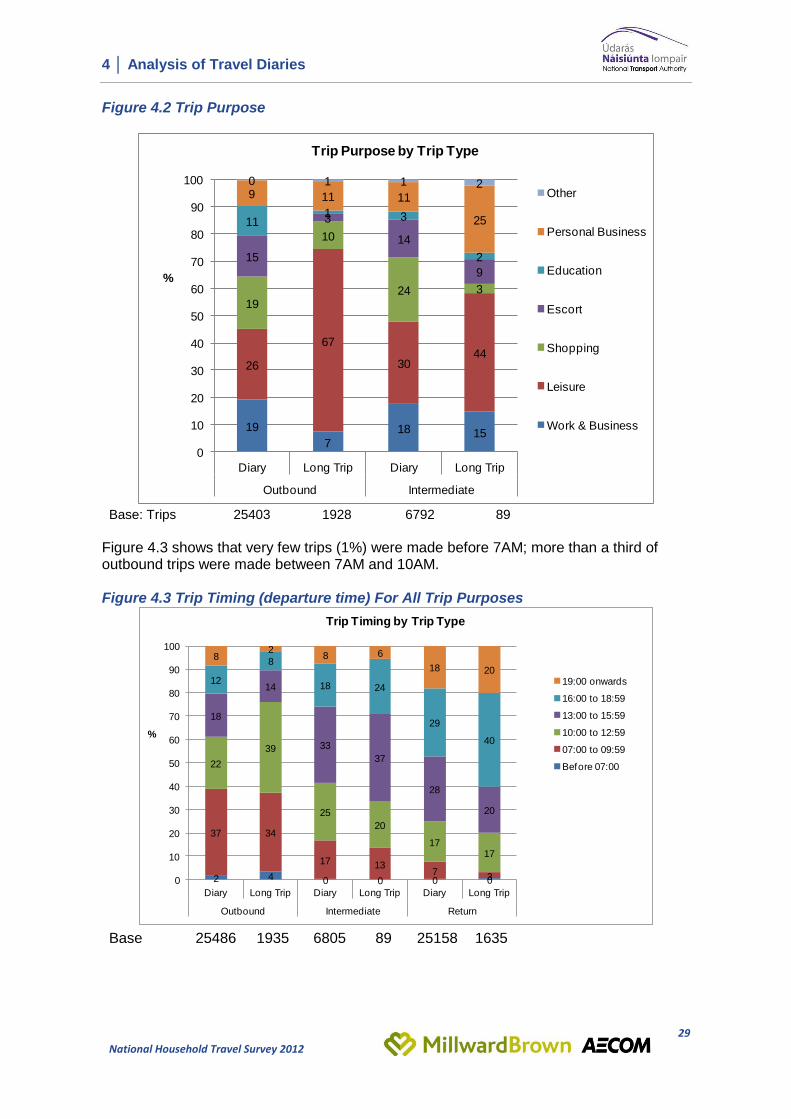
Figure 4.2 shows the split by journey purpose, for diary and long trips, and for intermediate and outbound trips. Almost a fifth of diary trips were for work or business, and just over a quarter for leisure. Two thirds of outbound long trips were for leisure. In the main, return trips are to Home.
4 │ Analysis of Travel Diaries
29
National Household Travel Survey 2012
Figure 4.2 Trip Purpose
19
7
18 15
26
67
3044
19
10
24 3
15
3
14
9
111 3
2
9 11 11
25
0 1 1 2
0
10
20
30
40
50
60
70
80
90
100
Diary Long Trip Diary Long Trip
Outbound Intermediate
%
Trip Purpose by Trip Type
Other
Personal Business
Education
Escort
Shopping
Leisure
Work & Business
Base: Trips 25403 1928 6792 89
Figure 4.3 shows that very few trips (1%) were made before 7AM; more than a third of outbound trips were made between 7AM and 10AM. Figure 4.3 Trip Timing (departure time) For All Trip Purposes
2 4 0 0 0 0
37 34
17 137
3
22
39
25
20
1717
18
14
33
37
28
20
12
8
18 24
29
40
82
8 6
18 20
0
10
20
30
40
50
60
70
80
90
100
Diary Long Trip Diary Long Trip Diary Long Trip
Outbound Intermediate Return
%
Trip Timing by Trip Type
19:00 onwards
16:00 to 18:59
13:00 to 15:59
10:00 to 12:59
07:00 to 09:59
Before 07:00
Base 25486 1935 6805 89 25158 1635
4 │ Analysis of Travel Diaries
30
National Household Travel Survey 2012
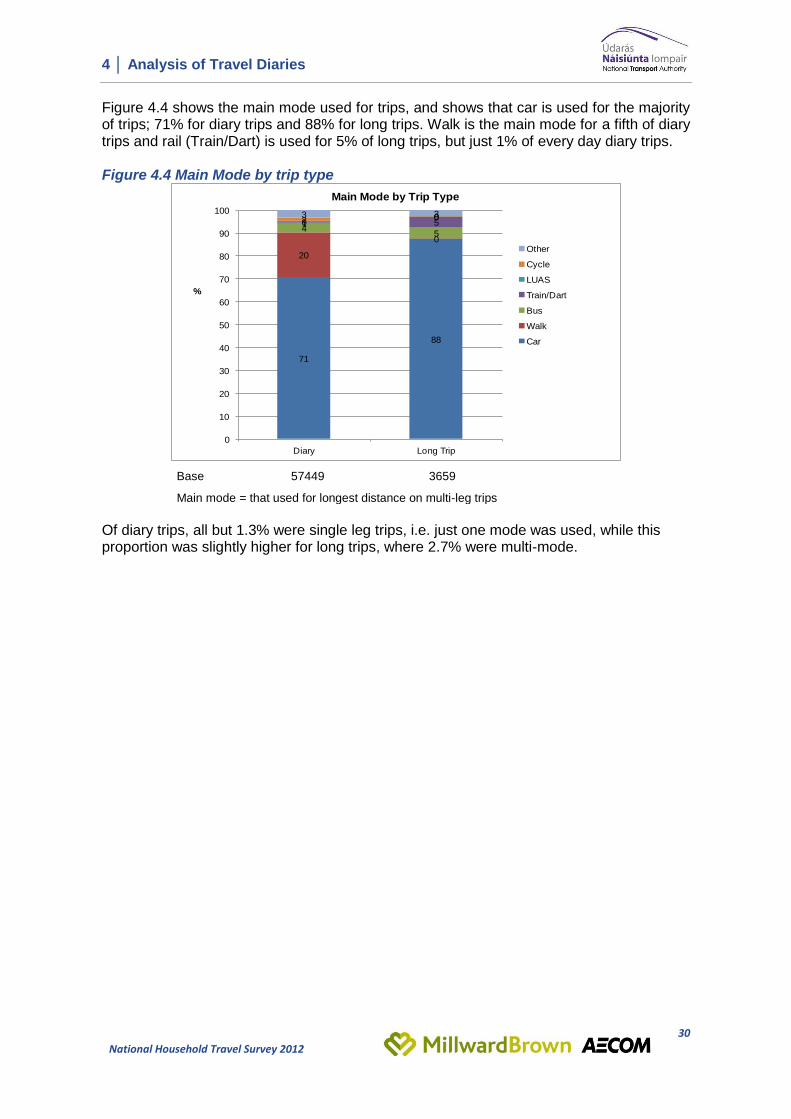
Figure 4.4 shows the main mode used for trips, and shows that car is used for the majority of trips; 71% for diary trips and 88% for long trips. Walk is the main mode for a fifth of diary trips and rail (Train/Dart) is used for 5% of long trips, but just 1% of every day diary trips. Figure 4.4 Main Mode by trip type
71
88
20
0
45
1 5002 03 3
0
10
20
30
40
50
60
70
80
90
100
Diary Long Trip
%
Main Mode by Trip Type
Other
Cycle
LUAS
Train/Dart
Bus
Walk
Car
Base 57449 3659
Main mode = that used for longest distance on multi-leg trips
Of diary trips, all but 1.3% were single leg trips, i.e. just one mode was used, while this proportion was slightly higher for long trips, where 2.7% were multi-mode.
4 │ Analysis of Travel Diaries
31
National Household Travel Survey 2012
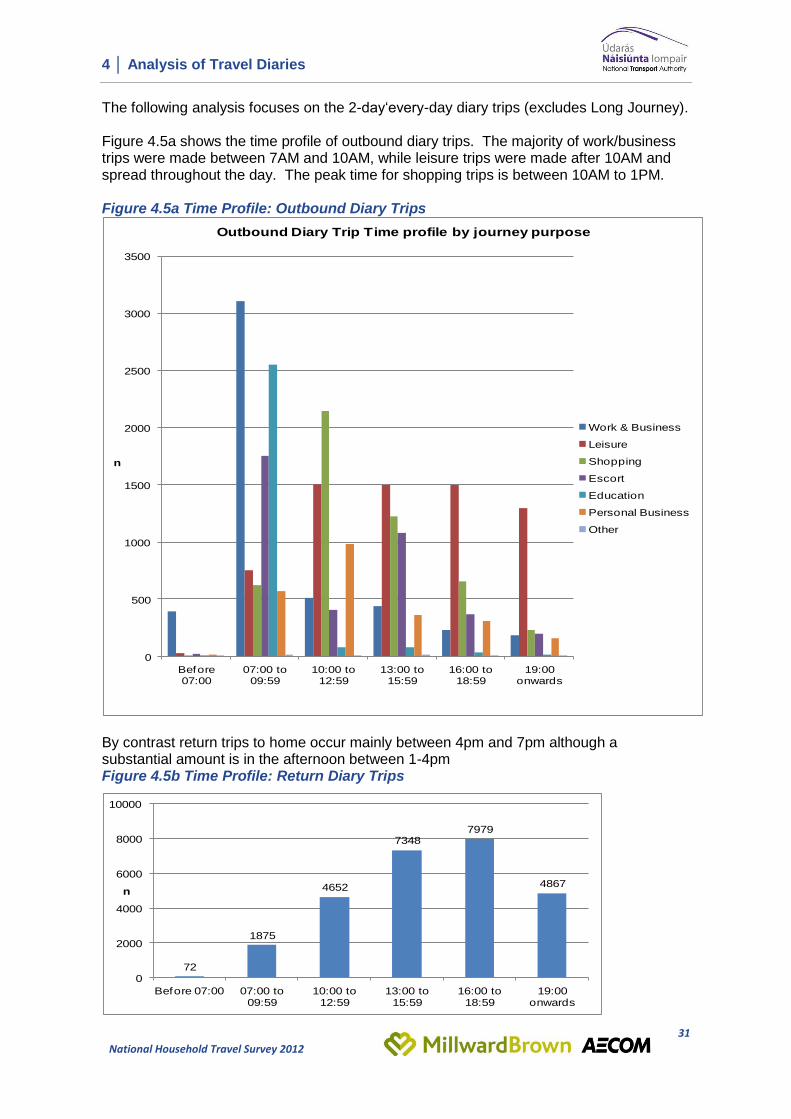
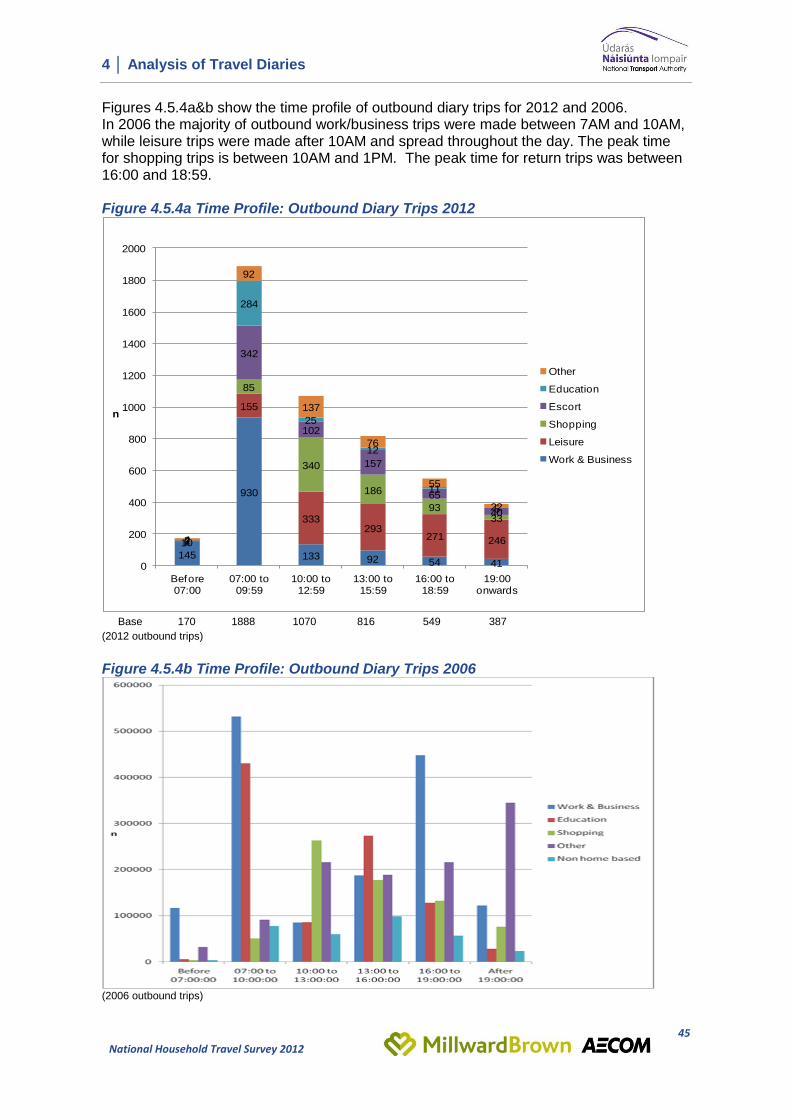
The following analysis focuses on the 2-day‘every-day diary trips (excludes Long Journey). Figure 4.5a shows the time profile of outbound diary trips. The majority of work/business trips were made between 7AM and 10AM, while leisure trips were made after 10AM and spread throughout the day. The peak time for shopping trips is between 10AM to 1PM. Figure 4.5a Time Profile: Outbound Diary Trips
0
500
1000
1500
2000
2500
3000
3500
Before 07:00
07:00 to 09:59
10:00 to 12:59
13:00 to 15:59
16:00 to 18:59
19:00 onwards
n
Outbound Diary Trip Time profile by journey purpose
Work & Business
Leisure
Shopping
Escort
Education
Personal Business
Other
By contrast return trips to home occur mainly between 4pm and 7pm although a substantial amount is in the afternoon between 1-4pm Figure 4.5b Time Profile: Return Diary Trips
72
1875
4652
73487979
4867
0
2000
4000
6000
8000
10000
Before 07:00 07:00 to 09:59
10:00 to 12:59
13:00 to 15:59
16:00 to 18:59
19:00 onwards
n
4 │ Analysis of Travel Diaries
32
National Household Travel Survey 2012
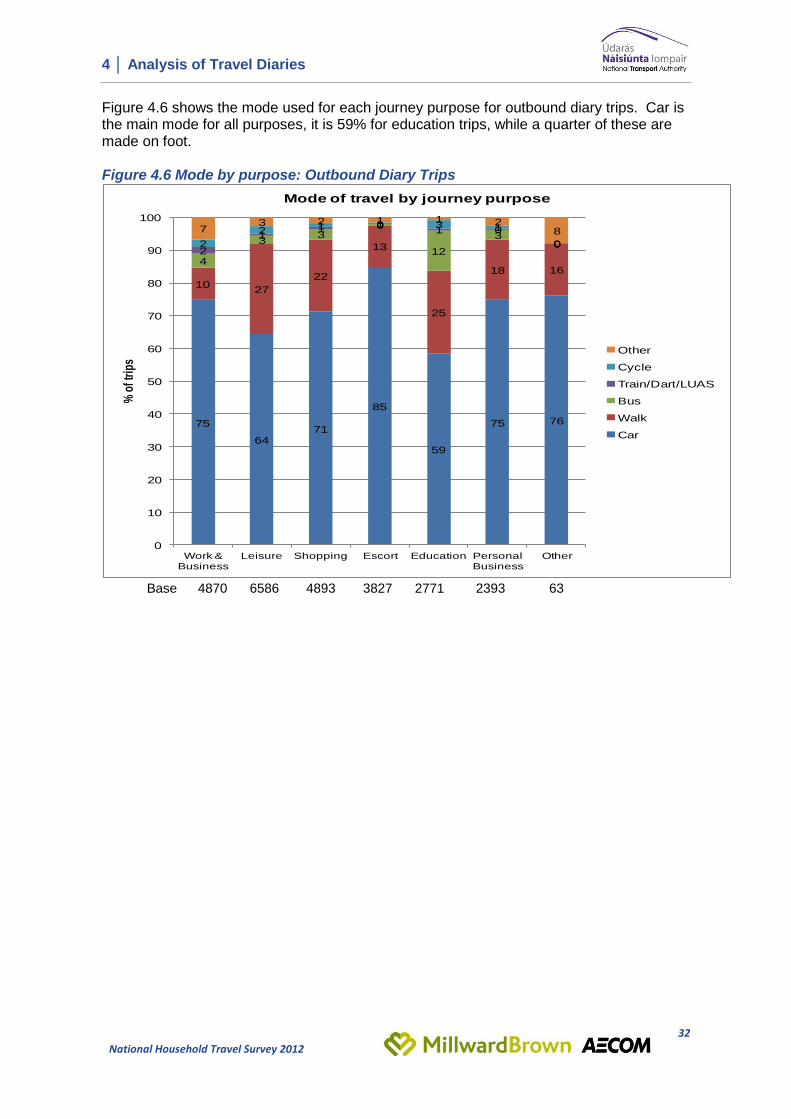
Figure 4.6 shows the mode used for each journey purpose for outbound diary trips. Car is the main mode for all purposes, it is 59% for education trips, while a quarter of these are made on foot. Figure 4.6 Mode by purpose: Outbound Diary Trips
75
6471
85
59
75 76
1027
22
13
25
18 164
33
0
12
30
2
11 0
1 0
02
2 1 1 3 1
0
73 2 1 1 2
8
0
10
20
30
40
50
60
70
80
90
100
Work & Business
Leisure Shopping Escort Education Personal Business
Other
% o
f tri
ps
Mode of travel by journey purpose
Other
Cycle
Train/Dart/LUAS
Bus
Walk
Car
Base 4870 6586 4893 3827 2771 2393 63
4 │ Analysis of Travel Diaries
33
National Household Travel Survey 2012
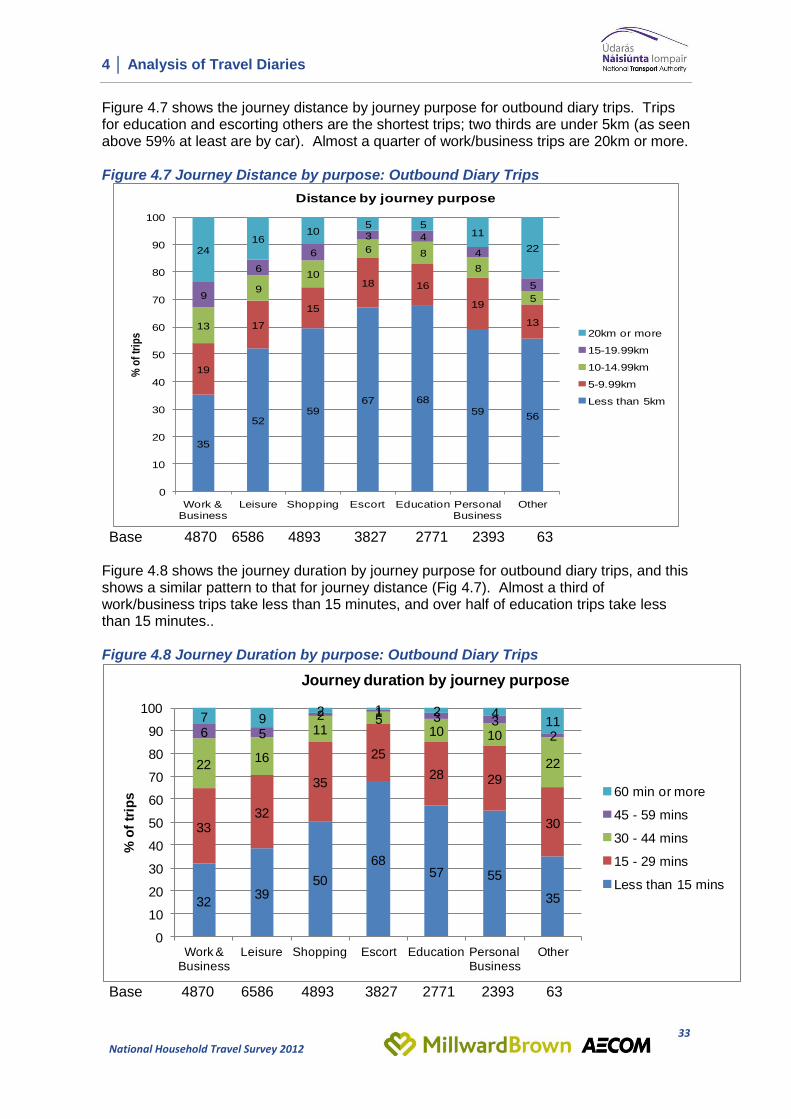
Figure 4.7 shows the journey distance by journey purpose for outbound diary trips. Trips for education and escorting others are the shortest trips; two thirds are under 5km (as seen above 59% at least are by car). Almost a quarter of work/business trips are 20km or more. Figure 4.7 Journey Distance by purpose: Outbound Diary Trips
35
5259
67 68
5956
19
17
15
18 16
19
1313
9
10
6 8
8
59
6
6
3 4
4
5
2416
105 5
11
22
0
10
20
30
40
50
60
70
80
90
100
Work & Business
Leisure Shopping Escort Education Personal Business
Other
% o
f tr
ips
Distance by journey purpose
20km or more
15-19.99km
10-14.99km
5-9.99km
Less than 5km
Base 4870 6586 4893 3827 2771 2393 63
Figure 4.8 shows the journey duration by journey purpose for outbound diary trips, and this shows a similar pattern to that for journey distance (Fig 4.7). Almost a third of work/business trips take less than 15 minutes, and over half of education trips take less than 15 minutes.. Figure 4.8 Journey Duration by purpose: Outbound Diary Trips
3239
50
6857 55
35
3332
35
25
28 29
30
2216
115
10 10
22
6 5
2 1 3 32
7 92 1 2 4
11
0
10
20
30
40
50
60
70
80
90
100
Work & Business
Leisure Shopping Escort Education Personal Business
Other
% o
f tr
ips
Journey duration by journey purpose
60 min or more
45 - 59 mins
30 - 44 mins
15 - 29 mins
Less than 15 mins
Base 4870 6586 4893 3827 2771 2393 63

4 │ Analysis of Travel Diaries
34
National Household Travel Survey 2012
Figures 4.9a&b show the journey distance by main mode for outbound diary trips. Almost half, 46% of car trips are less than 5km, as are a quarter of bus trips. Rail modes are used for longer distance trips, with almost a third (32%) being over 20km.
Figure 4.9a Journey Distance by Main Mode: Outbound Diary Trips
Base 18136 963 201 737
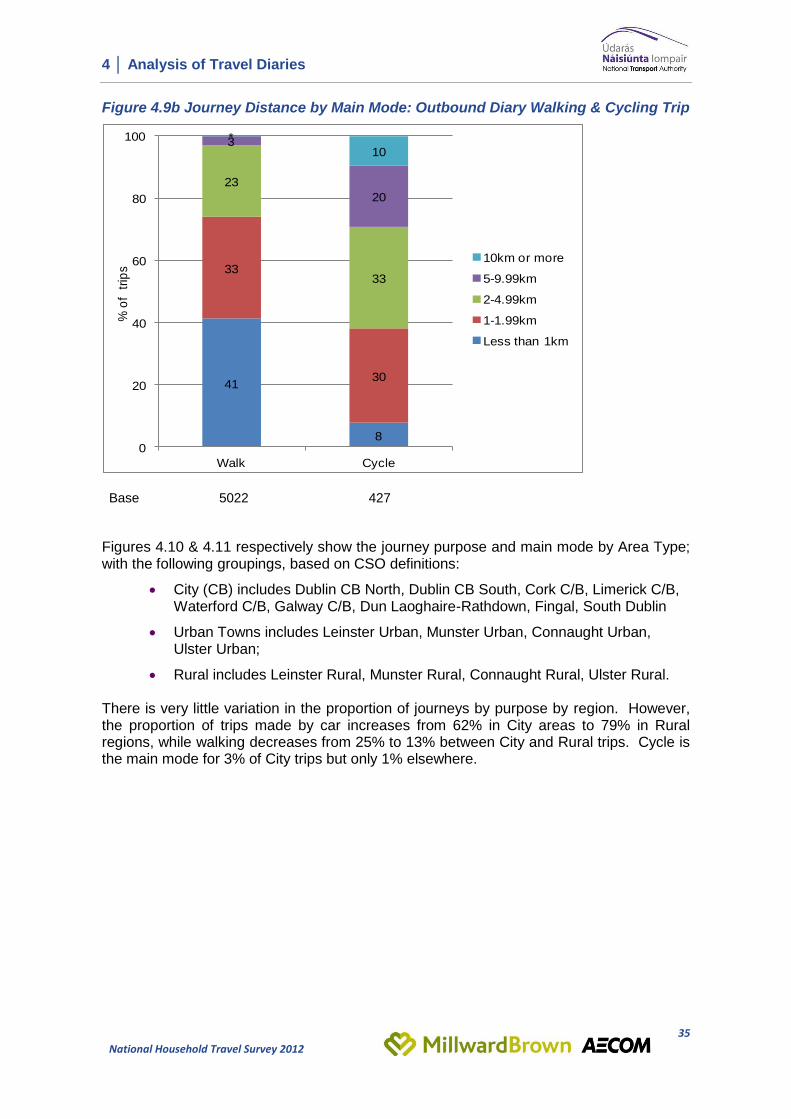
Three quarters of walk trips are under 2km and 41% are under a kilometre. Just under two thirds (63%) of cycle trips are between 1 and 5 kilometres, but a three in ten are in excess of 5km and 10% are greater than 10km
46
25 19
34
20
29
20
20
11
18
20
16
7 12
8
8
15
32 22
0
20
40
60
80
100
Car Bus Dart/ Train/LUAS Other
% of trips
20km or more
15 - 19.99km
10 - 14.99km
5 - 9.99km
Less than 5km
16
4 │ Analysis of Travel Diaries
35
National Household Travel Survey 2012
Figure 4.9b Journey Distance by Main Mode: Outbound Diary Walking & Cycling Trip
41
8
33
30
23
33
3
20
*
10
0
20
40
60
80
100
Walk Cycle
% o
f t
rip
s
10km or more
5-9.99km
2-4.99km
1-1.99km
Less than 1km
Base 5022 427
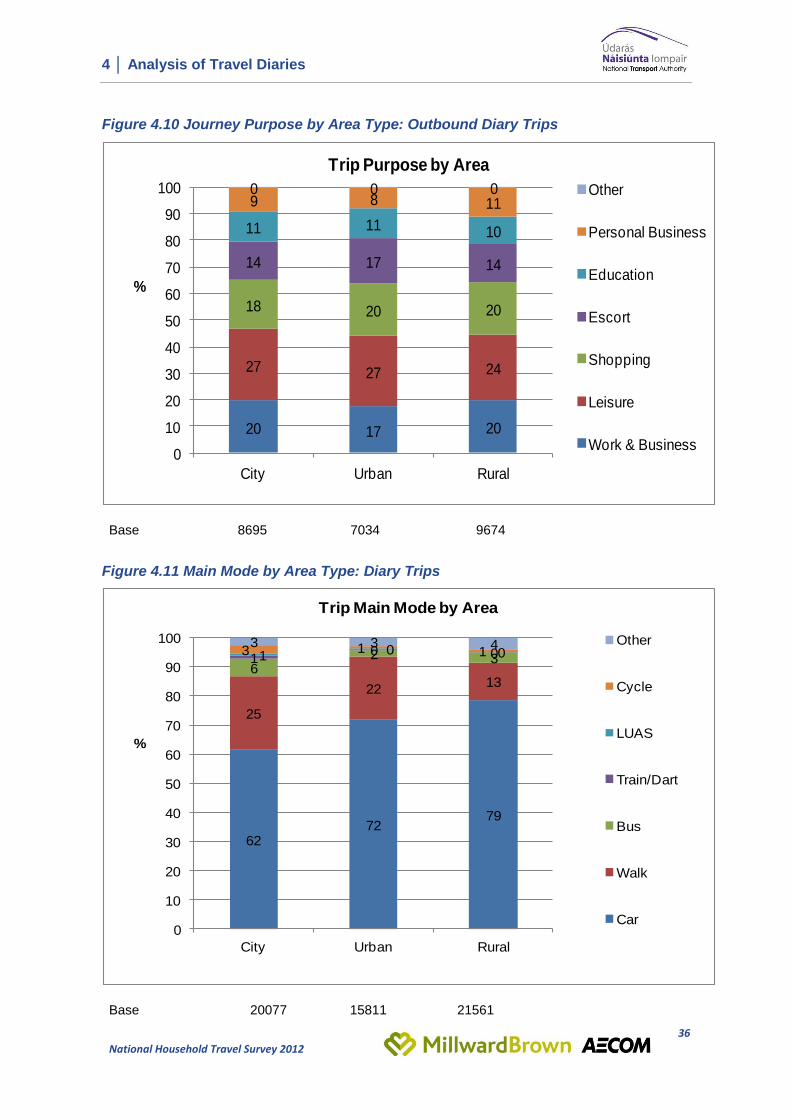
Figures 4.10 & 4.11 respectively show the journey purpose and main mode by Area Type; with the following groupings, based on CSO definitions:
City (CB) includes Dublin CB North, Dublin CB South, Cork C/B, Limerick C/B, Waterford C/B, Galway C/B, Dun Laoghaire-Rathdown, Fingal, South Dublin
Urban Towns includes Leinster Urban, Munster Urban, Connaught Urban, Ulster Urban;
Rural includes Leinster Rural, Munster Rural, Connaught Rural, Ulster Rural. There is very little variation in the proportion of journeys by purpose by region. However, the proportion of trips made by car increases from 62% in City areas to 79% in Rural regions, while walking decreases from 25% to 13% between City and Rural trips. Cycle is the main mode for 3% of City trips but only 1% elsewhere.
4 │ Analysis of Travel Diaries
36
National Household Travel Survey 2012
Figure 4.10 Journey Purpose by Area Type: Outbound Diary Trips
20 17 20
27 27 24
18 20 20
14 17 14
11 11 10
9 8 110 0 0
0
10
20
30
40
50
60
70
80
90
100
City Urban Rural
%
Trip Purpose by Area
Other
Personal Business
Education
Escort
Shopping
Leisure
Work & Business
Base 8695 7034 9674
Figure 4.11 Main Mode by Area Type: Diary Trips
6272
79
25
2213
62 310 01 0 03 1 1
3 3 4
0
10
20
30
40
50
60
70
80
90
100
City Urban Rural
%
Trip Main Mode by Area
Other
Cycle
LUAS
Train/Dart
Bus
Walk
Car
Base 20077 15811 21561
4 │ Analysis of Travel Diaries
37
National Household Travel Survey 2012
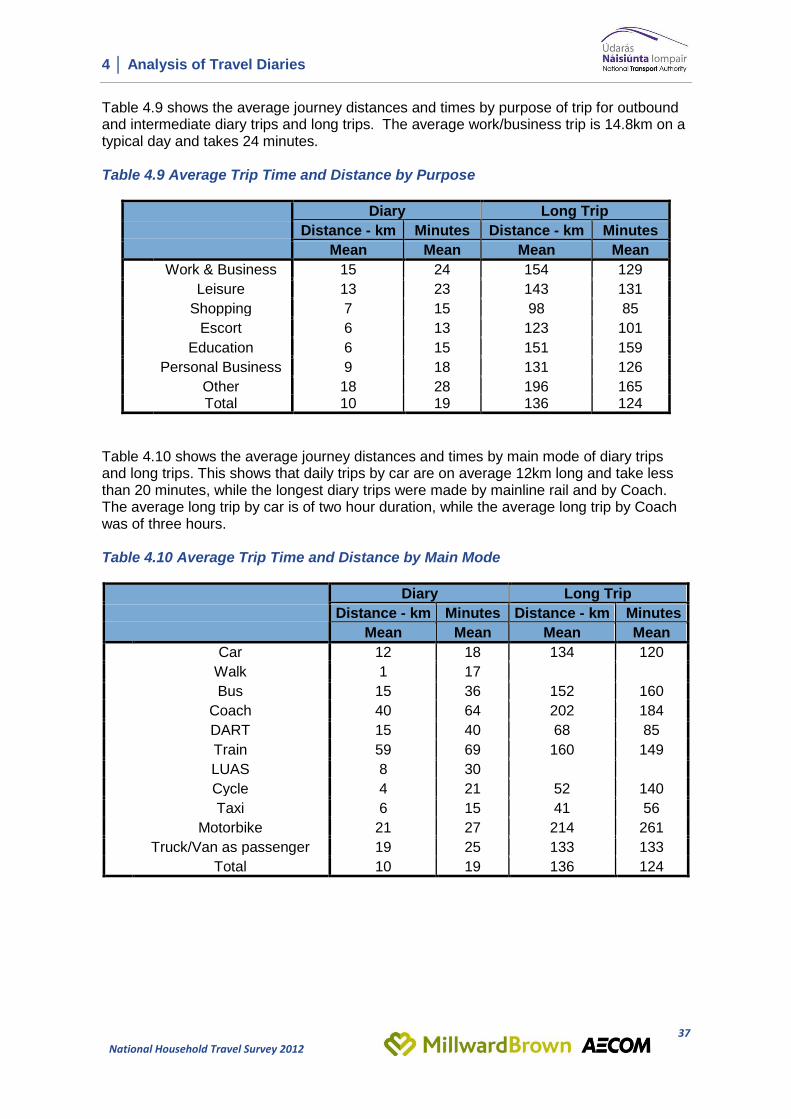
Table 4.9 shows the average journey distances and times by purpose of trip for outbound and intermediate diary trips and long trips. The average work/business trip is 14.8km on a typical day and takes 24 minutes. Table 4.9 Average Trip Time and Distance by Purpose
Diary Long Trip
Distance - km Minutes Distance - km Minutes
Mean Mean Mean Mean
Work & Business 15 24 154 129
Leisure 13 23 143 131
Shopping 7 15 98 85
Escort 6 13 123 101
Education 6 15 151 159
Personal Business 9 18 131 126
Other 18 28 196 165 Total 10 19 136 124
Table 4.10 shows the average journey distances and times by main mode of diary trips and long trips. This shows that daily trips by car are on average 12km long and take less than 20 minutes, while the longest diary trips were made by mainline rail and by Coach. The average long trip by car is of two hour duration, while the average long trip by Coach was of three hours. Table 4.10 Average Trip Time and Distance by Main Mode
Diary Long Trip
Distance - km Minutes Distance - km Minutes
Mean Mean Mean Mean
Car 12 18 134 120
Walk 1 17
Bus 15 36 152 160
Coach 40 64 202 184
DART 15 40 68 85
Train 59 69 160 149
LUAS 8 30
Cycle 4 21 52 140
Taxi 6 15 41 56
Motorbike 21 27 214 261
Truck/Van as passenger 19 25 133 133
Total 10 19 136 124
4 │ Analysis of Travel Diaries
38
National Household Travel Survey 2012
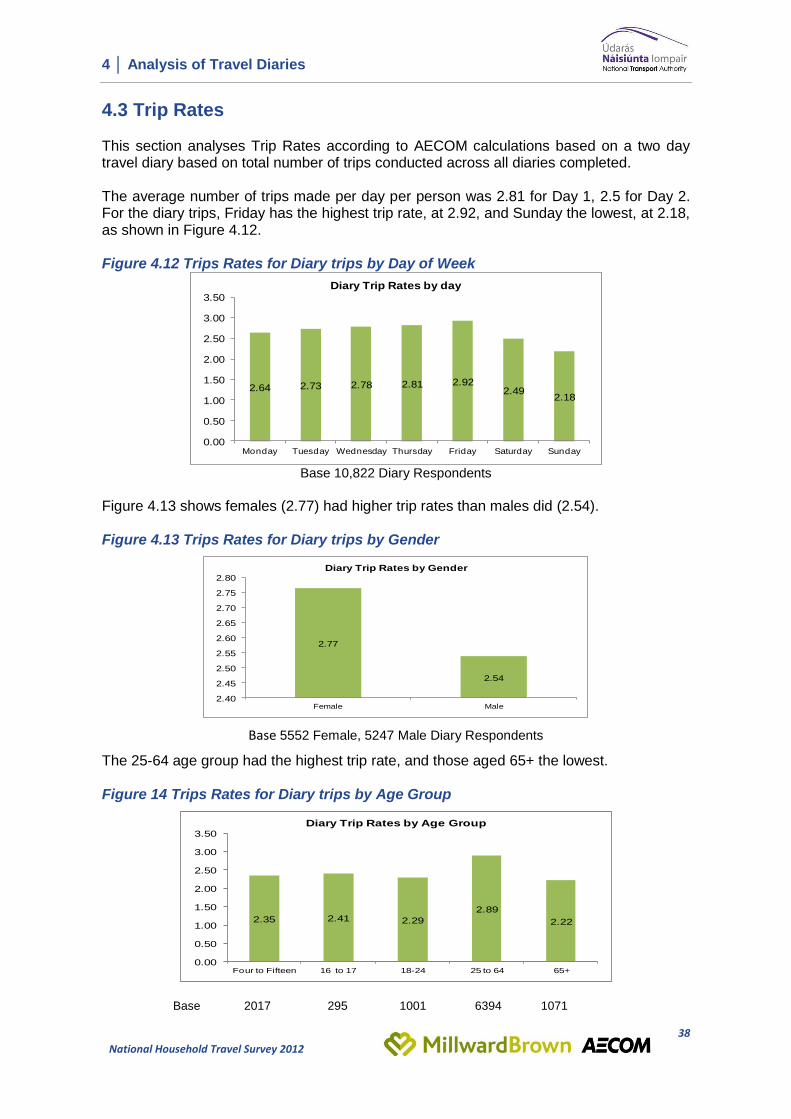
4.3 Trip Rates This section analyses Trip Rates according to AECOM calculations based on a two day travel diary based on total number of trips conducted across all diaries completed. The average number of trips made per day per person was 2.81 for Day 1, 2.5 for Day 2. For the diary trips, Friday has the highest trip rate, at 2.92, and Sunday the lowest, at 2.18, as shown in Figure 4.12. Figure 4.12 Trips Rates for Diary trips by Day of Week
2.64 2.73 2.78 2.81 2.922.49
2.18
0.00
0.50
1.00
1.50
2.00
2.50
3.00
3.50
Monday Tuesday Wednesday Thursday Friday Saturday Sunday
Diary Trip Rates by day
Base 10,822 Diary Respondents
Figure 4.13 shows females (2.77) had higher trip rates than males did (2.54). Figure 4.13 Trips Rates for Diary trips by Gender
2.77
2.54
2.40
2.45
2.50
2.55
2.60
2.65
2.70
2.75
2.80
Female Male
Diary Trip Rates by Gender
Base 5552 Female, 5247 Male Diary Respondents
The 25-64 age group had the highest trip rate, and those aged 65+ the lowest. Figure 14 Trips Rates for Diary trips by Age Group
2.35 2.41 2.29
2.89
2.22
0.00
0.50
1.00
1.50
2.00
2.50
3.00
3.50
Four to Fifteen 16 to 17 18-24 25 to 64 65+
Diary Trip Rates by Age Group
Base 2017 295 1001 6394 1071
4 │ Analysis of Travel Diaries
39
National Household Travel Survey 2012
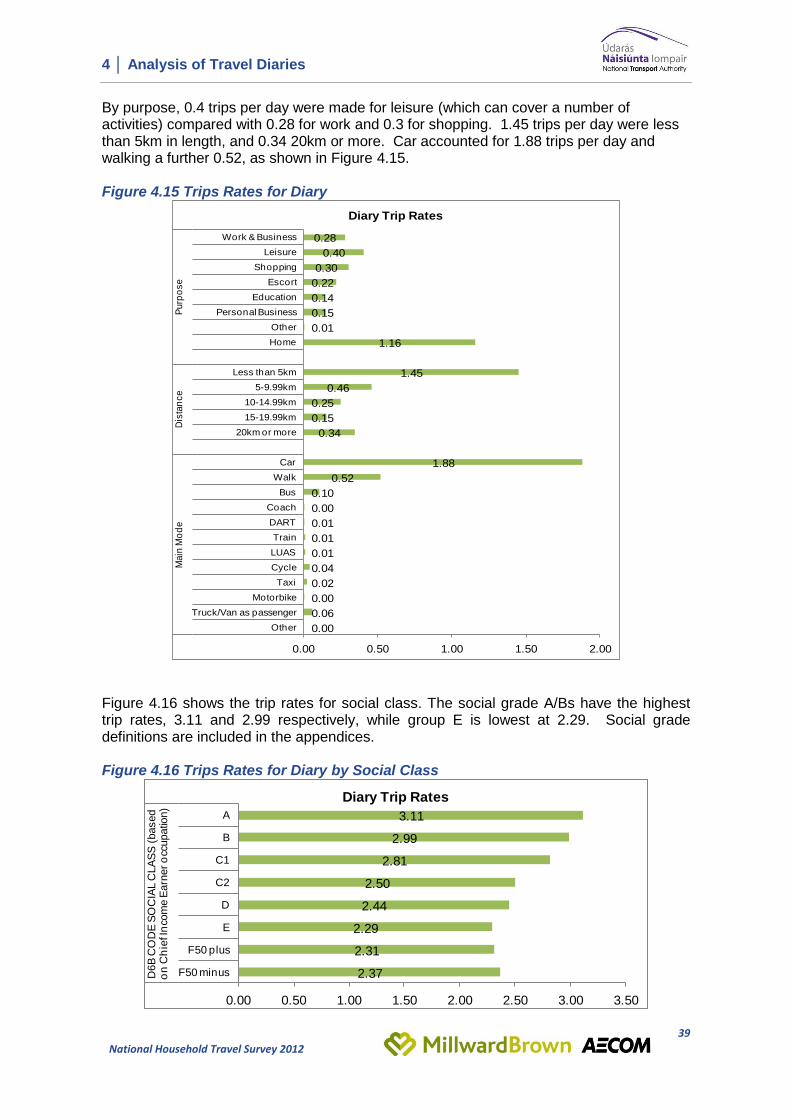
By purpose, 0.4 trips per day were made for leisure (which can cover a number of activities) compared with 0.28 for work and 0.3 for shopping. 1.45 trips per day were less than 5km in length, and 0.34 20km or more. Car accounted for 1.88 trips per day and walking a further 0.52, as shown in Figure 4.15. Figure 4.15 Trips Rates for Diary
0.28
0.40
0.30
0.22
0.14
0.15
0.01
1.16
1.45
0.46
0.25
0.15
0.34
1.88
0.52
0.10
0.00
0.01
0.01
0.01
0.04
0.02
0.00
0.06
0.00
0.00 0.50 1.00 1.50 2.00
Work & Business
Leisure
Shopping
Escort
Education
Personal Business
Other
Home
Less than 5km
5-9.99km
10-14.99km
15-19.99km
20km or more
Car
Walk
Bus
Coach
DART
Train
LUAS
Cycle
Taxi
Motorbike
Truck/Van as passenger
Other
Purp
ose
Dis
tan
ce
Main
Mo
de
Diary Trip Rates
Figure 4.16 shows the trip rates for social class. The social grade A/Bs have the highest trip rates, 3.11 and 2.99 respectively, while group E is lowest at 2.29. Social grade definitions are included in the appendices. Figure 4.16 Trips Rates for Diary by Social Class
3.11
2.99
2.81
2.50
2.44
2.29
2.31
2.37
0.00 0.50 1.00 1.50 2.00 2.50 3.00 3.50
A
B
C1
C2
D
E
F50 plus
F50 minusD6B
CO
DE
SO
CIA
L C
LA
SS
(based
o
n C
hie
f In
com
e E
arn
er o
ccupatio
n)
Diary Trip Rates
4 │ Analysis of Travel Diaries
40
National Household Travel Survey 2012
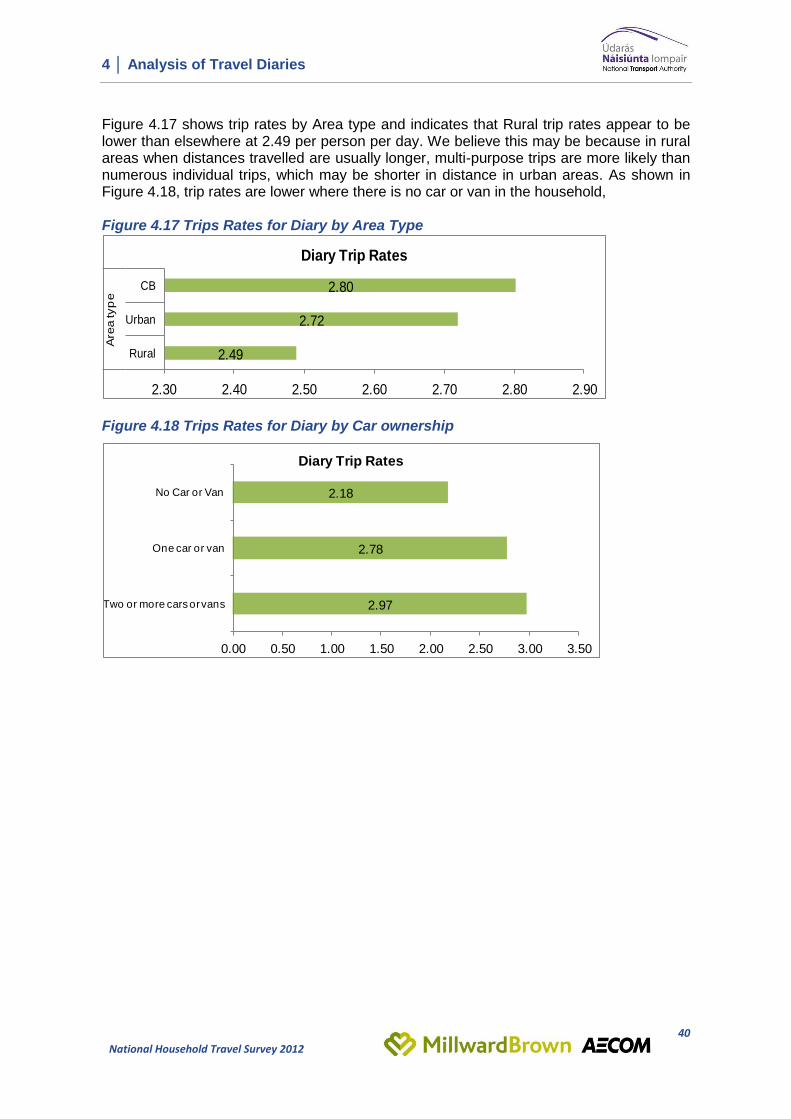
Figure 4.17 shows trip rates by Area type and indicates that Rural trip rates appear to be lower than elsewhere at 2.49 per person per day. We believe this may be because in rural areas when distances travelled are usually longer, multi-purpose trips are more likely than numerous individual trips, which may be shorter in distance in urban areas. As shown in Figure 4.18, trip rates are lower where there is no car or van in the household, Figure 4.17 Trips Rates for Diary by Area Type
2.80
2.72
2.49
2.30 2.40 2.50 2.60 2.70 2.80 2.90
CB
Urban
Rural
Are
a typ
e
Diary Trip Rates
Figure 4.18 Trips Rates for Diary by Car ownership
2.18
2.78
2.97
0.00 0.50 1.00 1.50 2.00 2.50 3.00 3.50
No Car or Van
One car or van
Two or more cars or vans
Diary Trip Rates
4 │ Analysis of Travel Diaries
41
National Household Travel Survey 2012
4.4 Free Travel Pass Ownership
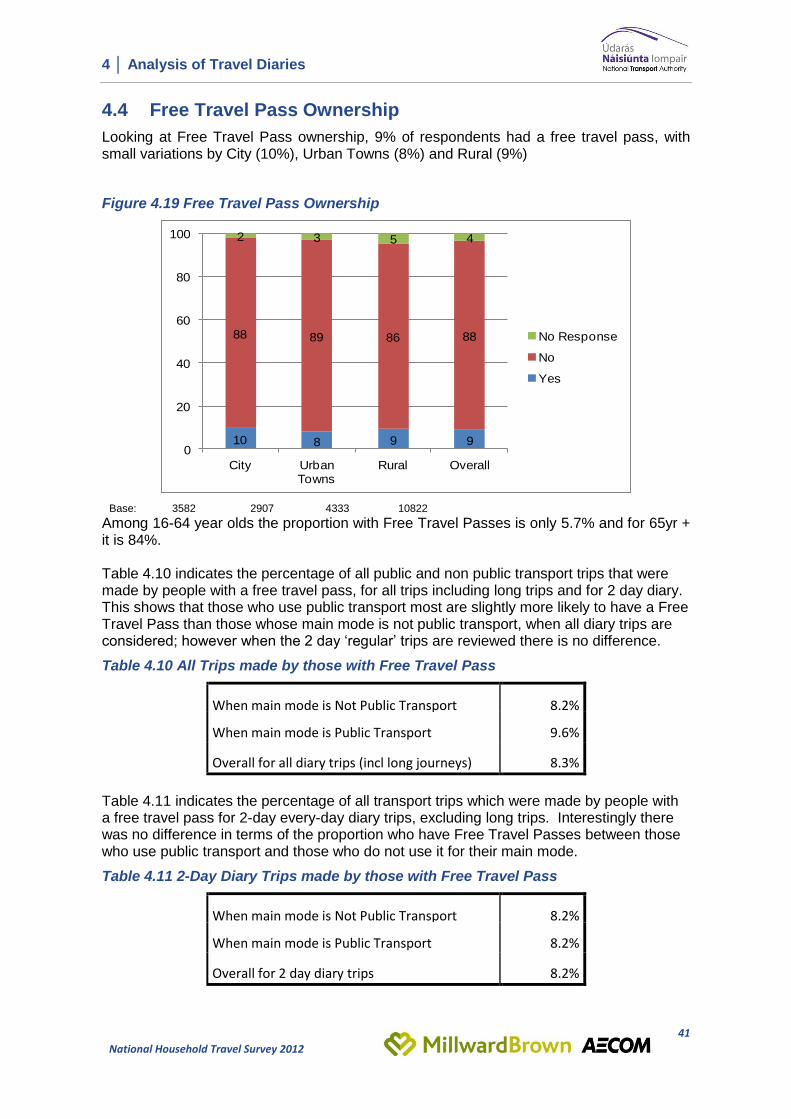
Looking at Free Travel Pass ownership, 9% of respondents had a free travel pass, with small variations by City (10%), Urban Towns (8%) and Rural (9%)
Figure 4.19 Free Travel Pass Ownership
10 8 9 9
88 89 86 88
2 3 5 4
0
20
40
60
80
100
City Urban Towns
Rural Overall
No Response
No
Yes
Base: 3582 2907 4333 10822
Among 16-64 year olds the proportion with Free Travel Passes is only 5.7% and for 65yr + it is 84%. Table 4.10 indicates the percentage of all public and non public transport trips that were made by people with a free travel pass, for all trips including long trips and for 2 day diary. This shows that those who use public transport most are slightly more likely to have a Free Travel Pass than those whose main mode is not public transport, when all diary trips are considered; however when the 2 day ‘regular’ trips are reviewed there is no difference.
Table 4.10 All Trips made by those with Free Travel Pass
When main mode is Not Public Transport 8.2%
When main mode is Public Transport 9.6%
Overall for all diary trips (incl long journeys) 8.3%
Table 4.11 indicates the percentage of all transport trips which were made by people with a free travel pass for 2-day every-day diary trips, excluding long trips. Interestingly there was no difference in terms of the proportion who have Free Travel Passes between those who use public transport and those who do not use it for their main mode.
Table 4.11 2-Day Diary Trips made by those with Free Travel Pass
When main mode is Not Public Transport 8.2%
When main mode is Public Transport 8.2%
Overall for 2 day diary trips 8.2%
4 │ Analysis of Travel Diaries
42
National Household Travel Survey 2012
4.5 Trends in Travel Diary Analysis in Greater Dublin Area Introduction This section presents some summary outputs from a sample of the diary data collected on behalf of The Authority during 2012 by Millward Brown and analysed by AECOM, relating to households from the Greater Dublin Area (GDA) comprising exclusively of counties Dublin, Kildare, Meath and Wicklow and where possible, comparisons have been drawn with 2006 data for the same region to indicate trends and changes in travel behaviour. In order to make comparisons with data collected in 2006, data from 2012 was only included for respondents aged 11 or over as this was the lower age cut-off in 2006. Trips with lengths of less than 1 mile are also excluded as this was the basis for the reported trips in 2006. The 2012 sample of 2,868 respondents made 11,277 trips (2.0 trips per person per day) and the number of respondents for 2006 was 2,630, for a seven day diary, resulting in over 32,000 trips recorded. Table 4.5.1 shows the spread of diaries by month. The 2006 survey was undertaken over a different period, i.e. the Spring/early Summer, although in both surveys, school holiday times were not included. This should be borne in mind when comparing results, as time of year, and especially length of daylight coming into the autumn, can affect modes used. Table 4.5.1 Month Diaries Recorded (2006 & 2012)
2006 2012 Frequency Percent Cumulative
Percent
Frequency Percent Cumulative Percent
March
1628 61.9 61.9
- - -
April 38 1.3 1.3
May 738 25.7 27.1
June 1002 38.1 100.0 597 20.8 47.9
September - - - 631 22 69.9
October - - - 633 22.1 91.9
November - - - 231 8.1 100.0
Total 2630 100 2868 100
Table 4.5.2 shows that slightly more than half of the diaries were completed by female respondents, slightly more so in 2006 than 2012. Table 4.5.2 Respondent Gender (2006 & 2012)
2006 2012
Frequency Percent Frequency Percent
Valid Female 1443 54.9 1486 51.8
Male 1187 45.1 1382 48.2
Total 2630 100 2868 100
Table 4.5.3 shows the spread of age ranges of respondents, with fewer under 14s in 2006, but more 19-34 yr olds and less 50-64 yr olds. The length of diary (7 day in 2006 versus 2 day in 2012) may have impacted on some groups (i.e. younger group).
4 │ Analysis of Travel Diaries
43
National Household Travel Survey 2012
Table 4.5.3 Age Groups (2006 & 2012) 2006 2012
Frequency Percent Valid Percent
Frequency Percent Valid Percent
Valid 11-14 35 1.3 1.3 185 6.5 6.5
15-18 203 7.7 7.8 201 7 7
19-34 853 32.4 32.9 668 23.3 23.3
35-49 743 28.3 28.7 866 30.2 30.2
50-64 478 18.2 18.4 660 23 23
65+ 281 10.7 10.8 286 10 10
Total 2593 98.6 100.0 2866 99.9 100
Missing 37 1.4 2 0.1
Total 2630 100 2868 100
Diary Trips From the 2012 two day travel diary, 11,277 trips were recorded. Fourteen percent of trips in 2012 were intermediate trips where the origin and destination was not ‘home’; higher than the 8% of trips of this type found in 2006. Table 4.5.4 GDA Trips by Trip Type (2006, 2012)
2006 Diary 2012 Diary
All Days % Over 2 days %
Outbound 15381 46.9 4880 43.3
Intermediate 2248 8.0 1608 14.3
Return 14943 45.1 4789 42.5 Total trips 32572 11277
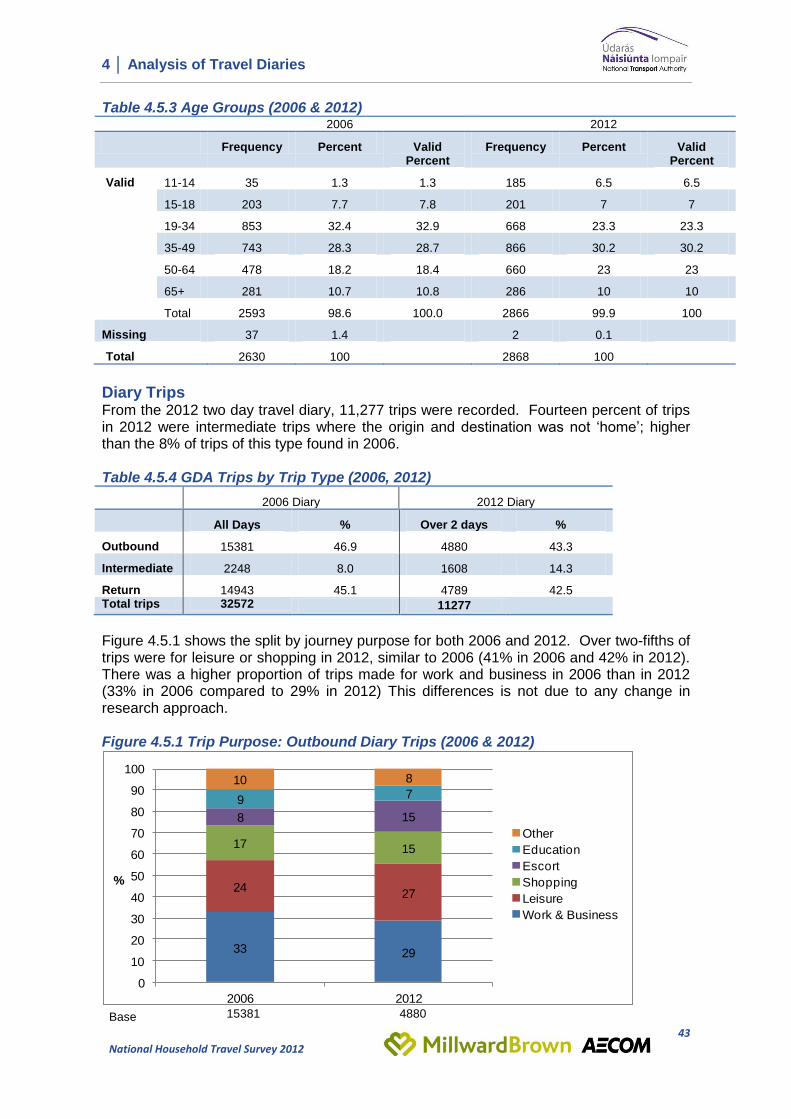
Figure 4.5.1 shows the split by journey purpose for both 2006 and 2012. Over two-fifths of trips were for leisure or shopping in 2012, similar to 2006 (41% in 2006 and 42% in 2012). There was a higher proportion of trips made for work and business in 2006 than in 2012 (33% in 2006 compared to 29% in 2012) This differences is not due to any change in research approach. Figure 4.5.1 Trip Purpose: Outbound Diary Trips (2006 & 2012)
33 29
2427
17 15
8 15
9 710 8
0
10
20
30
40
50
60
70
80
90
100
2006 2012
%
Other
Education
Escort
Shopping
Leisure
Work & Business
Base 15381 4880
4 │ Analysis of Travel Diaries
44
National Household Travel Survey 2012
Note: 2012 groupings made consistent with 2006
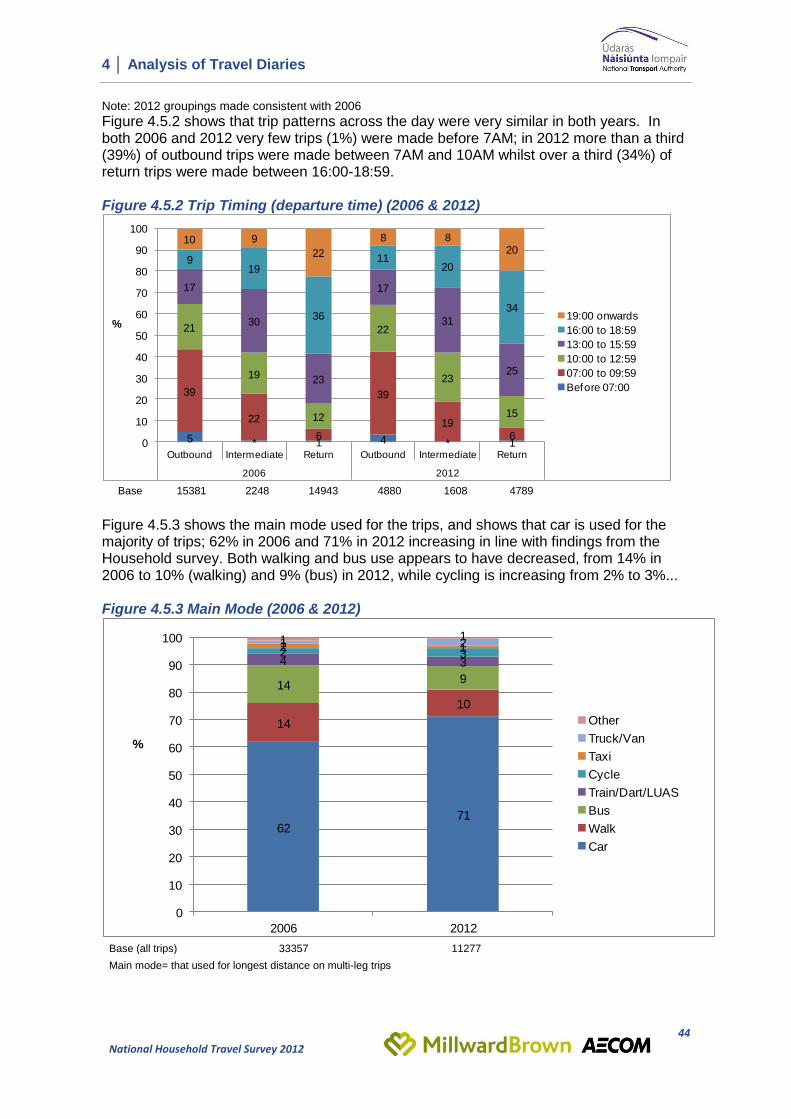
Figure 4.5.2 shows that trip patterns across the day were very similar in both years. In both 2006 and 2012 very few trips (1%) were made before 7AM; in 2012 more than a third (39%) of outbound trips were made between 7AM and 10AM whilst over a third (34%) of return trips were made between 16:00-18:59. Figure 4.5.2 Trip Timing (departure time) (2006 & 2012)
5 * 1 4 * 1
39
22
6
39
19
6
21
19
12
22
23
15
17
30
23
17
31
25
919
36
1120
34
10 9
22
8 820
0
10
20
30
40
50
60
70
80
90
100
Outbound Intermediate Return Outbound Intermediate Return
2006 2012
%19:00 onwards
16:00 to 18:59
13:00 to 15:59
10:00 to 12:59
07:00 to 09:59
Before 07:00
Base 15381 2248 14943 4880 1608 4789
Figure 4.5.3 shows the main mode used for the trips, and shows that car is used for the majority of trips; 62% in 2006 and 71% in 2012 increasing in line with findings from the Household survey. Both walking and bus use appears to have decreased, from 14% in 2006 to 10% (walking) and 9% (bus) in 2012, while cycling is increasing from 2% to 3%... Figure 4.5.3 Main Mode (2006 & 2012)
6271
14
10
149
4 32 32 11 21 1
0
10
20
30
40
50
60
70
80
90
100
2006 2012
%
Other
Truck/Van
Taxi
Cycle
Train/Dart/LUAS
Bus
Walk
Car
Base (all trips) 33357 11277
Main mode= that used for longest distance on multi-leg trips
4 │ Analysis of Travel Diaries
45
National Household Travel Survey 2012
Figures 4.5.4a&b show the time profile of outbound diary trips for 2012 and 2006. In 2006 the majority of outbound work/business trips were made between 7AM and 10AM, while leisure trips were made after 10AM and spread throughout the day. The peak time for shopping trips is between 10AM and 1PM. The peak time for return trips was between 16:00 and 18:59. Figure 4.5.4a Time Profile: Outbound Diary Trips 2012
145
930
133 92 54 41
10
155
333293
271 2462
85
340
186
9333
7
342
102
157
65
40
2
284
25
12
11
5
4
92
137
76
55
22
0
200
400
600
800
1000
1200
1400
1600
1800
2000
Before 07:00
07:00 to 09:59
10:00 to 12:59
13:00 to 15:59
16:00 to 18:59
19:00 onwards
n
Other
Education
Escort
Shopping
Leisure
Work & Business
Base 170 1888 1070 816 549 387
(2012 outbound trips)
Figure 4.5.4b Time Profile: Outbound Diary Trips 2006
(2006 outbound trips)
4 │ Analysis of Travel Diaries
46
National Household Travel Survey 2012
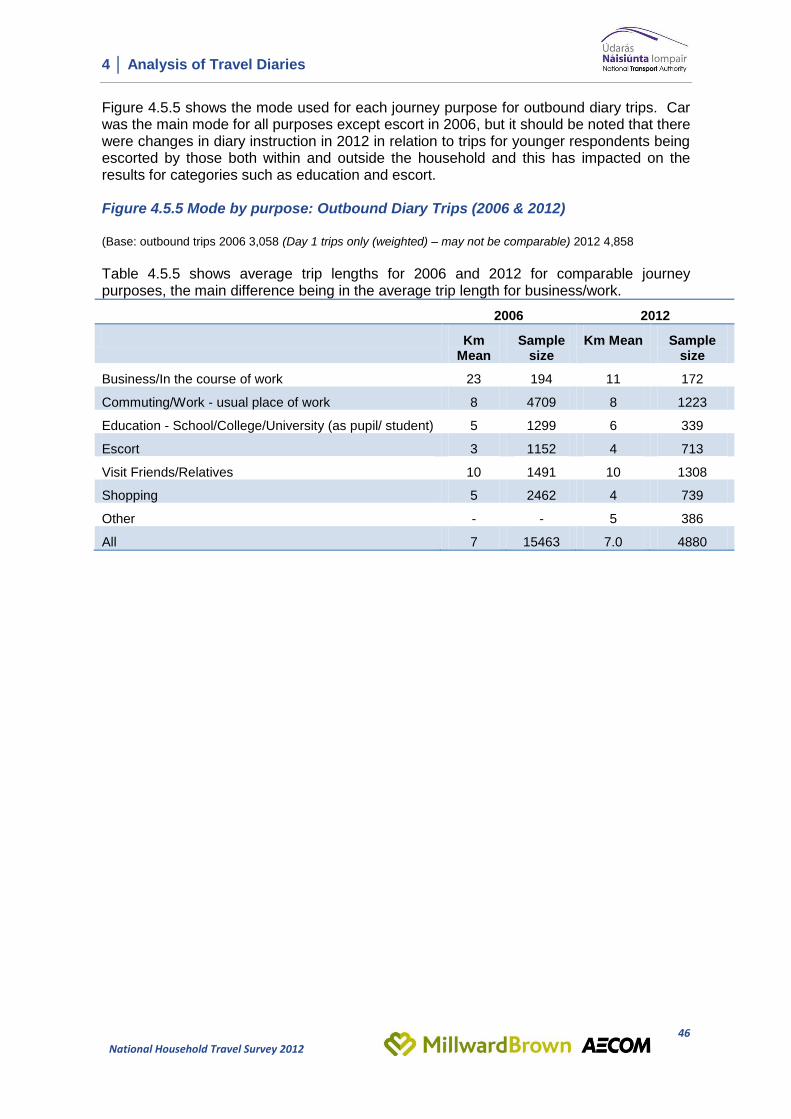
Figure 4.5.5 shows the mode used for each journey purpose for outbound diary trips. Car was the main mode for all purposes except escort in 2006, but it should be noted that there were changes in diary instruction in 2012 in relation to trips for younger respondents being escorted by those both within and outside the household and this has impacted on the results for categories such as education and escort. Figure 4.5.5 Mode by purpose: Outbound Diary Trips (2006 & 2012) (Base: outbound trips 2006 3,058 (Day 1 trips only (weighted) – may not be comparable) 2012 4,858
Table 4.5.5 shows average trip lengths for 2006 and 2012 for comparable journey purposes, the main difference being in the average trip length for business/work.
2006 2012
Km Mean
Sample size
Km Mean Sample size
Business/In the course of work 23 194 11 172
Commuting/Work - usual place of work 8 4709 8 1223
Education - School/College/University (as pupil/ student) 5 1299 6 339
Escort 3 1152 4 713
Visit Friends/Relatives 10 1491 10 1308
Shopping 5 2462 4 739
Other - - 5 386
All 7 15463 7.0 4880
4 │ Analysis of Travel Diaries
47
National Household Travel Survey 2012
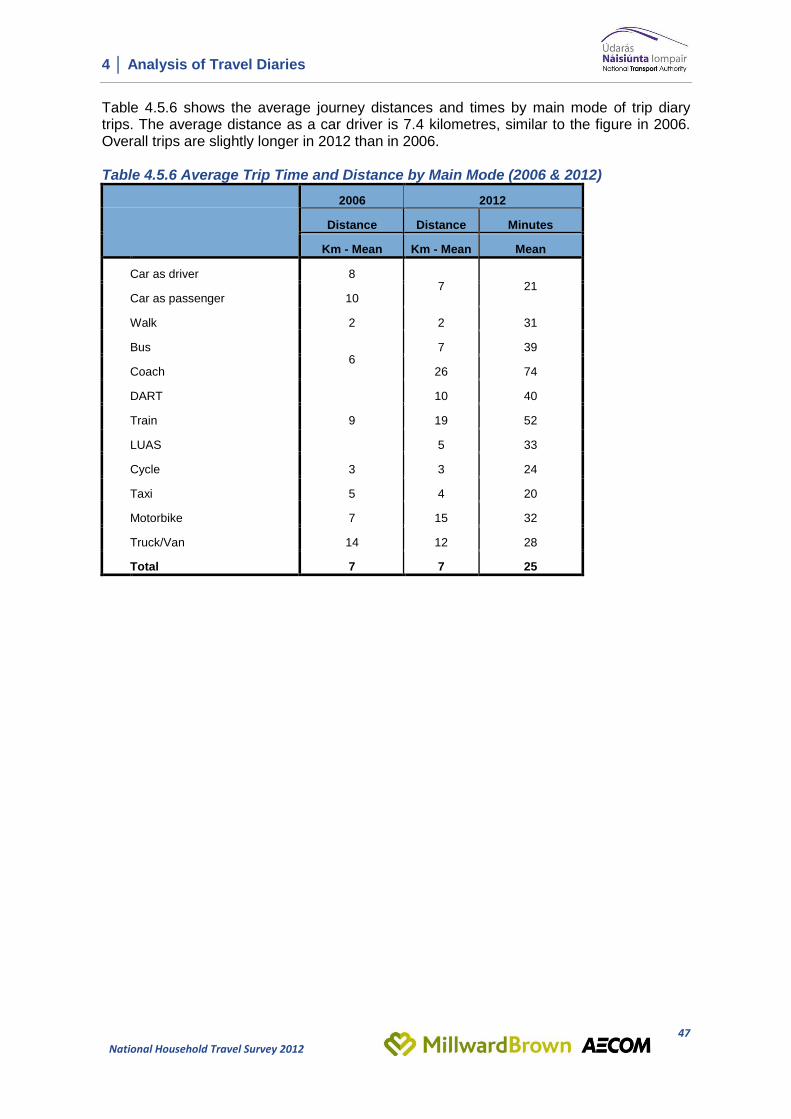
Table 4.5.6 shows the average journey distances and times by main mode of trip diary trips. The average distance as a car driver is 7.4 kilometres, similar to the figure in 2006. Overall trips are slightly longer in 2012 than in 2006. Table 4.5.6 Average Trip Time and Distance by Main Mode (2006 & 2012)
2006 2012
Distance Distance Minutes
Km - Mean Km - Mean Mean
Car as driver 8 7 21
Car as passenger 10
Walk 2 2 31
Bus 6
7 39
Coach 26 74
DART
9
10 40
Train 19 52
LUAS 5 33
Cycle 3 3 24
Taxi 5 4 20
Motorbike 7 15 32
Truck/Van 14 12 28
Total 7 7 25
5 │ Summary of Key Findings
48
National Household Travel Survey 2012
5. Summary of Key Findings The key findings from this analysis of the National Household Travel Survey Diary 2013 are summarised below:
The broadening of the Household Travel Survey to a nationwide catchment in 2012 has confirmed that travel patterns, modes used, trips rates, etc, differ by area of residence, with key differences between Rural and Urban & City locations.
Trip rates are lower in Rural areas, as they are generally longer and multi-purpose e.g. escort, work, shopping, etc.
Trip rates are higher for women at 2.77 versus men at 2.54,
Trip rates are higher on Friday for normal every day trips, increasing as the weekdays progress. Long trips rates are highest on Saturdays.
The car is the main mode of transport with almost three quarter (73%) using it most often, in the Greater Dublin Area increasing on 2006 levels (from 52% to 64%), while the bus has decreased during this time period in the GDA (18% to 12%).
While trips by car account for less Education trips than other purposes, it still accounts for 59% of all Education trips. Furthermore 68% of Education trips are less than 5km, and 57% are less than 15 minutes, so some of these shorter Educations trips are being made by car.
Public transport options are least likely to be used for grocery shopping and for education, with the exception of buses which have their own part to play in both.
There are very specific reasons why certain modes are chosen most often: - Cars/vans are chosen for a number of reasons such as when there is no
other choice and being convenient for shopping, and it’s the key mode when choosing for family convenience.
- Taxis are used when there is no other choice, but also for a degree of reliability.
- Within their own context both Motorbike and Bicycles are seen as Fast and also rated highly for Value.
- Cycling and Walking are seen as Healthy options and Good for the environment.
- Those who use the Bus most often believe it is good value for money, but some use it when there are no other options and the Bus is noticeably less associated with speed than other modes.
- Those who use the Train/Dart most often see it is a convenient way to get to work and also perceive it as good value. The Luas is seen as comfortable and also good value along the same route, and this combined with parking charges is impacting on users perceptions.
Car licences are held by 4 in 5 of the survey participants, and the vast majority are
full licences. In the GDA region we see a drop in provisional licences from 17% in 2006 to 6% in 2012.
Based on respondent feedback from the household survey, 13% of our sample has a free ticket/pass; this rises to 18% among those who use public transport and is 84% among those aged 65 years and over.
Appendix
Appendix – Survey Questionnaire
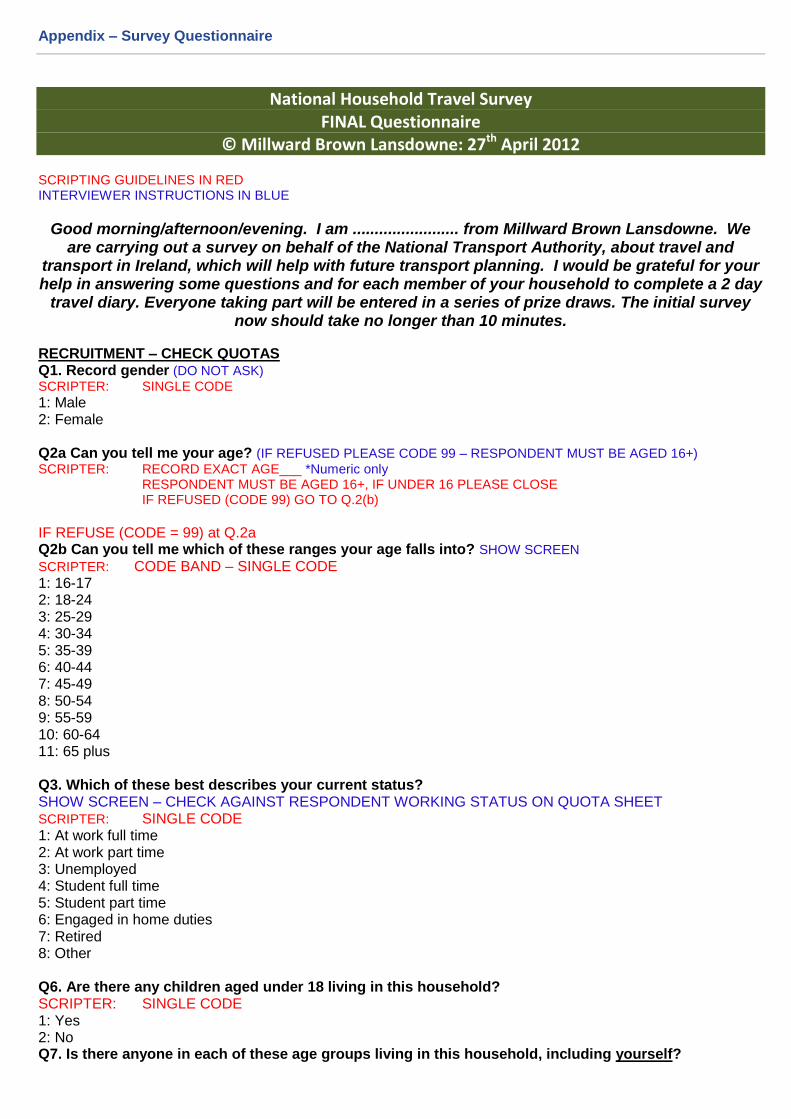
National Household Travel Survey FINAL Questionnaire
© Millward Brown Lansdowne: 27th April 2012 SCRIPTING GUIDELINES IN RED INTERVIEWER INSTRUCTIONS IN BLUE
Good morning/afternoon/evening. I am ........................ from Millward Brown Lansdowne. We are carrying out a survey on behalf of the National Transport Authority, about travel and
transport in Ireland, which will help with future transport planning. I would be grateful for your help in answering some questions and for each member of your household to complete a 2 day
travel diary. Everyone taking part will be entered in a series of prize draws. The initial survey now should take no longer than 10 minutes.
RECRUITMENT – CHECK QUOTAS Q1. Record gender (DO NOT ASK) SCRIPTER: SINGLE CODE
1: Male 2: Female Q2a Can you tell me your age? (IF REFUSED PLEASE CODE 99 – RESPONDENT MUST BE AGED 16+) SCRIPTER: RECORD EXACT AGE___ *Numeric only
RESPONDENT MUST BE AGED 16+, IF UNDER 16 PLEASE CLOSE IF REFUSED (CODE 99) GO TO Q.2(b)
IF REFUSE (CODE = 99) at Q.2a Q2b Can you tell me which of these ranges your age falls into? SHOW SCREEN SCRIPTER: CODE BAND – SINGLE CODE
1: 16-17 2: 18-24 3: 25-29 4: 30-34 5: 35-39 6: 40-44 7: 45-49 8: 50-54 9: 55-59 10: 60-64 11: 65 plus Q3. Which of these best describes your current status? SHOW SCREEN – CHECK AGAINST RESPONDENT WORKING STATUS ON QUOTA SHEET SCRIPTER: SINGLE CODE 1: At work full time 2: At work part time 3: Unemployed 4: Student full time 5: Student part time 6: Engaged in home duties 7: Retired 8: Other Q6. Are there any children aged under 18 living in this household? SCRIPTER: SINGLE CODE 1: Yes 2: No Q7. Is there anyone in each of these age groups living in this household, including yourself?
Appendix – Survey Questionnaire
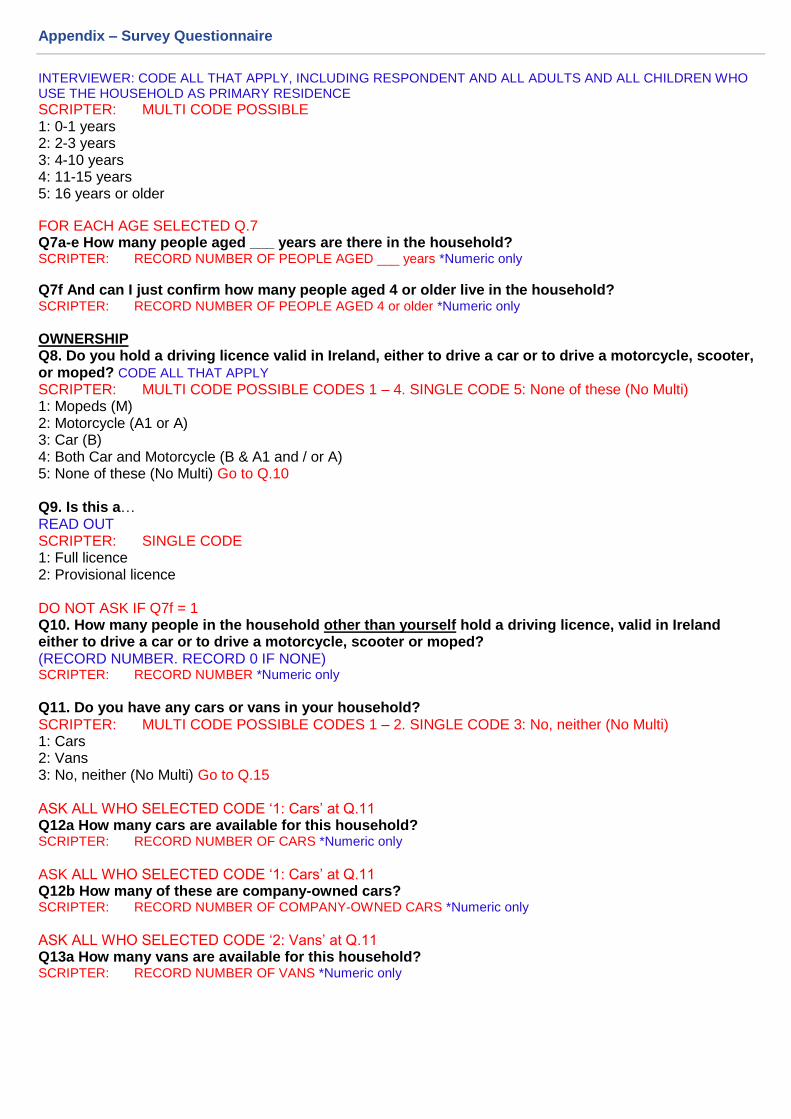
INTERVIEWER: CODE ALL THAT APPLY, INCLUDING RESPONDENT AND ALL ADULTS AND ALL CHILDREN WHO USE THE HOUSEHOLD AS PRIMARY RESIDENCE
SCRIPTER: MULTI CODE POSSIBLE 1: 0-1 years 2: 2-3 years 3: 4-10 years 4: 11-15 years 5: 16 years or older
FOR EACH AGE SELECTED Q.7 Q7a-e How many people aged ___ years are there in the household? SCRIPTER: RECORD NUMBER OF PEOPLE AGED ___ years *Numeric only
Q7f And can I just confirm how many people aged 4 or older live in the household? SCRIPTER: RECORD NUMBER OF PEOPLE AGED 4 or older *Numeric only
OWNERSHIP Q8. Do you hold a driving licence valid in Ireland, either to drive a car or to drive a motorcycle, scooter, or moped? CODE ALL THAT APPLY SCRIPTER: MULTI CODE POSSIBLE CODES 1 – 4. SINGLE CODE 5: None of these (No Multi) 1: Mopeds (M) 2: Motorcycle (A1 or A) 3: Car (B) 4: Both Car and Motorcycle (B & A1 and / or A) 5: None of these (No Multi) Go to Q.10 Q9. Is this a… READ OUT SCRIPTER: SINGLE CODE 1: Full licence 2: Provisional licence DO NOT ASK IF Q7f = 1 Q10. How many people in the household other than yourself hold a driving licence, valid in Ireland either to drive a car or to drive a motorcycle, scooter or moped? (RECORD NUMBER. RECORD 0 IF NONE) SCRIPTER: RECORD NUMBER *Numeric only
Q11. Do you have any cars or vans in your household? SCRIPTER: MULTI CODE POSSIBLE CODES 1 – 2. SINGLE CODE 3: No, neither (No Multi) 1: Cars 2: Vans 3: No, neither (No Multi) Go to Q.15 ASK ALL WHO SELECTED CODE ‘1: Cars’ at Q.11 Q12a How many cars are available for this household? SCRIPTER: RECORD NUMBER OF CARS *Numeric only
ASK ALL WHO SELECTED CODE ‘1: Cars’ at Q.11 Q12b How many of these are company-owned cars? SCRIPTER: RECORD NUMBER OF COMPANY-OWNED CARS *Numeric only
ASK ALL WHO SELECTED CODE ‘2: Vans’ at Q.11 Q13a How many vans are available for this household? SCRIPTER: RECORD NUMBER OF VANS *Numeric only
Appendix – Survey Questionnaire
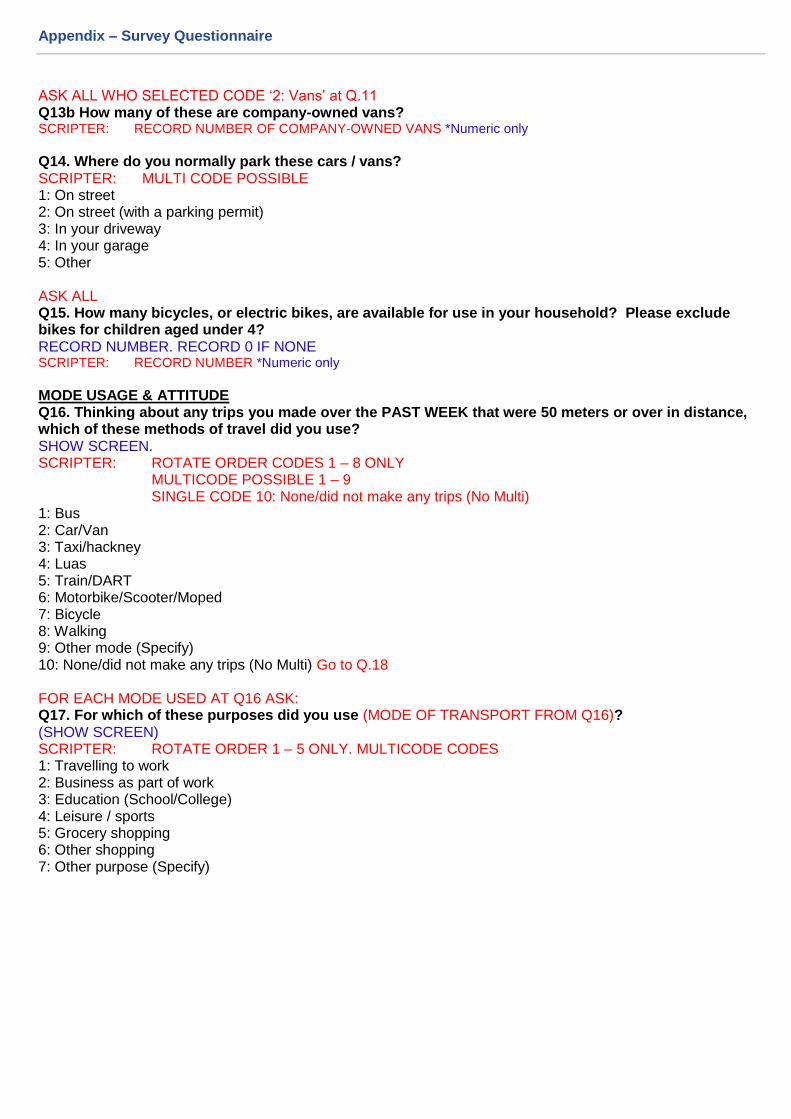
ASK ALL WHO SELECTED CODE ‘2: Vans’ at Q.11 Q13b How many of these are company-owned vans? SCRIPTER: RECORD NUMBER OF COMPANY-OWNED VANS *Numeric only
Q14. Where do you normally park these cars / vans? SCRIPTER: MULTI CODE POSSIBLE 1: On street 2: On street (with a parking permit) 3: In your driveway 4: In your garage 5: Other ASK ALL Q15. How many bicycles, or electric bikes, are available for use in your household? Please exclude bikes for children aged under 4? RECORD NUMBER. RECORD 0 IF NONE SCRIPTER: RECORD NUMBER *Numeric only
MODE USAGE & ATTITUDE Q16. Thinking about any trips you made over the PAST WEEK that were 50 meters or over in distance, which of these methods of travel did you use? SHOW SCREEN. SCRIPTER: ROTATE ORDER CODES 1 – 8 ONLY
MULTICODE POSSIBLE 1 – 9 SINGLE CODE 10: None/did not make any trips (No Multi)
1: Bus 2: Car/Van 3: Taxi/hackney 4: Luas 5: Train/DART 6: Motorbike/Scooter/Moped 7: Bicycle 8: Walking 9: Other mode (Specify) 10: None/did not make any trips (No Multi) Go to Q.18 FOR EACH MODE USED AT Q16 ASK: Q17. For which of these purposes did you use (MODE OF TRANSPORT FROM Q16)? (SHOW SCREEN) SCRIPTER: ROTATE ORDER 1 – 5 ONLY. MULTICODE CODES 1: Travelling to work 2: Business as part of work 3: Education (School/College) 4: Leisure / sports 5: Grocery shopping 6: Other shopping 7: Other purpose (Specify)

Appendix – Survey Questionnaire
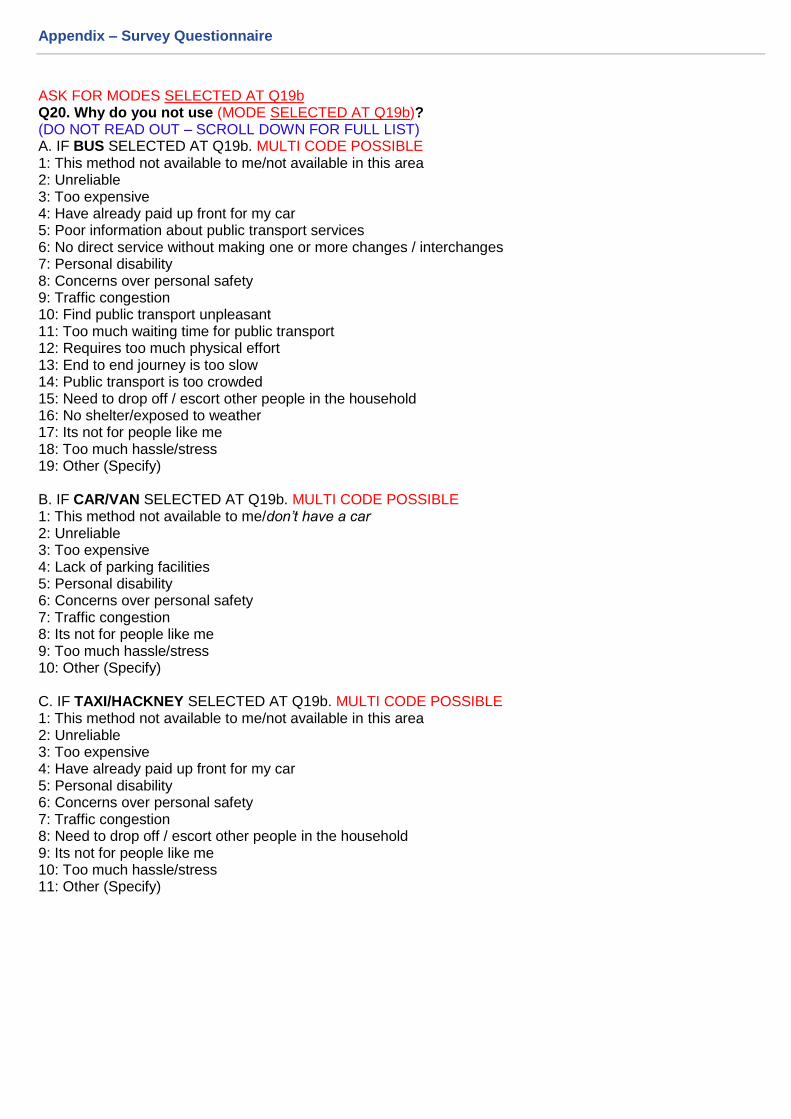
ASK ALL ONCE Q18. Overall which methods of travel did you use most often? SHOW SCREEN. SCRIPTER: ROTATE ORDER CODES 1 – 8 ONLY. SINGLE CODE 1: Bus 2: Car/Van 3: Taxi/hackney 4: Luas 5: Train/DART 6: Motorbike/Scooter/Moped 7: Bicycle 8: Walking 9: Other mode (Specify) 10: None of these ASK FOR MODE CODED MOST OFTEN AT Q.18 Q19. Why do you use (MODE OF TRANSPORT FROM Q18) most often? (DO NOT READ OUT – SCROLL DOWN FOR FULL LIST) 1: Reasonably priced / good value 2: Good for the environment 3: Clean / not untidy or messy 4: For people like me 5: No other choice 6: Healthy option 7: Comfortable 8: Fast 9: Reliable 10: Happy to be seen using it 11: Modern 12: Safe 13: Convenient way to get to work 14: Convenient way to take children to school 15: Convenient for going out socially at the weekends or in the evenings 16: Convenient for shopping 17: Convenient for family 18: More relaxing 19: Other (Specify) Q19b. Are there any methods of transport on this list that you would never or rarely use? SHOW SCREEN. SCRIPTER: DO NOT SHOW ANY CODES 1 – 9 SELECTED AT Q16
ROTATE ORDER CODES 1 – 8 ONLY MULTICODE POSSIBLE 1 – 9 SINGLE CODE 10: None of these, i.e. use all modes
1: Bus 2: Car/Van 3: Taxi/hackney 4: Luas 5: Train/DART 6: Motorbike/Scooter/Moped 7: Bicycle 8: Walking 9: Other mode (Specify) 10: None of these, i.e. Use all modes (No Multi)
Appendix – Survey Questionnaire
ASK FOR MODES SELECTED AT Q19b Q20. Why do you not use (MODE SELECTED AT Q19b)? (DO NOT READ OUT – SCROLL DOWN FOR FULL LIST) A. IF BUS SELECTED AT Q19b. MULTI CODE POSSIBLE 1: This method not available to me/not available in this area 2: Unreliable 3: Too expensive 4: Have already paid up front for my car 5: Poor information about public transport services 6: No direct service without making one or more changes / interchanges 7: Personal disability 8: Concerns over personal safety 9: Traffic congestion 10: Find public transport unpleasant 11: Too much waiting time for public transport 12: Requires too much physical effort 13: End to end journey is too slow 14: Public transport is too crowded 15: Need to drop off / escort other people in the household 16: No shelter/exposed to weather 17: Its not for people like me 18: Too much hassle/stress 19: Other (Specify) B. IF CAR/VAN SELECTED AT Q19b. MULTI CODE POSSIBLE 1: This method not available to me/don’t have a car 2: Unreliable 3: Too expensive 4: Lack of parking facilities 5: Personal disability 6: Concerns over personal safety 7: Traffic congestion 8: Its not for people like me 9: Too much hassle/stress 10: Other (Specify) C. IF TAXI/HACKNEY SELECTED AT Q19b. MULTI CODE POSSIBLE 1: This method not available to me/not available in this area 2: Unreliable 3: Too expensive 4: Have already paid up front for my car 5: Personal disability 6: Concerns over personal safety 7: Traffic congestion 8: Need to drop off / escort other people in the household 9: Its not for people like me 10: Too much hassle/stress 11: Other (Specify)
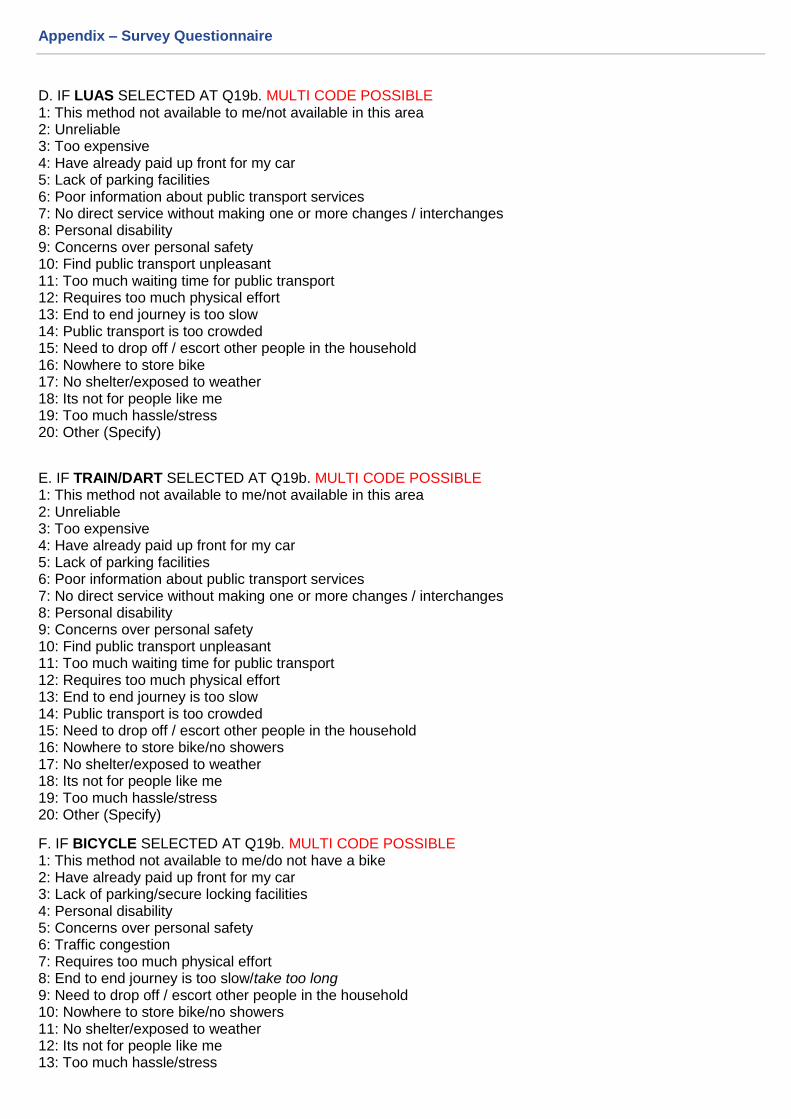
Appendix – Survey Questionnaire
D. IF LUAS SELECTED AT Q19b. MULTI CODE POSSIBLE 1: This method not available to me/not available in this area 2: Unreliable 3: Too expensive 4: Have already paid up front for my car 5: Lack of parking facilities 6: Poor information about public transport services 7: No direct service without making one or more changes / interchanges 8: Personal disability 9: Concerns over personal safety 10: Find public transport unpleasant 11: Too much waiting time for public transport 12: Requires too much physical effort 13: End to end journey is too slow 14: Public transport is too crowded 15: Need to drop off / escort other people in the household 16: Nowhere to store bike 17: No shelter/exposed to weather 18: Its not for people like me 19: Too much hassle/stress 20: Other (Specify)
E. IF TRAIN/DART SELECTED AT Q19b. MULTI CODE POSSIBLE 1: This method not available to me/not available in this area 2: Unreliable 3: Too expensive 4: Have already paid up front for my car 5: Lack of parking facilities 6: Poor information about public transport services 7: No direct service without making one or more changes / interchanges 8: Personal disability 9: Concerns over personal safety 10: Find public transport unpleasant 11: Too much waiting time for public transport 12: Requires too much physical effort 13: End to end journey is too slow 14: Public transport is too crowded 15: Need to drop off / escort other people in the household 16: Nowhere to store bike/no showers 17: No shelter/exposed to weather 18: Its not for people like me 19: Too much hassle/stress 20: Other (Specify)
F. IF BICYCLE SELECTED AT Q19b. MULTI CODE POSSIBLE 1: This method not available to me/do not have a bike 2: Have already paid up front for my car 3: Lack of parking/secure locking facilities 4: Personal disability 5: Concerns over personal safety 6: Traffic congestion 7: Requires too much physical effort 8: End to end journey is too slow/take too long 9: Need to drop off / escort other people in the household 10: Nowhere to store bike/no showers 11: No shelter/exposed to weather 12: Its not for people like me 13: Too much hassle/stress
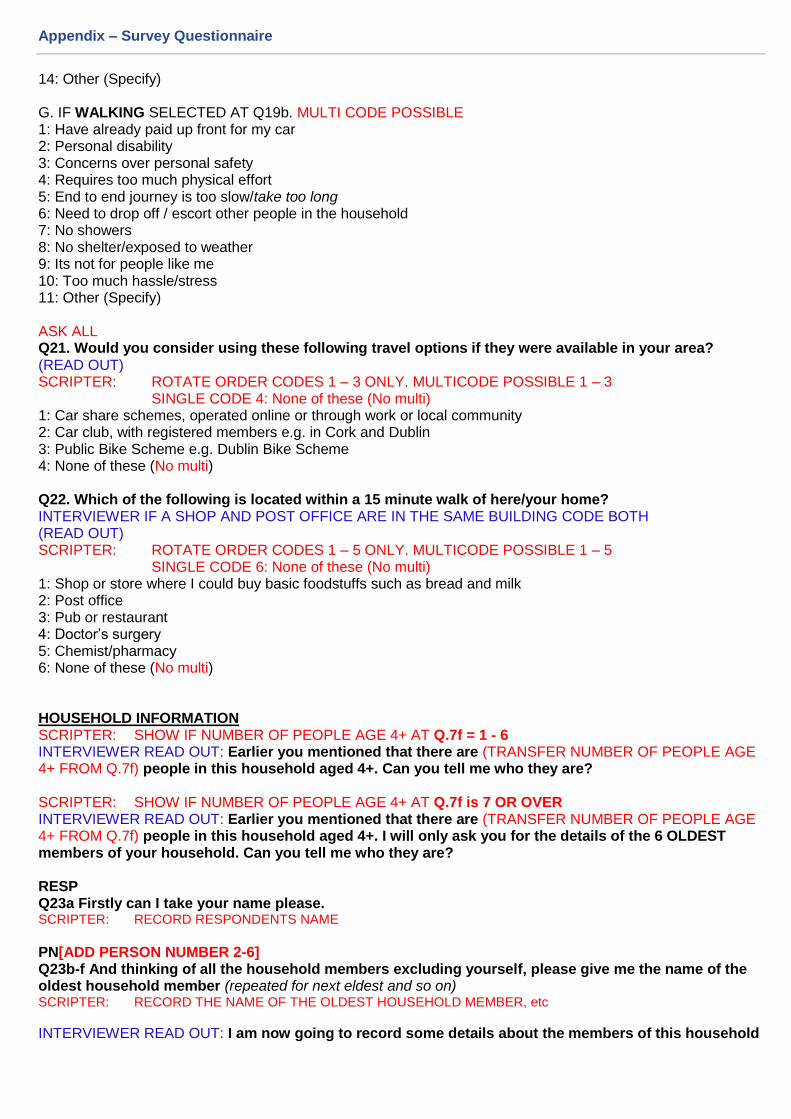
Appendix – Survey Questionnaire
14: Other (Specify) G. IF WALKING SELECTED AT Q19b. MULTI CODE POSSIBLE 1: Have already paid up front for my car 2: Personal disability 3: Concerns over personal safety 4: Requires too much physical effort 5: End to end journey is too slow/take too long 6: Need to drop off / escort other people in the household 7: No showers 8: No shelter/exposed to weather 9: Its not for people like me 10: Too much hassle/stress 11: Other (Specify) ASK ALL Q21. Would you consider using these following travel options if they were available in your area? (READ OUT) SCRIPTER: ROTATE ORDER CODES 1 – 3 ONLY. MULTICODE POSSIBLE 1 – 3
SINGLE CODE 4: None of these (No multi) 1: Car share schemes, operated online or through work or local community 2: Car club, with registered members e.g. in Cork and Dublin 3: Public Bike Scheme e.g. Dublin Bike Scheme 4: None of these (No multi) Q22. Which of the following is located within a 15 minute walk of here/your home? INTERVIEWER IF A SHOP AND POST OFFICE ARE IN THE SAME BUILDING CODE BOTH (READ OUT) SCRIPTER: ROTATE ORDER CODES 1 – 5 ONLY. MULTICODE POSSIBLE 1 – 5
SINGLE CODE 6: None of these (No multi) 1: Shop or store where I could buy basic foodstuffs such as bread and milk 2: Post office 3: Pub or restaurant 4: Doctor’s surgery 5: Chemist/pharmacy 6: None of these (No multi) HOUSEHOLD INFORMATION SCRIPTER: SHOW IF NUMBER OF PEOPLE AGE 4+ AT Q.7f = 1 - 6
INTERVIEWER READ OUT: Earlier you mentioned that there are (TRANSFER NUMBER OF PEOPLE AGE 4+ FROM Q.7f) people in this household aged 4+. Can you tell me who they are? SCRIPTER: SHOW IF NUMBER OF PEOPLE AGE 4+ AT Q.7f is 7 OR OVER
INTERVIEWER READ OUT: Earlier you mentioned that there are (TRANSFER NUMBER OF PEOPLE AGE 4+ FROM Q.7f) people in this household aged 4+. I will only ask you for the details of the 6 OLDEST members of your household. Can you tell me who they are? RESP Q23a Firstly can I take your name please. SCRIPTER: RECORD RESPONDENTS NAME
PN[ADD PERSON NUMBER 2-6] Q23b-f And thinking of all the household members excluding yourself, please give me the name of the oldest household member (repeated for next eldest and so on) SCRIPTER: RECORD THE NAME OF THE OLDEST HOUSEHOLD MEMBER, etc
INTERVIEWER READ OUT: I am now going to record some details about the members of this household
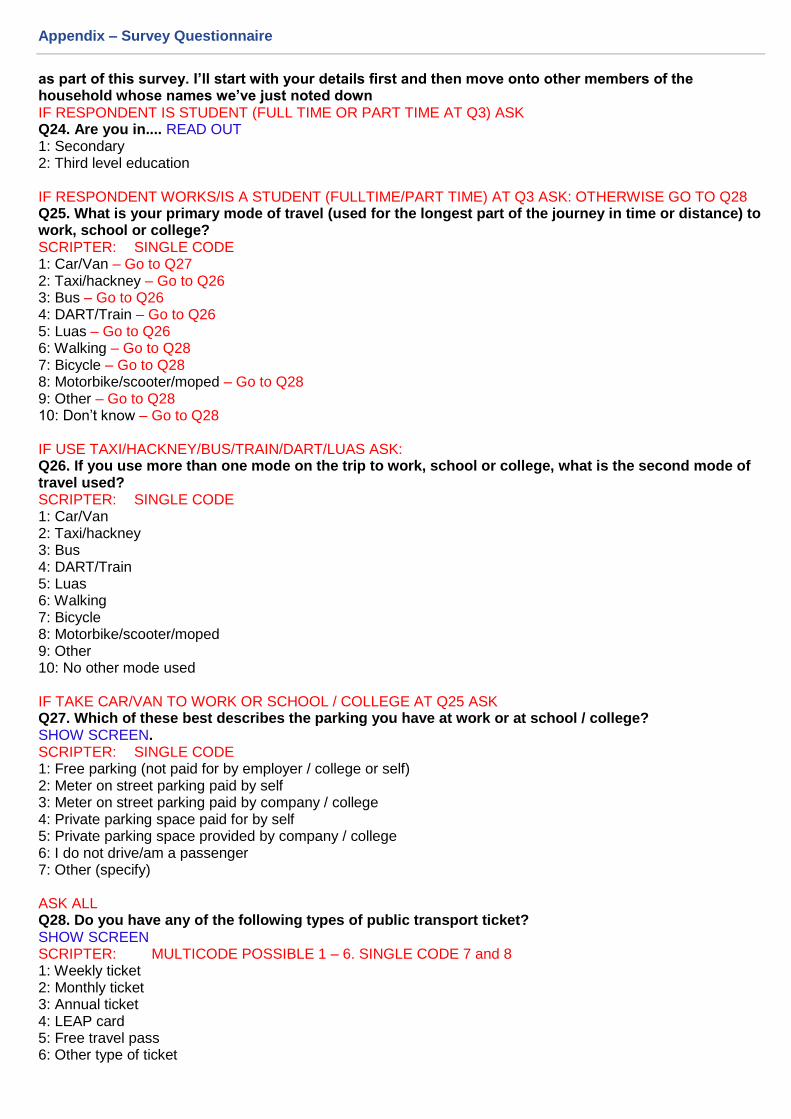
Appendix – Survey Questionnaire
as part of this survey. I’ll start with your details first and then move onto other members of the household whose names we’ve just noted down IF RESPONDENT IS STUDENT (FULL TIME OR PART TIME AT Q3) ASK Q24. Are you in.... READ OUT 1: Secondary 2: Third level education IF RESPONDENT WORKS/IS A STUDENT (FULLTIME/PART TIME) AT Q3 ASK: OTHERWISE GO TO Q28 Q25. What is your primary mode of travel (used for the longest part of the journey in time or distance) to work, school or college? SCRIPTER: SINGLE CODE 1: Car/Van – Go to Q27 2: Taxi/hackney – Go to Q26 3: Bus – Go to Q26 4: DART/Train – Go to Q26 5: Luas – Go to Q26 6: Walking – Go to Q28 7: Bicycle – Go to Q28 8: Motorbike/scooter/moped – Go to Q28 9: Other – Go to Q28 10: Don’t know – Go to Q28 IF USE TAXI/HACKNEY/BUS/TRAIN/DART/LUAS ASK: Q26. If you use more than one mode on the trip to work, school or college, what is the second mode of travel used? SCRIPTER: SINGLE CODE 1: Car/Van 2: Taxi/hackney 3: Bus 4: DART/Train 5: Luas 6: Walking 7: Bicycle 8: Motorbike/scooter/moped 9: Other 10: No other mode used IF TAKE CAR/VAN TO WORK OR SCHOOL / COLLEGE AT Q25 ASK Q27. Which of these best describes the parking you have at work or at school / college? SHOW SCREEN. SCRIPTER: SINGLE CODE 1: Free parking (not paid for by employer / college or self) 2: Meter on street parking paid by self 3: Meter on street parking paid by company / college 4: Private parking space paid for by self 5: Private parking space provided by company / college 6: I do not drive/am a passenger 7: Other (specify) ASK ALL Q28. Do you have any of the following types of public transport ticket? SHOW SCREEN SCRIPTER: MULTICODE POSSIBLE 1 – 6. SINGLE CODE 7 and 8 1: Weekly ticket 2: Monthly ticket 3: Annual ticket 4: LEAP card 5: Free travel pass 6: Other type of ticket
Appendix – Survey Questionnaire
7: Do not use public transport (No multi) 8: None of these (No multi) ASK ALL Q29. Are you part of a public bikes scheme (for example the Dublin Bikes scheme)? SCRIPTER: SINGLE CODE 1: Yes 2: No INTERVIEWER: ON DIARY PLEASE RECORD PERSON NUMBER AS 01 OF [01-06: SCRIPTER from Q7f insert number of people aged 4 or older who live in the household up to a maximum number of 6]. THIS IS THE DIARY
FOR THE RESPONDENT. BEFORE HANDING OVER THE DIARY ENSURE YOU HAVE FILLED OUT INTERVIEWER NUMBER, ASSIGNMENT NUMBER, HOUSEHOLD NUMBER AND PERSON NUMBER CORRECTLY.
SCRIPTER: SINGLE CODE 1: Person number 1 (respondent) IF MORE THAN ONE HOUSEHOLD MEMBER: ASK FOR HOUSEHOLD MEMBER 2/3/4/5/6 INTERVIEWER: On diary please record Person Number as [02/03/04/05/06] OF [01-06: SCRIPTER from Q7f insert number of people aged 4 or older who live in the household up to a maximum number of 6]. This is the diary for [insert name of member of the household from Q23b/c/d/e/f]. BEFORE HANDING OVER THE DIARY ENSURE YOU HAVE FILLED OUT INTERVIEWER NUMBER, ASSIGNMENT NUMBER, HOUSEHOLD NUMBER AND PERSON NUMBER CORRECTLY.
SCRIPTER: SINGLE CODE 1: Person Number [2/3/4/5/6] FOR Q30a-Q37 EACH MEMBER 2/3/4/5/6 Q30a. What age is [insert name of member of the household from Q23b/c/d/e/f] (CODE 99 FOR REFUSED OR DON’T KNOW) SCRIPTER: RECORD EXACT AGE___ *Numeric only
IF REFUSE (CODE = 99) at Q30.1 Q30b.Can you tell me which of these ranges [insert name of member of the household from Q23b/c/d/e/f] falls into? SCRIPTER: CODE BAND – SINGLE CODE
1: 4-10 2: 11-15 3: 16-17 4: 18-24 5: 25-29 6: 30-34 7: 35-39 8: 40-44 9: 45-49 10: 50-54 11: 55-59 12: 60-64 13: 65 plus 14: Don’t Know/Refused Q30c. Is [insert name of member of the household from Q23b/c/d/e/f] (READ OUT) SCRIPTER: SINGLE CODE
1: Male 2: Female Q31. Does [insert name of member of the household from Q23b/c/d/e/f] (INTERVIEWER: READ OUT – CODE MAIN ACTIVITY ONLY) SCRIPTER: SINGLE CODE
1: Work (No Multi) – Go to Q33 2: Attend School (No Multi) – Go to Q32 3: Attend College (No Multi) – Go to Q32 4: Other (No Multi) – Go to Q36
Appendix – Survey Questionnaire
IF HOUSEHOLD MEMBER ATTENDS SCHOOL OR COLLEGE Q32. Is [insert name of member of the household from Q23b/c/d/e/f] in.... (READ OUT) SCRIPTER: SINGLE CODE
1: Primary education 2: Secondary education 3: Third level education IF HOUSEHOLD MEMBER WORKS OR IS A STUDENT ASK: OTHERWISE GO TO Q36. Q33. What is [insert name of member of the household from Q23b/c/d/e/f] primary mode of travel (used for the longest part of the journey in time or distance) to work, school or college? SCRIPTER: SINGLE CODE
1: Car/Van – Go to Q35 2: Taxi/hackney – Go to Q34 3: Bus – Go to Q34 4: DART/Train – Go to Q34 5: Luas – Go to Q34 6: Walking – Go to Q36 7: Bicycle – Go to Q36 8: Motorbike/scooter/moped – Go to Q36 9: Don’t know– Go to Q36 IF USE TAXI/HACKNEY/BUS/TRAIN/DART/LUAS ASK: Q34. If [insert name of member of the household from Q23b/c/d/e/f] use more than one mode on the trip to work, school or college, what is the second mode of travel used? SCRIPTER: SINGLE CODE
1: Car/Van 2: Taxi/hackney 3: Bus 4: DART/Train 5: Luas 6: Walking 7: Bicycle 8: Motorbike/scooter/moped 9: No other mode used 10: Don’t know IF HOUSEHOLD MEMBER TAKES CAR/VAN TO WORK OR SCHOOL / COLLEGE AT Q33 ASK: Q35. Which of these best describes the parking [insert name of member of the household from Q23b/c/d/e/f] have at work or at school / college? (SHOW SCREEN) SCRIPTER: SINGLE CODE
1: Free parking (not paid for by employer / college or self) 2: Meter on street parking paid by self 3: Meter on street parking paid by company / college 4: Private parking space paid for by self 5: Private parking space provided by company / college 6: Does not drive/is a passenger 7: Other: (specify) 8: Don’t know
Appendix – Survey Questionnaire
ASK FOR ALL HOUSEHOLD MEMBERS Q36. Does [insert name of member of the household from Q23b/c/d/e/f] have any of the following types of public transport ticket? (SHOW SCREEN) SCRIPTER: MULTICODE POSSIBLE 1 – 6. SINGLE CODE 7- 9 1: Weekly ticket 2: Monthly ticket 3: Annual ticket 4: LEAP card 5: Free travel pass 6: Other type of ticket 7: Does not use public transport (No Multi) 8: None of these (No Multi) 9: Don’t know (No Multi) Q37. Is [insert name of member of the household from Q23b/c/d/e/f] part of a public bikes scheme (for example the Dublin Bikes scheme)? SCRIPTER: SINGLE CODE
1: Yes 2: No 3: Don’t Know LONG DISTANCE TRIPS ASK ALL Q38. Over the last three months how many trips have you made over 50 km or 30 miles that are not part of your every day routine? (RECORD NUMBER. RECORD 0 IF NONE) SCRIPTER: RECORD TOTAL NUMBER OF TRIPS OVER 50 km / 30 miles *Numeric only
IF Q.38 = 0, SKIP TO DEMOGRAPHICS
Q39 How many were by bus/private bus/coach or minibus? SCRIPTER: RECORD NUMBER OF TRIPS BY BUS/PRIVATE BUS/COACH OR MINIBUS *Numeric only
Q39 How many were by train? SCRIPTER: RECORD NUMBER OF TRIPS BY TRAIN *Numeric only
Q39 How many were by car or van? SCRIPTER: RECORD NUMBER OF TRIPS BY CAR OR VAN *Numeric only
Q39 How many were by other forms of transport? SCRIPTER: RECORD NUMBER OF TRIPS BY OTHER FORMS OF TRANSPORT *Numeric only
ASK FOR EACH MODE USED AT Q39 NOT EQUAL TO ‘0’ (Zero) Q40. How many of these trips by (MODE FROM Q39 NOT EQUAL TO ‘0’ (Zero)) were for (EACH CODE 1 to 7) SCRIPTER: RECORD NUMBER OF TRIPS BY (MODE FROM Q39) for (EACH CODE 1 to 7) *Numeric only
1: Holiday 2: Business 3: Commuting to work, school or college 4: Shopping 5: Visiting relatives or friends 6: Sports or leisure 7: Other purposes
Appendix – Survey Questionnaire
DEMOGRAPHICS
ASK ALL INTERVIEWER READ OUT: And finally, we’re just going to ask you some questions about your household which will allow us to look at the results across different groups. Please be assured that your responses will be treated in the strictest confidence and will remain anonymous.
D1 Which of these best describes your household tenure? (SHOW SCREEN) SCRIPTER: SINGLE CODE. ROTATE CODES 1-3
1: Rented 2: Owner 3: Living with parents 4: Other
D2 How long have you lived at this address? RECORD NUMBER OF YEARS – IF LESS THAN A YEAR ENTER AS 0 SCRIPTER: RECORD NUMBER OF YEARS *Numeric only
D3 What type of house do you have? SHOW SCREEN – NOTE: ‘HOUSE’ INCLUDES BUNGALOWS SCRIPTER: SINGLE CODE
1: Detached house 2: Semi Detached house 3: Terraced House 4: Apartment/flat 5: Other
D4 Do you have internet in your household? (PROBE TO PRECODES) SCRIPTER: MULTICODE POSSIBLE 1 – 4. SINGLE CODE 5 and 6 1: Yes, via fixed landline broadband 2: Yes, via mobile broadband 3: Yes, via dial up on standard telephone line 4: Yes, via satellite broadband 5: Not in household, but have internet access at work/education/other (No Multi) 6: No internet access (No Multi) D5. Are you the chief income earner in this household? SCRIPTER: SINGLE CODE 1: Yes - Chief Income Earner 2: No - Not Chief Income Earner
D6a What is the occupation of the chief income earner/your occupation (IF CHIEF INCOME EARNER)? SCRIPTER: OPEN TEXT BOX RECORD FULL JOB DETAILS. IF MANAGER/SELF EMPLOYED STATE NO. OF EMPLOYEES. SPECIFY: QUALIFICATIONS/TRAINING IF FARMER, STATE NO. OF ACRES
D6b Code Social class based on CIE SCRIPTER: SINGLE CODE 1: A 2: B 3: C1 4: C2 5: D 6: E 7: F50 plus 8: F50 minus
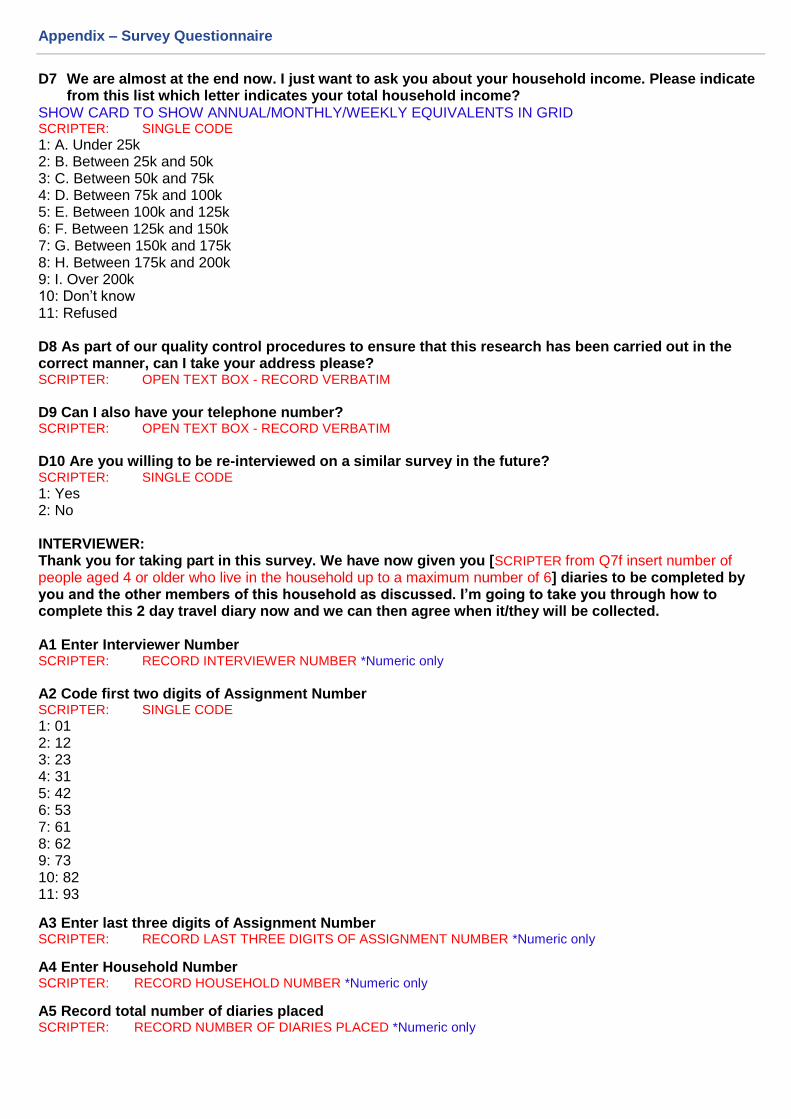
Appendix – Survey Questionnaire
D7 We are almost at the end now. I just want to ask you about your household income. Please indicate from this list which letter indicates your total household income?
SHOW CARD TO SHOW ANNUAL/MONTHLY/WEEKLY EQUIVALENTS IN GRID SCRIPTER: SINGLE CODE
1: A. Under 25k 2: B. Between 25k and 50k 3: C. Between 50k and 75k 4: D. Between 75k and 100k 5: E. Between 100k and 125k 6: F. Between 125k and 150k 7: G. Between 150k and 175k 8: H. Between 175k and 200k 9: I. Over 200k 10: Don’t know 11: Refused D8 As part of our quality control procedures to ensure that this research has been carried out in the correct manner, can I take your address please? SCRIPTER: OPEN TEXT BOX - RECORD VERBATIM
D9 Can I also have your telephone number? SCRIPTER: OPEN TEXT BOX - RECORD VERBATIM
D10 Are you willing to be re-interviewed on a similar survey in the future? SCRIPTER: SINGLE CODE
1: Yes 2: No INTERVIEWER: Thank you for taking part in this survey. We have now given you [SCRIPTER from Q7f insert number of people aged 4 or older who live in the household up to a maximum number of 6] diaries to be completed by you and the other members of this household as discussed. I’m going to take you through how to complete this 2 day travel diary now and we can then agree when it/they will be collected. A1 Enter Interviewer Number SCRIPTER: RECORD INTERVIEWER NUMBER *Numeric only
A2 Code first two digits of Assignment Number SCRIPTER: SINGLE CODE
1: 01 2: 12 3: 23 4: 31 5: 42 6: 53 7: 61 8: 62 9: 73 10: 82 11: 93
A3 Enter last three digits of Assignment Number SCRIPTER: RECORD LAST THREE DIGITS OF ASSIGNMENT NUMBER *Numeric only
A4 Enter Household Number SCRIPTER: RECORD HOUSEHOLD NUMBER *Numeric only
A5 Record total number of diaries placed SCRIPTER: RECORD NUMBER OF DIARIES PLACED *Numeric only
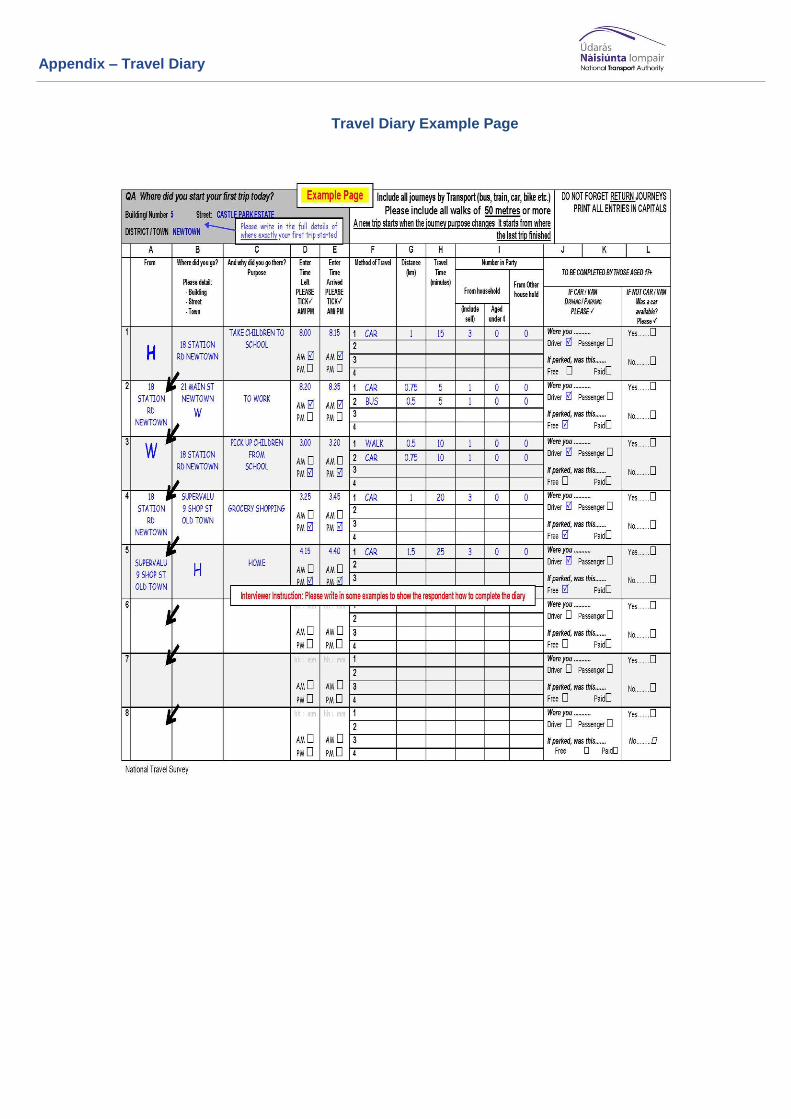
Appendix – Travel Diary
Travel Diary Example Page
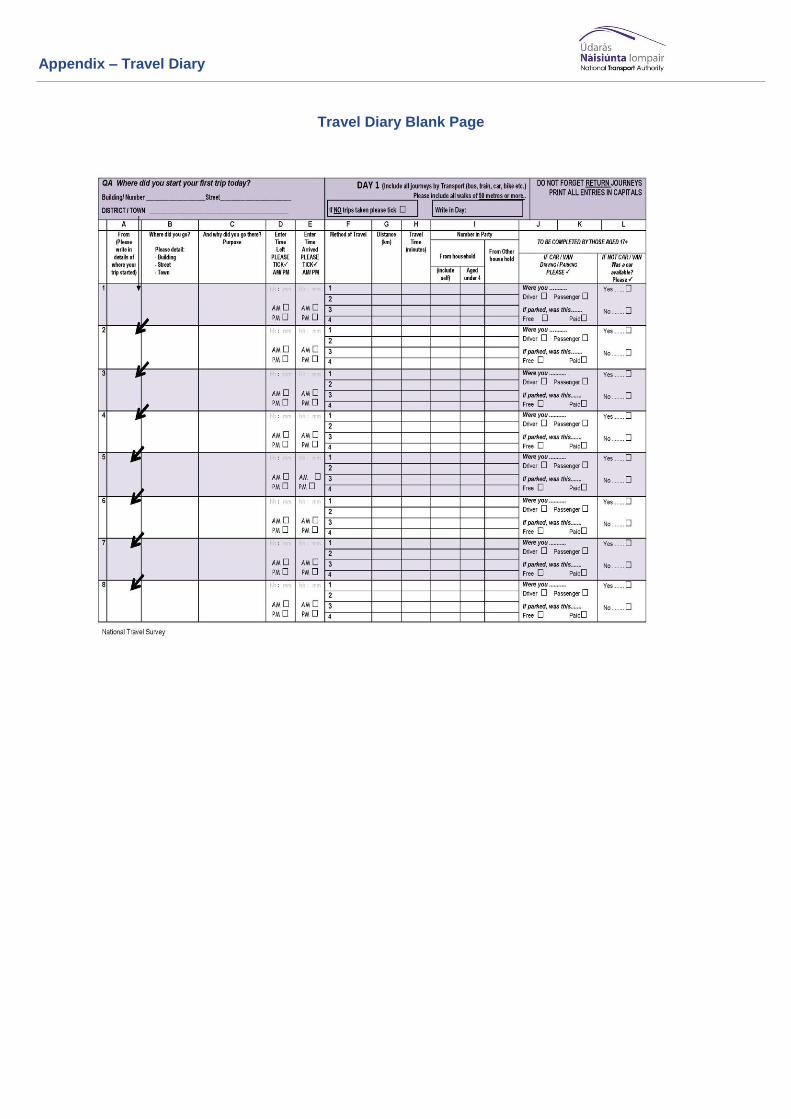
Appendix – Travel Diary
Travel Diary Blank Page

Appendix – Travel Diary
Travel Diary Long Journey Page
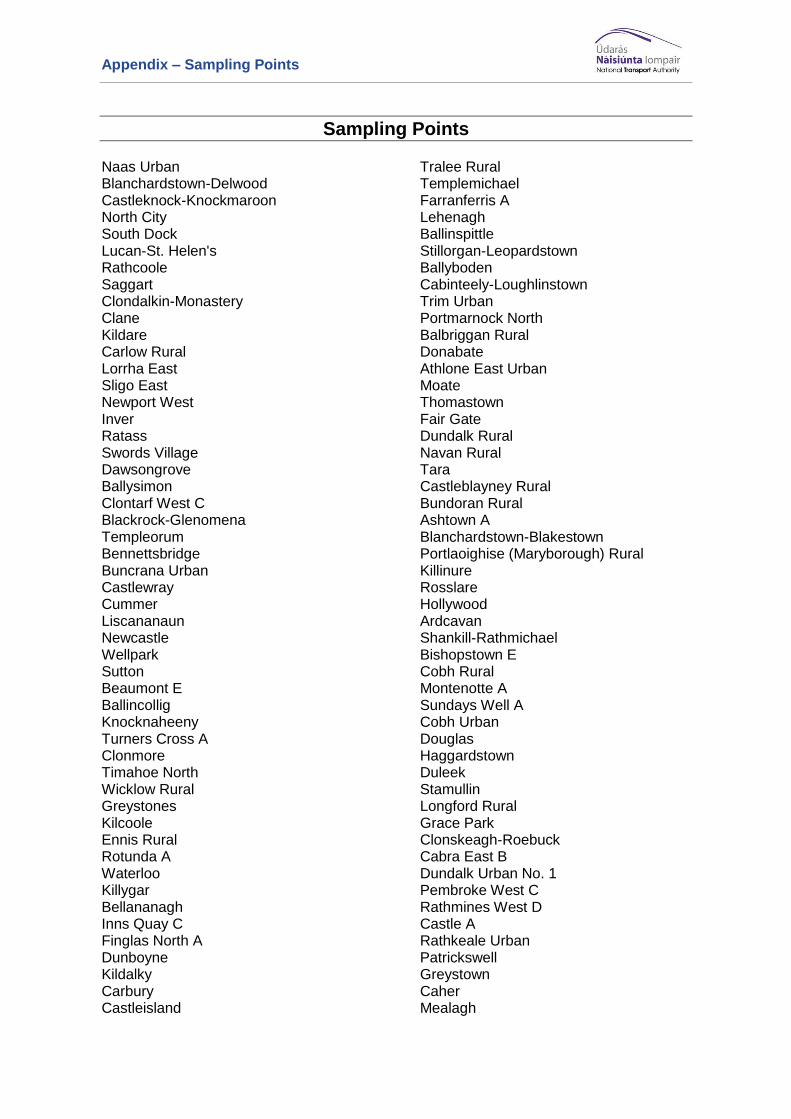
Appendix – Sampling Points
Sampling Points Naas Urban Blanchardstown-Delwood Castleknock-Knockmaroon North City South Dock Lucan-St. Helen's Rathcoole Saggart Clondalkin-Monastery Clane Kildare Carlow Rural Lorrha East Sligo East Newport West Inver Ratass Swords Village Dawsongrove Ballysimon Clontarf West C Blackrock-Glenomena Templeorum Bennettsbridge Buncrana Urban Castlewray Cummer Liscananaun Newcastle Wellpark Sutton Beaumont E Ballincollig Knocknaheeny Turners Cross A Clonmore Timahoe North Wicklow Rural Greystones Kilcoole Ennis Rural Rotunda A Waterloo Killygar Bellananagh Inns Quay C Finglas North A Dunboyne Kildalky Carbury Castleisland
Tralee Rural Templemichael Farranferris A Lehenagh Ballinspittle Stillorgan-Leopardstown Ballyboden Cabinteely-Loughlinstown Trim Urban Portmarnock North Balbriggan Rural Donabate Athlone East Urban Moate Thomastown Fair Gate Dundalk Rural Navan Rural Tara Castleblayney Rural Bundoran Rural Ashtown A Blanchardstown-Blakestown Portlaoighise (Maryborough) Rural Killinure Rosslare Hollywood Ardcavan Shankill-Rathmichael Bishopstown E Cobh Rural Montenotte A Sundays Well A Cobh Urban Douglas Haggardstown Duleek Stamullin Longford Rural Grace Park Clonskeagh-Roebuck Cabra East B Dundalk Urban No. 1 Pembroke West C Rathmines West D Castle A Rathkeale Urban Patrickswell Greystown Caher Mealagh
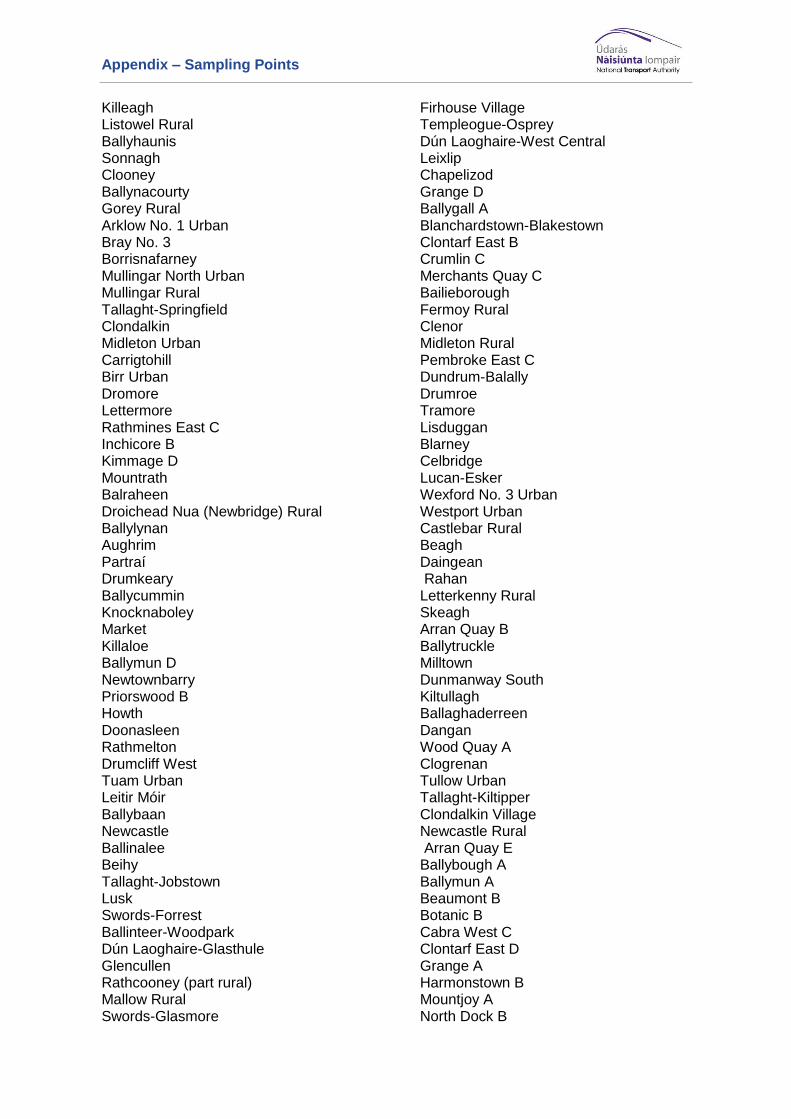
Appendix – Sampling Points
Killeagh Listowel Rural Ballyhaunis Sonnagh Clooney Ballynacourty Gorey Rural Arklow No. 1 Urban Bray No. 3 Borrisnafarney Mullingar North Urban Mullingar Rural Tallaght-Springfield Clondalkin Midleton Urban Carrigtohill Birr Urban Dromore Lettermore Rathmines East C Inchicore B Kimmage D Mountrath Balraheen Droichead Nua (Newbridge) Rural Ballylynan Aughrim Partraí Drumkeary Ballycummin Knocknaboley Market Killaloe Ballymun D Newtownbarry Priorswood B Howth Doonasleen Rathmelton Drumcliff West Tuam Urban Leitir Móir Ballybaan Newcastle Ballinalee Beihy Tallaght-Jobstown Lusk Swords-Forrest Ballinteer-Woodpark Dún Laoghaire-Glasthule Glencullen Rathcooney (part rural) Mallow Rural Swords-Glasmore
Firhouse Village Templeogue-Osprey Dún Laoghaire-West Central Leixlip Chapelizod Grange D Ballygall A Blanchardstown-Blakestown Clontarf East B Crumlin C Merchants Quay C Bailieborough Fermoy Rural Clenor Midleton Rural Pembroke East C Dundrum-Balally Drumroe Tramore Lisduggan Blarney Celbridge Lucan-Esker Wexford No. 3 Urban Westport Urban Castlebar Rural Beagh Daingean Rahan Letterkenny Rural Skeagh Arran Quay B Ballytruckle Milltown Dunmanway South Kiltullagh Ballaghaderreen Dangan Wood Quay A Clogrenan Tullow Urban Tallaght-Kiltipper Clondalkin Village Newcastle Rural Arran Quay E Ballybough A Ballymun A Beaumont B Botanic B Cabra West C Clontarf East D Grange A Harmonstown B Mountjoy A North Dock B
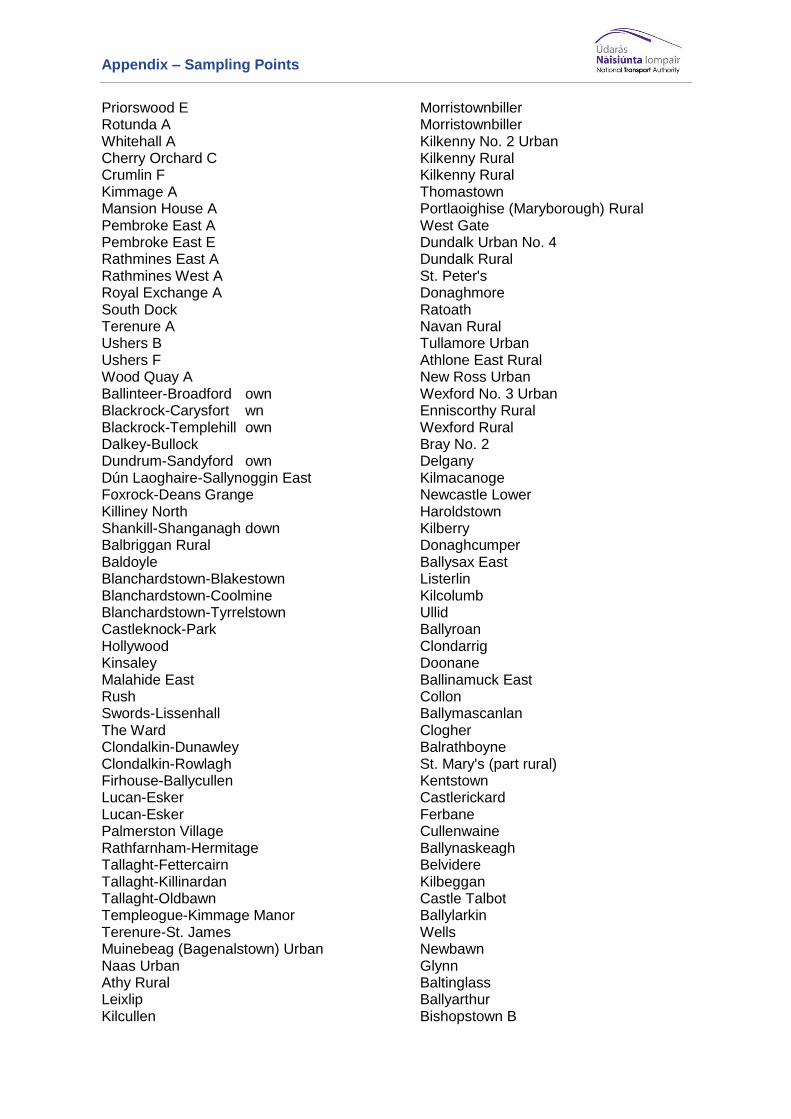
Appendix – Sampling Points
Priorswood E Rotunda A Whitehall A Cherry Orchard C Crumlin F Kimmage A Mansion House A Pembroke East A Pembroke East E Rathmines East A Rathmines West A Royal Exchange A South Dock Terenure A Ushers B Ushers F Wood Quay A Ballinteer-Broadford own Blackrock-Carysfort wn Blackrock-Templehill own Dalkey-Bullock Dundrum-Sandyford own Dún Laoghaire-Sallynoggin East Foxrock-Deans Grange Killiney North Shankill-Shanganagh down Balbriggan Rural Baldoyle Blanchardstown-Blakestown Blanchardstown-Coolmine Blanchardstown-Tyrrelstown Castleknock-Park Hollywood Kinsaley Malahide East Rush Swords-Lissenhall The Ward Clondalkin-Dunawley Clondalkin-Rowlagh Firhouse-Ballycullen Lucan-Esker Lucan-Esker Palmerston Village Rathfarnham-Hermitage Tallaght-Fettercairn Tallaght-Killinardan Tallaght-Oldbawn Templeogue-Kimmage Manor Terenure-St. James Muinebeag (Bagenalstown) Urban Naas Urban Athy Rural Leixlip Kilcullen
Morristownbiller Morristownbiller Kilkenny No. 2 Urban Kilkenny Rural Kilkenny Rural Thomastown Portlaoighise (Maryborough) Rural West Gate Dundalk Urban No. 4 Dundalk Rural St. Peter's Donaghmore Ratoath Navan Rural Tullamore Urban Athlone East Rural New Ross Urban Wexford No. 3 Urban Enniscorthy Rural Wexford Rural Bray No. 2 Delgany Kilmacanoge Newcastle Lower Haroldstown Kilberry Donaghcumper Ballysax East Listerlin Kilcolumb Ullid Ballyroan Clondarrig Doonane Ballinamuck East Collon Ballymascanlan Clogher Balrathboyne St. Mary's (part rural) Kentstown Castlerickard Ferbane Cullenwaine Ballynaskeagh Belvidere Kilbeggan Castle Talbot Ballylarkin Wells Newbawn Glynn Baltinglass Ballyarthur Bishopstown B
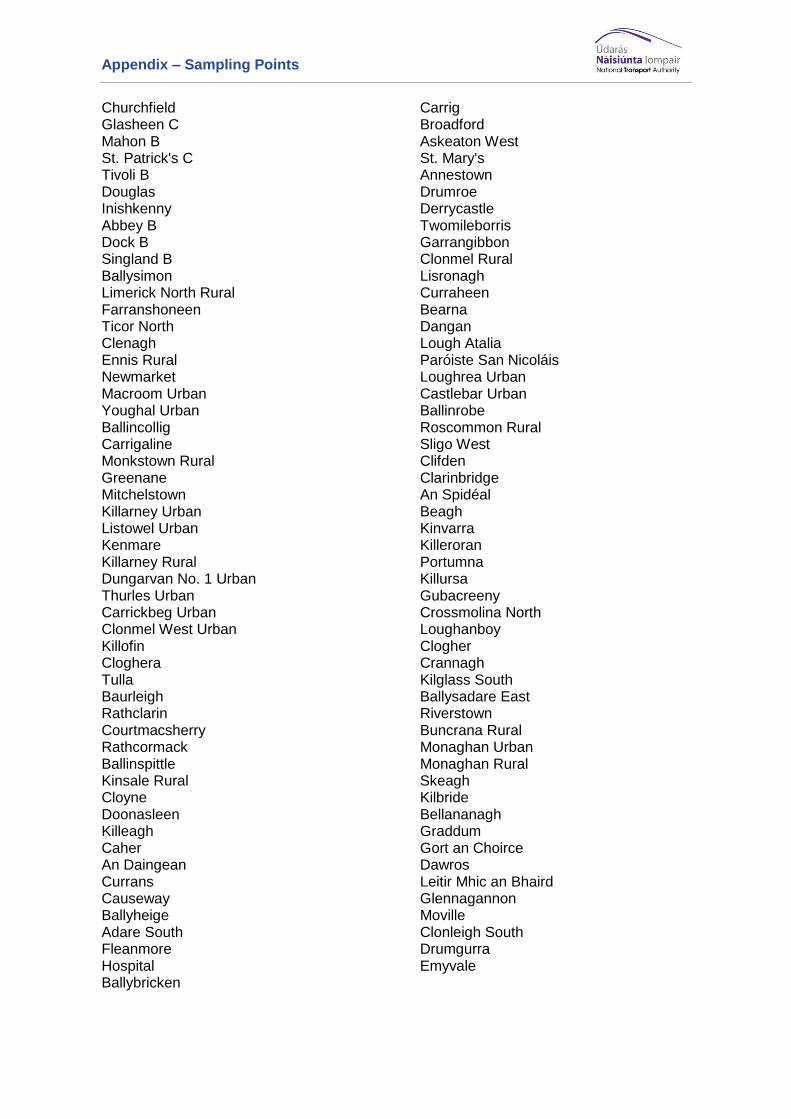
Appendix – Sampling Points
Churchfield Glasheen C Mahon B St. Patrick's C Tivoli B Douglas Inishkenny Abbey B Dock B Singland B Ballysimon Limerick North Rural Farranshoneen Ticor North Clenagh Ennis Rural Newmarket Macroom Urban Youghal Urban Ballincollig Carrigaline Monkstown Rural Greenane Mitchelstown Killarney Urban Listowel Urban Kenmare Killarney Rural Dungarvan No. 1 Urban Thurles Urban Carrickbeg Urban Clonmel West Urban Killofin Cloghera Tulla Baurleigh Rathclarin Courtmacsherry Rathcormack Ballinspittle Kinsale Rural Cloyne Doonasleen Killeagh Caher An Daingean Currans Causeway Ballyheige Adare South Fleanmore Hospital Ballybricken
Carrig Broadford Askeaton West St. Mary's Annestown Drumroe Derrycastle Twomileborris Garrangibbon Clonmel Rural Lisronagh Curraheen Bearna Dangan Lough Atalia Paróiste San Nicoláis Loughrea Urban Castlebar Urban Ballinrobe Roscommon Rural Sligo West Clifden Clarinbridge An Spidéal Beagh Kinvarra Killeroran Portumna Killursa Gubacreeny Crossmolina North Loughanboy Clogher Crannagh Kilglass South Ballysadare East Riverstown Buncrana Rural Monaghan Urban Monaghan Rural Skeagh Kilbride Bellananagh Graddum Gort an Choirce Dawros Leitir Mhic an Bhaird Glennagannon Moville Clonleigh South Drumgurra Emyvale

Appendix – AECOM Technical Notes
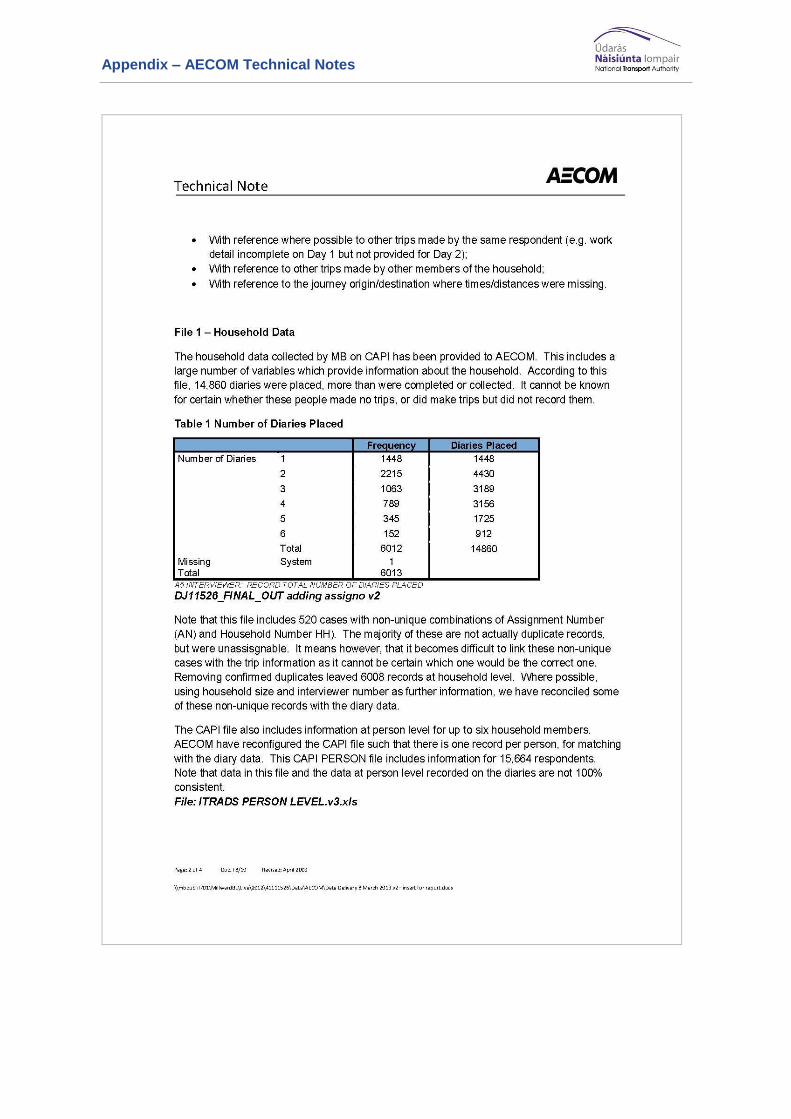
Appendix – AECOM Technical Notes
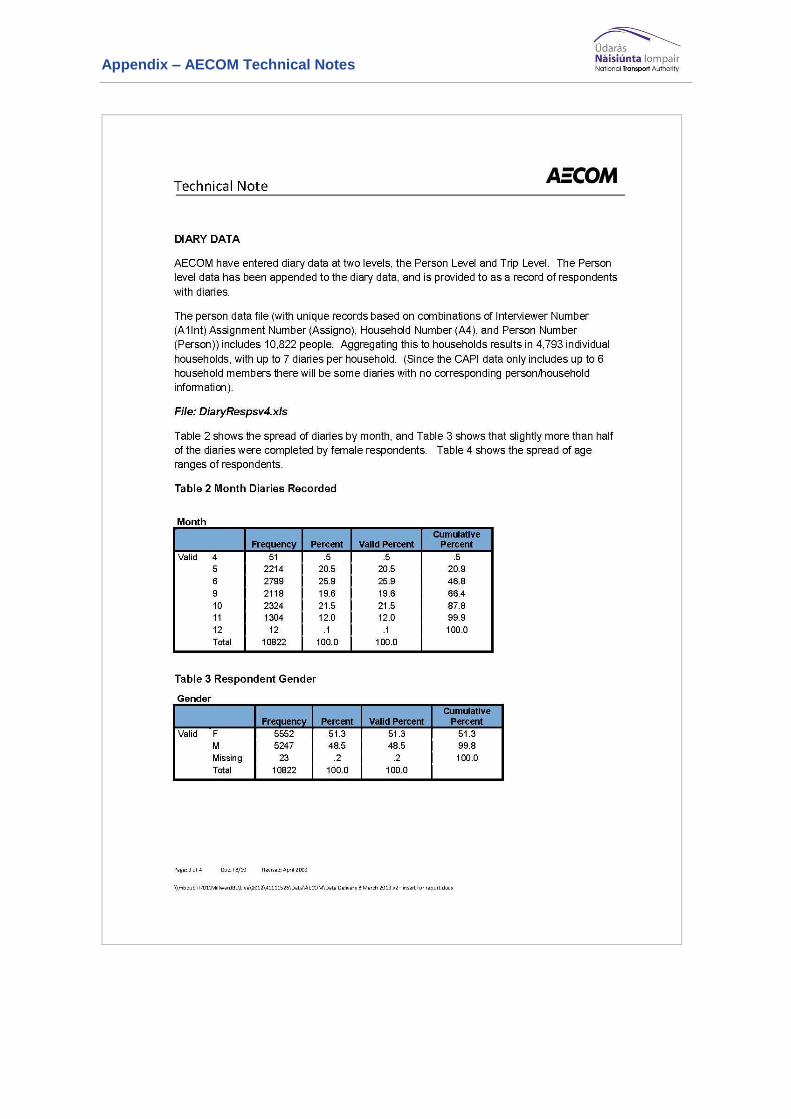
Appendix – AECOM Technical Notes
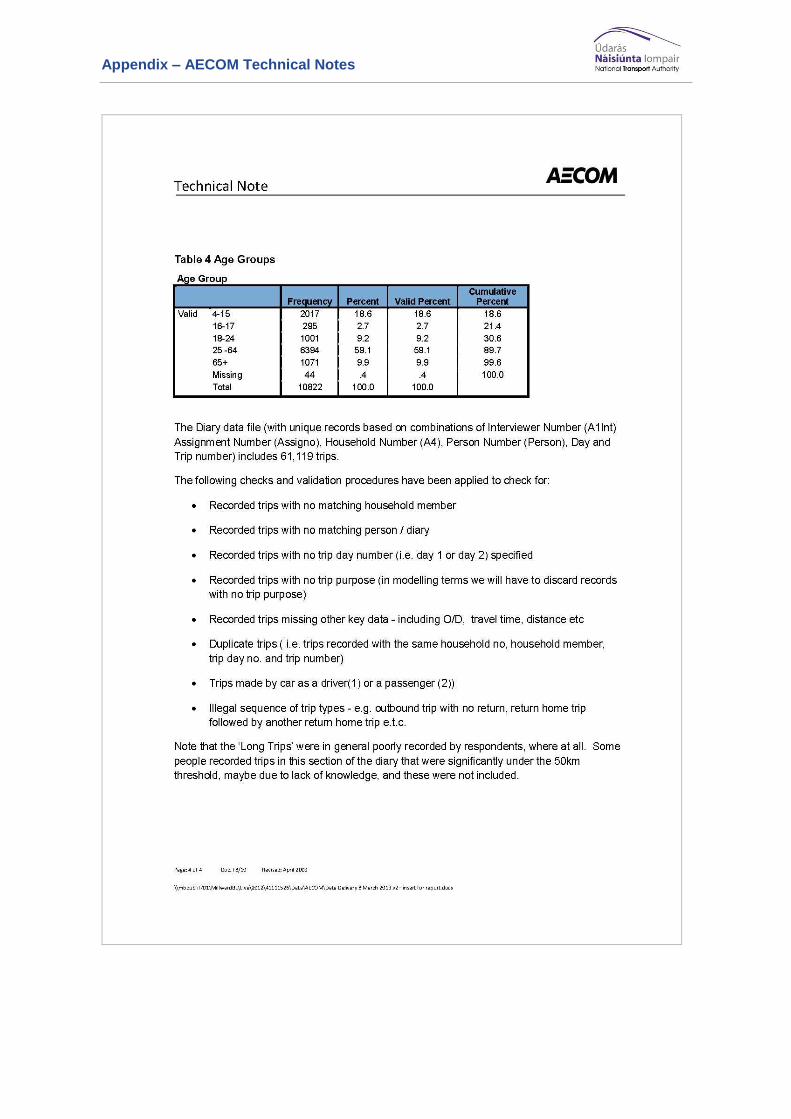
Appendix – AECOM Technical Notes
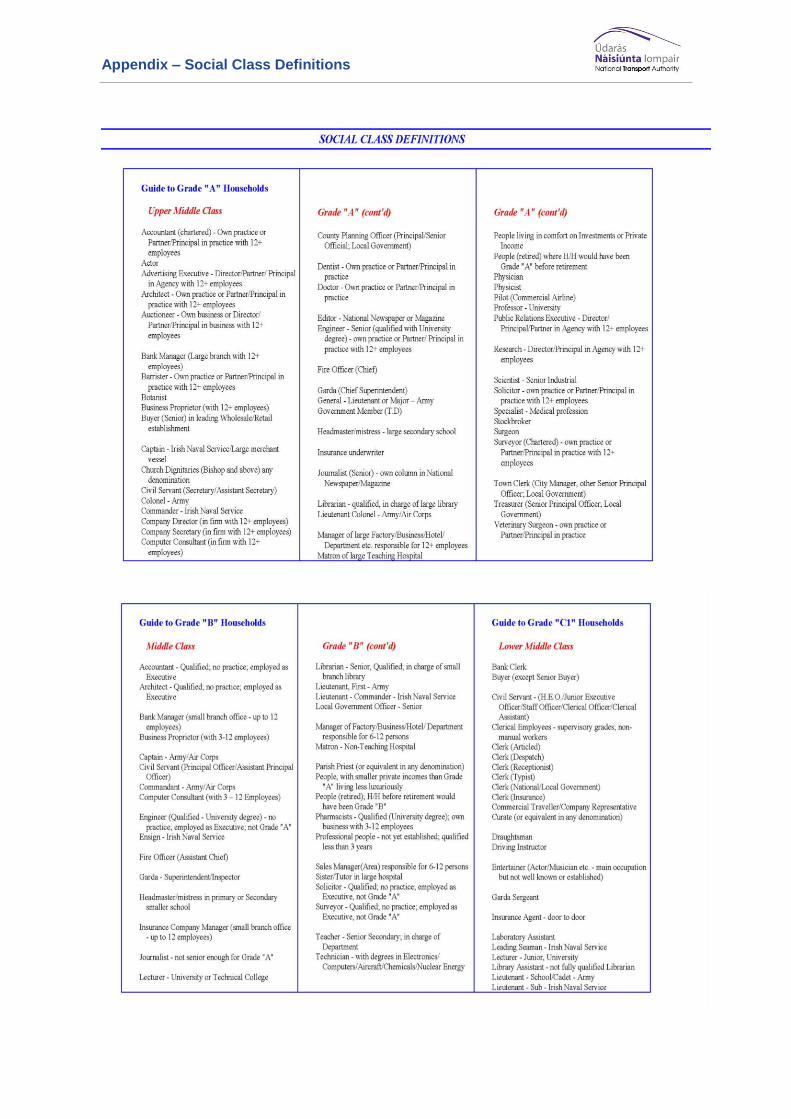
Appendix – Social Class Definitions
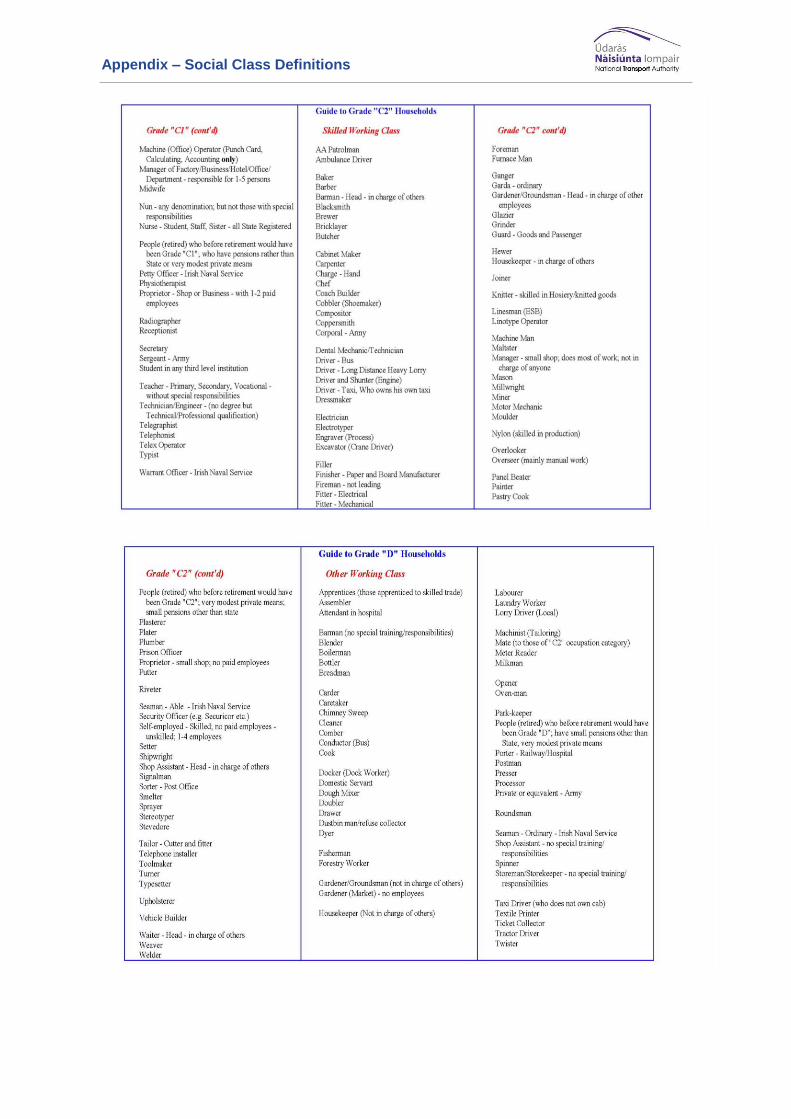
Appendix – Social Class Definitions
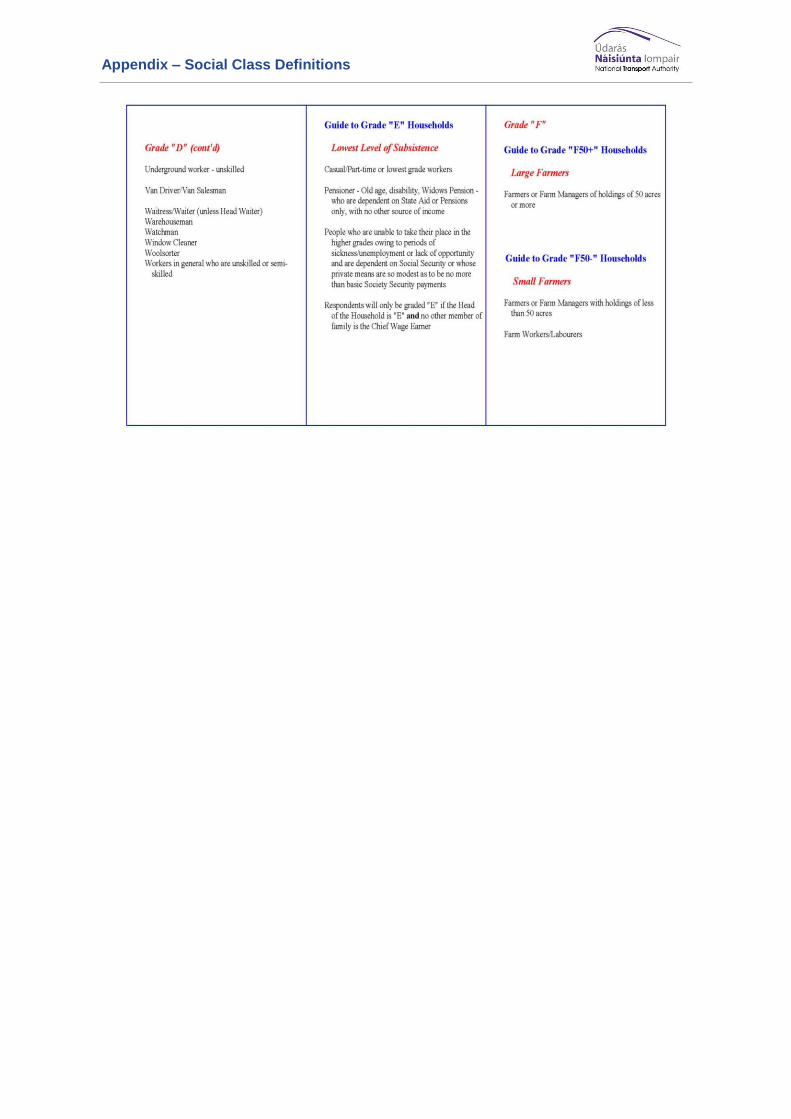
Appendix – Social Class Definitions
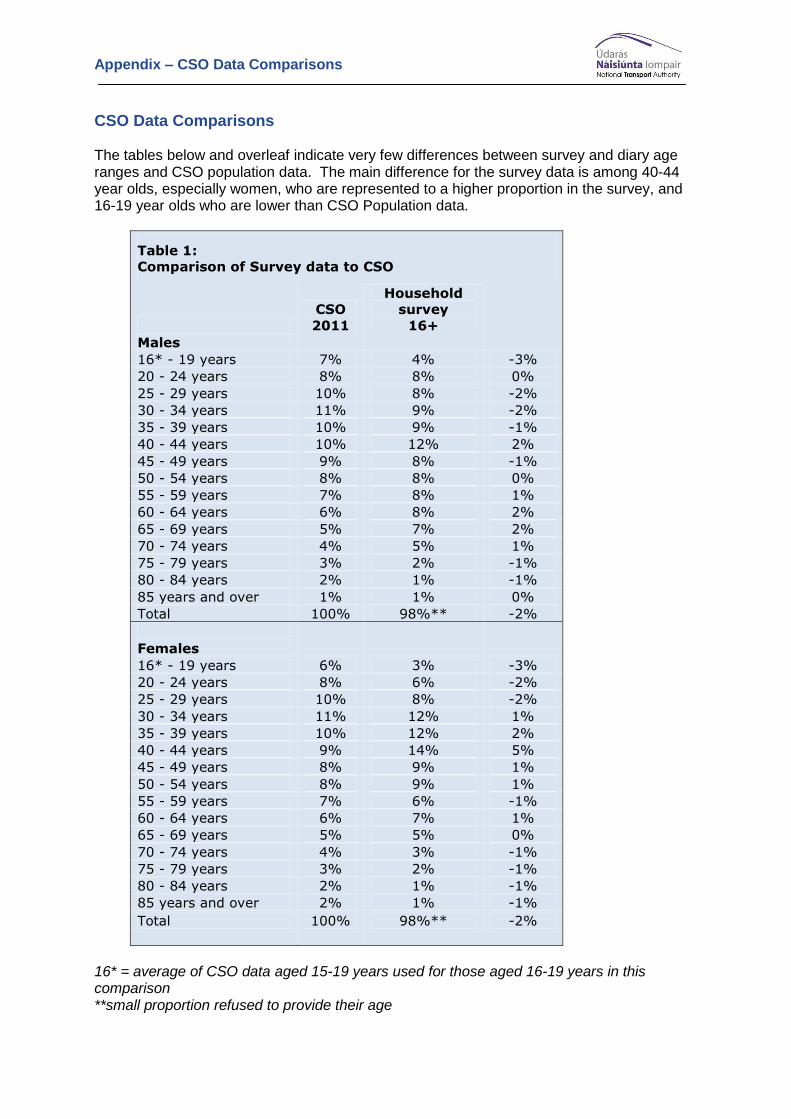
Appendix – CSO Data Comparisons
CSO Data Comparisons The tables below and overleaf indicate very few differences between survey and diary age ranges and CSO population data. The main difference for the survey data is among 40-44 year olds, especially women, who are represented to a higher proportion in the survey, and 16-19 year olds who are lower than CSO Population data.
Table 1:
Comparison of Survey data to CSO
CSO
2011
Household
survey
16+
Males
16* - 19 years 7% 4% -3%
20 - 24 years 8% 8% 0%
25 - 29 years 10% 8% -2%
30 - 34 years 11% 9% -2%
35 - 39 years 10% 9% -1%
40 - 44 years 10% 12% 2%
45 - 49 years 9% 8% -1%
50 - 54 years 8% 8% 0%
55 - 59 years 7% 8% 1%
60 - 64 years 6% 8% 2%
65 - 69 years 5% 7% 2%
70 - 74 years 4% 5% 1%
75 - 79 years 3% 2% -1%
80 - 84 years 2% 1% -1%
85 years and over 1% 1% 0%
Total 100% 98%** -2%
Females
16* - 19 years 6% 3% -3%
20 - 24 years 8% 6% -2%
25 - 29 years 10% 8% -2%
30 - 34 years 11% 12% 1%
35 - 39 years 10% 12% 2%
40 - 44 years 9% 14% 5%
45 - 49 years 8% 9% 1%
50 - 54 years 8% 9% 1%
55 - 59 years 7% 6% -1%
60 - 64 years 6% 7% 1%
65 - 69 years 5% 5% 0%
70 - 74 years 4% 3% -1%
75 - 79 years 3% 2% -1%
80 - 84 years 2% 1% -1%
85 years and over 2% 1% -1%
Total 100% 98%** -2%
16* = average of CSO data aged 15-19 years used for those aged 16-19 years in this comparison **small proportion refused to provide their age
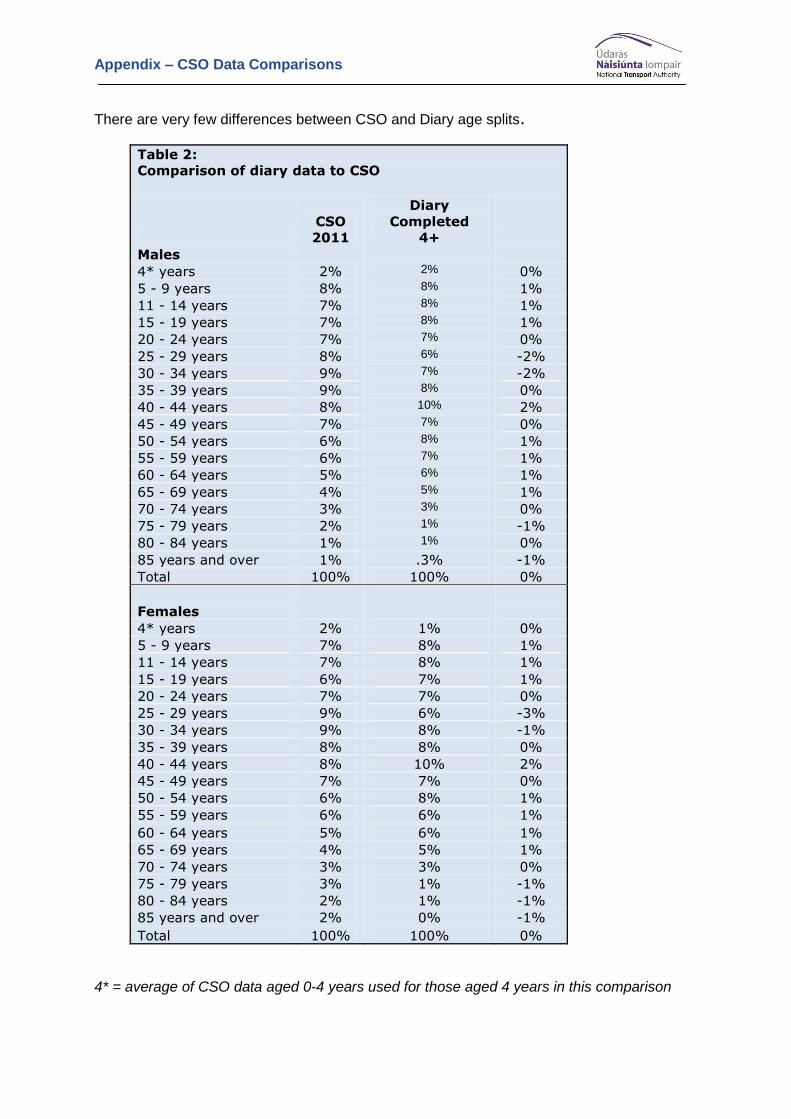
Appendix – CSO Data Comparisons
There are very few differences between CSO and Diary age splits.
Table 2:
Comparison of diary data to CSO
CSO
2011
Diary
Completed
4+
Males
4* years 2% 2% 0%
5 - 9 years 8% 8% 1%
11 - 14 years 7% 8% 1%
15 - 19 years 7% 8% 1%
20 - 24 years 7% 7% 0%
25 - 29 years 8% 6% -2%
30 - 34 years 9% 7% -2%
35 - 39 years 9% 8% 0%
40 - 44 years 8% 10% 2%
45 - 49 years 7% 7% 0%
50 - 54 years 6% 8% 1%
55 - 59 years 6% 7% 1%
60 - 64 years 5% 6% 1%
65 - 69 years 4% 5% 1%
70 - 74 years 3% 3% 0%
75 - 79 years 2% 1% -1%
80 - 84 years 1% 1% 0%
85 years and over 1% .3% -1%
Total 100% 100% 0%
Females
4* years 2% 1% 0%
5 - 9 years 7% 8% 1%
11 - 14 years 7% 8% 1%
15 - 19 years 6% 7% 1%
20 - 24 years 7% 7% 0%
25 - 29 years 9% 6% -3%
30 - 34 years 9% 8% -1%
35 - 39 years 8% 8% 0%
40 - 44 years 8% 10% 2%
45 - 49 years 7% 7% 0%
50 - 54 years 6% 8% 1%
55 - 59 years 6% 6% 1%
60 - 64 years 5% 6% 1%
65 - 69 years 4% 5% 1%
70 - 74 years 3% 3% 0%
75 - 79 years 3% 1% -1%
80 - 84 years 2% 1% -1%
85 years and over 2% 0% -1%
Total 100% 100% 0%
4* = average of CSO data aged 0-4 years used for those aged 4 years in this comparison
Appendix – CSO Data Comparisons
Appendix - Report on Pilot Phase
Page No.
1. Background to Pilot ................................................................................... 1.
2. Changes from previous research .............................................................. 2.
3. Feedback on sample ................................................................................. 3.
4. Feedback on survey .................................................................................. 4.
5. Feedback on diary ..................................................................................... 5.
6 Feedback on Instructions .......................................................................... 6.
Appendix:
Final questionnaire
Final Diary
TABLE OF CONTENTS
Appendix – Report on Pilot Phase
1 | P a g e
1. Background to Pilot In February 2012 the National Transport Authority (NTA) commissioned Millward Brown (formerly Millward Brown Lansdowne) to conduct a National Travel Diary Study. This research will be conducted between April and November 2012 and will involve interviewing in 6,000 households and placing diaries with all aged 4+ years in these household. This is an important research study for the NTA and will provide input into their 2012 modelling plans, which will also incorporate 2011 census data. Therefore the approach and question format needs to be fully piloted prior to the main research being conducted in order to ensure that the survey runs smoothly and the research provides the information required. The pilot study was conducted on a tight turnaround between end March and start April 2012. The original briefing document required a minimum of 80 households split between urban, semi urban and rural locations. This ensures a wide range of points to be covered at strategic locations throughout the country. Millward Brown set the following sampling point splits for the purpose of the Pilot phase: 2 rural sampling points 2 semi urban sampling points 3 urban sampling points … resulting in a final pilot sample of 98 households and a placement of 224 diaries, equivalent of 2.3 diaries per household. Within the time allowed 195 diaries were completed and returned resulting in an 87% completion rate and an average of 2 diaries completed per household, in line with expectations. Assessing the completed diaries and reviewing the topline report from the initial survey enables us to make improvements to both the survey and diary ahead of the full rollout. The methodology has also been assessed and the logistics tested and we have also received detailed feedback from our interviewers and Field Supervisors in order to identify any potential issues and also highlight any improvements. Once the pilot had been completed, the full Millward Brown NTA team met to review all elements of the pilot and to make changes and recommendations for moving forward. The details of these changes are included in the following pages.
Appendix – Report on Pilot Phase
2 | P a g e
2. Changes from Previous Research
While the pilot is an important aspect of this research programme, we also need to take into account previous comparable research projects. Millward Brown conducted research for the Dublin Transportation Office (DTO), now subsumed into the NTA, in 2004 and 2006, including the Luas Before and After Studies and also the forerunner to the current study, the Greater Dublin Area (GDA) Travel Diary study. We have taken the questionnaire and diary from the 2006 GDA study as the initial starting point for this research programme, as this is a tried and tested approach. However there are a number of distinct differences which require amendments to be made throughout the research programme. These differences include:
1) A 2 day travel diary in 2012 as opposed to a 7 day travel diary in 2006. We believe that the reduced obligation on respondents to complete only 2 days travel entries will help improve co-operation rates, especially among others in the household who did not complete the initial survey and therefore do not have the benefit of the rapport that the interviewed respondents will have established with the interviewer.
2) Research conducted throughout the Republic of Ireland as opposed to GDA only. The wider geographical scope of the 2012 research will mean that different transport patterns will be encountered especially in rural areas outside the GDA. The inclusion of a large proportion of rural sampling points will also introduce specific challenges in terms of sample allocation and spread in sparsely populated locations. It may also pose issues in terms of recording addresses where there are often no house numbers or street names and where household are just identified by family name and townland.
3) Diaries to be completed by all aged 4+ in household rather than all aged 11+ previously. The introduction of children aged 4-10 years into the diary completion will bring its own challenges in terms of actual completion, which in many cases will need to be assisted by a parent or other adult. We also need to provide clear instruction for those trips taken by the children in the household but where accompanied by an adult from outside the household e.g. child minder, grandparent, etc.
Furthermore, since 2006 travel patterns and economic circumstances have changed, with many more people unemployed, which does not necessarily lead to fewer trips but to different type of trips. One improvement that has been introduced in terms of technology is that the research survey is now conducted via a handheld HAPI device. This helps to improve routing and flow of survey while also enhancing data collection with up to date monitoring of survey completion.

Appendix – Report on Pilot Phase
3 | P a g e
3. Feedback on Sample
Detailed discussion between Millward Brown, AECOM and the NTA around sampling approach and allocation of sampling points were held in advance of the pilot. Different options were discussed in relation to the Geodirectory and optimum use of maps. The following has been implemented and tested during the pilot
- We provide one area per point, highlighting the survey area.
- Maps show residential buildings/households.
- Each sampling point is unique and not overlapping
- Sampling points are distributed regionally based on CSO population distribution.
- Allocation of sampling points would be spread geographically over
time throughout the research period in order to avoid any regional/time bias.
- During the full rollout of the survey, interviewers will mark households
visited on their map with household number and return them with the diaries & completion sheets to aid identification.
We are monitoring sample point allocation through the two periods of research (April-June and September – November) and will update the NTA if any difficulties are envisaged

Appendix – Report on Pilot Phase
4 | P a g e
4. Feedback on Survey
Feedback from interviewers on the pilot survey is that it worked really well and the flow and length did not provide any problems. We also analysed the topline results from the pilot survey in order to ensure that questions were being answered correctly and looked at the ‘other answer’ options to ensure no codes were omitted. A summary of the changes made to the survey as a result of the pilot are listed below:
- Those aged 15 now need to have written permission to be included in surveys (guidelines have changed since 2006 on this matter). Therefore the lower age limit was changed from 15+ to 16+ on survey.
- It was felt that the flow of the interview was somewhat disrupted by personal questions at start, therefore measures such as chief income earner status, occupation and grading of social class questions were placed at end of interview alongside income question.
- The analysis of open ended responses to Q20 showed that while some modes were not used in the past week they were used from time to time. Therefore we re-introduced the question on Never/Rarely use modes (Q19b) as a filter for ‘Reason why not use modes’ (Q20).
- We received feedback resulting in simplification of instructions on
completion of details for other household member, to ensure correct corresponding number is placed on the relevant diary to allow for consolidation of diary and survey data.
- We also identified the need for a real-time tally of diaries placed for
project management so interviewers are now asked to enter this into the survey data at the end of each interview.
The survey was then amended and re-piloted internally before final sign of by the NTA ahead of the full rollout of the household survey.
Appendix – Report on Pilot Phase
5 | P a g e
5. Feedback on Dairy As the diary contains the main travel element of the research programme the investigation into the feedback from the pilot phase was both extensive and thorough. This involved detailed review of all completed and retuned dairies by our various in-house departments in Millward Browne and also feedback from AECOM. There were considerable changes made in terms of layout, rather than content, in order to enhance completion of the diaries. This proved to be the most successful aspect of the pilot, as this will ensure more accurate and full data for the overall study. A copy of the final dairy layout is appended, and while most of the changes were ‘cosmetic’ they were important to help respondents complete their travel entries accurately and in full. A summary of the main changes are listed below:
Front page: - Changes were made to the capture of person number within
household (XX of YY) to smoother consolidation of data - The front page layout has been enhanced to include two key
addresses only, allowing for more room to capture information. Example page: - One of our interviewers suggested that some lines of the example
page be left clear for interviewer to use as written example while explaining the diary to respondents. It was felt that this was a very good build and was therefore incorporated.
- It was also felt that more generic addresses were needed for relevance across Ireland, as the existing version was too Dublin centric
Day 1 & 2 Diary completion pages: - We provided clearer details and more space for inserting start
address for diary days, by including a large text box including specific requirements, in top left hand corner on diary days
- Our analysis of the returned diaries also showed that hours/minutes and am/pm were not always fully completed so this part of the diary page was enhanced.
- We also incorporated clearer instructions around columns JKL in relation to those using or not using a car
Long Journey page: - We also enhanced the layout of the Long journey page, particularly in
relation to instructions All changes were signed of by our field department, AECOM and the NTA.
Appendix – Report on Pilot Phase
6 | P a g e
6. Feedback on Instructions Another positive aspect of the pilot was that it highlighted any information gaps that existed. Following on from the pilot we want to ensure that all parties were fully briefed on the various aspects of the research programme. For the main survey we will ensure that all interviewers are first briefed by phone and then receive comprehensive briefing notes on the various aspects of the survey. They are also able to contact our field department at any stage if they have queries. Specific areas of feedback are listed below:
- Instructions on neater hand-writing were incorporated to ensure easier recording during data entry
- In the interviewer guidelines we re-iterated that the survey section on other household members should be completed and a dairy placed for each person normally resident in the household and if any person happened to be absent from the household for the specific diary days that the diary should be completed as much as possible for that person (as long as they were still within the Republic of Ireland)
- A scenario came to light where famers on their own land or people in
rural Ireland were travelling more than 50 meters to go to their own post/letter box, washing line, etc. We advised that these trips should not be included in the diary and only trips to and from work (including intermediary trips) should be included (excluding those trips that are part of work requirements such as driver of taxi/truck/tractor, etc)
Following on from the pilot phase some of the queries we received in relation to diary entries were incorporated into a specific section of the NTA website to outline details and FAQs on the study. This website is accessible to anyone who has questions about the Travel Diary Research Study.