2017 national household travel
TRANSCRIPT
2017 National Household Travel Survey Data Explorer User’s Guide — Public Use Version Prepared by the Federal Highway Administration Revised February 2021
2017 NHTS Data Explorer User’s Guide for Add-on Agencies
i
TABLE OF CONTENTS
CHAPTER 1. BACKGROUND ............................................................................................... 1
CHAPTER 2. FREQUENTLY ASKED QUESTIONS .................................................................... 2
What is the NHTS-DE? .......................................................................................................... 2
What is in the NHTS-DE V1.2 Update?................................................................................. 2
How Do I Calculate and Interpret Margin of Error?............................................................. 2
What Do I Do if I Encounter Problems While Running the Data Explorer? ......................... 2
CHAPTER 3. ACCESSING THE 2017 NHTS DATA EXPLORER .................................................. 3
CHAPTER 4. TOOL OVERVIEW ........................................................................................... 4
NHTS-DE Key Elements ........................................................................................................ 4
CHAPTER 5. USING THE TOOL............................................................................................ 7
CHAPTER 6. EXAMPLE APPLICATIONS .............................................................................. 15
Example 1. Creating a Table with an Analysis Variable and One Tabulation Variable (Row Variable) and Calculating MoE ........................................................................................... 15
Example 2. Creating a Table with an Analysis Variable and Two Tabulation Variables (Row and Column Variable) while selecting data subsets ................................................. 18
Example 3. Creating a Table with an Analysis Variable and Three Tabulation Variables (Row, Column and Page Variable) while selecting data subsets ....................................... 21
APPENDIX – USING THE ADJUSTED TRIP MILEAGE VARIABLE IN NHTS-DE TO COMPUTE MILEAGE BY CATEGORIZED TRIP DISTANCE ..................................................................... 25
Example 1. Calculating Annual VMT by Trip Distance and Household Location ............... 25
Example 2. Calculating Distribution of Work Trips by Trip Distance ................................. 30

2017 NHTS Data Explorer User’s Guide — Public Use Version
1
CHAPTER 1. BACKGROUND
The National Household Travel Survey (NHTS) Data Explorer (NHTS-DE) was created to support online data analysis of the 2017 NHTS. It provides users with the ability to build customized tabulations without any special software and delivers output tables in Hypertext Markup Language (HTML), Excel spreadsheet, and comma-separated value (CSV) formats. The main goal of this online tool is to make NHTS data more user friendly. The public use version of this tool (i.e., NHTS-DE) is located on the NHTS homepage and can be used to analyze NHTS data at the national level.

2017 NHTS Data Explorer User’s Guide — Public Use Version
2
CHAPTER 2. FREQUENTLY ASKED QUESTIONS
What is the NHTS-DE?
The NHTS-DE provides a convenient and user friendly way to analyze 2017 NHTS data at the national level. Some of its features include the following:
• Users can run an analysis online without any special software.
• The tool automatically applies the correct statistical weight based on the selected unit of analysis.
• The tool provides convenient summaries using the most common NHTS metrics (e.g., Average Annual Miles per Driver, Vehicle Occupancy, Annual Person Miles of Travel, Average Trip Length, Annual Vehicle Miles of Travel, etc.) built-in as a part of the available analysis variables.
What is in the NHTS-DE V1.2 Update?
The NHTS-DE V1.2 update incorporates all the update objectives listed in the NHTS Version 1.2 Release Notes. The following two points are especially worth noting:
• For analyses involving gender and age, imputed age and sex variables (i.e., R_AGE_IMP and R_SEX_IMP, both added in the V1.1 release) are recommended. Examples in chapters 5 and 6 of this guide illustrate the use of these two variables. For more information on R_AGE_IMP and R_SEX_IMP, refer to “Imputed Age and Sex Variables” in the NHTS Version 1.2 Release Notes.
• For trip length summaries that are generated for trending purposes (i.e., comparing 2017 NHTS data with prior NHTS/NPTS data), the adjusted trip length variable (i.e., TRPMILAD, added in V1.2 release) is recommended. See appendixError! Reference source not found. for details on how to use this variable in the NHTS-DE tool. For more information on the adjusted trip length variable, please refer to “Adjusted Trip Mileage Variable” in the NHTS Version 1.2 Release Notes.
How Do I Calculate and Interpret Margin of Error?
The margin of error (MoE) refers to the maximum difference expected between the true value of a measure and the estimated statistic, typically expressed in a confidence interval (CI). For example, a 95% CI means: there is a 95% confidence that the true value of an estimated measure will be in the given CI range.
For more information on how to calculate and interpret MoE within the NHTS-DE, refer to chapter 4 (C-1. Error! Reference source not found.) and chapter 6 (example 1) of this guide.
What Do I Do if I Encounter Problems While Running the Data Explorer?
For technical assistance when using or interpreting the output from the NHTS-DE, contact Data User Support.

2017 NHTS Data Explorer User’s Guide — Public Use Version
3
CHAPTER 3. ACCESSING THE 2017 NHTS DATA EXPLORER
The 2017 NHTS Data Explorer (NHTS-DE) can be accessed from the NHTS homepage using the following steps:
Step 1: Go to the NHTS homepage at https://nhts.ornl.gov/ (see figure 1).
Figure 1. NHTS homepage.
Step 2: Scroll down to the bottom of the homepage. The NHTS-DE appears on the bottom of the page.
2017 NHTS Data Explorer User’s Guide — Public Use Version
4
CHAPTER 4. TOOL OVERVIEW
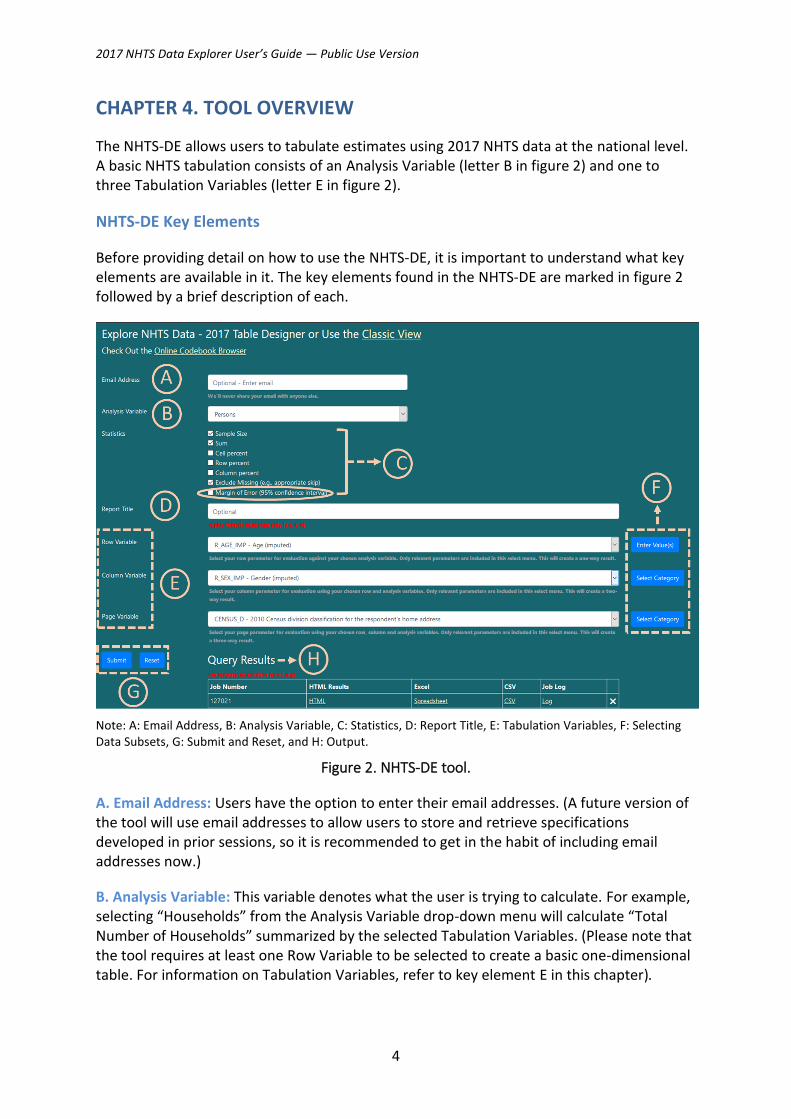
The NHTS-DE allows users to tabulate estimates using 2017 NHTS data at the national level. A basic NHTS tabulation consists of an Analysis Variable (letter B in figure 2) and one to three Tabulation Variables (letter E in figure 2).
NHTS-DE Key Elements
Before providing detail on how to use the NHTS-DE, it is important to understand what key elements are available in it. The key elements found in the NHTS-DE are marked in figure 2 followed by a brief description of each.
Note: A: Email Address, B: Analysis Variable, C: Statistics, D: Report Title, E: Tabulation Variables, F: Selecting Data Subsets, G: Submit and Reset, and H: Output.
Figure 2. NHTS-DE tool.
A. Email Address: Users have the option to enter their email addresses. (A future version of the tool will use email addresses to allow users to store and retrieve specifications developed in prior sessions, so it is recommended to get in the habit of including email addresses now.)
B. Analysis Variable: This variable denotes what the user is trying to calculate. For example, selecting “Households” from the Analysis Variable drop-down menu will calculate “Total Number of Households” summarized by the selected Tabulation Variables. (Please note that the tool requires at least one Row Variable to be selected to create a basic one-dimensional table. For information on Tabulation Variables, refer to key element E in this chapter).

2017 NHTS Data Explorer User’s Guide — Public Use Version
5
Since Analysis Variables represent the basis of calculation, the NHTS-DE tool includes the most common NHTS metrics (e.g., Average Annual Miles per Driver, Average Vehicle Occupancy, Annual Person Miles of Travel, Average Person Trip Length, Annual Vehicle Miles of Travel, etc.) built-in as Analysis Variables. For the entire list, please see the Analysis Variable drop-down menu in the NHTS-DE.
C. Statistics: This provides a list of different statistical measures available in the NHTS-DE to summarize the selected Analysis Variable and Tabulation Variables. The list is dynamically generated as the selection of Analysis Variable and Tabulation Variables change. Only those statistics relevant to the selected variables are included in the list.
One of the statistical measures available in the list of Statistics is the margin of error (MoE) (encircled within key element C). MoE needs special mention, as there is often confusion on how to interpret it.
The MoE refers to the maximum difference expected between the true value of a measure and the estimated statistic, typically expressed in a confidence interval (CI). A 95% CI means that there is a 95% confidence that the true value of an estimated measure will fall in the given CI range. For example, according to the 2017 NHTS, the weighted survey estimates of total trips (nationally) reported by workers was 216,235 (in millions) while its corresponding MoE was estimated as 1,949.86 (in millions). This MoE estimate allows one to conclude with 95% confidence that the interval 214,285.14 (in millions) to 218,184.86 (in millions) contains the true estimate of total number of trips undertaken by workers. These lower and upper bounds of the 95% CI in this case were calculated as follows:
• Lower Bound = 216,235 – 1,949.86 = 214,285.14
• Upper Bound = 216,235 + 1,949.86 = 218,184.86
Refer to chapter 6 (see example 1) of this guide to understand how MoE can be calculated using NHTS-DE.
D. Report Title: This field can be used to enter an appropriate title for the table that is being generated. The resulting output table will show this specific table heading. While this field is optional, providing an appropriate title can be useful to distinguish between different table outputs in instances where the user is running multiple tables.
E. Tabulation Variables: Tabulation Variables are the variables by which the Analysis Variable would be summarized in the output table(s). These are basically data items (i.e., NHTS variables) that were collected in the 2017 NHTS. Up to three Tabulation Variables can be selected: Row, Column, and Page:
• Row Variable: This is the first of the three Tabulation Variables and is required by the tool in order to generate output. When Row Variable is selected, a drop-down menu of Row Variables appears, which provides a list of applicable NHTS variables by which the selected Analysis Variable can be generated. The resultant output table summarizes the Analysis Variable by the selected Row Variable.
• Column Variable: This second Tabulation Variable can only be selected once the Row Variable is selected. The Column Variable drop-down menu provides a list of

2017 NHTS Data Explorer User’s Guide — Public Use Version
6
applicable NHTS variables similar to the Row Variable. The resultant output table summarizes the Analysis Variable based on combinations of the Row and the Column Variables.
• Page Variable: This third Tabulation Variable can only be selected after both the Row and Column Variables are selected. The Page Variable drop-down menu provides a list of applicable NHTS variables that can be used to further breakdown the results into multiple tables. The resultant output generates separate tables, summarizing the Analysis Variable by Row and Column Variables based on the selected Page Variable.
F. Selecting Data Subsets: The DE tool includes the ability for users to select specific data subsets for analysis using the Enter Value(s)/Select Category filters, which are available for each Tabulation Variable. These filters are optional and are applicable when the user desires to work with only subsets of specific variables. The choice is presented either as “Enter Value(s)” or “Select Category”, depending on whether the Tabulation Variable contains continuous/numeric values or is a categorical data element, respectively.
• For continuous/numerical variables, such as R_AGE_IMP (i.e., imputed respondent age) or TRPMILES (i.e., trip distance in miles), the Enter Value(s) button will appear on the side of the Tabulation Variable drop-down menu.
• For categorical variables, such as HHFAMINC (i.e., household income), R_SEX_IMP (i.e., imputed respondent gender), or HH_Race (i.e., respondent race), the Select Category button appears on side of the Tabulation Variable drop-down menu.
G. Submit and Reset: Click on the Submit button to generate desired data summaries. Click on the Reset button to clear out all selections and restart the query process.
H. Output: This represents the Query Results table, where the links to the generated tabular output appear when the results are generated.
After the Submit button is clicked, the NHTS-DE returns the Query Results table. The Query Results table consists of the job number (a unique identification number associated with the specific query job that was carried out by the user), links to the generated output table (in HTML, Excel spreadsheet, and CSV formats), and a job log link that provides a text file containing detailed events logged by the SAS program. The job log contains information about the date and time when the job was executed, computation time, query details, output information, and errors.
When contacting user support with questions about your output, it is helpful to provide the specific job log number(s).
2017 NHTS Data Explorer User’s Guide — Public Use Version
7
CHAPTER 5. USING THE TOOL
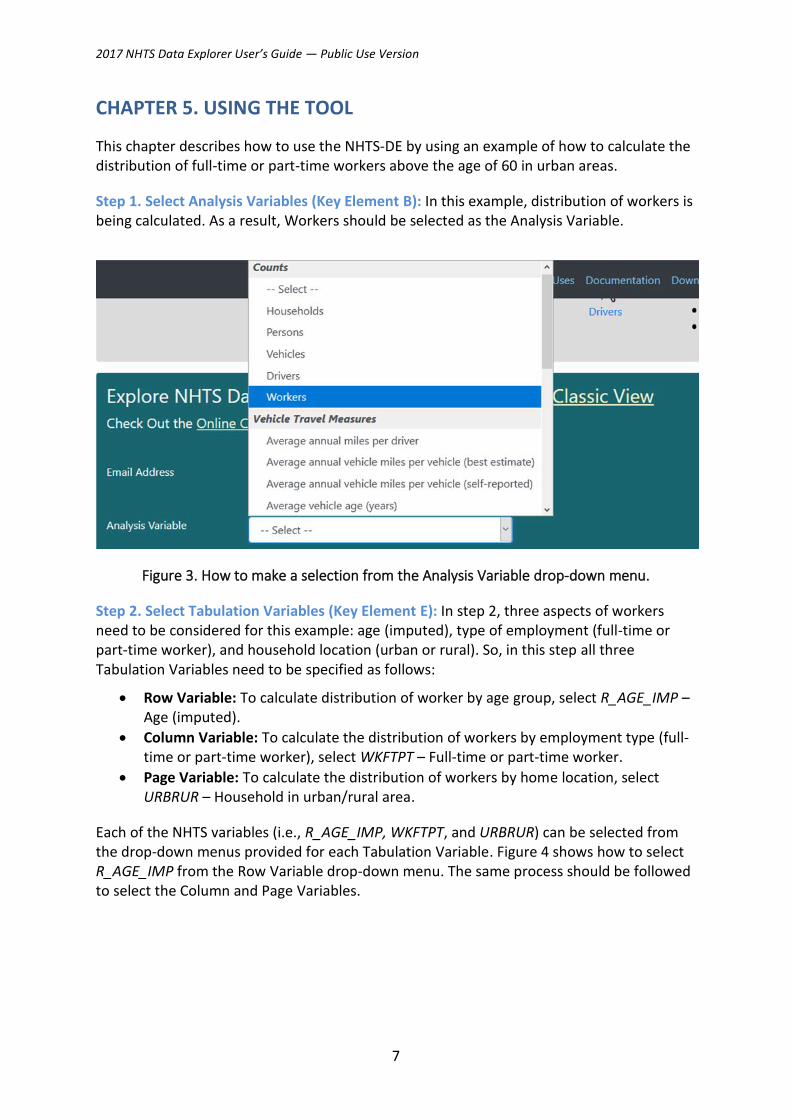
This chapter describes how to use the NHTS-DE by using an example of how to calculate the distribution of full-time or part-time workers above the age of 60 in urban areas.
Step 1. Select Analysis Variables (Key Element B): In this example, distribution of workers is being calculated. As a result, Workers should be selected as the Analysis Variable.
Figure 3. How to make a selection from the Analysis Variable drop-down menu.
Step 2. Select Tabulation Variables (Key Element E): In step 2, three aspects of workers need to be considered for this example: age (imputed), type of employment (full-time or part-time worker), and household location (urban or rural). So, in this step all three Tabulation Variables need to be specified as follows:
• Row Variable: To calculate distribution of worker by age group, select R_AGE_IMP – Age (imputed).
• Column Variable: To calculate the distribution of workers by employment type (full-time or part-time worker), select WKFTPT – Full-time or part-time worker.
• Page Variable: To calculate the distribution of workers by home location, select URBRUR – Household in urban/rural area.
Each of the NHTS variables (i.e., R_AGE_IMP, WKFTPT, and URBRUR) can be selected from the drop-down menus provided for each Tabulation Variable. Figure 4 shows how to select R_AGE_IMP from the Row Variable drop-down menu. The same process should be followed to select the Column and Page Variables.

2017 NHTS Data Explorer User’s Guide — Public Use Version
8
Figure 4. How to make a selection from the Row Variable drop-down menu.
For guidance on the correct variable names to use for any Tabulation Variable, use the Online Codebook Browser and search for the variable by entering a keyword. For example, type “Age” when looking for the NHTS variable representing respondents’ imputed ages. This will bring up a filtered list of variables related to age (i.e., variables with the word “age” in their description).
The Tabulation Variables automatically appear one after the other once the previous variable is selected. For example, the Row Variable will appear automatically after the Analysis Variable is selected. Similarly, the Column Variable will appear once Row Variable is selected. Figure 5 through figure 7 illustrate this process.
After Analysis Variable is Selected:
Figure 5. Row Variable visible once an Analysis Variable is selected.

2017 NHTS Data Explorer User’s Guide — Public Use Version
9
After Row Variable is Selected:
Figure 6. Column Variable visible once a Row Variable is selected.
After Column Variable is Selected:
Figure 7. Page variable visible once a Column variable is selected.
Step 3. Select Data Subsets (Key Element F): Data subsets should be specified once all the necessary Tabulation Variables are selected. This is an optional step to be used when data subsets are desired for any Tabulation Variable.
To calculate the percentage of workers above the age of 60, as demonstrated in figure 8, for Row Variable R_AGE_IMP, use the following steps:

2017 NHTS Data Explorer User’s Guide — Public Use Version
10
1. Click the Enter Value(s) button next to the Row Variable (R_AGE_IMP). 2. Select “Greater than” from the Operator drop-down menu. 3. Enter 60 in the Constant field.
Figure 8. How to select data subsets for numerical/continuous variables.
To calculate the distribution of workers by their employment type (i.e., full-time or part-time) there is no need to select anything from the Column Variable drop-down menu of data subset. This is because the analysis involves estimating both full-time and part-time workers, so no subset is required.
To calculate distribution of workers in urban areas, the Page Variable needs to be selected as follows (see figure 9):
1. Click the Select Category button next to the Page Variable. 2. Select URBRUR – Urban from the drop-down menu.
Figure 9. How to select data subsets for categorical variables.
Step 4. Enter a Report Title (Key Element D): While optional, providing an appropriate report title is useful in describing what is being shown in the table.
Figure 10 shows where to type in the report title. In this example, “Distribution of Elderly workers by Employment Type in Urban Area” is used.

2017 NHTS Data Explorer User’s Guide — Public Use Version
11
Figure 10. How to enter a Report Title.
Step 5. Select Statistics (Key Element C): To select desired Statistics, select/unselect the checkboxes provided under the list of Statistics. For this analysis, the following options were chosen (see figure 11):
• Sum.
• Row percent.
• Exclude Missing (e.g., appropriate skip).
Figure 11. List of Statistics.
Step 6. Click Submit Button (Key Element G): At this point in the process, it is time to generate the output tables. To do so, click the Submit button to request the output table (see figure 12).
Figure 12: How to request and access tabular outputs
Step 7. Click on the HTML Link (Key Element H): After clicking the Submit button, Query Results table will appear. Within the table, click on any one of the links (HTML Results, Excel, or CSV) to get the output table in the desired format. In this example, the HTML Results link was selected for viewing the online outputs (see figure 12).
2017 NHTS Data Explorer User’s Guide — Public Use Version
12
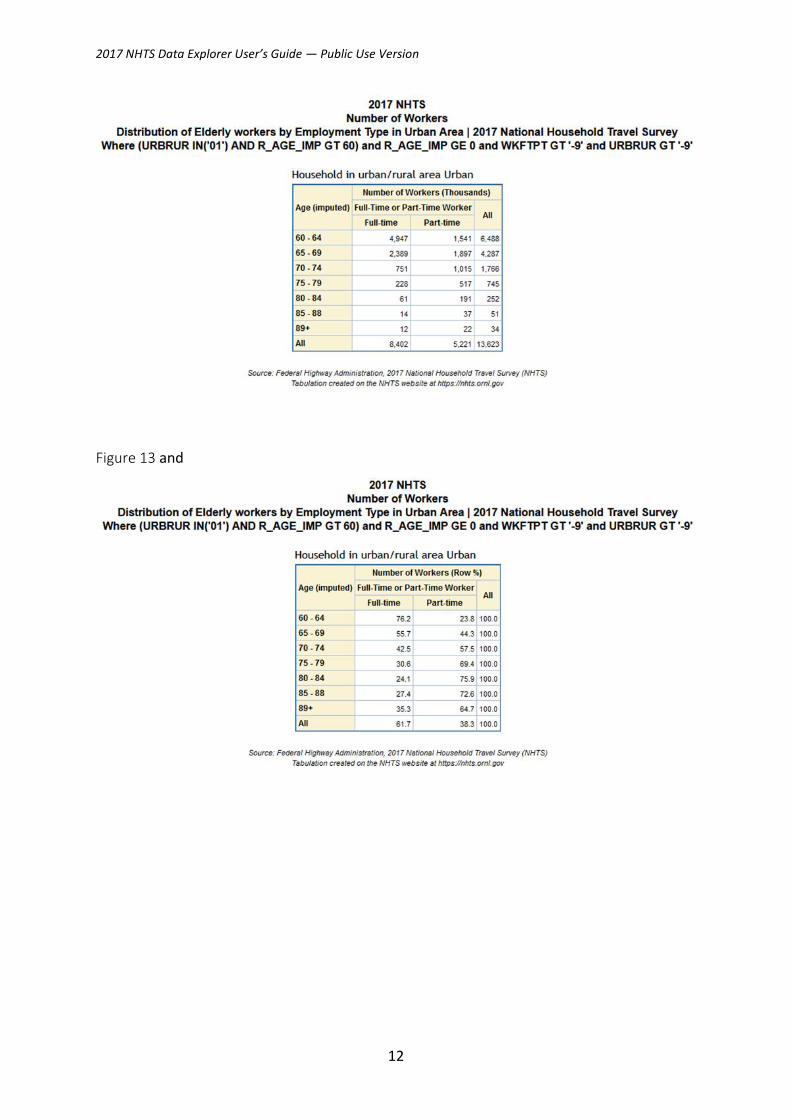
Figure 13 and

2017 NHTS Data Explorer User’s Guide — Public Use Version
13
figure 14 show the HTML output tables that were generated.
Figure 13 shows the sum (in thousands) of full-time and part-time workers who are above 60 years old and live in an urban area. Columns 2–4 are weighted totals (or sum) of full-time and part-time and total workers respectively.
Figure 14 shows the row percent of full-time and part-time workers who are above 60 years old and live in an urban area. Columns 2–4 show the percentages.

2017 NHTS Data Explorer User’s Guide — Public Use Version
14
Figure 13. First tabular output showing total number of full-time and part-time workers who are above 60 years old and located in an urban area.
Figure 14. Second tabular output showing row percentage of full-time and part-time workers who are above 60 years old and located in an urban area.

2017 NHTS Data Explorer User’s Guide — Public Use Version
15
CHAPTER 6. EXAMPLE APPLICATIONS
This chapter provides three examples that demonstrate how to use the NHTS-DE tool.
Example 1. Creating a Table with an Analysis Variable and One Tabulation Variable (Row Variable) and Calculating MoE
Example 1 outlines how to analyze the number of drivers by age group using the NHTS-DE tool.
Step 1. Select Analysis Variables: In this example, distribution of driver count is being calculated. As a result, Drivers should be selected as the Analysis Variable.
Step 2. Select Tabulation Variables: Only one aspect of drivers is being considered: age. As a result, only the Row Variable will be utilized. The variable R_AGE_IMP (i.e., imputed respondent age) should be selected.
Step 3. Select Data Subsets: Since this calculation does not require any data subsets, this step is not applicable for this example.
Step 4. Enter Report Title: Type in “Number of Drivers by Age Group” for the report title.
Step 5. Select Statistics: The desired measures should be selected from the list of Statistics. The following options were chosen for this example:
• Sample Size.
• Sum.
• Percent.
• Exclude Missing (e.g., appropriate skip).
• Margin of Error (95% confidence interval).
Step 6. Click Submit Button: At this point in the process, it is time to generate the output tables. To do so, click the Submit button to request the output table.
Step 7. Click on the HTML link: Click on the HTML link within the Query Results table.
Figure 15 shows what the NHTS-DE should look like after following steps 1–7.

2017 NHTS Data Explorer User’s Guide — Public Use Version
16
Figure 15. NHTS-DE tool with all the selected items for example 1.
The HTML output for this analysis produces the following two tables:
• Table 1 shows the sample size, sum, and percent for total number of drivers by age group (see figure 16).
• Table 2 shows MoE for total number of drivers by age group (see figure 17).
In figure 16, column 3 (i.e., sum) shows the weighted survey estimates of the total number of drivers by age group. As an example, at the 16–20-years-old age group, 14,265 (in thousands) drivers were estimated based on the 2017 NHTS national data. This accounted for 6.4% of the total drivers in the United States, as shown in column 4.

2017 NHTS Data Explorer User’s Guide — Public Use Version
17
Figure 16. Tabular output 1 for example 1 showing sample size, sum, and percent for total number of drivers by age group.
MoE, as shown in figure 17, is based on the 95% CI. The weighted survey estimates of total number of drivers in the 16–20 age group is 14,265 (in thousands) (see figure 16), its corresponding MoE is estimated as 525.89 (in thousands) (see figure 17). As a result, the lower and upper bounds can be calculated as follows:
• Lower bound: (14,265 − 525.89) = 13,739.11
• Upper bound: (14,265 + 525.89) = 14,790.89
This MoE estimate allows one to conclude with 95% confidence that the interval 13,739.11 (in thousands) to 14,790.89 (in thousands) contains the estimated number of total drivers belonging to the 16–20 age group.

2017 NHTS Data Explorer User’s Guide — Public Use Version
18
Figure 17. Tabular output 2 for example 1 showing MoE for total number of drivers by age group.
Example 2. Creating a Table with an Analysis Variable and Two Tabulation Variables (Row and Column Variable) while selecting data subsets
Example 2 outlines how to calculate the average vehicle age (years) by vehicle type for low-income households (i.e., income less than $25,000) using the NHTS-DE tool.
Step 1. Select Analysis Variables: In this example, the average vehicle age (years) is being calculated. As a result, Average vehicle age (years) should be selected as the Analysis Variable.
Step 2. Select Tabulation Variables: Vehicle age is being analyzed by two aspects: vehicle type and household income. As a result, both the Row and the Column Variables will be utilized.
• Row Variable: VEHTYPE – Vehicle type.
• Column Variable: HHFAMINC – Household income.

2017 NHTS Data Explorer User’s Guide — Public Use Version
19
Step 3. Select Data Subsets: To calculate average vehicle age by vehicle type there is no need to select anything from the Row Variable drop-down menu of data subset. This is because the analysis involves estimating all the vehicle types, so no subset is required.
To calculate average vehicle age by low-income households, click the Select Category button next to the Column Variable (HHFAMINC) and select the following from the drop-down menu (press the ctrl key while selecting multiple categories).
• HHFAMINC - Less than $10,000
• HHFAMINC - $10,000 to $14,999
• HHFAMINC - $15,000 to $24,999
Step 4. Enter Report Title: Type in “Mean Vehicle Age by Vehicle Type for Low-Income Households” for the report title.
Step 5. Select Statistics: The desired measures should be selected from the list of Statistics. The following options were chosen for this example:
• Mean.
• Exclude Missing (e.g., appropriate skip).
Step 6. Click Submit Button: At this point in the process, it is time to generate the output tables. To do so, click the Submit button to request the output table.
Step 7. Click on the HTML Link: Click on the HTML link within the Query Results table.
Figure 18 shows what the NHTS-DE should look like after following steps 1–7.

2017 NHTS Data Explorer User’s Guide — Public Use Version
20
Figure 18. NHTS-DE tool with all the selected items for example 2.
The HTML output for this analysis produces a single table showing the mean of vehicle age (years) by vehicle type for all three specified household income categories (see
figure 19).
In
figure 19, columns 2 through 4 show estimates of mean vehicle age (years) by different vehicle type for each of the three selected household income categories. For example, mean vehicle age of automobile/car/station wagon in households with income less than $10,000 is 12.58 (years). Column 5 (i.e., all) gives the mean vehicle age (years) by vehicle type for all low-income households.

2017 NHTS Data Explorer User’s Guide — Public Use Version
21
Figure 19. Tabular output for example 2 showing the mean of vehicle age (years) by vehicle type for all three specified household income categories.
Example 3. Creating a Table with an Analysis Variable and Three Tabulation Variables (Row, Column and Page Variable) while selecting data subsets
Example 3 outlines how to calculate the distribution of walk and bike trips by trip distance and gender using the NHTS-DE tool.
Step 1. Select Analysis Variables: In this example, distribution of total annual person trips is being calculated. As a result, Annual person trips (Travel Day PT) should be selected as the Analysis Variable.
Step 2. Select Tabulation Variables: Three aspects of trips are being considered: travel mode, trip distance and gender. As a result, all three Tabulation Variables i.e., Row. Column and Page Variables will be utilized.
• Row Variable: TRPTRANS – Trip mode, derived.
• Column Variable: TRPMILES – Trip distance in miles, derived from route geometry returned by Google Maps API, or from reported loop-trip distance.
• Page Variable: R_SEX_IMP – Gender (imputed).
Step 3. Select Data Subsets: To calculate walk and bike trips, click the Select Category button next to the Row Variable (TRPTRANS) and select TRPTRANS - Walk and TRPTRANS - Bicycle from the drop-down menu (click the ctrl key while selecting multiple categories).
To calculate distribution of trips by trip distance there is no need to subset the Column Variable. This is because the analysis involves estimating distribution of trips for all categories of trip distances, so no subset is required.
2017 NHTS Data Explorer User’s Guide — Public Use Version
22
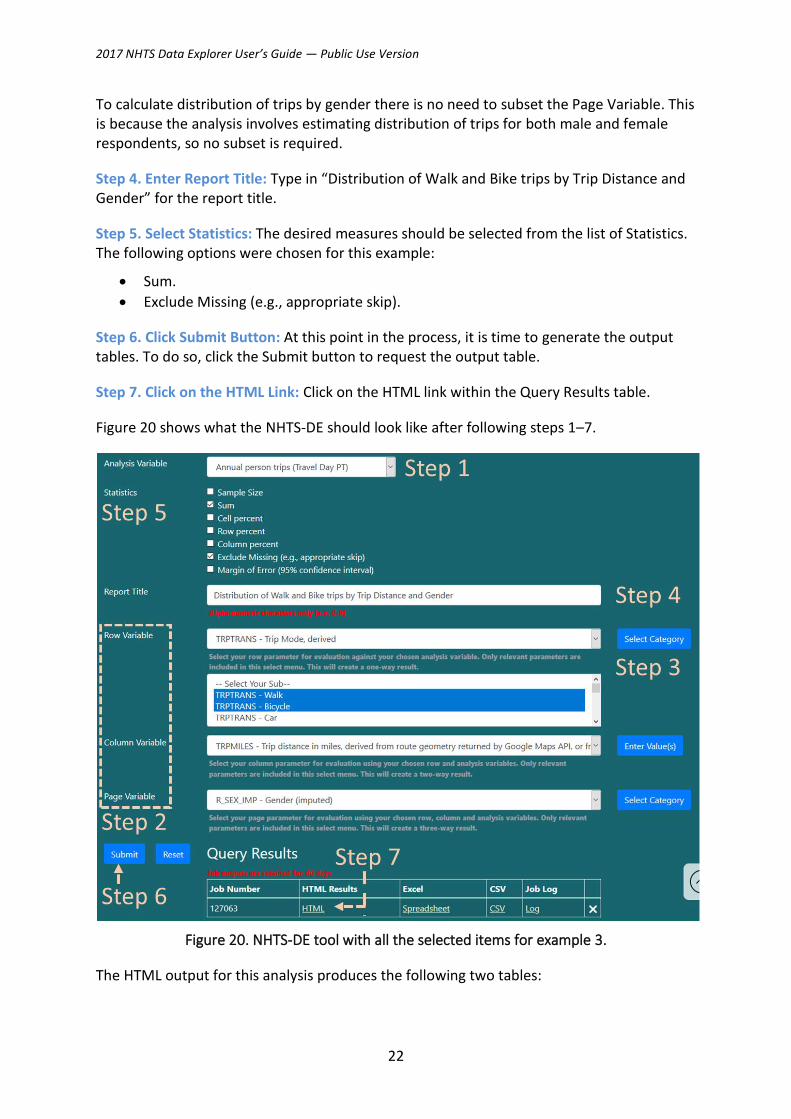
To calculate distribution of trips by gender there is no need to subset the Page Variable. This is because the analysis involves estimating distribution of trips for both male and female respondents, so no subset is required.
Step 4. Enter Report Title: Type in “Distribution of Walk and Bike trips by Trip Distance and Gender” for the report title.
Step 5. Select Statistics: The desired measures should be selected from the list of Statistics. The following options were chosen for this example:
• Sum.
• Exclude Missing (e.g., appropriate skip).
Step 6. Click Submit Button: At this point in the process, it is time to generate the output tables. To do so, click the Submit button to request the output table.
Step 7. Click on the HTML Link: Click on the HTML link within the Query Results table.
Figure 20 shows what the NHTS-DE should look like after following steps 1–7.
Figure 20. NHTS-DE tool with all the selected items for example 3.
The HTML output for this analysis produces the following two tables:
2017 NHTS Data Explorer User’s Guide — Public Use Version
23
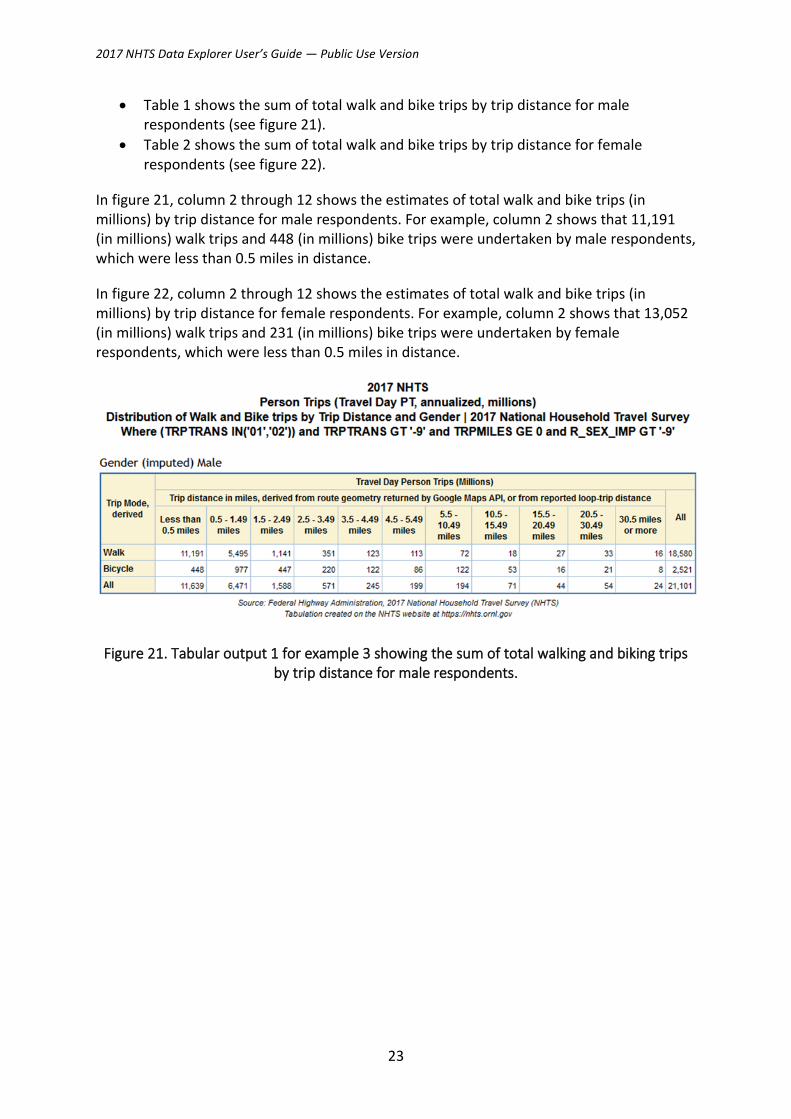
• Table 1 shows the sum of total walk and bike trips by trip distance for male respondents (see figure 21).
• Table 2 shows the sum of total walk and bike trips by trip distance for female respondents (see figure 22).
In figure 21, column 2 through 12 shows the estimates of total walk and bike trips (in millions) by trip distance for male respondents. For example, column 2 shows that 11,191 (in millions) walk trips and 448 (in millions) bike trips were undertaken by male respondents, which were less than 0.5 miles in distance.
In figure 22, column 2 through 12 shows the estimates of total walk and bike trips (in millions) by trip distance for female respondents. For example, column 2 shows that 13,052 (in millions) walk trips and 231 (in millions) bike trips were undertaken by female respondents, which were less than 0.5 miles in distance.
Figure 21. Tabular output 1 for example 3 showing the sum of total walking and biking trips by trip distance for male respondents.

2017 NHTS Data Explorer User’s Guide — Public Use Version
24
Figure 22. Tabular output 2 for example 3 showing the sum of total walking and biking trips by trip distance for female respondents.

2017 NHTS Data Explorer User’s Guide — Public Use Version
25
APPENDIX – USING THE ADJUSTED TRIP MILEAGE VARIABLE IN NHTS-DE TO COMPUTE MILEAGE BY CATEGORIZED TRIP DISTANCE
The NHTS Version 1.2 data release included the TRPMILAD variable, which can be used to adjust 2017 NHTS PMT and VMT metrics for trending with prior survey years. For more information about the variable’s construct, see NHTS Version 1.2 Release Notes.
This adjustment only affects driver and passenger trips made in personal vehicles (where TRPTRANS = 03, 04, 05, 06, 08, 09, and 18). For personal vehicle work trips (WHYTRP90=01), TRPMILAD is 1.0735 times TRPMILES. For all other personal vehicle trips, the adjustment factor is 1.1151.
With its inclusion in NHTS Version 1.2, the NHTS-DE now includes a new set of trip distance-based analysis variables that are calculated based on TRPMILAD as follows:
• Adjusted annual PMT (Travel Day PMT).
• Adjusted average person trip length (Travel Day PT).
• Adjusted annual VMT (Travel Day VMT).
• Adjusted average vehicle trip length (Travel Day VT).
The NHTS Version 1.2 still includes the original unadjusted person and trip VMT estimates, calculated based on TRPMILES as follows:
• Annual PMT (Travel Day PMT).
• Average person trip length (Travel Day PT).
• Annual VMT (Travel Day VMT).
• Average vehicle trip length (Travel Day VT).
This appendix details how to approach a special case where a data user wants to run a table using one of the above analysis variables where the Row, Column, or Page Variable is also the categorical trip distance.
The most important element when conducting such a distance-based analysis is to always pair the distance variable with the analysis variable. More specifically:
• If the analysis variable uses the TRPMILAD variable (i.e., any of the four adjusted miles of travel analysis variables), always use TRPMILAD as the Tabulation Variable.
• Similarly, if the analysis variable is based on TRPMILES, always use TRPMILES as the Tabulation Variable.
The following two examples illustrate when and how this recommendation is applied, and how to choose the adjusted and unadjusted trip distance results.
Example 1. Calculating Annual VMT by Trip Distance and Household Location
This analysis can be converted to a two-way cross-tabulation: (1) annual VMT by trip distance and (2) annual VMT by household location (urban versus rural) using the 2017 NHTS. As the Analysis Variable is annual VMT (a trip distance-based variable), the following two tables can be generated:

2017 NHTS Data Explorer User’s Guide — Public Use Version
26
• Table A: Adjusted annual VMT by adjusted trip distance by household location (urban/rural) or
• Table B: Unadjusted annual VMT by unadjusted trip distance by household location (urban/rural).
The choice for which table to use depends on how the results are used. For example:
• If data comparison to prior NHTS/NPTS is the goal, table A is recommended.
• If a simple citation of data from 2017 NHTS (the most recent NHTS) is needed, table B will serve the purpose.
The following steps detail how to generate each table.
Steps (Simplified) to Create Table A
Step 1. Select Analysis Variable: Adjusted annual VMT (Travel Day VMT)
Step 2. Select Tabulation Variables:
• Row Variable: TRPMILAD – Trip distance in miles, adjusted for comparability to past surveys.
• Column Variable: URBRUR – Household in urban/rural area.
Step 3. Select Data Subsets: No subsets needed.
Step 4. Enter Report Title: Enter “Annual VMT by Trip Distance by Household Location in Urban/Rural (Adjusted).”
Step 5. Select Statistics: The desired measures should be selected from the list of Statistics. The following options were chosen for this example:
• Sum.
• Exclude Missing (e.g., appropriate skip).
Step 6. Click Submit Button: At this point in the process, it is time to generate the output tables. To do so, click the “Submit” button to request the output table.
Step 7. Review the HTML Output Table: Click on the HTML link within the Query Results table.
Figure 23 shows what the NHTS-DE should look like after following steps 1–7.

2017 NHTS Data Explorer User’s Guide — Public Use Version
27
Figure 23. NHTS-DE tool with all the selected items for table A in example 1.
The HTML output for this query produces the sum table for adjusted annualized VMT by adjusted trip distance by household location in urban/rural areas (see figure 24).

2017 NHTS Data Explorer User’s Guide — Public Use Version
28
Figure 24. Output for table A in example 1: sum table for annual adjusted VMT by adjusted trip distance by household location in urban/rural area.
Steps (Simplified) to Create Table B
Step 1. Select Analysis Variable: Annual VMT (Travel Day VMT)
Step 2. Select Tabulation Variables:
• Row Variable: TRPMILES – Trip distance in miles, derived from route geometry returned by Google Maps API, or from reported loop-trip distance.
• Column Variable: URBRUR – Household in urban/rural area
Step 3. Select Data Subsets: No subsets needed.
Step 4. Enter Report Title: Enter “Annual VMT by Trip Distance by Household Location in Urban/Rural (Unadjusted).”
Step 5. Select Statistics: The desired measures should be selected from the list of Statistics. The following options were chosen for this example:
• Sum.
• Exclude Missing (e.g., appropriate skip).
Step 6. Click Submit Button: At this point in the process, it is time to generate the output tables. To do so, click the “Submit” button to request the output table.
Step 7. Review the HTML Output Table: Click on the HTML link within the Query Results table.

2017 NHTS Data Explorer User’s Guide — Public Use Version
29
Figure 25 shows what the NHTS-DE should look like after following steps 1–7.
Figure 25. NHTS-DE tool with all the selected items for table B in example 1.
The HTML output for this query produces the sum table for unadjusted annualized VMT by unadjusted trip distance by household location in urban/rural areas (see figure 26).

2017 NHTS Data Explorer User’s Guide — Public Use Version
30
Figure 26. Output for table B in example 1: sum table for annual unadjusted VMT by unadjusted trip distance by household location in urban/rural area.
Example 2. Calculating Distribution of Work Trips by Trip Distance
This is three-way cross-tab query can be translated as annual person trips (PTs) by trip distance and by trip purpose using the 2017 NHTS. In this case, the analysis variable is a trip count-based variable (not one of the eight trip distance-based Analysis Variables), which offers two options for sets of tables that can be generated:
• Table set A: Annual PTs by adjusted trip distance by trip purpose.
• Table set B: Annual PTs by unadjusted trip distance by trip purpose.
The following steps detail how to generate each table set.
Steps (Simplified) to Create Table set A
Step 1. Select Analysis Variable: Annual person trips (Travel Day PT)
Step 2. Select Tabulation Variables:
• Row Variable: TRPMILAD – Trip distance in miles, adjusted for comparability to past surveys.
• Column Variable: WHYTRP90 – Travel day trip purpose consistent with 1990 NPTS design
Step 3. Select Data Subsets:
• Subset Row Variable: Not needed.

2017 NHTS Data Explorer User’s Guide — Public Use Version
31
• Subset Column Variable:
i. Click the Select Category button next to the Column Variable (WHYTRP90). ii. Select WHYTRP90 – To/From Work from the drop-down menu.
Step 4. Enter Report Title: Enter “Distribution of Work Trips by Trip Distance (Adjusted).”
Step 5. Select Statistics: The desired measures should be selected from the list of Statistics. The following options were chosen for this example:
• Sum.
• Column Percent.
• Exclude Missing (e.g., appropriate skip).
Step 6. Click Submit Button: At this point in the process, it is time to generate the output tables. To do so, click the “Submit” button to request the output table.
Step 7. Review the HTML Output Table: Click on the HTML link within the Query Results table.
Figure 27Error! Reference source not found. shows what the NHTS-DE should look like after following steps 1–7.
2017 NHTS Data Explorer User’s Guide — Public Use Version
32
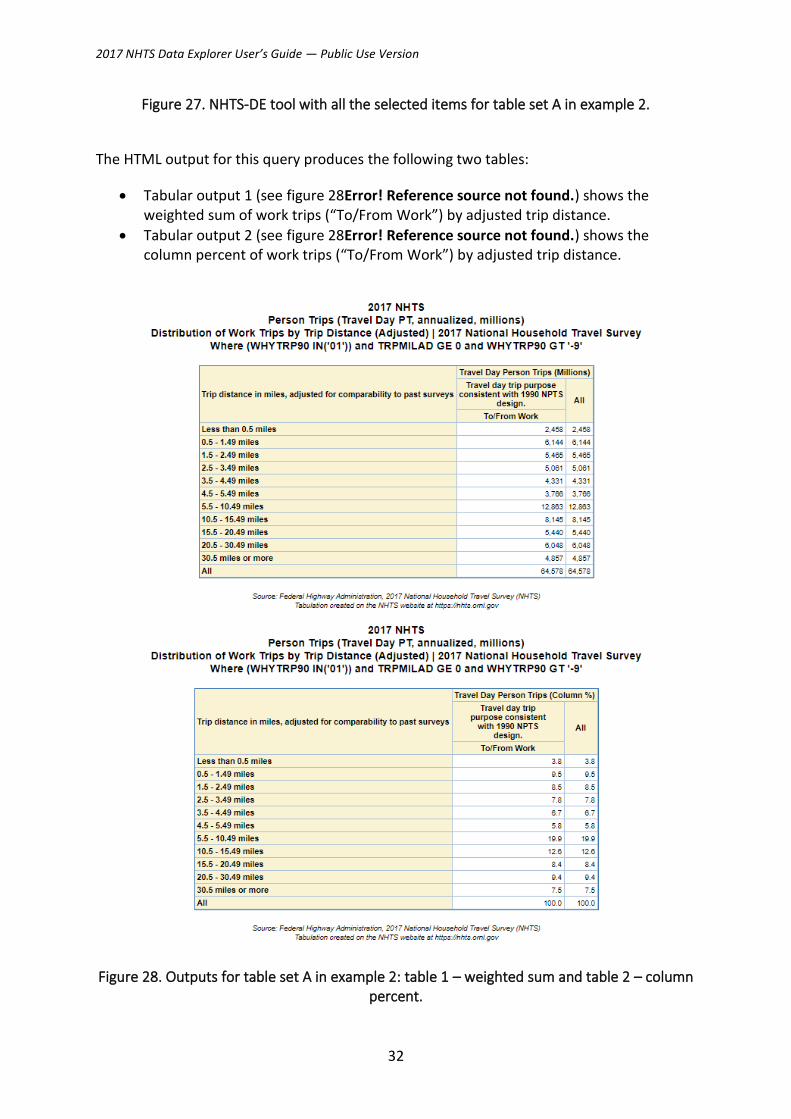
Figure 27. NHTS-DE tool with all the selected items for table set A in example 2.
The HTML output for this query produces the following two tables:
• Tabular output 1 (see figure 28Error! Reference source not found.) shows the weighted sum of work trips (“To/From Work”) by adjusted trip distance.
• Tabular output 2 (see figure 28Error! Reference source not found.) shows the column percent of work trips (“To/From Work”) by adjusted trip distance.
Figure 28. Outputs for table set A in example 2: table 1 – weighted sum and table 2 – column percent.

2017 NHTS Data Explorer User’s Guide — Public Use Version
33
Steps (Simplified) to Create Table Set B
Step 1. Select Analysis Variable: Annual person trips (Travel Day PT).
Step 2. Select Tabulation Variables:
• Row Variable: TRPMILES – Trip distance in miles, derived from route geometry returned by Google Maps API, or from reported loop-trip distance.
• Column Variable: WHYTRP90 – Travel day trip purpose consistent with 1990 NPTS design.
Step 3. Select Data Subsets:
• Subset Row Variable: Not needed.
• Subset Column Variable:
i. Click the Select Category button next to the Column Variable (WHYTRP90). ii. Select WHYTRP90 – To/From Work from the drop-down menu.
Step 4. Enter Report Title: Enter “Distribution of Work Trips by Trip Distance (Unadjusted).”
Step 5. Select Statistics: The desired measures should be selected from the list of Statistics. The following options were chosen for this example:
• Sum.
• Column Percent.
• Exclude Missing (e.g., appropriate skip).
Step 6. Click Submit Button: At this point in the process, it is time to generate the output tables. To do so, click the “Submit” button to request the output table.
Step 7. Review the HTML Output Table: Click on the HTML link within the Query Results table.
Figure 29 shows what the NHTS-DE should look like after following steps 1–7.

2017 NHTS Data Explorer User’s Guide — Public Use Version
34
Figure 29. NHTS-DE tool with all the selected items for table set B in example 2.
The HTML output for this query produces the following two tables:
• Tabular output 1 (see figure 30Error! Reference source not found.) shows the weighted sum of work trips (“To/From Work”) by unadjusted trip distance.
• Tabular output 2 (see figure 30Error! Reference source not found.) shows the column percent of work trips (“To/From Work”) by unadjusted trip distance.

2017 NHTS Data Explorer User’s Guide — Public Use Version
35
Figure 30. Outputs for table set B in example 2: table 1 – weighted sum and table 2 – column percent.