2009 national household travel survey user’s guide
TRANSCRIPT
7/29/2019 2009 NATIONAL HOUSEHOLD TRAVEL SURVEY USER’S GUIDE
http://slidepdf.com/reader/full/2009-national-household-travel-survey-users-guide 1/81
(Version 2)
Last Updated October 2011
U.S. Department of Transportation
Federal Highway Administration
2009 NATIONAL HOUSEHOLD TRAVEL SURVE
USER’S GUIDE
7/29/2019 2009 NATIONAL HOUSEHOLD TRAVEL SURVEY USER’S GUIDE
http://slidepdf.com/reader/full/2009-national-household-travel-survey-users-guide 2/81
2009 NHTS User's Guide i Federal Highway Administration
Table of Contents
Chapter Page
1 Introduction to the 2009 NHTS ...................................................................... 1-1
Analysis of the NHTS Data .............................................................................. 1-1Survey Sponsors – National and Add-on Partners ........................................ 1-2Purpose and Uses of the Survey ....................................................................... 1-4Survey Content and Coverage .......................................................................... 1-5Survey Coverage ................................................................................................. 1-8
2 Survey Procedures and Methodology .............................................................. 2-1
The Interview Process ....................................................................................... 2-1Sample Design and Selection ............................................................................ 2-6Interviewers ......................................................................................................... 2-7Survey Procedures .............................................................................................. 2-8Data Editing ........................................................................................................ 2-9
3 The NHTS Data Series: Changes over Time in the NPTS/NHTS ............ 3-1
2009 Survey Changes ......................................................................................... 3-1 The Entire NHTS/NPTS Series ...................................................................... 3-5
4 Survey Response Rates ...................................................................................... 4-1
Overview .............................................................................................................. 4-1Classification of All Telephone Numbers Used............................................. 4-2Household Screener Interview Response Rate .............................................. 4-3Useable Households ........................................................................................... 4-6Final Dispositions for Person-Level Interviews ............................................ 4-8Overall Survey Response Rates for Useable Households............................. 4-10
5 Weight Calculations ............................................................................................ 5-1
Initial Household Weight .................................................................................. 5-1
Useable Household Weight ............................................................................... 5-3Person and Travel Day Weights ....................................................................... 5-5Replicate Weights ............................................................................................... 5-6
7/29/2019 2009 NATIONAL HOUSEHOLD TRAVEL SURVEY USER’S GUIDE
http://slidepdf.com/reader/full/2009-national-household-travel-survey-users-guide 3/81
Contents (continued)
2009 NHTS User's Guide ii Federal Highway Administration
Chapter Page
6 Description of Data Files .................................................................................. 6-1
Structure of the Data Files ................................................................................ 6-1Relationship Between the Four NHTS Data Files ........................................ 6-3 When is a Record on the File ............................................................................ 6-3Household Member Variables .......................................................................... 6-4Codebook............................................................................................................. 6-5Repeated Variables ............................................................................................. 6-8Derived Variables ............................................................................................... 6-9 Trip Purpose Categories (WHYTO, WHTTRP90 & TRPPURP) .............. 6-9
7 Using the Data .................................................................................................... 7-1
Travel Concepts .................................................................................................. 7-1Person Trip ............................................................................................ 7-1Person Miles of Travel (PMT) ............................................................ 7-1 Vehicle Trips .......................................................................................... 7-2 Vehicle Miles of Travel (VMT) ........................................................... 7-2 Vehicle Occupancy ............................................................................... 7-2
Sample Tables and Logic, Online Analysis Engine and OtherResources on the NHTS Website ....................................................... 7-3
Control Numbers ............................................................................................... 7-3
Weighted Sums ................................................................................................... 7-4 Weighting the Data ............................................................................................. 7-4Replicate Weights and Sampling Errors .......................................................... 7-6Nonsampling Errors .......................................................................................... 7-7Finding the Variables You Want ...................................................................... 7-8Merging Data from Multiple Files .................................................................... 7-8
ID Variables Not Always Sequential .................................................. 7-10Merging Data Files ................................................................................ 7-10
Data File Conventions ....................................................................................... 7-11
7/29/2019 2009 NATIONAL HOUSEHOLD TRAVEL SURVEY USER’S GUIDE
http://slidepdf.com/reader/full/2009-national-household-travel-survey-users-guide 4/81
Contents (continued)
2009 NHTS User's Guide iii Federal Highway Administration
Tables Page
1-1 State level departments of transportation ....................................................... 1-3
1-2 Regional planning agencies/metropolitan planning organizations(MPOs) ................................................................................................................. 1-3
1-3 2009 NHTS summary of content ..................................................................... 1-7
2-1 Adult retrieval completion rates in useable households................................ 2-16
3-1 Changes in the 2009 NHTS survey methodology and content andthe anticipated effect .......................................................................................... 3-3
3-2 Changes over time in the NPTS/NHTS data series ..................................... 3-10
4-1 Classification of sampled telephone numbers ................................................ 4-2
4-2 Classification of telephone numbers in the sample by study area ............... 4-3
4-3 Weighted screener response rates by study area ............................................ 4-6
4-4 Recruited household completion rates ............................................................ 4-7
4-5 Weighted usability rates by study area ............................................................. 4-8
4-6 Person-level final dispositions for all household members 5 yearsold and older in useable households ................................................................ 4-9
4-7 Retrieval interview self and proxy rates in useable households by
adult and child ..................................................................................................... 4-9
4-8 Person-level final dispositions for all household members 5 yearsold and older in useable households by adult and child ............................... 4-10
4-9 Overall survey response rates by Add-on region ........................................... 4-11
6-1 Structure of 2009 NHTS version 2 data files ................................................. 6-2
6-2 Contents of the 2009 NHTS codebook .......................................................... 6-7
6-3 Variables used in all four NHTS data files ...................................................... 6-8
7-1 Sample sizes and weight sums in the four data files ...................................... 7-4
7-2 Sample sizes and weight sums for other travel indicators ............................ 7-4
7-3 Description of the different weights on the 2009 NHTS ............................. 7-6
7-4 Examples of link variables between the four 2009 NHTS datafiles ........................................................................................................................ 7-9
7/29/2019 2009 NATIONAL HOUSEHOLD TRAVEL SURVEY USER’S GUIDE
http://slidepdf.com/reader/full/2009-national-household-travel-survey-users-guide 5/81
2009 NHTS User's Guide vi Federal Highway Administration
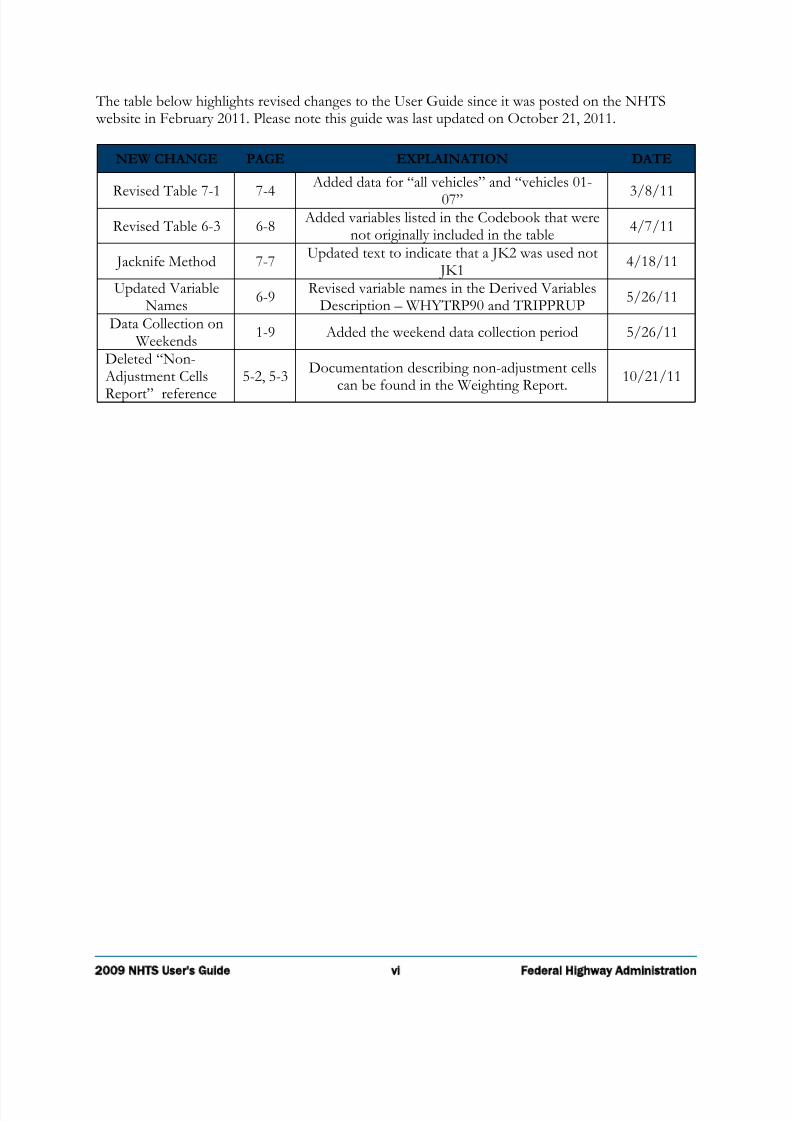
The table below highlights revised changes to the User Guide since it was posted on the NHTS website in February 2011. Please note this guide was last updated on October 21, 2011.
NEW CHANGE PAGE EXPLAINATION DATE
Revised Table 7-1 7-4
Added data for “all vehicles” and “vehicles 01-
07” 3/8/11
Revised Table 6-3 6-8 Added variables listed in the Codebook that were
not originally included in the table4/7/11
Jacknife Method 7-7Updated text to indicate that a JK2 was used not
JK14/18/11
Updated VariableNames
6-9Revised variable names in the Derived Variables
Description – WHYTRP90 and TRIPPRUP5/26/11
Data Collection on Weekends
1-9 Added the weekend data collection period 5/26/11
Deleted “Non- Adjustment Cells
Report” reference
5-2, 5-3Documentation describing non-adjustment cells
can be found in the Weighting Report.
10/21/11
7/29/2019 2009 NATIONAL HOUSEHOLD TRAVEL SURVEY USER’S GUIDE
http://slidepdf.com/reader/full/2009-national-household-travel-survey-users-guide 6/81
2009 NHTS User's Guide 1-1 Federal Highway Administration
The National Household Travel Survey (NHTS) provides information to assist transportation
planners and others who need comprehensive data on travel and transportation patterns in the
United States. This User’s Guide provides details of the 2009 NHTS, which updates information
gathered in the 2001 NHTS and prior Nationwide Personal Transportation Surveys (NPTS)
conducted in 1969, 1977, 1983, 1990, and 1995.
This guide includes descriptions of the survey procedures and methodology used for the 2009
NHTS, the NPTS/NHTS data series, the weighting procedures, response rates and file structure for
the 2009 NHTS data. Related survey documentation available on the NHTS website
http://nhts.ornl.gov provide a dictionary of all variables in the data files, data file codebooks,
control totals, glossary of NHTS terms and abbreviations, a copy of the 2009 NHTS questionnaire,
and additional background information.
The Federal Highway Administration would like to acknowledge Westat and Cambridge Systematics,
Inc. for their work on the 2009 National Household Travel Survey User’s Guide.
Analysis of the NHTS Data
The Federal Highway Administration (FHWA) supports the NHTS website:
http://nhts.ornl.gov
which is maintained by the Oak Ridge National Laboratory, Center for Transportation Analysis. The
website serves as a central facility to obtain information on the NHTS, status updates on the dataset
or publications, publications using NHTS data, and the disaggregate NHTS data which is available
for download and analysis by the user community. The Online Analysis Engine on the website
allows users to create customized tables from the NHTS data without having to download the
dataset and code the table specifications.
Introduction to the 2009 NHTS 1

7/29/2019 2009 NATIONAL HOUSEHOLD TRAVEL SURVEY USER’S GUIDE
http://slidepdf.com/reader/full/2009-national-household-travel-survey-users-guide 7/81
Introduction to the 2009 NHTS1
2009 NHTS User's Guide 1-2 Federal Highway Administration
The NHTS dataset contains data for all 150,147 completed households in the sample including
household, person, vehicle and daily (travel day) trip level data. In addition to the households
selected as part of the national survey this dataset includes the data collected from the twenty Add-
on program regions listed in Table 1-1.
Publicly available data files for the 2009 NHTS were created by FHWA and contain the following
general features:
It is a microdata dataset, which contains the record of each interview (with informationdeleted that would identify the specific person or household);
The data are arranged in four hierarchical files to facilitate analysis; and
The data are available for download as Statistical Analysis System (SAS) WindowsBinary, SAS Transport, Dbase or ASCII; and
In addition to the NHTS website, there is also a Community of Practice site where datausers can interact with each other, ask questions, and share findings. This is located at:
http://knowledge.fhwa.dot.gov/cops/hcx.nsf/home?openform&Group=National%20Household%20Travel%20Survey
Survey Sponsors – National and Add-on Partners
The 2009 NHTS was conducted under the sponsorship of the FHWA. The Federal Transit
Administration, AAA, and the Public Policy Institute of AARP also contributed funding to the
national sample of the 2009 NHTS, which included 26,000 households.
Most of the 2009 NHTS interviews were sponsored by the 20 Add-on partners who are state and
metropolitan transportation planning organizations that fund additional samples to use as a
household travel survey for their respective jurisdictions. The Add-on partners for the 2009 NHTS
are presented in Tables 1-1 and 1-2 below. Note that the number of households actually completed
is typically slightly higher than the target amount.
7/29/2019 2009 NATIONAL HOUSEHOLD TRAVEL SURVEY USER’S GUIDE
http://slidepdf.com/reader/full/2009-national-household-travel-survey-users-guide 8/81
Introduction to the 2009 NHTS1
2009 NHTS User's Guide 1-3 Federal Highway Administration
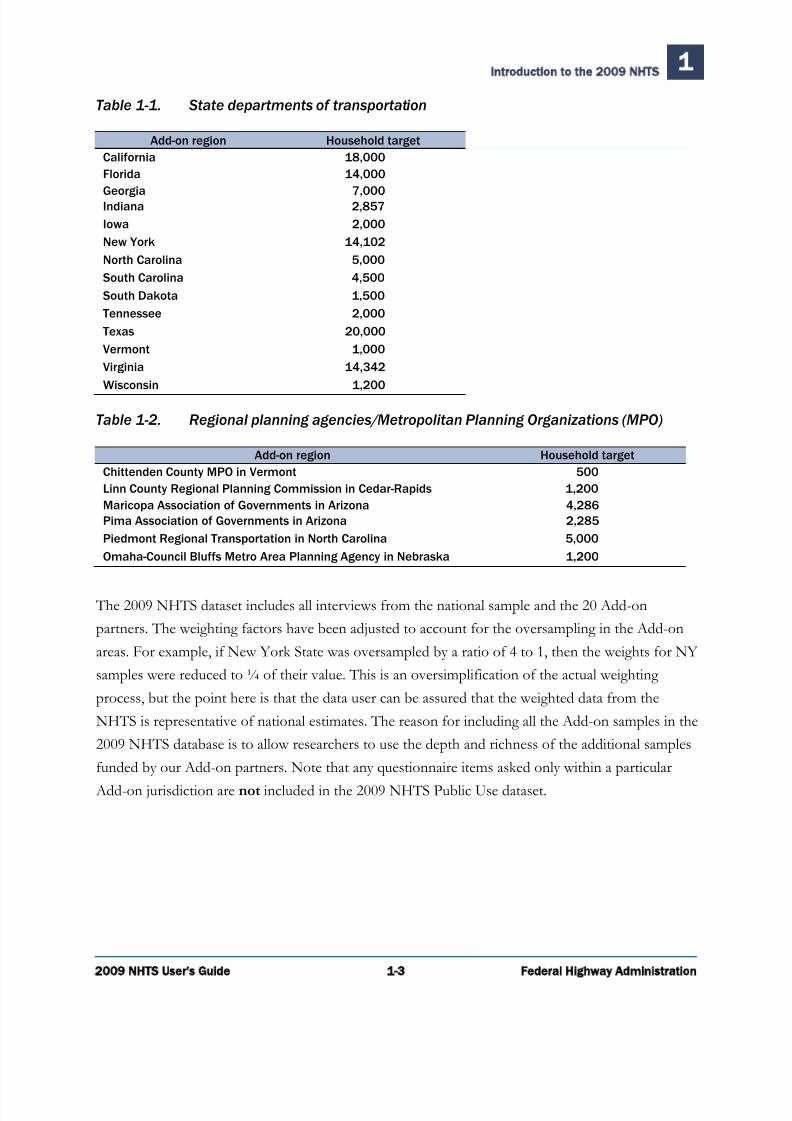
Table 1-1. State departments of transportation
Add-on region Household target
California 18,000
Florida 14,000
Georgia 7,000Indiana 2,857
Iowa 2,000
New York 14,102
North Carolina 5,000
South Carolina 4,500
South Dakota 1,500
Tennessee 2,000
Texas 20,000
Vermont 1,000
Virginia 14,342
Wisconsin 1,200
Table 1-2. Regional planning agencies/Metropolitan Planning Organizations (MPO)
Add-on region Household target
Chittenden County MPO in Vermont 500
Linn County Regional Planning Commission in Cedar-Rapids 1,200
Maricopa Association of Governments in Arizona 4,286
Pima Association of Governments in Arizona 2,285
Piedmont Regional Transportation in North Carolina 5,000
Omaha-Council Bluffs Metro Area Planning Agency in Nebraska 1,200
The 2009 NHTS dataset includes all interviews from the national sample and the 20 Add-on
partners. The weighting factors have been adjusted to account for the oversampling in the Add-on
areas. For example, if New York State was oversampled by a ratio of 4 to 1, then the weights for NY
samples were reduced to ¼ of their value. This is an oversimplification of the actual weighting
process, but the point here is that the data user can be assured that the weighted data from the
NHTS is representative of national estimates. The reason for including all the Add-on samples in the
2009 NHTS database is to allow researchers to use the depth and richness of the additional samples
funded by our Add-on partners. Note that any questionnaire items asked only within a particular
Add-on jurisdiction are not included in the 2009 NHTS Public Use dataset.
7/29/2019 2009 NATIONAL HOUSEHOLD TRAVEL SURVEY USER’S GUIDE
http://slidepdf.com/reader/full/2009-national-household-travel-survey-users-guide 9/81
Introduction to the 2009 NHTS1
2009 NHTS User's Guide 1-4 Federal Highway Administration
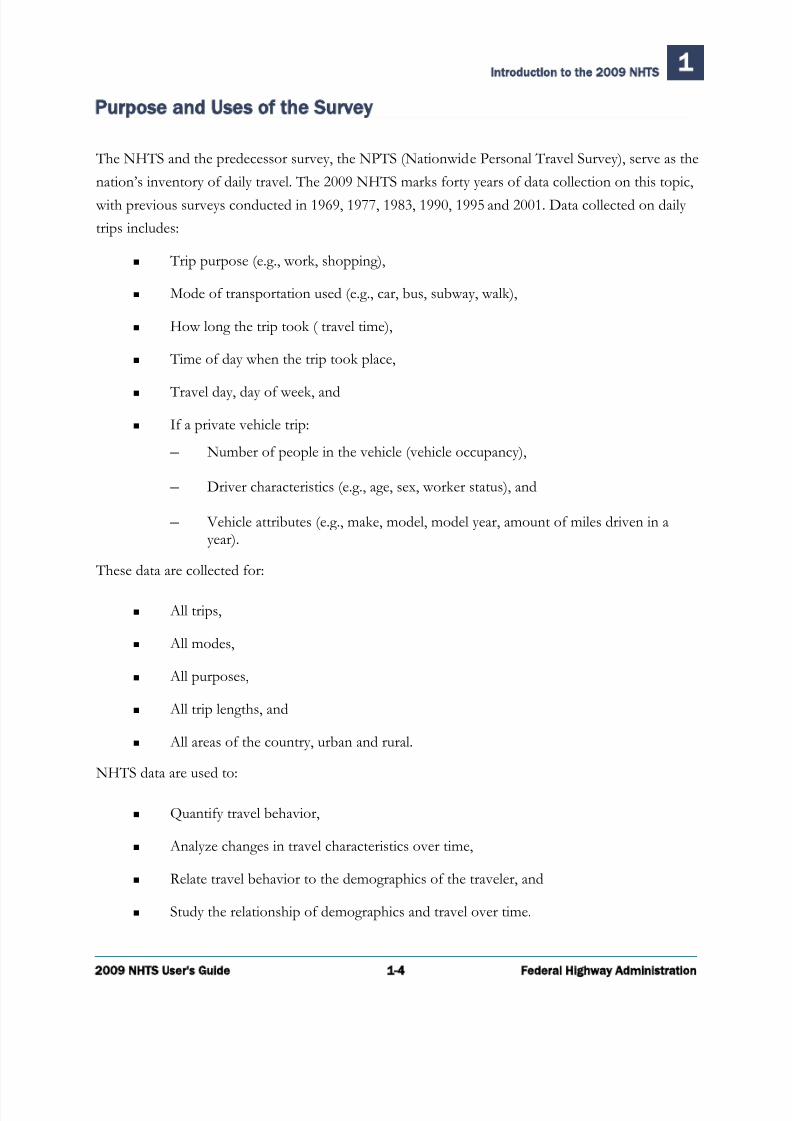
Purpose and Uses of the Survey
The NHTS and the predecessor survey, the NPTS (Nationwide Personal Travel Survey), serve as the
nation’s inventory of daily travel. The 2009 NHTS marks forty years of data collection on this topic,
with previous surveys conducted in 1969, 1977, 1983, 1990, 1995 and 2001. Data collected on daily
trips includes:
Trip purpose (e.g., work, shopping),
Mode of transportation used (e.g., car, bus, subway, walk),
How long the trip took ( travel time),
Time of day when the trip took place,
Travel day, day of week, and
If a private vehicle trip:
– Number of people in the vehicle (vehicle occupancy),
– Driver characteristics (e.g., age, sex, worker status), and
– Vehicle attributes (e.g., make, model, model year, amount of miles driven in ayear).
These data are collected for:
All trips,
All modes,
All purposes,
All trip lengths, and
All areas of the country, urban and rural.
NHTS data are used to:
Quantify travel behavior,
Analyze changes in travel characteristics over time,
Relate travel behavior to the demographics of the traveler, and
Study the relationship of demographics and travel over time.

7/29/2019 2009 NATIONAL HOUSEHOLD TRAVEL SURVEY USER’S GUIDE
http://slidepdf.com/reader/full/2009-national-household-travel-survey-users-guide 10/81
Introduction to the 2009 NHTS1
2009 NHTS User's Guide 1-5 Federal Highway Administration
The NHTS data are used primarily for gaining a better understanding of travel behavior. The data
enable national, state and regional transportation planners and the transportation research
community to assess program initiatives, review programs and policies, study current mobility issues,
and plan for the future. The NHTS is a tool in the urban transportation planning process; it
provides national data on personal travel behavior, trends in travel over time, and trip generation
rates. It is used as a benchmark in reviewing local data, and data for various other planning and
modeling applications.
The transportation research community, including academics, consultants and government, use the
NHTS extensively to examine:
Travel behavior at the individual and household level,
The characteristics of travel, such as trip chaining, use of the various modes, amountand purpose of travel by time of day and day of week, vehicle occupancy, and a host of other attributes,
The relationship between demographics and travel, and
The public’s perceptions of the transportation system.
People in fields outside of transportation use the NHTS data to connect the role of transportation
with other aspects of our lives. Medical researchers use the data to determine crash exposure rates of
drivers and passengers, including the elderly, who have heightened morbidity and mortality rates.
There is great interest in the NHTS data on the extent of walking for purposes of studying obesity
patterns. Safety specialists study the accident risk of school-age children, particularly when they are
traveling on their own by walking or biking. Social service agencies need to know more about how
low-income households currently meet their travel needs.
Survey Content and Coverage
To serve these disparate uses, the 2009 NHTS dataset includes, but is not limited to:
Household data on the relationship of household members, education level, income,housing characteristics, and other demographic information,
Information on each household vehicle, including year, make, model, and estimates of annual miles traveled,
7/29/2019 2009 NATIONAL HOUSEHOLD TRAVEL SURVEY USER’S GUIDE
http://slidepdf.com/reader/full/2009-national-household-travel-survey-users-guide 11/81
Introduction to the 2009 NHTS1
2009 NHTS User's Guide 1-6 Federal Highway Administration
Data about drivers, including information on travel as part of work,
Data about one-way trips taken during a designated 24-hour period (the household'stravel day) including the time the trip began and ended, length of the trip, compositionof the travel party, mode of transportation, purpose of the trip, and the specific vehicle
used (if a household vehicle),
Information to describe characteristics of the geographic area in which the samplehousehold and workplace of sample persons are located,
Data on telecommuting,
Public perceptions of the transportation system,
Data on Internet usage, and
The typical number of transit, walk and bike trips made over a period longer than the
24-hour travel day.
In the past there have been many requests for data that are closely related to, but are not available in
the survey. Examples of the most common requests for data that are not included in NHTS are:
Specific information on the costs of travel,
Information about specific travel routes or types of roads used,
How travel of the sampled household changes over time. [Note: The NHTS is a cross-sectional survey, which means that different households are selected for the sample each
time it is conducted. The NHTS is not currently a longitudinal survey, which wouldinvolve tracking the same sample households over time.]
Information that would identify the exact household or workplace location. Thisinformation is collected but not published to protect the confidentiality of respondents,and
The traveler's reason for selecting a specific mode of travel over another mode.
In the NHTS content list provided in Table 1-3, the data items i tal ic ized below are considered
“core” NHTS data, largely composed of the items that have been collected in all six surveys to date.
Data items added in the 2001 survey are indicated by an * and those added in 2009 are indicated by a
**.

7/29/2019 2009 NATIONAL HOUSEHOLD TRAVEL SURVEY USER’S GUIDE
http://slidepdf.com/reader/full/2009-national-household-travel-survey-users-guide 12/81
Introduction to the 2009 NHTS1
2009 NHTS User's Guide 1-7 Federal Highway Administration
Table 1-3. 2009 NHTS summary of content
2009 NHTS summary of content
For Each Household: For Each Vehicle:
Number of people, drivers, workers and vehicles Make/Model/Age (year) Income Annual miles driven Housing Type Commercially licensed**
Owned or rented How long owned*
Number of cell phones* Odometer reading
Number of other phones Alternative Fuel**
Race of reference person Primary Driver
Hispanic status of reference person Tract and Block Group characteristics Daily Travel Data:
Internet Use & Delivery to households** Origin and Destination address (for Add-ons)
Time trip started and ended For Each Person: Distance Age/Sex/Relation to reference person Means of transportation: Driver status vehicle type Worker status/Primary activity if household vehicle, which one Internet use* if transit, wait time
Home deliveries from Internet shopping** if transit, access and egress mode*
Travel Disability* Interstate Use**
Effect of disability on mobility* Tolls Paid**
Education level Trip Purpose
Immigrant status* Detailed purpose*
Views on transportation Travel Party Size
Annual miles driven Last time of travel*
Incidence of public transit use in past month
Incidence of motorcycle use in last month
Incidence of walk and bike trips in past week
School travel (children)**
For Each Worker:
Full or part-time More than one job
Occupation (four categories)*
Workplace location Usual mode to work Drive alone or Carpool Usual distance to work Usual time to work**
Work from home
Usual arrival time at work
Flexibility in work arrival time**
* added in 2001
** added in 2009
7/29/2019 2009 NATIONAL HOUSEHOLD TRAVEL SURVEY USER’S GUIDE
http://slidepdf.com/reader/full/2009-national-household-travel-survey-users-guide 13/81
Introduction to the 2009 NHTS1
2009 NHTS User's Guide 1-8 Federal Highway Administration
In addition to the data collected in the NHTS interviews, other data are appended to the NHTS file
after the interview. Certain variables are derived from data in the interview and information from the
sample frame. These include items such as Great Circle Distance to Work (GCDWORK),
Household Size (HHSIZE) and Life Cycle (LIF_CYC). See the document entitled Derived NHTS
Variables.
Data from the demographic firm, Nielsen Claritas, are also appended to the file. These data serve to
better describe the characteristics of the Census Tract or Block Group where each respondent lives.
Inclusion of the Nielsen Claritas data allows for additional analyses of the dataset that could not
otherwise be accomplished without breaching respondent confidentiality. See the Census Tract and
Block Group Variables Description.
Survey Coverage Who is included in sample - The NHTS is a survey of the civilian, non-institutionalized
population of the United States. As such, an eligible household excludes telephones in motels,
hotels, group quarters, such as nursing homes, prisons, barracks, convents or monasteries and any
living quarters with 10 or more unrelated roommates.
When Conducted – The 2009 NHTS was conducted over a period from March 2008 through May
2009. Travel days were assigned for all seven days of the week, including all holidays. The survey
data were weighted to a 12-month period to produce annual estimates of travel.
Which Daily Trips are Included - All trips reported by eligible household members in eligible
households in the U.S. were recorded. The designated 24-hour travel day starts at 4:00 AM of the
day assigned and continues until 3:59 AM of the following day. On a typical day, 4 AM represents
the time when the fewest number of people are traveling, thus allowing collection of more coherent
data on trips. On weekends the travel day begins on Friday at 6PM and ends on Sunday at midnight.

7/29/2019 2009 NATIONAL HOUSEHOLD TRAVEL SURVEY USER’S GUIDE
http://slidepdf.com/reader/full/2009-national-household-travel-survey-users-guide 14/81
2009 NHTS User's Guide 2-1 Federal Highway Administration
The Interview Process
Households Eligible for the NHTS – The NHTS collected travel data from the civilian, non-
institutionalized population of the United States. People living in medical institutions, prisons, and in
barracks on military bases were excluded from the sample. However, telephone numbers in
dormitory rooms, fraternity and sorority houses were included so long as no more than 10 people
shared the same telephone number.
The focus of this User’s Guide is the 150,147 households in the landline sample. (Note that an
additional small sample of 1,254 cell phone only households was conducted as a test of methods and
responses, but data from this group was not intended to be incorporated into the final NHTS
dataset. Unless otherwise indicated in the User’s Guide, all references to the NHTS sample refer to
the landline sample.)
The first public release of data for these households was made in January 2010. In the summer of
2010 the weights were enhanced and Version 2 of the NHTS dataset was released in the fall of 2010.
All telephone numbers in households in the sample that were found to be residential were eligible
for the household interview. The household recruitment interview had to be completed by a
household member who was at least 18 years old.
Interviewers could conduct retrieval interviews with household members who were 16 years and
older. Proxy interviews were requested for all younger household members. However, if asked by an
adult household member, an interviewer could directly interview a household member who was 14
or 15 years old.
The Data Collection Process – The NHTS was conducted as a telephone survey, using Computer-
Assisted Telephone Interviewing (CATI) technology. The sample was a list-assisted random digit
dialing (RDD) telephone number sample.
Survey Procedures and Methodology 2

7/29/2019 2009 NATIONAL HOUSEHOLD TRAVEL SURVEY USER’S GUIDE
http://slidepdf.com/reader/full/2009-national-household-travel-survey-users-guide 15/81
Survey Procedures and Methodology2
2009 NHTS User's Guide 2-2 Federal Highway Administration
At the sampling stage, each telephone number in the sample was randomly assigned a day of the
week. During the household recruitment interview, each household was assigned a specific date as
their “Travel Day” for which detailed data on travel were collected.
Advance Letter and Cash Incentive – Some households (those that could be associated with an
address through their sampled telephone number) were first contacted by an advance letter,
followed about a week later by a telephone call. The mailing of these advance letters was timed so
that the household received the letter shortly before the first telephone call to the household was
made. This was accomplished by releasing the sample to the interviewers in small groups and
mailing to each release group approximately 10 days in advance of the anticipated first call.
The advance letter mailing included the letter from the NHTS Program Manager, a five-dollar cash
incentive, and a brochure introducing the survey. The NHTS Field Documents contains a copy of the advance letter and the brochure. The primary purpose of the mailing was to improve
cooperation rates by informing prospective respondents that this was a legitimate survey, not a
marketing or fundraising call.
Westat, the social science research firm that conducted the survey for FHWA, mailed advance letters
to over 400,000 households. Approximately 7 percent of these letters were returned as "undelivered"
by the post office.
Travel Day Assignment – During the administration of the household recruitment interview, the
CATI program automatically assigned a travel date to each household. The interviewer revealed the
travel date to the household respondent during the interview.
Travel characteristics are known to vary by season of the year and day-of-the week. There is some
variation in the number of completed interviews by month. To control for this, part of the weighting
process adjusted the estimates of total persons and total households to be equal for each calendar
month.
The variation in travel by day of the week was balanced by assigning the travel days for one-seventh
of the sample telephone numbers to each day of the week. When the calls to a sample phone
number resulted in a completed household recruitment interview, the CATI system determined the
household’s travel date on the selected day of the week 10 to 14 days in the future, which allowed
time for diary mailings to reach the household.

7/29/2019 2009 NATIONAL HOUSEHOLD TRAVEL SURVEY USER’S GUIDE
http://slidepdf.com/reader/full/2009-national-household-travel-survey-users-guide 16/81
Survey Procedures and Methodology2
2009 NHTS User's Guide 2-3 Federal Highway Administration
Travel Diary Mailing – The use of travel diaries on household travel surveys has been shown to
improve the accuracy of trip reporting. Therefore, all household members in households who
completed a household recruitment interview were sent diaries for their travel day. Of the over
300,000 household members who completed person interviews, 72 percent reported having filled
out the travel diary. The diary package was mailed within a day or two following the completion of
the household recruitment interview. It was sent via United States Postal Service Priority Mail and
contained:
A letter from the U.S. DOT thanking the household for completing the householdinterview and agreeing to participate in the survey;
A brochure describing the survey;
A travel day diary and a two-dollar cash incentive in individual envelopes personalizedfor each household member at least five years old. The reverse side of each diary provided guidance on completing the diary and included an example of a completeddiary;
An eye-catching brightly colored reminder card identifying the household’s travel date;and
An odometer mileage form identifying the make, model and year of each household vehicle, with spaces to enter the odometer readings and the dates they were taken.
Reminder Call – Each household received a reminder call on the day before their assigned travelday. The call was designed to find out if the household had received its diary package, answer
questions, and remind household members to record their travel in the diary the following day.
Interviewers attempted to speak with the household respondent but spoke with any household
member 16 and older if the household respondent was not available. If the interviewer reached an
answering machine, the reminder to collect travel information was left on the answering machine.
Households were asked to call the study's toll-free number if there were any questions.
Call-Back Period – There was a seven-day period during which interviewers were permitted by the
CATI system to call each household to collect their travel detail. This limit was established by
FHWA because of memory problems beyond seven days. Phone calls to collect the diary
information from the household usually began the day after the travel day, and continued for the
next six additional days. Though no outgoing calls were made after the close of the seven-day
period, respondents could call into the toll-free number to provide their information. Such
information was recorded after the seven-day window provided the subject had completed a diary.

7/29/2019 2009 NATIONAL HOUSEHOLD TRAVEL SURVEY USER’S GUIDE
http://slidepdf.com/reader/full/2009-national-household-travel-survey-users-guide 17/81
Survey Procedures and Methodology2
2009 NHTS User's Guide 2-4 Federal Highway Administration
Proxy Interview Procedures – A proxy interview is one in which someone else in the household
reports for the subject. In the NHTS data collection, an adult household member always served as
the proxy for a child under age 14. The 2009 NHTS did not complete retrieval interviews for any
child under the age of five. Proxies were also requested for persons age 14 and 15 years. However, if
an adult household member requested that the interviewer speak directly with these teenagers, the
interview was conducted with the subject. Proxies were not initially requested for household
members 16 years and older.
An issue with proxy interviews is under what circumstances to allow proxies for adult household
members, defined here as 16 and older. In the 2009 NHTS, proxies were allowed for these subjects
if:
The subject was not capable of being interviewed because of an impairment or alanguage barrier;
The interviewer was told that this subject would not be available for the entire seven-day recall period;
The interviewer was told that this subject would never participate, and the proxy wasknowledgeable about the subject's travel on the assigned travel day; or
The interviewers attempted to reach the subject for the first three days of the seven-day call-back period, and were not successful.
If the respondent filled out a travel diary for travel day, the proxy household member was asked to
find the diary and use it when they served as a proxy for the respondent. Note that the conditions
under which each interview was completed are a part of the data files. There are variables for:
Whether the interview was with the subject or a proxy respondent (PROXY on thePerson and Travel Day Files); and
If a travel diary was completed by the subject or another household member(DIARYCMP on the Person File).
Reducing Respondent Burden – During the person interview, special NHTS trip rostering
procedures were applied to reduce respondent burden for household members who traveled
together during the travel day. Burden was reduced at two main points during the interview - during
trip rostering and during the collection of trip detail on each trip that was rostered.
7/29/2019 2009 NATIONAL HOUSEHOLD TRAVEL SURVEY USER’S GUIDE
http://slidepdf.com/reader/full/2009-national-household-travel-survey-users-guide 18/81
Survey Procedures and Methodology2
2009 NHTS User's Guide 2-5 Federal Highway Administration
During trip rostering, each household member was asked to list all trips taken prior to asking about
the detail on each individual trip. If the household member currently being interviewed reported that
another household member went on a trip with him/her, then this trip was automatically also
recorded on the roster for the other household member, provided that household member had not
yet been interviewed. When the interviewer talked with this other household member, (s)he merely
had to confirm that the household member went on the trip. The household member had to agree
with the trip destination and start and end times for the trips to be considered identical. If the
currently-interviewed household member agreed that the trips were the same, the trip was retained
on the roster, otherwise, it was deleted. If the currently-interviewed household member agreed that
the previous household member was correct and the trip was retained on the roster, then this
current household member, if not the driver on the trip, was not required to provide any detail on
the trip. Trip detail was copied from the previous household member. The drivers on a particular
travel day trip were always required to report the trip details.
The Data Collection Period – The 2009 NHTS interviews were conducted from March 17, 2008
through May 7, 2009. The first assigned Travel Day was March 28, 2008 and the last assigned travel
date was April 30, 2009.
The survey must be conducted over at least a 12-month period so that seasonal variations in travel
are represented. As in 1995 and 2001, the 2009 NHTS took 14 months, rather than 12 to complete.
This was because interviewers were trained in waves and it took a few months to train all the
interviewers needed for the study. The survey weights adjust for the monthly differences in number
of interviews completed.
Travel day dates were assigned to all seven days of the week, including holidays. The intent was to
represent travel across an entire year.
Interviews were conducted with households in all 50 States and the District of Columbia. The
sample of telephone numbers was refreshed periodically throughout the study field period to ensure
that new exchanges and telephone numbers were included and all geographic areas were completely represented in all seasons.
7/29/2019 2009 NATIONAL HOUSEHOLD TRAVEL SURVEY USER’S GUIDE
http://slidepdf.com/reader/full/2009-national-household-travel-survey-users-guide 19/81
Survey Procedures and Methodology2
2009 NHTS User's Guide 2-6 Federal Highway Administration
Sample Design and Selection
This survey was designed as a list-assisted random digit dialing survey, to yield an equal probability
sample of households with landline telephones. The national sample was increased in 20 Add-on
areas: Phoenix AZ, Tucson AZ, California, Florida, Georgia, Iowa, Cedar Rapids IA, Indiana, North
Carolina, Piedmont Region NC, Omaha NE, New York, South Carolina, South Dakota, Tennessee,
Texas, Virginia, Vermont, Chittenden County VT, and Wisconsin. The target sample size was 25,000
completed households for the national sample. Targets for the Add-on areas are found in Chapter 1.
Sampling Frame – The sampling frame consisted of all telephone numbers in 100-banks of
numbers in which there was at least one listed residential number. A 100-bank is a set of 100
telephone numbers with the same first eight digits, that is, the same area code, exchange, and the
next two digits. New sampling frames were constructed about every quarter and a sample wasselected for use until a new sample was drawn. Sampling frames were constructed as of December
2007, March 2008, June 2008, September 2008 and December 2008.
Sample Selection – Telephone numbers were sorted according to several variables and a systematic
sample was then selected from the sorted list. For the national landline sample, all telephone
numbers in the frame of 100-banks had an equal probability of selection.
The sort of telephone numbers was first by the ten Census Divisions and second by metropolitan
areas/non-metropolitan areas. For metropolitan areas, the initial sort was by population of the
metropolitan statistical area (MSA) and primary metropolitan statistical area (PMSA) (largest to
smallest). Within an MSA/PMSA, telephone exchanges were ordered by those serving the county
(or counties) containing the central city, followed by those serving the remaining non-central city
county (or counties). Within each county, exchanges were ordered numerically – lowest to highest.
For non-metro areas, the initial sort was by state within a Census Division, with a serpentine
ordering 1 from north to south and from east to west. Within state, non-metro counties were
similarly ordered in a serpentine fashion, north to south and east to west. Finally, within county,exchanges were ordered numerically from lowest to highest.
1 Serpentine Ordering: The listing begins in the most Northeast state in a given Census Division, followed by the state just south and still at the
eastern edge of the Division. After the far Southeast state in the division, the listing proceeds to the state just west of the most Southeast state. The
sort continues with the next state to the north. The listing continues in this fashion until all states in the Division have been included.

7/29/2019 2009 NATIONAL HOUSEHOLD TRAVEL SURVEY USER’S GUIDE
http://slidepdf.com/reader/full/2009-national-household-travel-survey-users-guide 20/81
Survey Procedures and Methodology2
2009 NHTS User's Guide 2-7 Federal Highway Administration
For each of the Add-on areas the samples were selected from carefully defined telephone exchange
frames that covered the Add-on areas, selecting an equal probability sample from the working banks
(1+ banks) within those exchanges. The sampling procedure was systematic, with ordering by
working bank and exchange, and then an ordering across exchanges which varied across Add-on
areas.
Interviewers Data collection for the national landline sample of the 2009 NHTS, as well as the 20 Add-on
samples, was conducted utilizing staff at Westat’s Telephone Research Centers (TRCs) and their vast
team of at home interviewers (AHI) located across the nation. The centers used were located in
Frederick, MD, Sarasota, FL, Sacramento and Merced, CA, and Rockville, MD. Westat is a socialscience research firm headquartered in Rockville, Maryland.
Interviewer Training – A staff of 880 Westat interviewers and 62 supervisors were trained on the
2009 NHTS. These interviewers were trained during numerous training sessions conducted
periodically over the 14-month data collection period. The peak number of interviewers working on
the study in any week was 569. Of the 880 interviewers, 102 interviewed respondents in both
English and Spanish.
All interviewers assigned to the survey participated in training sessions and completed at least 24
hours of formal project-specific training. For interviewers with no prior interviewing experience,
these hours were in addition to four hours spent in training on general interviewing skills and
another four hours of training on the use of CATI. Additionally, at home interviewers received two
more hours of training on Westat Remote Access (WRA). This training is designed to instruct them
how to log into the Westat systems. These hours of non-project specific training occurred prior to
the interviewer's assignment to the NHTS project. For the NHTS project, 60 percent of the 880
interviewers were experienced and did not have to go through the non-specific project training.
Interviewers whom the TRC supervisory staff felt were not ready for "live" interviewing at theconclusion of the formal "classroom" training received additional training time.
Interviewer Monitoring – Interviewer monitoring is an important aspect of survey quality control.
Staff from FHWA monitored the data collection interviews weekly for the first several months and
then monthly through the end of data collection. Everyone who had the experience of monitoring
7/29/2019 2009 NATIONAL HOUSEHOLD TRAVEL SURVEY USER’S GUIDE
http://slidepdf.com/reader/full/2009-national-household-travel-survey-users-guide 21/81
Survey Procedures and Methodology2
2009 NHTS User's Guide 2-8 Federal Highway Administration
the interviews gained a better understanding of the survey data. Using telephones and personal
computer displays linked to the interviewer's connection to the CATI program, supervisors silently
monitored about 10 percent of each interviewer's work over the course of the study.
Survey Procedures Callback Procedures – Effective calling patterns are essential to achieving a high response rate on
all telephone surveys. Westat made at least seven attempts to establish contact to recruit a
household. Call attempts to complete each subsequent person-level retrieval interview began the
first day after the assigned travel day and continued throughout the next seven-days. A computer
algorithm scheduled these calls over different days and times and included day, evening and
weekend calls.
Refusal Conversion – Refusal conversion was an important aspect of Westat's overall response
maximization effort for the NHTS. An integral component of this effort was the utilization of a
select team of refusal conversion specialists. The team was comprised of Telephone Research Center
interviewer staff members who had demonstrated exceptional skills in achieving high cooperation
rates. Once interviewers were familiar with the questionnaires, and common reasons for refusals
were identified, Westat supervisors held special training sessions on refusal conversion techniques
for the refusal conversion interviewers.
Whenever a respondent initially refused to complete an interview, the interviewer completed a
separate CATI data collection module to record any information known about the household and
the respondent's reason(s) for refusing to participate. Non-hostile refusals were returned to
interviewers specially trained in refusal conversion for additional calls to the household.
Bilingual Interviewing – Interviewing on the NHTS was conducted in both English and Spanish.
Interviewing in Spanish was an important factor in gaining the cooperation of Hispanic respondents
and completing interviews with them. Bilingual interviewers completed the full survey interviewertraining in English, and conducted interviews in English until they were thoroughly familiar with the
questionnaires and CATI system. They also attended additional training on the Spanish CATI
instruments. The entire CATI questionnaire was translated into Spanish. Spanish-speaking
supervisors monitored the bilingual interviewers.

7/29/2019 2009 NATIONAL HOUSEHOLD TRAVEL SURVEY USER’S GUIDE
http://slidepdf.com/reader/full/2009-national-household-travel-survey-users-guide 22/81
Survey Procedures and Methodology2
2009 NHTS User's Guide 2-9 Federal Highway Administration
All cases assigned an initial result code of "language problem" by an English-only-speaking
interviewer were available only to bilingual interviewers. If the bilingual interviewer determined that
the respondent spoke neither English nor Spanish, attempts were made to conduct the interview
using an English-speaking household member as a proxy. If these attempts were not successful, a
final code of "language problem" was assigned to the case.
Confidentiality – All data were collected with an assurance that all information that could identify a
specific respondent would remain confidential. All Westat and FHWA personnel, including
interviewers and professional staff, signed an affidavit stating that they would maintain the
confidentiality of all survey data.
Data Editing
Online Edits – Most of the editing on the NHTS was done online while the interviewer had the
respondent on the telephone. This editing was accomplished by programming the edits into the
CATI software so that the interviewer automatically asked the appropriate next question and was
prompted when a response entered to a particular question was not a likely response. All the online
edits used in the NHTS are documented in the household and person NHTS Questionnaire. These
online edits fell into three main groups:
Skip edits that moved the interviewer to the appropriate next question based onresponses provided to earlier questions. For example, a subject that was 6 years old wasnot asked employment questions;
Range edits that prompted the interviewer when a response entered was possibly incorrect. For example, a response that indicated that a particular vehicle was driven45,000 miles in the past 12 months. For some variables, both hard and soft ranges wereprogrammed into the CATI. In the example above, the soft range was 2,000 to 30,000. The hard range was 0 to 200,000. Therefore, in this example, the interviewer wasprompted to re-ask the question because the response was not within the soft range. If the subject provided a response of 45,000 a second time, the response was accepted.
Responses that exceeded the hard range were recorded in "comments." If needed,ranges were modified post-data collection to accommodate values that exceeded thehard range; and
Logic edits that prompted the interviewer when a value entered was within the validrange for a variable but did not pass the logic check. For example, the subject informedthe interviewer during the person interview that a particular household member was thedriver on a particular trip. However, that household member was not recorded as a

7/29/2019 2009 NATIONAL HOUSEHOLD TRAVEL SURVEY USER’S GUIDE
http://slidepdf.com/reader/full/2009-national-household-travel-survey-users-guide 23/81
Survey Procedures and Methodology2
2009 NHTS User's Guide 2-10 Federal Highway Administration
driver during the household recruitment interview or was not reported as being on thetrip. In both these scenarios a logic edit would be triggered. The triggering of logic editssometimes required modifying previously provided information. That is, the currentresponse that the respondent was the driver on the trip may be correct but the earlierresponse that the subject was not on the trip may need to be modified.
Updating CATI During Data Collection – This editing, which was ongoing throughout data
collection, occurred after a household or person interview was completed. This involved the
interviewer updating the record directly after the call was completed based on information provided
during the call. This information had to be updated later because it had not been possible to code it
into the appropriate variable during the interview. Instead the information was:
Recorded online in "comments" in CATI if the interviewer had not left the case and if the information being provided was not very extensive;
On a "problem sheet" if the interviewer had left the CATI case or the informationbeing provided was extensive;
On a form designed to collect specific information that was modified, forgotten orprovided after the interviewer could enter the information into CATI; or
Recorded in an "other specify" category.
Examples of the types of information entered in "comments" include:
The response provided by the respondent was out of range and would not be accepted
by the CATI software. When this happened, the response was reviewed and if likely,after approval by FHWA the range for the specific variable was broadened. If theresponse was unlikely, it was coded -9 (not ascertained);
A subsequent response modified an earlier response and the respondent agreed that theearlier response needed to be changed. For example, the household respondentenumerated three household vehicles. But later, when the interviewer asked about theprimary driver of each vehicle it was determined that one of the vehicles was notlicensed and was not in working condition. Information on this vehicle was deleted afterthe interview; and
The interviewer entered an incorrect response and left the variable before the responsecould be modified. For example, the note from the interviewer said that she entered
person A as a worker when in fact person A was not a worker.

7/29/2019 2009 NATIONAL HOUSEHOLD TRAVEL SURVEY USER’S GUIDE
http://slidepdf.com/reader/full/2009-national-household-travel-survey-users-guide 24/81
Survey Procedures and Methodology2
2009 NHTS User's Guide 2-11 Federal Highway Administration
Examples of information recorded in "problem sheets" include:
The interviewer completed the household interview and found out at the end of theinterview that the respondent was an adult but was not a household member (e.g., (s)heusually lived elsewhere and was just visiting). In such a scenario, the person's case had tobe deleted;
The respondent initially refused to provide his/her home address and provided just amailing address. However, after the interview was completed, (s)he was morecomfortable with the study and provided a home address; and
The interviewer entered data in the wrong proxy case (e.g., the interviewer thought themother was responding for daughter A when in fact the information was being provided for daughter B). Since the interviewer was midway through the interview, theinterview was not interrupted. The error was recorded on a problem sheet and the cases were switched later.
An example of a specific form used by interviewers included:
A "missed trip" form. Often respondents informed the interviewer they had forgottento mention a trip after the interviewer had left the trip roster. In such cases, the missedtrip information was recorded on a form and added to the CATI file later; and
Sometimes an interviewer may have felt that the response categories for a particular question did not
accurately describe the response provided by a respondent. In such cases the interviewer checked
the "other specify" response category and recorded the response in open-ended text. On completion
of the interview, these responses were reviewed and were appropriately coded into an existing
category, a new category was added, or the response was left in "other specify" as an open-ended
response.
Approach to Post-Interview Editing – In surveys with complex questionnaires and procedures,
such as the NHTS, the final dataset reflects fundamental approaches taken in the data collection and
editing processes. For the 2009 NHTS, two approaches may have had considerable impact on the
resulting data.
The first is the reluctance to impute data. If the respondent did not answer an item, its value was
generally not imputed, (i.e., determine what the logical response would be given the response to
other items). Carefully performed imputation has its place in many statistical surveys, however
Westat and FHWA determined that imputation would be limited in the NHTS data and only used

7/29/2019 2009 NATIONAL HOUSEHOLD TRAVEL SURVEY USER’S GUIDE
http://slidepdf.com/reader/full/2009-national-household-travel-survey-users-guide 25/81
Survey Procedures and Methodology2
2009 NHTS User's Guide 2-12 Federal Highway Administration
with data items where known responses were required for proper weighting (e.g., race). If data were
imputed, an imputation/edit flag was set for the variable to indicate the values that were imputed.
Second, a conservative approach was taken regarding editing reported data. If it was determined that
what was reported could not have happened (e.g., trip ending before it started), the unlikely response
was set to a "not ascertained" (-9) code. The exception to this rule was if a more reliable response
for the same information could be reasonably obtained from another household member or from
elsewhere in the subject household member's interview. For example, household member A
reported a "start time" for a trip that failed an edit. But, household member B went on the same trip
and his (different) reported time did not fail the edit. In this example, the start time reported by
household member A was modified to the time reported by household member B. This was only
done when trip data failed an edit. In general, differences in data reported by household members
on the same trip were allowed to remain. For example, Person A reported a trip starting at 8:30AM when Person B said the same trip started at 8:35AM.
Data Collection Editing – Throughout data collection on the 2009 NHTS, edits designed to check
for data consistency and logic were programmed and run. .When the value of a variable failed an
edit, it was manually reviewed. If the value was illogical, and could not be reasonably resolved, it was
revised to "not ascertained" (a code of -9). No flags were set when a response was set to "not
ascertained".
In order to ensure that the data were complete and of high quality, a series of data editing
procedures were implemented. During the review of edits and cleaning of responses for travel day
trips, it was sometimes necessary to slightly modify a response or impute a missing response for the
resolution of incorrectly completed items. These procedures are outlined below.
Edit Procedures – First all cases with minimally overlapping trips for the same household member
were examined. In many cases these trips were duplicates, i.e., the trip detail on both trips indicated
that the exact same trip had been reported twice. True duplicate trips could not be generated due to
the trip rostering procedures that were in place to reduce respondent burden. However, duplicatetrips were often recorded by off-setting the start and stop times by 1 minute. These cases were
reviewed manually and duplicate trips were deleted.
Next, all cases were examined where two or more travel day trips for the same household member
had overlapping trip times, embedded trip times, or missing data. In some cases information was
7/29/2019 2009 NATIONAL HOUSEHOLD TRAVEL SURVEY USER’S GUIDE
http://slidepdf.com/reader/full/2009-national-household-travel-survey-users-guide 26/81
Survey Procedures and Methodology2
2009 NHTS User's Guide 2-13 Federal Highway Administration
available on another household member’s record that could help clarify conflicting information.
Whenever possible this information was used to make adjustments to the record with embedded
trips.
In some cases the most logical edit was to “split the travel time”, these were mostly walk or bike
trips. For example, if a walking trip from home was reported from 8:00AM to 9:00AM, and was
followed by a walking trip to home from 8:55AM to 9:00AM, then the end time of the first trip was
adjusted to 8:30AM and the start time of the second trip was adjusted to 8:31AM. In some of these
cases trip distance and travel time had to be adjusted as well.
Other cases involved embedded trips that were on the way to a destination. These were often
reported after the interviewer had finished gathering trip information, thus were recorded on a
"Missed Trip" form and manually entered during data editing at a later stage. Many that werereported incorrectly involved trips to the gas station for instance, or picking up or dropping off
someone on the way to a destination. For example, if a trip to home (recorded in CATI during the
interview) was reported from 5:00PM to 5:30PM, and a trip to the gas station was reported from
5:00PM to 5:10PM (recorded on a missed trip form as it was recalled later), then we assumed that
the respondent stopped at the gas station on the way home. Therefore, the original trip in CATI
from 5:00PM to 5:30PM was modified to a trip from the gas station to home. The start time of the
trip was changed to 5:10PM. Unfortunately, when there was an embedded trip reported there was
no information on dwell time. That is, the person arrived at the gas station at 5:10PM and left for
home from the gas station also at 5:10PM. In some cases, two Missed Trip forms were submitted,
for example, one for a trip to the gas station, and another for the trip home that was already
recorded in CATI. In these cases it was sometimes possible to establish dwell time and the trip
roster was edited accordingly.
Imputation Flags – There are imputation flags for each of the following variables: AGE, RACE,
SEX, HOMEOWN, and HOMETYPE. A flag for these variables indicates that the variable has
been imputed.
One of the goals of this imputation was to decrease the number of trips with missing start and end
time values. If both start time and end time were missing the trip was left in the roster in the original
order reported by the respondent. If start time was missing but end time was known or vice versa,
and trip distance and mode were reported, then we were able to estimate the travel time of the trip

7/29/2019 2009 NATIONAL HOUSEHOLD TRAVEL SURVEY USER’S GUIDE
http://slidepdf.com/reader/full/2009-national-household-travel-survey-users-guide 27/81
Survey Procedures and Methodology2
2009 NHTS User's Guide 2-14 Federal Highway Administration
and subsequently impute the missing start or end time. The following rules were used to estimate
travel time based on mode and distance:
If the mode is local transit bus, school bus, subway, trolley (TRPTRANS=9,11,,17,18),
and the trip distance is <=15 miles, then we used an average estimated speed of 10mph;
If the mode is local transit bus, school bus, subway, trolley (TRPTRANS=9,11,,17,18),and the trip distance is >15 miles, then we used an average estimated speed of 20 mph;
If the mode is car, van, SUV, pickup truck, other truck, recreational vehicle, motorcycle,commuter bus, charter bus, city to city bus, Amtrak, commuter train, taxi cab, limo,shuttle (TRPTRANS=1, 2, 3, 4, 5, 6, 7, 10, 12, 13, 15, 16,19,, 23, 24), and the tripdistance is <=15 miles, then we used an average estimated speed of 25 mph;
If the mode is car, van, SUV, pickup truck, other truck, recreational vehicle, motorcycle,
commuter bus, charter bus, city to city bus, Amtrak, commuter train, taxi cab, limo,shuttle (TRPTRANS=1, 2, 3, 4, 5, 6, 7,10, 12, 13, , 15, 16, 19, 23, 24), and the tripdistance is >15 miles, then we used an average estimated speed of 50 mph;
If the mode is bicycle (TRPTRANS=22), for any trip distance, the average estimatedspeed used was 10 mph;
If the mode is walk (TRPTRANS=23), for any trip distance, the average estimatedspeed used was 3 mph; and
If the mode is anything else (airplanes, ships, ferry’s boats, other) the data was left as isas the variation was too great to estimate the trip time duration.
Once travel time was estimated, the imputed start or end time was calculated by subtracting the
estimated travel time from the end time. The imputed end time was calculated by adding the
estimated travel time to the start time. In all cases where a start or end time was imputed, the trip fit
into the travel day roster without causing any overlapping trips.
In addition to missed trips reported for the subject on missed trip forms, trips not reported for the
subject during the person interview were also imputed. These trips were imputed when a subsequent
household member reported that a household member who had completed a person interview earlier had accompanied them on a trip. Since the earlier household member had already completed
the interview, it was assumed that (s)he had forgotten to report the trip. The missing trip from the
subsequent household member was copied to the travel day record for the household member who
had completed the interviewer earlier. An imputation flag was set to indicate trips that were added.
7/29/2019 2009 NATIONAL HOUSEHOLD TRAVEL SURVEY USER’S GUIDE
http://slidepdf.com/reader/full/2009-national-household-travel-survey-users-guide 28/81
Survey Procedures and Methodology2
2009 NHTS User's Guide 2-15 Federal Highway Administration
The other variables such as AGE, SEX, OTHRPHON, etc. were imputed during the weighting
process if the value for the variable was missing (-7. -8 or -9).
Trip Already Reported – The trip roster for each household member who completed a person
interview provides a listing of all trips taken on the travel day. However, to reduce respondent
burden, not all household members were asked to provide trip detail for each trip taken. For
example, trip detail was not asked on proxy interviews if the same trip was self-reported earlier by
another household member. Post data collection, trip details recorded during the interview with the
self-reported household member were copied to the record for the proxy household member who
reported being on the same trip.
Derived Variables – The CATI data set was converted into a SAS data set specified by FHWA.
The data files created had several "derived variables" that were created by either renaming questionnaire variables or combining multiple variables. Survey weights and other variables not
collected during the interview were also appended to the final data files.
This version of the User's Guide discusses the four data files that are part of the NHTS dataset. The
four files are the:
Household File – data collected once for the household (one record per household);
Person File – data items collected once for each interviewed household member (onerecord for each completed person interview);
Vehicle File – data items related to the household ’s vehicles (one record for eachhousehold vehicle); and
Travel Day Trip File – data items collected for each trip an interviewed person madeon the household’s travel day (one record for each trip each person made).
Useable Households – The four data files in the dataset contain information on only households
that are "useable." A useable household in the 2009 NHTS is one in which the household
recruitment interview was completed, and person interviews were completed with at least 50 percentof the adult (age 18+) household members. Only information for useable households has been
provided in the four files.

7/29/2019 2009 NATIONAL HOUSEHOLD TRAVEL SURVEY USER’S GUIDE
http://slidepdf.com/reader/full/2009-national-household-travel-survey-users-guide 29/81
Survey Procedures and Methodology2
2009 NHTS User's Guide 2-16 Federal Highway Administration
While the “useable household” threshold for including a household on the dataset was the 50
percent or more adults interviewed, it should be noted that 87 percent of all households had 100
percent of all household adults interviewed.
A household interview was considered complete if the:
Interviewer asked every applicable question in the household recruitment questionnaireand set an appointment to call the household back to collect diary information;
The household respondent provided the complete household roster information for thehousehold; and
The household respondent provided an address for mailing the travel diaries to thehousehold.
The person interview was considered complete if the interviewer administered every applicable
question to the subject during the person interview. That is, the interviewer got to the last question
in the questionnaire and was able to thank the subject for participating in the survey.
A total of 196,619 households were recruited for the 2009 NHTS. The final dataset contains
information on the 150,147 useable households. Although the definition of a useable household
required only 50 percent of adults to complete a person interview, Westat completed person
interviews with or by proxy for 93 percent of the eligible adult household members.
Table 2-1. Adult retrieval completion rates in useable households
Survey completion level
Number of eligible adult household members 283,974
Number of self-report interviews 216,980
Number of proxy interviews 46,592
Total number of completed retrieval interviews 263,572
Editing the Delivery Datasets – As a final editing step, frequencies for useable households on
both the CATI dataset and the delivery datasets were compared. Next, edits were run on the four
delivery data sets to ensure consistency in the reporting of values across the four delivery files.

7/29/2019 2009 NATIONAL HOUSEHOLD TRAVEL SURVEY USER’S GUIDE
http://slidepdf.com/reader/full/2009-national-household-travel-survey-users-guide 30/81
2009 NHTS User's Guide 3-1 Federal Highway Administration
2009 Survey Changes
The NHTS is the only national source of travel behavior data over time, and as such, is widely used
for trend analysis. For that reason, it is critical for data users to understand any changes made from
one survey to another. While most of the core of the NHTS remained unchanged from earlier
surveys, the 2009 NHTS represents slight changes in survey methods and procedures, including:
1. The 2009 NHTS was modified to eliminate the retrospective collection of long distant
trip data. Detailed travel information was collected for only daily travel.
2. Second odometer readings for household vehicles were not collected in the 2009NHTS.
3. A major addition to the 2009 administration was the Safe Routes to School section. Inhouseholds with children aged 5-15 years old, one household member was randomly selected and the most knowledgeable parent interviewed to get a better understanding about how children travel to school and the safety concerns of their parents.
4. While all household members were enumerated, only those household members who were 5 years and older were eligible for the interview process. Prior to the conduct of
the 2001 NHTS children under the age of 5 did not generate a travel interview. In the2001 NHTS, all household members were eligible for a person interview regardless of age. The 2009 NHTS returned to the previous age guidelines and requested travelinformation is collected only from household members five years and older. Afteranalyzing the data from 2001, FHWA determined the additional data collected did notprovide enough added value to compensate for the increase in respondent burdenresulting from the completion of these interviews.
5. Changes to the household recruitment interview for the 2009 NHTS included theaddition of question to determine if an enumerated vehicle had a commercial licenseplate. For each vehicle with a model year of 2002 or newer, we asked if the vehicle was a
hybrid or alternate fuel use vehicle. As in past surveys, the total number of all household vehicles was asked; however, in 2009 the wording of the response category wasmodified to include motorbikes.
6. The off-line geocoding operation was changed to an online geocoding process. If theaddress information failed the online coding, an off-line geocoding operation that usedmultiple databases and detailed manual searches to determine the latitude and longitudeof a location was used.
The NHTS Data Series: Changes Over Time in
the NPTS/NHTS 3

7/29/2019 2009 NATIONAL HOUSEHOLD TRAVEL SURVEY USER’S GUIDE
http://slidepdf.com/reader/full/2009-national-household-travel-survey-users-guide 31/81
The NHTS Data Series: Changes Over Time in the NHTS/NPTS3
2009 NHTS User's Guide 3-2 Federal Highway Administration
7. An interviewer instruction was added to help more accurately record the one-way distance from home to workplace.
8. Additional questions were added to better understand details of work related travel(e.g., usual start time, availability of flex time).
9. Questions were added about purchases made through the internet and whether thosepurchases were delivered to a subject’s home. Internet use continues to increase overtime and a growing number of people use the internet to replace trips to purchasegoods or provide entertainment. The 2009 survey added a few questions aboutpurchases made through the internet and whether these purchases were delivered to asubjects’ home. These questions were added to provide more evidence about how commerce via the internet impacts trip making. In the 2001 survey we asked aboutusage in the past 6 months. The 2009 survey limited the reference period to in the pastmonth, and subjects were no longer asked if they had access to the internet and from where.
10. The process for calculation of weights was more detailed (see Chapter 5).
11. A follow up question was added, for those household members who were at least18 years old and reported as not being drivers, to determine if they had ever drove.
12. Asking the highest level of education was moved from the retrieval to the recruitmentinterview.
The following modifications were made to questions that collect information related to daily travel.
13. The list of transportation modes was revised to reflect changes in often used modes. A
new coding option was added to attempt to capture the impact of Light Electric Vehicles (i.e., Golf Carts).
14. Subjects were asked how many times they have driven a motorcycle or moped on publicroadways in the past month.
15. Response categories for type of transportation used on travel day trips were modified tobe more specific about the type of vehicle used.
16. During the collection of trip details, subjects were asked if they used an Interstate orturnpike during any part of their trips. If they answered yes, they were asked if they paid
a toll while traveling on that road. Trip-end addresses are not collected for the nationalsample, but they are for the Add-on’s. The 2009 NHTS employed online geocoding. This process took place as addresses were entered into the CATI system.
Table 3-1 below lists key changes to the 2009 NHTS. The reason for change has also been provided
to better understand the probable impact the change may have on the 2009 survey data.

7/29/2019 2009 NATIONAL HOUSEHOLD TRAVEL SURVEY USER’S GUIDE
http://slidepdf.com/reader/full/2009-national-household-travel-survey-users-guide 32/81
The NHTS Data Series: Changes Over Time in the NHTS/NPTS3
2009 NHTS User's Guide 3-3 Federal Highway Administration
Table 3-1. Changes in the 2009 NHTS survey methodology and content and the
anticipated effect
Topic From To Anticipated effect
What is
collected?
One survey that
collected both travelday and travel period
information
Only ask about travel
day date
Long distance travel was not a focus
of the 2009 NHTS
Which household
members are
eligible?
All household
members
Household members
age 5 and older
Transportation planners rarely use any
data associated with this population;
therefore, it is anticipated that this
change is not problematic
Safe Routes to
school
Never asked before Adult respondent was
asked to discuss travel
to school behaviors of
one randomly selected
household member 5-
15 years old
Enhance the understanding of how
children travel to school and the safety
concerns of their parents
Hybrid vehicles No questions aboutHybrid/Alternate fuel
use vehicles
Asking if vehicles werehybrid or alternate fuel
use vehicle if model
year was 2002 or
newer
Improve the personal transportationdata related to the percentage of the
fleet that is hybrid or alternate fuel
use
Employment
questions
No special
instructions for
interviewers on
collecting workplace
travel distance
Instruction added to
the interviewer to help
them more accurately
record the one-way
distance from home to
their work place
Improve the precision of work trip
distance estimations
Asking if the
respondent had
worked at home in
the past 2 months
and if so how often
Asking the respondent
to report usual start
time, if flex time and
working from home is
an option, and how
often they work at
home
Improve the data used in analyzing
changes work trips
Internet Use Internet questions
only included asking
if a subject has
internet access and if
so from where
Questions added
about purchases
made through the
internet and whether
those purchases were
delivered to the
subjects’ home
Improve the understanding of how
commerce via the internet impacts
trip making
Most recent long-distance trip
Collected Not collected Long-distance trips were not includedin the scope of the 2009 survey
Odometer
readings
Two odometer
readings collected –
the first at the time
of the retrieval
interview and the
second several
months later
Only collected one
reading
Data users are unable to generate
independent validations of annual
mileage estimates
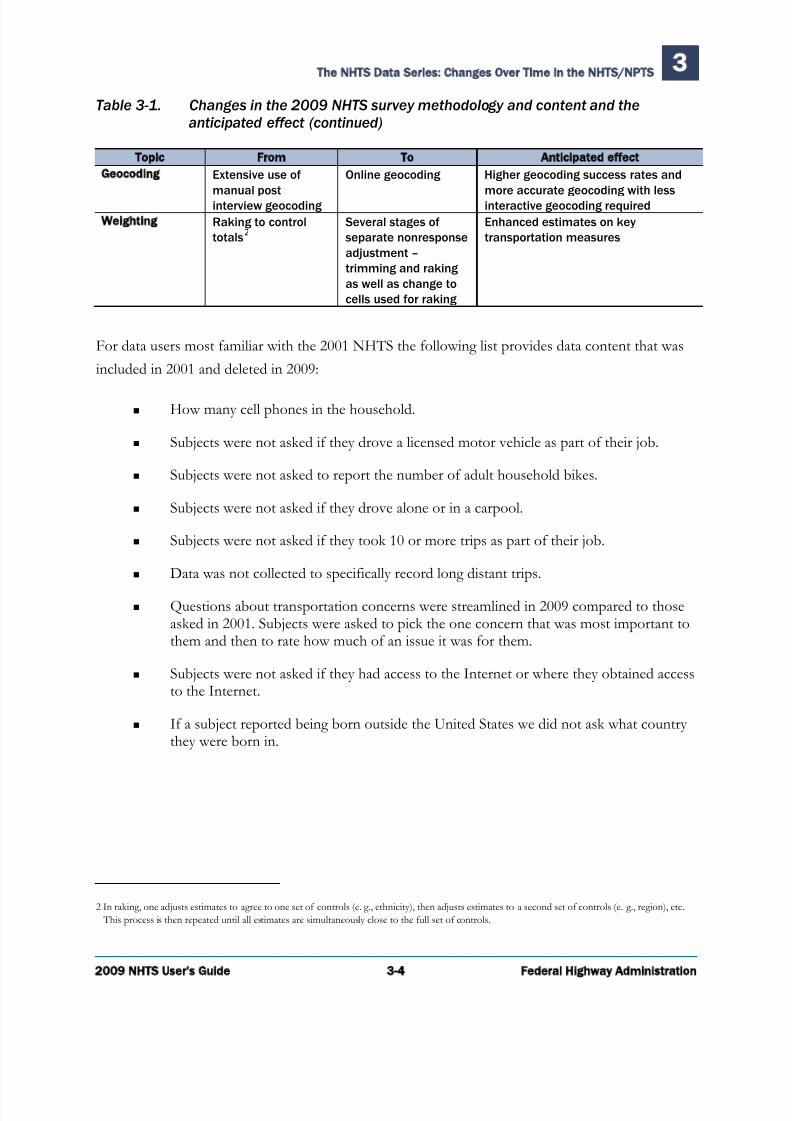
7/29/2019 2009 NATIONAL HOUSEHOLD TRAVEL SURVEY USER’S GUIDE
http://slidepdf.com/reader/full/2009-national-household-travel-survey-users-guide 33/81
The NHTS Data Series: Changes Over Time in the NHTS/NPTS3
2009 NHTS User's Guide 3-4 Federal Highway Administration
Table 3-1. Changes in the 2009 NHTS survey methodology and content and the
anticipated effect (continued)
Topic From To Anticipated effect
Geocoding Extensive use of
manual postinterview geocoding
Online geocoding Higher geocoding success rates and
more accurate geocoding with lessinteractive geocoding required
Weighting Raking to control
totals2
Several stages of
separate nonresponse
adjustment –
trimming and raking
as well as change to
cells used for raking
Enhanced estimates on key
transportation measures
For data users most familiar with the 2001 NHTS the following list provides data content that was
included in 2001 and deleted in 2009:
How many cell phones in the household.
Subjects were not asked if they drove a licensed motor vehicle as part of their job.
Subjects were not asked to report the number of adult household bikes.
Subjects were not asked if they drove alone or in a carpool.
Subjects were not asked if they took 10 or more trips as part of their job.
Data was not collected to specifically record long distant trips.
Questions about transportation concerns were streamlined in 2009 compared to thoseasked in 2001. Subjects were asked to pick the one concern that was most important tothem and then to rate how much of an issue it was for them.
Subjects were not asked if they had access to the Internet or where they obtained accessto the Internet.
If a subject reported being born outside the United States we did not ask what country they were born in.
2 In raking, one adjusts estimates to agree to one set of controls (e. g., ethnicity), then adjusts estimates to a second set of controls (e. g., region), etc.
This process is then repeated until all estimates are simultaneously close to the full set of controls.
7/29/2019 2009 NATIONAL HOUSEHOLD TRAVEL SURVEY USER’S GUIDE
http://slidepdf.com/reader/full/2009-national-household-travel-survey-users-guide 34/81
The NHTS Data Series: Changes Over Time in the NHTS/NPTS3
2009 NHTS User's Guide 3-5 Federal Highway Administration
The Entire NHTS/NPTS Series
The 2009 NHTS continues the series of household travel surveys begun by the Department of
Transportation in 1969 to measure every-day travel in the United States. The survey has evolved
considerably over the years in both scope and methodology. This section of the User’s Guide
presents a summary of the characteristics of each of the seven NPTS/NHTS surveys from 1969
through 2009.
1969 and 1977 – These surveys were similar in that the sampling frame was clustered Primary
Sampling Units (PSUs) from retired Census surveys. Both were conducted as face-to-face home
interviews using a pencil and paper questionnaire administered by field staff of the Census Bureau.
The sample sizes were 15,000 and 18,000 households respectively, so both were sufficient to give a
national picture of household travel.
The 1969 questionnaire was very short and to the point, while the 1977 questionnaire was long and
detailed. Much of the detail added in 1977 was information on long-distance trips (travel period
trips). The focus on long trips in 1977 was further reinforced by the fact that a part of the NPTS
sample was also interviewed for the National Travel Survey (NTS.) The NTS was a survey of long-
distance trips (100+ miles) taken over the course of a full year.
The other major difference between the 1969 and 1977 surveys was that the focus on auto travel in
1969 was broadened to vehicle travel by 1977, reflecting the greater mix of vehicle types in the
household-based fleet.
1983 – Like the 1969 and 1977, the 1983 survey was conducted as a face-to-face interview by Census
Bureau field staff, using a retired PSU-based sample from the Current Population Survey (CPS).
However, either because of the smaller sample size of 6,500 households or the economic conditions
during the survey period, the 1983 data is acknowledged as an anomaly in the NPTS series, with trip
and travel data believed to be too low. Another issue inherent to the 1983 dataset is that, given the
low sample size, each Census field interviewer only conducted 2-3 NPTS interviews a month. Itseemed that this was too low a threshold to maintain proficiency with a complex questionnaire like
NPTS.

7/29/2019 2009 NATIONAL HOUSEHOLD TRAVEL SURVEY USER’S GUIDE
http://slidepdf.com/reader/full/2009-national-household-travel-survey-users-guide 35/81
The NHTS Data Series: Changes Over Time in the NHTS/NPTS3
2009 NHTS User's Guide 3-6 Federal Highway Administration
All three of the Census-administered surveys had used a four-day recall window beyond travel day.
That is, the person-level interview had to be completed within 4 days after travel day for the
interview to be included.
1990 – The 1990 NPTS represented a switch to a private survey research firm, Research Triangle
Institute (RTI), and to a telephone sample. The interviews were conducted using Computer-Assisted
Telephone Interviewing (CATI) which allows for some online editing as the data is collected. A non-
clustered random-digit dialing (RDD) sample was used, which could better represent travel
throughout the country. Clustered samples are problematic for household travel surveys because the
nature of some mode choices is highly dependent on very small geographic areas. For example,
people who live within a half-mile of public transit will use it considerably more than people who
live 2 miles away from transit. Thus, the specific location of the clusters can determine the types of
travel collected.
Because it is more difficult to reach individual respondents by telephone, the recall window was
expanded to 6 days beyond travel day.
While switching to a telephone survey resolved the problems with sample clustering and sample size,
the 1990 NPTS trip rates (expressed as daily person trips per household) were still well-below those
obtained by Metropolitan Planning Organizations (MPOs) in their household travel surveys. This
had been a problem throughout the data series, and it would be solved in the 1995 survey.
The Add-on component to the NPTS was initiated in the 1990 survey, with two states and one
MPO (Metropolitan Planning Organization) participating.
1995 – A major change in the 1995 survey was the use of a travel diary for collecting daily trips.
While the travel diary corrected the previously described problem of trip rates, it also necessitated a
switch to a two-stage data collection.
The two-stage data collection design implemented in 1995, combined with the increase in survey burden and increased telemarketing in the US, resulted in a much lower response rate than
previously obtained in the NPTS.
Another significant change in the 1995 survey was changing the standard for a household to be
included in the dataset. The previous requirement was that one or more household members had to
7/29/2019 2009 NATIONAL HOUSEHOLD TRAVEL SURVEY USER’S GUIDE
http://slidepdf.com/reader/full/2009-national-household-travel-survey-users-guide 36/81
The NHTS Data Series: Changes Over Time in the NHTS/NPTS3
2009 NHTS User's Guide 3-7 Federal Highway Administration
complete the person interview for the household to be considered complete. In 1995, this was
changed to 50 percent or more of the household adults (18+) had to be interviewed for the
household to be included in the dataset.
The Add-on component was continued with two states and two MPOs, and for the first time,
Add-on sponsors could add a minimal number of their own questions.
2001 NHTS – The 2001 survey represented a combined survey of the NPTS and the American
Travel Survey (ATS). The ATS, which had been conducted in 1995 by the Bureau of Transportation
Statistics, was a survey of trips of 100 miles or more taken over the course of a calendar year. There
were problems in trying to use the 1995 NPTS and the 1995 ATS together to form a picture of total
household travel by the American public. The combined survey approach for the 2001 NHTS was
designed to give one data source for the full continuum of person travel. In addition to a combinedsurvey, the threshold for longer trips was lowered to 50 miles or more, to obtain a better sample of
those often overlooked 50-100 mile trips.
For the first time in the NPTS series, travel was collected for household members 0-4 years old. All
previous surveys had collected travel only from household members age 5 and older, assuming that
those 0-4 household members only made trips with other household members. However, this
ignored trips of this young group made with day care providers, as part of a preschool activity, or
just with non-household members.
Great care was taken in the 2001 NHTS to resolve some of the response rate issues that surfaced in
the 1995 survey. A number of successful actions were initiated to stop the decline in response rates.
Prior to the main survey an intensive pilot test was conducted by RTI and Westat. The focus of this
test was to evaluate substantial revisions to the recruitment and retrieval instruments aimed at
reducing respondent burden, and to test several incentive levels.
Nine Add-on partners participated in the 2001 NHTS, including five states and four MPOs. For the
first time, trip origins and destinations were collected for Add-on sponsors. In terms of the impacton sample size, about two-thirds of the total 2001 NHTS sample was sponsored by Add-on areas.
2009 NHTS – The 2009 NHTS reflected an emphasis on the Add-on component, with 14 States
and 6 MPOs participating in the survey as Add-on jurisdictions. For the first time in the
NPTS/NHTS series the great majority of NHTS households were funded by the Add-on partners.
7/29/2019 2009 NATIONAL HOUSEHOLD TRAVEL SURVEY USER’S GUIDE
http://slidepdf.com/reader/full/2009-national-household-travel-survey-users-guide 37/81
The NHTS Data Series: Changes Over Time in the NHTS/NPTS3
2009 NHTS User's Guide 3-8 Federal Highway Administration
Given the emphasis on Add-ons and both technical and budgetary concerns surrounding the long-
trip data collection, the 2009 survey did not have long-trip data collection.
In earlier NPTS/NHTS surveys the Add-on jurisdictions were limited or discouraged from adding
questions to be asked only of their residents. This was changed in the 2009 survey, and Add-ons had
increased opportunity to collect on topics of timely interest to them.
The 2009 NHTS also represented the first time since 1990 that data were collected from a sample
other than a list-assisted random sample of landline telephone numbers. Because of the increased
prevalence of households that had only cell phones, with no household landline, a separate sample
of Cell Phone Only households was conducted. The 1,250 households in this sample allowed for the
survey sponsors to determine the feasibility of conducting the NHTS interview by cell phone, andalso provided some data for research on the differences in demographics and travel behavior
between households that have landlines and those that have only cell phones. Note that the data
collected from the Cell Phone Only households are NOT included in the public use dataset and are
not part of the data tabulated from the Online Analysis Engine.
The 2009 survey collected travel data from all household members age 5 and above. This represents
a change from the 2001 NHTS, which had collected travel data on all household members regardless
of age, however age 5 and above had been the sampled group in all earlier NHTS/NPTS surveys.
In terms of survey content, items were added to the 2009 survey about the impact of the Internet
and teleworking on travel behavior. Additional questions on travel to school were asked of one
randomly-selected school-age child in the household. Data on alternative fuel used was collected on
each household vehicle, and data on Interstate use and tolls paid were collected on travel day trips.
In addition to changes in the survey design and administration, a host of real world factors affected
the 2009 NHTS, as described below.
External Factors Impacting the 2009 NHTS – Certain factors, such as the state of the economy
and the price of oil are known to have significant effects on how, when, and the amount that people
travel. Variations in these factors are expected and are often accounted for in travel trend analysis.
During the 2009 NHTS data collection period these variations were prominent and are believed to
have had an impact on travel trends. In the summer of 2008 the United States saw gas prices rise
7/29/2019 2009 NATIONAL HOUSEHOLD TRAVEL SURVEY USER’S GUIDE
http://slidepdf.com/reader/full/2009-national-household-travel-survey-users-guide 38/81
The NHTS Data Series: Changes Over Time in the NHTS/NPTS3
2009 NHTS User's Guide 3-9 Federal Highway Administration
higher than they have ever been to over $4.00 a gallon in most places. In the winter of 2008, the
United States saw the worst economic fallout since the Great Depression with the bailout of
financial institutions, car manufacturers and record high unemployment rates. These two drastic
economic swings greatly influenced the amount of travel people made, their mode choices, and their
reasons for travel. In addition to these economic factors, this was the first time any national travel
survey was in data collection during an election year. This required interviewers to have to compete
with calls from political campaigns and polling companies and sometimes led to frustrated
respondents. While the impact of these outside influences cannot be fully quantified, they surely
impacted overall travel behaviors and response rates observed in the 2009 NHTS.
The weather also posed significant issues for various areas of the U.S. during the 2009 NHTS. In
June 2008, Cedar Rapids’ Cedar River crested to its highest levels ever, over 30 feet. As a result of
the significant flooding, data collection was suspended in two Add-on regions, Cedar Rapids andIowa. While we attempted data retrieval for those households that already had assigned travel days3,
sample release for these two regions was held from the end of June through late-September. In
September 2008, Galveston, Texas was devastated by Hurricane Ike. Much of the Gulf Coast felt
significant impacts from this storm from the panhandle of Florida to Corpus Christi, Texas. While
interviewing was only briefly suspended in many of the surrounding areas, Galveston was removed
from the sample moving forward.
3 The decision to attempt data collection for the households with assigned travel days was made to show respect and appreciation for those who took
the time to fulfill their promise to participate. Interviewers were provided specific instructions for calling households in Iowa.
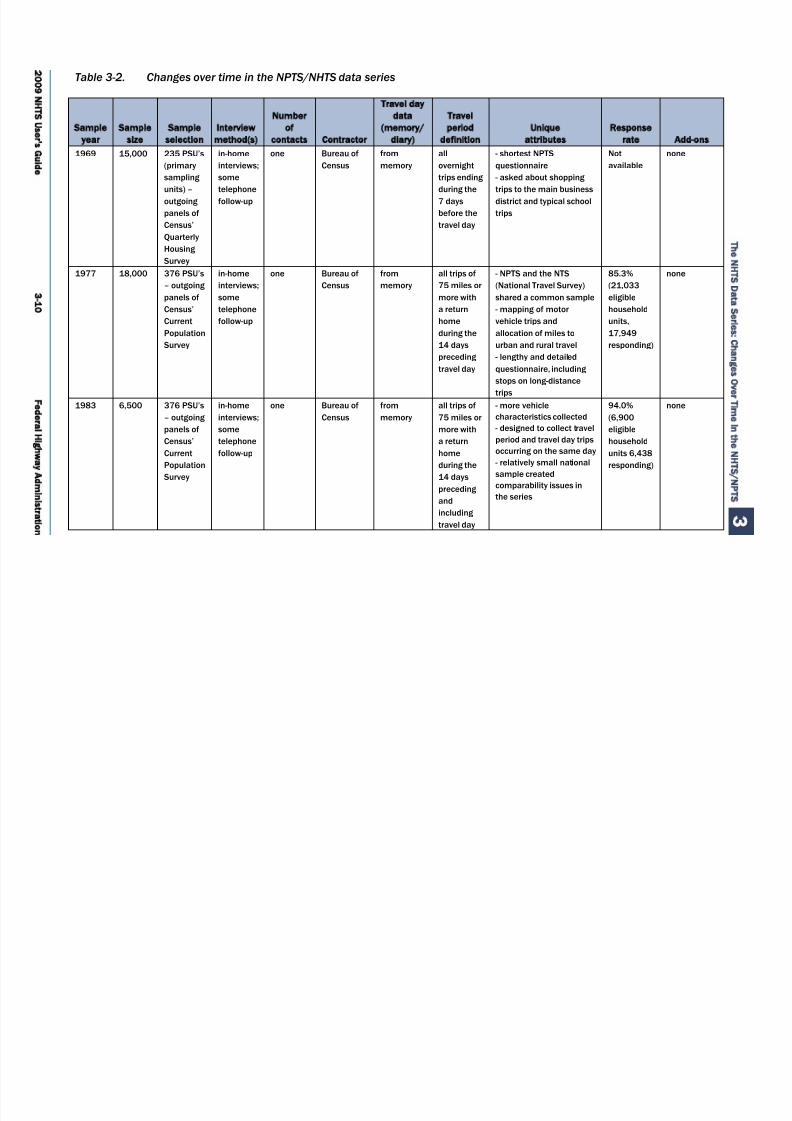
7/29/2019 2009 NATIONAL HOUSEHOLD TRAVEL SURVEY USER’S GUIDE
http://slidepdf.com/reader/full/2009-national-household-travel-survey-users-guide 39/81
T
N
D
aS
e
C
O
Tmen
h
N
N
3
2
N
U
sG
d
31
F
aHgw
A
mins
a
o
Table 3-2. Changes over time in the NPTS/NHTS data series
Sample
year
Sample
size
Sample
selection
Interview
method(s)
Number
of
contacts Contractor
Travel day
data
(memory/
diary)
Travel
period
definition
Unique
attributes
Response
rate Add-ons
1969 15,000 235 PSU’s
(primary
sampling
units) –
outgoing
panels of
Census’
Quarterly
Housing
Survey
in-home
interviews;
some
telephone
follow-up
one Bureau of
Census
from
memory
all
overnight
trips ending
during the
7 days
before the
travel day
- shortest NPTS
questionnaire
- asked about shopping
trips to the main business
district and typical school
trips
Not
available
none
1977 18,000 376 PSU’s
– outgoing
panels of
Census’
Current
Population
Survey
in-home
interviews;
some
telephone
follow-up
one Bureau of
Census
from
memory
all trips of
75 miles or
more with
a return
home
during the
14 days
preceding
travel day
- NPTS and the NTS
(National Travel Survey)
shared a common sample
- mapping of motor
vehicle trips and
allocation of miles to
urban and rural travel
- lengthy and detailed
questionnaire, including
stops on long-distance
trips
85.3%
(21,033
eligible
household
units,
17,949
responding)
none
1983 6,500 376 PSU’s
– outgoing
panels of
Census’
Current
Population
Survey
in-home
interviews;
some
telephone
follow-up
one Bureau of
Census
from
memory
all trips of
75 miles or
more with
a return
home
during the
14 days
preceding
and
including
travel day
- more vehicle
characteristics collected
- designed to collect travel
period and travel day trips
occurring on the same day
- relatively small national
sample created
comparability issues in
the series
94.0%
(6,900
eligible
household
units 6,438
responding)
none

7/29/2019 2009 NATIONAL HOUSEHOLD TRAVEL SURVEY USER’S GUIDE
http://slidepdf.com/reader/full/2009-national-household-travel-survey-users-guide 40/81
T
N
D
aS
e
C
O
Tmen
h
N
N
3
2
N
U
sG
d
31
F
aHgw
A
mins
a
o
Table 3-2. Changes over time in the NPTS/NHTS data series (continued)
Sample
year
Sample
size
Sample
selection
Interview
method(s)
Number
of
contacts Contractor
Travel day
data
(memory/
diary)
Travel
period
definition
Unique
attributes
Response
rate Add-ons
1990 22,317
(18,000
national
and
4,300
Add-ons)
- list-
assisted
sample of
telephone
numbers
formed a
RDD
sample
- sample
was
stratified
by 34
geographic
units
telephone
interviews
one Research
Triangle
Institute,
Research
Triangle
Park, North
Carolina
from
memory
all trips of
75 miles or
more with
a return
home
during the
14 days
preceding
and
including
travel day
- first time that the survey
conducted exclusively by
phone
- first unclustered sample
design
- data collected on most
recent traffic accident, if
within the past 5 years
- first time for Add-ons
73.1%
(30,529
eligible and
presumed
eligible
household
units,
22,317
completing)
New York
State
Connecticut
Indianapolis
MPO
1995 42,031
(21,000
national
and
21,031
Add-ons)
- list-
assisted
sample of
telephone
numbers
formed a
Random
Digit
Dialing
(RDD)
sample
- sample
was
stratified
by 70
geographic
units
telephone
interviews
two – one
interview
at the
household
level, one
for each
person in
the
household
Research
Triangle
Institute,
Research
Triangle
Park, North
Carolina
travel diary
used
all trips of
75 miles or
more with
a return
home
during the
14 days
preceding
and
including
the travel
day
- first time for a 2-stage
survey using a travel diary
- trip rates increased
considerably because of
the travel diary
- completed household
definition changed to 50%
or more of household
adults
- household rostering of
trips (ability to confirm
trips previously reported
by another household
member)
- first time cash incentives
were used
- first time odometer
readings were collected
37.2%
(112,960
eligible and
presumed
eligible
residential
telephone
numbers,
42,033
household
completing)
New York
State
Commonwea
lth of
Massachuset
ts
Oklahoma
City, OK
Tulsa, OK

7/29/2019 2009 NATIONAL HOUSEHOLD TRAVEL SURVEY USER’S GUIDE
http://slidepdf.com/reader/full/2009-national-household-travel-survey-users-guide 41/81
T
N
D
aS
e
C
O
Tmen
h
N
N
3
2
N
U
sG
d
31
F
aHgw
A
mins
a
o
Table 3-2. Changes over time in the NPTS/NHTS data series (continued)
Sample
year
Sample
size
Sample
selection
Interview
method(s)
Number
of
contacts Contractor
Travel day
data
(memory/
diary)
Travel
period
definition
Unique
attributes
Response
rate Add-ons
2001 26,038
national
and
approx.
40,000
Add-ons
list-
assisted
sample of
telephone
numbers
formed a
Random
Digit
Dialing
(RDD)
sample
telephone
interviews
two – one
interview
at the
household
level, one
for each
person in
the
household
Westat
Rockville,
MD
(National
sample and
2 Add-ons);
Morpace,
Farmington
Hills, MI
(7 Add-ons)
travel diary
used
all trips of
50 miles or
more with a
return
home
during the
28 days
preceding
and
including
travel day
- first time the long trip
survey (American Travel
Survey) was combined
with the daily trip survey
(NPTS)
- threshold for long trips
was lowered to 50 miles
to collect more trips in the
previously ignored 50-75
mile range
- if no long trips taken
during travel period, most
recent trip of 50 miles or
more was collected
- walking trips increased
considerably because of
multiple prompts in the
questionnaire
- cash incentives used in
both the pre-interview
letter and with the traveldiary mailing
- multiple data collection
methods for odometer
readings
41.0%
(63,472
eligible and
presumed
eligible
residential
telephone
numbers,
26,038
households
completing)
Baltimore,
MPO
Des Moines
MPO
Hawaii
Kentucky (4
counties)
Lancaster PA
MPO
New York
State
Oahu
(Honolulu
MPO)
Texas
Wisconsin
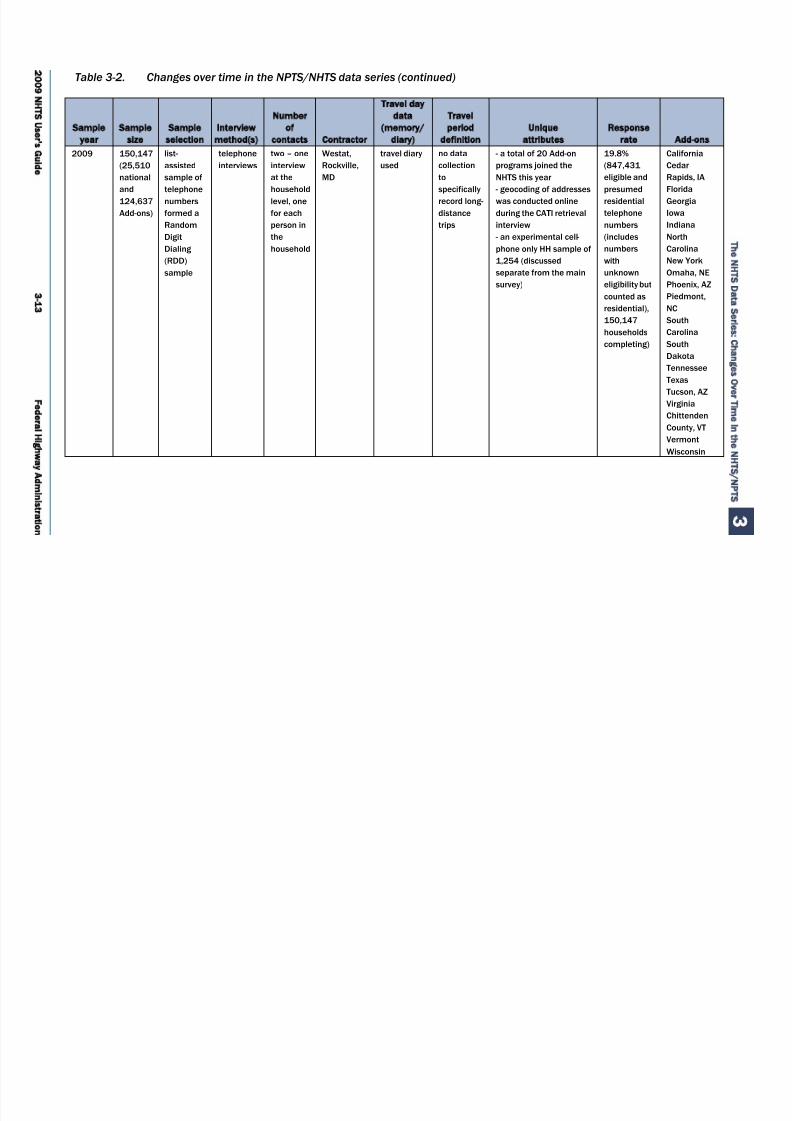
7/29/2019 2009 NATIONAL HOUSEHOLD TRAVEL SURVEY USER’S GUIDE
http://slidepdf.com/reader/full/2009-national-household-travel-survey-users-guide 42/81
T
N
D
aS
e
C
O
Tmen
h
N
N
3
2
N
U
sG
d
31
F
aHgw
A
mins
a
o
Table 3-2. Changes over time in the NPTS/NHTS data series (continued)
Sample
year
Sample
size
Sample
selection
Interview
method(s)
Number
of
contacts Contractor
Travel day
data
(memory/
diary)
Travel
period
definition
Unique
attributes
Response
rate Add-ons
2009 150,147
(25,510
national
and
124,637
Add-ons)
list-
assisted
sample of
telephone
numbers
formed a
Random
Digit
Dialing
(RDD)
sample
telephone
interviews
two – one
interview
at the
household
level, one
for each
person in
the
household
Westat,
Rockville,
MD
travel diary
used
no data
collection
to
specifically
record long-
distance
trips
- a total of 20 Add-on
programs joined the
NHTS this year
- geocoding of addresses
was conducted online
during the CATI retrieval
interview
- an experimental cell-
phone only HH sample of
1,254 (discussed
separate from the main
survey)
19.8%
(847,431
eligible and
presumed
residential
telephone
numbers
(includes
numbers
with
unknown
eligibility but
counted as
residential),
150,147
households
completing)
California
Cedar
Rapids, IA
Florida
Georgia
Iowa
Indiana
North
Carolina
New York
Omaha, NE
Phoenix, AZ
Piedmont,
NC
South
Carolina
South
Dakota
Tennessee
Texas
Tucson, AZVirginia
Chittenden
County, VT
Vermont
Wisconsin

7/29/2019 2009 NATIONAL HOUSEHOLD TRAVEL SURVEY USER’S GUIDE
http://slidepdf.com/reader/full/2009-national-household-travel-survey-users-guide 43/81
2009 NHTS User's Guide 4-1 Federal Highway Administration
Overview
The 2009 NHTS data were collected between March 2008 and May 2009, with travel days of March
28, 2008 through April 30, 2009. As described in Chapter 2, Survey Procedures and Methodology,
there were several stages of data collection for each sampled telephone number. Each sampled
telephone number was screened to determine whether it was or was not a residential household. If
residential, an adult household member was asked a series of questions about the persons and
vehicles of the household. During this recruitment or screener interview, the household was
assigned a travel day for trip reporting and a follow-up appointment to report on their travel.
Following the screener interview, a diary package was prepared and mailed to the household and the
day before their travel day the household received a call reminding them to record their travel the
next day. Immediately after the assigned travel day, interviewers called to conduct the retrieval
interview for each household member who was at least 5 years of age. During the retrieval
interviews, travel information as well as responses to a number of additional questionnaire items was
recorded. A summary of the overall response rates, as well as the rates at key stages of the survey
process are documented in this section.
Note that in most parts of this User’s Guide the first interview with the household is referred to as
the recruitment interview because one important purpose is to recruit the household to participate in
the survey. This first interview serves another significant purpose in the context of survey response
rates, namely to screen the telephone number to insure that it is a working number used by a
household, not by a business or serving group quarters. Because of the primacy of this screening
function in the response rate calculations, the first interview with the household will be referenced as
the screener interview throughout this chapter.
Survey Response Rates 4

7/29/2019 2009 NATIONAL HOUSEHOLD TRAVEL SURVEY USER’S GUIDE
http://slidepdf.com/reader/full/2009-national-household-travel-survey-users-guide 44/81
Survey Response Rates4
2009 NHTS User's Guide 4-2 Federal Highway Administration
Classification of All Telephone Numbers Used
The first step in the calculation of response rates is to classify all telephone numbers in the sample
into residential (in-scope) and non-residential/non-working (out-of-scope) categories. All telephone
numbers fall into three main groups:
In-Scope Numbers – Telephone screening resulted in identifying 441,982 telephonenumbers (16.8%) as residential. Interviewers completed screener interviews with196,699 households (44.5%). A screener interview was considered complete if theinterviewer administered all questions in the screener interview and a travel day wasassigned.
Out-of-Scope Numbers – Over half the telephone numbers in the sample (67.8%) were found to be either non-working or non-residential. Most of these were identifiedin a screening process by the telephone vendor and were not attempted by theinterviewing staff. The remainder of the numbers were identified as out-of-scope as theresult of interviewer call attempts.
Eligibility Unknown Numbers – At the end of data collection, the residency status of 15.4 percent of the sample had not been determined by vendor processing or callattempts. These cases were found to be divided nearly evenly between ring no answers(No Contact – 51.7%) and cases where the interviewer reached an answering machinebut never spoke to anyone at the phone number (No Human Contact – 48.3%).
Table 4-1 presents the final distribution of all telephone numbers in the 2008 NHTS sample at the
household level. The total number of telephone numbers used to achieve the 150,147 completedhousehold interviews was 2,631,599.
Table 4-1. Classification of sampled telephone numbers
Household screener interview classification result Number Percent
In-Scope - Total 441,982 16.80
Completed Household Screener Interviews 196,699 7.47
Refusals 216,089 8.21
Maximum Call Attempts Reached 18,536 0.70
Language or Communication Barrier 10,658 0.41
Out-of-Scope - Total 1,784,168 67.80
Non-working (identified by TRC) 271,780 10.33Non-residential (identified by TRC) 78,387 2.98
Ineligible Other 513 0.02
Non-Residential (identified by vendor) 1,433,488 54.47
Eligibility Unknown - Total 405,449 15.41
No Contact 209,402 7.96
No Human Contact 196,047 7.45
Total Telephone Numbers in Sample 2,631,599 100.00

7/29/2019 2009 NATIONAL HOUSEHOLD TRAVEL SURVEY USER’S GUIDE
http://slidepdf.com/reader/full/2009-national-household-travel-survey-users-guide 45/81
Survey Response Rates4
2009 NHTS User's Guide 4-3 Federal Highway Administration
Table 4-2 presents the distribution of sampled telephone numbers across the three major
classifications for each of the study areas individually.
Table 4-2. Classification of telephone numbers in the sample by study area
In-scope
numbers
Out-of-scope
numbers
Unknown
eligibility
numbers
Total
sampled
numbers
National1 72,465 304,981 67,712 445,158
Phoenix, Arizona 14,215 58,970 14,181 87,366
Tucson, Arizona 6,584 22,883 4,524 33,991
California 63,422 193,207 65,025 321,654
Florida 46,201 219,596 50,655 316,452
Georgia 21,275 105,166 16,472 142,913
Iowa 3,813 20,473 2,434 26,720
Cedar Rapids, Iowa 2,486 10,158 2,160 14,804
Indiana 6,925 30,347 4,522 41,794
Omaha, Nebraska 3,212 18,942 1,920 24,074
New York 44,864 159,520 36,499 240,883
North Carolina 13,871 54,168 8,837 76,876
North Carolina Piedmont 13,008 58,008 8,805 79,821
South Carolina 12,672 47,761 11,694 72,127
Rapid City, South Dakota 1,080 5,203 516 6,799
Sioux Falls, South Dakota 2,154 10,056 1,174 13,384
Tennessee 5,274 21,193 3,517 29,984
Texas 63,798 291,902 68,700 424,400
Vermont (includes Chittenden County) 3,795 13,141 2,339 19,275
Virginia 38,180 126,781 32,297 197,258
Wisconsin 2,688 11,712 1,466 15,866
Total
1Numbers sampled in the National sample will include numbers that are ultimately located in an Add-on region.
Household Screener Interview Response Rate
The overall survey response rate is a product of the response rate for the screener interview and the
response rate for the retrieval interview. In this section we calculate the screener interview response
rates.

7/29/2019 2009 NATIONAL HOUSEHOLD TRAVEL SURVEY USER’S GUIDE
http://slidepdf.com/reader/full/2009-national-household-travel-survey-users-guide 46/81
Survey Response Rates4
2009 NHTS User's Guide 4-4 Federal Highway Administration
In order to calculate the screener interview response rate, it is necessary to estimate the residency
status of the 15.4 percent of telephone numbers in Table 4-1 whose eligibility was unknown at the
conclusion of the household screening. Westat’s methodology to do this is consistent with the
American Association of Public Opinion Research (AAPOR) standards. 4 A good faith effort was
made to estimate the percentage of residential numbers among those whose eligibility was not
determined during the recruitment process. This was accomplished by re-fielding selected sub-
samples of the scope-undetermined numbers. Based on the results of the re-fielding effort, more
specific residency assumptions were assigned to the remaining scope-undetermined numbers. These
enhanced estimates were based on whether or not an address was matched to the telephone number
when sampling originally occurred. When there is an address associated with the telephone number,
the chance of the number being currently residential is much higher. The results were as follows:
1—addressable ring-no-answer numbers: assumed residential percentage 19 percent; 2—
nonaddressable ring-no-answer numbers: assumed residential percentage 3.4 percent; 3— addressable answering-machine-only numbers: assumed residential percentage 75 percent; 4—
nonaddressable answering-machine-only numbers: assumed residential percentage 28 percent. We
applied these findings to the remaining nonresponding telephone numbers. For example, for every
100 addressable ring-no-answer numbers, 19 were assumed to be residential numbers and were
included in the denominator for nonresponse calculations.
The calculation of the weighted response rate is discussed below. Note that, in the context of
response rates, the term “weighted’ does not refer to the household, person and travel day weights
used to expand the NHTS sample to estimates of the universe. In the case of weighted response
rates, the weight used is the inverse of the probability of selection, also called the base weight.
The weighted response rates (weighted using the base weight) are the weighted totals of screened
households divided by the estimated aggregation of total households (including the fixed
percentages from the four types of scope-unknown telephone numbers). The weighted screener
response rate can be written as follows:
= ∑ ∈ ∑ ∈ +∑ +∑ ∈∈+0.19∗∑ ∈ +0.034∗∑ +∈ +0.75∗∑ ∈ +0.28∗∑ ∈
4 Cite http://www.aapor.org/Standard_Definitions/1481.htm.

7/29/2019 2009 NATIONAL HOUSEHOLD TRAVEL SURVEY USER’S GUIDE
http://slidepdf.com/reader/full/2009-national-household-travel-survey-users-guide 47/81
Survey Response Rates4
2009 NHTS User's Guide 4-5 Federal Highway Administration
where BWi is the base weight of the telephone number, COMP are screener completes, REF are
screener refusals, ONR are other nonresponding households, ADDR RNA are addressable ring-no-
answers, NADDR RNA are non-addressable ring-no-answers, ADDR AM are addressable
answering-machine-only, NADDR AM are non-addressable answering-machine-only.
We use weighted rather than unweighted response rates so that disproportionate sampling across a
region does not artificially inflate the response rate. For example, consider one sample area
comprised of two regions, A and B, each region having 1,000 households. In region A 100
households are sampled (1 in 10) and in region B only 10 households are sampled (1 in 100). In
region A, 90 of the 100 sampled households (90%) are respondents. In region B, 5 of the 10
sampled households (50%) are respondents. A simple unweighted response or completion rate for
this sample area would be calculated as 86.4 percent 5 A total of 90 percent of region A’s sample
responded and 50 percent of region B’s sample responded, but since the sample was much larger inregion A, the unweighted mean is 86.4 percent.
For response rates the base weight is the weight. In this example, the base weight for region A is 10
and base weight for region B is 1006. By weighting the households by these base weights, we
effectively blow up region B to its correct population size, which is 50 percent of all households in
the sample area that is comprised of regions A and B. Remember each region has 1,000 households.
The weighted response rate is calculated as 70 percent as shown below.
(10 base weight*90 responding HHs)+(100 base weight*5 responding HHs)/{(10 base weight*100 sampled HHs)+(100 base weight*10 sampled HHs)}
= (900+500)/(1000+1000)
Because each region has 50 percent of the households in the population so each gets 50 percent of
the weighted response rate.
The weighted response rate can be seen as an unbiased estimate of the response rate one would get
if one did a census of the entire population (no sampling): it is the true percentage of responsive
households. The unweighted response rate on the other hand will tend to ‘favor’ the regions that got
the high sampling rates.
5 Take the number of completes (95) divided by the number of sampled households (110) = 86.4 percent.
6 The base weights are the reciprocal of the probably of selection (e.g., 1 in 10 sampled has a base weight of 10).
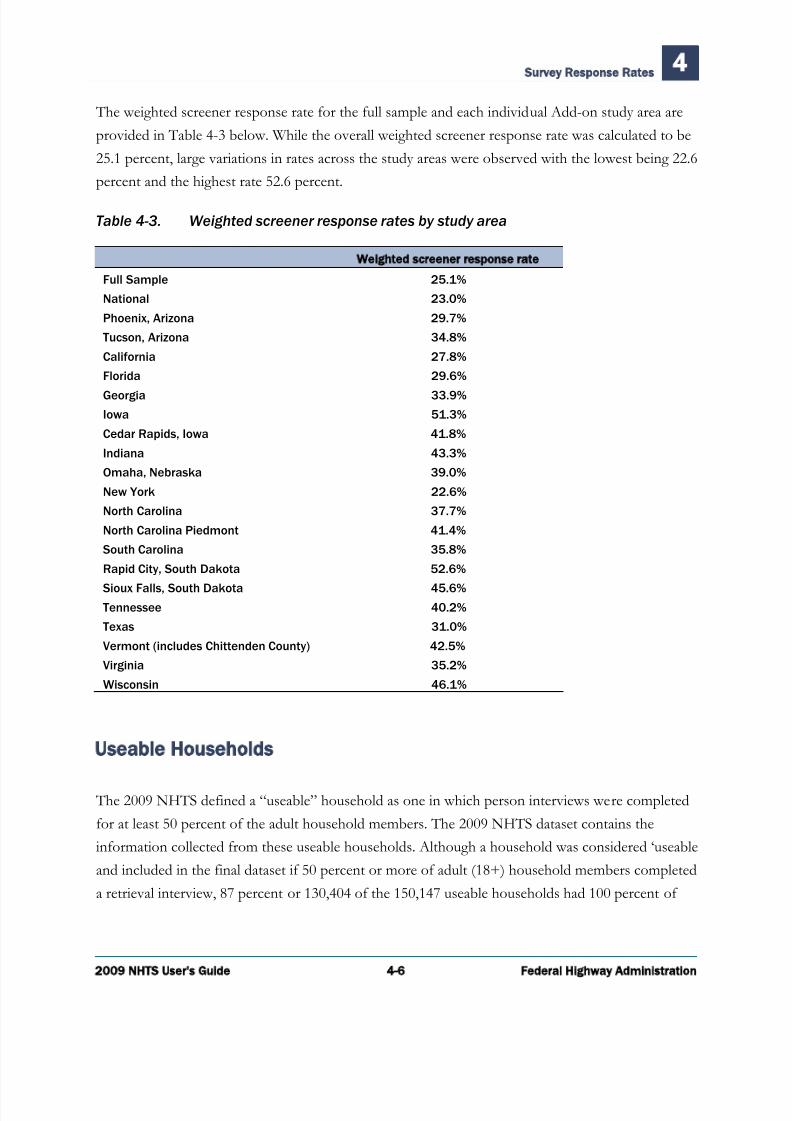
7/29/2019 2009 NATIONAL HOUSEHOLD TRAVEL SURVEY USER’S GUIDE
http://slidepdf.com/reader/full/2009-national-household-travel-survey-users-guide 48/81
Survey Response Rates4
2009 NHTS User's Guide 4-6 Federal Highway Administration
The weighted screener response rate for the full sample and each individual Add-on study area are
provided in Table 4-3 below. While the overall weighted screener response rate was calculated to be
25.1 percent, large variations in rates across the study areas were observed with the lowest being 22.6
percent and the highest rate 52.6 percent.
Table 4-3. Weighted screener response rates by study area
Weighted screener response rate
Full Sample 25.1%
National 23.0%
Phoenix, Arizona 29.7%
Tucson, Arizona 34.8%
California 27.8%
Florida 29.6%
Georgia 33.9%
Iowa 51.3%
Cedar Rapids, Iowa 41.8%
Indiana 43.3%
Omaha, Nebraska 39.0%
New York 22.6%
North Carolina 37.7%
North Carolina Piedmont 41.4%
South Carolina 35.8%
Rapid City, South Dakota 52.6%
Sioux Falls, South Dakota 45.6%Tennessee 40.2%
Texas 31.0%
Vermont (includes Chittenden County) 42.5%
Virginia 35.2%
Wisconsin 46.1%
Useable Households
The 2009 NHTS defined a “useable” household as one in which person interviews were completed
for at least 50 percent of the adult household members. The 2009 NHTS dataset contains the
information collected from these useable households. Although a household was considered ‘useable
and included in the final dataset if 50 percent or more of adult (18+) household members completed
a retrieval interview, 87 percent or 130,404 of the 150,147 useable households had 100 percent of
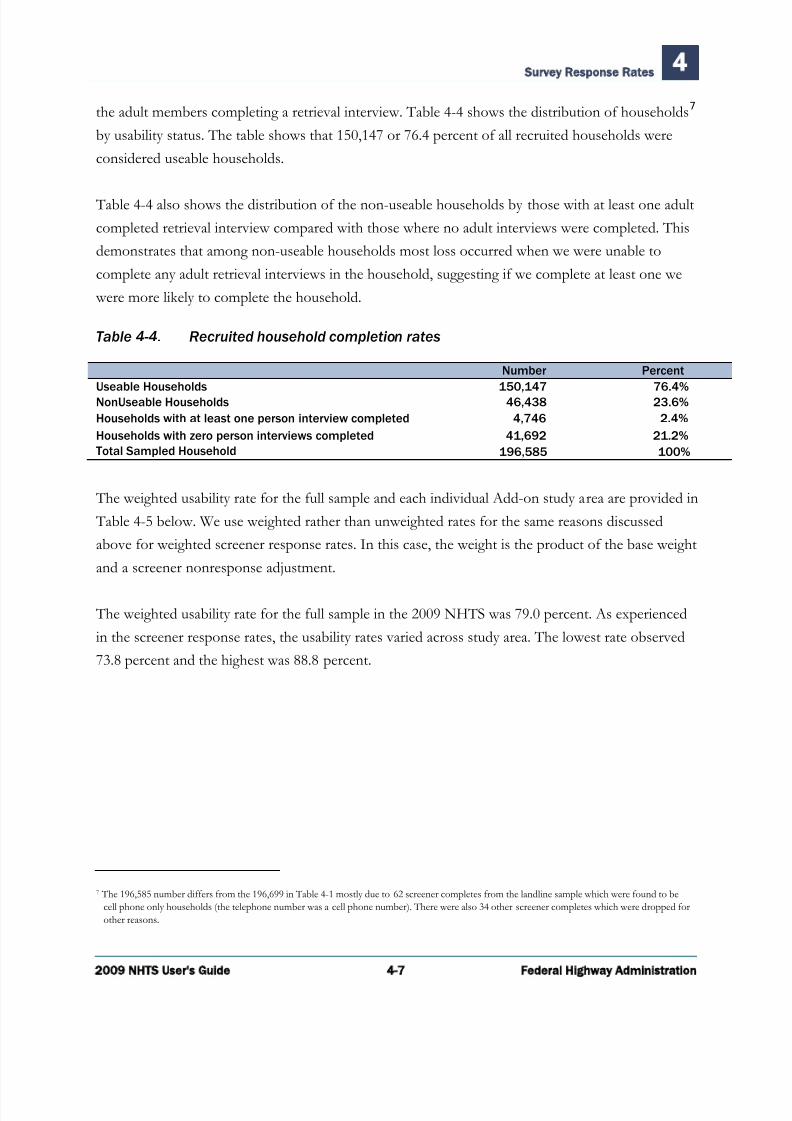
7/29/2019 2009 NATIONAL HOUSEHOLD TRAVEL SURVEY USER’S GUIDE
http://slidepdf.com/reader/full/2009-national-household-travel-survey-users-guide 49/81
Survey Response Rates4
2009 NHTS User's Guide 4-7 Federal Highway Administration
the adult members completing a retrieval interview. Table 4-4 shows the distribution of households7
by usability status. The table shows that 150,147 or 76.4 percent of all recruited households were
considered useable households.
Table 4-4 also shows the distribution of the non-useable households by those with at least one adult
completed retrieval interview compared with those where no adult interviews were completed. This
demonstrates that among non-useable households most loss occurred when we were unable to
complete any adult retrieval interviews in the household, suggesting if we complete at least one we
were more likely to complete the household.
Table 4-4. Recruited household completion rates
Number Percent
Useable Households 150,147 76.4%NonUseable Households 46,438 23.6%
Households with at least one person interview completed 4,746 2.4%
Households with zero person interviews completed 41,692 21.2%
Total Sampled Household 196,585 100%
The weighted usability rate for the full sample and each individual Add-on study area are provided in
Table 4-5 below. We use weighted rather than unweighted rates for the same reasons discussed
above for weighted screener response rates. In this case, the weight is the product of the base weight
and a screener nonresponse adjustment.
The weighted usability rate for the full sample in the 2009 NHTS was 79.0 percent. As experienced
in the screener response rates, the usability rates varied across study area. The lowest rate observed
73.8 percent and the highest was 88.8 percent.
7 The 196,585 number differs from the 196,699 in Table 4-1 mostly due to 62 screener completes from the landline sample which were found to be
cell phone only households (the telephone number was a cell phone number). There were also 34 other screener completes which were dropped for
other reasons.
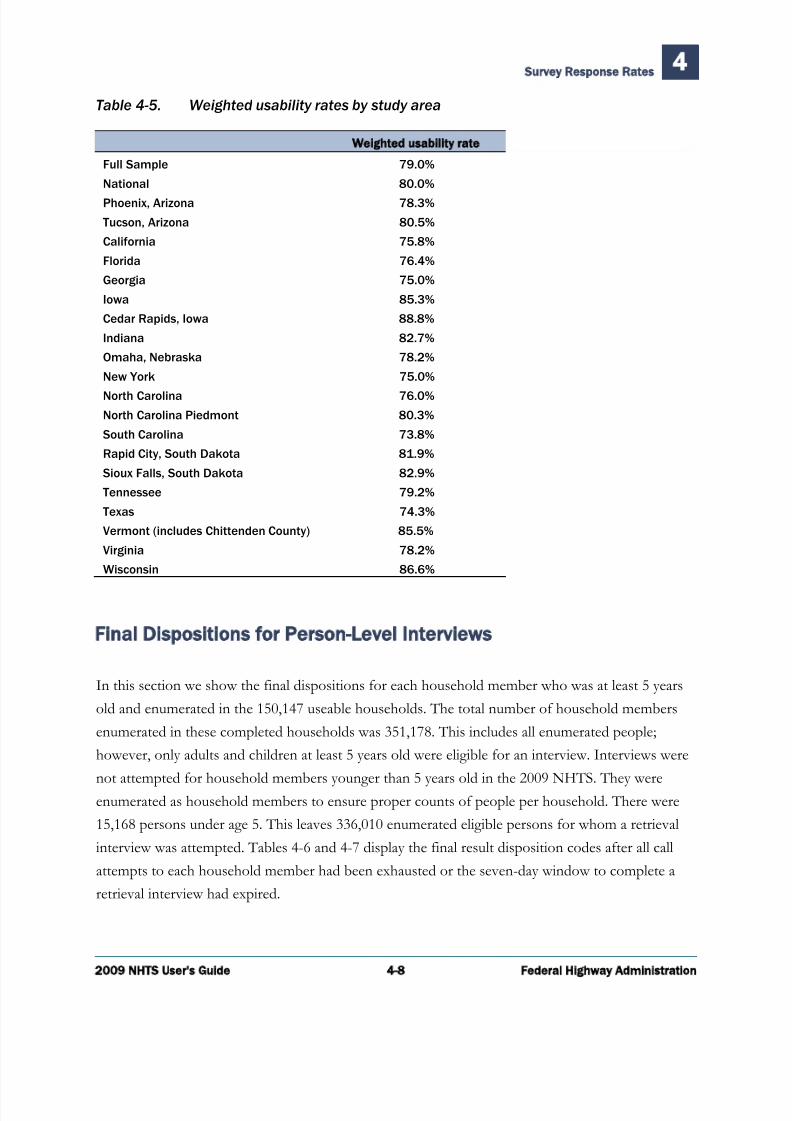
7/29/2019 2009 NATIONAL HOUSEHOLD TRAVEL SURVEY USER’S GUIDE
http://slidepdf.com/reader/full/2009-national-household-travel-survey-users-guide 50/81
Survey Response Rates4
2009 NHTS User's Guide 4-8 Federal Highway Administration
Table 4-5. Weighted usability rates by study area
Weighted usability rate
Full Sample 79.0%
National 80.0%
Phoenix, Arizona 78.3%
Tucson, Arizona 80.5%
California 75.8%
Florida 76.4%
Georgia 75.0%
Iowa 85.3%
Cedar Rapids, Iowa 88.8%
Indiana 82.7%
Omaha, Nebraska 78.2%
New York 75.0%
North Carolina 76.0%
North Carolina Piedmont 80.3%
South Carolina 73.8%
Rapid City, South Dakota 81.9%
Sioux Falls, South Dakota 82.9%
Tennessee 79.2%
Texas 74.3%
Vermont (includes Chittenden County) 85.5%
Virginia 78.2%
Wisconsin 86.6%
Final Dispositions for Person-Level Interviews
In this section we show the final dispositions for each household member who was at least 5 years
old and enumerated in the 150,147 useable households. The total number of household members
enumerated in these completed households was 351,178. This includes all enumerated people;
however, only adults and children at least 5 years old were eligible for an interview. Interviews were
not attempted for household members younger than 5 years old in the 2009 NHTS. They wereenumerated as household members to ensure proper counts of people per household. There were
15,168 persons under age 5. This leaves 336,010 enumerated eligible persons for whom a retrieval
interview was attempted. Tables 4-6 and 4-7 display the final result disposition codes after all call
attempts to each household member had been exhausted or the seven-day window to complete a
retrieval interview had expired.
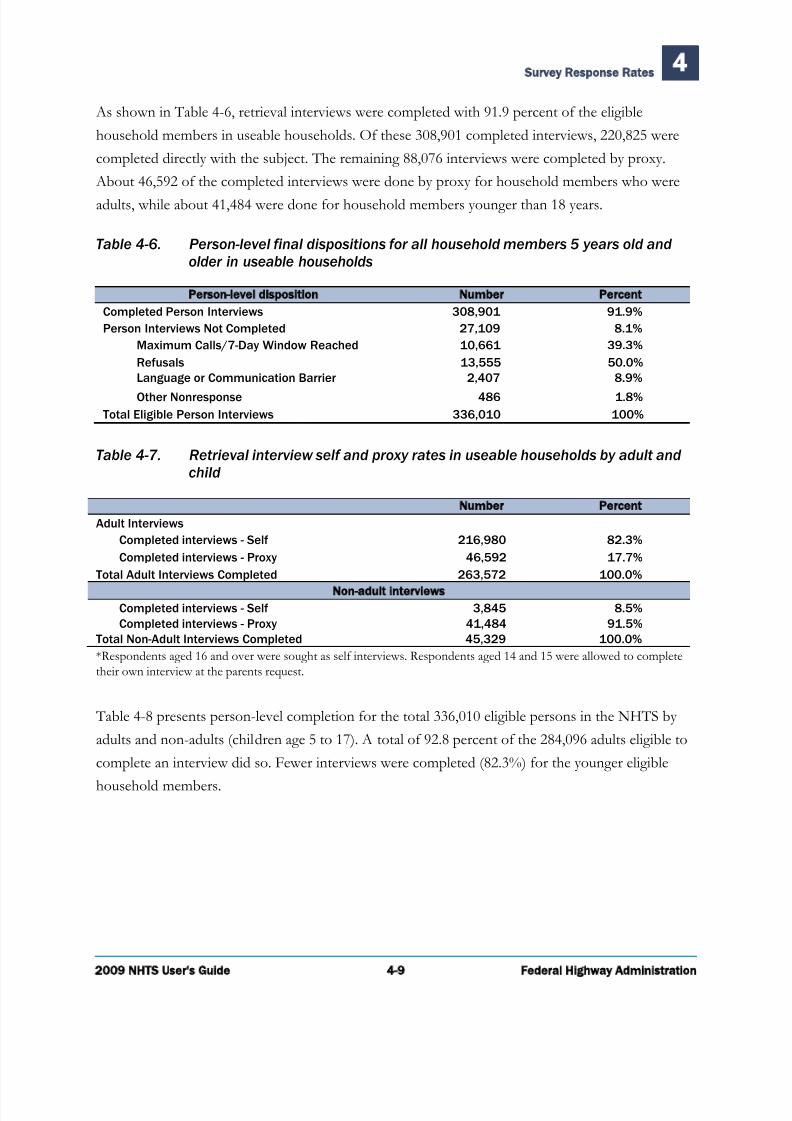
7/29/2019 2009 NATIONAL HOUSEHOLD TRAVEL SURVEY USER’S GUIDE
http://slidepdf.com/reader/full/2009-national-household-travel-survey-users-guide 51/81
Survey Response Rates4
2009 NHTS User's Guide 4-9 Federal Highway Administration
As shown in Table 4-6, retrieval interviews were completed with 91.9 percent of the eligible
household members in useable households. Of these 308,901 completed interviews, 220,825 were
completed directly with the subject. The remaining 88,076 interviews were completed by proxy.
About 46,592 of the completed interviews were done by proxy for household members who were
adults, while about 41,484 were done for household members younger than 18 years.
Table 4-6. Person-level final dispositions for all household members 5 years old and
older in useable households
Person-level disposition Number Percent
Completed Person Interviews 308,901 91.9%
Person Interviews Not Completed 27,109 8.1%
Maximum Calls/7-Day Window Reached 10,661 39.3%
Refusals 13,555 50.0%
Language or Communication Barrier 2,407 8.9%
Other Nonresponse 486 1.8%
Total Eligible Person Interviews 336,010 100%
Table 4-7. Retrieval interview self and proxy rates in useable households by adult and
child
Number Percent
Adult Interviews
Completed interviews - Self 216,980 82.3%
Completed interviews - Proxy 46,592 17.7%
Total Adult Interviews Completed 263,572 100.0%
Non-adult interviews
Completed interviews - Self 3,845 8.5%
Completed interviews - Proxy 41,484 91.5%
Total Non-Adult Interviews Completed 45,329 100.0%
*Respondents aged 16 and over were sought as self interviews. Respondents aged 14 and 15 were allowed to completetheir own interview at the parents request.
Table 4-8 presents person-level completion for the total 336,010 eligible persons in the NHTS by
adults and non-adults (children age 5 to 17). A total of 92.8 percent of the 284,096 adults eligible to
complete an interview did so. Fewer interviews were completed (82.3%) for the younger eligible
household members.

7/29/2019 2009 NATIONAL HOUSEHOLD TRAVEL SURVEY USER’S GUIDE
http://slidepdf.com/reader/full/2009-national-household-travel-survey-users-guide 52/81
Survey Response Rates4
2009 NHTS User's Guide 4-10 Federal Highway Administration
Table 4-8. Person-level final dispositions for all household members 5 years old and
older in useable households by adult and child
Number Percent
Adult Interviews
Completed interviews 263,572 92.8%Non-Completed interviews 20,524 7.2%
Total Adult Interviews Attempted 284,096 100.0%
Non-adult interviews
Completed interviews 45,329 87.3%
Non-Completed interviews 6,585 12.7%
Total Non-Adult Interviews Attempted 51,914 100.0%
Overall Survey Response Rates for Useable Households
In this section we present the overall weighted response rate for the full NHTS sample and each
individual study area. This response rate is the product of the weighted screener response rate as
reported in Table 4-3 and the weighted usability rate as reported in Table 4-5.
Response rates varied greatly across regions with the lowest at 17.0 percent and the highest at
43.8 percent. The range of observed responses rates at the retrieval interview stage was half that of
the recruitment stage, making the variability of the overall rates mostly attributed to the recruitment
rates. Once recruited, households tend to respond at similar rates without respect to region.
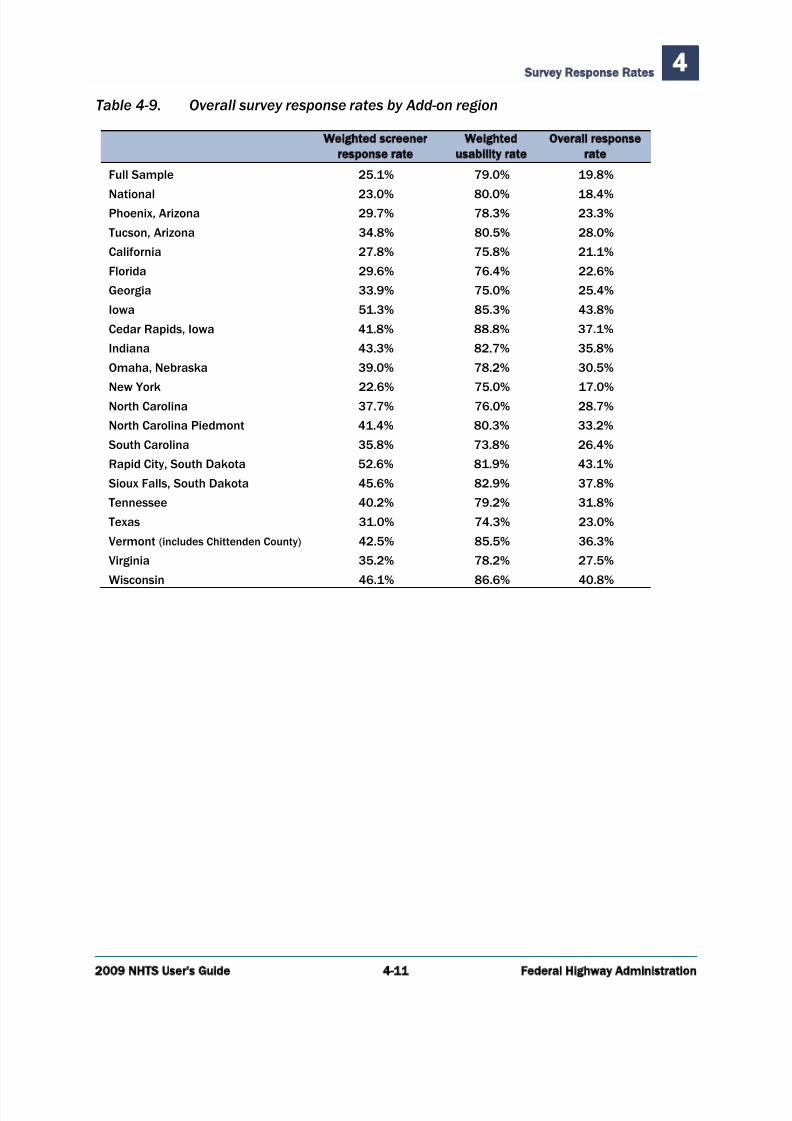
7/29/2019 2009 NATIONAL HOUSEHOLD TRAVEL SURVEY USER’S GUIDE
http://slidepdf.com/reader/full/2009-national-household-travel-survey-users-guide 53/81
Survey Response Rates4
2009 NHTS User's Guide 4-11 Federal Highway Administration
Table 4-9. Overall survey response rates by Add-on region
Weighted screener
response rate
Weighted
usability rate
Overall response
rate
Full Sample 25.1% 79.0% 19.8%
National 23.0% 80.0% 18.4%Phoenix, Arizona 29.7% 78.3% 23.3%
Tucson, Arizona 34.8% 80.5% 28.0%
California 27.8% 75.8% 21.1%
Florida 29.6% 76.4% 22.6%
Georgia 33.9% 75.0% 25.4%
Iowa 51.3% 85.3% 43.8%
Cedar Rapids, Iowa 41.8% 88.8% 37.1%
Indiana 43.3% 82.7% 35.8%
Omaha, Nebraska 39.0% 78.2% 30.5%
New York 22.6% 75.0% 17.0%North Carolina 37.7% 76.0% 28.7%
North Carolina Piedmont 41.4% 80.3% 33.2%
South Carolina 35.8% 73.8% 26.4%
Rapid City, South Dakota 52.6% 81.9% 43.1%
Sioux Falls, South Dakota 45.6% 82.9% 37.8%
Tennessee 40.2% 79.2% 31.8%
Texas 31.0% 74.3% 23.0%
Vermont (includes Chittenden County) 42.5% 85.5% 36.3%
Virginia 35.2% 78.2% 27.5%
Wisconsin 46.1% 86.6% 40.8%

7/29/2019 2009 NATIONAL HOUSEHOLD TRAVEL SURVEY USER’S GUIDE
http://slidepdf.com/reader/full/2009-national-household-travel-survey-users-guide 54/81
2009 NHTS User's Guide 5-1 Federal Highway Administration
Weights are needed to produce valid population-level estimates. Several stages of nonresponse
adjustment and poststratification are done to reduce sampling error and bias. Different weights are
required for households, persons, and travel days. Discussion of which weight to use when is
contained in Chapter 7. Replicate weights are also available for the NHTS, allowing the user to
compute unbiased variance estimates.
The public use dataset contains person and household weights for all “useable” households. Useable
households are households in which retrieval interviews were completed with at least 50 percent of
the adults in the household. The NHTS 2009 database consists of interviews from a total of 150,147
useable households.
Initial Household Weight
The base weight is the reciprocal of the known probability of selection of a telephone number. This
is the probability of selection of the telephone number on the telephone number sampling frame,
which differs by sampling stratum. There is also an added factor for households that indicate thatthey have multiple landline telephone numbers (which are used for answering calls), as these
households have multiple chances of selection which need to be adjusted for.
The first adjustment to the base weight is for nonresponse in attempting to complete the household
interview (screener nonresponse). A special calculation is needed prior to the screener nonresponse
adjustment because it is not possible to determine whether some telephone numbers are residential
or not. This occurs when there are only ring-no-answers on repeated calls (with no evidence that the
number is non-working or business), or when repeated calls only reach an answering machine.
Residency rates for these two situations were determined by computing the results of making
Weight Calculations 5

7/29/2019 2009 NATIONAL HOUSEHOLD TRAVEL SURVEY USER’S GUIDE
http://slidepdf.com/reader/full/2009-national-household-travel-survey-users-guide 55/81
Weight Calculations5
2009 NHTS User's Guide 5-2 Federal Highway Administration
exhaustive extra attempts for a sample of telephone numbers which coded out initially as ring-no-
answer or answering machine. The results of these extra attempts were used to compute four
percentages:
Estimated percentage of residential numbers among ring-no-answers with addressesavailable: 19 percent;
Estimated percentage of residential numbers among ring-no-answers with no addressesavailable: 3.4 percent;
Estimated percentage of residential numbers among answering-machine-only numbers with addresses available: 75 percent; and
Estimated percentage of residential numbers among answering-machine-only numbers with no addresses available: 28 percent.
The numbers ‘with addresses available’ are those in which we had an address provided for the
telephone number from our sampling vendor: these numbers in general have a much greater chance
of being residential numbers at the time of calling.
For the screener nonresponse adjustment, cells were formed with a separate nonresponse
adjustment factor computed for each cell. Characteristics of the telephone exchanges, such as
percentage of listed households by race or by tenure, were examined to determine where response
rates differed8. A search algorithm was used to define cells that were as heterogeneous in response
rate as possible (a set of cells with as different response rates as possible). This allowed us to adjustas well as is possible for the biasing effects of nonresponse, but at the same time giving larger
adjustments to households with a larger propensity to not respond (so that these households are not
underrepresented because of nonresponse). The search algorithm generated a tree of response cells
by a sequence of next-best binary splits. Each split in the sequence checks all the cells on the tree at
that point, and finds the best existing cell to split in terms of getting two new cells with response
rates as different as possible (using the exchange characteristics available to define splits). Cells with
too-small sample sizes or too-extreme nonresponse adjustments are avoided. The exchange-level
variables which defined the cells are given in the Weighting Report.
8 Other examples of characteristics available from the telephone exchanges are Median Income in the exchange, Median Years of Education in the
exchange and Percentage of College Graduates in the exchange.

7/29/2019 2009 NATIONAL HOUSEHOLD TRAVEL SURVEY USER’S GUIDE
http://slidepdf.com/reader/full/2009-national-household-travel-survey-users-guide 56/81
Weight Calculations5
2009 NHTS User's Guide 5-3 Federal Highway Administration
The next weight adjustment is for interviewed households that have more than one residential
telephone line. Such households have a higher probability of selection and thus received a reduced
weight.
The weight consisting of the product of the base weight, the household screener nonresponse
adjustment, and the multiple phone adjustment is called the "initial household weight." This weight
is the starting point for all of the different weights defined below, and is used itself in certain types
of analyses which only require information from the household screener.
Useable Household Weight
To get the "useable household weight," a nonresponse adjustment was applied to the initialhousehold weight. The respondents in this case were those screener respondent households who
were also useable, and the nonrespondents were those screener respondent households who were
not useable (had fewer than half of the adults in the household completing a travel interview).
Information on characteristics collected in the household screener interview, as well as the
information available from the telephone exchanges, was available for determining nonresponse
adjustment cells at this level. As in the initial household weight nonresponse adjustment, a search
algorithm was used to determine the best definition of cells (the most heterogeneous cells in terms
of the criterion of usability). Variables used in the usability nonresponse adjustment are given in the
Weighting Report.
The next step is a composition step. The base weights, screener nonresponse adjustments, and
usability nonresponse adjustments are all defined within the original sampling strata. These sampling
strata are defined by a set of telephone exchanges corresponding to a geographic area (usually a state
or county or a set of counties), and are from a telephone exchange frame for a particular time period
(usually three months). The final domains are also geographic areas and time periods, but they are
not the same as the sampling strata. The geographic domains are defined by geocoding of the
addresses (which may indicate they are not in the geographic domain which is primarily served by the telephone exchanges included in the household’s sampling stratum). The time domains are
defined in terms of the travel dates for the travel interviews, which may be ‘early’ or ‘late’ for a
particular sample group. Sampled telephone numbers are released in packets (in randomized order),
and within these packets households may be recruited quickly (receiving a relatively earlier travel
7/29/2019 2009 NATIONAL HOUSEHOLD TRAVEL SURVEY USER’S GUIDE
http://slidepdf.com/reader/full/2009-national-household-travel-survey-users-guide 57/81
Weight Calculations5
2009 NHTS User's Guide 5-4 Federal Highway Administration
date), or may require considerable calls to be recruited (receiving a relatively later travel date). Thus
two households from the same sample may end up with travel dates months apart.
The compositing step takes a domain (a geographic area and a particular time period) and maps into
it all of the sampling strata contributing to it. Each sampling strata then is assumed to be a separate
unbiased estimator for the domain. The compositing factor for the sampling strata within the
domain is based on relative effective sample size (sample size adjusted for a simple design effect9 ).
For example, suppose there are two sampling strata covering a domain with sample sizes 100 and 50
and effective sample sizes of 80 and 45. Then the composite factors will be 80/125 and 45/125
respectively. The denominator becomes the sum of the two effective sample sizes. The composite
weight is the useable household weight multiplied to the appropriate composite weighting factor.
The next step was to take the composite weights and to adjust them to be consistent withindependent controls for the domains based on various demographic categories, in a process called
raking. This reduces the variances for any characteristics which are correlated to these demographic
characteristics (as the independent controls have much lower variability). The source for these
controls was the 2008 American Community Survey (ACS), and the controls consisted of attributes
such as: geography, race, ethnicity and number of household vehicles. For a full accounting of the
raking process and the variables and control totals for each domain, see the Weighting Report.
Weights were first adjusted to assure agreement on the first raking dimension, then weights were
adjusted for the second raking dimension, then for the third, etc. Then the process was repeated,
again assuring agreement with each of the raking dimensions. The process continued to be repeated,
with iterative controlling to each variable, until simultaneously close agreement for each variable was
obtained. In addition to variables for which ACS data was used, it was desired to ensure equal
contributions for each of the seven days of the week and to obtain appropriate contributions by
month in which the travel day occurred. The Weighting Report provides details of the actual
dimensions used.
9 The simple design effect used was the Kish factor 1 +CV 2, where CV is the coefficient of variation of the weights. See for example Kish (1992),
“Weighting for Unequal Pi”, Journal of Official Statistics 8, 183-200.

7/29/2019 2009 NATIONAL HOUSEHOLD TRAVEL SURVEY USER’S GUIDE
http://slidepdf.com/reader/full/2009-national-household-travel-survey-users-guide 58/81
Weight Calculations5
2009 NHTS User's Guide 5-5 Federal Highway Administration
Person and Travel Day Weights
The starting point for person weights for useable households is the initial household weight. Each
person in the household receives the household weight as their initial weight, as there is no
subsampling of persons within households.
An adult-level and child-level nonresponse adjustment was done within each useable household, so
that the completed adult and child interviews could represent adults and children in useable
households with no completed interviews. Nonresponse cells were defined across households. The
binary search algorithm discussed in earlier was again used to determine the best set of adult-level
and child-level cells (cells based on characteristics known of both respondents and nonrespondents
which are as heterogeneous in response rate as is possible). Variables used in this nonresponse
adjustment process are given in the Weighting Report.
The final step for this person weight was to control survey estimates to person-level control totals
from the 2008 Census county-level and ACS estimates. The Weighting Report has the control totals
and the average adjustment factors for each category used in this weighting step.
Special Weights for Travel to School Questions – Children aged 5 to 15 were eligible for a
special questionnaire section on how they get to school. This was administered to a subsample of
one eligible child per household. An extra set of weights (SFWGT) is available which includes the
inverse of this subsampling factor, and this set of weights should be used for this questionnaire
section.
Travel Day Weights – Travel day weights are simple functions of the person weights, modified
only for the purpose of producing annual estimates of the number of trips. The "useable households
travel day weight" is simply equal to the final useable household person weight multiplied by 365.
Vehicle Weights – Each vehicle in the household should receive the useable household-level
weight, as every vehicle in the household is automatically part of the sample.

7/29/2019 2009 NATIONAL HOUSEHOLD TRAVEL SURVEY USER’S GUIDE
http://slidepdf.com/reader/full/2009-national-household-travel-survey-users-guide 59/81
Weight Calculations5
2009 NHTS User's Guide 5-6 Federal Highway Administration
Replicate Weights
Provided with the final weights at each level (household, person, special child, vehicle) is a set of 100
replicate weights. The 100 replicate weights are generated using a Jackknife procedure (for each
replicate a mutually exclusive and exhaustive 1/100th part of the sample is deleted, and the remaining
99/100 sample reweighted). Any estimate can be computed using each replicate weight in place of
the main weight. The sum of squared differences between these replicate estimates and the full-
sample weight estimate provides an unbiased estimator of variance. These replicate variances will
include all components of variance, including the increase in variance from the nonresponse
adjustments, and the decrease in variance from the poststratification to external control totals, as the
replicate weights carefully incorporate all of these adjustments. The replicate weights are not on the
downloadable 2009 NHTS Public Use dataset, they are available on the website as a separate file.
Software such as SUDAAN, WESVARPC, and the most recent version of SAS (9.2) can allow for
easy computation of replicate variance estimates.

7/29/2019 2009 NATIONAL HOUSEHOLD TRAVEL SURVEY USER’S GUIDE
http://slidepdf.com/reader/full/2009-national-household-travel-survey-users-guide 60/81
2009 NHTS User's Guide 6-1 Federal Highway Administration
Structure of the Data Files
The 2009 NHTS Public Use Data, Version 2, is organized into four different data files, which are
available to users in SAS, ASCII, or DBF formats. Table 6-1 illustrates the structure of the four files,
with a description of which data are included in each file, the applicable questionnaire sections, the
record level, and the variables that are needed to uniquely identify a record (ID variables).
The file variables are identified by the variable name in the SAS versions. For each file variable, the
Codebook contains:
1. The variable name,
2. The label, which is a brief description of the variable content,
3. The variable type (character or numeric),
4. The variable length,
5. The section and item number of the questionnaire or other source of the data,
6. Value ranges and special codes,
7. The unweighted frequency of responses for each value or code shown, and
8. The weighted frequency of responses for each value or code shown.
The Data Dictionary provides an alphabetical listing of all NHTS variables, regardless of their file
location. This is document is most useful when you have a variable name and are trying to find out
more about what is contained in the variable. Like the Codebook, the Data Dictionary contains the
variable name, the description of the variable content, the questionnaire number or other source of the data, variable type, length and location in terms of the four NHTS files.
Description of Data Files 6
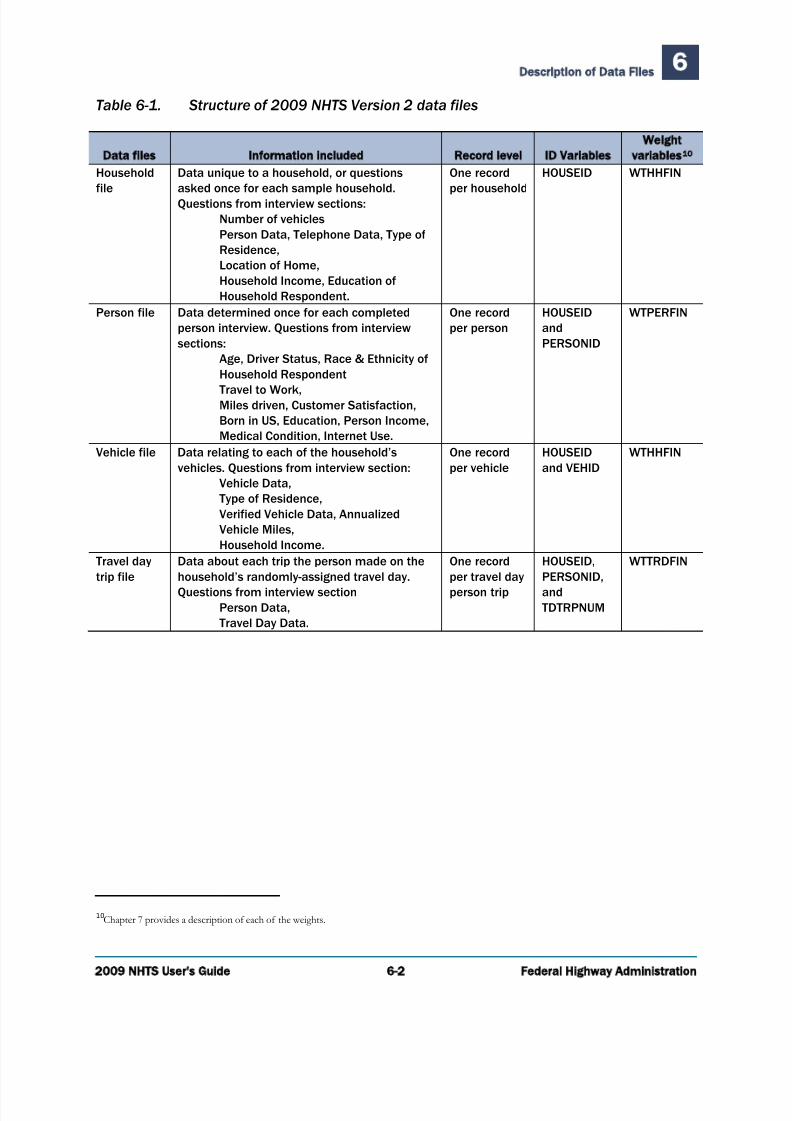
7/29/2019 2009 NATIONAL HOUSEHOLD TRAVEL SURVEY USER’S GUIDE
http://slidepdf.com/reader/full/2009-national-household-travel-survey-users-guide 61/81
Description of Data Files6
2009 NHTS User's Guide 6-2 Federal Highway Administration
Table 6-1. Structure of 2009 NHTS Version 2 data files
Data files Information included Record level ID Variables
Weight
variables10
Household
file
Data unique to a household, or questions
asked once for each sample household.
Questions from interview sections:
Number of vehicles
Person Data, Telephone Data, Type of
Residence,
Location of Home,
Household Income, Education of
Household Respondent.
One record
per household
HOUSEID WTHHFIN
Person file Data determined once for each completed
person interview. Questions from interview
sections:
Age, Driver Status, Race & Ethnicity of
Household Respondent
Travel to Work,Miles driven, Customer Satisfaction,
Born in US, Education, Person Income,
Medical Condition, Internet Use.
One record
per person
HOUSEID
and
PERSONID
WTPERFIN
Vehicle file Data relating to each of the household’s
vehicles. Questions from interview section:
Vehicle Data,
Type of Residence,
Verified Vehicle Data, Annualized
Vehicle Miles,
Household Income.
One record
per vehicle
HOUSEID
and VEHID
WTHHFIN
Travel day
trip file
Data about each trip the person made on the
household’s randomly-assigned travel day.
Questions from interview section
Person Data,
Travel Day Data.
One record
per travel day
person trip
HOUSEID,
PERSONID,
and
TDTRPNUM
WTTRDFIN
10 Chapter 7 provides a description of each of the weights.
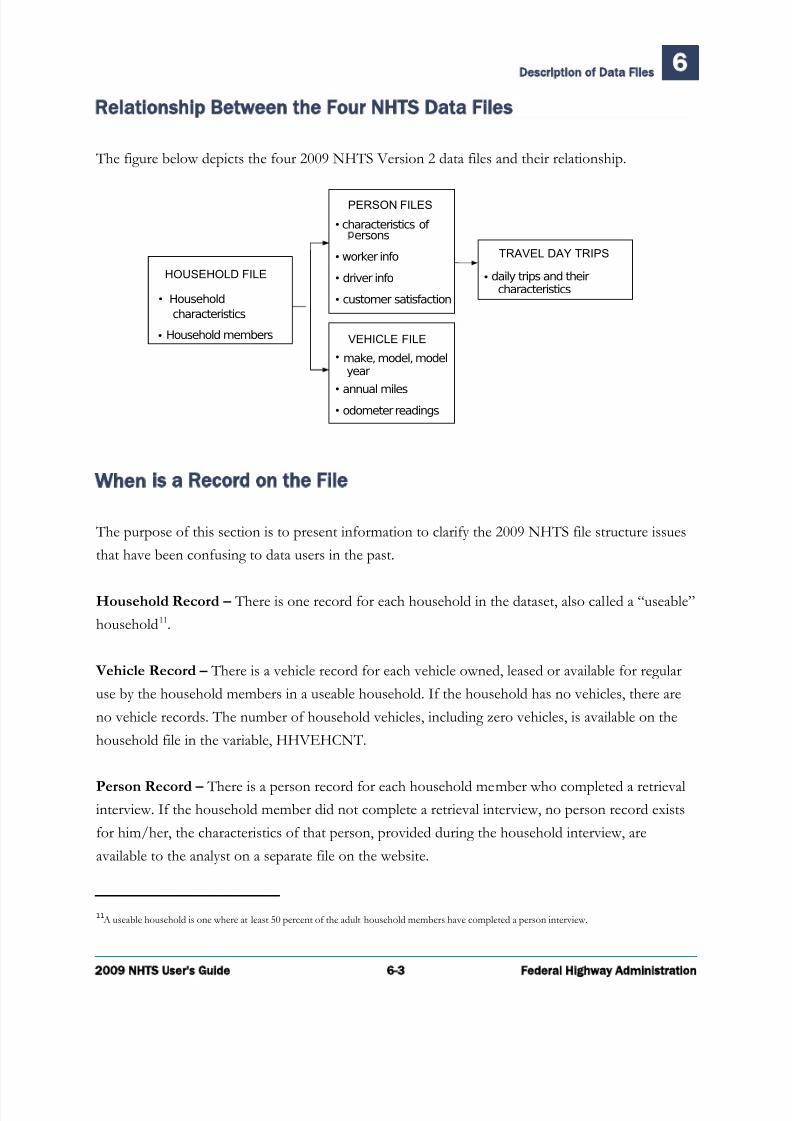
7/29/2019 2009 NATIONAL HOUSEHOLD TRAVEL SURVEY USER’S GUIDE
http://slidepdf.com/reader/full/2009-national-household-travel-survey-users-guide 62/81
Description of Data Files6
2009 NHTS User's Guide 6-3 Federal Highway Administration
Relationship Between the Four NHTS Data Files
The figure below depicts the four 2009 NHTS Version 2 data files and their relationship.
HOUSEHOLD FILE
• Household
characteristics
• Household members
PERSON FILES
• characteristics of ersons
• worker info
• driver info
• customer satisfaction
VEHICLE FILE
• make, model, modelyear
•
annual miles• odometer readings
TRAVEL DAY TRIPS
• daily trips and theircharacteristics
When is a Record on the File
The purpose of this section is to present information to clarify the 2009 NHTS file structure issues
that have been confusing to data users in the past.
Household Record – There is one record for each household in the dataset, also called a “useable”
household11.
Vehicle Record – There is a vehicle record for each vehicle owned, leased or available for regular
use by the household members in a useable household. If the household has no vehicles, there are
no vehicle records. The number of household vehicles, including zero vehicles, is available on the
household file in the variable, HHVEHCNT.
Person Record – There is a person record for each household member who completed a retrievalinterview. If the household member did not complete a retrieval interview, no person record exists
for him/her, the characteristics of that person, provided during the household interview, are
available to the analyst on a separate file on the website.
11A useable household is one where at least 50 percent of the adult household members have completed a person interview.
7/29/2019 2009 NATIONAL HOUSEHOLD TRAVEL SURVEY USER’S GUIDE
http://slidepdf.com/reader/full/2009-national-household-travel-survey-users-guide 63/81
Description of Data Files6
2009 NHTS User's Guide 6-4 Federal Highway Administration
Travel Day Trip Record – There is a trip record for each trip taken by an interviewed person in a
useable household. If the person made no trips on their travel day, the person file variable,
SAMEPLC, i.e., “stayed in the same place all day?”, would confirm that they were interviewed for
travel day and reported no trips.
In earlier NHTSs, before “stayed in same place all day?” was asked, data users assumed that the lack
of a travel day trip record for a respondent meant that person was not interviewed for their travel
day travel. This was not true for the 1990, 1995, and 2001 surveys. If there is a person record for
that person, they were interviewed for the details of their travel day. Note that about 12 percent of
the 60,282 persons in useable households in the 2009 NHTS reported no travel day trips. Not
surprisingly, more of the “stayed at home” days fall on a weekend. Of all persons who did not make
a trip on their travel day, 20 percent had Saturday as their travel day and 18 percent had Sunday.
While some of these non-travelling people may be “soft refusals” who did not want to botherreporting their trips, many of them are legitimate non-travelers. Remember that the NHTS travel
days encompass all 365 days of the year, including holidays and weekends.
Household Member Variables
For the 2009 NHTS, the characteristics of all household members, whether interviewed or not, are
available on a separate file on the website. These characteristics were included to allow the user to
address a number of travel behavior and survey method research issues. They provide the full profile
of the household and allow users to know the characteristics of those household members who
completed the person interview and those who did not. The information provided for each
household member includes:
Age, Driver status, Relationship to Household Respondent, Sex,
Person interview response status, i.e., whether a retrieval interview was completed, etc.and Worker status.

7/29/2019 2009 NATIONAL HOUSEHOLD TRAVEL SURVEY USER’S GUIDE
http://slidepdf.com/reader/full/2009-national-household-travel-survey-users-guide 64/81
Description of Data Files6
2009 NHTS User's Guide 6-5 Federal Highway Administration
Codebook
There are four sections of the Codebook, one for each file: Household, Person, Vehicle and Travel
Day. The Codebook contains eight items of information about each variable in each of the files.
Table 6-2 lists the items that are arranged in the Codebook in column format with a brief
description of the contents of each column. The document entitled Derived Variables Descriptions
provides additional detail on how each of the derived variables in the dataset was created.
As an example, the Codebook entries for the variable EVERDROV are detailed below:
Name – EVERDROV
Label – Has been a driver in the past
Note that this variable was added to collect information on the mobility impacts of olderdrivers giving up their licenses.
Type – C
C= character variable, typically used for questions that have a coded answer such a 01= Yes,02=No. An N in this field denotes a numeric variable that can be used in arithmeticcalculations, such as average trip length.
Length – 2 this is a two-position variable. (Note that unless a variable required more than2 positions, the default value in the NHTS dataset is 2 positions.)
Question – C8
This refers to the question number on the 2009 NHTS Questionnaire. A DV code followedby a number refers to the fact that this was a Derived Variable, i.e., some information notdirectly asked but recoded from information asked in the interviewed or provided from anoutside source, such as the sample frame. The number following DV indicates which derived variable it is.
Code/Range – Either lists all possible values of the variable, a range of the values, or acombination of the two. For this variable it is:
-1 Appropriate Skip (The respondent currently being a driver or was not of driving age16+, so they were not asked this question)
-7 Refused (The respondent refused to answer, as differentiated from Don’t Know. This is used more often on sensitive questions, such as income.)
-8 Don’t Know (The respondent did not know the answer. For this type of question,typically this would occur in a proxy interview).
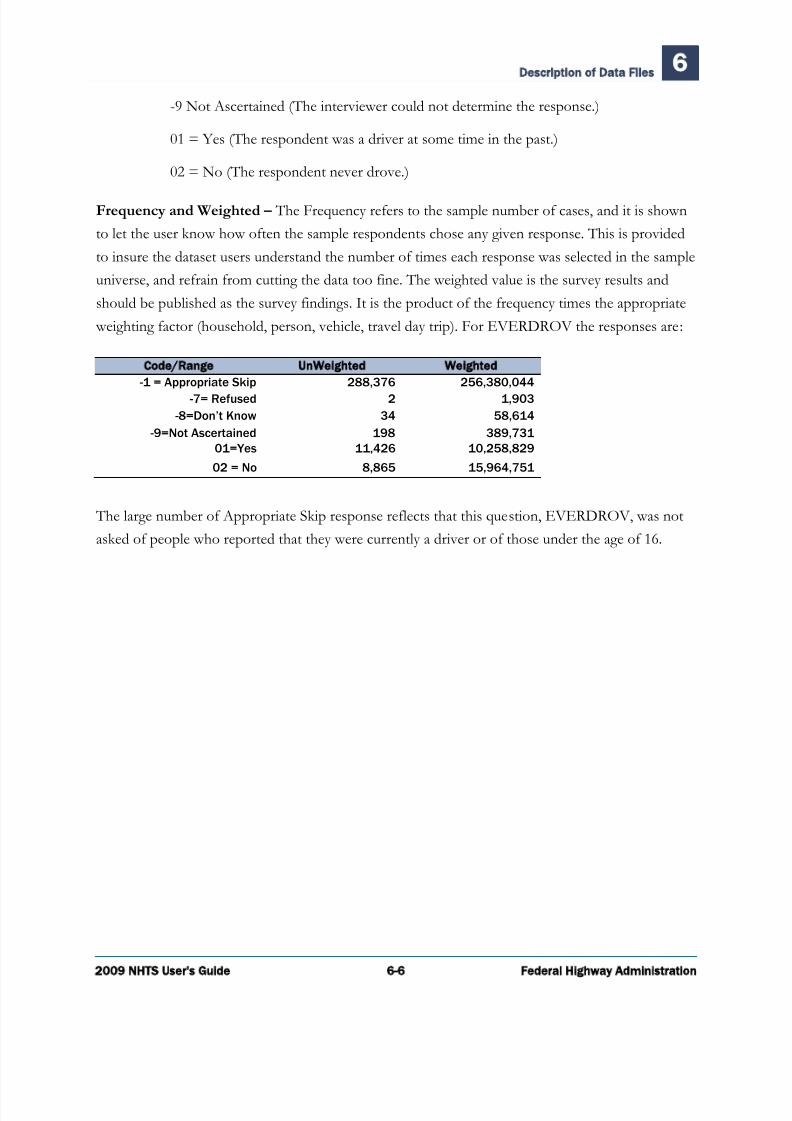
7/29/2019 2009 NATIONAL HOUSEHOLD TRAVEL SURVEY USER’S GUIDE
http://slidepdf.com/reader/full/2009-national-household-travel-survey-users-guide 65/81
Description of Data Files6
2009 NHTS User's Guide 6-6 Federal Highway Administration
-9 Not Ascertained (The interviewer could not determine the response.)
01 = Yes (The respondent was a driver at some time in the past.)
02 = No (The respondent never drove.)
Frequency and Weighted – The Frequency refers to the sample number of cases, and it is shown
to let the user know how often the sample respondents chose any given response. This is provided
to insure the dataset users understand the number of times each response was selected in the sample
universe, and refrain from cutting the data too fine. The weighted value is the survey results and
should be published as the survey findings. It is the product of the frequency times the appropriate
weighting factor (household, person, vehicle, travel day trip). For EVERDROV the responses are:
Code/Range UnWeighted Weighted
-1 = Appropriate Skip 288,376 256,380,044
-7= Refused 2 1,903
-8=Don’t Know 34 58,614
-9=Not Ascertained 198 389,731
01=Yes 11,426 10,258,829
02 = No 8,865 15,964,751
The large number of Appropriate Skip response reflects that this question, EVERDROV, was not
asked of people who reported that they were currently a driver or of those under the age of 16.

7/29/2019 2009 NATIONAL HOUSEHOLD TRAVEL SURVEY USER’S GUIDE
http://slidepdf.com/reader/full/2009-national-household-travel-survey-users-guide 66/81
Description of Data Files6
2009 NHTS User's Guide 6-7 Federal Highway Administration
Table 6-2. Contents of the 2009 NHTS Codebook
Column heading Description of contents
Example variable
(from person file)
Name The variable name EVERDROV
Variable Type C = Character; N = Numeric C
Variable Length Maximum variable length 2
Variable Label Short description of the variable Has been a driver in the past
Question Number Source item(s) in the questionnaire
section
C8
Value Range & Codes Either lists all possible values of the
variable, a range of the values, or a
combination of the two
01 = YES
02= NO
-1 = Legitimate skip
-7 = Refused
-8 = Don’t know
-9 = Not ascertained
Unweighted Frequencies Shows the number of records in the file
for each listed value
01 = 11,426
02 = 8,865
-1 = 288,376 -7 = 2
-8 = 34
-9 = 198
Weighted Frequencies Shows the corresponding weight for
each listed value for the variable
01 = 10,258,829
02 = 15,964,751
-1 =256,380,044
-7 = 1,903
-8 = 58,614
-9 = 389,731
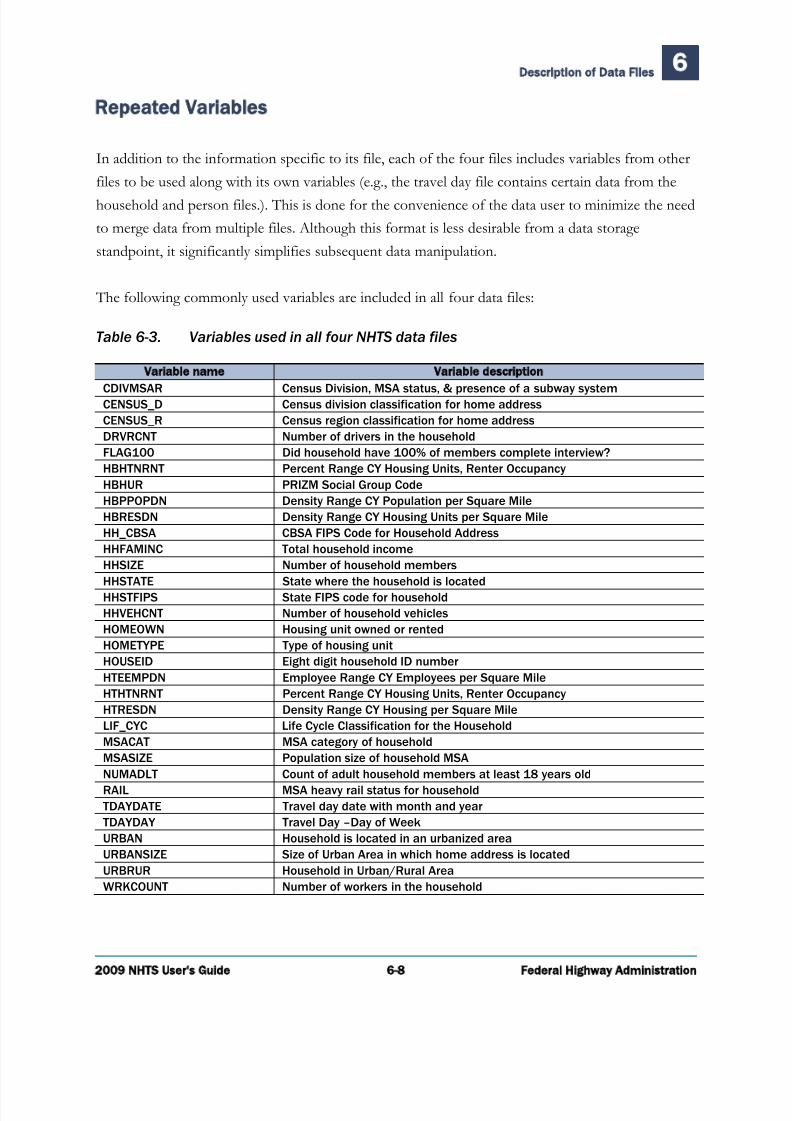
7/29/2019 2009 NATIONAL HOUSEHOLD TRAVEL SURVEY USER’S GUIDE
http://slidepdf.com/reader/full/2009-national-household-travel-survey-users-guide 67/81
Description of Data Files6
2009 NHTS User's Guide 6-8 Federal Highway Administration
Repeated Variables
In addition to the information specific to its file, each of the four files includes variables from other
files to be used along with its own variables (e.g., the travel day file contains certain data from the
household and person files.). This is done for the convenience of the data user to minimize the need
to merge data from multiple files. Although this format is less desirable from a data storage
standpoint, it significantly simplifies subsequent data manipulation.
The following commonly used variables are included in all four data files:
Table 6-3. Variables used in all four NHTS data files
Variable name Variable description
CDIVMSAR Census Division, MSA status, & presence of a subway systemCENSUS_D Census division classification for home address
CENSUS_R Census region classification for home address
DRVRCNT Number of drivers in the household
FLAG100 Did household have 100% of members complete interview?
HBHTNRNT Percent Range CY Housing Units, Renter Occupancy
HBHUR PRIZM Social Group Code
HBPPOPDN Density Range CY Population per Square Mile
HBRESDN Density Range CY Housing Units per Square Mile
HH_CBSA CBSA FIPS Code for Household Address
HHFAMINC Total household income
HHSIZE Number of household members
HHSTATE State where the household is located
HHSTFIPS State FIPS code for household
HHVEHCNT Number of household vehicles
HOMEOWN Housing unit owned or rented
HOMETYPE Type of housing unit
HOUSEID Eight digit household ID number
HTEEMPDN Employee Range CY Employees per Square Mile
HTHTNRNT Percent Range CY Housing Units, Renter Occupancy
HTRESDN Density Range CY Housing per Square Mile
LIF_CYC Life Cycle Classification for the Household
MSACAT MSA category of household
MSASIZE Population size of household MSA
NUMADLT Count of adult household members at least 18 years old
RAIL MSA heavy rail status for household
TDAYDATE Travel day date with month and year
TDAYDAY Travel Day –Day of Week
URBAN Household is located in an urbanized area
URBANSIZE Size of Urban Area in which home address is located
URBRUR Household in Urban/Rural Area
WRKCOUNT Number of workers in the household

7/29/2019 2009 NATIONAL HOUSEHOLD TRAVEL SURVEY USER’S GUIDE
http://slidepdf.com/reader/full/2009-national-household-travel-survey-users-guide 68/81
Description of Data Files6
2009 NHTS User's Guide 6-9 Federal Highway Administration
Derived Variables
Numerous derived variables were created during the development of the four public use files of the
dataset for the 2009 survey. These variables are included in the document entitled Derived Variables
Descriptions, which provides documentation on how each of the variables was derived. These
variables are considered derived as they do not appear in the survey questionnaire and therefore no
data was stored in these variables during data collection. The variables were derived by:
Renaming a questionnaire variable to match names used during the 2001 NHTS or new names provided by FHWA,
Calculating the variable from one or more variables in the questionnaires to providesummary variables to aid data users,
Obtaining the variable from external sources to provide additional descriptors, or
Creating flag variables to identify data records that have been edited or imputed.
Trip Purpose Categories (WHYTO, WHYTRP90 and TRIPPURP)
The 2009 NHTS has several variables that describe the trip purpose, which are divided into two
coding schemes, referred to here as ‘one-way’ and ‘round-trip’ purposes. The one-way scheme used
in collecting the 2009 data uses ‘return home’ as a trip purpose. This one-way scheme, instituted in
the 1995 NPTS and used in both the 2001 and 2009 NHTS, allows for a way to analyze trip chaining
and enable a better recode to trip purposes used in the transportation modeling process. The round-
trip purposes will be particularly useful for analyses comparing the 2009 data across the NHTS time
series data.
For each trip, the data set includes the following variables:
WHYTO – the one-way purpose for the trip (why the traveler went to the tripdestination)
WHYFROM – the one-way purpose for the previous trip (why the traveler was at thetrip origin)
WHYTRP90 – the round-trip purpose
TRIPPURP – the trip purpose scheme used by transportation planners (e.g., HBW =home based-work, etc.)

7/29/2019 2009 NATIONAL HOUSEHOLD TRAVEL SURVEY USER’S GUIDE
http://slidepdf.com/reader/full/2009-national-household-travel-survey-users-guide 69/81
Description of Data Files6
2009 NHTS User's Guide 6-10 Federal Highway Administration
The 2009 one-way trip purpose uses a “from-to” format, while the round-trip purposes were based
on coding a “main reason” for the trip. The rules used to convert the collected one-way purposes to
the WHYTRP90 round-trip purposes are:
A trip “to home” after completing an activity is categorized as “return home” in theone-way 2009 purposes. (WHYTO) while the round-trip purpose (WHYTRP90) wasassigned to the activity that was the main reason the subject was away from home,
In the round-trip scheme if one of the purposes was work, the return trip home wasassigned a work purpose, even if there were incidental trips made on the way home, and
In the round-trip scheme, if there were multiple purposes for being away from homeand work was not one of them, the activity the person spent the most time at whileaway from home was assigned as the main purpose for the return trip home. The variable, DWELTIME, was used to determine this.
7/29/2019 2009 NATIONAL HOUSEHOLD TRAVEL SURVEY USER’S GUIDE
http://slidepdf.com/reader/full/2009-national-household-travel-survey-users-guide 70/81
2009 NHTS User's Guide 7-1 Federal Highway Administration
Travel Concepts
The following travel concepts are central to using the NHTS Travel Day data and are provided
primarily for data users who are not familiar with household travel survey data. However, these may
also be useful to the transportation planning professional because the use of certain travel terms and
concepts often vary by individual survey.
Person Trip
Definition – A trip by one person in any mode of transportation. This is the most basicand universal measure of personal travel. Each record in the Travel Day file in theNHTS dataset represents one person trip.
Example – Two household members travelling together in one car are counted as twoperson trips. Three household members walking to the store together are counted asthree person trips.
Person Miles of Travel (PMT)
Definition – The number of miles traveled by each person on a trip. The purpose is toaccount for all miles traveled by all people.
Example – Two people travelling together take a six-mile subway trip to the airport. That trip results in 12 person miles of travel (the sum of all the miles traveled by all thepeople who traveled). A ten-mile van trip with a driver and three passengers results in40 person miles of travel (4 people each traveling 10 miles).
Using the Data 7

7/29/2019 2009 NATIONAL HOUSEHOLD TRAVEL SURVEY USER’S GUIDE
http://slidepdf.com/reader/full/2009-national-household-travel-survey-users-guide 71/81
Using the Data7
2009 NHTS User's Guide 7-2 Federal Highway Administration
Vehicle Trips
Definition – A trip by a single privately operated vehicle (POV) regardless of thenumber of persons in the vehicle. The typical manner of computing vehicle trips fromthe NHTS file is to impose two limits on the full universe of Travel Day trips:
– Travel mode must be POV (TRPTRANS = 01 -0712 ), and
– Only the driver’s trip is captured (DRVR_FLG = 01).
The second limitation (DRVR_FLG = 01) is to insure that the trip is counted only once.
Example – Two people travelling together in a car would be counted as one vehicletrip. Four people going to a restaurant in a van is considered one vehicle trip.
Vehicle Miles of Travel (VMT)
Definition – One vehicle mile of travel is the movement of one privately operated vehicle (POV) for one mile, regardless of the number of people in the vehicle. Like vehicle trips, the records used to compute VMT must meet two criteria:
– Travel mode must be POV (TRPTRANS = 01 -0713 ), and
– Only the driver’s trip is captured (DRVR_FLG = 01).
Example – When one person drives a car 12 miles to work, 12 vehicle miles of travelhave been made (number of vehicles times the number of miles traveled). If two peopletravel three miles by pickup, three vehicle miles of travel have been made.
Vehicle Occupancy
Definition – For NHTS data, vehicle occupancy is computed as person miles of travelper vehicle mile (referred to as the travel method). Note that the other commonly useddefinition of vehicle occupancy is persons per vehicle trip (referred to as the trip
method).
12 The 2009 NHTS collected HH information on golf carts/electric vehicles used by the HH. These vehicles are indentified by TRPTRANS=08 and
can be used if of interest to a particular research area; however, they are not considered in the findings reported by FHWA.
13 The 2009 NHTS collected HH information on golf carts/electric vehicles used by the HH. These vehicles are indentified by TRPTRANS=08 and
can be used if of interest to a particular research area; however, they are not considered in the findings reported by FHWA.

7/29/2019 2009 NATIONAL HOUSEHOLD TRAVEL SURVEY USER’S GUIDE
http://slidepdf.com/reader/full/2009-national-household-travel-survey-users-guide 72/81
Using the Data7
2009 NHTS User's Guide 7-3 Federal Highway Administration
Sample Tables and Logic, Online Analysis Engine and Other
Resources on the NHTS Website
NHTS Website – http://nhts.ornl.gov
The NHTS Website offers:
Analysis capability which will include production of user-defined tables,
A component for exploratory analysis of the data,
A number of standard NHTS tables,
Papers and articles analyzing the NHTS data, and Updates on the dataset users and uses as well as user support comments.
The website should be the data user’s first stop to determine which of the many capabilities can
assist the user in finding or creating the data s(he) needs. Many users seek data that is already
available in the Frequently-Asked for Tables. The standard tables are an invaluable resource to those
starting to tabulate the NHTS data. To use this resource, click on Online Analysis Tools, then on
Frequently-Asked for Tables.
The Online Analysis Engine allows users to create tables they specify without having to download
the files and develop their own table statement. The Online Analysis Engine produces properly
weighted user-specified tables in either Excel or HTML format.
The website also provides for user support by going to the Contact Us section.
Control Numbers
Control totals are known values, external to the survey itself, which are used to adjust the survey
weights for non-response and non-coverage. Control totals were used to adjust the 2009 NHTS
weights for:
The number of U.S. households, and

7/29/2019 2009 NATIONAL HOUSEHOLD TRAVEL SURVEY USER’S GUIDE
http://slidepdf.com/reader/full/2009-national-household-travel-survey-users-guide 73/81
Using the Data7
2009 NHTS User's Guide 7-4 Federal Highway Administration
The number of persons in these households.
The control categories chosen for the 2009 NHTS and the weighting procedure are described in
Chapter 5 of this User’s Guide. The full complement of control numbers for the 2009 NHTS data
set is contained in the Weighting Report.
Weighted Sums
Weighted sums are simply the calculated sums of the survey weights. These values are helpful to
users in verifying the correctness of data tabulations. The 2009 NHTS total landline sample sizes
and weight sums for the six data files are shown in Table 7-1:
Table 7-1. Sample sizes and weight sums in the six data files
Data file Sample size Weight sum
Household 150,147 113,101,330
Person 351,275 283,053,872
Vehicle 309,163 210,777,656
Travel day trip (annualized) 1,167,321 392,022,844,962
All vehicles 309,163 211,501,318
*Vehicles (Modes 01-07) 307,956 210,777,656
*Note: Only vehicles whose type is identified and whose type is modes 01-07 are used in the count of household
vehicles (HHVEHCNT), the calculation of Vehicle Trips and the calculation of VMT (including VMT_MILE) . The reason for excluding vehicles whose type is not 01-07 from the household vehicle count, Vehicle Trips and
VMT is to ensure that those variables only include motorized vehicles that can be licensed for highway use.
Other travel indicators show the following sample sizes and weighted sums (Table 7-2). The user
should use these as marginal checks when tabulating the NHTS data.
Table 7-2. Sample sizes and weight sums for travel indicators
Data Sample size Weight sum
Workers 139,068 151,373,097
Drivers 249,882 212,308,999
Person Trips 1,167,321 392,022,844,962
Person Miles of Travel (PMT)* 11,257,336 3,732,791,298,429
Vehicle Trips 748,142 233,849,356,482
Vehicle Miles of Travel (VMT)* 6,888,630 2,245,111,452,964
*based on calculated trip distance
7/29/2019 2009 NATIONAL HOUSEHOLD TRAVEL SURVEY USER’S GUIDE
http://slidepdf.com/reader/full/2009-national-household-travel-survey-users-guide 74/81
Using the Data7
2009 NHTS User's Guide 7-5 Federal Highway Administration
Weighting the Data
Chapter 5 described how the weights were calculated for the 2009 survey. The weights reflect the
selection probabilities and adjustments to account for nonresponse, undercoverage, and multiple
telephones in a household. To obtain estimates that are minimally biased, weights must be used.
Note that the 2009 NHTS sample was designed to oversample households in 14 states and 6
metropolitan planning areas. The weighting process adjusted that oversampling to provide correctly
balanced estimates by geographic area. Because the weighting also involved adjustments for
demographic factors, such as household size, race and ethnicity, tabulations without weights may be
significantly different than weighted estimates and may be subject to large bias. Estimates of the
totals are obtained by multiplying each data value by the appropriate weight and summing the
results.
Which Weight to Use. There are several different weights, and it is important that the appropriate
weight is used for a particular estimate. There are household weights, person weights and travel day
weights.
Household weights (WTHHFIN) are used whenever one is tabulating an estimate at thehousehold level as opposed to the person level, such as number of households by household vehicle ownership and distribution of households by number of householddrivers.
Vehicle weights (WTHHFIN) are the same as the household weight since the vehicle isconsidered a household attribute. Use the vehicle weight for items such as vehicles by
vehicle type or by vehicle age.
Travel day weights (WTTRDFIN) are used for estimates involving numbers of trips ormiles of travel, for example, number of vehicle trips by trip purpose. Only trips inprivately-owned vehicles that are reported by the driver should be counted in estimating vehicle trips. For example, if a person reports being a passenger in a vehicle driven by another household member, that trip would not be counted.
Person weights (WTPERFIN) are generally used for estimates of non-household andnon-travel day items of interest, for example workers by gender, drivers by annual miles
estimated, etc.
Note that for some estimates requiring ratios, different weights should be used for the numerators
than for the denominators. For example, for estimates of daily trips per household, travel day
weights are used for the numerator (since the numerator involves person trips) and household
weights are used for the denominator (since the denominator is the weighted number of

7/29/2019 2009 NATIONAL HOUSEHOLD TRAVEL SURVEY USER’S GUIDE
http://slidepdf.com/reader/full/2009-national-household-travel-survey-users-guide 75/81
Using the Data7
2009 NHTS User's Guide 7-6 Federal Highway Administration
households). As a second example, for estimates of average time spent driving by all drivers, travel
day weights are used for the numerator and person weights are used for the denominator (since
drivers are a subset of persons).

7/29/2019 2009 NATIONAL HOUSEHOLD TRAVEL SURVEY USER’S GUIDE
http://slidepdf.com/reader/full/2009-national-household-travel-survey-users-guide 76/81
2009 NHTS User's Guide 7-1 Federal Highway Administration
Replicate Weights and Sampling Errors
Table 7-3 provides the variable names for the weights and the replicate weights and this section
discusses how they may be used to estimate sampling errors.
Table 7-3. Description of the different weights on the 2009 NHTS
Household Person Travel day
Weight WTHHFIN
(HHWGT)*
WTPERFIN WTTRDFIN (DAYWGT)*
Replicates HHWGT1-100 WTPERFIN1-100 DAYWGT1-100
*Weights in parentheses come from Replicate weights file.
Since every person and household in the U.S. was not included in this survey, the sample estimate
may differ from the result that would have been obtained if a census were conducted under the
exact same circumstances. Calculating sampling errors provides the basis for measurement of the
variability in the estimated statistics, and allows analysts to make probability statements about how
large the difference may be between an estimated sample statistic and what would have been
obtained for that statistic had a census been conducted.
The replicate weights may be used to calculate standard errors. The idea in replicate variance
estimation is that sample estimates are made for a number of subsamples of the fully conducted
survey. One then looks at the difference between each replicate sample estimate and the full sampleestimate and squares the difference. Finally, one sums up the squared differences across all the
replicates, with an appropriate multiplicative factor.
The replicate weights were calculated using the Jackknife2 method14. These weights can be used to
calculate standard error estimates using WesVar, SUDAAN, or SAS v9.2. Standard error estimates
can also be easily calculated using the following formula:
� 99100[()− ]2100=1
14Wolter, KM. (1985) Introduction to Variance Estimation. New York: Springer-Verlag.
7/29/2019 2009 NATIONAL HOUSEHOLD TRAVEL SURVEY USER’S GUIDE
http://slidepdf.com/reader/full/2009-national-household-travel-survey-users-guide 77/81
Using the Data7
2009 NHTS User's Guide 7-2 Federal Highway Administration
where x is the full sample estimate (calculated by using the full sample weights) and REP(i) is the
estimate calculated by using the replicate weights and the summation over the index i is from 1 to
100. For example, suppose one is interested in an estimate of persons. The weight WTPERFIN is
used to calculate the overall estimate x. The weight WTPERFIN1 is used to calculate the estimate
REP(1), the weight WTPERFIN2 is used to calculate the estimate REP(2), etc.
As an example of the use of standard errors, the weighted survey estimate of total transit trips is
7,492,304,015 with an estimated standard error of 250,003,726. This standard error estimate allows
one to conclude with 95 percent confidence probability that the interval6, 996,303,743 to
7,988,304,287 contains the estimated number of total public transit trips that would have been
obtained if a census of households were conducted using the same procedures.
Nonsampling Errors
There are many sources of error in addition to error occurring because only a sample was selected.
Some examples of nonsampling include:
A respondent misunderstands a question and answers it incorrectly,
A respondent does not recall a trip or remembers details of the trip incorrectly,
An interviewer does not correctly record what the respondent says,
A person or household is a nonrespondent, and
A person does not answer a specific question.
Undercoverage may also be a source of error. Undercoverage occurs for several reasons, including
that a household has no telephone, a person states incorrectly that the telephone number we have
dialed is not residential, and the household respondent either accidentally or purposely does not
report all the people living in the household.
Note that nonsampling errors can sometimes be much larger than sampling error. Furthermore, for
this survey good estimates of sampling error are possible but, as in most surveys, it is impossible to
estimate nonsampling error.
7/29/2019 2009 NATIONAL HOUSEHOLD TRAVEL SURVEY USER’S GUIDE
http://slidepdf.com/reader/full/2009-national-household-travel-survey-users-guide 78/81
Using the Data7
2009 NHTS User's Guide 7-3 Federal Highway Administration
Finding the Variables You Want
The 2009 NHTS datasets are large, complex and contain numerous survey and external variables.
The following variable lists are available to assist users in locating NHTS variables:
Codebook – The Codebook is the most commonly-used and comprehensive source of information
of the data files. There is a separate Codebook section for each of the four data files – Household,
Person, Vehicle and Travel Day Trips. The Codebook provides the variable name, a description of
the variable and its characteristics (length, character or numeric) the questionnaire item used, the
possible responses to each variable and the unweighted and weighted frequency of each possible
response. Thus the Codebook is invaluable for checking to insure that the user’s calculations show
the same frequency as on the dataset.
Data Dictionary – This list shows all of the variables that are contained in all four 2009 NHTS data
files in a single alphabetic listing. Since many variables are in more than one file, the Data Dictionary
list has four columns indicating which data files contain each of the variables.
Merging Data from Multiple Files
Despite the effort to include often used variables on multiple files (see Chapter 6), there still comes a
time when it is necessary to use information from separate files for an analysis. For example, to
study the daily trip patterns of different types of privately-owned vehicles (POVs), one needs to use
the variable VEHTYPE (vehicle type) from the Vehicle file and link it to trip characteristics
maintained in the Travel Day file. In these types of circumstances, one needs to merge together two
or more of the four files.
File merging can be complicated and confusing, and a mistake can lead to invalid analysis results.
However, an understanding of how the four files are structured and relate to each other can
significantly help clarify the process.
ID Numbers – Each unit (e.g., households, persons) in the survey has its unique identification
number (ID). Specifically, each household is identified by a unique eight digit household ID
(HOUSEID). Within each household, household members are identified by a two digit person
number (PERSONID) and, similarly, household vehicles are identified by a two digit vehicle
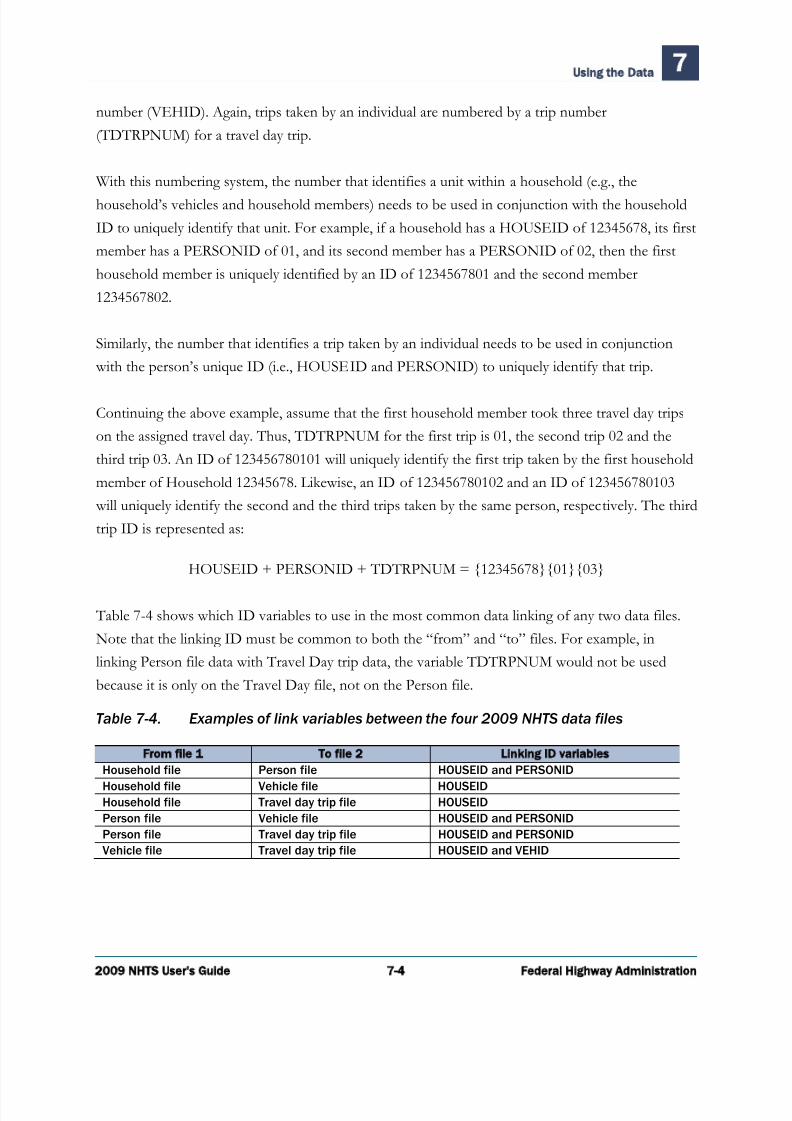
7/29/2019 2009 NATIONAL HOUSEHOLD TRAVEL SURVEY USER’S GUIDE
http://slidepdf.com/reader/full/2009-national-household-travel-survey-users-guide 79/81
Using the Data7
2009 NHTS User's Guide 7-4 Federal Highway Administration
number (VEHID). Again, trips taken by an individual are numbered by a trip number
(TDTRPNUM) for a travel day trip.
With this numbering system, the number that identifies a unit within a household (e.g., the
household’s vehicles and household members) needs to be used in conjunction with the household
ID to uniquely identify that unit. For example, if a household has a HOUSEID of 12345678, its first
member has a PERSONID of 01, and its second member has a PERSONID of 02, then the first
household member is uniquely identified by an ID of 1234567801 and the second member
1234567802.
Similarly, the number that identifies a trip taken by an individual needs to be used in conjunction
with the person’s unique ID (i.e., HOUSEID and PERSONID) to uniquely identify that trip.
Continuing the above example, assume that the first household member took three travel day trips
on the assigned travel day. Thus, TDTRPNUM for the first trip is 01, the second trip 02 and the
third trip 03. An ID of 123456780101 will uniquely identify the first trip taken by the first household
member of Household 12345678. Likewise, an ID of 123456780102 and an ID of 123456780103
will uniquely identify the second and the third trips taken by the same person, respectively. The third
trip ID is represented as:
HOUSEID + PERSONID + TDTRPNUM = {12345678}{01}{03}
Table 7-4 shows which ID variables to use in the most common data linking of any two data files.
Note that the linking ID must be common to both the “from” and “to” files. For example, in
linking Person file data with Travel Day trip data, the variable TDTRPNUM would not be used
because it is only on the Travel Day file, not on the Person file.
Table 7-4. Examples of link variables between the four 2009 NHTS data files
From file 1 To file 2 Linking ID variables
Household file Person file HOUSEID and PERSONID
Household file Vehicle file HOUSEIDHousehold file Travel day trip file HOUSEID
Person file Vehicle file HOUSEID and PERSONID
Person file Travel day trip file HOUSEID and PERSONID
Vehicle file Travel day trip file HOUSEID and VEHID
7/29/2019 2009 NATIONAL HOUSEHOLD TRAVEL SURVEY USER’S GUIDE
http://slidepdf.com/reader/full/2009-national-household-travel-survey-users-guide 80/81
Using the Data7
2009 NHTS User's Guide 7-5 Federal Highway Administration
ID Variables Not Always Sequential
The ID variables within a file are not always sequential. There are a number of reasons for this.
Examples explaining these reasons were provided in the Data Editing portion of Chapter 2. Some of
the reasons why the numbers are not sequential are:
Some persons and vehicles reported by the household respondent were later found notto belong with the household and were deleted from the data set,
Some trip segments reported as separate trips were combined during editing, and
Some trip segments reported as a single trip were split into two.
Merging Data Files
Depending on the nature of the analysis, merging files is typically based on a variable common to
the files. The file-merging approach is illustrated here using an example. In this example, the user
wants to analyze the impact, if any, of occasional telecommuting on the number of daily trips. The
trip-making data are contained in the Travel Day file while the variable indicating occasional
telecommuting is in the Person file (WKFMHM2M). That is, the Travel-day file needs to be merged
with the Person file.
The variables HOUSEID and PERSONID combined enable one to use the Person file to identify
those who occasionally telecommute and those who do not. Using the combined identification
number for HOUSEID and PERSONID, one can identify trips taken by that person in the Travel
Day file. In this case, HOUSEID and PERSONID combined is the common identification needed
to merge the Travel Day and Person files.
In layman’s language, the computer is first instructed to “grab” the variable WKFMHM2M, which
holds the data on whether the respondent occasionally telecommutes, along with the associated
HOUSEID and PERSONID variables from the Person file. Next, the computer is instructed toidentify from the Travel Day file all trips that are taken by that person. That is, having the same
combined HOUSEID and PERSONID identification number.
Finally, the computer is told to “match” information on occasional telecommuting to the travel day
trips based on the combined HOUSEID and PERSONID identification number.
7/29/2019 2009 NATIONAL HOUSEHOLD TRAVEL SURVEY USER’S GUIDE
http://slidepdf.com/reader/full/2009-national-household-travel-survey-users-guide 81/81
Using the Data7
After the files are successfully merged, the next question in using the merged file is which weighting
factor to use. See Chapter 5 for details on the weights to use.
Data File Conventions
There are a number of conventions followed throughout the 2009 NHTS data files. Some of these
are also listed and they include:
Yes/No Questions – coded as:
– 01 = yes
– 02 = no
Calendar Dates – multiple variables contain these dates, usually the year and month
are shown as follows:
YYYYMM = year followed by the month
Times – all reported time variables are in military time as:
– 0000 to 2359
Legitimate Skip Codes – questions intentionally skipped in the instrument aredenoted by a -1 in the field.
Don’t Know – when the respondent indicated that they did not know the response to a
question it is denoted by an -8 in the field.
Refused – when a respondent refused to provide a response to a question is denotedby a -7 in the field.
Not Ascertained – When a question should have been asked of the respondent but was not (the question was not a legitimate skip for that respondent) or the responseprovided did not seem correct because it failed an edit check and could not becorrected, the response was set to not ascertained. The value uses when the response was not ascertained is denoted by a -9 in the field.
Mi i I f i f D i d V i bl V i bl i h d h