national travel survey 2003 & 2004
TRANSCRIPT

National Travel Survey2003 & 2004
Technical ReportOliver Hayllar, Paul McDonnell,Christopher Mottau & Dorothy Salathiel
UK Data Archive SN 5340 - National Travel Survey

National Travel Survey2003 and 2004Oliver Hayllar, Paul McDonnell,Christopher Mottau & Dorothy Salathiel
Prepared for the Department for Transport
October 2005
P2320 and P2420

Contents
KEY V
ACKNOWLEDGEMENTS ..................................................................................................VI
1 INTRODUCTION.......................................................................................11.1 Background..............................................................................................11.2 Uses of the NTS data ..............................................................................11.3 Review of fieldwork sequence .................................................................2
1.3.1 Sample selection ................................................................................. 31.3.2 The interview ....................................................................................... 31.3.3 Data input and editing.......................................................................... 41.3.4 Data file protection............................................................................... 6
1.4 Response.................................................................................................6
2 SAMPLE SELECTION..............................................................................72.1 Sample size and structure .......................................................................72.2 Quasi-panel design..................................................................................72.3 Selection of sample points.......................................................................82.4 Oversampling of London........................................................................102.5 Selection of addresses ..........................................................................102.6 Allocation of PSUs .................................................................................102.7 Selection of households at multi-household addresses.........................112.8 Ineligible (deadwood) addresses ...........................................................112.9 PSU level variables................................................................................12
3 FIELDWORK PROCEDURES AND RESPONSE RATE........................153.1 Introduction ............................................................................................153.2 Interviewer briefings...............................................................................153.3 Confidentiality ........................................................................................153.4 Questionnaire and document despatch to interviewers.........................153.5 Contacting respondents.........................................................................163.6 Allocation of Travel Weeks ....................................................................173.7 The placement interview........................................................................18
3.7.1 The 2003 and 2004 NTS questionnaires........................................... 203.7.2 Placing the travel record and other documents................................. 22
The seven day travel record .............................................................. 23The long distance journey record ...................................................... 24The fuel and mileage chart ................................................................ 25
3.7.3 Length of the placement call.............................................................. 253.8 The reminder call ...................................................................................263.9 The mid-week check call .......................................................................273.10 The Pick-up call .....................................................................................283.11 Outcome coding.....................................................................................293.12 The £5 gift voucher incentive.................................................................313.13 Response rates......................................................................................313.14 The non-response survey ......................................................................353.15 Back-checking and quality control .........................................................36
4 DATA PROCESSING .............................................................................37

4.1 Diary coding and entry...........................................................................374.2 Editing the travel record data.................................................................374.3 Geocoding of address data....................................................................374.4 Coding and editing the CAPI questionnaire data...................................38
4.4.1 Examining notes ................................................................................ 384.4.2 Back-coding other answers ............................................................... 384.4.3 SOC & SIC coding............................................................................. 394.4.4 Registration number checking ........................................................... 404.4.5 Vehicle coding ................................................................................... 414.4.6 Distance checks and area coding...................................................... 414.4.7 Data conversion................................................................................. 42
5 VARIABLES IN THE 2002/2003 NTS DATABASE................................435.1 Introduction ............................................................................................435.2 List of main variables .............................................................................465.3 PSU level variables................................................................................515.4 Household variables ..............................................................................575.5 Vehicle level variables ...........................................................................715.6 Individual level variables........................................................................805.7 Long distance trip variables .................................................................1095.8 Trip level variables...............................................................................1165.9 Stage level variables............................................................................129
6 DEFINITIONS COMPARED WITH EARLIER SURVEYS.....................1376.1 Summary of differences for each NTS.................................................1376.2 Detailed list of changes in procedure and definitions ..........................141
6.2.1 Definition of a journey/ trip............................................................... 1416.2.2 Trip purpose..................................................................................... 1426.2.3 Round trips ...................................................................................... 1446.2.4 Shopping trips.................................................................................. 1446.2.5 Walking jobs .................................................................................... 1456.2.6 Short walks ...................................................................................... 1456.2.7 Length of walk.................................................................................. 1466.2.8 Main mode of transport.................................................................... 1476.2.9 Mode of transport............................................................................. 1486.2.10 Trip start time and travelling time .................................................... 1486.2.11 Treatment of part miles.................................................................... 1486.2.12 Type of area..................................................................................... 1496.2.13 Population density ........................................................................... 1506.2.14 Household income........................................................................... 1516.2.15 Walking time to various facilities...................................................... 1516.2.16 Miscellaneous differences ............................................................... 152
6.3 2002 Survey Year ................................................................................1546.4 2003 Survey Year ................................................................................1576.5 2004 Survey Year ................................................................................157
7 COMPARISON OF NTS DATA WITH OTHER SOURCES ..................1597.1 Age and sex of NTS respondents........................................................1597.2 Region of residence of NTS respondents............................................1637.3 Vehicle stock of household 4-wheeled cars.........................................1637.4 Car mileage estimates .........................................................................1647.5 Household car availability ....................................................................1677.6 Travel to work ......................................................................................1697.7 Bicycle mileage....................................................................................1717.8 Bus boardings......................................................................................1727.9 Van mileage.........................................................................................173

7.10 Driving licence holding.........................................................................173
8 SAMPLING ERRORS...........................................................................1758.1 Introduction ..........................................................................................1758.2 Sampling error calculations and tables................................................176
9 PROGRESS ON IMPLEMENTING THE RECOMMENDATIONS OF THENATIONAL STATISTICS QUALITY REVIEW ......................................1919.1 Introduction ..........................................................................................1919.2 Sample size and survey design ...........................................................191
9.2.1 Sample size ..................................................................................... 1919.2.2 Stratification ..................................................................................... 1919.2.3 Quasi-panel design.......................................................................... 1929.2.4 Sample frame .................................................................................. 192
9.3 Questionnaire topics ............................................................................192Household level ............................................................................... 192Individual level ................................................................................. 192Vehicle level..................................................................................... 192Rotated questions............................................................................ 193Questions added for 2003-2005 ...................................................... 193
9.4 Diary data ............................................................................................1939.4.1 Geocoding ....................................................................................... 1939.4.2 New technologies ............................................................................ 194
9.5 Response rates....................................................................................1949.5.1 Incentives......................................................................................... 194
9.6 Data processing...................................................................................1949.6.1 Weighting......................................................................................... 1949.6.2 Non-response survey ...................................................................... 1959.6.3 Partially responding households...................................................... 1959.6.4 Census-linked Study of survey non-response (CLS) ...................... 1959.6.5 Imputation ........................................................................................ 1969.6.6 Area classifications .......................................................................... 1969.6.7 Rolling three year data .................................................................... 1969.6.8 Tours database................................................................................ 196
9.7 Data Access.........................................................................................1969.8 Other issues.........................................................................................196
9.8.1 Local authority boosts...................................................................... 1969.9 Other changes from 2002 not covered in the Review..........................197
9.9.1 Registration number ........................................................................ 1979.9.2 Coding ............................................................................................. 1979.9.3 Distance checks............................................................................... 197
REPORTS AND PAPERS ON THE NATIONAL TRAVEL SURVEY ........................................199
APPENDIX A QUESTIONNAIRE DOCUMENTATION 2003 AND 2004 ......................... 201
APPENDIX B 2003 AND 2004 ALLOCATION OF PSUS TO QUOTA MONTHS............ 313
APPENDIX C ALLOCATION OF PSUS TO QUOTA MONTHS....................................... 315
APPENDIX D ADVANCE LETTERS ................................................................................ 317
APPENDIX E QUESTIONS DELETED FROM THE NTS IN 2003 AND 2004................. 319
APPENDIX F SURVEY LEAFLET.................................................................................... 321
APPENDIX G ADULT AND YOUNG PERSONS TRAVEL RECORDS ........................... 323

APPENDIX H MEMORY JOGGER................................................................................... 329
APPENDIX I LONG DISTANCE JOURNEY RECORD................................................... 332
APPENDIX J FUEL AND MILEAGE CHART................................................................... 337
APPENDIX K ADDRESS RECORD FORM ..................................................................... 357
APPENDIX L EXAMPLE TRAVEL WEEK ALLOCATION CARD .................................... 371
APPENDIX M PROMISSORY NOTE................................................................................ 373

National Centre for Social Research
v
KEYSymbols and conventions
In tables where figures have been rounded to the nearest final digit, there may be anapparent slight discrepancy between the sum of the constituent items and the totalshown.
Symbols. The following symbols have been used throughout.
.. = not available
. = not applicable- = Negligible (less than half the final digit shown)0 = Nil

National Centre for Social Research
vi
ACKNOWLEDGEMENTSWe owe a great deal to the NTS team at the Department for Transport for theirsupport and guidance. At NatCen, the NTS is very much a team effort, and thanksare due to the programmers, operations staff and interviewers who have worked sowell together to make the survey a success. Particular thanks go to Michael Baxter,Spencer Broadley, Olivia Christophersen, Steven Elder, Simon Holroyd, Steve Kelly,Kevin Pickering, Sarah Tipping and Darren Williams. Finally, we are very grateful toall the respondents who gave their time to participate in the survey.

National Centre for Social Research
1
1 INTRODUCTION
1.1 Background
The National Travel Survey (NTS) provides up-to-date and regular information aboutpersonal travel within Great Britain and monitors trends in travel behaviour. TheMinistry of Transport commissioned the first NTS in 1965/1966, and it was repeatedon an ad-hoc basis in 1972/1973, 1975/1976, 1978/1979, and 1985/1986. In 1988,the NTS became a continuous survey (i.e. fieldwork was conducted on a monthlybasis) with an annual set sample size of 5040 addresses which had increased to5796 by 2001. In 2002 the annual set sample size increased to 15,048 addresses.
Since January 2002, the Department for Transport (DfT) has commissioned theNational Centre for Social Research (NatCen), an independent social researchinstitute, as the contractor for the NTS. NatCen is responsible for questionnairedevelopment, sample selection, data collection and editing, and data file production.The DfT is responsible for building the database and data analysis, publication andarchiving.
This report is a combined technical report which outlines both the 2003 and 2004NTS methodology for sample design, fieldwork procedures, data preparation anddata provision. Differences between the two survey years are be noted whereappropriate.
Every three years an extended NTS Technical report is produced, giving moredetailed information on the methodology as well as additional information on thevariables collected, sampling errors, the impact of changes to the survey over timeand comparisons of NTS data with data from other sources. The last extended reportwas the 2000 Technical Report. This combined 2003 and 2004 report is also anextended report.
As this report is a combined report, chapters sometimes cover different time periods.In summary, chapters 1 to 4, 6, as well as the appendices (including thequestionnaire documentation), cover the 2003 and 2004 survey years. Chapter 5gives details on key variables based on 2002/2003 data and chapter 8 givesstandard errors based on 2002/03 data; the data in these chapters is consistent withthe latest detailed NTS publication , 'Focus on Personal Travel: 2005 Edition', whichwas based on 2002/03 data. Chapter 7 compares NTS data with other sources forthe survey years 2002 to 2004, although for some tables only data up to 2003 wasavailable. Chapter 9 looks at progress in implementing the recommendations of theNational Statistics Quality Review up until the current survey year (2005).
1.2 Uses of the NTS data
The NTS gathers information about several different aspects of travel including:purpose of travel, method of travel (walk, car, bus etc.), origin and destination of trips,time travelling and distance, as well as detailed information about individuals,vehicles and households.

National Centre for Social Research
2
DfT publishes the survey results. The findings and data are used by a variety oforganisations including: Government departments (including DfT, HM Revenue andCustoms, the Department for Trade and Industry, the Department for Education andSkills), the Transport Research Laboratory, the Highways Agency, Friends of theEarth, the Institute of Child Health, Help the Aged, Safe Routes to School, Transport2000, the AA and RAC, university academics and students, transport consultants andlocal councils (as background information for their local transport plans). DfT depositthe NTS dataset at the UK Data Archive at the University of Essex. Figure 1-1 showsexamples of the uses of NTS data.
Figure 1-1 Examples of the uses of NTS data
NTS data has been used to:• Build up a picture of changes in personal travel over time• Examine travel among special groups in the population, such as children, elderly people, disabled
people etc.• Understand the circumstances in which people will tend to use cars rather than public transport
(or vice versa)• Understand how people travel to the shops or to school• Demonstrate the relationship between increased driving licence holding and falling bus use
among pensioners• Identify the decline in the proportion of young people learning to drive• Assess the take-up of OAP concessionary fares• Understand how increased car ownership has led to increased driving among women• Study the use of buses by school children and how this has changed• Get guidance on the types of vehicle that cause the most pollution, by analysing fuel consumption
and mileage levels• Monitor accident rates amongst different types of road users• Establish annual mileage for cars in order to advise on road and fuel tax• Help to monitor journey speeds• Examine car ownership levels and the accessibility of bus services in rural areas
1.3 Review of fieldwork sequence
The NTS uses two data collection methods: face to face interviewing using computerassisted personal interviewing (CAPI) and self-completion of a 7 day travel record.Figure 1-2 outlines the sequence of NTS tasks.

National Centre for Social Research
3
Figure 1-2 The sequence of NTS tasks
Sample Selection from PAF
uQuestionnaire development
uSampled addresses issued to interviewers
uPlacement and Pick up interviews
uData transmission and documents returned by interviewers
uIn-house data input and editing
uQuality checking
uData checking using SPSS
uData file production and delivery to DfT
uVariable derivation and imputation, and data analysis and
reporting by DfT
1.3.1 Sample selection
Both the 2003 and 2004 NTS were based on a random sample of 15,048 privatehouseholds, drawn from the Postcode Address File (PAF). The sample was designedto ensure that the addresses for each quarter were representative of the total GBpopulation (see Chapter 2).
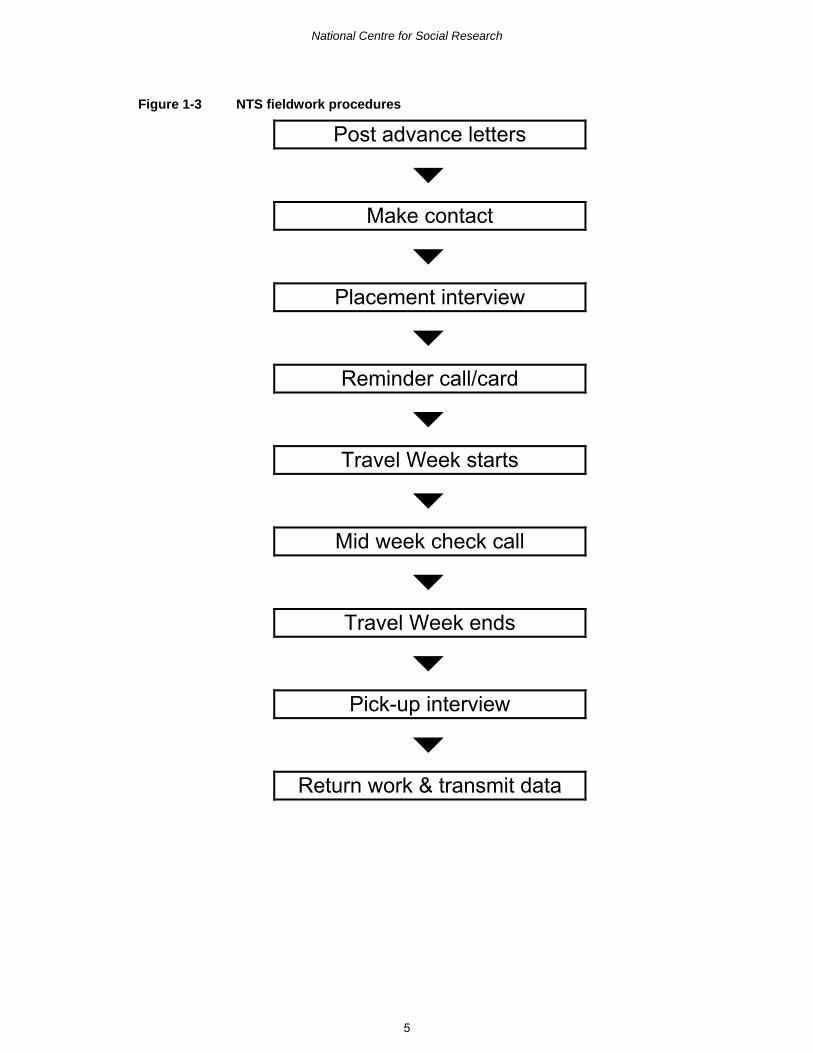
1.3.2 The interviewInterviewers were instructed to begin fieldwork at the beginning of the quota month.Travel Week start dates were allocated within quota months, which ran from mid-month to mid-month. The field work procedure is outlined in figure 1-3 and beganwith the interviewer sending advance letters to the sampled addresses. Theseletters briefly explained the purpose of the NTS, and mentioned that an interviewerwould contact them. It also stated that each respondent would receive a £5 giftvoucher if all household members completed every section of the survey. From June2004 onwards, a book of six first-class stamps was also included with the advanceletter.
Interviewers followed up the advance letter by making face-to-face contact with thehousehold to make arrangements for the placement interview. The placementinterview generally took place before the Travel Week started. This interview was
National Centre for Social Research
4
conducted with all the household members and gathered information about thehousehold, its individual members, household vehicles and long distance journeysthat the household members had recently made. At the end of this interview theinterviewer explained and placed the 7 day travel diaries with all householdmembers.
If there was a gap of more than a few days between the placement interview and thestart of the Travel Week, interviewers made a reminder call or sent a reminder cardto the household to remind them that their Travel Week was about to start. This wasfollowed by a mid week check call (either by telephone or face-to-face) during theTravel Week which checked on the household’s progress in completing their diaries.
Within 6 days after the end of the Travel Week a pick up interview was conductedand the diaries were collected and checked. The pick up interview was used tocomplete any outstanding sections of the placement interview and to also checkwhether anything, such as a respondent’s possession of various types of travel card,had changed since placement.
1.3.3 Data input and editing
Usually the day after the pick up call, CAPI data was transmitted back to the NatCenoperations department and all paper documents were returned by post. Once thedocuments had been received, a team of NTS coders booked the diaries into thecontrol system, and coded, keyed and edited thetravel record information using theDiary Entry System. The contents of the CAPI questionnaire were edited andchecked, and all interviewer notes examined. During this process the interviewerswere contacted if there were any queries that could not be resolved by the coders. Ifnecessary, the interviewer re-contacted respondents to resolve any issues.
Interviewers’ progress was monitored on a weekly basis. The in-office deadline forfieldwork completion was approximately 8 weeks after the start of the first TravelWeek for the quota month in question. For example, the cut off deadline for theJanuary quotas was around 10th March. Quality checks were also made on selectedinterviewers on a rota basis and ten percent of addresses were back-checked1.
1 Back-checking involves contacting participating households by telephone to ensure that they werehappy with the way that the interview was conducted.
National Centre for Social Research
5
Figure 1-3 NTS fieldwork procedures
Post advance letters
uMake contact
uPlacement interview
uReminder call/card
uTravel Week starts
uMid week check call
uTravel Week ends
uPick-up interview
uReturn work & transmit data

National Centre for Social Research
6
1.3.4 Data file protection
The data were organised into nine record types and delivered to DfT. The nine recordtypes consisted of households, individuals (two records), vehicles, long distancejourneys made in the three weeks before the Travel Week (two records), days withinthe Travel Week, journeys made during the Travel Week, and the stages of thesejourneys. Lastly, NatCen provided DfT with PSU-level variables associated with eachhousehold - data which were not collected directly from households. See section 2.10for a detailed description of PSU-level variables.
1.4 Response
Only households classed as ‘fully co-operating’2 are included in the responsecalculations. A national response rate of 60% was achieved in 2003 and in 2004.This is equivalent to an achieved sample rate (ASR) of 54% in 2003 and 53% in2004. The ASR includes those households classified as ineligible in the denominator.
2 See Section 3.11 for a definition of ‘fully co-operating’ and for full response details for both 2003 and2004.

National Centre for Social Research
7
2 SAMPLE SELECTION
2.1 Sample size and structure
The samples for 2003 and 2004 were designed to provide a representative sample ofhouseholds in Great Britain for each survey year. The annual issued sample size inboth years was the same as 2002 at 15,048 addresses. This is over two and a halftimes the sample size for 2000 and 2001, and three times that for 1998 and 1999.The sample size was increased in 2002 to provide the degree of precision requiredby DfT with just one year’s data. Previously, it had been necessary to combine threeyears’ data for most analyses.
The NTS is based on a stratified two-stage random probability sample of privatehouseholds in Great Britain. The sampling frame is the ‘small user’ PostcodeAddress File (PAF), a list of all addresses (delivery points) in the country whichreceive less than 25 items of mail per day. For practical reasons, the Scottish islandsand the Isles of Scilly were excluded from the sampling frame. This excludes 2.2% ofaddresses in Scotland and 0.2% in Great Britain.
Each sample was drawn firstly by selecting the Primary Sampling Units (PSUs), andthen by selecting addresses within PSUs. The sample design employs postcodesectors as PSUs. There were 684 PSUs in 2003 and 2004.
2.2 Quasi-panel design
Following a review of the NTS methodology3, it was decided that the NTS shouldintroduce a quasi-panel design from 2002 onwards. According to this design, half thePSUs in a given year’s sample are retained for the next year’s sample and the otherhalf are replaced. This has the effect of reducing the variance of estimates of year-on-year change. Hence 342 of the PSUs selected for the 2002 sample were retainedfor the 2003 sample, supplemented with 342 new PSUs. The PSUs carried over fromthe 2002 sample for inclusion in 2003 were excluded from the 2003 sample frame, sothey could not appear twice in the sample. The dropped PSUs from 2002 wereincluded in the sample frame. The same procedure of dropping PSUs was carried outto create the 2004 sample.
Whilst the same PSU sectors might appear in different survey years, no singleaddresses were allowed to be in more than one year. The PSUs which were carriedover each year had different addresses selected to those selected in the same PSUin the previous year. Each year, NatCen provided the sampling company with a list ofthe addresses selected for the previous year’s survey. These addresses wereexcluded from the sampling frame before either the 2003 or 2004 addresses wereselected. This meant respondents to the previous year’s survey in the PSUs whichwere carried over could not be contacted again.
3 Elliott, D. (2000) ONS Quality Review of the National Travel Survey: Some Aspects of Design andEstimation Methods.

National Centre for Social Research
8
2.3 Selection of sample points
A list of all postcode sectors in Great Britain was generated, excluding those in theScottish Islands and the Isles of Scilly. Sectors carried over from each year were alsoexcluded. Sectors south of the Caledonian Canal with less than 500 delivery pointsand sectors north of the Caledonian Canal with less than 250 delivery points weregrouped with an adjacent sector. Grouped sectors were then treated as one PSU. Onaverage each PSU contained about 2,900 delivery points.
This list of postcode sectors in Great Britain was stratified using a regional variable,car ownership and population density. This is done in order to increase the precisionof the sample and to ensure that the different strata in the population are correctlyrepresented. Random samples of PSUs were then selected within each stratum.
The regional strata for Great Britain are based on the NUTS2 areas, grouped in a fewcases where single areas are too small. NUTS or Nomenclature of Units forTerritorial Statistics is a European-wide geographical classification developed by theEuropean Office for Statistics (Eurostat). NUTS2 roughly relates to counties orgroups of counties in England, and groups of unitary authorities or council areas inScotland and Wales. The 40 regional strata for the survey are shown in Figure 2-1.
Within each region, postcode sectors were listed in increasing order of the proportionof households with no car (according to the 1991 Census). Cut-off points were thendrawn approximately one third and two thirds (in terms of delivery points) down theordered list, to create three roughly equal-sized bands. Within each of the 120 bandsthus created (40x3), sectors were listed in order of population density (people perhectare). 342 postcode sectors were then systematically selected with probabilityproportional to delivery point count4. Differential sampling fractions were used inInner London, Outer London and the rest of Great Britain in order to oversampleLondon (see section 2.4 for further details). These sectors were then added to the342 sectors carried over from the previous year’s survey to make the final sample of684 sectors for each year.
4 after expansion by the Multiple Occupancy Indicator (MOI) in Scotland (see Section 2.7).

National Centre for Social Research
9
Figure 2-1 NTS regional stratification variable
England GOR code1 Inner London – East 7 Greater London2 Inner London – West 7 Greater London3 Outer London – East and North East 7 Greater London4 Outer London – South 7 Greater London5 Outer London West and North West 7 Greater London6 Devon and Cornwall 9 South West7 North Somerset, North East Somerset, Bath,
Somerset and Dorset9 South West
8 Bristol, South Gloucestershire, Gloucestershireand Wiltshire
9 South West
9 Oxfordshire, Buckinghamshire and Berkshire 8 South East10 Hampshire and Isle of Wight 8 South East11 Kent 8 South East12 West Sussex and East Sussex 8 South East13 Surrey 8 South East14 Essex 6 Eastern15 Cambridgeshire, Suffolk and Norfolk 6 Eastern16 Hertfordshire and Bedfordshire 6 Eastern17 Leicestershire, Lincolnshire and
Northamptonshire4 East Midlands
18 Warwickshire and Hereford & Worcester 5 West Midlands19 West Midlands 5 West Midlands20 Shropshire and Staffordshire 5 West Midlands21 Nottinghamshire and Derbyshire 4 East Midlands22 Cheshire 2 North West and Merseyside23 Merseyside 2 North West and Merseyside24 Greater Manchester 2 North West and Merseyside25 Lancashire and Cumbria 2 North West and Merseyside26 South Yorkshire 3 Yorkshire and Humberside27 West Yorkshire 3 Yorkshire and Humberside28 North Yorkshire and Humberside 3 Yorkshire and Humberside29 Cleveland, County Durham and
Northumberland1 North East
30 Tyne & Wear 1 North East

National Centre for Social Research
10
Figure 2-1 NTS regional stratification variable (continued)Wales GOR code
31 Anglesey, Gwynedd, Conwy, Denbighshire,Flintshire, Wrexham, Powys, Ceredigion
11 Wales
32 Carmarthenshire, Neath Port Talbot,Pembrokeshire, Swansea
11 Wales
33 Blaenau Gwent, Caerphilly, Monmouthshire,Newport, Torfaen
11 Wales
34 Bridgend, Cardiff, Merthyr Tydfil, RhonddaCynon Taff, Vale of Glamorgan
11 Wales
Scotland GOR code35 Grampian, Highland, Argyll & Bute 12 Scotland36 Tayside, Fife and Central 12 Scotland37 Edinburgh, Lothians and Borders 12 Scotland38 Glasgow and Dunbartonshire 12 Scotland39 Lanarkshire, Renfrewshire and Inverclyde 12 Scotland40 Ayrshire and Dumfries & Galloway 12 Scotland
2.4 Oversampling of London
Each year London PSUs were oversampled in order to compensate for lowerresponse rates. Response rates tend to be much lower in London compared with therest of Great Britain, with rates being lowest in Inner London. The NTS oversamplesInner and Outer London with the aim of achieving responding sample sizes inLondon and elsewhere which are proportional to their population. Estimates ofresponse rates were made in order to oversample Inner and Outer London; 49% forInner London, 58% for Outer London and 67% for the rest of Great Britain. Theseestimates were based on NTS response rates from 1995-2000 plus our ownexperience of achieving full household co-operation in these areas. Of the 684sectors in the sample, 56 were in Outer London and 44 in Inner London. Thesefigures were the same for both 2003 and 2004.
2.5 Selection of addresses
Within each selected sector, 22 addresses were sampled systematically, giving asample of 15,048 addresses (684 postcodes x 22).
About 24.7 million delivery points were available for selection in Great Britain as awhole, with about three million delivery points in Greater London. Consequently theprobability of an address in Great Britain being selected for the 2003 NTS was one in1632; in Inner London this was one in 1221, and in Outer London one in 1458. In2004, the probability of an address in Great Britain being selected was one in 1644;in Inner London this was one in 1237, and in Outer London one in 1465.
2.6 Allocation of PSUs
As travel patterns show a seasonal variation, equal numbers of PSUs were assignedto each quota month (57 PSUs per month). Furthermore, PSUs were allocated toquota months such that a nationally representative sample would be obtained foreach quarter.

National Centre for Social Research
11
2.7 Selection of households at multi-household addresses
The term 'multi-household address' relates to an address with accommodation formore than one household. An example of this would be a house (no. 15) which hasbeen split into two flats (15a and 15b) or there could be two families living as twoseparate households in one house.
In England and Wales multi-household addresses are not reliably identified on thePAF. On the whole these addresses will not be identified until the interviewer hasvisited the address. As a result these households will have had a lower chance ofselection than others. While there are relatively few such addresses (one percent),they account for a larger proportion of households, and these households tend to berather different to others (poorer, younger, and smaller), so consequent biases maynot be entirely trivial. Special procedures are in place to minimise this bias;interviewers are instructed to include all households up to a maximum of three ateach address. If there are more than three at any one address, interviewers use aselection grid on the Address Record Form to randomly select three of them. Thislimitation on the number of extra households leaves some residual bias that could beremoved using corrective weighting. This will be done from 2006 when NTS data for2005 and previous years will be published on a weighted basis.
In contrast to England and Wales, the ‘multiple occupancy indicator’ (MOI) on PAFreliably identifies the number of households there are at each address in Scotland.Consequently the sampling frame for Scotland was expanded by MOI to give theseextra households the same chance of being selected as households at singleoccupancy addresses. Thus at multi-household addresses, interviewers randomlyselected one household for interview.
2.8 Ineligible (deadwood) addresses
The following types of address were classified as ineligible in 2003 and 2004. (Seealso section 3.11 Outcome Coding):
Houses not yet built or under construction.
Demolished or derelict buildings or buildings where the address has "disappeared"when 2 addresses were combined into one.
Vacant/empty housing unit - housing units known not to contain any residenthousehold on the date of the 1st contact attempt.
Non-residential address - an address occupied solely by a business, school,government office, other organisation, etc., with no resident persons
Residential accommodation not used as the main residence of any of the residents.This is likely to apply to second homes/seasonal/vacation/temporary residences.These were excluded to avoid double counting - the households occupying theaddress had a chance of selection at their permanent address.
Communal establishment/institution - an address at which 4 or more unrelatedpeople sleep; while they may or may not eat communally, the establishment must berun or managed by the owner or a person (or persons) employed for this purpose.
National Centre for Social Research
12
Address is residential and occupied by a private household(s), but does not containany household eligible for the survey - it is very rare for a residential household not tobe eligible for NTS interview, exceptions include 'Household of foreign diplomat orforeign serviceman living on a base', addresses which are not the 'Main residence' ofany of the residents and addresses where there are no residents aged 16 or over.
Address out of sample - cases where interviewers were directed not to approach aparticular address. This is very rare and usually only occurs where an addressshould not have been listed on the original sampling frame.
2.9 PSU level variables
In addition to the information provided by members of the sampled households, theNTS also collects information measured at the PSU level (P-level). The value of a P-level variable applies to all households living within that PSU. The P-level is thereforethe highest level at which the data may be analysed, coming just above the H(Household) level in the analysis hierarchy.
The 2003 and 2004 NTS included seventeen P-level variables (see Figure 2-2). Amore detailed account of the derivation of PSU-level variables is given in Chapter 5.

National Centre for Social Research
13
Figure 2-2 Description of P-level variables
Variable DescriptionP1 PSU identification numberP2 Region (Scotland, Wales and nine Government office regions in England)P3 Blank field, not usedP4 Blank field, not usedP5 Type of Area (urban/rural classification) constructed from a classification of
urban areas derived by ONS and DfT from the 1991 Census of Population.P6 PSU Population Density derived from 1991 Census figures on the number
of people living in private households per hectareP7 LA Population Density derived from 1991 Census figures on the number of
people living in private households per hectare.P8-14 Concessionary fares This information is obtained by DfT via a questionnaire
sent to all local authoritiesP8 Availability of concessionary bus fares for pensionersP9 Eligibility for concessionary bus fare schemes for pensioners
P10 Type of concession bus fare schemes for pensionersP11 Membership fee for concessionary bus fare schemes for pensionersP12 Times available for concessionary bus fare schemes for pensionersP13 Geographical area covered by the concessionary bus fare schemes for
pensionersP14 Modes additional to bus covered by concessionary bus fare schemes
for pensionersP15 County of residenceP16 Regional stratification prior to 2002 No longer in useP17 Regional stratification (from 2002)P18 County/ Unitary Authority codes

National Centre for Social Research
14

National Centre for Social Research
15
3 FIELDWORK PROCEDURES AND RESPONSE RATE
3.1 Introduction
The NTS is a continuous survey with fieldwork taking place throughout the year.Respondents were interviewed face to face using Computer-Assisted PersonalInterviewing (CAPI), and they recorded their travel details in a 7 day self-completiontravel record.
Interviewers began fieldwork at the beginning of each month. The fieldwork involvedmaking contact with households, conducting the placement interview, placing thetravel diaries and conducting the pick up interview at the end of the Travel Week.Travel Week start dates were allocated within quota months, which ran from mid-month to mid-month. For example, the first Travel Week that interviewers couldallocate for the June quota, started in mid-June. The CAPI data and NTS documentswere returned to the NatCen operations department for in-house data input andediting.
The 2003 and 2004 CAPI questionnaires were designed and implemented using thesoftware system Blaise 4. A single Blaise instrument was used for the household,individual, vehicle and administrative sections of the questionnaire. The Diary EntrySystem (DES) was written in Visual Basic. Selected CAPI variables were extractedand loaded into the NatCen field management system from where they werereferenced by the DES. This provides contextual information from the CAPI interviewfor those people inputting and editing travel record data.
3.2 Interviewer briefings
Interviewers were briefed by the researchers during a series of two day briefings. Thebriefings covered all aspects of the survey and included the completion of a dummyinterview on interviewer laptops, as well as role-play exercises to practice doorsteptechnique and the placing and picking up of the travel records. Interviewers were alsogiven a pre-briefing exercise. This involved completing their own travel record usingtheir own journey details for a week, studying the definitions manual and completinga short test on this.
3.3 Confidentiality
Respondents were informed in the advance letter that their participation wasvoluntary and that any information they provided would remain confidential and wouldnot be passed on to anyone outside NatCen in a form that could be used to identifythem. Respondents were provided with a telephone number for NatCen’s Operationsdepartment that they could telephone if they had any queries. Any substantivequeries or complaints were subsequently passed on to researchers to deal with.
3.4 Questionnaire and document despatch to interviewers
Before the start of each quota month, the operations department transmitted thesampled addresses and latest version of the questionnaire to the interviewers bymodem. The relevant NTS materials were despatched to the interviewers by post.

National Centre for Social Research
16
Any queries about transmission or other technical matters were dealt with by acomputer helpline run from the Operations department during working hours, and bya team of experienced interviewers working from home outside of working hours.Laptop maintenance was handled by a separate department within NatCen. Theinterviewers were also able to contact the staff in the specific team within theOperations department which dealt with the NTS.
3.5 Contacting respondents
Interviewers were given advance letters to send to the selected addresses inadvance of their first call (see Appendix D). A Welsh translation of the advance letterwas used for addresses in Wales. The advance letter gave some generalbackground to the survey and explained its importance, some of its uses, and howthe household had been selected. It also stated that each respondent would receivea £5 gift voucher if the placement interview was complete and all householdmembers had filled out a travel record. See section 3.12 for more details on the £5incentive payment for respondents.
The letter included a space for interviewers to write in their name so that respondentsknew who would be calling. The letters were sent in ‘On Her Majesty’s Service’envelopes and also enclosed was an NTS fridge magnet. From June 2004onwards, a book of six first-class stamps was also included with the advance letteras a gesture of goodwill to encourage respondents to take part.
Interviewers were notified of any refusals made direct to the Operations departmentas a result of the advance letter. Interviewers were not required to visit theseaddresses and they did not count against interviewers’ individual response rates.However, they were counted as non-response in calculating the overall response tothe survey.
A few days after the advance letters had been sent, interviewers made contact withrespondents by personal visit, although telephone numbers were later madeavailable for some households where it was found to be very difficult to makecontact. Interviewers were required to make a minimum of 4 calls. These had to beat different times of day and on different days of the week. If there was still nocontact, only then could an interviewer return a case as a ‘non-contact’. However, inpractice, interviewers made far more calls than this. The average number of callsmade for each type of outcome is shown in Table 3-1.
Interviewers had a survey leaflet to use on the doorstep (see Appendix F). Thiscontained information about the reasons for carrying out the survey, how householdswere chosen, and selected findings from previous surveys. Interviewers could leavethis with respondents who were not sure if they wanted to take part, and call back ata later date. They also left it if they made an appointment to come back and do theinterview. Interviewers could also use DfT Personal Travel Factsheets todemonstrate to possible respondents the type of data collected by the NTS. For anyyoung children, a themed fun pack was provided for their amusement whilst adultscompleted the survey.

National Centre for Social Research
17
Table 3-1 Mean number of calls, by outcome
2003 2004
Fully co-operating 6.1 6.0Partially co-operating 6.8 6.8Non-contact 8.5 8.2Refusal 4.3 4.3Other unproductive 4.4 4.3Unknown eligibility 8.6 8.5Ineligible 2.7 2.8
Overall average 5.5 5.4
3.6 Allocation of Travel Weeks
Each household had to be allocated a Travel Week during which they kept theirtravel record and entered details into the fuel and mileage chart. Travel Week startdates were allocated within quota months, which ran from mid-month to mid-month.The travel recording periods for each month are shown in the figure below.
Figure 3-1 NTS 2003 and 2004 quota month dates
2003 2004MONTH From To MONTH From ToJanuary 12 January 11 February January 12 January 11 FebruaryFebruary 12 February 13 March February 12 February 12 MarchMarch 14 March 13 April March 13 March 12 AprilApril 14 April 13 May April 13 April 13 MayMay 14 May 13 June May 14 May 13 JuneJune 14 June 13 July June 14 June 13 JulyJuly 14 July 13 August July 14 July 13 AugustAugust 14 August 13 September August 14 August 13 SeptemberSeptember 14 September 13 October September 14 September 13 OctoberOctober 14 October 12 November October 14 October 13 NovemberNovember 13 November 12 December November 14 November 14 DecemberDecember 13 December 11 January December 15 December 13 January
It was important that the choice of Travel Week was not left to the discretion of therespondent or interviewer as this could lead to bias. To prevent bias, it wasnecessary to ensure that the Travel Weeks were evenly spread over the days of theweek as well as the weeks of the quota month. The method for doing this was to giveeach interviewer a Travel Week Allocation Card (see Appendix L for an example)listing 22 Travel Week start dates for the month. These 22 dates were randomlyselected from all the dates from mid-month to mid-month, thus giving eachinterviewer a slightly different set of 22 dates.
The interviewer had to allocate a start date to every address in their assignment,whether or not it was productive. They did this by allocating the first address at whichthey had a definite outcome (either a placement interview, deadwood, refusal or non-
National Centre for Social Research
18
contact) to the first date available on the list, the next address to the second date andso on. In exceptional circumstances where interviewers could not contact ahousehold in time to allocate any of the original Travel Weeks (such as a householdbeing away on holiday), interviewers were able to request additional Travel Weeksduring the week after the original travel recording period (the ‘5th week’). Theoperations department controlled use of these additional dates.
3.7 The placement interview
The first stage of interviewing consisted of the placement interview. This wasconducted with all household members and consisted of three sections.
The household questionnaire was asked of the Household Reference Person(HRP), which is the householder with the highest income, or their spouse orpartner.
The individual questionnaire was asked of each household member, includingchildren (although proxy information was collected for under 11s). A maximum of10 people could be included. On the extremely rare occasions when interviewersencountered a household with more than 10 members, they were instructed toselect the oldest 10 to take part in the interview, and to ensure that all vehicleowners were included.
The vehicle questionnaire was asked of the main driver for each vehicle in thehousehold. A maximum of 10 vehicles could be recorded.
It was not always possible to interview all household members in person and soproxy interviews were allowed for adults who were difficult to contact. Thepercentage who were interviewed face-to-face, by proxy and not interviewed in 2003and 2004 is shown in Table 3.2. Interviewers were instructed to interview those under11 by proxy, which is why most interviews with children were proxy interviews. Inboth years 67% of interviews with children aged under 11 were by proxy.

National Centre for Social Research
19
Table 3-2 Method of individual interview at placement in 2003 and 2004
2003 Aged <16 Aged 16+ Total% % %
Face-to-face 37 80 71Proxy 62 19 29Not interviewed 0.6 0.4 0.4Base (individuals) 4,751 17,465 22,2162004 Aged <16 Aged 16+ Total
% % %Face-to-face 37 79 70Proxy 63 21 30Not interviewed 0.1 0.3 0.2Base (individuals) 4,701 16,992 21,693
In the majority of cases, the placement interview took place before the start of theTravel Week. Tables 3-3 and 3-4 show the gap between the placement interview andthe start of the Travel Week in 2003 and 2004 (see Section 3.11 for a definition of fulland partial response). In eight out of ten households, the placement interview wasstarted and travel records placed before the Travel Week started. A further 8 percentin 2003 and 9 percent in 2004 were started on the first day of the Travel Week andfour percent in 2003 and five percent in 2004 on the second day. Very few placementinterviews were started after this time.
Table 3-3 Timing of the placement interview in relation to the Travel Week in 2003
FullResponse
PartialResponse
Total
Placement interview was… % % %… 8 or more days before start of Travel Week 31 30 31… 1-7 days before start of Travel Week 52 51 52… on day 1 of Travel Week 8 9 8… on day 2 of Travel Week 4 4 4… on day 3 of Travel Week 2 3 2… on day 4 of Travel Week 1 0.8 1… on day 5 of Travel Week 0.5 0.5 0.5… on day 6 of Travel Week 0.4 0.5 0.4… on day 7 of Travel Week 0.3 0.2 0.3… after end of Travel Week 1 1.3 1Base (households) 8258 1001 9259

National Centre for Social Research
20
Table 3-4 Timing of the placement interview in relation to the Travel Week in 2004
FullResponse
PartialResponse
Total
Placement interview was… % % %… 8 or more days before start of Travel Week 25 27 25… 1-7 days before start of Travel Week 54 45 53… on day 1 of Travel Week 9 8 9… on day 2 of Travel Week 5 5 5… on day 3 of Travel Week 2 4 3… on day 4 of Travel Week 2 2 2… on day 5 of Travel Week 1 1 1… on day 6 of Travel Week 0.6 2 0.7… on day 7 of Travel Week 0.5 1 0.6… after end of Travel Week 2 5 2Base (households) 8122 900 9022
3.7.1 The 2003 and 2004 NTS questionnaires
The topics covered by each section of the placement interview are shown in Figure3.2.
Figure 3-2 Placement interview topics, 2003 and 2004
HOUSEHOLD INDIVIDUAL VEHICLE
Household grid Disability Registration no.Accommodation Walk of 20 minutes or more Vehicle details
Tenure Use of bicycles ParkingLength of residence Driving licences Company carsReasons for moving Economic activity Mileage
Distances to amenities Transport barriers to employmentDeliveries Transport-related benefitsShopping Income
Children’s travel Place of workTransport opinions Home workingHousehold vehicles Difficulties travelling to work
Difficulties with shopping and otherjourneys
Satisfaction with local busservices (new in 2004)
Season tickets
Long distance journeys
No new questions were introduced in 2003, although a change was made to the waylong distance journeys were recorded in the CAPI. This change made it easier forinterviewers to record return journeys so that rather than having to record all thedetails of the return journey the interviewer could just record that the journey was thereturn journey of a previous one and the details were then calculated by the CAPI.
National Centre for Social Research
21
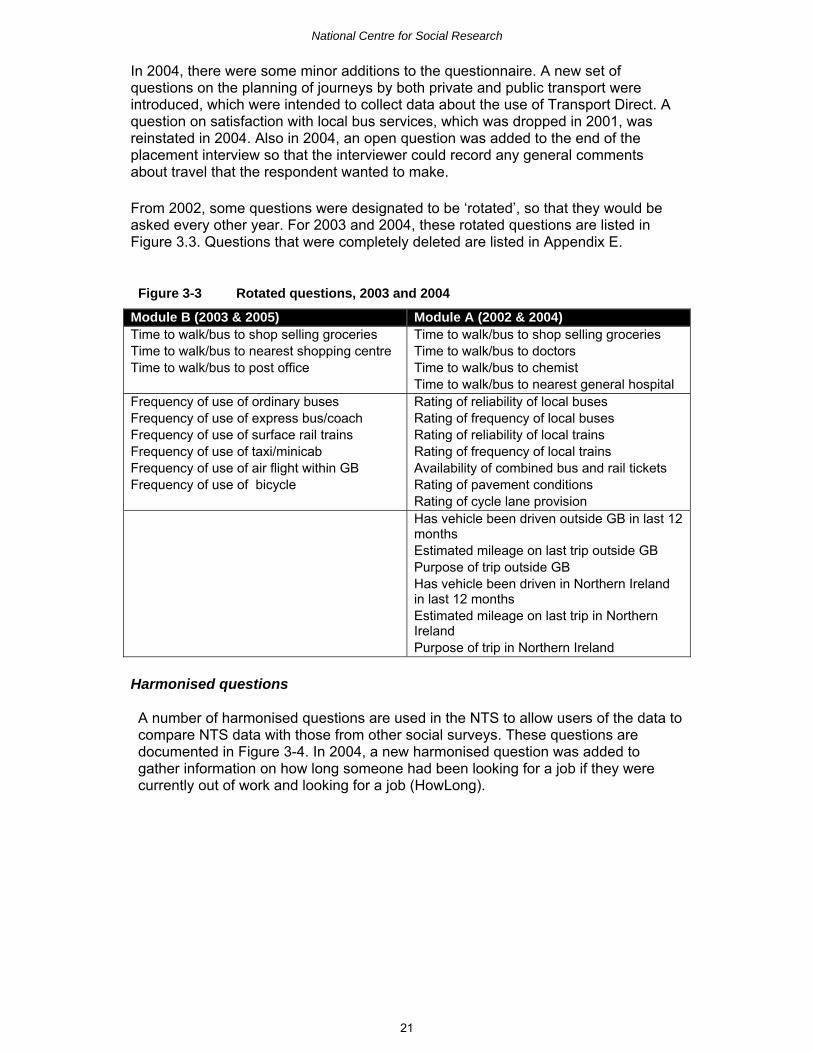
In 2004, there were some minor additions to the questionnaire. A new set ofquestions on the planning of journeys by both private and public transport wereintroduced, which were intended to collect data about the use of Transport Direct. Aquestion on satisfaction with local bus services, which was dropped in 2001, wasreinstated in 2004. Also in 2004, an open question was added to the end of theplacement interview so that the interviewer could record any general commentsabout travel that the respondent wanted to make.
From 2002, some questions were designated to be ‘rotated’, so that they would beasked every other year. For 2003 and 2004, these rotated questions are listed inFigure 3.3. Questions that were completely deleted are listed in Appendix E.
Figure 3-3 Rotated questions, 2003 and 2004
Module B (2003 & 2005) Module A (2002 & 2004)Time to walk/bus to shop selling groceriesTime to walk/bus to nearest shopping centreTime to walk/bus to post office
Time to walk/bus to shop selling groceriesTime to walk/bus to doctorsTime to walk/bus to chemistTime to walk/bus to nearest general hospital
Frequency of use of ordinary busesFrequency of use of express bus/coachFrequency of use of surface rail trainsFrequency of use of taxi/minicabFrequency of use of air flight within GBFrequency of use of bicycle
Rating of reliability of local busesRating of frequency of local busesRating of reliability of local trainsRating of frequency of local trainsAvailability of combined bus and rail ticketsRating of pavement conditionsRating of cycle lane provisionHas vehicle been driven outside GB in last 12monthsEstimated mileage on last trip outside GBPurpose of trip outside GBHas vehicle been driven in Northern Irelandin last 12 monthsEstimated mileage on last trip in NorthernIrelandPurpose of trip in Northern Ireland
Harmonised questions
A number of harmonised questions are used in the NTS to allow users of the data tocompare NTS data with those from other social surveys. These questions aredocumented in Figure 3-4. In 2004, a new harmonised question was added togather information on how long someone had been looking for a job if they werecurrently out of work and looking for a job (HowLong).

National Centre for Social Research
22
Figure 3-4 HARMONISED QUESTIONS USED IN THE 2003 AND 2004 NTS
Harmonised question NTS question name Yearintroduced
Sex Sex 1998Age AgeIf 1998Date of birth Birth 2000Marital status MarStat 1999Living arrangements LiveWith 1999Ownership of accommodation Hhldr 2002Joint Ownership HiHNum 2002Ethnic Group EthGroup 2001Length of residence HLong 1998Relationship to head of household RelHoH 1998Accommodation type Accom 2000House type HseTyp 2000Flat type FltTyp 2000Other accommodation AccOth 2000Housing tenure Tenl 1998Car ownership UseVcl 1998Vehicle type TypeVcl 1998Company car PrivVcl 1998In employment Wrking 1998Training scheme SchemeET 1998Away from work JbAway 1998Own business OwnBus 1998Relative business RelBus 1998Looking for work Looked 1998Starting work StartJ 1998Inactive YinAct 1998Industry IndD 1998Job title OccT 1998Job description OccD 1998Job status Stat 1998Paid employment EverWk 1998Date of leaving last job DtJbl 1998Supervising employees SVise 2001Supervision responsibilities SViseDesc 2001Organisation size EmpNo 1998Self-employed Solo 1998Number of employees SENo 1998Full or part time work FtPtWk 1998Long-term unemployed HowLong 2004
Fully documented versions of the questionnaires used in the 2003 and 2004 NTS canbe found in Appendix A. These show the routing and content of each questionnaire.The documentation of the 2003 and 2004 questionnaire includes not only thehousehold, individual and vehicle sections, but also the administration blockcompleted by all interviewers, as well as the diary entry system.
3.7.2 Placing the travel record and other documents
At the end of the placement interview, the interviewer placed:

National Centre for Social Research
23
• the seven day travel record (Appendix G),
• the long distance journey record (Appendix I),
• and the fuel and mileage chart (Appendix J).
The seven day travel record
Each individual in a household was issued with a seven day travel record, in whichthey were to record details of their travel activity. There are two versions, one foradults (respondents aged 16 and over) and one for children (the Young Person’stravel record).
Each trip was recorded, and the respondent provided details of origin anddestination, purpose, mode, distance travelled, cost, time, vehicles used, tickets usedand number in the party for each journey. In addition the adult version of the travelrecord asked drivers to detail where they parked their vehicle as well as associatedparking costs. From 2003 a new field was added to the travel record to collectinformation on whether drivers paid a congestion charge for each car journey. Onday 7, the child travel record asked whether the respondent spent any time in thestreet (e.g. playing, talking with friends etc.). See Figure 3-5 for more substantivedetails on the content of the travel diaries in both 2003 and 2004.
Interviewers explained to respondents in detail how to complete the travel record.They generally did this by entering the details of some typical journeys made by therespondent in the blank example pages provided, often using the respondent’sprevious day’s journeys. Some interviewers used the NTS definitions manual tohelp describe the level and type of details required.5
Simplified pocket size diaries or memory joggers (see Appendix H), into whichrespondents could briefly note down their journeys, were placed with respondents ifthe interviewer felt they would be helpful. Everyone received an NTS pen to aidtravel record and other NTS document completion.
5 All survey definitions are given in the NTS definitions manual, copies of which are available on request.

National Centre for Social Research
24
Figure 3-5 Seven Day Travel DiariesAdult Diary (respondents aged 16 and over(blue)
Young Person’s Diary (green)
Day 1-6 Day 1-6Purpose of journey Purpose of journeyTime Left Time LeftTime Arrived Time ArrivedOrigin - Where the journey started (From Village/Town/ Local Area)
Where the journey started (From Village/ Town/Local Area)
Destination - Where the journey ended (ToVillage/ Town/ Local Area)
Where the journey ended (To Village/ Town/Local Area)
Method of Travel (Car, bus, walking etc.) (Onlywalks that were more than one mile, or took morethan 20 minutes are included)
Method of Travel (Car, bus, walking etc.) (Onlywalks that were more than one mile, or took morethan 20 minutes are included)
Distance (yards or metres/ miles) Distance (yards or metres/ miles)Number in party Number in party (split into adults and children)Time travelling (in minutes) Time travelling (in minutes)Ticket Type (Single/ return/ travel card etc.) Ticket Type (Single/ return/ travel card etc.)Cost CostNumber of boardings (the number of trains/buses etc. used to reach journey destination)
Number of boardings (the number of trains/buses etc. used to reach journey destination)
Which car/ motorcycle etc. used (only if journeywas made not by public transport, but by car/motorcycle etc. )
Which car/ motorcycle etc. used (if journey wasmade not by public transport, but by car/motorcycle etc.)
Driver or Passenger? (whether they were a front,or rear passenger) (only if journey was made notby public transport, but by car/ motorcycle etc.)
Passenger (whether they were a front, or rearpassenger)
Drivers only : where they parked and the costDrivers only: Road/ Congestion charges paid(introduced in 2003)
Day 7 additional information requested Day 7 additional information requestedPostal address details for both the origin anddestination of journeys
Postal address details for both the origin anddestination of journeys
All walks over 50 yards (including those less thanone mile, or twenty minutes in length)
All walks over 50 yards (including those less thanone mile, or twenty minutes in length)Any time spent in the street not classified as ajourney (e.g. playing with friends, skateboarding,riding bikes etc. )
The long distance journey record
The NTS also collects details about any long distance journeys, defined as trips of 50miles or more made within Great Britain, which a respondent makes over a four weekperiod. A four week period is used to allow for enough journeys to be available fordata analysis.
The four week period was determined by the date of the designated Travel Week fora household, with the last day of the four week period being the last day of the TravelWeek (i.e. the four week period is the Travel Week plus the three weeks before it ).
During the placement interview, any long distance journeys that occurred betweenthe start of the 4 week period and the day of the interview were recordedretrospectively. If there was a gap remaining between the placement interview andthe start of the Travel Week, the interviewer gave respondents the long distance

National Centre for Social Research
25
journey record. Long distance journeys during this period were then asked aboutduring the pick-up interview. Long Distance Journeys that took place during theTravel Week were covered in the travel record. In total, a maximum of 40 longdistance journeys could be recorded. See Figure 3.6 for an example of how the fourweek period works and Appendix I for a copy of the LDJ record.
Figure 3-6 Example of long distance journey (LDJ) recording period
Week 1 Week 2 Week 3 Week 4
Placement interview Start of Travel Week
LDJ period covered retrospectivelyduring the placement interview
LDJ period covered by theLDJ record and entered intothe CAPI during the pick-up
interview
The fuel and mileage chart
In addition to the diaries and long distance journey record, a fuel and mileage chartwas placed at the end of the placement interview for each household vehicle. Thedriver was encouraged to keep this chart in their vehicle. The chart required thedriver to record the fuel gauge and milometer readings at the start and end of theTravel Week. The amount and cost of fuel put into the vehicle during the TravelWeek was also recorded. See Appendix J for a copy of the Fuel and Mileage chart.
3.7.3 Length of the placement call
The average length of the placement call (that is, the placement interview plus thetime taken to place and explain the various documents) was 52.2 minutes in 2003and 53.0 minutes in 2004. In both years the time it takes to do a placement interviewvaried according to household size, being almost twice as long for the largesthouseholds as for a one-person household (see Tables 3-5 and 3-6 below).

National Centre for Social Research
26
Table 3-5 Mean length of placement call (mins) by household size in 2003
Number ofpeople
Mean length Base
1 38 2,4192 52 3,0573 60 1,2644 63 1,1605 68 3766 70 1177 (79) 278 (86) 99 (90) 410 (87) 4
Table 3-6 Mean length of placement call (mins) by household size in 2004
Number ofpeople
Mean length Base
1 39 2,2322 54 2,9623 59 1,2094 64 1,0715 67 3996 68 1167 (84) 298 (84) 69 (90) 410 (69) 3
3.8 The reminder call
Once the travel record had been placed, the next stage was to remind the householdto start recording their journeys on the date allocated to them. Interviewers did thiseither by sending a reminder card, or by making a reminder phone call one or twodays before the start of the Travel Week. See Table 3-7 for details of reminder callsand the sending of reminder cards in 2003 and 2004.

National Centre for Social Research
27
Table 3-7 Proportion of productive households where a reminder wasconducted2003 Fully co-
operatingPartially co-operating
Total
% % %Reminder phone call 41 31 40Reminder card sent 13 9 13No reminder card or phone call 46 60 47
Base (households) 8,255 1,000 9,2552004 Fully co-
operatingPartially co-operating
Total
% % %Reminder phone call 38 27 37Reminder card sent 10 10 10No reminder card or phone call 52 63 53
Base (households) 8,118 900 9,018
Reminder phone calls were generally short, lasting 3.4 minutes on average in both2003 and 2004. Interviewers were instructed to make the call when they wereparticularly concerned about the household's commitment to filling in their traveldiaries, or when there was a gap of several days between the placement call and theTravel Week.
3.9 The mid-week check call
Interviewers also had the option of conducting a call half-way through the TravelWeek, in order to encourage and help respondents with any difficulties they might behaving filling out their travel diaries. This could be either a phone call or a personalvisit, and was at the interviewer’s discretion, although they were strongly encouragedto conduct a face-to-face check for elderly participants. The proportion and type ofmid-week checking calls conducted are shown in Table 3-8 below.

National Centre for Social Research
28
Table 3-8 Proportion of productive households where a mid-week checkconducted
2003 Fully co-operating
Partially co-operating
Total
% % %Mid week check conducted by phone 38 24 37Mid week check conducted in person 22 14 21No mid week check 40 63 42
Base (households) 8,256 1,000 9,2562004 Fully co-
operatingPartially co-operating
Total
% % %Mid week check conducted by phone 37 23 36Mid week check conducted in person 22 13 21No mid week check 41 64 43
Base (households) 8,117 900 9,017
As shown above, in both 2003 and 2004, the majority of fully productive householdsreceived a mid-week check, either by phone or face-to-face. Partially co-operatinghouseholds were less likely to receive one; this is likely to be because interviewerswould not conduct a check for those who refused the travel record directly after theplacement interview. The mid-week check call lasted 5.4 minutes on average in 2003and 5.0 minutes in 2004.
3.10 The Pick-up call
At the end of the Travel Week, the interviewer called at the household (generallywithin a few days) to pick up and check the Travel diaries and to carry out anothermuch shorter interview, known as the pick-up interview. The topics covered by thisinterview are shown below:
Figure 3-7 Pick-up interview topics
HOUSEHOLD INDIVIDUAL VEHICLE
New vehicles acquiredsince placement
New driving licences acquired sinceplacement
Fuel gauge details
Disposal of vehiclesrecorded at placement
New season tickets acquired sinceplacement
Mileage details
Long distance journeys betweenplacement and the start of the Travel
Week
At pick-up, both the Fuel and Mileage chart and the Long Distance Journey recordswere collected, checked, and the details transferred into the CAPI questionnaireeither during the interview or later on by the interviewer at home.
If all household members had completed a travel record and the placementquestionnaire was complete, the household was also issued with a promissory note

National Centre for Social Research
29
which informed them of the number of £5 gift vouchers they would receive. Thesevouchers would then be sent to them by the operations department.
The pick-up interview could be done either on the laptop, or using a paperquestionnaire which was transferred into the Blaise questionnaire by the interviewerafterwards or by the operations team when paperwork was returned to the office.6
On average, the pick-up call (including the interview and checking the travel records)lasted 22.4 minutes in 2003 and 22.3 minutes in 2004. This call was made within sixdays of the end of the Travel Week.
3.11 Outcome coding
Interviewers were required to assign an outcome code to every address in theirassignment. The range of possible outcomes is shown in Figure 3.8.
The fully and partially co-operating codes (11-13 and 21-23) were automaticallycomputed by the CAPI questionnaire. For a household to be classed as fully co-operating, the placement interview had to be fully completed and filled in traveldiaries had to be collected for all household members. To be classed as fullycompleted, the placement interview needed the household section, all individualinterviews (whether in person or by proxy), and at least one vehicle section (ifapplicable) to be completed.
The household was coded as partially co-operating if any of the following applied:
• The household section of the placement questionnaire was not completed
• Anyone was coded as ‘not available’ for the individual section
• No vehicle questionnaire sections were complete (if applicable)
• Travel records were not collected for all household members at pick-up
• Any of the travel records were incomplete (e.g. missing days)
6 The paper version of the pick-up questionnaire was introduced in 2002 to enable interviewers do thepick-up interview on the doorstep where respondents were unwilling to let them into the property again.

National Centre for Social Research
30
Figure 3-8 NTS outcome codes
Outcome CodeFULLY CO-OPERATINGFully productive: All desired respondent(s) in person 11Fully productive: Partly by desired respondent(s), partly by proxy 12Fully productive: By proxy 13
PARTIALLY CO-OPERATINGPartial productive: Desired respondent(s) 21Partial productive: Partly by desired respondent(s), partly by proxy 22Partial productive: By proxy 23
NON-CONTACTNo contact with anyone at address 31 MULTI-HOUSEHOLDS ONLY: Contact made at address, but not with member ofselected household
32
Contact made at selected household but not with any responsible member 33
REFUSALOffice refusal 41MULTI-HOUSEHOLDS ONLY: information refused before selection of householdscomplete (i.e. no of h’holds)
42
Refusal at introduction/before interview 43Refusal during interview 44Broken appointment – no recontact 45
OTHER UNPRODUCTIVEIllness at home during survey period 51Absence from home/in hospital all survey period 52Physical or mental incapacity 53Language difficulties 54OFFICE APPROVAL ONLY - Lost productive 55OFFICE APPROVAL ONLY - Other unproductive 56
UNKOWN ELIGIBILTYOFFICE APPROVAL ONLY - Not attempted 61OFFICE APPROVAL ONLY – Inaccessible 62OFFICE APPROVAL ONLY - Unable to locate address 63Unknown whether address contains residential housing 64Residential address – unknown whether occupied by eligible household 65Other unknown eligibility 67
INELIGIBLE/DEADWOODOFFICE APPROVAL ONLY - Unable to locate/address doesn’t exist 70Not yet built/under construction 71Demolished/derelict 72Vacant/empty 73Non-residential address e.g. business, school, office factory etc. 74Address occupied, no resident household e.g. holiday or weekend home 75Communal Establishment/Institution (no private dwellings) 76Residential, but no eligible respondent (e.g. no-one aged 16 and over) 77OFFICE USE ONLY - Address out of sample 78Other ineligible 79

National Centre for Social Research
31
3.12 The £5 gift voucher incentive
In 2002 an experiment to test the effect of offering incentives to NTS samplemembers was conducted from the beginning of the July 2002 quota until the end ofthe December 2002 quota (see section 3.12 in the 2002 NTS Technical report, andStratford et al. 2003). This experiment found that offering an incentive didsignificantly increase the likelihood of gaining full household co-operation. At the endof 2002, it was decided that the incentive payment would be offered as a part of theNTS survey for 2003 onwards
Interviewers gave each household a signed promissory note if all householdmembers had completed the placement interview and completed a travel record.These notes promised the delivery (by post) of £5 vouchers by the operationsdepartment. Interviewers then sent their copy of the promissory note to theoperations department. On receipt of the signed promissory notes, the travel diarieswere inspected, and high street vouchers were sent to the household if thedocuments met the specified criteria of completeness.
3.13 Response rates
The tables below show the national response rates for 2003 and 2004, as well as theInner and Outer London and National (excluding London) response rates for thesame periods. The overall response rate in 2003 was 60% but this was lower in Inner(46%) and Outer London (51%), and higher in the rest of the country (62%). In 2004,the overall response rate was also 60% and was lower in Inner (43%) and OuterLondon (49%), and higher in the rest of the country (62%).
Table 3-9 NTS National response rates in 2003
Achieved Sample Rate Standard Response RateNumber % %
Set sample 15048Additional households 147Total dealt with 15195 100Ineligible/deadwood 1412 9Unknown eligibility 201 1Eligible households7 13765 100Fully co-operating 8259 54 60Partially co-operating 1000 7 7Refusal to co-operateand other unproductive
3780 25 29
Non-contact 543 4 4
7 The number of eligible households is estimated by assuming that the proportion eligible among thoseof ‘unknown eligibility’ is the same as the proportion known to be eligible among the rest of the sample.

National Centre for Social Research
32
Table 3-10 NTS Inner London response rates in 2003
Achieved Sample Rate Standard Response RateNumber % %
Set sample 968Additional households 76Total dealt with 1044 100Ineligible/deadwood 181 17Unknown eligibility 15 1Eligible households 862 100Fully co-operating 396 38 46Partially co-operating 84 8 10Refusal to co-operateand other unproductive
276 26 33
Non-contact 92 9 11
Table 3-11 NTS Outer London response rates in 2003
Achieved Sample Rate Standard Response RateNumber % %
Set sample 1232Additional households 21Total dealt with 1253 100Ineligible/deadwood 99 8Unknown eligibility 16 1Eligible households 1153 100Fully co-operating 585 47 51Partially co-operating 111 9 10Refusal to co-operateand other unproductive
381 30 34
Non-contact 61 5 5

National Centre for Social Research
33
Table 3-12 NTS National excluding London response rates in 2003
Achieved Sample Rate Standard Response RateNumber % %
Set sample 12848Additional households 50Total dealt with 12898 100Ineligible/deadwood 1132 9Unknown eligibility 170 1Eligible households 11750 100Fully co-operating 7278 56 62Partially co-operating 805 6 7Refusal to co-operateand other unproductive
3123 24 28
Non-contact 390 3 3
Table 3-13 NTS National response rates in 2004
Achieved Sample Rate Standard Response RateNumber % %
Set sample 15048Additional households 170Total dealt with 15218 100Ineligible/deadwood 1585 10Unknown eligibility 243 2Eligible households 13611 100Fully co-operating 8124 53 60Partially co-operating 898 6 7Refusal to co-operateand other unproductive
3872 25 30
Non-contact 496 3 4

National Centre for Social Research
34
Table 3-14 NTS Inner London response rates in 2004
Achieved Sample Rate Standard Response RateNumber % %
Set sample 968Additional households 111Total dealt with 1079 100Ineligible/deadwood 191 18Unknown eligibility 36 3Eligible households 885 100Fully co-operating 378 35 43Partially co-operating 92 9 10Refusal to co-operateand other unproductive
287 27 35
Non-contact 95 9 12
Table 3-15 NTS Outer London response rates in 2004
Achieved Sample Rate Standard Response RateNumber % %
Set sample 1232Additional households 22Total dealt with 1254 100Ineligible/deadwood 155 12Unknown eligibility 18 1Eligible households 1097 100Fully co-operating 541 43 49Partially co-operating 93 7 8Refusal to co-operateand other unproductive
396 32 37
Non-contact 51 4 5

National Centre for Social Research
35
Table 3-16 NTS National excluding London response rates in 2004
Achieved Sample Rate Standard Response RateNumber % %
Set sample 12848Additional households 37Total dealt with 12885 100Ineligible/deadwood 1239 10Unknown eligibility 189 1Eligible households 11629 100Fully co-operating 7205 56 62Partially co-operating 713 6 6Refusal to co-operateand other unproductive
3189 25 29
Non-contact 350 3 3
As mentioned in section 2.4, the NTS oversamples Inner and Outer London with theaim of achieving responding sample sizes that reflect the regional distribution withoutthe need for corrective weighting. The degree of oversampling in both 2003 and2004, was based on estimates of differences in response rates between InnerLondon, Outer London and the rest of Great Britain and on mid-1998 populationestimates.
Despite oversampling, Inner and Outer London are still slightly under-represented(see Table 3-17). This will be corrected from 2006 when NTS data for 2005 andprevious years will be published on a weighted basis.
Table 3-17 Regional distribution of the 2003 and 2004 NTS compared with mid2003 population estimates
Inner London(%)
Outer London(%)
Rest of GB(%)
Whole of GB(%)
2003 AchievedSample
4.7 7.5 87.8 100
2004 Achievedsample
4.5 7.3 88.2 100
Mid 2003populationestimates
5.0 7.7 87.2 100
3.14 The non-response survey
Non-response may bias the results of the NTS. For example, if those who do notrespond to the survey are busier and do considerably more travel than those who dorespond, then the amount of personal travel may be under-represented in the NTSresults.
To investigate this possibility, non-response information was collected using a non-response form to provide data on whether the characteristics of non-respondentsdiffered to those of participants. This form gathered information about thedemographic characteristics and travel behaviour of household members.

National Centre for Social Research
36
Interviewers were instructed to ask Non-Response Form (NRF) questions once itbecame apparent that an interview was not going to be achieved at that visit to theaddress. These questions were located at the back of the Address Record Form (seeAppendix K). This meant that non-response data was available for brokenappointments and for households that refused to participate. In both 2003 and 2004 aNRF was completed on the doorstep at 31 percent of refusing households.
In 2003 and for the majority of 2004, self-completion postal NRFs were left at non-contact addresses, and respondents posted these back to NatCen. In late 2004, theprocedure for dealing with these postal NRFs changed, with interviewers informingthe operations department about a non-contact address on the Address record form,who subsequently sent out a form to the address. Response to the postal NRFs waslow in both years and despite postal reminders only 23 percent of non-contactsreturned an NRF in 2003 and 24 percent in 2004.
In addition, translations of the postal NRF were made into the four most commonAsian languages (Gujarati, Punjabi, Urdu, and Bengali) and these were posted tohouseholds which had been unable to take part in the main survey due to inadequateEnglish or the lack of availability of a household member able to translate or aid theinterviewer.
Further data were collected on non-responding households via an interviewer-completed observation form which also formed part of the ARF. This was completedat 89 percent of non-productive addresses in 2003 and 93 percent in 2004.
Weighting the data to correct for non-response bias will be introduced from 2006when NTS data for 2005 and previous years will be published on a weighted basis.
3.15 Back-checking and quality control
Like all NatCen projects in the field, the NTS was backchecked to ensure thatinterviewers were working to the standards to which they were trained and inaccordance with the specific project requirements on which they were briefed.
A minimum of 10% of the total productive interviews were backchecked, the majority(usually 90%) by telephone but where this was not possible (usually 10%) by letter. Ifthe responses received indicated significant deviations from the standards set, asupervisor was asked to revisit the address/addresses concerned personally.Backchecking was carried out usually within 2 weeks, and always within 4 weeks, ofthe interview date.
A percentage of ineligible (out of scope) addresses were also checked by letter tocheck the residential status of the sampled address. Of the 11 interviewers selectedper month, a maximum of 4 deadwood addresses per interviewer were checked.
All interviewers working on the NTS are also subject to twice yearly supervisions(one of which is a review supervision) to confirm that they are working to the higheststandards.
National Centre for Social Research
37
4 DATA PROCESSING
4.1 Diary coding and entry
After collection and brief checking by interviewers, the 7 day travel diaries werereturned to NatCen’s operations department where, after initial checking, they wereentered into the Diary Entry System (DES) by a team of editors. The coding of dataitems such as journey purpose, origin and destination, method of travel, ticket typeetc. took place as the data were entered into the system.
The NTS Diary system is a supplementary system to the National Travel Survey. It isused for the entry and validation of data entered by respondents into their Traveldiaries. The data entered are stored in a SQL server database ‘NTS_Diary’. Thesoftware was developed using Visual Basic version 5. Basic details of diaries enteredinto the office are recorded using the Diary Receipt program, which is also used torecord a batch number.
Once recorded as received into the office, travel record data were entered using theDiary Entry program. This also has a number of subsidiary screens for displayingrelevant information to assist data entry, and to enter further data specific to day 7only. A screen to create journey details as a repeat or a duplicate of another journeyis also provided.
An export facility then transforms all the travel record data entered for a wave intotext files. This is called the “Quantum Export” as the data is fed into softwaredeveloped using Quantum. Following the export of the data, the text files wereprocessed outside the NTS Diary system. An edit checking program was run on thefiles to do a comprehensive set of consistency checks, with a report being produced.The NTS diary system was used to rectify any validation errors reported, and thedata re-exported. When the data were clean they were delivered to the survey’ssponsors, the DfT.
4.2 Editing the travel record data
Two extensive sets of checks were run on the travel record data. First, certain checkswere applied in the DES as the travel record data were entered. These checks wereput in place in order to catch keying errors and implausible or impossible datacombinations. The editor either dealt with these errors immediately, or if they couldnot resolve them, they referred them to an experienced supervisor.
Once the data were entered and coded, a second set of checks was run on the data.These checks looked for inconsistencies with the CAPI data (for example ahousehold with no car saying they used their own car for a journey). The CAPI datawere checked and, if appropriate, either these or the travel record data were altered.
4.3 Geocoding of address data
Up to 2001, the only information recorded on travel diaries about the origin anddestination of journeys was the name of the town or village. However, in 2002 and forsubsequent survey years, respondents were required to provide more details. For

National Centre for Social Research
38
day 7 only, respondents were asked the full address (including the postcode if theyknew it) for the origin and destination of their journeys.
This assignment of a postcode to the origin and destination of journeys enablesfurther analysis of the NTS data, as it allows other coding to be applied includingward, urban/rural classification and National Transport Model (NTM) code.
An external company - Gatepost Systems – is used to supply and validate postcodesfrom the locations recorded, using approximations as needed. The tables below givedetails of the level of accuracy at which Gatepost coded the destination and origindetails provided in the travel diaries on day 7 in both 2003 and 2004.
Table 4-1 Accuracy of postcode validation in 2003
Origin (%) Destinations (%)Accurate postcode - exactlymatches that location
88.6 88.5
Very close proximity -accurate to street level
3.2 3.4
Accurate to locality 8.1 8.0Uncodeable (e.g. shops withno locality or town information)
0.1 0.2
Table 4-2 Accuracy of postcode validation in 2004
Origin (%) Destinations (%)Accurate postcode - exactlymatches that location
88.1 88.3
Very close proximity -accurate to street level
5.3 5.2
Accurate to locality 6.5 6.4Uncodeable (e.g. shops withno locality or town information)
0.03 0.03
4.4 Coding and editing the CAPI questionnaire data
4.4.1 Examining notes
If a query or problem arose during the interview, interviewers could use a functionwithin the Blaise CAPI programme to open a ‘memo’ to record it. At the operationsdepartment, these notes were printed on paper factsheets for each household, andone of the tasks of the CAPI coders was to examine them and see whether anyaction needed to be taken as a result of the message.
4.4.2 Back-coding other answers
The next task of the CAPI coders was to examine cases where a respondent hadgiven an ‘other answer’ to some of the pre-coded questions. During an interview, ifnone of the pre-codes was felt to apply to a particular question, the response wouldbe recorded verbatim by the interviewer. All such answers were examined by codersand back-coded to one of the existing codes if applicable.

National Centre for Social Research
39
4.4.3 SOC & SIC coding
In 2003 and 2004, the occupation and industry of respondents aged 16 and over wascoded using the Standard Occupational Classification (SOC2000) and StandardIndustrial Classifications (SIC 1992). The National Statistics Socio-economicClassification (NS-SEC) was derived from SOC2000 and employment status, andwas used as a social class measure. Details of the classifications are set out inFigures 4.1- 4.3.
Figure 4-1 Standard Occupational Classification 2000 (SOC 2000)
Description CodeCorporate managers 11Managers and proprietors in agriculture and services 12Science & technology professionals 21Health professionals 22Teaching & research professionals 23Business & public service professionals 24Science & technology associate professionals 31Health & social welfare associate professionals 32Protective service occupations 33Culture, media & sports occupations 34Administrative occupations 41Secretarial & related occupations 42Skilled agricultural trades 51Skilled metal & electric trades 52Skilled construction & building trades 53Textiles, printing & other skilled trades 54Caring personal service occupations 61Leisure & other personal service occupations 62Sales occupations 71Customer service occupations 72Process, plant & machine operatives 81Transport & mobile machine drivers & operatives 82Elementary trades, plant & storage related occupations 91Elementary administration & service occupations 92
Figure 4-2 Standard Industrial Classification 1992 (SIC92)
Description CodeAgriculture, hunting & forestry AFishing BMining & quarrying CManufacturing DElectricity, gas & water supply E

National Centre for Social Research
40
Figure 4-2 Standard Industrial Classification 1992 (SIC92)
Construction FWholesale & retail trade; repair of motor vehicles, motorcycles & personal &household goods
G
Hotels & restaurants HTransport, storage & communication IFinancial intermediation JReal estate, renting & business activities KPublic administration & defence; compulsory social security LEducation MHealth & social work NOther community, social & personal service activities OPrivate households with employed persons PExtra-territorial organisations & bodies Q
Figure 4-3 National Statistics Socio-economic Classification (NS-SEC)Analytic Classes
Description CodeLarge employers and higher managerial occupations 1.1Higher professional occupations 1.2Lower managerial & professional occupations 2Intermediate occupations 3Small employer & own account workers 4Lower supervisory & technical occupations 5Semi-routine occupations 6Routine occupations 7
4.4.4 Registration number checking
Since 2002 respondents to the NTS have been asked to give the registration numberof all household vehicles. The reason for this is that the more technical informationabout a vehicle (for example, type of fuel used, and taxation class) can be gainedthrough the DVLA database of vehicles, rather than having to ask respondentsdirectly. It was felt that information gained in this way would be more accurate andwould mean a shorter interview. If the respondent refused to give the registrationnumber, then questions about engine size etc. were asked directly in the interview.
On the whole, respondents were willing to give their registration number – they werecollected for 92 percent of vehicles in 2003 and 91 percent in 2004. However,checking by DfT showed that around 10 percent of these were invalid numbers.Either they did not match any number on the DVLA database, or if there was amatch, the vehicle make and model details on the database for that registrationnumber were different from the details that the respondent had provided.
The reason for this was investigated by re-contacting the respondents and confirmingthe registration number with them. Errors by interviewers accounted for at least someof the inaccuracy, for example transposition of digits and confusion of similar-sounding letters. In other cases, the respondent had not remembered the registrationnumber accurately. In 2003, in 28 percent of cases, the respondent confirmed thatthe registration number was actually correct whilst in 2004, 31 percent did. Often

National Centre for Social Research
41
these were new vehicles and it seems likely that the DVLA database extract used byDfT did not yet include their details (since the DVLA database extract is updatedquarterly). The registration numbers were rerun at the end of the survey year tocollect details for those vehicles which weren't included on the earlier DVLA dataextracts. In addition, each month, members of the operations team attempted to re-contact all those respondents where the registration number appeared inaccurate.They succeeded in getting a new registration number in 48 percent of cases in 2003,and 49 in 2004.
4.4.5 Vehicle coding
Each year, for each vehicle, the length of the vehicle and the size of the fuel tankneeded coding. Unfortunately, neither of these details are available from the vehiclelogbook or the information held by DVLA. Instead within the vehicle section of theBlaise questionnaire a database containing information obtained from carmanufacturers or motoring magazines about the vehicle length and fuel tank size fordifferent makes and models was used to code this information. This is referred to asthe car-coding frame. And because car manufacturers sometimes vary the size offuel tank fitted to a particular model depending on the year it was manufactured, thecoding frame was broken down by year of manufacture.
The fuel tank size was automatically assigned for most vehicles where theregistration number was not given using the car-coding frame. However, if thevehicle’s make and model was not listed in this database and the respondent couldnot provide information on the fuel tank size, editors were required to look up theinformation if possible.
Those respondents that gave the registration number of the vehicle were not routedthrough this part of the vehicle questionnaire, and therefore the fuel tank size andlength were not coded at this point. For these vehicles, once the DVLA data hadbeen extracted, a set of lookup tables were used to link the make and model codeassigned to the vehicle by DVLA to the list of make and models on the car-codingframe. This was not a one to one relationship as DVLA sometimes issue severaldifferent model codes for some vehicle models.
4.4.6 Distance checks and area coding
From 2002, inter-county distance checks, which had been developed by DfT, wereapplied during editing by NatCen. If a distance between two places seemedimplausible, coders were instructed to check the distance by using an atlas or web-based distance estimator (such as the RAC site). If they were able to estimate amore plausible distance (and there were no notes from interviewers explaining that,for example, the respondent took a detour), then they altered the distance.
Sometimes, it was not the distance that was incorrect but the origin or destinationthat had been incorrectly coded, for example when two or more towns share thesame name in different counties. In these instances, editors referred to the longdistance journey record or checked with interviewers.
Where the interviewer had been unable to allocate a code for county, unitaryauthority or area type for the journey origin or destination, editors were required toallocate the correct code. Where the place visited was not listed on the gazetteer

National Centre for Social Research
42
used in the CAPI questionnaire, they were instructed to code it to the nearest placelisted that was within the same local authority.
4.4.7 Data conversion
The data were organised into nine record types households, individuals (tworecords), vehicles, long distance journeys made in the three weeks before the TravelWeek (two records), days within the Travel Week, journeys made during the TravelWeek, and the stages of these journeys (see Figure 4-4). Individual data variablesoccupied fixed column positions within these records. For ‘continuing’ variables,present in both past and present data sets, the columns occupied were the same asin previous years for compatibility with the existing DfT programmes. Columnpositions that were used by variables that were dropped were not re-used. Newvariables occupied new column positions on the same record, or if necessary, theywere continued on a further record.
The missing value scheme is uniform throughout and employs two minus values:
• -9 signifies ‘not applicable’, i.e. when data are expected to be absent becausefilter conditions that apply are not met. (‘Off route’ in Blaise). This is ‘DNA’ in thedatabase.
• -8 signifies ‘non response’ for whatever reason when filter conditions are met.The distinct values in Blaise for ‘don’t know’ and ‘refused’ are thus combined intoa single missing value. This is ‘NA’ in the database.
The records and variables required by DfT were a sub-set of all the data available.NatCen mapped the additional data to separate data records and assembled all thedata, including data for unproductives, in a single Quantum level data set, from whichdifferent data sets were exported and supplied to DfT:
• The required fixed format records
• SPSS data sets at each level including all available variables
Figure 4-4 NTS record types, 2003 and 2004
Record type Data LevelRecord 1 Households HouseholdRecord 2 Vehicles VehicleRecord 3 Individuals (continued on record 9) IndividualRecord 4 Long Distance Journeys 1 (these data occur once
per individual)Individual
Record 5 Long Distance Journeys (these data occur once perjourney)
Journey
Record 6 Days DayRecord 7 Journeys JourneyRecord 8 Stages StageRecord 9 Individuals2 (continuation of record 3) Individual

National Centre for Social Research
43
5 VARIABLES IN THE 2002/2003 NTS DATABASE
5.1 Introduction
This chapter contains a detailed description of variables in the 2002/2003 NTSdatabase. The list is not meant to be exhaustive. However, most of the omittedvariables are either used to calculate other variables or are not suitable for producingcross-tabulations. In addition, there are many variables on the database which havebeen created by aggregating categories of the variables listed here.
The data are held in an eight-level hierarchical database, as shown in Figure 5.1below.
Figure 5-1 The NTS 8-level hierarchical database
Primary Sampling Unit (PSU)
Household
Individual Vehicle
Long Distance trip Day
Trip
Stage
Over 200 variables are contained at these different levels. These can be cross-tabulated across levels, although it can be difficult to draw relationships betweenvariables in different ‘branches’ of the database, for example, between vehicle levelvariables and individual or stage level variables.
Variables that contain quantitative data, such as age and stage distance, are bandedfor convenience in data extraction. However, the majority of these are also availableas unbanded numeric variables. The banded variables normally have variablenumbers 1 higher than the numeric variable to which they relate. For example,variable v93 contains actual milometer readings from respondents’ vehicles andvariable v94 bands these together into 15 groups (‘Up to 2000 miles’, ‘2001-4000miles’ and so on). Banded variables that are based upon numeric variables aremarked as such in their full listing.
The vast majority of NTS variables are single-coded (i.e only one answer is given tothe question by the respondent). However, some variables are multi-coded. Anexample is i314 (Difficulties with car trips), where more than one answer can begiven. Multi-coded variables are marked as such in the definitions given below. Thereare also some variables for which more than one set of information may need to be

National Centre for Social Research
44
recorded. For example, where an individual has more than one special ticket/pass,information is collected on each ticket/pass. In these cases, information on eachseason ticket/pass is stored in a different variable (e.g. I185, I191, I197 etc).
Variables can have up to two values that can be defined as not available: ‘NA’ and‘DNA’.
NA (not available) indicates that the value is missing or unknown. In most cases,data are imputed into the final dataset using a variety of procedures (see below).
DNA (does not apply) indicates that the question was not asked of somerespondents. Block routing in the questionnaire means that certain questions areskipped when they clearly do not apply to a respondent. For example, someone 10years of age would not be asked whether he/she was employed; someone whoresponded that they were unemployed would not be asked what problems theyencountered on their trip to work.
Where questions were unanswered, or where specific details of trips were omitted,data is imputed, providing there is a reasonably sound basis for doing so. This stage,known as ‘patching’, is applied to all key variables to simplify analyses.
The patching process relies entirely on the available information in the survey dataset. No attempt is made to constrain the final distribution in the sample to conformwith other data sources.
Most missing values are patched using automatic rules, although some are examinedon a case by case basis to enable a sensible estimate to be made. The automaticrules are of two broad types:
Related variables – this method uses variables that provide related informationabout the respondent, and uses these values to select the best estimate. Forexample, if a vehicle’s taxation class was not provided, it could be assumed byexamining the vehicle type.
‘Hotdecking’ – this method uses related variables to find another record in thedataset that is similar, in all significant respects, to the record to be patched. Themissing value is then patched using the value from the related record.
In addition to cross-tabulating NTS variables in any combination, variables can alsobe used as filters, to perform tabulations on a subset of the sample, for examplethose under 16.
To ease the burden on respondents, we ask that respondents record short walkstages (walks of less than one mile) only on the seventh day of their travel record. Tocompensate for this, short walk trips on the seventh day are weighted by a factor ofseven.
With the above exception, there is currently no other weighting of NTS data.However, following the NTS Quality Review 2000, work has been undertaken toweight the data for known sources of survey bias. Weighted data will be madeavailable from 2006 (see section 9.6).
The remainder of this chapter is structured as follows:

National Centre for Social Research
45
5.2 List of the main variables5.3 Primary Sampling Unit variables5.4 Household variables5.5 Vehicle variables5.6 Individual variables5.7 Long-distance trip variables5.8 Trip variables5.9 Stage variables
Within each subsection, variables are grouped by topic, and the following informationis given, where appropriate:
Sources: for all NTS derived variables, the reference numbers of the sourcevariables are given. Similarly, where variables are derived from more than onequestion in the questionnaire, this is explained.
Definitions: where technical definitions are implicit in the design of the questions orthe coding of the variables, these definitions are explained.
Imputation: where records in the variable have been imputed, a short description ofthe imputation used is included.
Banded variables: where the variable is a banded version of an unbanded numericvariable, this information is shown, along with the reference number of the originalvariable.
Modular variables: some questions are asked only every other year. Variablesbased upon these questions are identified as such.
In the tables below the first column lists the name of the value within each variable.The second column gives the number of records with this value in the 2002/2003combined database. The third column gives this count as a percentage of all records.Records with no value for the variable (either ‘NA’ or ‘DNA’), are excluded from thetotal for this purpose

National Centre for Social Research
46
5.2 List of main variables
PSU (Primary Sampling Unit)variables
Area geography
P2 Government Office RegionP5 Type of areaP6 PSU population densityP7 LA population densityP15 County of residenceP17 Stratum codeP18 UA of residence
Concessionary fares schemes
P10 Type of concessionP12 Times availableP13 Areas availableP14 Modes additional to bus
Household variables
Address
H12n Address typeH50 Type of tenancyH51 Length of residenceH134 Why move to current addressH135 Main reason for movingH148 Importance of public transport inchoice of homeH154 Type of area
Accessibility of public transport
H13 Walk time to bus stopH14 Frequency of bus serviceH15 Walk time to railway stationH16 Bus time to railway stationH17 Type of railway stationH136 Rail/metro/tram stop closer thanrailway
H137 Walk time to LU/light rail/tramstopH138 Bus time to LU/light rail/tramstop
Accessibility of services
H18 Walk time to doctor’s surgeryH19 Bus time to doctor’s surgeryH20 Walk time to nearest Post OfficeH21 Bus time to nearest Post OfficeH22 Walk time to nearest chemistH23 Bus time to nearest chemistH24 Walk time to nearest food storeH25 Bus time to nearest food storeH26 Walk time to nearest shoppingcentreH27 Bus time to nearest shoppingcentreH28 Walk time to nearest generalhospitalH29 Bus time to nearest generalhospital
Household vehicle access
H35 Number of bicyclesH52 Number of household three andfour wheeled carsH53 Number of motorcyclesH54 Number of vans/lorriesH55 Number of cars/light vansH56 Car/light van availabilityH57 Household vehicle availabilityH63 Persons with full car licenseH107 Number of household companycars
Household composition
H58 Number of people in householdH59 Household structure (family)H60 Household structureH61 Household structure (NTS)H62 Disabled adult in householdH74 Number of adultsH75 Number of children

National Centre for Social Research
47
Social and economic
H65 HRP working statusH66 HRP employment statusH69 HRP Industry typeH70 Household IncomeH83 Employed in householdH84 Real household incomeequivalent semi-deciles (2002-03basis)H85 Real household incomeequivalent quintiles (2002-03 basis)H108 ACORN classificationH121 Index of multiple deprivationH132 Household working structureH151 Index of multiple deprivation(2004 basis)
Opinions of local transport options
H122 Rate the frequency of localbusesH123 Rate the reliability of local busesH124 Rate the frequency oftrains/underground/metroH125 Rate the reliability oftrains/underground/metroH126 Rate the quality of localpavementsH127 Rate the provision of local cyclelane/paths
Shopping
H139 Ordering by phone, post orinternetH140 How often deliveredH141 Goods in last deliveryH142 How goods were orderedH143 How bought otherwiseH147 Reasons for no main foodshopping
Rail and bus tickets
H149 Combined rail and bus ticketsavailable in area
Vehicle level variables
Vehicle Reference
V92 Rank of car in householdVI3 Gender of main driverVI6P Pensionable status of main driver
Vehicle details
V3 Type of vehicleV15 Taxation classV87 Engine capacityV91 AgeV130 Make and modelV150 Car adapted for disabled driverV164 CO2 emissions
Mileage
V46 Estimate of annual mileageV94 Total mileageV96 Mileage in Travel WeekV98 Eligible mileageV121 Ineligible mileageV122 Reasons for ineligible mileageV140 Annual vehicle commutingmileageV142 Annual vehicle business mileageV144 Annual vehicle private mileage
Vehicle registration
V85 Registration - ownershipV89 Registration letterV90 Year of first registrationV103 Purchase/hire costsV112 Company car summaryV131 Month of registration
Fuel
V88 Type of fuelV100 Fuel purchasedV102 Fuel costV135 Fuel consumed

National Centre for Social Research
48
Parking
V145 Parking – overnight locationV146 Parking – distance from houseV147 Type of parking paymentV149 Annual parking fee
Delivery of goods
V155 Frequency of delivery of goodsin course of workV156 Number of delivery points
Travel outside GB
V158 Number of miles outside GBV159 Purpose of trip outside GBV161 Number of miles in NIV162 Purpose of trip in NI
Individual level variables
Personal details
I2 Relationship to household referencepersonI3 GenderI6 AgeI268 Legal marital statusI269 Living arrangementsI277 Why no spouse in householdI275 Ethnic group
Social and economic
I79 Industry typeI80 Employee/self-employedI177 Working statusI178 Individual incomeI243 Government training schemeI245 Unpaid work for family businessI276 Responsibility for supervisingother employeesI397 Employment statusI398 NS-SEC
Unemployment
I244 Away from work whilst on trainingschemeI247 Looking for work/training in last 4weeksI248 Immediate availability forgovernment training schemeI249 Why not available for workI250 Left last paid jobI300 Turned down job because oftransport difficultiesI301 Transport difficulties preventingwork
Work travel benefits
I302 Travel benefits at workI303 Travel benefits offered to meI304 Use free/reduced price busticketsI305 Use free/reduced price trainticketsI306 Use interest free travel loanI307 Use employer’s bus/vanI308 Alternative to company carI395 Use interest free loan for parkingseason ticketI396 Use cut price or free car parking
Tickets and passes
I106/I126/I146/I357/I358/I359Ticket/pass mode(s)I185/I191/I197/I342/I347/I352Ticket/pass typeI186/I192/I198/I343/I348/I353Ticket/pass mode priorityI187/I192/I199/I344/I349/I354Ticket/pass validityI189/I195/I201/I346/I351/I356Ticket/pass useI205/I206/I207/I360/I361/I362Ticket/pass weekly cost

National Centre for Social Research
49
Travel difficulties
I165 Travel difficultiesI212 Disabled driversI214 Years since last droveI290 Why difficult to use a busI314 Difficulties with car tripsI315 Most difficult problem with cartripsI363 Difficulties travelling by footI364 Disability causes difficulties inusing local busI292 Special transport servicesavailable
Travel to work
I92 WorkplaceI180 Usual means of travel to workI220 County of workI267 Work Place UAI270 Work place urban/ruralI316 Travel to work another day.I317 Why difficult to travel to workanother wayI318 Most difficult problem withtravelling another wayI319 Any difficulties travelling to workby other modesI320 Most difficult problem travellingby other modesI321 Car unused while at workI322 Why don’t use car for workI323 Main reason don’t use car forwork
Driving
I182 Driving licenceI183 Driving experienceI203 Access to car
Home working
I257 Work at home instead of usualworkplaceI258 Day of week worked at homeI309 Possible to work at home?I310 How often work at home?I311 Why not work at home (moreoften)?
I312 Possible to work at home withouttelephoneI313 Possible to work at home withoutcomputer
Public transport use
I261 Frequency of bus useI262 Frequency of express bus/coachuseI263 Frequency of surface rail useI264 Frequency of taxi/minicab useI266 Frequency of domestic air flightsuse
CyclingI265 Frequency of bicycle useI271 Own or use a bicycleI272 Ridden a bicycle in the last 12monthsI273 Where did you cycle
School travel
I278 Daily school tripI280 How far to school (time)I282 How far to school (distance)I283 Method of school travelI284 Accompanied to school by anadultI285 Reason accompanied to schoolI286 Age first accompanied to schoolI287 Reason accompanied to schoolbefore allowed aloneI288 Allowed to cross roadsI289 Allowed to cross main roads
Walking
I293 Frequency of walkingI294 Where respondent walkedI296 Time walk tookI298 Distance walkedI299 Method of travel to start of walk
Shopping

National Centre for Social Research
50
I324 Usual mode when travelling formain food shoppingI325 Difficulties with car travel for mainfood shoppingI326 Most difficult problem withcar/travel for main food shoppingI327 Main food shopping another wayI328 Why difficult to do main shoppinganother wayI329 Main difficulty to do mainshopping another wayI330 Difficulties with public transportfor main food shoppingI331 Main difficulty with publictransport for main food shoppingI332 Car unused while doing mainfood shoppingI333 Why car not used for main foodshoppingI334 Main reason why car not used formain food shopping
Difficulties accessing services
I335 Any other travel difficultiesI336 Difficulties with travel todoctor/hospitalI337 Difficulties with travel tofriends/relativesI338 Difficulties with travel to socialactivitiesI339 Difficulties with travel withchildren to schoolI340 Difficulties with travel tocollege/universityI341 Difficulties with other travel
Playing in the street
I366/I372/I378/I384/I390 Playtime starttimeI368/I374/I380/I386/I392 Playtime endtimeI370/I376/I382/I388/I394 Playtimeelapsed time
Long distance trip level variables
L3 Calendar monthL5 Origin (county)
L6 Destination (county)L7 Purpose toL8 Mode of transportL10 DistanceL12 PurposeL13 Purpose fromL14 Origin (UA)L15 Destination (UA)L16 Urban/rural coding of originL17 Urban/rural coding of destination
Trip level variables
Reference
J52 Day (of week)
Trip type
J14 Series of callsJ23 Number of stagesJ37 Short walk
Trip mode and purpose
J24 Purpose fromJ26 Purpose toJ28 PurposeJ36 Main mode of transport
Trip time and distance
J30 Overall travelling timeJ31 Start timeJ33 Overall trip timeJ34 Trip lengthJ40 Overall speedJ41 Mean travel speedJ56 Mid-point timeJ60 End timeJ61 Hours when trip was in progress
Origin and destination
J57 Origin (county)J58 Destination (county)J63 Origin (UA)J64 Destination (UA)J65 Urban/rural coding of originJ66 Urban/rural coding of destination

National Centre for Social Research
51
Cost
J62 Total cost of public transport trip
Stage level variables
Stage details
S2 Mode of transportS15 Number of boardingsS24 Means of travelS26 Length of stageS27 Stage speedS28 Short walkS37 Travel time
Number in party
S8a Number in party (adults)S8c Number in party (children)S8t Number in party (total)
Private vehicles
S18 Private vehicle occupantS19 Where parkedS21 Parking cost (pence)
Tickets and costs
S30 Ticket cost (1)S32 Ticket cost (2)S34 Total costS35 Type of ticket
VARIABLE DETAILS
5.3 PSU level variables
These variables describe the 1,368postcode sectors (or sector groups)that represent the primary samplingunits (PSUs) from which the sample ofhouseholds was selected in 2002 and2003 (684 in each year).
The survey months run mid-month tomid-month. Up to 2001, data werepresented on a calendar year basis.There were therefore some PSUs inthe December quota that containedhouseholds with Travel Weeks inDecember of that year, and others withTravel Weeks in January of thefollowing year.
From 2002 onwards, the survey hasused ‘survey years’ as its basis fordata extractions. So, for example,‘survey year’ 2002 includes allhouseholds sampled from mid-January2002 to mid-January 2003.
The value of a PSU variable applies toall households living within that PSU.Unlike almost all other variables in thesurvey, the PSU variables were notderived from information provided bymembers of the sampled households.

National Centre for Social Research
52
Area geography
P2 Government Office Region
1 North East Met 26 1.9%2 North East Non-Met 34 2.5%3 NW & Merseyside Met 92 6.7%4 NW & MerseysideNon-met
68 5.0%
5 Yorkshire &Humberside Met
78 5.7%
6 Yorkshire &Humberside Non-met
38 2.8%
7 East Midlands 97 7.1%8 West Midlands Met 60 4.4%9 West Midlands Non-met
60 4.4%
10 Eastern 124 9.1%11 Greater London 200 14.6%12 South East 184 13.5%13 South West 115 8.4%14 Wales 68 5.0%15 Scotland Met 59 4.3%16 Scotland Non-Met 65 4.8%Total 1368 100%
P2 is an aggregation of P15.
A variable (P2g) is available whichaggregates these categories to GORsand countries. Where appropriate, themetropolitan areas and remainders aredistinguished within regions. Themetropolitan areas are included inregions as follows:
- North East (Tyneside met.)- NW and Merseyside
(Manchester, Liverpool met.)- Yorks and Humber (West
Yorkshire met.)- West Midlands (West Midlands
met.)- Scotland (Glasgow met.)
P5 Area Type
1 Inner London 88 6.4%2 Outer London b/u area 140 10.2%3 West Midlands b/uarea
51 3.7%
4 Greater Manchesterb/u area
60 4.4%
P5 Area Type5 West Yorkshire b/uarea
33 2.4%
6 Glasgow b/u area 17 1.2%7 Liverpool b/u area 23 1.7%8 Tyneside b/u area 22 1.6%9 Other urban over 250K 165 12.1%10 Other urban over100K to 250K
140 10.2%
11 Other urban over 50Kto 100K
117 8.6%
12 Other urban over 25Kto 50K
112 8.2%
13 Other urban over 10Kto 25K
160 11.7%
14 Other urban over 3Kto 10K
112 8.2%
16 Rural 128 9.4%Total 1368 100%
NTS urban/rural analyses are nowdone at the household level usingvariable h154. Variable p5 is stillavailable but is no longer used. It isincluded here for information and forconsistency with previous years. (SeeH154 for definition of area type.)
P6 PSU Population density (pers/hec)
1 Under 1 133 9.7%2 1 to 4.99 208 15.2%3 5 to 9.99 130 9.5%4 10 to 14.99 102 7.5%5 15 to 19.99 111 8.1%6 20 to 24.99 90 6.6%7 25 to 29.99 88 6.4%8 30 to 34.99 80 5.8%9 35 to 39.99 80 5.8%10 40 to 44.99 64 4.7%11 45 to 49.99 59 4.3%12 50 to 59.99 70 5.1%13 60 to 74.99 59 4.3%14 75 and over 94 6.9%Total 1368 100%
P6 is derived from 1991 Censusfigures and represents an approximateestimate of the number ofpersons per hectare for the sector. It isderived taken from thesampling frame.

National Centre for Social Research
53
P7 LA Population density (pers/hec)
1 Under 1 139 10.2%2 1 to 1.99 161 11.8%3 2 to 3.49 132 9.6%4 3.5 to 4.99 82 6.0%5 5 to 9.99 197 14.4%6 10 to 14.99 133 9.7%7 15 to 19.99 72 5.3%8 20 to 24.99 88 6.4%9 25 to 34.99 161 11.8%10 35 to 44.99 87 6.4%11 45 and over 116 8.5%Total 1368 100%
P7 is derived from 1991 Censusfigures and represents an approximateestimate of the number of people livingin private households per hectare inthe local authority. It is more reliablethan the PSU density estimate in P6.However, it relates to a much largerarea and is,therefore, less closely matched to theneighbourhoodsof the sampled addresses.
P15 County of residence
1 Avon 17 1.2%2 Bedfordshire 14 1.0%3 Berkshire 16 1.2%4 Buckinghamshire 12 0.9%5 Cambridgeshire 19 1.4%6 Cheshire 22 1.6%7 Cleveland 10 0.7%8 Cornwall 4 0.3%9 Cumbria 19 1.4%10 Derbyshire 21 1.5%11 Devon 32 2.3%12 Dorset 12 0.9%13 Durham 11 0.8%14 East Sussex 14 1.0%15 Essex 34 2.5%16 Gloucestershire 17 1.2%17 Greater Manchester 59 4.3%18 Hampshire 37 2.7%19 Hereford andWorcester
15 1.1%
20 Hertfordshire 16 1.2%21 Humberside 20 1.5%22 Isle of Wight 3 0.2%23 Kent 37 2.7%
P15 County of residence24 Lancashire 27 2.0%25 Leicestershire 19 1.4%26 Lincolnshire 20 1.5%27 London Central 3 0.2%28 Other Inner London 85 6.2%31 Other London notCentral
112 8.2%
32 Merseyside 33 2.4%33 Norfolk 18 1.3%34 Northamptonshire 10 0.7%35 Northumberland 13 1.0%36 North Yorkshire 18 1.3%37 Nottinghamshire 27 2.0%38 Oxfordshire 18 1.3%39 Shropshire 9 0.7%40 Somerset 18 1.3%41 South Yorkshire 30 2.2%42 Staffordshire 23 1.7%43 Suffolk 15 1.1%44 Surrey 12 0.9%45 Tyne and Wear 26 1.9%46 Warwickshire 13 1.0%47 West Midlands 60 4.4%48 West Sussex 22 1.6%49 West Yorkshire 48 3.5%50 Wiltshire 15 1.1%51 Clwyd 10 0.7%52 Dyfed 11 0.8%53 Gwent 9 0.7%54 Gwynedd 5 0.4%55 Mid Glamorgan 15 1.1%56 Powys 1 0.1%57 South Glamorgan 8 0.6%58 West Glamorgan 9 0.7%59 Borders 3 0.2%60 Central 10 0.7%61 Dumfries andGalloway
1 0.1%
62 Fife 8 0.6%63 Grampian 12 0.9%64 Highlands 4 0.3%65 Lothian 19 1.4%66 Strathclyde 59 4.3%67 Tayside 8 0.6%68 Essex within M25 2 0.1%69 Hertfordshire withinM25
6 0.4%
70 Kent within M25 1 0.1%71 Surrey within M25 12 0.9%Total 1368 100%
P15 describes PSUs under the formersystem of counties, and are includedfor consistency with older data. P18 is

National Centre for Social Research
54
now used for analyses, whereappropriate.
P17 Stratum code
1 Inner London – East 56 4.1%2 Inner London – West 32 2.3%3 Outer London – Eastand North East
40 2.9%
4 Outer London – South 30 2.2%5 Outer London – Westand North West
42 3.1%
6 Devon and Cornwall 36 2.6%7 North Somerset, Bath,North East Somerset,Somerset and Dorset
37 2.7%
8 Bristol, SouthGloucestershire,Gloucestershire andDorset
42 3.1%
9 Oxfordshire,Buckinghamshire andBerkshire
46 3.4%
10 Hampshire and theIsle of Wight
40 2.9%
11 Kent 38 2.8%12 West Sussex andEast Sussex
36 2.6%
13 Surrey 24 1.8%14 Essex 36 2.6%15 Cambridgeshire,Suffolk and Norfolk
52 3.8%
16 Hertfordshire andBedfordshire
36 2.6%
17 Leicestershire,Lincolnshire andNorthamptonshire
49 3.6%
18 Warwickshire andHereford and Worcester
28 2.0%
19 West Midlands 60 4.4%20 Shropshire andStaffordshire
32 2.3%
21 Nottinghamshire andDerbyshire
48 3.5%
22 Cheshire 22 1.6%23 Merseyside 33 2.4%24 Greater Manchester 59 4.3%25 Lancashire andCumbria
46 3.4%
26 South Yorkshire 30 2.2%27 West Yorkshire 48 3.5%28 North Yorkshire andHumberside
38 2.8%
29 Cleveland, CountyDurham andNorthumberland
34 2.5%
30 Tyne and Wear 26 1.9%
P17 Stratum code31 Anglesey, Gwynedd,Conwy, Denbighshire,Flintshire, Wrexham,Powys
20 1.5%
32 Carmarthenshire,Neath Port Talbot,Pembrokeshire,Swansea
16 1.2%
33 Blaenau Gwent,Caerphilly,Monmouthshire,Newport, Torfaen
14 1.0%
34 Bridgend, Cardiff,Merthyr Tydfil, RhonddaCynon Taff, Glamorgan
18 1.3%
35 Grampian, Highland,Argyll and Bute
20 1.5%
36 Tayside, Fife andCentral
26 1.9%
37 Edinburgh, Lothianand Borders
22 1.6%
38 Glasgow andDunbartonshire
20 1.5%
39 Lanarkshire,Renfrewshire andInverclyde
24 1.8%
40 Ayrshire andDumfries & Galloway
12 0.9%
Total 1368 100%
These 40 strata can be used toprovide data at a sub-regional level.However, due to the relatively smallsample size of the NTS, data areaggregated over a number of years forsubregional analyses.
P18 UA of residence2003 only1 Bath and North EastSomerset
2 0.3%
2 Bedfordshire 1 0.1%3 Blackburn with Darwen 1 0.1%4 Blackpool 1 0.1%5 Bournemouth 2 0.3%6 Bracknell Forest 1 0.1%7 Brighton and Hove 3 0.4%8 Bristol, City of 3 0.4%9 Buckinghamshire 5 0.7%10 Cambridgeshire 7 1.0%11 Cheshire 10 1.5%12 Cornwall and Isles ofScilly
2 0.3%
13 Cumbria 10 1.5%14 Darlington 1 0.1%
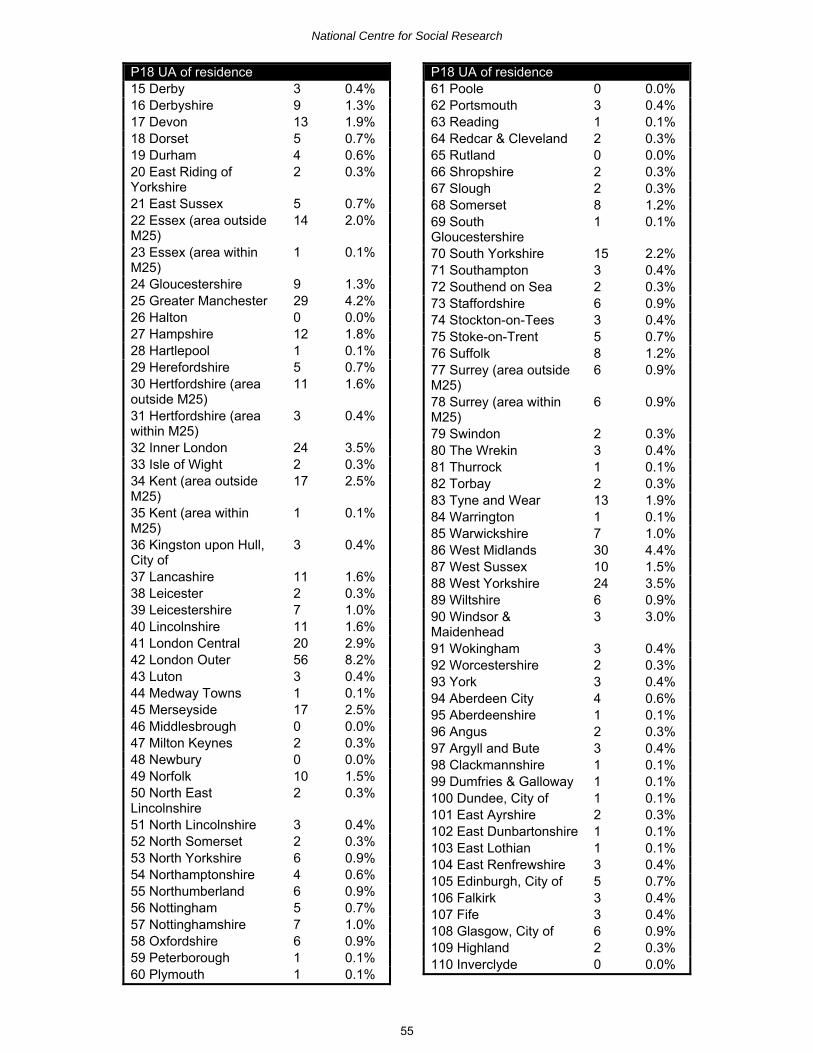
National Centre for Social Research
55
P18 UA of residence15 Derby 3 0.4%16 Derbyshire 9 1.3%17 Devon 13 1.9%18 Dorset 5 0.7%19 Durham 4 0.6%20 East Riding ofYorkshire
2 0.3%
21 East Sussex 5 0.7%22 Essex (area outsideM25)
14 2.0%
23 Essex (area withinM25)
1 0.1%
24 Gloucestershire 9 1.3%25 Greater Manchester 29 4.2%26 Halton 0 0.0%27 Hampshire 12 1.8%28 Hartlepool 1 0.1%29 Herefordshire 5 0.7%30 Hertfordshire (areaoutside M25)
11 1.6%
31 Hertfordshire (areawithin M25)
3 0.4%
32 Inner London 24 3.5%33 Isle of Wight 2 0.3%34 Kent (area outsideM25)
17 2.5%
35 Kent (area withinM25)
1 0.1%
36 Kingston upon Hull,City of
3 0.4%
37 Lancashire 11 1.6%38 Leicester 2 0.3%39 Leicestershire 7 1.0%40 Lincolnshire 11 1.6%41 London Central 20 2.9%42 London Outer 56 8.2%43 Luton 3 0.4%44 Medway Towns 1 0.1%45 Merseyside 17 2.5%46 Middlesbrough 0 0.0%47 Milton Keynes 2 0.3%48 Newbury 0 0.0%49 Norfolk 10 1.5%50 North EastLincolnshire
2 0.3%
51 North Lincolnshire 3 0.4%52 North Somerset 2 0.3%53 North Yorkshire 6 0.9%54 Northamptonshire 4 0.6%55 Northumberland 6 0.9%56 Nottingham 5 0.7%57 Nottinghamshire 7 1.0%58 Oxfordshire 6 0.9%59 Peterborough 1 0.1%60 Plymouth 1 0.1%
P18 UA of residence61 Poole 0 0.0%62 Portsmouth 3 0.4%63 Reading 1 0.1%64 Redcar & Cleveland 2 0.3%65 Rutland 0 0.0%66 Shropshire 2 0.3%67 Slough 2 0.3%68 Somerset 8 1.2%69 SouthGloucestershire
1 0.1%
70 South Yorkshire 15 2.2%71 Southampton 3 0.4%72 Southend on Sea 2 0.3%73 Staffordshire 6 0.9%74 Stockton-on-Tees 3 0.4%75 Stoke-on-Trent 5 0.7%76 Suffolk 8 1.2%77 Surrey (area outsideM25)
6 0.9%
78 Surrey (area withinM25)
6 0.9%
79 Swindon 2 0.3%80 The Wrekin 3 0.4%81 Thurrock 1 0.1%82 Torbay 2 0.3%83 Tyne and Wear 13 1.9%84 Warrington 1 0.1%85 Warwickshire 7 1.0%86 West Midlands 30 4.4%87 West Sussex 10 1.5%88 West Yorkshire 24 3.5%89 Wiltshire 6 0.9%90 Windsor &Maidenhead
3 3.0%
91 Wokingham 3 0.4%92 Worcestershire 2 0.3%93 York 3 0.4%94 Aberdeen City 4 0.6%95 Aberdeenshire 1 0.1%96 Angus 2 0.3%97 Argyll and Bute 3 0.4%98 Clackmannshire 1 0.1%99 Dumfries & Galloway 1 0.1%100 Dundee, City of 1 0.1%101 East Ayrshire 2 0.3%102 East Dunbartonshire 1 0.1%103 East Lothian 1 0.1%104 East Renfrewshire 3 0.4%105 Edinburgh, City of 5 0.7%106 Falkirk 3 0.4%107 Fife 3 0.4%108 Glasgow, City of 6 0.9%109 Highland 2 0.3%110 Inverclyde 0 0.0%

National Centre for Social Research
56
P18 UA of residence111 Midlothian 2 0.3%112 Moray 0 0.0%113 North Ayrshire 3 0.4%114 North Lanarkshire 3 0.4%115 Orkney Islands 0 0.0%116 Perth and Kinross 1 0.1%117 Renfrewshire 2 0.3%118 Scottish Borders 1 0.1%119 Shetland Islands 0 0.0%120 South Ayrshire 0 0.0%121 South Lanarkshire 4 0.6%122 Stirling 2 0.3%123 WestDunbartonshire
3 0.4%
124 West Lothian 2 0.3%125 Western Isles 0 0.0%126 Blaenau Gwent 1 0.1%127 Bridgend 1 0.1%128 Caerphilly 3 0.4%129 Cardiff 2 0.3%130 Carmarthenshire 2 0.3%131 Ceredigion 2 0.3%132 Conwy 0 0.0%133 Denbighshire 3 0.4%134 Flintshire 1 0.1%135 Gwynedd 1 0.1%136 Isle of Anglesey 1 0.1%137 Merthyr Tydfil 3 0.4%138 Monmouthshire 2 0.3%139 Neath and PortTalbot
2 0.3%
140 Newport 1 0.1%141 Pembrokeshire 2 0.3%142 Powys 1 0.1%143 Rhondda, Cynon,Taff
2 0.1%
144 Swansea 0 0.3%145 Torfaen 2 0.0%146 Vale of Glamorgan 1 0.3%147 Wrexham 0 0.1%Total 684 100%
Concessionary fares schemes
Variables P8-P14 contain informationon concessionary fare schemes forpensioners within PSUs. As theseschemes have changed over timesome of these variables are no longerused.
Variable P8 (availability ofconcessionary bus fares for
pensioners) is no longer used as, from2002, all local authorities were obligedto provide an OAP concessionary busfare scheme.
P9 (eligibility of concessionary busfare schemes for pensioners) is nolonger used as, from 2003, all areas inEngland, Wales and Scotland wereobliged to provide schemes for allpersons aged 60 and above.
P11 (membership fee forconcessionary bus fare scheme forpensioners) is no longer used as allschemes which were recorded werefree schemes.
P10 Type of concession
1 Free fare 490 33.6%2 Flat fare 144 10.5%3 Half fare 710 54.2%4 Two-thirds fare 0 0.0%5 Other reduced fare 24 1.8%6 Tokens: up to £15 0 0.0%7 Tokens: £15.01 to £30 0 0.0%8 Tokens: over £30 0 0.0%9 Tokens: valueunspecified/variable
0 0.0%
10 Mixture of fares andtokens
0 0.0%
11 Other type 0 0.0%Total 1368 100%
P10 gives the type of concession wasthat which was available to all personsaged 60 and above at no cost. Inspecial cases, where differentschemes were offered to 60-64 yearolds and to those aged 65 and above,the LA was coded according to thescheme for those aged 65 and above.In a number of cases, the concessionvaries for different types of peoplewithin the overall qualifying group. Thecategory ‘other reduced fare’ includesschemes offering varying levels of farereduction, as well as reductions notspecified in other categories
The value applied to households wasthe value for the appropriate LA. ForPSUs containing households in more

National Centre for Social Research
57
than one LA, the value taken for thePSU was the value for the LA to whichthe highest number of addresses werecoded.
P12 Times available
1 Anytime 542 39.6%2 Peak hours only 0 0.0%3 Off-peak only 29 2.1%4 Mixture of peak, off-peak
796 58.2%
5 Other time restrictions 1 0.1%Total 1368 100%
Peak hours are defined here as 6.30-9.00am and 4.00-6.30pm onweekdays. The value applied tohouseholds was the value for theappropriate LA. For PSUs containinghouseholds in more than one LA, thevalue taken for the PSU was the valuefor the LA to which the highest numberof addresses were coded.
P13 Areas available
1 District only or less 172 12.6%2 Above district, notcountywide
149 10.9%
3 Countywide 879 64.3%4 Above county 72 5.3%5 Other area restriction 96 7.0%Total 1368 100%
This defines the area of travel overwhich the scheme applies. The area isalso likely to define residentialqualifications in the great majority ofcases. District-wide schemes includeparish council schemes that applied inthe area administered by the districtcouncil. Category 2 includes cases inwhich adjacent districts combine toprovide a scheme that does notoperate throughout the county.
The value applied to households wasthe value for the appropriate LA. ForPSUs containing households in morethan one LA, the value taken for thePSU was the value for the LA to whichthe highest number of addresses werecoded.
P14 Modes additional to bus2002 only1 None 316 47.0%2 Public services only 268 39.8%3 Private / voluntaryservices only
70 10.4%
4 Both private / voluntaryand public
19 2.8%
5 Other 0 0.0%Total 673 100%NA 11
Some bus schemes permit members’concessionary travel on other modes.Private/voluntary services includeindependently operated services suchas social car schemes, and a variety ofcommunity transport such as dial-a-ride.
5.4 Household variables
In 2002/03, there were 15,695 fullyresponding households in the NTSsample, (7,437 in 2002 and 8,258 in2003).
The NTS defines a household as asingle person or a group of peoplewho use the sampled address as theironly or main residence and eithershare one meal a day or share theliving accommodation (a living room orsitting room). Where people havemore than one address, they areincluded if the sampled address istheir stated main residence. However,adult children who come home only forholidays are excluded; a householdmember (such as a member of thearmed services) away continuously forsix months or more is excluded;anyone continuously in residence forsix months or more (such as an aupair) is included.
The household reference person
General information about eachhousehold was collected at the initialinterview from the householdreference person (see below), spouse,or in some cases, another responsible

National Centre for Social Research
58
adult, using the householdquestionnaire. The householdreference person is defined as follows:
- In households with a solehouseholder, that person is thehousehold reference person.
- In households with jointhouseholders, the person withthe highest income is thehousehold reference person.
- If two or more householdershave exactly the same income,the elder is the householdreference person.
Additional household variables werederived from information collected onthe individual and vehiclequestionnaires.
Address type
H12n Address Type
1 House/bungalow(detached)
3669 23.4%
2 House/bungalow(semi-detached)
5106 32.5%
3 House/bungalow(terrace/end terrace)
4230 27.0%
4 House/bungalow (typeunknown)
1 0.0%
5 Flat/maisonette(purpose built)
2122 13.5%
6 Flat/maisonette (non-purpose built)
445 2.8%
7 Flat/maisonette (typeunknown)
1 0.0%
8 Other accommodationtype
121 0.8%
Total 15695 100%
This describes the residential unitoccupied by the household. Ahousehold living in a converted flat in asemi-detached house would beconsidered to be living in the flat, notthe house, as the former is theirresidential unit. A flat is generallydistinguished from rooms by having allits rooms contained behind one frontdoor.
Missing values are imputed from thetype of tenure, the household size, andthe pensionable status of the head ofhousehold.
H50 Type of tenancy
1 Own outright 5097 32.5%2 Buying with mortgage 6037 38.5%3 Part rent / partmortgage
83 0.5%
4 Rent 4296 27.4%5 Live rent free 181 1.2%6 Squatting 1 0.0%Total 15695 100%
Missing values for H50 are imputedbased on data for households withsimilar values for H12, H60 and H70.
H51 Length of residence
1 Under 1 yr (over 1mile)
1008 6.4%
2 Under 1 yr (under 1mile)
451 2.9%
3 1 under 2 years 1168 7.4%4 2 under 3 years 1052 6.7%5 3 under 5 years 1671 10.6%6 5 under 10 years 2631 16.8%7 10+ years 3324 21.2%8 Always lived here 4389 28.0%9 Under 1 year (milesNA)
1 0.0%
Total 15695 100%
This variable indicates the number ofyears the HRP has lived at theaddress.The distinction between categories 1,2 and 9 is made by asking thedistance moved from the respondent’sprevious residence.
Missing values are imputed from theage/sex of the household referenceperson.
Respondents who had moved in thelast three years were also asked whythey moved (H134), their main reasonfor moving (H135) and the importanceof the availability of public transport in

National Centre for Social Research
59
the local area when choosing theirhome (H148).
H134 Why move to current address
1 Better neighbourhood 866 23.6%2 Change ofemployment
333 9.1%
3 Closer to work/school 456 12.4%4 Closer to family/friends 537 14.6%5 Closer to shops/leisurefacilities
158 4.3%
6 Better public transport 116 3.2%7 Larger or betterhouse/flat
960 26.1%
8 Smaller or cheaperhouse/flat
338 9.2%
9 Moved in/split up withpartner
428 11.6%
10 Wanted to buy 374 10.2%11 To live independently 458 12.5%12 Other reason 427 11.6%Total 3677 100%NA 3DNA 12015
H135 Main reason for moving
1 Better neighbourhood 488 13.3%2 Change ofemployment
244 6.6%
3 Closer to work/school 242 6.6%4 Closer to family/friends 301 8.2%5 Closer to shops/leisurefacilities
26 0.7%
6 Better public transport 23 0.6%7 Larger or betterhouse/flat
654 17.8%
8 Smaller or cheaperhouse/flat
211 5.7%
9 Moved in/split up withpartner
343 9.3%
10 Wanted to buy 233 6.3%11 To live independently 321 8.7%12 Other reason 590 16.1%Total 3676 100%NA 4DNA 12015
H148 Importance of public transport inchoice of home
1 Very important 840 22.9%2 Fairly important 778 21.2%3 Not very important 866 23.6%
H148 Importance of public transport inchoice of home4 Not at all important 1183 32.3%Total 3667 100%NA 13DNA 12015
H154 Type of area
1 Inner London 727 4.6%2 Outer London built-uparea
1339 8.5%
3 West Midlands built-uparea
590 3.8%
4 Greater Manchesterbuilt-up area
621 4.0%
5 West Yorkshire built-up area
380 2.4%
6 Glasgow built-up area 161 1.0%7 Liverpool built-up area 251 1.6%8 Tyneside built-up area 257 1.6%9 Other urban over 250K 1737 11.1%10 Other urban over100K to 250K
1601 10.2%
11 Other urban over 50Kto 100K
1217 7.8%
12 Other urban over 25Kto 50K
1299 8.3%
13 Other urban over 10Kto 25K
1786 11.4%
14 Other urban over 3Kto 10K
1163 7.4%
15 Rural 2566 16.3%Total 15695 100%
Variable H154 is based on thedefinition of urban areas at the timeofthe 2001 Population Census. In simpleterms, an urban area is a continuousbuilt-up area, of at least 20 hectaresand with at least 1,500 residents. EachNTS household was assigned to anurban/rural category using a look-upfile from their postcode to the H154urban/rural category.
Accessibility of public transport
H13-H17 and H136-H138 describe theneighbourhood in terms of the nearestpublic transport. Information relates tothe nearest stop/station, even if this isnot the one normally used.

National Centre for Social Research
60
Interviewers are advised that anyonein the household can answer thesequestions, if it is felt that they have abetter knowledge of local services thanthe HRP.
These questions are measures of fact,not of opinion. Interviewers areencouraged to make use ofinformation other than that provided bythe household if this provides a moreaccurate indication of the true position.‘Walk time’ assumes a walk speed ofthree miles per hour, and takes noaccount of, for example, any infirmityor disability of the respondent.
Where a respondent replies that theydo not know how far away facilitiesare, they are encouraged to providetheir best estimate.
H13 Walk time to bus stop
1 6 minutes or less 13521 86.1%2 7-13 minutes 1578 10.1%3 14-26 minutes 420 2.7%4 27-43 minutes 75 0.5%5 44 minutes or more 101 0.6%Total 15695 100%
H14 Frequency of bus service
1 Less than once a day 143 0.9%2 At least once a day 1087 6.9%3 At least 1 an hour 3070 19.6%4 At least 1 every halfhour
5800 37.0%
5 At least 1 everyquarter hour
5595 35.6%
Total 15695 100%
H15 Walk time to railway station
1 6 minutes or less 957 6.1%2 7-13 minutes 1487 9.5%3 14-26 minutes 3846 24.5%4 27-43 minutes 2749 17.5%5 44 minutes or longer 6656 42.4%Total 15695 100%
H16 Bus time to railway station
1 No bus/quicker to walk 4157 26.5%
H16 Bus time to railway station2 6 minutes or less 1163 7.4%3 7-13 minutes 2350 15.0%4 14-26 minutes 4341 27.7%5 27 to 43 minutes 2210 14.1%6 44 minutes or longer 1474 9.4%Total 15695 100%
H17 Type of railway station
1 Frequent service allday
13848 88.2%
2 Frequent service rushhour only
656 4.2%
3 Less frequent service 1191 7.6%Total 15695 100%
H136 Light rail / metro / tram stop closerthan railway
1 London Underground 683 59.4%2 Metro 292 25.4%3 Light Rail 74 6.4%4 Tram 100 8.7%Total 1149 100%None 14525NA 21
H137 Walk time to LU/light rail/tram stop
1 6 mins or less 335 29.2%2 7-13 mins 312 27.2%3 14-26 mins 337 29.4%4 27-43 mins 78 6.8%5 44 mins or longer 85 7.4%Total 1147 100%NA / DNA 14548
H138 Bus time to LU/light rail/tram stop
1 No bus / quicker towalk
548 47.9%
2 6 minutes or less 52 4.5%3 7-13 minutes 67 5.9%4 14-26 minutes 247 21.6%5 27-43 minutes 227 19.9%6 44 minutes 2 0.2%Total 1143 100%NA / DNA 14552
The questions which define H137 andH138 are only asked where there is atube/light rail/tram stop closer than thenearest surface railway station.

National Centre for Social Research
61
Accessibility of services
Variables H18-H29 describe theneighbourhood in terms of theavailable amenities. Some of thesequestions are rotated, and weretherefore asked either in 2002 or in2003.
As above, walking speed is assumedto be three miles per hour.
H18 Walk distance to doctor’s surgery2002 only – modular1 6 minutes or less 1222 16.5%2 7-13 minutes 1478 19.9%3 14-26 minutes 2296 31.0%4 27-43 minutes 1074 14.5%5 44 minutes or more 1345 18.1%Total 7415 100%NA/DNA 8280
H19 Bus time to doctor’s surgery2002 only – modular1 No bus service /quicker to walk
3704 50.2%
2 6 minutes or less 939 12.7%
3 7-13 minutes 988 13.4%
4 14-26 minutes 1129 15.3%
5 27-43 minutes 416 5.6%6 44 minutes or more 202 2.7%Total 7378 100%NA/DNA 8317
H20 Walk distance to nearest Post Office2003 only, modular1 6 minutes or less 3333 40.4%2 7-13 minutes 2609 31.7%3 14-26 minutes 1756 21.3%4 27-43 minutes 339 4.1%5 44 minutes or more 205 2.5%Total 8242 100%NA/DNA 7453
H21 Bus distance to nearest Post Office2003 only, modular1 No bus service /quicker to walk
6320 77.0%
2 6 minutes or less 897 10.9%3 7-13 minutes 629 7.7%4 14-26 minutes 293 3.6%5 27-43 minutes 49 0.6%6 44 minutes or more 17 0.2%Total 8205 100%NA/DNA 7490
H22 Walk distance to nearest chemist2002 only, modular1 6 minutes or less 2286 30.8%2 7-13 minutes 2102 28.3%3 14-26 minutes 1901 25.6%4 27-43 minutes 501 6.7%5 44 minutes or more 640 8.6%Total 7430 100%NA/DNA 8265
H23 Bus time to nearest chemist2002 only, modular1 No bus service /quicker to walk
4567 61.8
2 6 minutes or less 1190 16.13 7-13 minutes 803 10.94 14-26 minutes 597 8.15 27-43 minutes 172 2.36 44 minutes or more 62 0.8Total 7391 100%NA/DNA 8304
H24 Walk time to nearest food store
1 6 minutes or less 8835 56.3%2 7-13 minutes 3892 24.8%3 14-26 minutes 2069 13.2%4 27-43 minutes 476 3.0%5 44 minutes or more 413 2.6%Total 15685 100%NA 10
H25 Bus time to nearest food store
1 No bus service/quickerto walk
12232 78.4%
2 6 minutes or less 1884 12.1%3 7-13 minutes 889 5.7%4 14-26 minutes 437 2.8%5 27-43 minutes 104 0.7%6 44 minutes or more 56 0.4%Total 15602 100%NA 93

National Centre for Social Research
62
H26 Walk time to nearest shopping centre2003 only, modular1 6 minutes or less 787 9.5%2 7-13 minutes 1329 16.1%3 14-26 minutes 2669 32.4%4 27-43 minutes 1390 16.8%5 44 minutes or more 2075 25.2%Total 8250 100%NA/DNA 7445
H27 Bus time to nearest shopping centre2003 only, modular1 No bus service/quickerto walk
2291 27.9%
2 6 minutes or less 773 9.4%3 7-13 minutes 1812 22.1%4 14-26 minutes 2365 28.8%5 27-43 minutes 712 8.7%6 44 minutes or more 257 3.1%Total 8210 100%NA/DNA 7485
H28 Walk time to nearest general hospital2002 only, modular1 6 minutes or less 182 2.5%2 7-13 minutes 329 4.5%3 14-26 minutes 972 13.2%4 27-43 minutes 1056 14.3%5 44 minutes or more 4845 65.6%Total 7384 100%NA/DNA 8311
H29 Bus time to nearest general hospital2002 only, modular1 No bus service/quickerto walk
1074 14.6%
2 6 minutes or less 244 3.3%3 7-13 minutes 645 8.8%4 14-26 minutes 1831 24.9%5 27-43 minutes 1754 23.8%6 44 minutes or more 1810 24.6%Total 7358 100%NA/DNA 8337
Household vehicle access
The number of bicycles covers all non-motorised bicycles or tricycles (otherthan toy cycles) in the household’spossession and used by members ofthe household aged six or older.
Missing values are imputed from thenumber of bicycle trips made in theTravel Week, and the number ofchildren in the household.
H35 Number of bicycles
1 No bikes 8339 53.1%2 One bike 3408 21.7%3 Two bikes 2376 15.1%4 Three bikes 912 5.8%5 Four bikes 536 3.4%6 Five or more bikes 124 0.8%Total 15695 100%
Variables H52-H55 are derived fromvariable V3. These variables arecounts of the numbers of vehicles ofvarious types owned or in regular useby the household (including any not inuse at the time but which might comeinto use in the next month).
Motorcycles (H53) include motorscooters, sidecar combinations andmopeds.
Cars/light vans (H55) include three-wheeled vehicles, light vans, LandRovers, Jeeps (or similar vehicles),minibuses, motor caravans anddormobiles.
H52 Number of household 3 and 4wheeled cars
1 None 4460 28.4%2 One 7375 47.0%3 Two 3374 21.5%4 Three 419 2.7%5 Four 52 0.3%6 Five or more 15 0.1%Total 15695 100%

National Centre for Social Research
63
H53 Number of motorcycles
1 None 15268 97.3%2 One 373 2.4%3 Two 42 0.3%4 Three or more 12 0.1%Total 15695 100%
H54 Number of vans/lorries
1 None 14959 95.3%2 One 701 4.5%3 Two 30 0.2%4 Three 5 0.0%5 Four 0 0.0%6 Five or more 0 0.0%Total 15695 100%
H55 Number of cars/light vans
1 None 4223 26.9%2 One 6944 44.2%3 Two 3852 24.5%4 Three 566 3.6%5 Four 80 0.5%6 Five or more 30 0.2%Total 15695 100%
H56 Car/light van availability
1 Car/light van (includingpool car)
11438 72.9%
2 Only new car/light van 19 0.1%3 Only “Possibly comeinto use”
52 0.3%
4 No car/light vanavailable
4185 26.7%
Total 15694 100%NA 1
H56 is derived from the vehiclequestionnaire. It distinguisheshouseholds with vehicles that are ineveryday use throughout the TravelWeek from those which are acquiredduring the week, and from those whichare unavailable (eg. broken down) atthe time of the placement interview,but which may be usable by the lastday of the Travel Week.
H57 Household vehicle availability
1 Three or morecars/vans
676 4.3%
2 Two cars/vans 3852 24.5%3 One car/van (private) 6470 41.2%4 One car/van (notprivate)
469 3.0%
5 Company pool car only 37 0.2%6 Two wheel motorvehicles only
33 0.2%
7 Other motor vehiclesonly
6 0.0%
8 One or more bicyclesonly
960 6.1%
9 No vehicles 3192 20.3%Total 15695 100%
H57 is derived from variables V3, V15and H35.
Missing values are imputed from thecount of household motor vehicles andthe count of household bicycles.
H63 Persons with full car licence
1 None 3329 21.2%2 One 5636 35.9%3 Two 5995 38.2%4 Three 612 3.9%5 Four or more 123 0.8%Total 15695 100%
H63 is derived from variable I182. Thecount includes holders of licences forcar only or for car and motorcycle.
H107 Number of household company cars
1 None 14783 94.2%2 One 846 5.4%3 Two 62 0.4%4 Three 2 0.0%5 Four 2 0.0%Total 15695 100%
H107 is derived from variable V112.

National Centre for Social Research
64
Household composition
All members of a household wererequired to complete a travel record.The size of the household is,therefore, equivalent to the number ofresponding individuals in the sample.
For household variables, a child isdefined as somebody aged 0-15;anyone aged 16+ is defined as anadult. Adult children refer to children ofthe HRP aged 16+.
H58 Number of people in household
1 4651 29.6%2 5791 36.9%3 2256 14.4%4 2023 12.9%5 705 4.5%6 194 1.2%7 45 0.3%8 19 0.1%9 6 0.0%10 5 0.0%Total 15695 100%
H59 Household structure (family)
1 2 adults youngest child0-4
1456 9.3%
2 1 adult youngest child0-4
302 1.9%
3 2 adults youngest child5-12
1507 9.6%
4 1 adult youngest child5-12
401 2.6%
5 2 adults youngest child13-15
513 3.3%
6 1 adult youngest child13-15
88 0.6%
7 Family adult child(ren) 1516 9.7%8 Adults include parentof HRP
121 0.8%
9 Pensioner household 4453 28.4%10 Other household 5338 34.0%Total 15695 100%
Missing values are imputed from theworking status of the individuals in thehousehold.
H60 Household structure
1 Single person under65
2375 15.1%
2 Single person 65 andolder
2276 14.5%
3 Two people, HRPunder 30
554 3.5%
4 Two people, HRP 30-64
3284 20.9%
5 Two people, HRP 65+ 1953 12.4%6 Three persons (1-2children)
1281 8.2%
7 Three adults 975 6.2%8 Four people (2-3children)
1384 8.8%
9 Four people (1 child) 313 2.0%10 Four adults 326 2.1%11 Five or more people(3+ children)
596 3.8%
12 Five or more people(1-2 children)
287 1.8%
13 Five or more adults 91 0.6%Total 15695 100%
H61 Household structure (NTS)
1 1 man under 65 1241 7.9%2 1 man 65 and over 656 4.2%3 1 woman under 60 898 5.7%4 1 woman 60 and over 1856 11.8%5 1 man, 1 child 26 0.2%6 1 woman, 1 child 381 2.4%7 1 man, 2+ children 21 0.1%8 1 woman, 2+ children 363 2.3%9 1 man, 1 woman (HRPpensioner)
1979 12.6%
10 1 man, 1 woman(HRP not pensioner)
3059 19.5%
11 2 men or 2 women 346 2.2%12 1 man, 1 woman, 1child
978 6.2%
13 2 men or 2 women, 1child
40 0.3%
14 1 man, 1 woman, 2children
1281 8.2%
15 2 men or 2 women, 2children
17 0.1%
16 1 man, 1 woman, 3children
379 2.4%
17 2 men or 2 women, 3children
5 0.0%
18 2 adults, 4 children 86 0.5%19 2 adults, 5 children 15 0.1%20 2 adults, 6 children 6 0.0%21 2 adults, 7+ children 3 0.0%

National Centre for Social Research
65
H61 Household structure (NTS)22 3 adults 975 6.2%23 3 adults, 1 child 313 2.0%24 3 adults, 2 children 145 0.9%25 3 adults, 3 children 38 0.2%26 3 adults, 4+ children 8 0.1%27 4 adults 326 2.1%28 4 adults, 1 child 84 0.5%29 4 adults, 2+ children 43 0.3%30 5 adults 68 0.4%31 5 adults, 1+ children 27 0.2%32 All other, no children 23 0.1%33 All other with children 9 0.1%Total 15695 100%
Household structure variables H59-H61 are derived from I2-I6 and I177.
H62 Disabled adult in household
1 HRP only 2647 16.9%2 Spouse/cohabitee only 786 5.0%3 Child only 56 0.4%4 Parent only 85 0.5%5 Other person only 38 0.2%6 HRP andspouse/cohabitee
449 2.9%
7 Other (2 or more) 105 0.7%8 None disabled 11529 73.5%Total 15695 100%
H62 is derived from variables I2, I5(the numeric variable that defines I6)and I165. The NTS use the term‘disabled’ to describe a person whohas difficulty, for reasons of long-standing poor health or physicaldisability, in using buses or cars or ingoing out of the house on foot. Thisincludes problems attributable to oldage.
H74 Number of adults
1 5442 34.7%2 8194 52.2%3 1479 9.4%4 453 2.9%5 95 0.6%6 24 0.2%7 or more 8 0.1%Total 15695 100%
H75 Number of children
1 0 11427 72.8%2 1 1843 11.7%3 2 1743 11.1%4 3 524 3.3%5 4 120 0.8%6 5 25 0.2%7 6 or more 13 0.1%Total 15695 100%Social and economic
H65 HRP working status
1 Full time 7829 49.9%2 Part time 1211 7.7%3 Unemployed 237 1.5%4 Retired/ permanentlysick
5437 34.6%
5 Student 144 0.9%6 Looking afterhome/family
652 4.2%
7 Other non-working 185 1.2%Total 15695 100%
H65 is derived from the HRP’sresponse to I177.
H66 Employment status
1 Self employed 1763 11.2%2 Employed manager 2045 13.0%3 Other employee 11370 72.4%4 Never worked 517 3.3%Total 15695 100%
H66 is derived from I2, I78 and I80.
H69 HRP Industry type
1 Agriculture etc. 278 1.9%2 Fishing 15 0.1%3 Mining, quarrying 185 1.2%
4 Manufacturing 3106 20.7%5 Energy, water 237 1.6%6 Construction 1223 8.1%7 Wholesale, retail andmotor trade
1809 12.0%
8 Hotels and restaurants 495 3.3%9 Transport, storage andcommunication
1196 8.0%
10 Financial 591 3.9%

National Centre for Social Research
66
H69 HRP Industry type11 Real estate, rentingand business activities
1541 10.3%
12 Public administrationand defence
1165 7.8%
13 Education 1159 7.7%14 Health and socialwork
1399 9.3%
15 Other community,social and personal
544 3.6%
16 Private householdswith employed persons
71 0.5%
17 Extra-territorialorganisations
7 0.0%
18 Workplace outsideUK
0 0.0%
Total 15021 100%NA 166DNA 508
For the purposes of H65-H66 andH68-H69, the household is classifiedaccording to the characteristics or thecircumstances of the HRP, and isderived from I79. ‘Unemployed’combines those waiting for and lookingfor a job.
H70 Household income
1 Less than £1000 92 0.6%2 £1000-£1999 104 0.7%3 £2000-£2999 142 0.9%4 £3000-£3999 270 1.7%5 £4000-£4999 580 3.7%6 £5000-£5999 816 5.2%7 £6000-£6999 585 3.7%8 £7000-£7999 535 3.4%9 £8000-£8999 882 5.6%10 £9000-£9999 498 3.2%11 £10000-£12499 974 6.2%12 £12500-£14999 942 6.0%13 £15000-£17499 1044 6.7%14 £17500-£19999 863 5.5%15 £20000-£24999 1415 9.0%16 £25000-£29999 1373 8.7%17 £30000-£34999 1131 7.2%18 £35000-£39999 922 5.9%19 £40000-£49999 1134 7.2%20 £50000-£74999 797 5.1%21 £75000 or more 596 3.8%Total 15695 100%
When the household contains only oneadult, the household’s income is that
of the HRP. When the householdcontains more than one adult, theincome of the whole household is anestimate by one household memberonly – either the HRP or the HRP’sspouse. Where information was notsupplied, values were imputed bytotalling the individual incomes of thehousehold members, the best estimatebeing the midpoint of the income band.When the individual incomes requiredfor this process were missing, theywere imputed first, using comparablecases for which income had beenreported (see I178).
H83 Employed in household
1 None 5883 37.5%2 1 part time, no full time 973 6.2%3 1 full time, no part time 3346 21.3%4 2 part time, no full time 153 1.0%5 1 full time, 1 part time 2000 12.7%6 2 full time, no part time 2366 15.1%7 1 full time, 2+ part time 157 1.0%8 2 full time, 1+ part time 336 2.1%9 3+ part time, no fulltime
20 0.1%
10 3+ full time, no parttime
368 2.3%
11 3+ full time, 1+ parttime
93 0.6%
Total 15695 100%
H83 is derived from I177.
H84 Real household equivalent semi-deciles (2002-2003 basis)
1st (lowest) 785 5.0%2nd 785 5.0%3rd 785 5.0%4th 784 5.0%5th 785 5.0%6th 785 5.0%7th 785 5.0%8th 784 5.0%9th 785 5.0%10th 785 5.0%11th 785 5.0%12th 784 5.0%13th 785 5.0%14th 785 5.0%15th 785 5.0%16th 784 5.0%

National Centre for Social Research
67
H84 Real household equivalent semi-deciles (2002-2003 basis)17th 785 5.0%18th 785 5.0%19th 785 5.0%20th (highest) 784 5.0%Total 15695 100%
Households are assigned to one oftwenty groups, ranked in ascendingorder of affluence. Households with anincome straddling two or more codebands are randomly allocated to oneof the bands, whilst ensuring thebands remain equal in size.
In addition to semi-deciles based upon2002-2003, there exist variables H84kand H84l, based upon 2002 and 2003individual years only.
H85 Real household income equivalentquintiles (2002-2003 basis)
1 Lowest real income 3139 20.0%2 Second level 3139 20.0%3 Third level 3139 20.0%4 Fourth level 3139 20.0%5 Highest real income 3139 20.0%Total 15695 100%
H85 is aggregated from H84.Correspondingly, there exist variablesH85K and H85L, which relate toindividual years 2002 and 2003respectively.
H108 ACORN® classification
1 Wealthy suburbs, largedetached houses
392 2.5%
2 Villages with wealthycommuters
465 3.0%
3 Mature affluent home-owning areas
469 3.0%
4 Affluent suburbs, olderfamilies
575 3.7%
5 Mature well-offsuburbs
358 2.3%
6 Agricultural villages,home-based workers
255 1.3%
7 Holiday areas, olderpeople, home-basedworkers
95 0.6%
8 Home-owning areas, 214 1.4%
H108 ACORN® classificationwell-off older residents9 Private flats, elderlypeople
204 1.3%
10 Affluent workingfamilies and mortgages
453 2.9%
11 Affluent workingcouples and mortgages,new homes
186 1.2%
12 Transient workforces,living at place of work
37 0.2%
13 Home-owning familyareas
319 2.0%
14 Home-owning familyareas, older children
422 2.7%
15 Families andmortgages, youngerchildren
321 2.0%
16 Well-off town and cityareas
141 0.9%
17 Flats and mortgages,singles/young workingcouples
160 1.0%
18 Furnishedflats/bedsits, youngersingle people
44 0.3%
19 Apartments, youngprofessionalsingles/couples
136 0.9%
20 Gentrified multi-ethnicareas
117 0.7%
21 Prosperous enclaves,highly qualifiedexecutives
79 0.5%
22 Academic centres,students/youngprofessionals
83 0.5%
23 Affluent city centreareas, tenements/flats
130 0.8%
24 Partially gentrifiedmulti-ethnic areas
116 0.7%
25 Convertedflats/bedsits, singlepeople
116 0.7%
26 Mature establishedhome-owning areas
557 3.5%
27 Rural areas, mixedoccupations
496 3.2%
28 Established home-owning areas
692 4.4%
29 Home-owning areas,council tenants/retiredpeople
423 2.7%
30 Established home-owning areas, skilledworkers
600 3.8%
31 Home owners in olderproperties, younger
570 3.6%

National Centre for Social Research
68
H108 ACORN® classificationworkers32 Home-owning areaswith skilled workers
715 4.6%
33 Council areas, somenew home owners
498 3.2%
34 Mature home-owningareas, skilled workers
494 3.1%
35 Low-rise estates,older workers, newhome owners
515 3.3%
36 Home-owning multi-ethnic areas, youngfamilies
179 1.1%
37 Multi-occupied towncentres, mixedoccupations
267 1.7%
38 Multi-ethnic areas,white collar workers
224 1.4%
39 Home owners, smallcouncil flats, singlepensioners
395 2.5%
40 Council areas, olderpeople, health problems
304 1.9%
41 Better-off councilareas, new homeowners
345 2.2%
42 Council areas, youngfamilies, some newhome owners
386 2.5%
43 Council areas, youngfamilies, many loneparents
262 1.7%
44 Multi-occupiedterraces, multi-ethnicareas
93 0.6%
45 Low-rise councilhousing, less well-offfamilies
350 2.2%
46 Council areas,residents with healthproblems
280 1.8%
47 Estates with highunemployment
162 1.0%
48 Council flats, elderlypeople, health problems
236 1.5%
49 Council flats, veryhigh unemployment
178 1.1%
50 Council areas, highunemployment, loneparents
216 1.4%
51 Council flats, greatesthardship, many loneparents
68 0.4%
52 Multi-ethnic, largefamilies, overcrowding
48 0.3%
53 Multi-ethnic, severeunemployment, lone
183 1.2%
H108 ACORN® classificationparents54 Multi-ethnic, highunemployment,overcrowding
49 0.3%
55 Could not classify 23 0.1%Total 15695 100%
Developed by CACI®, ACORN® is ageodemographic targetingclassification, which combinesgeographic and demographicinformation from the 1991 census toproduce a tool for classifying differenttypes of people in different areasthroughout Great Britain.
H121 Index of multiple deprivation
1 (most deprived) 1849 13.9%2 1895 14.2%3 1554 11.6%4 1390 10.4%5 1264 9.5%6 1180 8.8%7 1041 7.8%8 1034 7.7%9 552 4.1%10 (least deprived) 1589 11.9%Total 13348 100%NA 2347
The Index of Multiple Deprivation isbased upon the premise that multipledeprivation is made up of separatedimensions or ‘domains’ ofdeprivation. These domains reflectdifferent aspects of deprivation. Sixdomain indices (income, employment,health deprivation and disability,education skills and training, housingand geographical access to services)are combined to make the overallIndex of Multiple Deprivation.
The index of multiple deprivationapplies only to households in England.Households in Scotland or Wales arecoded as NA.
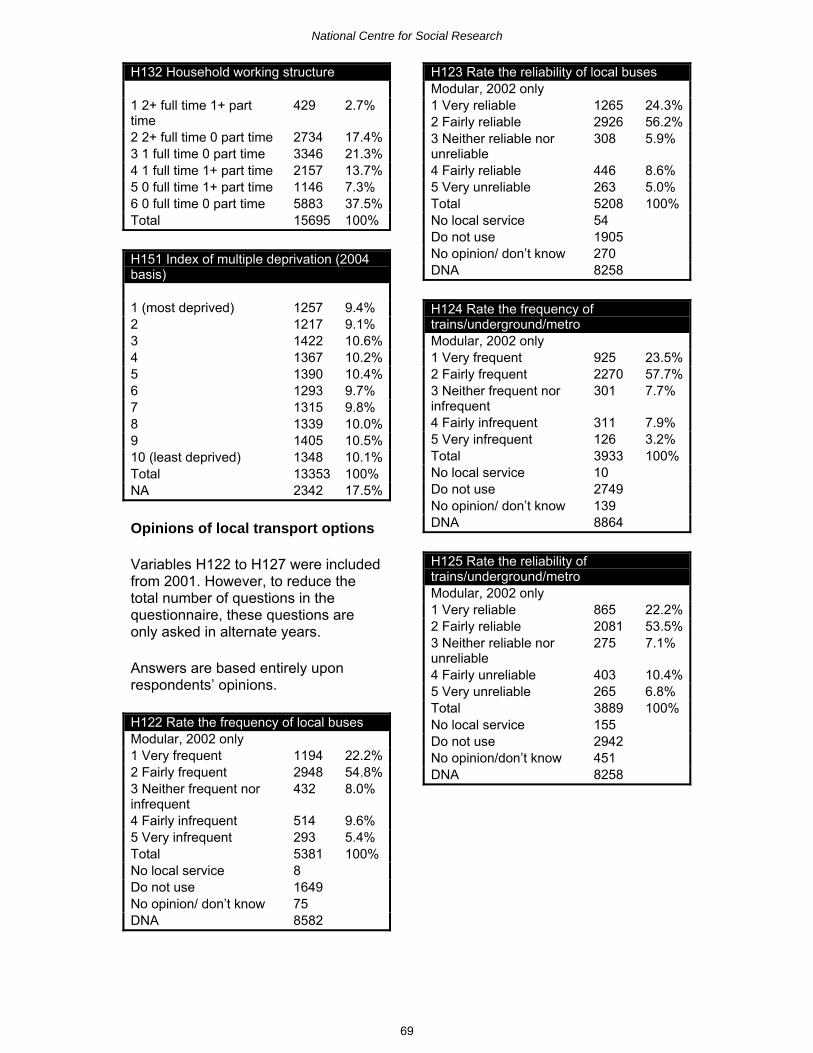
National Centre for Social Research
69
H132 Household working structure
1 2+ full time 1+ parttime
429 2.7%
2 2+ full time 0 part time 2734 17.4%3 1 full time 0 part time 3346 21.3%4 1 full time 1+ part time 2157 13.7%5 0 full time 1+ part time 1146 7.3%6 0 full time 0 part time 5883 37.5%Total 15695 100%
H151 Index of multiple deprivation (2004basis)
1 (most deprived) 1257 9.4%2 1217 9.1%3 1422 10.6%4 1367 10.2%5 1390 10.4%6 1293 9.7%7 1315 9.8%8 1339 10.0%9 1405 10.5%10 (least deprived) 1348 10.1%Total 13353 100%NA 2342 17.5%
Opinions of local transport options
Variables H122 to H127 were includedfrom 2001. However, to reduce thetotal number of questions in thequestionnaire, these questions areonly asked in alternate years.
Answers are based entirely uponrespondents’ opinions.
H122 Rate the frequency of local busesModular, 2002 only1 Very frequent 1194 22.2%2 Fairly frequent 2948 54.8%3 Neither frequent norinfrequent
432 8.0%
4 Fairly infrequent 514 9.6%5 Very infrequent 293 5.4%Total 5381 100%No local service 8Do not use 1649No opinion/ don’t know 75DNA 8582
H123 Rate the reliability of local busesModular, 2002 only1 Very reliable 1265 24.3%2 Fairly reliable 2926 56.2%3 Neither reliable norunreliable
308 5.9%
4 Fairly reliable 446 8.6%5 Very unreliable 263 5.0%Total 5208 100%No local service 54Do not use 1905No opinion/ don’t know 270DNA 8258
H124 Rate the frequency oftrains/underground/metroModular, 2002 only1 Very frequent 925 23.5%2 Fairly frequent 2270 57.7%3 Neither frequent norinfrequent
301 7.7%
4 Fairly infrequent 311 7.9%5 Very infrequent 126 3.2%Total 3933 100%No local service 10Do not use 2749No opinion/ don’t know 139DNA 8864
H125 Rate the reliability oftrains/underground/metroModular, 2002 only1 Very reliable 865 22.2%2 Fairly reliable 2081 53.5%3 Neither reliable norunreliable
275 7.1%
4 Fairly unreliable 403 10.4%5 Very unreliable 265 6.8%Total 3889 100%No local service 155Do not use 2942No opinion/don’t know 451DNA 8258

National Centre for Social Research
70
H126 Rate the quality of local pavementsModular, 2002 only1 Very good 330 4.7%2 Fairly good 2570 36.7%3 Neither good nor poor 994 14.2%4 Fairly poor 1535 21.9%5 Very poor 1565 22.4%Total 6994 100%Not many pavements inarea 369Do not use 51No opinion/don’t know 23DNA 8258
H127 Rate the provision of local cyclelanes/pathsModular, 2002 only1 Very good 399 9.9%2 Fairly good 1298 32.1%3 Neither good nor poor 482 11.9%4 Fairly poor 868 21.5%5 Very poor 994 24.6%Total 4041 100%No local cycle lanes 1846Do not use 1057No opinion/ don’t know 493DNA 8258
Shopping
H139 Ordering by phone/post or InternetMulticoded1 Food and drink 1996 19.5%2 Clothes 5771 56.5%3 Books 5012 49.1%4 Furniture 2308 22.6%5 Travel 5215 51.0%6 Tickets (non travel) 3255 31.9%7 Plants/bulbs 1173 11.5%8 Health goods 735 7.2%9 Other 1721 16.8%Total 10216 100%DNA 5479
H139 asks respondents whether they(or anyone else in the household) everordered goods over the phone, by postor on the Internet, and recorded allthat applied.
Values were recorded for variablesH140-H143 only for respondents whohad ordered goods in one of theseways.
H140 How often delivered
1 3 or more times aweek
92 0.9%
2 Once or twice a week 559 5.5%3 More than twice amonth
797 7.8%
4 Once or twice a month 2782 27.2%5 More than twice a year 3484 34.1%6 Once or twice a year 2173 21.3%7 Less than once a year 324 3.2%Total 10211 100%NA 5DNA 5479
H141 Goods in last deliveryMulticoded1 Food and drink 818 8.3%2 Clothes 2832 28.7%3 Books 2060 20.9%4 Furniture 518 5.2%5 Travel 1535 15.5%6 Tickets (non travel) 677 6.9%7 Plants/bulbs 251 2.5%8 Health goods 212 2.1%9 Other 1017 10.3%Total 9880 100%NA 7DNA 5808
In contrast to H139, variable H141asked respondents to tell us the goodsthat arrived in their last delivery ofgoods ordered by phone, post orInternet. The question is only asked ofthose who had ordered goods in thepreceding year.
Where respondents ordered more thanone type of goods together,interviewers recorded all that applied.
Plants/bulbs and health goods wereincluded from 2003 onwards and werepreviously coded as ‘other’.
H142 How goods were ordered
Phone 5609 56.9%Post 1433 14.5%Internet 2814 28.6%Total 9856 100%NA 24DNA 5815

National Centre for Social Research
71
H143 How bought otherwise1 In person 6154 62.5%2 By phone 1074 10.9%3 By post 942 9.6%4 Over the Internet 621 6.3%5 By fax 36 0.4%6 On the doorstep 8 0.1%7 Asked someone elseto buy
129 1.3%
8 Would not have bought 844 8.6%9 Other 39 0.4%Total 9847 100%NA 9DNA 5839
Variable H143 records howrespondents think they wouldotherwise have bought the goodsreceived in their last delivery of goodsordered by phone, post or Internet.
H147 Reasons for no main food shopping1 Delivered by shop 10 28.6%2 Most food eaten out 4 11.4%3 Other 21 60.0%Total 35 100%DNA 15660Rail and bus tickets
H149 Combined rail and bus ticketsavailable in areaModular, 2002 only1 Yes 1936 26.1%2 No 1440 19.4%3 Don’t know 3939 53.1%4 No local service 109 1.5%Total 7424 100%NA 13DNA 8258
5.5 Vehicle level variables
The majority of vehicle-level variablesare asked explicitly of respondents inthe vehicle questionnaire. However,respondents are asked to provide theirvehicle’s registration mark. If therespondent agrees to do so, thecorrect values for variables V15, V88-V91, V130-V131 and V164 are
extracted directly from the DVLAdatabase.
If the respondent refuses to providetheir registration mark, the questionsthat provide values for these variablesare asked explicitly of the respondentor, in the case of V164, the variable iscoded as NA.
Vehicle reference
V92 Rank of car in household
1 First 4528 26.9%2 Second 4528 26.9%3 Third 676 4.0%4 Fourth 110 0.7%5 Fifth 30 0.2%6 Sixth or lower 9 0.1%7 Only car 6944 41.3%8 Secondary vehicle 74 0.4%Total 16825 100%DNA 560
For the purposes of variable V92,vehicles are ranked in descendingorder of annual mileage. V92 appliesonly to cars, light vans, LandRovers/Jeeps, minibuses, motorcaravans and dormobiles.
A ‘secondary vehicle’ is one that thehousehold acquires during the TravelWeek. These are not assigned a rank,as the length of time the vehicle hasbeen available is too short to makesuch a judgement.
Missing values for V92 are imputedusing V45 (Estimated annual mileage).
Each household vehicle is linked to itsmain driver in the household. The NTSdefines the main driver as thehousehold member who drives themost miles in the vehicle over thecourse of a year
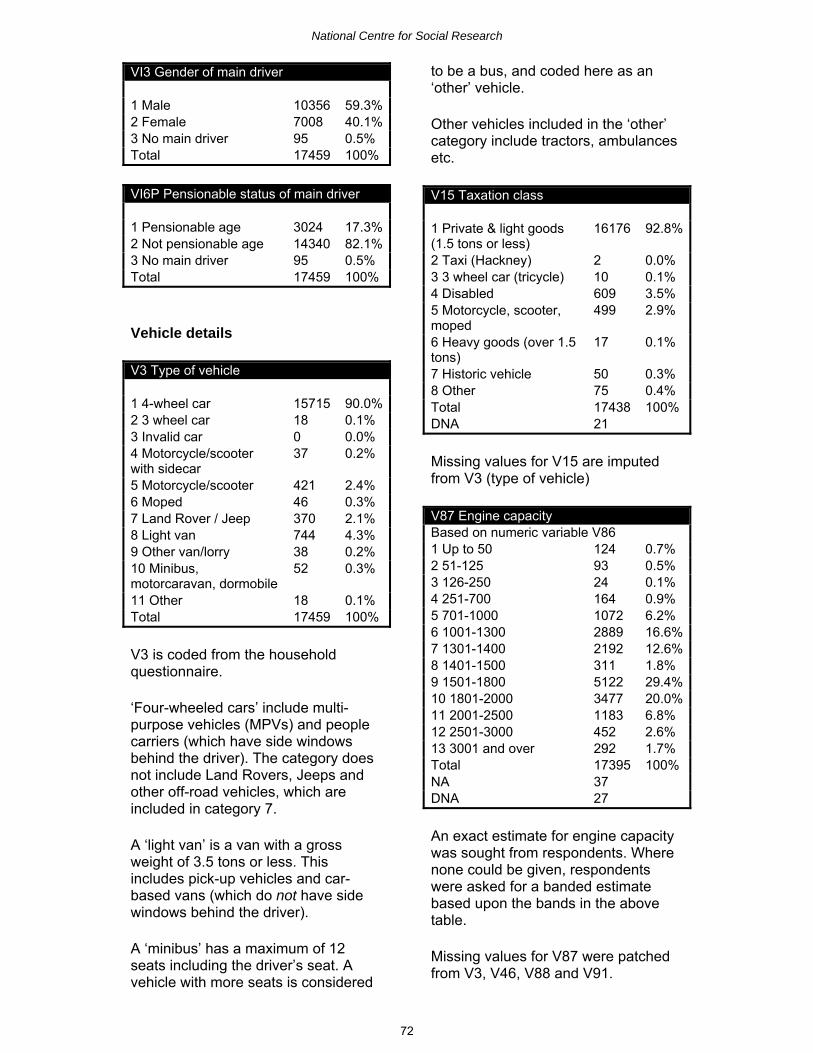
National Centre for Social Research
72
VI3 Gender of main driver
1 Male 10356 59.3%2 Female 7008 40.1%3 No main driver 95 0.5%Total 17459 100%
VI6P Pensionable status of main driver
1 Pensionable age 3024 17.3%2 Not pensionable age 14340 82.1%3 No main driver 95 0.5%Total 17459 100%
Vehicle details
V3 Type of vehicle
1 4-wheel car 15715 90.0%2 3 wheel car 18 0.1%3 Invalid car 0 0.0%4 Motorcycle/scooterwith sidecar
37 0.2%
5 Motorcycle/scooter 421 2.4%6 Moped 46 0.3%7 Land Rover / Jeep 370 2.1%8 Light van 744 4.3%9 Other van/lorry 38 0.2%10 Minibus,motorcaravan, dormobile
52 0.3%
11 Other 18 0.1%Total 17459 100%
V3 is coded from the householdquestionnaire.
‘Four-wheeled cars’ include multi-purpose vehicles (MPVs) and peoplecarriers (which have side windowsbehind the driver). The category doesnot include Land Rovers, Jeeps andother off-road vehicles, which areincluded in category 7.
A ‘light van’ is a van with a grossweight of 3.5 tons or less. Thisincludes pick-up vehicles and car-based vans (which do not have sidewindows behind the driver).
A ‘minibus’ has a maximum of 12seats including the driver’s seat. Avehicle with more seats is considered
to be a bus, and coded here as an‘other’ vehicle.
Other vehicles included in the ‘other’category include tractors, ambulancesetc.
V15 Taxation class
1 Private & light goods(1.5 tons or less)
16176 92.8%
2 Taxi (Hackney) 2 0.0%3 3 wheel car (tricycle) 10 0.1%4 Disabled 609 3.5%5 Motorcycle, scooter,moped
499 2.9%
6 Heavy goods (over 1.5tons)
17 0.1%
7 Historic vehicle 50 0.3%8 Other 75 0.4%Total 17438 100%DNA 21
Missing values for V15 are imputedfrom V3 (type of vehicle)
V87 Engine capacityBased on numeric variable V861 Up to 50 124 0.7%2 51-125 93 0.5%3 126-250 24 0.1%4 251-700 164 0.9%5 701-1000 1072 6.2%6 1001-1300 2889 16.6%7 1301-1400 2192 12.6%8 1401-1500 311 1.8%9 1501-1800 5122 29.4%10 1801-2000 3477 20.0%11 2001-2500 1183 6.8%12 2501-3000 452 2.6%13 3001 and over 292 1.7%Total 17395 100%NA 37DNA 27
An exact estimate for engine capacitywas sought from respondents. Wherenone could be given, respondentswere asked for a banded estimatebased upon the bands in the abovetable.
Missing values for V87 were patchedfrom V3, V46, V88 and V91.

National Centre for Social Research
73
V91 Age
1 Up to 6 months 942 5.4%2 6 months to 1 year 828 4.8%3 Over 1 to 1.5 years 871 5.0%4 Over 1.5 to 2 years 850 4.9%5 Over 2 to 3 years 1483 8.5%6 Over 3 to 4 years 1386 8.0%7 Over 4 to 5 years 1434 8.3%8 Over 5 to 6 years 1351 7.8%9 Over 6 to 7 years 1257 7.2%10 Over 7 to 8 years 1121 6.5%11 Over 8 to 10 years 1997 11.5%12 Over 10 to 13 years 2032 11.7%13 Over 13 to 18 years 1354 7.8%14 Over 18 years 440 2.5%Total 17346 100%NA 92DNA 21
Missing values for V91 are imputedusing V3, V46, V87, V89, V90, V94,V96 and V112.
V130 Make and model
1 Small Fiat 265 1.5%2 Small Ford 973 5.6%3 Small Nissan/Datsun 372 2.2%4 Small Rover/Austin 205 1.2%5 Other small car 1837 10.6%6 Small/medium Ford 1093 6.3%7 Small/mediumNissan/Datsun
149 0.9%
8 Small/mediumPeugeot/Talbot
402 2.3%
9 Small/mediumRover/Austin
96 0.6%
10 Small/mediumVauxhall
649 3.8%
11 Small/mediumVW/Audi
396 2.3%
12 Other small/mediumcar
1935 11.2%
13 Medium Ford 565 3.3%14 Medium Rover/Austin 597 3.5%15 Medium Vauxhall 777 4.5%16 Other medium car 2902 16.8%17 Large Ford 178 1.0%18 Large Rover/Austin 68 0.4%19 Other large car 1844 10.7%20 Land Rover, Jeep orsimilar
491 2.8%
21 Light van 590 3.4%22 Other (motorcycle, 910 5.3%
V130 Make and modellorry etc.)Total 17294 100%NA 165
Missing values for V130 are imputedfrom V3 and V87.
V150 Car adapted for disabled driver
1 Car adapted 49 0.3%2 Invalid car 77 0.4%3 Other 17333 99.3%Total 17459 100%
V164 CO2 emissionsBased on numeric variable V163Band AAA 0 0.0%Band AA 44 1.6%Band A 658 24.5%Band B 687 25.6%Band C 548 20.4%Band D 751 27.9%Total 2688 100%NA 14771
V164 is only available for carsregistered since March 2002.
Mileage
V46 Estimate of annual mileageBased on numeric variable V451 Under 500 283 1.6%2 500-999 229 1.3%3 1000-1999 668 3.8%4 2000-2999 923 5.3%5 3000-3999 1157 6.6%6 4000-4999 1026 5.9%7 5000-6999 3234 18.5%8 7000-8999 2330 13.4%9 9000-11999 3105 17.8%10 12000-14999 1888 10.8%11 15000-17999 987 5.7%12 18000-20999 687 3.9%13 21000-29999 452 2.6%14 30000 miles and over 472 2.7%Total 17441 100%DNA 18
46 represents the main driver’sestimate of the vehicle’s total mileagein a year, including mileage ineligible
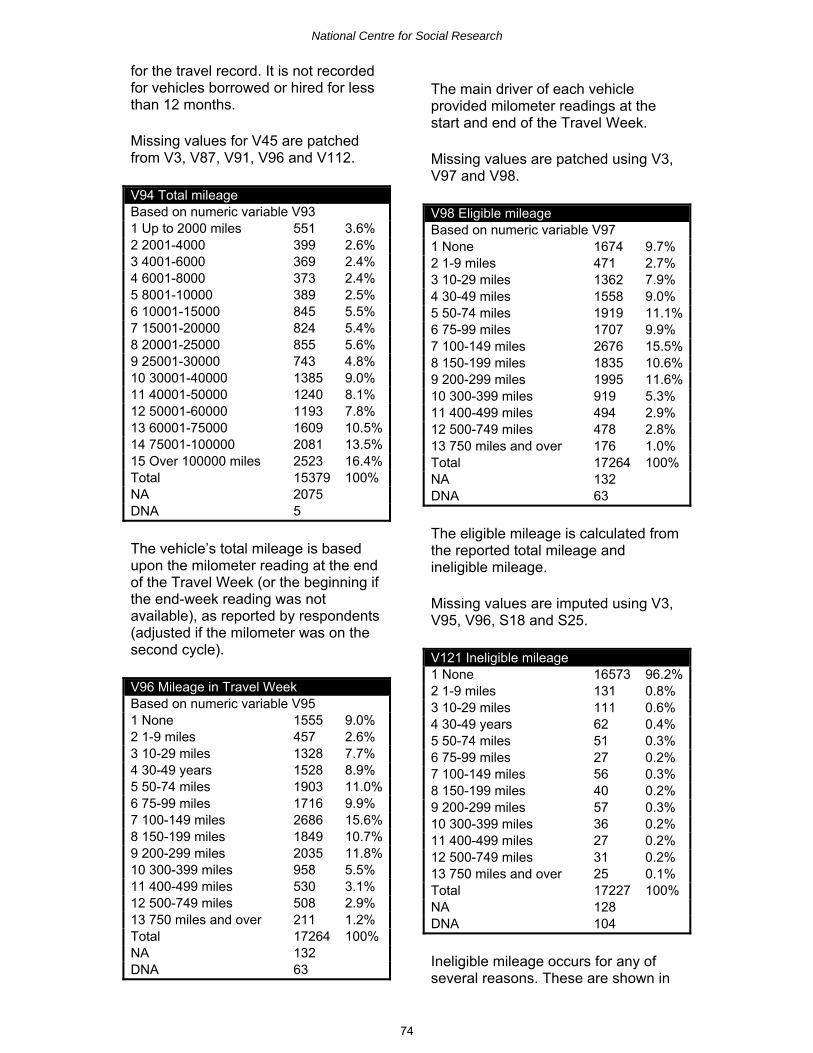
National Centre for Social Research
74
for the travel record. It is not recordedfor vehicles borrowed or hired for lessthan 12 months.
Missing values for V45 are patchedfrom V3, V87, V91, V96 and V112.
V94 Total mileageBased on numeric variable V931 Up to 2000 miles 551 3.6%2 2001-4000 399 2.6%3 4001-6000 369 2.4%4 6001-8000 373 2.4%5 8001-10000 389 2.5%6 10001-15000 845 5.5%7 15001-20000 824 5.4%8 20001-25000 855 5.6%9 25001-30000 743 4.8%10 30001-40000 1385 9.0%11 40001-50000 1240 8.1%12 50001-60000 1193 7.8%13 60001-75000 1609 10.5%14 75001-100000 2081 13.5%15 Over 100000 miles 2523 16.4%Total 15379 100%NA 2075DNA 5
The vehicle’s total mileage is basedupon the milometer reading at the endof the Travel Week (or the beginning ifthe end-week reading was notavailable), as reported by respondents(adjusted if the milometer was on thesecond cycle).
V96 Mileage in Travel WeekBased on numeric variable V951 None 1555 9.0%2 1-9 miles 457 2.6%3 10-29 miles 1328 7.7%4 30-49 years 1528 8.9%5 50-74 miles 1903 11.0%6 75-99 miles 1716 9.9%7 100-149 miles 2686 15.6%8 150-199 miles 1849 10.7%9 200-299 miles 2035 11.8%10 300-399 miles 958 5.5%11 400-499 miles 530 3.1%12 500-749 miles 508 2.9%13 750 miles and over 211 1.2%Total 17264 100%NA 132DNA 63
The main driver of each vehicleprovided milometer readings at thestart and end of the Travel Week.
Missing values are patched using V3,V97 and V98.
V98 Eligible mileageBased on numeric variable V971 None 1674 9.7%2 1-9 miles 471 2.7%3 10-29 miles 1362 7.9%4 30-49 miles 1558 9.0%5 50-74 miles 1919 11.1%6 75-99 miles 1707 9.9%7 100-149 miles 2676 15.5%8 150-199 miles 1835 10.6%9 200-299 miles 1995 11.6%10 300-399 miles 919 5.3%11 400-499 miles 494 2.9%12 500-749 miles 478 2.8%13 750 miles and over 176 1.0%Total 17264 100%NA 132DNA 63
The eligible mileage is calculated fromthe reported total mileage andineligible mileage.
Missing values are imputed using V3,V95, V96, S18 and S25.
V121 Ineligible mileage1 None 16573 96.2%2 1-9 miles 131 0.8%3 10-29 miles 111 0.6%4 30-49 years 62 0.4%5 50-74 miles 51 0.3%6 75-99 miles 27 0.2%7 100-149 miles 56 0.3%8 150-199 miles 40 0.2%9 200-299 miles 57 0.3%10 300-399 miles 36 0.2%11 400-499 miles 27 0.2%12 500-749 miles 31 0.2%13 750 miles and over 25 0.1%Total 17227 100%NA 128DNA 104
Ineligible mileage occurs for any ofseveral reasons. These are shown in

National Centre for Social Research
75
the first four categories of variableV122.
V121 can be derived from V95 andV97.
V122 Reasons for ineligible mileage1 Driven by non-household person
369 45.1%
2 Carrying goods incourse of work
272 33.3%
3 Driven off public/GBroads
94 11.5%
4 Vehicle used astaxi/hire car
42 5.1%
5 Both 1 and 2 25 3.1%6 Both 1 and 3 6 0.7%7 Both 1 and 4 0 0.0%8 Both 2 and 3 9 1.1%9 Both 2 and 4 1 0.1%10 Both 3 and 4 0 0.0%11 1, 2 and 3 0 0.0%12 1, 2 and 4 0 0.0%13 1, 3 and 4 0 0.0%14 2, 3 and 4 0 0.0%15 All 1, 2, 3 and 4 0 0.0%Total 818 100%DNA 16641
V140 Annual vehicle commuting mileageBased on numeric variable V1391 Nil 8307 47.6%2 1-2499 3774 21.6%3 2500-17999 5194 29.7%4 18000+ 184 1.1%Total 17459 100%
Missing values for V140 are patchedfrom V3 and V123.
V142 Annual vehicle business mileageBased on numeric variable V1411 Nil 14149 81.0%2 1-2499 1770 10.1%3 2500-17999 1277 7.3%4 18000+ 263 1.5%Total 17459 100%
Missing values for V142 are patchedfrom V3 and V125.
V144 Annual vehicle private mileageBased on numeric variable V1431 Nil 2243 12.8%2 1-2499 4191 24.0%3 2500-17999 10854 62.2%4 18000+ 171 1.0%Total 17459 100%
Missing values for V144 are patchedfrom V3 and V127.
Vehicle registration
V85 Registration – ownership
1 Employer 845 4.8%2 Other firm – employer-hired
67 0.4%
3 Own business 57 0.3%4 Other firm – ownbusiness hired
3 0.0%
5 Other firm 28 0.2%6 Household member 16291 93.3%7 Other firm – householdhired
27 0.2%
8 Other person –borrowed/loaned
82 0.5%
9 Other person – nodetails
59 0.3%
Total 17459 100%
Variable V85 records the relationshipof the registered keeper of the vehicleto the household.
‘Hire’ includes hire and leasing.
If registration details were unknown,the question asked was who ‘owns’the vehicle.
Missing values were imputed fromV112.
V89 Registration letter
1 Suffix A 5 0.0%2 Suffix B 4 0.0%3 Suffix C 8 0.0%4 Suffix D 11 0.1%5 Suffix E 5 0.0%6 Suffix F 17 0.1%7 Suffix G 12 0.1%8 Suffix H 16 0.1%

National Centre for Social Research
76
V89 Registration letter9 Suffix J 24 0.1%10 Suffix K 19 0.1%11 Suffix L 18 0.1%12 Suffix M 15 0.1%13 Suffix N 17 0.1%14 Suffix P 13 0.1%15 Suffix R 19 0.1%16 Suffix S 15 0.1%17 Suffix T 18 0.1%18 Suffix V 33 0.2%19 Suffix W 27 0.2%20 Suffix X 41 0.2%21 Suffix Y 55 0.3%22 Prefix A 108 0.6%23 Prefix B 89 0.5%24 Prefix C 134 0.8%25 Prefix D 207 1.2%26 Prefix E 296 1.7%27 Prefix F 457 2.7%28 Prefix G 622 3.6%29 Prefix H 623 3.7%30 Prefix J 701 4.1%31 Prefix K 830 4.9%32 Prefix L 1071 6.3%33 Prefix M 1101 6.5%34 Prefix N 1153 6.8%35 Prefix P 1289 7.6%36 Prefix R 1308 7.7%37 Prefix S 777 4.6%38 Prefix T 751 4.4%39 Prefix V 625 3.7%40 Prefix W 718 4.2%41 Prefix X 720 4.2%42 Prefix Y 816 4.8%43 Year Identifier 51 804 4.7%44 Year Identifier 02 682 4.0%45 Year Identifier 52 458 2.7%46 Year Identifier 03 284 1.7%47 Year Identifier 53 52 0.3%Total 17068 100%97 No Letter 293NA 77DNA 21
V89 records the letter (or two-digitnumeric year identifier) which denotesthe year of registration. Registrationmarks with no letters, or letters that donot represent a correct year (such asQ-plates) are coded as having noletter.
Missing values for V89 are patchedfrom H7, H92, V90 and V91
V90 Year of first registration
1 1965 or earlier 25 0.1%2 1966 11 0.1%3 1967 13 0.1%4 1968 13 0.1%5 1969 12 0.1%6 1970 21 0.1%7 1971 25 0.1%8 1972 16 0.1%9 1973 19 0.1%10 1974 15 0.1%11 1975 13 0.1%12 1976 17 0.1%13 1977 21 0.1%14 1978 15 0.1%15 1979 24 0.1%16 1980 31 0.2%17 1981 33 0.2%18 1982 59 0.3%19 1983 81 0.5%20 1984 116 0.7%21 1985 100 0.6%22 1986 172 1.0%23 1987 243 1.4%24 1988 376 2.2%25 1989 567 3.3%26 1990 632 3.6%27 1991 656 3.8%28 1992 739 4.3%29 1993 990 5.7%30 1994 1102 6.4%31 1995 1155 6.7%32 1996 1195 6.9%33 1997 1279 7.4%34 1998 1348 7.8%35 1999 1419 8.2%36 2000 1449 8.4%37 2001 1628 9.4%38 2002 1281 7.4%39 2003 433 2.5%40 2004 2 0.0%Total 17346 100%NA 92DNA 21
V90 is patched using H7, H92, V89and V91.

National Centre for Social Research
77
Purchase/hire costs
V103 Purchase/hire costs
1 Firm paid (firmregistered / hired)
912 5.2%
2 Own business 60 0.3%3 Firm paid (privatelyregistered / hired)
403 2.3%
4 Not firm paid (privatelyregistered / hired)
15955 91.5%
5 No information 110 0.6%Total 17440 100%DNA 19
‘Firm paid’ includes the payment ofany proportion of the purchase price.Firm-registered and firm-hired/leasedvehicles are assumed to have beenpaid for by the firm.
No information was collected for thisvariable in respect of borrowedvehicles or vehicles registered to anorganisation other than an employer orhire/lease firm. In these cases, it isunlikely that the household paid thepurchase/hire costs. These vehiclesare coded to category 4 for thepurposes of variable V103.
Missing values were patched from V85and J28.
V112 Company car summary
1 Company car / anyfree fuel
286 1.8%
2 Company car / no freefuel
698 4.4%
3 Self-employedbusiness car
471 3.0%
4 Employer pays someprivate costs
317 2.0%
5 Used for work / incourse of workallowance only
1139 7.2%
6 Used for work / noallowance
568 3.6%
7 Not used for work / 3years old or less
2955 18.8%
8 Not used for work /over 3 years old
9245 58.8%
9 Other non-companycar
54 0.3%
V112 Company car summaryTotal 15733 100%DNA 1726
A company car is defined as vehiclesuch that:
• It has a ‘car’ body type• A firm pays part or all of the
purchase cost• The main driver is not self-
employed• The car is either in the firm’s
name or registered privatelywith the individual paying extraincome tax
This differs from the DVLA definition,which includes all cars registered to acompany. The free fuel in categories 1and 2 refers to any fuel knowingly paidby the employer for private mileagedone in the vehicle.
Category 3 includes those cars forwhich the main driver is self-employedand income tax relief is claimed on thevehicle.
Category 4 contains cars for which theemployer contributes to either therunning costs or fuel costs for privatemileage.
Category 5 distinguishes cars that therespondent uses for work and forwhich the employer only contributestowards the fuel costs incurred in thecourse of work and not any privaterunning costs.
Category 6 includes those used by therespondent for business purposes butfor which the respondent receives noallowance from the employer.
Categories 7 and 8 contain cars thatreceive no support from the employer,or business if the main driver is self-employed.
Missing values were imputed fromV85, V91 and J28.

National Centre for Social Research
78
V131 Month of registration
1 January 1592 9.2%2 February 999 5.8%3 March 2033 11.7%4 April 1328 7.6%5 May 1546 8.9%6 June 1279 7.4%7 July 684 3.9%8 August 3039 17.5%9 September 1649 9.5%10 October 1198 6.9%11 November 1216 7.0%12 December 798 4.6%Total 17361 100%NA 77DNA 21
Missing values for V131 are imputedat random to a month in the correcthalf of the year, determined from V89and V90.
Fuel
V88 Type of fuel
1 Petrol 14257 81.7%5 Diesel 3168 18.2%6 Electric 6 0.0%7 LPG 6 0.0%8 Bi-fuel 5 0.0%9 Other 1 0.0%Total 17443 100%DNA 16
Distinction in V88 is no longer madebetween unleaded, LRP and leadedpetrol.
Missing values are patched using V87and V90.
V100 Fuel purchasedBased on numeric variable V991 None 8809 50.6%2 1-15 litres 1509 8.7%3 Over 15-30 litres 2885 16.6%4 Over 30-60 litres 3323 19.1%5 Over 60-120 litres 772 4.4%6 Over 120 litres 98 0.6%Total 17396 100%DNA 63 0.4%
The main driver of the vehiclerecorded all fuel put into the tankduring the Travel Week. This wasnoted at the pickup interview. Theamount of fuel recorded may begreater than that implied by the cost(V102) because some or all of it mayhave been provided free of charge.
Missing values are imputed from V3,V87, V91 and V96.
V102 Fuel costBased on numeric variable V1011 None 8847 50.9%2 £1 to £7 264 1.5%3 Over £7 to £15 2018 11.6%4 Over £15 to £25 2680 15.4%5 Over £25 to £55 3070 17.6%6 Over £55 517 3.0%Total 17396 100%DNA 63
Respondents were asked to record thecost of fuel put into the tank to thenearest pound. This is the cost to thehousehold only. For individualvehicles, the unit will be inaccuratebecause of rounding in both sourcevariables.
Missing values were patched from H7,H92, V96 and V99.
V135 Fuel consumedBased on numeric variable V1341 None 1648 9.5%2 1-15 litres 6965 40.2%3 Over 15-30 litres 4415 25.5%4 Over 30-60 litres 3235 18.7%5 Over 60-120 litres 941 5.4%6 Over 120 litres 137 0.8%Total 17341 100%NA 9DNA 109
Questions are asked to ascertain thesize of a vehicle’s fuel tank, and toobtain fuel gauge readings at the startand the end of the Travel Week. Theanswers to these questions arecombined with the fuel purchasedduring the Travel Week to estimatefuel consumption.

National Centre for Social Research
79
Missing values are imputed from V3,V87, V88, V96 and V130.
Parking
V145 Parking – overnight location
1 Garage 4042 23.2%2 Private property (notgaraged)
8814 50.6%
3 Street 3946 22.7%4 Other 489 2.8%5 Not near home 129 0.7%Total 17420 100%NA 21DNA 18
Questions V146-V149 are only askedof respondents whose vehicles areparked somewhere other than theirown property. Respondents whosecars are parked in a garage orotherwise on their own private propertyare coded as DNA in the followingquestions.
V146 Parking – distance from house
1 Outside 2713 62.6%2 Less than 10 yards 820 18.9%3 10-34 yards 423 9.8%4 35-99 yards 208 4.8%5 100 yards or more(less than 10 minuteswalk)
149 3.4%
6 100 yards or more (10minutes or more walk)
24 0.6%
Total 4337 100%NA 55DNA 13067
V147 Type of parking payment
1 Resident’s parkingpermit
236 71.5%
2 Other non-resident’sparking permit
2 0.6%
3 Hired garage 78 23.6%4 Other 14 4.2%Total 330 100%5 No payment due 4101NA 25DNA 13003
V149 Annual parking feeBased on numeric variable V1481 Less than £35 91 28.3%2 £35 to less than £100 128 39.8%3 £100 to less than £200 39 12.1%4 £200 or more 64 19.9%Total 322 100%NA 33DNA 17104
Delivery of goods
V155 Frequency of delivery of goods incourse of work
1 3 or more times aweek
203 43.5%
2 Once or twice a week 116 24.8%3 Less than once a weekbut more than twice amonth
20 4.3%
4 Once or twice a month 71 15.2%5 Less than once amonth but more thantwice a year
29 6.2%
6 Once or twice a year 18 3.9%7 Less than once a year 7 1.5%8 Frequency unknown 3 0.6%Total 467 100%Goods not delivered 16942NA 32DNA 18
V156 Number of delivery points
1 1 239 51.2%2 2 to 4 126 27.0%3 5 to 9 43 9.2%4 10 to 19 21 4.5%5 20 or more 30 6.4%6 Frequency unknown 8 1.7%Total 467 100%Goods not delivered 16942NA 32DNA 18
Variable V156 represents the numberof stops the vehicle made to delivergoods on the last day that the vehiclewas used to deliver goods in thecourse of work and records thenumber of drop-off points made, not

National Centre for Social Research
80
the number of times the vehicle wentout.
Travel outside GB
V158 Number of miles outside GBBased on numeric variable V1571 Up to 100 100 20.2%2 Over 100 and up to200
37 7.5%
3 Over 200 and up to300
28 5.6%
4 Over 300 and up to400
23 4.6%
5 Over 400 and up to500
34 6.9%
6 Over 500 and up to1000
123 24.8%
7 Over 1000 and up to1500
40 8.1%
8 Over 1500 and up to2000
66 13.3%
9 Over 2000 40 8.1%Driven outside GB –mileage unknown
5 1.0%
Total 496 100%Not driven outside GB 7650NA 33DNA 9280
Although mileage travelled in NorthernIreland is recorded separately (inV161), all such mileage is alsoincluded in the total for V158.
V159 Purpose of trip outside GB
1 Holiday 335 67.5%2 Business trip 19 3.8%3 Shopping trip 97 19.6%4 Visiting friends orrelations
34 6.9%
5 Another reason 11 2.2%Total 496 100%Not driven outside GB 7650NA 33DNA 9280
V161 Number of miles in NI
Based on numeric variable V1601 Up to 100 8 29.6%2 Over 100 and up to200
6 22.2%
3 Over 200 and up to 2 7.4%
V161 Number of miles in NI
3004 Over 300 and up to400
0 0.0%
5 Over 400 and up to500
5 18.5%
6 Over 500 and up to1000
5 18.5%
7 Over 1000 and up to1500
0 0.0%
8 Over 2000 0 0.0%9 Driven in NI – mileageunknown
1 3.7%
Total 27 100%Not driven in NI 8121NA 31DNA 9280
V162 Purpose of trip in NI
1 Holiday 13 48.1%2 Business trip 0 0.0%3 Shopping trip 0 0.0%4 Visiting friends orrelations
13 48.1%
5 Another reason 1 3.7%6 Reason not known 0 0.0%Total 27 100%Not driven in NI 8121NA 31DNA 9280
5.6 Individual level variables
Fully responding households on the2002/2003 database contain 36,353individuals of all ages (16,886 in 2002and 19,467 in 2003). Demographicinformation about individuals wascollected on the householdquestionnaire; the rest of theinformation about individuals wasobtained via the individualquestionnaire.
Most individuals are interviewed face-to-face. However, there are somecircumstances where the individualquestionnaire is completed by proxy.Children under 11 are interviewed byproxy, as are individuals unable to

National Centre for Social Research
81
provide the information themselves(e.g. because of mental illness orbecause they were away from homethroughout the interview period).
Personal details
Values for the variables in this sectionare taken from the householdquestionnaire.
I2 Relationship to household referenceperson
1 Household referenceperson
15695 43.2%
2 Spouse 7961 21.9%3 Cohabitee 1293 3.6%4 Son/daughter 9764 26.9%5 Stepson /stepdaughter
429 1.2%
6 Foster child 21 0.1%7 Son-in-law / daughter-in-law
34 0.1%
8 Parent/guardian 160 0.4%9 Step-parent 1 0.0%10 Foster parent 0 0.0%11 Parent-in-law 41 0.1%12 Brother/sister 193 0.5%13 Stepbrother /stepsister
10 0.0%
14 Foster brother / fostersister
8 0.0%
15 Brother-in-law /sister-in-law
22 0.1%
16 Grandchild 161 0.4%17 Grandparent 3 0.0%18 Other relative 87 0.2%19 Other non-relative 470 1.3%Total 36353 100%
Missing values for I2 are patched fromI3, I5 and I268.
I3 Gender
1 Male 17445 48.0%2 Female 18908 52.0%Total 36353 100%
I6 AgeBased on numeric variable I51 Less than 1 year 427 1.2%2 1-2 years 857 2.4%3 3-4 years 923 2.5%4 5-10 years 2909 8.0%5 11-15 years 2475 6.8%6 16 years 445 1.2%7 17 years 415 1.1%8 18 years 340 0.9%9 19 years 345 0.9%10 20 years 338 0.9%11 21-25 years 1704 4.7%12 26-29 years 1634 4.5%13 30-39 years 5323 14.6%14 40-49 years 5043 13.9%15 50-59 years 4804 13.2%16 60-64 years 2076 5.7%17 65-69 years 1831 5.0%18 70-74 years 1644 4.5%19 75-79 years 1332 3.7%20 80-84 years 968 2.7%85 years or older 520 1.4%Total 36353 100%
I268 Legal marital status
1 Married and living withspouse
16085 55.9%
2 Separated 649 2.3%3 Single 7461 25.9%4 Divorced 2140 7.4%5 Widowed 2427 8.4%Total 28762 100%DNA 7591
Missing values for I268 are patchedfrom I2 and I5.
I269 Living arrangements
1 Married 16085 55.9%2 Cohabiting 2661 9.3%3 Single 5555 19.3%4 Separated 558 1.9%5 Divorced 1529 5.3%6 Widowed 2374 8.3%Total 28762 100%DNA 7591
I268 and I269 are only recorded forthose aged 16 or over. The remainderare coded DNA.

National Centre for Social Research
82
I277 Why no spouse in household
1 Married, spouse notin household
14 100%
2 Other 0 0%3 Total 14 100%
I277 is only asked of those who recordtheir marital status as ‘married andliving with spouse’, but where nospouse is listed as a householdmember.
I275 Ethnic group
1 British 32667 89.9%2 Other whitebackground
821 2.3%
3 White and blackCaribbean
122 0.3%
4 White and blackAfrican
75 0.2%
5 White and Asian 90 0.2%6 Any other mixedbackground
117 0.3%
7 Indian 625 1.7%8 Pakistani 433 1.2%9 Bangladeshi 113 0.3%10 Any other Asianbackground
216 0.6%
11 Caribbean 302 0.8%12 African 271 0.7%13 Any other blackbackground
78 0.2%
14 Chinese 86 0.2%15 Any other 328 0.9%Total 36344 100%NA 9
Social and economic
Applying to all who had ever been inpaid employment, the categories inthis variable are the divisions of theStandard Industrial Classification1992. However, this remains primarilyto provide consistency with older data.The NTS now uses the breakdowngiven by SOC2000 (This is held invariable I274, although this is not listedhere.)
I79 Industry type
1 Agriculture etc 467 1.8%2 Fishing 21 0.1%3 Mining, quarrying 222 0.8%4 Manufacturing 4775 18.0%5 Energy, water 327 1.2%6 Construction 1743 6.6%7 Wholesale, retail andmotor trade
3820 14.4%
8 Hotels and restaurants 1153 4.3%9 Transport, storage andcommunication
1737 6.5%
10 Financial 1061 4.0%11 Real estate, rentingand business activities
2618 9.9%
12 Public administrationand defence
1998 7.5%
13 Education 2369 8.9%14 Health and socialwork
3016 11.4%
15 Other community,social and personal
1076 4.1%
16 Private householdswith employed persons
145 0.5%
17 Extra-territorialorganizations
9 0.0%
Total 26557 100%NA 294DNA 9502
I80 Employee/self-employed
1 Employee (current orlast job)
24136 89.9%
2 Self-employed (currentor last job)
2719 10.1%
Total 26855 100%DNA 9498
Missing values for I80 are coded to 1,the most likely value.
Both I79 and I80 refer to therespondent’s current job. Forunemployed respondents, thequestions refer to the respondent’smost recent employment.
I177 Working status1 Employees: full-time 10891 37.9%2 Employees: part-time 3746 13.0%3 Self-employed: full-time
1504 5.2%
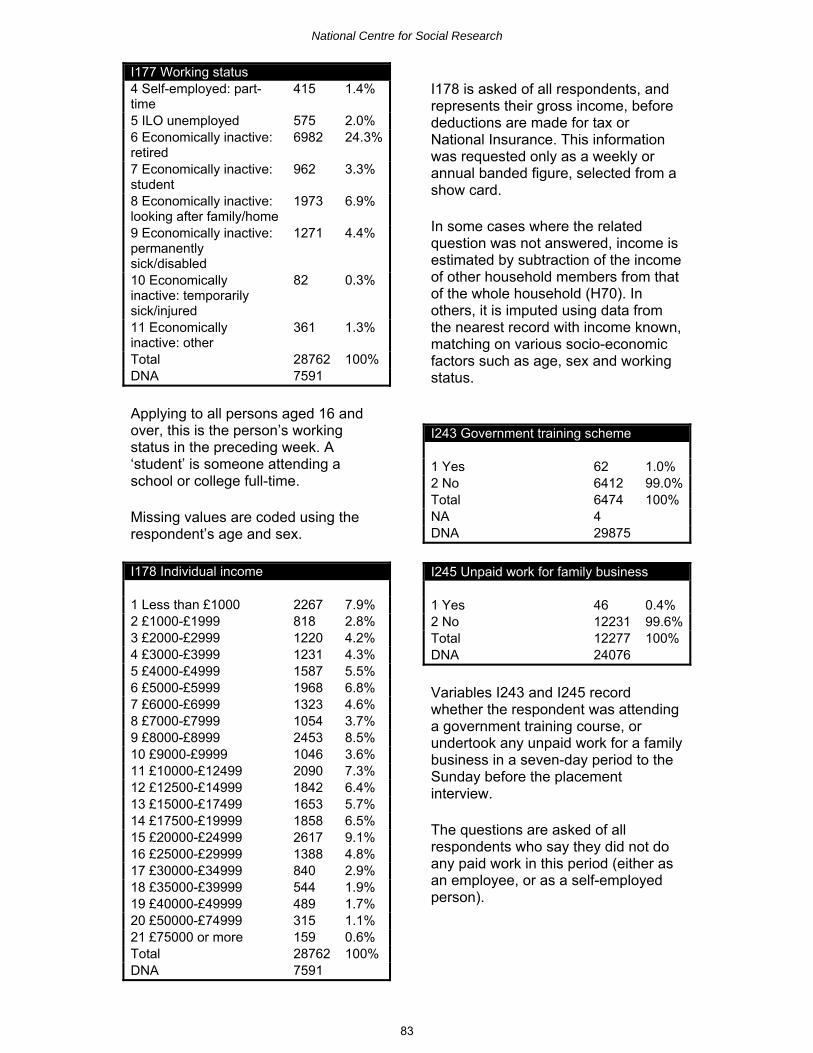
National Centre for Social Research
83
I177 Working status4 Self-employed: part-time
415 1.4%
5 ILO unemployed 575 2.0%6 Economically inactive:retired
6982 24.3%
7 Economically inactive:student
962 3.3%
8 Economically inactive:looking after family/home
1973 6.9%
9 Economically inactive:permanentlysick/disabled
1271 4.4%
10 Economicallyinactive: temporarilysick/injured
82 0.3%
11 Economicallyinactive: other
361 1.3%
Total 28762 100%DNA 7591
Applying to all persons aged 16 andover, this is the person’s workingstatus in the preceding week. A‘student’ is someone attending aschool or college full-time.
Missing values are coded using therespondent’s age and sex.
I178 Individual income
1 Less than £1000 2267 7.9%2 £1000-£1999 818 2.8%3 £2000-£2999 1220 4.2%4 £3000-£3999 1231 4.3%5 £4000-£4999 1587 5.5%6 £5000-£5999 1968 6.8%7 £6000-£6999 1323 4.6%8 £7000-£7999 1054 3.7%9 £8000-£8999 2453 8.5%10 £9000-£9999 1046 3.6%11 £10000-£12499 2090 7.3%12 £12500-£14999 1842 6.4%13 £15000-£17499 1653 5.7%14 £17500-£19999 1858 6.5%15 £20000-£24999 2617 9.1%16 £25000-£29999 1388 4.8%17 £30000-£34999 840 2.9%18 £35000-£39999 544 1.9%19 £40000-£49999 489 1.7%20 £50000-£74999 315 1.1%21 £75000 or more 159 0.6%Total 28762 100%DNA 7591
I178 is asked of all respondents, andrepresents their gross income, beforedeductions are made for tax orNational Insurance. This informationwas requested only as a weekly orannual banded figure, selected from ashow card.
In some cases where the relatedquestion was not answered, income isestimated by subtraction of the incomeof other household members from thatof the whole household (H70). Inothers, it is imputed using data fromthe nearest record with income known,matching on various socio-economicfactors such as age, sex and workingstatus.
I243 Government training scheme
1 Yes 62 1.0%2 No 6412 99.0%Total 6474 100%NA 4DNA 29875
I245 Unpaid work for family business
1 Yes 46 0.4%2 No 12231 99.6%Total 12277 100%DNA 24076
Variables I243 and I245 recordwhether the respondent was attendinga government training course, orundertook any unpaid work for a familybusiness in a seven-day period to theSunday before the placementinterview.
The questions are asked of allrespondents who say they did not doany paid work in this period (either asan employee, or as a self-employedperson).

National Centre for Social Research
84
I276 Responsibility for supervising otheremployees
1 Yes 7400 30.7%2 No 16678 69.3%Total 24078 100%NA 18DNA 12257
I397 Employment status
1 Self-employed: largeestablishment
60 0.2%
2 Self-employed: smallestablishment
625 2.3%
3 Self-employed: noemployees
2034 7.6%
4 Manager: largeestablishment
1842 6.9%
5 Manager: smallestablishment
933 3.5%
6 Foreman or supervisor 5092 19.0%7 Employee 16229 60.5%Total 26815 100%NA 40DNA 9498
I398 NS-SEC
1 Employers in largeorganization
43 0.2%
2 Higher managerial 1162 4.4%3 Higher professional:traditional employees
956 3.6%
4 Higher professional:new employees
357 1.3%
5 Higher professional:traditional self-employed
202 0.8%
6 Higher professional:new self-employed
43 0.2%
7 Lower professional:traditional employees
3044 11.4%
8 Lower professional:new employees
216 0.8%
9 Lower professional:traditional self-employed
237 0.9%
10 Lower professional:new self-employed
19 0.1%
11 Lower managerial 1595 6.0%12 Higher supervisory 1017 3.8%13 Intermediate: clericaland admin
1908 7.2%
14 Intermediate: salesand service
1247 4.7%
I398 NS-SEC15 Intermediate:technical and auxiliary
336 1.3%
16 Intermediate:engineering
109 0.4%
17 Small organisation:non-professional
486 1.8%
18 Small organisation:agriculture
37 0.1%
19 Own account: non-professional
1505 5.7%
20 Own account:agriculture
109 0.4%
21 Lower supervisory 1931 7.3%22 Lower technical: craft 770 2.9%23 Lower technical:process operative
214 0.8%
24 Semi-routine: sales 1589 6.0%25 Semi-routine: service 1617 6.1%26 Semi-routine:technical
435 1.6%
27 Semi-routine:operative
651 2.4%
28 Semi-routine:agricultural
88 0.3%
29 Semi-routine: clerical 495 1.9%30 Semi-routine:childcare
276 1.0%
31 Routine: sales andservice
636 2.4%
32 Routine: productive 672 2.5%33 Routine: technical 1123 4.2%34 Routine: operative 1424 5.4%35 Routine: agricultural 53 0.2%Total 26602 100%DNA 9751
I398 (National Statistics socio-economic classification) wasintroduced from 2001 to replace theformer SC (social class) and SEG(socio-economic group)measurements in all National Statisticssurveys. It is based upon informationgiven by the respondent, includingtheir occupation (classified using theSOC2000 classification) and theiremployment status (whether theysupervise other staff, are employed orself-employed etc.)
Both I397 and I398 refer to therespondent’s current or most recentjob.

National Centre for Social Research
85
Unemployment
I244 Away from work on training scheme
1 Yes 448 3.5%2 No 12238 96.2%3 Waiting to take up newjob/business
39 0.3%
Total 12725 100%DNA 23628
This question is asked of people whowere not in paid work at the time of theplacement interview.
I247 Looking for work/training in last 4weeks
1 Yes 602 5.0%2 No 11530 95.0%Total 12132 100%NA 1DNA 24220
I248 Immediate availability for governmenttraining scheme
1 Yes 572 85.5%2 No 97 14.5%Total 669 100%NA 4DNA 35680
This question asks respondents over16, who were not working or on atraining scheme whether they wouldhave been able to attend agovernment training scheme withintwo weeks, had an opportunity toattend arisen.
I249 Why not available for work
1 Student 962 8.3%2 Looking after thefamily/home
1972 17.0%
3 Temporarilysick/injured
82 0.7%
4 Long-term sick ordisabled
1271 10.9%
5 Retired from paid work 6979 60.0%6 Other 361 3.1%Total 11627 100%DNA 24726
Some combination of questions toderive I244 and I247-I249 were askedof all people who did not do any paidwork in the seven-day period to theSunday prior to the placementinterview. Exactly which of thesequestions were asked depended ontheir answers to other questions in thisgroup.
I250 Left last paid job
1 Last 3 months 321 3.2%2 Last 3 to 6 months 280 2.8%3 6 months to 1 year 439 4.3%4 1-2 years 638 6.3%5 2-3 years 563 5.5%6 3-4 years 514 5.1%7 4-5 years 450 4.4%8 Over 5 years 6973 68.5%Total 10178 100%NA 129DNA 26046
Variable I250 is recorded for alleconomically inactive people apartfrom those who have never worked.I300 Turned down job because oftransport difficultiesMulticoded1 Too far 29 40.8%2 Car not available 15 21.1%3 Can’t drive 16 22.5%4 Cost of petrol 0 0.0%5 Lack of parking 0 0.0%6 Cost of parking 0 0.0%7 Trafficcongestion/roadworks
1 1.4%
8 Inadequate publictransport
40 56.3%
9 Cost of public transport 9 12.7%10 Safety concerns 0 0.0%11 Physicaldifficulties/disability
1 1.4%
Other 5 7.0%Total 71 100%Haven’t turned down job 481DNA 35801
This question asks applicablerespondents whether, in the preceding12 months, they had turned down an

National Centre for Social Research
86
offer of employment owing to transportdifficulties.
I301 Transport difficulties preventing workMulticoded1 Too far 22 26.2%2 Car not available 34 40.5%3 Can’t drive 24 28.6%4 Cost of petrol 3 3.6%5 Lack of parking 1 1.2%6 Cost of parking 2 2.4%7 Trafficcongestion/roadworks
2 2.4%
8 Inadequate publictransport
36 42.9%
9 Cost of public transport 11 13.1%10 Safety concerns 6 7.1%11 Physicaldifficulties/disability
0 0.0%
Other 5 6.0%Total 84 100%NA 2DNA 35801
I300 and I301 are derived for alleconomically inactive respondents ofworking age (except students).
Work travel benefits
I302 is asked of all employees, andrecords whether any employees attheir place of work receive any of thebenefits listed. I303 is asked of allthose that answered I302 in theaffirmative; it records benefits offeredto the respondent themselves.
The remaining questions in thissection (I304-8, I395-6) indicatewhether the respondent tookadvantage of the travel benefitsoffered to them.
I302 Travel benefits at workMulti-coded1 Cut price or free bustickets
402 5.1%
2 Cut price or free railtickets
397 5.0%
3 Interest-free loan for aseason ticket
803 10.1%
4 Interest-free loan forparking
156 2.0%
I302 Travel benefits at work5 Cut price or free carparking
5388 67.8%
6 Company car oralternative
3317 41.7%
7 Use of car fromcompany pool
938 11.8%
8 Special bus or van forjourney to work
727 9.1%
9 Other transport-relatedbenefits
973 12.2%
Total 7946 100%None 6570NA 97DNA 21740
I303 Travel benefits offered to meMulti-coded1 Cut price or free bustickets
263 4.1%
2 Cut price or free railtickets
289 4.5%
3 Interest-free loan for aseason ticket
502 7.8%
4 Interest-free loan forparking
74 1.1%
5 Cut price or free carparking
4543 70.6%
6 Company car oralternative
1277 19.8%
7 Use of car fromcompany pool
503 7.8%
8 Special bus or van forjourney to work
369 5.7%
9 Other transport-relatedbenefits
678 10.5%
Total 6437 100%None 1507NA 3DNA 28406
I304 Use free/reduced price bus tickets
1 Yes 215 76.5%2 No 66 23.5%Total 281 100%DNA 36072
I305 Use free/reduced price train tickets
1 Yes 215 76.5%2 No 66 23.5%Total 281 100%DNA 36072
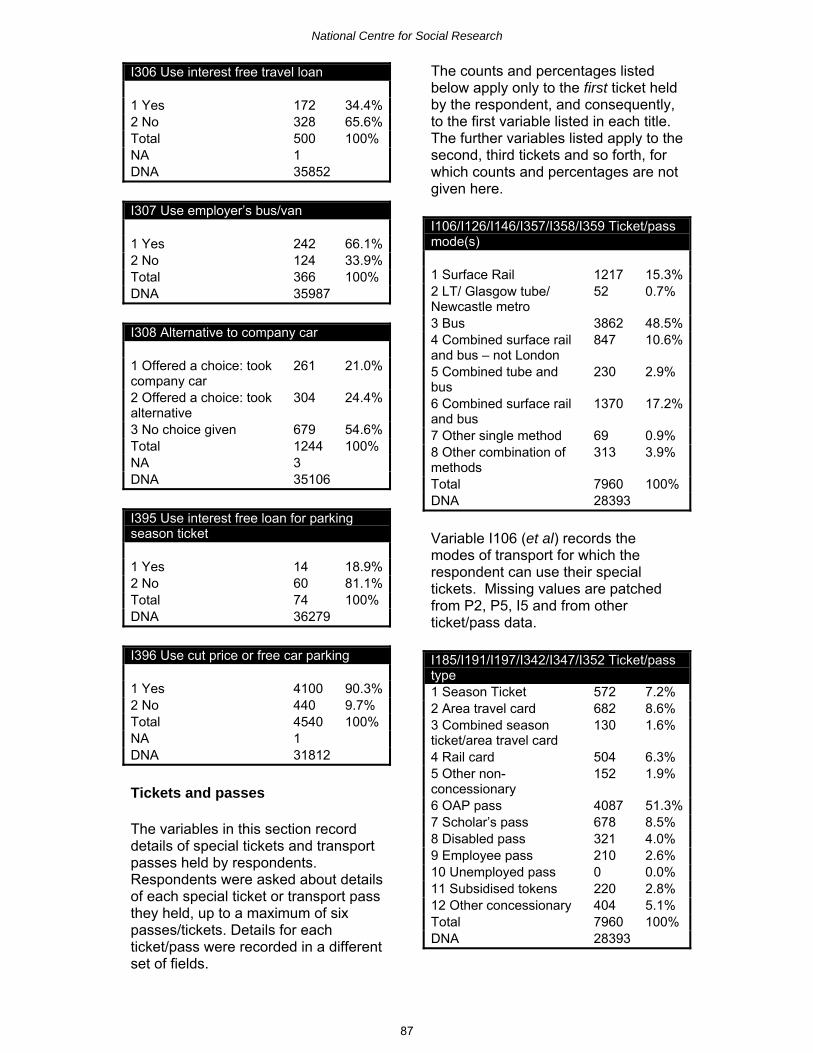
National Centre for Social Research
87
I306 Use interest free travel loan
1 Yes 172 34.4%2 No 328 65.6%Total 500 100%NA 1DNA 35852
I307 Use employer’s bus/van
1 Yes 242 66.1%2 No 124 33.9%Total 366 100%DNA 35987
I308 Alternative to company car
1 Offered a choice: tookcompany car
261 21.0%
2 Offered a choice: tookalternative
304 24.4%
3 No choice given 679 54.6%Total 1244 100%NA 3DNA 35106
I395 Use interest free loan for parkingseason ticket
1 Yes 14 18.9%2 No 60 81.1%Total 74 100%DNA 36279
I396 Use cut price or free car parking
1 Yes 4100 90.3%2 No 440 9.7%Total 4540 100%NA 1DNA 31812
Tickets and passes
The variables in this section recorddetails of special tickets and transportpasses held by respondents.Respondents were asked about detailsof each special ticket or transport passthey held, up to a maximum of sixpasses/tickets. Details for eachticket/pass were recorded in a differentset of fields.
The counts and percentages listedbelow apply only to the first ticket heldby the respondent, and consequently,to the first variable listed in each title.The further variables listed apply to thesecond, third tickets and so forth, forwhich counts and percentages are notgiven here.
I106/I126/I146/I357/I358/I359 Ticket/passmode(s)
1 Surface Rail 1217 15.3%2 LT/ Glasgow tube/Newcastle metro
52 0.7%
3 Bus 3862 48.5%4 Combined surface railand bus – not London
847 10.6%
5 Combined tube andbus
230 2.9%
6 Combined surface railand bus
1370 17.2%
7 Other single method 69 0.9%8 Other combination ofmethods
313 3.9%
Total 7960 100%DNA 28393
Variable I106 (et al) records themodes of transport for which therespondent can use their specialtickets. Missing values are patchedfrom P2, P5, I5 and from otherticket/pass data.
I185/I191/I197/I342/I347/I352 Ticket/passtype1 Season Ticket 572 7.2%2 Area travel card 682 8.6%3 Combined seasonticket/area travel card
130 1.6%
4 Rail card 504 6.3%5 Other non-concessionary
152 1.9%
6 OAP pass 4087 51.3%7 Scholar’s pass 678 8.5%8 Disabled pass 321 4.0%9 Employee pass 210 2.6%10 Unemployed pass 0 0.0%11 Subsidised tokens 220 2.8%12 Other concessionary 404 5.1%Total 7960 100%DNA 28393

National Centre for Social Research
88
Non-concessionary tickets and passes(codes 1-5) refer to schemes devisedby operators for commercial reasons.
A season ticket is valid for trips withina specified period on one specificroute. An area travel card is valid fortravel within a specified period on anyroute within a specified area. Acombined season/area travel cardfunctions as a season ticket at oneend of the route and as an area travelcard at the other. Rail card includesYoung Persons Railcard.
Missing values are patched using P2,P5, I5, I79, I177 and other ticketdetails.
I186/I192/I198/I343/I348/I353 Ticket/passmode priority
1 Surface rail only 1217 15.3%2 Surface rail and bus 183 2.3%3 Surface rail andunderground
93 1.2%
4 Surface rail, bus andunderground
334 4.2%
5 Surface rail and other 40 0.5%6 Underground / metroonly
52 0.7%
7 underground / metroand surface rail
12 0.2%
8 Underground / metroand bus
115 1.4%
9 Underground / metro,surface rail and bus
331 4.2%
10 Underground andother
22 0.3%
11 Bus only 3865 48.6%12 Bus and surface rail 657 8.3%13 Bus and underground 110 1.4%14 Bus, surface rail andunderground
606 7.6%
15 Bus and other 142 1.8%16 Other 181 2.3%Total 7960DNA 28393
I186 (et al) is constructed from I106 (etal) and a further question askingrespondents by which mode theytravelled the furthest using the relevantspecial ticket.
Missing values are patched usingother ticket details, S2, S26 and S35.
I187/I192/I199/I344/I349/I354 Ticket/passvalidity
1 One week 704 9.2%2 One month 526 6.9%3 3 months/ school term 156 2.0%4 6 months 28 0.4%5 1 year 2688 35.1%6 More than 1 year 2268 29.6%7 Unlimited 1227 16.0%8 Other period 66 0.9%9 Tokens etc. 0 0.0%Total 7663 100%NA 77DNA 28613
I187 does not apply to subsidisedtokens, which cover a set number oftrips rather than a specified timeperiod.
I189/I195/I201/I346/I351/I356 Ticket/passuseBased on numeric variablesI188/I194/I200/I345/I350/I3551 Less than 1 per year /never
687 8.9%
2 1-2 times per year 440 5.7%3 3-4 times per year 527 6.8%4 5-12 times per year 582 7.5%5 12+ times per year,less than once per week
422 5.5%
6 1-2 times per week 1099 14.2%7 3-4 times per week 718 9.3%8 5-6 times per week 628 8.1%9 7-8 times per week 276 3.6%10 9-10 times per week 1351 17.5%11 11-15 times per week 685 8.9%12 16-20 times per week 214 2.8%13 21+ time per week 111 1.4%Total 7740 100%DNA 28613
I189 does not apply to subsidisedtokens, which cover a set number oftrips rather than a specified timeperiod.
Missing values are patched from otherticket details.

National Centre for Social Research
89
I205/I206/I207/I360/I361/I362 Ticket/passweekly cost
1 Nil 5136 66.4%2 1 to 49p 969 12.5%3 50 to 99p 44 0.6%4 £1 to £1.99 23 0.3%5 £2 to £2.99 22 0.3%6 £3 to £3.99 55 0.7%7 £4 to £4.99 114 1.5%8 £5 to £5.99 79 1.0%9 £6 to £7.99 244 3.2%10 £8 to £9.99 222 2.9%11 £10 to £14.99 255 3.3%12 £15 to £19.99 219 2.8%13 £20 and over 358 4.6%Total 7740 100%DNA 28613
Missing values are imputed usingother ticket details.
Travel difficulties
The questions in this section focus ondifficulties in undertaking three travelactivities: going out on foot, usingbuses, and getting in and out of a car.The variables identify people withmobility problems and give someindication of difficulty. Elderly peoplewho felt that old age was the cause oftheir difficulty are included.
I165 Travel difficulties
1 Foot and bus 2235 7.8%2 Foot 2356 8.2%3 Bus 144 0.5%4 Disabled (Data NA) 0 0.0%5 No difficulties 24024 83.5%Total 28759 100%NA 3DNA 7591
I212 Disabled drivers
1 Disabled driver 2070 43.7%2 No longer drives(disability)
446 9.4%
3 No longer drives (otherreason)
150 3.2%
4 Never had a license 2071 43.7%Total 4737 100%NA 1DNA 31615
Variable I212 is derived from morethan one question in the individualquestionnaire. Respondents whoreported difficulty going out on foot orusing a bus, are asked whether theyhold driving licences, whether they stilldrive and, if not, whether the reasonthey stopped driving was due to theirdisability, or for some other reason.
I214 Years since last droveBased on numeric variable I2131 0-4 years 198 33.8%2 5-9 years 130 22.2%3 10-19 years 146 25.0%4 20+ years 111 19.0%Total 585 100%NA 13DNA 35755
Variable I214 is recorded for all thosewho no longer drive (as recorded inI212).
I290 Why difficult to use a busMulti-coded1 Getting to the bus stop 1475 62.0%2 Identifying destination 110 4.6%3 Standing waiting at thebus stop
1276 53.6%
4 Getting on or off buses 1594 67.0%5 Getting to and from theseat
980 41.2%
6 Communicating withthe driver/conductor
157 6.6%
7 Finding out timetableinformation
125 5.3%
Other 321 13.5%Total 2379 100%DNA 33974

National Centre for Social Research
90
I363 Difficulties travelling by foot1 No walking difficulties 24168 84.0%2 Walking difficulties,can go out on own
2963 10.3%
3 Walking difficulties,needs assistance,impossible alone
228 0.8%
4 Walking difficulties,needs assistance,difficult alone
571 2.0%
5 Walking difficulties,doesn’t go out,impossible to go out
443 1.5%
6 Walking difficulties,doesn’t go out, difficult togo out
386 1.3%
Total 28759 100%NA 3DNA 7591
I364 Disability causes difficulties in usinglocal bus1 No difficulties 26383 91.7%2 Some difficulties, douse bus
696 2.4%
3 Some difficulties, don’tuse bus, health reasons
1451 5.0%
4 Some difficulties, don’tuse bus, poor busservice
73 0.3%
5 Some difficulties, don’tuse bus, other reasons
159 0.6%
Total 28762 100%DNA 7591
Questions I363 and I364 are askedonly of those over 15.
I292 Special transport services availableMulticoded1 Dial-a-ride service 1998 5.5%2 Supermarket bus 1384 3.8%3 Hospital car or service 1921 5.3%4 Day centre or service 890 2.4%5 Shared taxi scheme 128 0.4%6 Taxi voucher scheme 389 1.1%7 Postbus 61 0.2%8 Community-ownedminibus
599 1.6%
9 Other special service 163 0.4%Total 36353 100%Don’t know type 144Not aware of any ofthese services
1022
NA 19DNA 31513
The question that relates to variableI292 is asked of all who reportproblems with travelling on foot, by caror on the bus.
The question asks respondents toanswer 'as far as they know or haveheard' and may not reflect the truepicture in some cases.
The scheme may not necessarily beavailable to the respondentthemselves, or relevant to theirparticular needs.
Travel to work
Many of the questions in this sectionrefer to a respondent’s ‘workplace’.Where there is any question about aperson’s ‘usual workplace’, it isdefined as the place visited regularlyfor work on at least two consecutivedays per week (if the respondentworks more than one day per week),for at least four consecutive weeks.
Where this definition provides two (ormore) possible candidates, the usualworkplace is that visited morefrequently. If the respondent visits allsuch locations with equal frequency,the one furthest from home is theusual workplace.
I92 Workplace
1 Same place 12710 76.9%2 Same place at leasttwo consecutive days
1259 7.6%
3 Different places 2055 12.4%4 Home/same buildingas home
505 3.1%
Total 16529 100%NA 29DNA 19795
I92 records whether workingrespondents worked at same place allthrough their preceding working week,or if the location of work varied.

National Centre for Social Research
91
Missing values are coded using I177.
I180 Usual means of travel to work1 Car/van driver 9732 60.7%2 Car/van passenger 1110 6.9%3 Car/van either driver orpassenger
292 1.8%
4 Car no details 0 0.0%5 2 wheel motor vehicle 190 1.2%6 Bicycle 516 3.2%7 Bus 1249 7.8%8 Surface Rail 603 3.8%9 LT Underground / lightrail
380 2.4%
10 Walk 1751 10.9%11 Taxi/minicab 75 0.5%12 Other 126 0.8%Total 16024 100%DNA 20329
I180 is asked of respondents in paidemployment, and working somewherethat is not their own home.Respondents who used a mixture ofmethods were asked to nominate onethat they considered the ‘main’method. ‘Bus’ includes coaches andbuses provided by an employer.
Missing values are patched usingI184, J28, I177 and I188.
I220 County of workplace1 Avon 227 1.6%2 Bedfordshire 112 0.8%3 Berkshire 217 1.6%4 Buckinghamshire 149 1.1%5 Cambridgeshire 260 1.9%6 Cheshire 252 1.8%7 Cleveland 87 0.6%8 Cornwall 58 0.4%9 Cumbria 218 1.6%10 Derbyshire 206 1.5%11 Devon 342 2.4%12 Dorset 110 0.8%13 Durham 96 0.7%14 East Sussex 110 0.8%15 Essex 333 2.4%16 Gloucestershire 224 1.6%17 Greater Manchester 589 4.2%18 Hampshire 408 2.9%19 Hereford andWorcester
145 1.0%
20 Hertfordshire 169 1.2%
I220 County of workplace21 Humberside 208 1.5%22 Isle of Wight 20 0.1%23 Kent 328 2.3%24 Lancashire 265 1.9%25 Leicestershire 243 1.7%26 Lincolnshire 210 1.5%27 London Central 640 4.6%28 Other Inner London 456 3.3%31 Other London notCentral
702 5.0%
32 Merseyside 268 1.9%33 Norfolk 178 1.3%34 Northamptonshire 114 0.8%35 Northumberland 119 0.9%36 North Yorkshire 254 1.8%37 Nottinghamshire 294 2.1%38 Oxfordshire 218 1.6%39 Shropshire 121 0.9%40 Somerset 185 1.3%41 South Yorkshire 243 1.7%42 Staffordshire 234 1.7%43 Suffolk 206 1.5%44 Surrey 174 1.2%45 Tyne and Wear 274 2.0%46 Warwickshire 111 0.8%47 West Midlands 687 4.9%48 West Sussex 180 1.3%49 West Yorkshire 503 3.6%50 Wiltshire 219 1.6%51 Clwyd 102 0.7%52 Dyfed 77 0.6%53 Gwent 115 0.8%54 Gwynedd 104 0.7%55 Mid Glamorgan 109 0.8%56 Powys 14 0.1%57 South Glamorgan 127 0.9%58 West Glamorgan 64 0.5%59 Borders 16 0.1%60 Central 113 0.8%61 Dumfries andGalloway
12 0.1%
62 Fife 62 0.4%63 Grampian 154 1.1%64 Highlands 56 0.4%65 Lothian 233 1.7%66 Strathclyde 522 3.7%67 Tayside 82 0.6%68 Essex within M25 0 0.0%69 Hertfordshire withinM25
39 0.3%
70 Kent within M25 3 0.0%71 Surrey within M25 18 0.1%Total 13988 100%DNA 22365

National Centre for Social Research
92
Missing values are patched using J24,J26, J57 and J58.
I267 UA of workplace
1 Bath and North EastSomerset
30 0.2%
2 Bedfordshire 59 0.4%3 Blackburn with Darwen 52 0.4%4 Blackpool 32 0.2%5 Bournemouth 19 0.1%6 Bracknell Forest 21 0.2%7 Brighton and Hove 33 0.2%8 Bristol, City of 152 1.1%9 Buckinghamshire 100 0.7%10 Cambridgeshire 178 1.3%11 Cheshire 177 1.3%12 Cornwall and Isles ofScilly
58 0.4%
13 Cumbria 218 1.3%14 Darlington 11 0.1%15 Derby 65 0.5%16 Derbyshire 141 1.0%17 Devon 296 2.1%18 Dorset 66 0.5%19 Durham 85 0.6%20 East Riding ofYorkshire
46 0.3%
21 East Sussex 76 0.5%22 Essex (area outsideM25)
276 2.0%
23 Essex (area withinM25)
0 0.0%
24 Gloucestershire 223 1.6%25 Greater Manchester 589 4.2%26 Halton 32 0.2%27 Hampshire 236 1.7%28 Hartlepool 11 0.1%29 Herefordshire 74 0.5%30 Hertfordshire (areaoutside M25)
169 1.2%
31 Hertfordshire (areawithin M25)
39 0.3%
32 Inner London 454 3.3%33 Isle of Wight 20 0.1%34 Kent (area outsideM25)
305 2.2%
35 Kent (area withinM25)
3 0.0%
36 Kingston upon Hull,City of
63 0.5%
37 Lancashire 181 1.3%38 Leicester 97 0.7%39 Leicestershire 141 1.0%40 Lincolnshire 210 1.5%
I267 UA of workplace41 London Central 640 4.6%42 London Outer 699 5.0%43 Luton 53 0.4%44 Medway Towns 19 0.1%45 Merseyside 268 1.9%46 Middlesbrough 23 0.2%47 Milton Keynes 49 0.4%48 Newbury 14 0.1%49 Norfolk 178 1.3%50 North EastLincolnshire
45 0.3%
51 North Lincolnshire 53 0.4%52 North Somerset 33 0.2%53 North Yorkshire 190 1.4%54 Northamptonshire 113 0.8%55 Northumberland 117 0.8%56 Nottingham 156 1.1%57 Nottinghamshire 137 1.0%58 Oxfordshire 216 1.5%59 Peterborough 82 0.6%60 Plymouth 12 0.1%61 Poole 24 0.2%62 Portsmouth 96 0.7%63 Reading 58 0.4%64 Redcar & Cleveland 21 0.2%65 Rutland 4 0.0%66 Shropshire 72 0.5%67 Slough 49 0.4%68 Somerset 186 1.3%69 SouthGloucestershire
12 0.1%
70 South Yorkshire 243 1.7%71 Southampton 76 0.5%72 Southend on Sea 36 0.3%73 Staffordshire 141 1.0%74 Stockton-on-Tees 31 0.2%75 Stoke-on-Trent 91 0.7%76 Suffolk 205 1.5%77 Surrey (area outsideM25)
174 1.2%
78 Surrey (area withinM25)
18 0.1%
79 Swindon 107 0.8%80 The Wrekin 48 0.3%81 Thurrock 18 0.1%82 Torbay 33 0.2%83 Tyne and Wear 273 2.0%84 Warrington 42 0.3%85 Warwickshire 111 0.8%86 West Midlands 684 4.9%87 West Sussex 180 1.3%88 West Yorkshire 503 3.6%89 Wiltshire 111 0.8%90 Windsor & 48 0.3%

National Centre for Social Research
93
I267 UA of workplaceMaidenhead91 Wokingham 27 0.2%92 Worcestershire 69 0.5%93 York 64 0.5%94 Aberdeen City 142 1.0%95 Aberdeenshire 10 0.1%96 Angus 28 0.2%97 Argyll and Bute 34 0.2%98 Clackmannshire 5 0.0%99 Dumfries & Galloway 12 0.1%100 Dundee, City of 31 0.2%101 East Ayrshire 31 0.2%102 East Dunbartonshire 0 0.0%103 East Lothian 8 0.1%104 East Renfrewshire 10 0.1%105 Edinburgh, City of 166 1.2%106 Falkirk 67 0.5%107 Fife 62 0.4%108 Glasgow, City of 204 1.5%109 Highland 51 0.4%110 Inverclyde 19 0.1%111 Midlothian 15 0.1%112 Moray 2 0.0%113 North Ayrshire 24 0.2%114 North Lanarkshire 43 0.3%115 Orkney Islands 1 0.0%116 Perth and Kinross 22 0.2%117 Renfrewshire 33 0.2%118 Scottish Borders 16 0.1%119 Shetland Islands 1 0.0%120 South Ayrshire 15 0.1%121 South Lanarkshire 72 0.5%122 Stirling 41 0.3%123 WestDunbartonshire
35 0.3%
124 West Lothian 44 0.3%125 Western Isles 1 0.0%126 Blaenau Gwent 11 0.1%127 Bridgend 15 0.1%128 Caerphilly 32 0.2%129 Cardiff 119 0.9%130 Carmarthenshire 29 0.2%131 Ceredigion 28 0.2%132 Conwy 7 0.1%133 Denbighshire 38 0.3%134 Flintshire 34 0.2%135 Gwynedd 82 0.6%136 Isle of Anglesey 18 0.1%137 Merthyr Tydfil 40 0.3%138 Monmouthshire 41 0.3%139 Neath and PortTalbot
32 0.2%
140 Newport 49 0.4%141 Pembrokeshire 20 0.1%
I267 UA of workplace142 Powys 14 0.1%143 Rhondda, Cynon,Taff
28 0.2%
144 Swansea 32 0.2%145 Torfaen 7 0.1%146 Vale of Glamorgan 8 0.1%147 Wrexham 27 0.2%Total 13946 100%NA 8DNA 22399
Missing values are patched using J24,J26, J57 and J58.
I270 Work place urban/rural1 Inner London 1094 7.8%2 Outer London built-uparea
912 6.5%
3 West Midlands built-uparea
549 3.9%
4 Greater Manchesterbuilt-up area
582 4.2%
5 West Yorkshire built-up area
417 3.0%
6 Glasgow built-up area 204 1.5%7 Liverpool built-up area 196 1.4%8 Tyneside built-up area 243 1.7%9 Other urban over 250K 1995 14.3%10 Other urban over100K to 250K
1886 13.5%
11 Other urban over 50Kto 100K
1329 9.5%
12 Other urban over 25Kto 50K
1417 10.2%
13 Other urban over 10Kto 25K
1435 10.3%
14 Other urban over 3Kto 10K
849 6.1%
15 Rural 838 6.0%Total 13946 100%NA 13DNA 22394
I314 Difficulties with car trips going to workMulti-coded1 No difficulties 6812 60.3%2 Too far/long journey 188 1.7%3 Cost of petrol 196 1.7%4 Lack of parkingfacilities
298 2.6%
5 Cost of parking 127 1.1%6 Personal disability 9 0.1%7 Concerns overpersonal safety
110 1.0%

National Centre for Social Research
94
I314 Difficulties with car trips going to work8 Trafficcongestion/roadworks
4142 36.7%
9 The weather 324 2.9%10 Other 118 1.0%Total 11288 100%NA 35DNA 25030
I315 Most difficult problem with car tripsgoing to work
1 No difficulties 6812 60.4%2 Too far / long journey 77 0.7%3 Cost of petrol 54 0.5%4 Lack of parkingfacilities
137 1.2%
5 Cost of parking 31 0.3%6 Personal disability 7 0.1%7 Concerns overpersonal safety
33 0.3%
8 Trafficcongestion/roadworks
3949 35.0%
9 The weather 113 1.0%10 Other 74 0.7%Total 25030 100%NA 36DNA 25030
I316 Travel to work another way
1 Very easy 1599 14.2%2 Quite easy 2419 21.4%3 Neither easy nordifficult
732 6.5%
4 Quite difficult 2298 20.4%5 Very difficult 4235 37.5%Total 11283 100%NA 40DNA 25030
I316 is recorded for all respondentswho had a regular trip to work, forwhich they used a car or motorcycleas their usual main method of travel.
The relevant question asks how easythe respondent would find it to maketheir trip to or from work using anothermethod.
I317 Why difficult to travel to work anotherwayMulti-coded1 Too far/long journey 1907 29.2%2 Not possible by publictransport
3085 47.2%
3 Distance to publictransport
294 4.5%
4 Unreliable publictransport
1216 18.6%
5 Cost of using publictransport/taxis
380 5.8%
6 Poor information aboutpublic transport
144 2.2%
7 Poor connections 1944 29.8%8 Public transportunpleasant
135 2.1%
9 Personal disability 54 0.8%10 Concerns overpersonal safety
105 1.6%
11 Trafficcongestion/roadworks
210 3.2%
12 Difficulties withdropping other people off
168 2.6%
13 Vehicle essential forjob
576 8.8%
14 The weather 86 1.3%15 Other 179 2.7%Total 6532 100%NA 1DNA 29820
I318 Most difficult problem with travellinganother way
1 Too far/long journey 1061 16.5%2 Not possible by publictransport
2600 40.4%
3 Distance to publictransport
86 1.3%
4 Unreliable publictransport
564 8.8%
5 Cost of using publictransport/taxis
69 1.1%
6 Poor information aboutpublic transport
36 0.6%
7 Poor connections 1193 18.5%8 Public transportunpleasant
28 0.4%
9 Personal disability 45 0.7%10 Concerns overpersonal safety
37 0.6%
11 Trafficcongestion/roadworks
59 0.9%
12 Difficulties withdropping other people off
113 1.8%

National Centre for Social Research
95
I318 Most difficult problem with travellinganother way13 Vehicle essential forjob
7 0.1%
14 The weather 496 7.7%15 Other 138 2.1%Total 6439 100%NA 1DNA 29820
I317 and I318 are recorded for allrespondents who answer (in I316) thatthey would find it ‘quite difficult’ or‘very difficult’ to travel to work using analternative method to car/motorbike.
Variable I317 captures all difficultiesreported; variable I318 captures onlythe one considered by the respondentto be the single most important.
I319 Any difficulties travelling to work byother modesMulticoded1 No difficulties 3113 66.3%2 Too far/long journey 79 1.7%3 Journey not possibleby public transport
43 0.9%
4 Unreliable publictransport
868 18.5%
5 Cost of using publictransport/taxis
98 2.1%
6 Poor information aboutpublic transport
79 1.7%
7 Poor connections 170 3.6%8 Public transportunpleasant
250 5.3%
9 Personal disability 27 0.6%10 Concerns overpersonal safety
157 3.3%
11 Trafficcongestion/roadworks
374 8.0%
12 Lack of/no cyclelanes
31 0.7%
13 The weather 190 4.0%14 Other 81 1.7%Total 4696 100%NA 4DNA 31653
I320 Most difficult problem travelling byother modes
1 No difficulties 3113 66.3%2 Too far/long journey 34 0.7%3 Journey not possibleby public transport
19 0.4%
4 Unreliable publictransport
752 16.0%
5 Cost of using publictransport/taxis
31 0.7%
6 Poor information aboutpublic transport
8 0.2%
7 Poor connections 65 1.4%8 Public transportunpleasant
81 1.7%
9 Personal disability 15 0.3%10 Concerns overpersonal safety
102 2.2%
11 Trafficcongestion/roadworks
273 5.8%
12 Lack of/no cyclelanes
15 0.3%
13 The weather 126 2.7%14 Other 61 1.3%Total 4695 100%NA 5DNA 31653
I319 and I320 represent problemsfaced by those who travel to work byany method other than private car ormotorcycle. I319 captures all suchproblems; I320 captures only theproblem considered by the respondentto be the single most important.
I321 Car unused while at work
1 All cars usually in use 450 39.3%2 Car unused, butrespondent not insuredto drive it
40 3.5%
3 Car unused andrespondent is insured todrive it
656 57.2%
Total 1146 100%NA 15DNA 35192
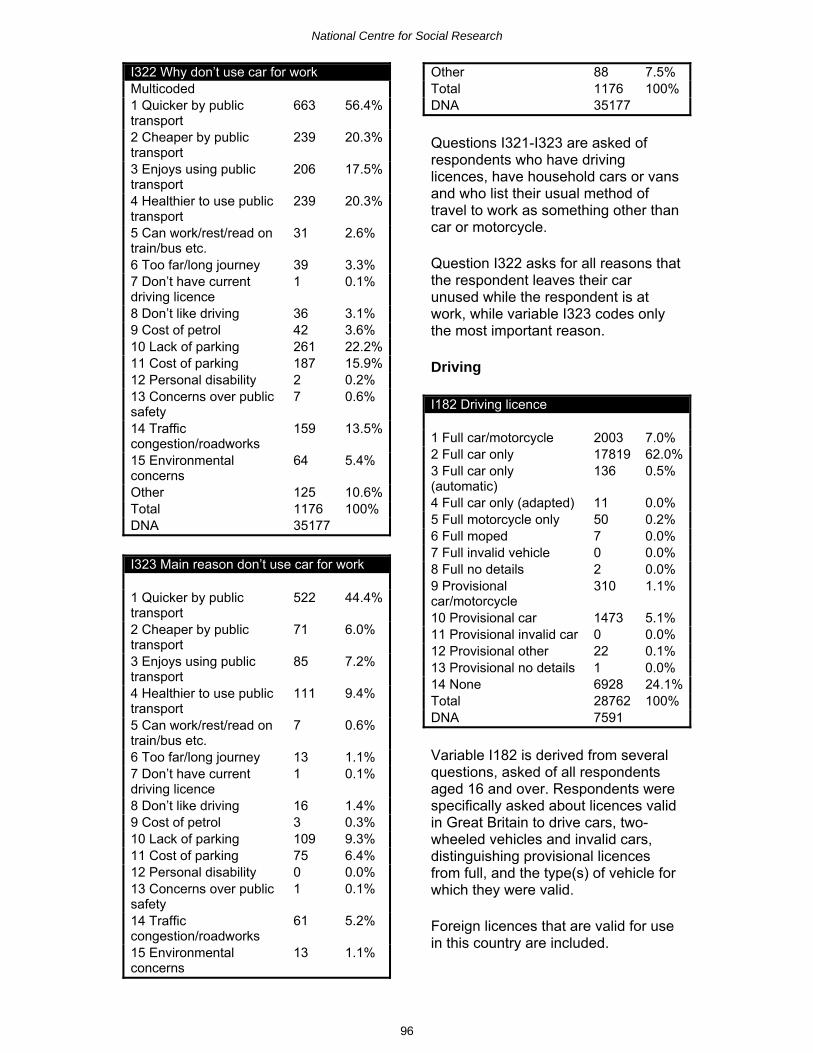
National Centre for Social Research
96
I322 Why don’t use car for workMulticoded1 Quicker by publictransport
663 56.4%
2 Cheaper by publictransport
239 20.3%
3 Enjoys using publictransport
206 17.5%
4 Healthier to use publictransport
239 20.3%
5 Can work/rest/read ontrain/bus etc.
31 2.6%
6 Too far/long journey 39 3.3%7 Don’t have currentdriving licence
1 0.1%
8 Don’t like driving 36 3.1%9 Cost of petrol 42 3.6%10 Lack of parking 261 22.2%11 Cost of parking 187 15.9%12 Personal disability 2 0.2%13 Concerns over publicsafety
7 0.6%
14 Trafficcongestion/roadworks
159 13.5%
15 Environmentalconcerns
64 5.4%
Other 125 10.6%Total 1176 100%DNA 35177
I323 Main reason don’t use car for work
1 Quicker by publictransport
522 44.4%
2 Cheaper by publictransport
71 6.0%
3 Enjoys using publictransport
85 7.2%
4 Healthier to use publictransport
111 9.4%
5 Can work/rest/read ontrain/bus etc.
7 0.6%
6 Too far/long journey 13 1.1%7 Don’t have currentdriving licence
1 0.1%
8 Don’t like driving 16 1.4%9 Cost of petrol 3 0.3%10 Lack of parking 109 9.3%11 Cost of parking 75 6.4%12 Personal disability 0 0.0%13 Concerns over publicsafety
1 0.1%
14 Trafficcongestion/roadworks
61 5.2%
15 Environmentalconcerns
13 1.1%
Other 88 7.5%Total 1176 100%DNA 35177
Questions I321-I323 are asked ofrespondents who have drivinglicences, have household cars or vansand who list their usual method oftravel to work as something other thancar or motorcycle.
Question I322 asks for all reasons thatthe respondent leaves their carunused while the respondent is atwork, while variable I323 codes onlythe most important reason.
Driving
I182 Driving licence
1 Full car/motorcycle 2003 7.0%2 Full car only 17819 62.0%3 Full car only(automatic)
136 0.5%
4 Full car only (adapted) 11 0.0%5 Full motorcycle only 50 0.2%6 Full moped 7 0.0%7 Full invalid vehicle 0 0.0%8 Full no details 2 0.0%9 Provisionalcar/motorcycle
310 1.1%
10 Provisional car 1473 5.1%11 Provisional invalid car 0 0.0%12 Provisional other 22 0.1%13 Provisional no details 1 0.0%14 None 6928 24.1%Total 28762 100%DNA 7591
Variable I182 is derived from severalquestions, asked of all respondentsaged 16 and over. Respondents werespecifically asked about licences validin Great Britain to drive cars, two-wheeled vehicles and invalid cars,distinguishing provisional licencesfrom full, and the type(s) of vehicle forwhich they were valid.
Foreign licences that are valid for usein this country are included.

National Centre for Social Research
97
Missing values are imputed from I3and I6.
I183 Driving experience
1 No licence 6928 24.2%2 Provisional only 1806 6.3%3 Full licence under 2years
436 1.5%
4 Full licence 2-3 years 536 1.9%5 Full licence 4-5 years 564 2.0%6 Full licence 6-7 years 636 2.2%7 Full licence 8-10 years 1168 4.1%8 Full licence 11-14years
2043 7.1%
9 Full licence 15-19years
2479 8.7%
10 Full licence 20-24years
2458 8.6%
11 Full licence 25-29years
2087 7.3%
12 Full licence 30-39years
3937 13.7%
13 Full licence 40-49years
2416 8.4%
14 Full licence 50+ years 1140 4.0%Total 28634 0.4%NA 128DNA 7591
I183 is asked of all respondents withany type of driving licence.
I203 Access to car
1 Main driver ofcompany car
959 2.6%
2 Other main driver 14762 40.6%3 Not main driver ofhousehold car
3202 8.8%
4 Household car butnon-driver
10246 28.2%
5 Driver but no car 1048 2.9%6 Non driver and no car 6136 16.9%Total 36353 100%
The definition of ‘car’ in this contextincludes ordinary cars, Jeeps, LandRovers, light vans, minibuses anddormobiles.
The ‘main driver’ of a vehicle is theperson who generally drives the mostmiles in the car. This may not be the
same person to whom the car isregistered or assigned.
A ‘driver’ is any person who holds afull driving licence valid for at least onehousehold car.
Conversely, a ‘non-driver’ is somebodywho does not hold a full drivinglicence, valid for at least onehousehold car.
Some respondents may be the maindriver of more than one household car.
Missing values are patched from H55,V3, V9, V112, V160, I1, I5 and I182.
Home working
I257 Work at home instead of usualworkplace
1 Yes 820 5.1%2 No 15199 94.9%Total 16019 100%NA 5DNA 20329
I257 is asked only of people who areemployed, and do not normally work athome. It records whether therespondent worked at home, in theseven-day period to the Sunday priorto the placement interview.
I258 Day of week worked at homeMulticoded1 Monday 328 40.4%2 Tuesday 341 42.0%3 Wednesday 340 41.9%4 Thursday 327 40.3%5 Friday 328 40.4%6 Saturday 87 10.7%7 Sunday 89 11.0%Total 812 100%Day not known 8Worked at home statusnot known
5
DNA 35528
I258 is asked of all people whorecorded ‘Yes’ for I257, and records all

National Centre for Social Research
98
days worked at home in the same timeperiod.
I309 Possible to work at home?
1 Yes 1638 10.8%2 No 13560 89.2%Total 15198 100%NA 1DNA 21154
I309 is asked of all people whoanswered ‘No’ for the question relatingto I257, and records whether it wouldbe possible to do their kind of work athome. It records a ‘Yes’ value for allpeople who could sometimes work athome, and for those who could do so ifit were possible to borrow appropriateequipment (a laptop, for example) fromwork.
I310 How often worked at home
1 3 or more times aweek
234 9.6%
2 Once or twice a week 441 18.0%3 Less than once aweek, more than twice amonth
161 6.6%
4 Once or twice a month 394 16.1%5 Less than once amonth, more than twicea year
263 10.7%
6 Once or twice a year 224 9.1%7 Less than once a yearor never
732 29.9%
Total 2449 100%NA 9DNA 33895
I310 records how often the respondentnormally works at home. This figureexcludes additional work done outsideof the respondent’s normal workinghours.
I311 Why not work at home (more often)Multicoded1 Do not haveequipment at home
137 18.7%
2 Employer does notallow it
382 52.2%
3 Just prefer not to 189 25.8%
4 No space to work athome
27 3.7%
5 Children at home 19 2.6%6 Other reason 58 7.9%Total 732 100%DNA 35621
I311 is only recorded for respondentswho record that they work at homeless than once a year or never. Itcodes all reasons that apply.
I312 Possible to work at home withouttelephone
1 Would be possiblewithout
65 4.7%
2 Would sometimes bepossible
226 16.3%
3 Would never bepossible
1092 79.0%
Total 1383 100%Don’t use telephone 334DNA 34636
I313 Possible to work at home without acomputer
1 Would be possiblewithout
75 5.2%
2 Would sometimes bepossible
193 13.5%
3 Would never bepossible
1166 81.3%
Total 1434 100%Don’t use computer 283DNA 34636
I312 and I313 are based uponquestions asked of people who work athome at least once or twice a year(from I310), or worked at home in thepreceding 7-day period (from I257).
Public transport use
I261 Frequency of bus use2003 only, Modular1 3 or more times aweek
3094 15.9%
2 Once or twice a week 2140 11.0%3 Less than once perweek, more than twice amonth
795 4.1%

National Centre for Social Research
99
I261 Frequency of bus use4 Once or twice a month 1429 7.3%5 Less than once amonth, more than twicea year
1431 7.4%
6 Once or twice a year 1913 9.8%7 Less than once a yearor never
8658 44.5%
Total 19460 100%NA 7DNA 16886
I262 Frequency of express bus/coach use2003 only, Modular1 3 or more times aweek
48 0.2%
2 Once or twice a week 76 0.4%3 Less than once perweek, more than twice amonth
70 0.4%
4 Once or twice a month 234 1.2%5 Less than once amonth, more than twicea year
676 3.5%
6 Once or twice a year 2070 10.6%7 Less than once a yearor never
16287 83.7%
Total 19461 100%NA 6DNA 16886
I263 Frequency of surface rail use2003 only, Modular1 3 or more times aweek
484 2.5%
2 Once or twice a week 484 2.5%3 Less than once perweek, more than twice amonth
453 2.3%
4 Once or twice a month 1377 7.1%5 Less than once amonth, more than twicea year
2526 13.0%
6 Once or twice a year 3872 19.9%7 Less than once a yearor never
10265 52.7%
Total 19461 100%NA 6DNA 16886
I264 Frequency of taxi/minicab use2003 only, Modular1 3 or more times aweek
523 2.7%
2 Once or twice a week 1687 8.7%
I264 Frequency of taxi/minicab use3 Less than once perweek, more than twice amonth
884 4.5%
Once or twice a month 2328 12.0%Less than once a month,more than twice a year
2548 13.1%
Once or twice a year 3072 15.8%Less than once a year ornever
8419 43.3%
Total 19461 100%NA 6DNA 16886
I266 Frequency of domestic air flight use2003 only, Modular1 3 or more times aweek
6 0.0%
2 Once or twice a week 22 0.1%3 Less than once perweek, more than twice amonth
46 0.2%
4 Once or twice a month 92 0.5%5 Less than once amonth, more than twicea year
397 2.0%
6 Once or twice a year 1222 6.3%7 Less than once a yearor never
17676 90.8%
Total 19461 100%NA 6DNA 16886
Cycling
I265 Frequency of bicycle use2003 only, Modular1 3 or more times aweek
1514 8.3%
2 Once or twice a week 1109 6.1%3 Less than once perweek, more than twice amonth
611 3.4%
4 Once or twice a month 933 5.1%5 Less than once amonth, more than twicea year
691 3.8%
6 Once or twice a year 804 4.4%7 Less than once a yearor never
12570 68.9%
Total 18232 100%NA 10DNA 18111

National Centre for Social Research
100
I271 Own or use a bicycle
1 Own a bicycle yourself 14060 41.2%2 Have use of householdbicycle
379 1.1%
3 Have use of non-household bicycle
136 0.4%
4 Have no use of abicycle
19560 57.3%
Total 34135 100%NA 11DNA 2207
‘Bicycle’ excludes exercise bikes, butincludes all other bicycles, even if theyare not in a roadworthy condition.
I272 Ridden a bicycle in the last 12months
1 Yes 12291 36.8%2 No 21139 63.2%Total 33430 100%Don’t know/can’tremember
716
DNA 2207
I273 Where did you cycle
1 Mainly on the road 5549 45.2%2 Pavement, cycle pathor cycle lane
3232 26.3%
3 Parks, open country orprivate land
1830 14.9%
4 Variety of surfaces 1677 13.6%Total 12288 100%NA 3DNA 24062
The questions that produce I271-I273are asked only of those over 4 years ofage.
Variable I273 asks where peoplecycled most often over the course ofthe preceding 12 months.
School travel
The majority of questions in thissection are taken from the householdsurvey.
See also I339 for transport difficultieswith trips to school.
I278 Daily school trip
1 Makes daily journey 3469 99.4%2 No daily journey 20 0.6%Total 3489 100%NA 1DNA 32863
Those in the second category for I278include those educated at home,children at boarding school etc.
I280 How far to school (time)Based on numeric variable I2791 Up to 5 minutes 719 35.9%2 6 to 10 minutes 545 27.2%3 11 to 15 minutes 341 17.0%4 16 to 20 minutes 190 9.5%5 21 to 25 minutes 69 3.4%6 26 to 30 minutes 89 4.4%7 31 to 45 minutes 40 2.0%8 46 to 60 minutes 6 0.3%9 Over 60 minutes 4 0.2%Total 2003 73.1%Distance given 1465No daily journey 20NA 2DNA 22863
I282 How far to school (distance)Based on numeric variable I2811 One mile and under 324 22.1%2 Over 1 mile to 2 miles 357 24.4%3 Over 2 to under 3miles
252 17.2%
4 Over 3 to under 4miles
150 10.3%
5 Over 4 to under 5miles
113 7.7%
6 Over 5 to under 10miles
187 12.8%
7 Over 10 to under 15miles
49 202%
8 Over 15 miles 31 2.1%Total 1463 100%Time given 2004No daily journey 20NA 2DNA 32863

National Centre for Social Research
101
For I282 respondents had the option ofgiving the distance to school in miles,kilometres, yards or metres. Answersgiven in metres or yards were thenused to calculate the distance in miles.
I283 Method of school travel
1 Underground, metro,light rail, tram
10 0.3%
2 Train 16 0.5%3 Public bus, minibus orcoach
265 7.6%
4 School or LA bus,minibus or coach
286 8.2%
4 Motorcycle, scooter ormoped
2 0.1%
5 Car or van 1093 31.5%6 Taxi/minicab 42 1.2%7 Bicycle 51 1.5%8 On foot 1704 49.1%Total 3469 100%No daily journey 20NA 1DNA 32863
I283 is asked of the HRP, in thehousehold questionnaire, about eachchild in the household. Where severalmodes are used, the usual mode usedfor the longest part of the trip is coded.
I284 Accompanied to school by an adult
1 Usually accompaniedby an adult
1991 57.4%
2 Not usuallyaccompanied by an adult
1253 36.1%
3 Sometimesaccompanied andsometimes not
171 4.9%
4 Part of wayaccompanied, part ofway not
54 1.6%
Total 3469 100%No daily journey 20NA 1DNA 32863
I285 Reason accompanied to schoolMulticoded1 Traffic danger 1021 51.3%2 Child might get lost 193 9.7%3 Child might not arriveon time
274 13.8%
4 Fear ofassault/molestation
810 40.7%
5 Fear of bullying 150 7.5%6 School too far away 517 26.0%7 Other 479 24.1%Total 1990 100%No daily journey 20Not accompanied 1478DNA 32864
I286 Age first unaccompanied to school
1 4 11 0.8%2 5 28 2.0%3 6 35 2.5%4 7 120 8.5%5 8 154 10.8%6 9 223 15.7%7 10 244 17.2%8 11 484 34.1%9 12 108 7.6%10 13 13 0.9%11 14 0 0.0%Total 1420 100%Age unknown 4Always accompanied 2045No daily journey 20NA 1DNA 32863
I287 Reason accompanied to schoolbefore allowed aloneMulticoded1 Traffic danger 819 57.6%2 Child might get lost 132 9.3%3 Child might not arriveon time
180 12.7%
4 Fear ofassault/molestation
574 40.4%
5 Fear of bullying 165 11.6%6 School too far away 233 16.4%7 Other 284 20.0%Total 1422 100%No daily journey 20Not unaccompanied 2045DNA 32864
I288 Allowed to cross roads1 Yes, almost always 1578 45.2%2 Yes,sometimes/depends
1018 29.2%
3 No, never 893 25.6%Total 3489 100%NA 1DNA 32863

National Centre for Social Research
102
I289 Allowed to cross main roads
1 Main roads 2458 56.2%2 Minor roads 1137 43.8%Total 2595 100%NA 1DNA 33757
Question I289 is asked only of thosewho advise that their child is allowedto cross roads alone.
Walking
I293 asks respondents how frequentlythey make walks of 20 minutes ormore.
The remainder of questions in thissection ask respondents to elaborateon the last such trip that they made.
I293 Frequency of walking
1 3 or more times aweek
11573 33.4%
2 Once or twice a week 7279 21.0%3 Less than once a weekbut more than twice amonth
1969 5.7%
4 Once or twice a month 2879 8.3%5 Less than once amonth but more thantwice a year
1370 4.0%
6 Once or twice a year 953 2.8%7 Less than once a yearor never
8587 24.8%
Total 34610 100%NA 36DNA 1707
I294 Where respondent walked
1 Mostly on pavementsalongside a road
17423 67.0%
2 Mostly on countryroads without pavements
1533 5.9%
3 Mostly in a town or citypark, or other urban area
1476 5.7%
4 Mostly in thecountryside
3453 13.3%
5 A mixture of these 1927 7.4%6 Other 186 0.7%
Total 25998 100%NA 25DNA 10330
I296 Duration of walkBased on numeric variable I2951 20-24 minutes 10946 42.3%2 25-29 minutes 3060 11.8%3 30-34 minutes 6345 24.5%4 35-39 minutes 462 1.8%5 40-44 minutes 897 3.5%6 45-49 minutes 1110 4.3%7 50-54 minutes 118 0.5%8 55-59 minutes 17 0.1%9 60-64 minutes 1665 6.4%10 65-59 minutes 13 0.1%11 70-74 minutes 21 0.1%12 75-79 minutes 86 0.3%13 80-84 minutes 28 0.1%14 85-89 minutes 3 0.0%15 90-119 minutes 436 1.7%16 120-179 minutes 416 1.6%17 180-239 minutes 142 0.5%18 240-299 minutes 56 0.2%19 300-359 minutes 26 0.1%20 360-419 minutes 14 0.1%21 420-479 minutes 1 0.0%22 480 minutes and over 38 0.1%Total 25900 100%NA 123DNA 10330
I298 Distance walkedBased on numeric variable I2971 1 mile 9 29.0%2 2 miles 6 19.4%3 3 miles 0 0.054 4 miles 0 0.0%5 5 miles 3 9.756 6 miles 3 9.7%7 7 miles 1 3.2%8 8 miles 2 6.5%9 9 miles 1 3.2%10 10 miles 2 6.5%11 11-15 miles 2 6.5512 16-20 miles 2 6.5%13 21-25 miles 0 0.0%14 26 miles and over 0 0.0%Total 31 100%NA 36321 100DNA 36321
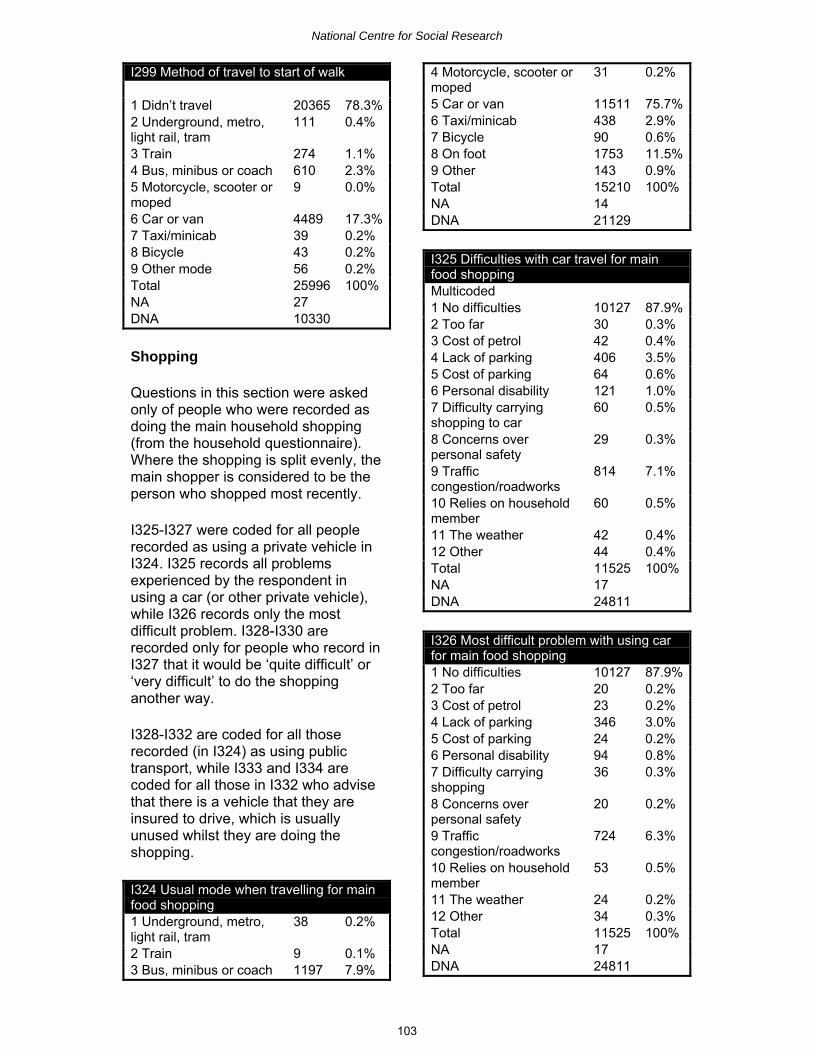
National Centre for Social Research
103
I299 Method of travel to start of walk
1 Didn’t travel 20365 78.3%2 Underground, metro,light rail, tram
111 0.4%
3 Train 274 1.1%4 Bus, minibus or coach 610 2.3%5 Motorcycle, scooter ormoped
9 0.0%
6 Car or van 4489 17.3%7 Taxi/minicab 39 0.2%8 Bicycle 43 0.2%9 Other mode 56 0.2%Total 25996 100%NA 27DNA 10330
Shopping
Questions in this section were askedonly of people who were recorded asdoing the main household shopping(from the household questionnaire).Where the shopping is split evenly, themain shopper is considered to be theperson who shopped most recently.
I325-I327 were coded for all peoplerecorded as using a private vehicle inI324. I325 records all problemsexperienced by the respondent inusing a car (or other private vehicle),while I326 records only the mostdifficult problem. I328-I330 arerecorded only for people who record inI327 that it would be ‘quite difficult’ or‘very difficult’ to do the shoppinganother way.
I328-I332 are coded for all thoserecorded (in I324) as using publictransport, while I333 and I334 arecoded for all those in I332 who advisethat there is a vehicle that they areinsured to drive, which is usuallyunused whilst they are doing theshopping.
I324 Usual mode when travelling for mainfood shopping1 Underground, metro,light rail, tram
38 0.2%
2 Train 9 0.1%3 Bus, minibus or coach 1197 7.9%
4 Motorcycle, scooter ormoped
31 0.2%
5 Car or van 11511 75.7%6 Taxi/minicab 438 2.9%7 Bicycle 90 0.6%8 On foot 1753 11.5%9 Other 143 0.9%Total 15210 100%NA 14DNA 21129
I325 Difficulties with car travel for mainfood shoppingMulticoded1 No difficulties 10127 87.9%2 Too far 30 0.3%3 Cost of petrol 42 0.4%4 Lack of parking 406 3.5%5 Cost of parking 64 0.6%6 Personal disability 121 1.0%7 Difficulty carryingshopping to car
60 0.5%
8 Concerns overpersonal safety
29 0.3%
9 Trafficcongestion/roadworks
814 7.1%
10 Relies on householdmember
60 0.5%
11 The weather 42 0.4%12 Other 44 0.4%Total 11525 100%NA 17DNA 24811
I326 Most difficult problem with using carfor main food shopping1 No difficulties 10127 87.9%2 Too far 20 0.2%3 Cost of petrol 23 0.2%4 Lack of parking 346 3.0%5 Cost of parking 24 0.2%6 Personal disability 94 0.8%7 Difficulty carryingshopping
36 0.3%
8 Concerns overpersonal safety
20 0.2%
9 Trafficcongestion/roadworks
724 6.3%
10 Relies on householdmember
53 0.5%
11 The weather 24 0.2%12 Other 34 0.3%Total 11525 100%NA 17DNA 24811

National Centre for Social Research
104
I327 Main food shopping another way
1 Very easy 1045 9.1%2 Quite easy 2987 25.9%3 Neither easy nordifficult
979 8.5%
4 Quite difficult 2933 25.5%5 Very difficult 3570 31.0%Total 11514 100%NA 28DNA 24811
I328 Why difficult to do main shoppinganother wayMulticoded1 Too far/long journey 1272 19.6%2 Journey not possibleby public transport
1256 19.3%
3 Distance to publictransport
200 3.1%
4 Unreliable publictransport
747 11.5%
5 Cost of using publictransport/taxis
462 7.1%
6 Poor information aboutpublic transport
113 1.7%
7 Poor connections 603 9.3%8 Public transportunpleasant
118 1.8%
9 Personal disability 685 10.5%10 Concerns overpersonal safety
43 0.7%
11 Trafficcongestion/roadworks
84 1.3%
12 Difficulties carryingthe shopping
5191 79.8%
13 Difficulties managingwith children
500 7.7%
14 The weather 104 1.6%15 Other 100 1.5%Total 6502 100%NA 1DNA 29850
I328 is asked of those who do not dothe main food shopping in a car or ona motorbike.
I329 Main difficulty to do main shoppinganother way
1 Too far/long journey 462 7.1%2 Journey not possibleby public transport
725 11.2%
3 Distance to publictransport
59 0.9%
4 Unreliable publictransport
251 3.9%
5 Cost of using publictransport/taxis
107 1.6%
6 Poor information aboutpublic transport
18 0.3%
7 Poor connections 192 3.0%8 Public transportunpleasant
22 0.3%
9 Personal disability 492 7.6%10 Concerns overpersonal safety
2 0.0%
11 Trafficcongestion/roadworks
13 0.2%
12 Difficulties carryingthe shopping
1868 28.8%
13 Difficulties managingwith children
2141 33.0%
14 The weather 86 1.3%15 Other 58 0.9%Total 6496 100%NA 5DNA 29850
I330 Difficulties with public transport formain food shoppingMulticoded1 No difficulties 2606 71.0%2 Too far/long journey 36 1.0%3 Not possible by publictransport
31 0.8%
4 Unreliable publictransport
157 4.3%
5 Cost of using publictransport
70 1.9%
6 Poor information aboutservices
9 0.2%
7 Poor connections 26 0.7%8 Public transportunpleasant
54 1.5%
9 Personal disability 212 5.8%10 Concerns overpersonal safety
68 1.8%
11 Trafficcongestion/roadworks
78 2.1%
12 Difficulties carryingthe shopping
618 16.8%

National Centre for Social Research
105
I330 Difficulties with public transport formain food shopping13 Difficulties managingwith children
71 1.9%
14 The weather 79 2.2%15 Other 56 1.5%Total 3668 100%NA 0DNA 32685
I331 Main difficulty with public transport formain food shopping
1 No difficulties 2606 71.0%2 Too far/long journey 20 0.5%3 Not possible by publictransport
10 0.3%
4 Unreliable publictransport
108 2.9%
5 Cost of using publictransport
39 1.1%
6 Poor information aboutservices
1 0.0%
7 Poor connections 9 0.2%8 Public transportunpleasant
30 0.8%
9 Personal disability 158 4.3%10 Concerns overpersonal safety
43 1.2%
11 Trafficcongestion/roadworks
43 1.2%
12 Difficulties carryingthe shopping
489 13.3%
13 Difficulties managingwith children
29 0.8%
14 The weather 32 0.9%15 Other 51 1.4%Total 3668 100%NA 0DNA 32865
I332 Car unused while doing main foodshopping
1 All cars usually in use 90 18.6%2 Car unused, butrespondent not insuredto drive it
33 6.8%
3 Car unused andrespondent is insured todrive it
360 74.5%
Total 483 100%NA 4DNA 35866
I333 Why car not used for main foodshoppingMulticoded1 Quicker by publictransport
219 60.8%
2 Cheaper by publictransport
63 17.5%
3 Enjoys using publictransport
92 25.6%
4 Healthier to use publictransport
69 19.2%
5 Can work/rest/read onpublic transport
1 0.3%
6 Combines with anotherjourney
5 1.4%
7 Too far/long journey 0 0.0%8 Don’t have currentdriving licence
0 0.0%
9 Don’t like driving 11 3.1%10 Cost of petrol 12 3.3%11 Lack of parkingfacilities
43 11.9%
12 Cost of parking 10 2.8%13 Personal disability 5 1.4%14 Concerns overpersonal safety
0 0.0%
15 Trafficcongestion/roadworks
12 3.3%
16 Environmentalconcerns
21 5.8%
17 Other 38 10.6%Total 360 100%NA 0DNA 35993
I334 Main reason why car not used formain food shopping1 Quicker by publictransport
180 50.0%
2 Cheaper by publictransport
13 3.6%
3 Enjoys using publictransport
49 13.6%
4 Healthier to use publictransport
28 7.8%
5 Can work/rest/read onpublic transport
0 0.0%
6 Combines with anotherjourney
4 1.1%
7 Too far/long journey 0 0.0%8 Don’t have currentdriving licence
0 0.0%
9 Don’t like driving 8 2.2%10 Cost of petrol 5 1.4%11 Lack of parkingfacilities
25 6.9%
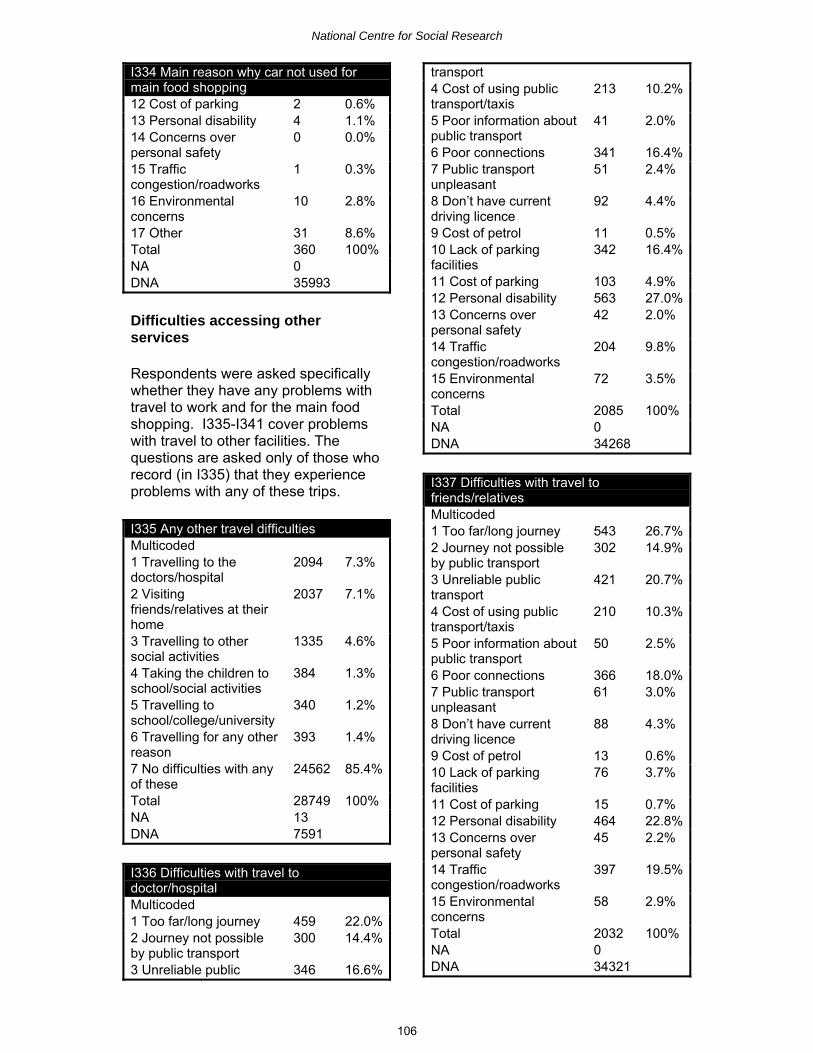
National Centre for Social Research
106
I334 Main reason why car not used formain food shopping12 Cost of parking 2 0.6%13 Personal disability 4 1.1%14 Concerns overpersonal safety
0 0.0%
15 Trafficcongestion/roadworks
1 0.3%
16 Environmentalconcerns
10 2.8%
17 Other 31 8.6%Total 360 100%NA 0DNA 35993
Difficulties accessing otherservices
Respondents were asked specificallywhether they have any problems withtravel to work and for the main foodshopping. I335-I341 cover problemswith travel to other facilities. Thequestions are asked only of those whorecord (in I335) that they experienceproblems with any of these trips.
I335 Any other travel difficultiesMulticoded1 Travelling to thedoctors/hospital
2094 7.3%
2 Visitingfriends/relatives at theirhome
2037 7.1%
3 Travelling to othersocial activities
1335 4.6%
4 Taking the children toschool/social activities
384 1.3%
5 Travelling toschool/college/university
340 1.2%
6 Travelling for any otherreason
393 1.4%
7 No difficulties with anyof these
24562 85.4%
Total 28749 100%NA 13DNA 7591
I336 Difficulties with travel todoctor/hospitalMulticoded1 Too far/long journey 459 22.0%2 Journey not possibleby public transport
300 14.4%
3 Unreliable public 346 16.6%
transport4 Cost of using publictransport/taxis
213 10.2%
5 Poor information aboutpublic transport
41 2.0%
6 Poor connections 341 16.4%7 Public transportunpleasant
51 2.4%
8 Don’t have currentdriving licence
92 4.4%
9 Cost of petrol 11 0.5%10 Lack of parkingfacilities
342 16.4%
11 Cost of parking 103 4.9%12 Personal disability 563 27.0%13 Concerns overpersonal safety
42 2.0%
14 Trafficcongestion/roadworks
204 9.8%
15 Environmentalconcerns
72 3.5%
Total 2085 100%NA 0DNA 34268
I337 Difficulties with travel tofriends/relativesMulticoded1 Too far/long journey 543 26.7%2 Journey not possibleby public transport
302 14.9%
3 Unreliable publictransport
421 20.7%
4 Cost of using publictransport/taxis
210 10.3%
5 Poor information aboutpublic transport
50 2.5%
6 Poor connections 366 18.0%7 Public transportunpleasant
61 3.0%
8 Don’t have currentdriving licence
88 4.3%
9 Cost of petrol 13 0.6%10 Lack of parkingfacilities
76 3.7%
11 Cost of parking 15 0.7%12 Personal disability 464 22.8%13 Concerns overpersonal safety
45 2.2%
14 Trafficcongestion/roadworks
397 19.5%
15 Environmentalconcerns
58 2.9%
Total 2032 100%NA 0DNA 34321

National Centre for Social Research
107
I338 Difficulties with travel to socialactivitiesMulticoded1 Too far/long journey 154 11.9%2 Journey not possibleby public transport
250 19.3%
3 Unreliable publictransport
317 24.5%
4 Cost of using publictransport/taxis
152 11.7%
5 Poor information aboutpublic transport
21 1.6%
6 Poor connections 144 11.1%7 Public transportunpleasant
35 2.7%
8 Don’t have currentdriving licence
80 6.2%
9 Cost of petrol 7 0.5%10 Lack of parkingfacilities
52 4.0%
11 Cost of parking 15 1.2%12 Personal disability 368 28.4%13 Concerns overpersonal safety
58 4.5%
14 Trafficcongestion/roadworks
159 12.3%
15 Environmentalconcerns
55 4.2%
Total 1295 100%NA 3DNA 35055
I339 Difficulties with travel with children toschoolMulticoded1 Too far/long journey 42 11.1%2 Journey not possibleby public transport
54 14.3%
3 Unreliable publictransport
53 14.0%
4 Cost of using publictransport/taxis
30 7.9%
5 Poor information aboutpublic transport
5 1.3%
6 Poor connections 29 7.7%7 Public transportunpleasant
3 0.8%
8 Don’t have currentdriving licence
9 2.4%
9 Cost of petrol 4 1.1%10 Lack of parkingfacilities
58 15.3%
11 Cost of parking 1 0.3%12 Personal disability 38 10.1%13 Concerns overpersonal safety
17 4.5%
14 Trafficcongestion/roadworks
132 34.9%
15 Environmentalconcerns
16 4.2%
Total 378 100%NA 0DNA 35975
I340 Difficulties with travel tocollege/universityMulticoded1 Too far/long journey 50 14.9%2 Journey not possibleby public transport
45 13.4%
3 Unreliable publictransport
118 35.2%
4 Cost of using publictransport/taxis
27 8.1%
5 Poor information aboutpublic transport
8 2.4%
6 Poor connections 55 16.4%7 Public transportunpleasant
18 5.4%
8 Don’t have currentdriving licence
14 4.2%
9 Cost of petrol 4 1.2%10 Lack of parkingfacilities
19 5.7%
11 Cost of parking 8 2.4%12 Personal disability 21 6.3%13 Concerns overpersonal safety
18 5.4%
14 Trafficcongestion/roadworks
79 23.6%
15 Environmentalconcerns
11 3.3%
Total 335 100%NA 0DNA 36018
I341 Difficulties with other travelMulticoded1 Too far/long journey 55 11.6%2 Journey not possibleby public transport
52 11.0%
3 Unreliable publictransport
86 18.1%
4 Cost of using publictransport/taxis
32 6.8%
5 Poor information aboutpublic transport
14 3.0%
6 Poor connections 48 10.1%7 Public transportunpleasant
21 4.4%
8 Don’t have currentdriving licence
16 3.4%

National Centre for Social Research
108
I341 Difficulties with other travel9 Cost of petrol 4 0.8%10 Lack of parkingfacilities
19 4.0%
11 Cost of parking 18 3.8%12 Personal disability 92 19.4%13 Concerns overpersonal safety
21 4.4%
14 Trafficcongestion/roadworks
146 30.8%
15 Environmentalconcerns
41 8.6%
Total 474 100%NA 1DNA 35878
Playing in the street
From 2002, the Young Person’s Travelrecord contains an additional sectionon Day 7, which records all periodsthat children spent playing in thestreet.
The database holds fifteen variableson playing in the street in total. Thesehold information for start time, endtime and total elapsed time, for each ofa maximum of five periods spentplaying in the street. The counts andpercentages given in this section applyto the first of these periods only.
I366/I372/I378/I384/I390 Playtime starttimeBased on numeric variablesI365/I371/I377/I383/I3891 0000-0059 0 0.0%2 0100-0159 0 0.0%3 0200-0259 0 0.0%4 0300-0359 0 0.0%5 0400-0459 0 0.0%6 0500-0559 1 0.1%7 0600-0659 0 0.0%8 0700-0759 7 0.7%9 0800-0859 21 2.2%10 0900-0959 39 4.1%11 1000-1059 96 10.0%12 1100-1159 69 7.2%13 1200-1259 51 5.3%14 1300-1359 42 4.4%15 1400-1459 59 6.1%16 1500-1559 172 17.9%17 1600-1659 227 23.6%18 1700-1759 87 9.1%
I366/I372/I378/I384/I390 Playtime starttime19 1800-1859 57 5.9%20 1900-1959 26 2.7%21 2000-2059 3 0.3%22 2100-2159 4 0.4%23 2200-2259 0 0.0%24 2300-2359 0 0.0%Total 961 100%No playtime data 4423Under 5 years old 2207Adult 28762
I368/I374/I380/I386/I392 Playtime endtimeBased on numeric variablesI367/I373/I379/I385/I3911 0000-0059 0 0.02 0100-0159 0 0.03 0200-0259 0 0.04 0300-0359 0 0.05 0400-0459 0 0.06 0500-0559 0 0.07 0600-0659 0 0.08 0700-0759 1 0.19 0800-0859 23 2.410 0900-0959 7 0.711 1000-1059 26 2.712 1100-1159 43 4.513 1200-1259 75 7.814 1300-1359 54 5.615 1400-1459 35 3.616 1500-1559 68 7.117 1600-1659 129 13.418 1700-1759 207 21.519 1800-1859 120 12.520 1900-1959 83 8.621 2000-2059 52 5.422 2100-2159 31 3.223 2200-2259 7 0.724 2300-2359 0 0.0Total 961 100No playtime data 4423Under 5 years old 2207Adult 28762
I370/I376/I382/I388/I394 Playtime elapsedtimeBased on numeric variablesI369/I375/I381/I387/I3931 Less than 15 minutes 55 5.7%2 15 minutes to under 30minutes
70 7.3%
3 30 minutes to under 45minutes
96 10.0%

National Centre for Social Research
109
4 45 minutes to under 60minutes
65 6.8%
5 60 minutes to under 90minutes
197 20.5%
6 90 minutes to under 2hours
98 10.2%
7 2 hours to under 3hours
217 22.6%
8 3 hours to under 4hours
94 9.8%
9 4 hours and over 69 7.2%Total 961 100%No playtime data 4423Under 5 years old 2207Adult 28762
5.7 Long distance trip variables
Long-distance trips are trips of 50miles or more. Due to the low numberof such trips that people make,respondents are also asked (in theindividual questionnaire) to tell usabout any such trips made in the threeweek period prior to the Travel Week.
This record is combined with all long-distance trips in the Travel Week toconstruct the variables in this section.
Further notes relevant to thesevariables can be found accompanyingthe corresponding trip-level variables,later in this chapter.
L3 Calendar month
1 January 2826 6.7%2 February 2820 6.7%3 March 3363 8.0%4 April 3623 8.6%5 May 3700 8.8%6 June 3545 8.4%7 July 3883 9.2%8 August 4675 11.1%9 September 3808 9.0%10 October 3734 8.8%11 November 2951 7.0%12 December 3290 7.8%Total 42218 100%
Missing values for L3 are patched byinspection, looking at the respondent’swhole trip record.
L5 Origin (county)
1 Avon 796 1.9%2 Bedfordshire 395 0.9%3 Berkshire 720 1.7%4 Buckinghamshire 581 1.4%5 Cambridgeshire 931 2.2%6 Cheshire 700 1.7%7 Cleveland 155 0.4%8 Cornwall 412 1.0%9 Cumbria 863 2.0%10 Derbyshire 625 1.5%11 Devon 1201 2.8%12 Dorset 635 1.5%13 Durham 221 0.5%14 East Sussex 611 1.4%15 Essex 1170 2.8%16 Gloucestershire 721 1.7%17 Greater Manchester 1213 2.9%18 Hampshire 1396 3.3%19 Hereford andWorcester
561 1.3%
20 Hertfordshire 453 1.1%21 Humberside 518 1.2%22 Isle of Wight 59 0.1%23 Kent 1429 3.4%24 Lancashire 874 2.1%25 Leicestershire 779 1.8%26 Lincolnshire 731 1.7%27 London Central 1137 2.7%28 Other Inner London 1028 2.4%31 Other London notCentral
2106 5.0%
32 Merseyside 613 1.5%33 Norfolk 810 1.9%34 Northamptonshire 466 1.1%35 Northumberland 330 0.8%36 North Yorkshire 875 2.1%37 Nottinghamshire 814 1.9%38 Oxfordshire 955 2.3%39 Shropshire 286 0.7%40 Somerset 733 1.7%41 South Yorkshire 650 1.5%42 Staffordshire 587 1.4%43 Suffolk 678 1.6%44 Surrey 744 1.8%45 Tyne and Wear 505 1.2%46 Warwickshire 493 1.2%47 West Midlands 1634 3.9%48 West Sussex 522 1.2%49 West Yorkshire 1179 2.8%50 Wiltshire 680 1.6%51 Clwyd 343 0.8%52 Dyfed 367 0.9%

National Centre for Social Research
110
L5 Origin (county)53 Gwent 258 0.6%54 Gwynedd 456 1.1%55 Mid Glamorgan 191 0.5%56 Powys 90 0.2%57 South Glamorgan 354 0.8%58 West Glamorgan 158 0.4%59 Borders 127 0.3%60 Central 188 0.4%61 Dumfries andGalloway
132 0.3%
62 Fife 228 0.5%63 Grampian 300 0.7%64 Highlands 320 0.8%65 Lothian 605 1.4%66 Strathclyde 1031 2.4%67 Tayside 286 0.7%68 Essex within M25 0 0.0%69 Hertfordshire withinM25
106 0.3%
70 Kent within M25 5 0.0%71 Surrey within M25 98 0.2%Total 42218 100%
Missing values are imputed using P15for all trips that begin at ‘home’. For allother cases, missing values arepatched by inspecting all other detailsof the long distance trip.
L14 Origin (UA)
1 Bath and North EastSomerset
181 0.4%
2 Bedfordshire 209 0.5%3 Blackburn with Darwen 109 0.3%4 Blackpool 270 0.6%5 Bournemouth 126 0.3%6 Bracknell Forest 49 0.1%7 Brighton and Hove 217 0.5%8 Bristol, City of 464 1.1%9 Buckinghamshire 414 1.0%10 Cambridgeshire 642 1.5%11 Cheshire 558 1.3%12 Cornwall and Isles ofScilly
410 1.0%
13 Cumbria 862 2.0%14 Darlington 55 0.1%15 Derby 183 0.4%16 Derbyshire 442 1.0%17 Devon 1024 2.4%18 Dorset 428 1.0%19 Durham 164 0.4%20 East Riding ofYorkshire
181 0.4%
L14 Origin (UA)21 East Sussex 388 0.9%22 Essex (area outsideM25)
998 2.4%
23 Essex (area withinM25)
0 0.0%
24 Gloucestershire 719 1.7%25 Greater Manchester 1213 2.9%26 Halton 45 0.1%27 Hampshire 827 2.0%28 Hartlepool 22 0.1%29 Herefordshire 264 0.6%30 Hertfordshire (areaoutside M25)
453 1.1%
31 Hertfordshire (areawithin M25)
106 0.3%
32 Inner London 1027 2.4%33 Isle of Wight 59 0.1%34 Kent (area outsideM25)
1384 3.3%
35 Kent (area withinM25)
5 0.0%
36 Kingston upon Hull,City of
148 0.4%
37 Lancashire 493 1.2%38 Leicester 279 0.7%39 Leicestershire 477 1.1%40 Lincolnshire 727 1.7%41 London Central 1136 2.7%42 London Outer 2098 5.0%43 Luton 186 0.4%44 Medway Towns 43 0.1%45 Merseyside 610 1.4%46 Middlesbrough 54 0.1%47 Milton Keynes 167 0.4%48 Newbury 69 0.2%49 Norfolk 810 1.9%50 North EastLincolnshire
92 0.2%
51 North Lincolnshire 97 0.2%52 North Somerset 131 0.3%53 North Yorkshire 618 1.5%54 Northamptonshire 466 1.1%55 Northumberland 331 0.8%56 Nottingham 487 1.2%57 Nottinghamshire 327 0.8%58 Oxfordshire 954 2.3%59 Peterborough 286 0.7%60 Plymouth 19 0.0%61 Poole 81 0.2%62 Portsmouth 318 0.8%63 Reading 175 0.4%64 Redcar & Cleveland 45 0.1%65 Rutland 21 0.0%66 Shropshire 171 0.4%67 Slough 91 0.2%

National Centre for Social Research
111
L14 Origin (UA)68 Somerset 733 1.7%69 SouthGloucestershire
19 0.0%
70 South Yorkshire 649 1.5%71 Southampton 247 0.6%72 Southend on Sea 104 0.2%73 Staffordshire 346 0.8%74 Stockton-on-Tees 34 0.1%75 Stoke-on-Trent 239 0.6%76 Suffolk 678 1.6%77 Surrey (area outsideM25)
743 1.8%
78 Surrey (area withinM25)
98 0.2%
79 Swindon 300 0.7%80 The Wrekin 116 0.3%81 Thurrock 67 0.2%82 Torbay 158 0.4%83 Tyne and Wear 505 1.2%84 Warrington 94 0.2%85 Warwickshire 493 1.2%86 West Midlands 1632 3.9%87 West Sussex 521 1.2%88 West Yorkshire 1176 2.8%89 Wiltshire 380 0.9%90 Windsor &Maidenhead
195 0.5%
91 Wokingham 140 0.3%92 Worcestershire 296 0.7%93 York 249 0.6%94 Aberdeen City 186 0.4%95 Aberdeenshire 63 0.1%96 Angus 56 0.1%97 Argyll and Bute 124 0.3%98 Clackmannshire 4 0.0%99 Dumfries & Galloway 132 0.3%100 Dundee, City of 78 0.2%101 East Ayrshire 96 0.2%102 East Dunbartonshire 0 0.0%103 East Lothian 44 0.1%104 East Renfrewshire 20 0.0%105 Edinburgh, City of 457 1.1%106 Falkirk 76 0.2%107 Fife 227 0.5%108 Glasgow, City of 421 1.0%109 Highland 313 0.7%110 Inverclyde 17 0.0%111 Midlothian 25 0.1%112 Moray 51 0.1%113 North Ayrshire 60 0.1%114 North Lanarkshire 56 0.1%115 Orkney Islands 5 0.0%116 Perth and Kinross 152 0.4%117 Renfrewshire 21 0.0%
L14 Origin (UA)118 Scottish Borders 126 0.3%119 Shetland Islands 0 0.0%120 South Ayrshire 54 0.1%121 South Lanarkshire 95 0.2%122 Stirling 108 0.3%123 WestDunbartonshire
65 0.2%
124 West Lothian 76 0.2%125 Western Isles 2 0.0%126 Blaenau Gwent 13 0.0%127 Bridgend 27 0.1%128 Caerphilly 75 0.2%129 Cardiff 332 0.8%130 Carmarthenshire 121 0.3%131 Ceredigion 124 0.3%132 Conwy 82 0.2%133 Denbighshire 165 0.4%134 Flintshire 68 0.2%135 Gwynedd 282 0.7%136 Isle of Anglesey 115 0.3%137 Merthyr Tydfil 70 0.2%138 Monmouthshire 130 0.3%139 Neath and PortTalbot
58 0.1%
140 Newport 65 0.2%141 Pembrokeshire 122 0.3%142 Powys 90 0.2%143 Rhondda, Cynon,Taff
52 0.1%
144 Swansea 100 0.2%145 Torfaen 18 0.0%146 Vale of Glamorgan 20 0.0%147 Wrexham 87 0.2%Total 42143 100%
L6 Destination (county)
1 Avon 807 1.9%2 Bedfordshire 394 0.9%3 Berkshire 727 1.7%4 Buckinghamshire 592 1.4%5 Cambridgeshire 915 2.2%6 Cheshire 674 1.6%7 Cleveland 150 0.4%8 Cornwall 433 1.0%9 Cumbria 910 2.2%10 Derbyshire 628 1.5%11 Devon 1128 2.7%12 Dorset 630 1.5%13 Durham 219 0.5%14 East Sussex 630 1.5%15 Essex 1177 2.8%16 Gloucestershire 675 1.6%17 Greater Manchester 1140 2.7%
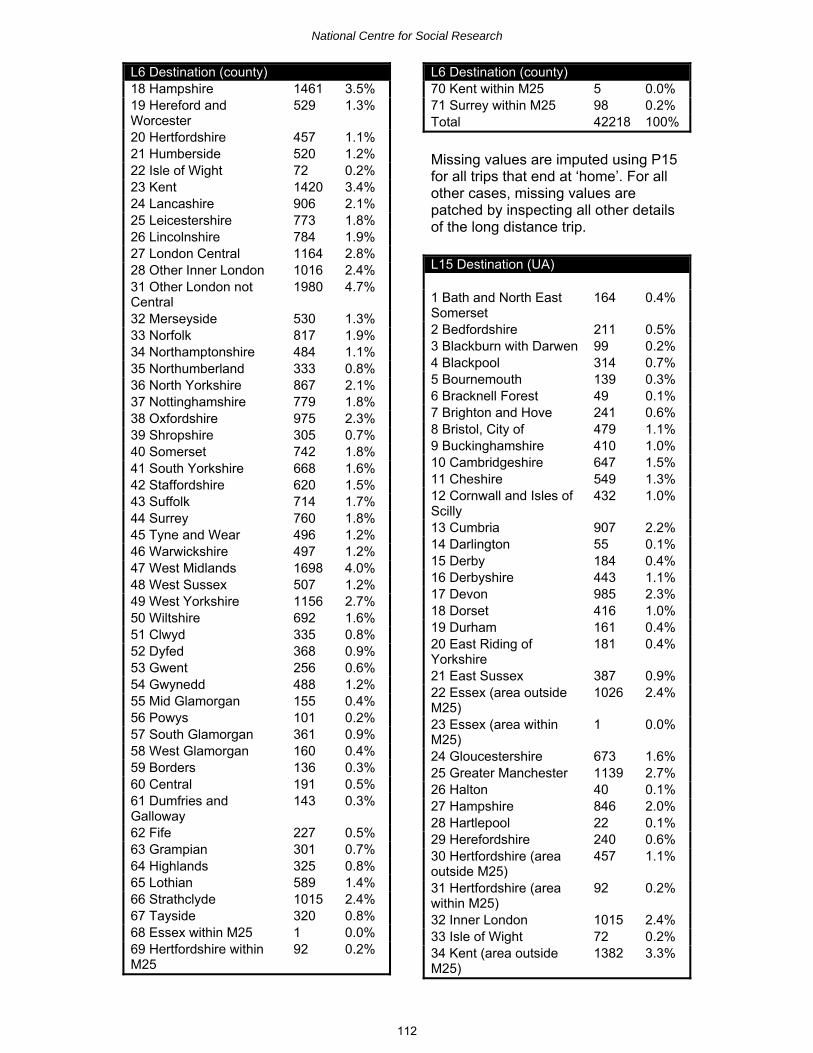
National Centre for Social Research
112
L6 Destination (county)18 Hampshire 1461 3.5%19 Hereford andWorcester
529 1.3%
20 Hertfordshire 457 1.1%21 Humberside 520 1.2%22 Isle of Wight 72 0.2%23 Kent 1420 3.4%24 Lancashire 906 2.1%25 Leicestershire 773 1.8%26 Lincolnshire 784 1.9%27 London Central 1164 2.8%28 Other Inner London 1016 2.4%31 Other London notCentral
1980 4.7%
32 Merseyside 530 1.3%33 Norfolk 817 1.9%34 Northamptonshire 484 1.1%35 Northumberland 333 0.8%36 North Yorkshire 867 2.1%37 Nottinghamshire 779 1.8%38 Oxfordshire 975 2.3%39 Shropshire 305 0.7%40 Somerset 742 1.8%41 South Yorkshire 668 1.6%42 Staffordshire 620 1.5%43 Suffolk 714 1.7%44 Surrey 760 1.8%45 Tyne and Wear 496 1.2%46 Warwickshire 497 1.2%47 West Midlands 1698 4.0%48 West Sussex 507 1.2%49 West Yorkshire 1156 2.7%50 Wiltshire 692 1.6%51 Clwyd 335 0.8%52 Dyfed 368 0.9%53 Gwent 256 0.6%54 Gwynedd 488 1.2%55 Mid Glamorgan 155 0.4%56 Powys 101 0.2%57 South Glamorgan 361 0.9%58 West Glamorgan 160 0.4%59 Borders 136 0.3%60 Central 191 0.5%61 Dumfries andGalloway
143 0.3%
62 Fife 227 0.5%63 Grampian 301 0.7%64 Highlands 325 0.8%65 Lothian 589 1.4%66 Strathclyde 1015 2.4%67 Tayside 320 0.8%68 Essex within M25 1 0.0%69 Hertfordshire withinM25
92 0.2%
L6 Destination (county)70 Kent within M25 5 0.0%71 Surrey within M25 98 0.2%Total 42218 100%
Missing values are imputed using P15for all trips that end at ‘home’. For allother cases, missing values arepatched by inspecting all other detailsof the long distance trip.
L15 Destination (UA)
1 Bath and North EastSomerset
164 0.4%
2 Bedfordshire 211 0.5%3 Blackburn with Darwen 99 0.2%4 Blackpool 314 0.7%5 Bournemouth 139 0.3%6 Bracknell Forest 49 0.1%7 Brighton and Hove 241 0.6%8 Bristol, City of 479 1.1%9 Buckinghamshire 410 1.0%10 Cambridgeshire 647 1.5%11 Cheshire 549 1.3%12 Cornwall and Isles ofScilly
432 1.0%
13 Cumbria 907 2.2%14 Darlington 55 0.1%15 Derby 184 0.4%16 Derbyshire 443 1.1%17 Devon 985 2.3%18 Dorset 416 1.0%19 Durham 161 0.4%20 East Riding ofYorkshire
181 0.4%
21 East Sussex 387 0.9%22 Essex (area outsideM25)
1026 2.4%
23 Essex (area withinM25)
1 0.0%
24 Gloucestershire 673 1.6%25 Greater Manchester 1139 2.7%26 Halton 40 0.1%27 Hampshire 846 2.0%28 Hartlepool 22 0.1%29 Herefordshire 240 0.6%30 Hertfordshire (areaoutside M25)
457 1.1%
31 Hertfordshire (areawithin M25)
92 0.2%
32 Inner London 1015 2.4%33 Isle of Wight 72 0.2%34 Kent (area outsideM25)
1382 3.3%

National Centre for Social Research
113
L15 Destination (UA)35 Kent (area withinM25)
5 0.0%
36 Kingston upon Hull,City of
159 0.4%
37 Lancashire 489 1.2%38 Leicester 275 0.7%39 Leicestershire 477 1.1%40 Lincolnshire 778 1.8%41 London Central 1161 2.8%42 London Outer 1969 4.7%43 Luton 183 0.4%44 Medway Towns 37 0.1%45 Merseyside 526 1.2%46 Middlesbrough 53 0.1%47 Milton Keynes 182 0.4%48 Newbury 84 0.2%49 Norfolk 815 1.9%50 North EastLincolnshire
88 0.2%
51 North Lincolnshire 92 0.2%52 North Somerset 141 0.3%53 North Yorkshire 594 1.4%54 Northamptonshire 484 1.1%55 Northumberland 333 0.8%56 Nottingham 473 1.1%57 Nottinghamshire 306 0.7%58 Oxfordshire 972 2.3%59 Peterborough 268 0.6%60 Plymouth 16 0.0%61 Poole 76 0.2%62 Portsmouth 342 0.8%63 Reading 188 0.4%64 Redcar & Cleveland 45 0.1%65 Rutland 20 0.0%66 Shropshire 187 0.4%67 Slough 97 0.2%68 Somerset 742 1.8%69 SouthGloucestershire
22 0.1%
70 South Yorkshire 667 1.6%71 Southampton 269 0.6%72 Southend on Sea 99 0.2%73 Staffordshire 355 0.8%74 Stockton-on-Tees 30 0.1%75 Stoke-on-Trent 264 0.6%76 Suffolk 714 1.7%77 Surrey (area outsideM25)
758 1.8%
78 Surrey (area withinM25)
98 0.2%
79 Swindon 290 0.7%80 The Wrekin 118 0.3%81 Thurrock 51 0.1%82 Torbay 127 0.3%83 Tyne and Wear 496 1.2%
L15 Destination (UA)84 Warrington 84 0.2%85 Warwickshire 497 1.2%86 West Midlands 1696 4.0%87 West Sussex 507 1.2%88 West Yorkshire 1152 2.7%89 Wiltshire 402 1.0%90 Windsor &Maidenhead
179 0.4%
91 Wokingham 129 0.3%92 Worcestershire 288 0.7%93 York 271 0.6%94 Aberdeen City 200 0.5%95 Aberdeenshire 53 0.1%96 Angus 52 0.1%97 Argyll and Bute 121 0.3%98 Clackmannshire 6 0.0%99 Dumfries & Galloway 143 0.3%100 Dundee, City of 104 0.2%101 East Ayrshire 79 0.2%102 East Dunbartonshire 0 0.0%103 East Lothian 37 0.1%104 East Renfrewshire 20 0.0%105 Edinburgh, City of 448 1.1%106 Falkirk 71 0.2%107 Fife 227 0.5%108 Glasgow, City of 422 1.0%109 Highland 320 0.8%110 Inverclyde 13 0.0%111 Midlothian 20 0.0%112 Moray 48 0.1%113 North Ayrshire 67 0.2%114 North Lanarkshire 46 0.1%115 Orkney Islands 3 0.0%116 Perth and Kinross 164 0.4%117 Renfrewshire 20 0.0%118 Scottish Borders 136 0.3%119 Shetland Islands 0 0.0%120 South Ayrshire 61 0.1%121 South Lanarkshire 94 0.2%122 Stirling 114 0.3%123 WestDunbartonshire
70 0.2%
124 West Lothian 80 0.2%125 Western Isles 2 0.0%126 Blaenau Gwent 13 0.0%127 Bridgend 19 0.0%128 Caerphilly 73 0.2%129 Cardiff 339 0.8%130 Carmarthenshire 128 0.3%131 Ceredigion 118 0.3%132 Conwy 108 0.3%133 Denbighshire 160 0.4%134 Flintshire 67 0.2%135 Gwynedd 300 0.7%

National Centre for Social Research
114
L15 Destination (UA)136 Isle of Anglesey 111 0.3%137 Merthyr Tydfil 52 0.1%138 Monmouthshire 126 0.3%139 Neath and PortTalbot
66 0.2%
140 Newport 69 0.2%141 Pembrokeshire 122 0.3%142 Powys 100 0.2%143 Rhondda, Cynon,Taff
44 0.1%
144 Swansea 94 0.2%145 Torfaen 15 0.0%146 Vale of Glamorgan 19 0.0%147 Wrexham 77 0.2%Total 42139 100%
Missing values are imputed using P18for all trips that end at ‘home’. For allother cases, missing values arepatched by inspecting all other detailsof the long distance trip.
L17 Urban/rural coding of destination
1 Inner London 2176 5.2%2 Outer London built-uparea
2651 6.3%
3 West Midlands built-uparea
1301 3.1%
4 Greater Manchesterbuilt-up area
1145 2.7%
5 West Yorkshire built-up area
902 2.1%
6 Glasgow built-up area 422 1.0%7 Liverpool built-up area 347 0.8%8 Tyneside built-up area 457 1.1%9 Other urban over 250K 6017 14.3%10 Other urban over100K to 250K
5373 12.8%
11 Other urban over 50Kto 100K
4449 10.6%
12 Other urban over 25Kto 50K
3898 9.3%
13 Other urban over 10Kto 25K
5318 12.6%
14 Other urban over 3Kto 10K
4027 9.6%
15 Rural 3609 8.6%Total 42092 100%NA 126
Missing values are imputed using P18for all trips that begin at ‘home’. For allother cases, missing values are
patched by inspecting all other detailsof the long distance trip.
L16 Urban/rural coding of origin
1 Inner London 2162 5.1%2 Outer London built-uparea
2788 6.6%
3 West Midlands built-uparea
1254 3.0%
4 Greater Manchesterbuilt-up area
1199 2.8%
5 West Yorkshire built-up area
921 2.2%
6 Glasgow built-up area 421 1.0%7 Liverpool built-up area 402 1.0%8 Tyneside built-up area 461 1.1%9 Other urban over 250K 5885 14.0%10 Other urban over100K to 250K
5261 12.5%
11 Other urban over 50Kto 100K
4440 10.5%
12 Other urban over 25Kto 50K
3950 9.41%
13 Other urban over 10Kto 25K
5407 12.8%
14 Other urban over 3Kto 10K
4014 9.5%
15 Rural 3529 8.4%Total 42094 100%NA 124
L13 Purpose from
1 Commuting 3312 7.8%2 In course of work 3413 8.1%3 Education 254 0.6%4 Food shopping 57 0.1%5 Non-food shopping 618 1.5%6 Personal businessmedical
86 0.2%
7 Personal businesseat/drink
6 0.0%
8 Personal businessother
1007 2.4%
9 Eat/drink with friends 155 0.4%10 Visit friends at privatehome
5148 12.2%
11 Other social 767 1.8%
12 Entertain/publicactivity
1041 2.5%
13 Sport: participate 274 0.6%14 Holiday: base 3481 8.2%15 Day trip 1564 3.7%16 Just walk 7 0.0%

National Centre for Social Research
115
L13 Purpose from17 Other non-escort 156 0.4%18 Escort commuting 43 0.1%19 Escort business andother work
29 0.1%
20 Escort education 141 0.3%21 Escort shopping/personal business
225 0.5%
22 Other escort 516 1.2%23 Home 19918 47.2%Total 42218 100%
Missing values for L13 are patched byinspecting all other details of the longdistance trip record.
L7 Purpose to
1 Work 3235 7.7%2 In course of work 3790 9.0%3 Education 244 0.6%4 Food shopping 77 0.2%5 Non food shopping 651 1.5%6 Personal businessmedical
100 0.2%
7 Personal businesseat/drink
2 0.0%
8 Personal businessother
1234 2.9%
9 Eat/drink with friends 131 0.3%10 Visit friends 5638 13.4%11 Other social 1171 2.8%12 Entertain/publicactivity
1123 2.7%
13 Sport: participate 300 0.7%14 Holiday: base 3562 8.4%15 Day trip/just walk 1719 4.1%16 Other non-escort 2 0.0%17 Escort home 214 0.5%18 Escort work 40 0.1%19 Escort in course ofwork
34 0.1%
20 Escort education 147 0.3%21 Escortshopping/personalbusiness
276 0.7%
22 Other escort 515 1.2%23 Home 18013 42.7%Total 42218 100%
L12 Purpose
1 Commuting 5494 13.0%2 Business 6524 15.5%3 Other work 82 0.2%4 Education 375 0.9%5 Food shopping 115 0.3%6 Non-food shopping 1170 2.8%7 Personal businessmedical
174 0.4%
8 Personal businesseat/drink
6 0.0%
9 Personal businessother
2077 4.9%
10 Visit friends at privatehome
9980 23.6%
11 Eat/drink with friends 250 0.6%12 Other social 1858 4.4%13 Entertain/publicactivity
2062 4.9%
14 Sport: participate 543 1.3%15 Holiday: base 6474 15.3%16 Day trip 3020 7.2%17 Just walk 3 0.0%18 Other non-escort 6 0.0%19 Escort commuting 45 0.1%20 Escort business andother work
68 0.2%
21 Escort education 254 0.6%22 Escort shopping/personal business
455 1.1%
23 Escort home (notown) and other escort
1183 2.8%
Total 42218 100%
Missing values for L12 are patchedfrom L7 and L13.
L8 Mode of transport
1 Walk, less than 1 mile 0 0.0%2 Walk, 1 mile or more 1 0.0%3 Bicycle 16 0.0%4 Private (hire) bus 770 1.8%5 Private car: driver 19123 45.3%6 Private car: passenger 13969 33.1%7 Motorcycle/scooter/moped: driver
169 0.4%
8 Motorcycle/scooter/moped: passenger
19 0.0%
9 Van/lorry: driver 1236 2.9%10 Van/lorry: passenger 557 1.3%11 Other privatetransport
199 0.5%
12 London stage bus 0 0.0%

National Centre for Social Research
116
13 Other stage bus 21 0.0%14 Coach/express bus 856 2.0%15 Excursion/tour bus 541 1.3%16 LT Underground 3 0.0%17 Surface Rail 4142 9.8%18 Light rail 5 0.0%19 Air 396 0.9%20 Taxi 94 0.2%21 Minicab 31 0.1%22 Other public transport 70 0.2%Total 42218 100%
This refers to the mode used for thelongest stage of the trip. If two or moresuch stages are equal in length, thelatest stage is taken as the mainstage.
Missing values are patched byinspecting all other details of the longdistance trip record.
L10 DistanceBased on numeric variable L91 50 to under 75 miles 16743 39.7%2 75 to under 100 miles 7531 17.8%3 100 to under 150 miles 8788 20.8%4 150 to under 250 miles 6584 15.6%5 250 to under 350 miles 1791 4.2%6 350 miles and over 781 1.8%Total 42218 100%
5.8 Trip level variables
A trip is a one-way course of travelhaving a single main purpose.
There are 593,761 trips in the 2002/03database, 278,916 in 2002 and314,845 in 2003.
Day
J52 Day (of week)
1 Monday 84339 14.2%2 Tuesday 88264 14.9%3 Wednesday 88735 14.9%4 Thursday 89871 14.9%5 Friday 92171 15.1%6 Saturday 84874 15.5%7 Sunday 65507 14.3%
Total 593761 100%
Trip type
J14 Series of calls
1 Yes 340 0.1%2 No 593421 99.9%Total 593761 100%
When a respondent makes a series ofshort stops on a journey (for example,when a respondent makes a longshopping trip and calls at numerousshops), the respondent or interviewermay find it difficult to subdivide thejourney into shorter trips. In this case,the trips can be combined into a singletrip, which is known as a ‘series ofcalls’ trip.
Series of calls are only used for tripsfor shopping, or for trips in course ofwork (such as a doctor’s round).
If the trips consist of more than onestage, or if they vary in any significantdetail (such as some trips being madeas car driver, and others as carpassenger), they are coded asindividual trips.
For strict compatibility with previoussurveys, series of calls are excludedfrom trip or stage counts (but not fromanalyses of distance travelled).
J23 Number of stages
1 One 576613 97.1%2 Two 12533 2.1%3 Three 4012 0.7%4 Four 483 0.1%5 Five 96 0.0%6 Six 18 0.0%7 Seven or more 6 0.0%Total 593761 100%
On days 1 to 6, the number of stagesexcludes short walks (since these areonly recorded on day 7).
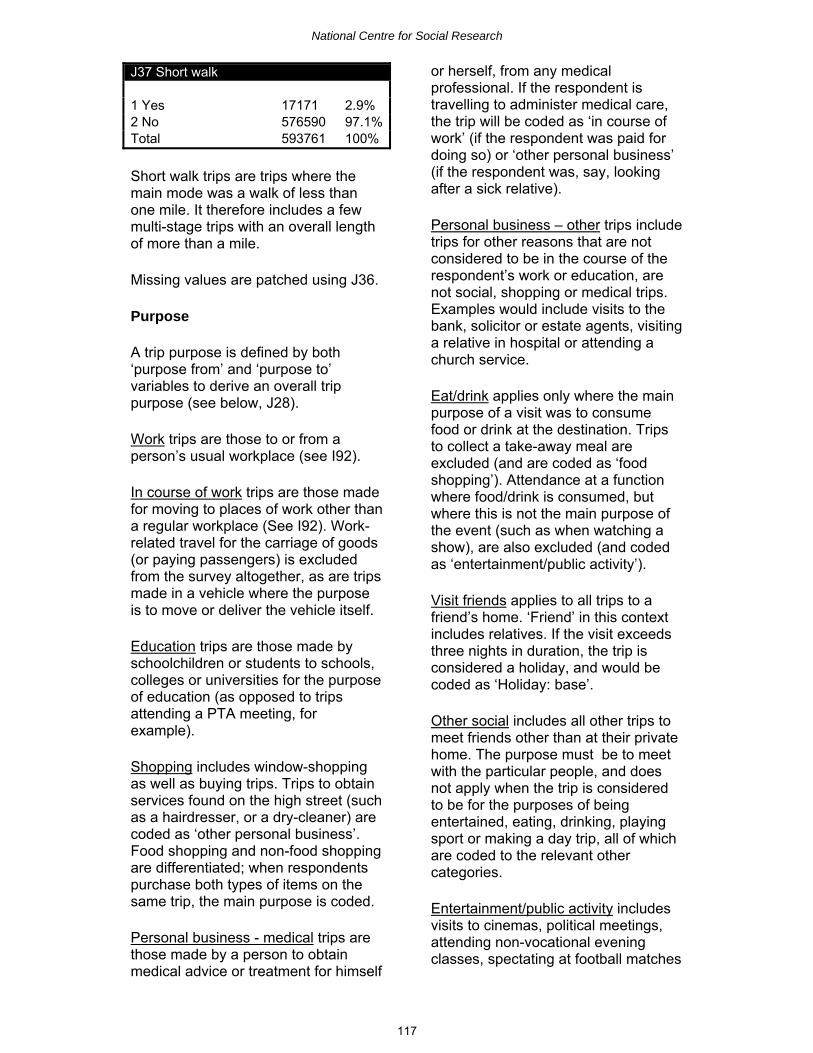
National Centre for Social Research
117
J37 Short walk
1 Yes 17171 2.9%2 No 576590 97.1%Total 593761 100%
Short walk trips are trips where themain mode was a walk of less thanone mile. It therefore includes a fewmulti-stage trips with an overall lengthof more than a mile.
Missing values are patched using J36.
Purpose
A trip purpose is defined by both‘purpose from’ and ‘purpose to’variables to derive an overall trippurpose (see below, J28).
Work trips are those to or from aperson’s usual workplace (see I92).
In course of work trips are those madefor moving to places of work other thana regular workplace (See I92). Work-related travel for the carriage of goods(or paying passengers) is excludedfrom the survey altogether, as are tripsmade in a vehicle where the purposeis to move or deliver the vehicle itself.
Education trips are those made byschoolchildren or students to schools,colleges or universities for the purposeof education (as opposed to tripsattending a PTA meeting, forexample).
Shopping includes window-shoppingas well as buying trips. Trips to obtainservices found on the high street (suchas a hairdresser, or a dry-cleaner) arecoded as ‘other personal business’.Food shopping and non-food shoppingare differentiated; when respondentspurchase both types of items on thesame trip, the main purpose is coded.
Personal business - medical trips arethose made by a person to obtainmedical advice or treatment for himself
or herself, from any medicalprofessional. If the respondent istravelling to administer medical care,the trip will be coded as ‘in course ofwork’ (if the respondent was paid fordoing so) or ‘other personal business’(if the respondent was, say, lookingafter a sick relative).
Personal business – other trips includetrips for other reasons that are notconsidered to be in the course of therespondent’s work or education, arenot social, shopping or medical trips.Examples would include visits to thebank, solicitor or estate agents, visitinga relative in hospital or attending achurch service.
Eat/drink applies only where the mainpurpose of a visit was to consumefood or drink at the destination. Tripsto collect a take-away meal areexcluded (and are coded as ‘foodshopping’). Attendance at a functionwhere food/drink is consumed, butwhere this is not the main purpose ofthe event (such as when watching ashow), are also excluded (and codedas ‘entertainment/public activity’).
Visit friends applies to all trips to afriend’s home. ‘Friend’ in this contextincludes relatives. If the visit exceedsthree nights in duration, the trip isconsidered a holiday, and would becoded as ‘Holiday: base’.
Other social includes all other trips tomeet friends other than at their privatehome. The purpose must be to meetwith the particular people, and doesnot apply when the trip is consideredto be for the purposes of beingentertained, eating, drinking, playingsport or making a day trip, all of whichare coded to the relevant othercategories.
Entertainment/public activity includesvisits to cinemas, political meetings,attending non-vocational eveningclasses, spectating at football matches

National Centre for Social Research
118
or playing indoor games such assnooker.
Sport: participate covers all outdoorsports, along with vigorous indoorsports such as badminton, swimmingor karate. However, trips to play indoorgames such as darts or table tennisare coded as entertainment. All trips towatch sport are also treated asentertainment.
Holiday: base trips are those made totravel to a hotel, caravan, campsiteetc, where the respondent is to stay forone night or more. The trip must be forrecreational or leisure purposes. Visitsmade to stay with friends or relativesfor longer than three nights are alsoincluded.
Day trip/just walk trips are those madefor pleasure within a single day forwhich other categories are notappropriate. Examples include jogging,taking a sightseeing trip, or simply‘going for a walk’.
Other non-escort covers the remainingtrips not elsewhere specified. Whilefew trips fall into this category, drivinglessons are one notable exception.
Sometimes, the purpose of the trip issimply to escort someone else (aparent on the school run, for example)or to accompany them (say, a smallchild with a parent on a trip to theshops). These trips are coded to therelevant ‘escort’ category, based uponthe purpose of the trip being made bythe person being accompanied.For example, when a mother takes achild to school, the trip purpose for thechild is ‘education’, while for themother the purpose is ‘escorteducation’.
‘Escort home’ includes escorting anon-household member to their ownhome.
Where the purpose of a trip could beconsidered ambiguous, therespondent and the interviewer (or thecoding team) adjudge which is themain purpose of a trip.
Home in the context of J24 and J26refers only to the respondent’s ownhome – not someone else’s home.
J24 Purpose from
1 Work 60081 10.1%2 In course of work 13389 2.3%3 Education 18226 3.1%4 Food shopping 28373 4.8%5 Non-food shopping 35717 6.0%6 Personal businessmedical
6010 1.0%
7 Personal businesseat/drink
249 0.0%
8 Personal businessother
24815 4.2%
9 Eat/drink with friends 9741 1.6%10 Visit friends 42335 7.1%11 Other social 4888 0.8%12 Entertain/publicactivity
16042 2.7%
13 Sport: participate 6939 1.2%14 Holiday: base 5235 0.9%15 Day trip/ just walk 18174 3.1%16 Other non-escort 118 0.0%17 Escort home 4604 0.8%18 Escort work 6385 1.1%19 Escort in course ofwork
247 0.0%
20 Escort education 14342 2.4%21 Escort shopping/personal business
13440 2.3%
22 Other escort 12473 2.1%23 Home 251938 42.4%Total 593761 100%
J26 Purpose to
1 Work 60480 10.2%2 In course of work 13204 2.2%3 Education 18682 3.1%4 Food shopping 28288 4.8%5 Non-food shopping 35670 6.0%6 Personal businessmedical
6047 1.0%
7 Personal businesseat/drink
242 0.0%

National Centre for Social Research
119
8 Personal businessother
24907 4.2%
9 Eat/drink with friends 9826 1.7%10 Visit friends 42518 7.2%11 Other social 4990 0.8%12 Entertain/publicactivity
16134 2.7%
13 Sport: participate 6978 1.2%14 Holiday: base 5655 1.0%15 Day trip/ just walk 18180 3.1%16 Other non-escort 116 0.0%17 Escort home 4605 0.8%18 Escort work 6374 1.1%19 Escort in course ofwork
252 0.0%
20 Escort education 14140 2.4%21 Escort shopping/personal business
13513 2.3%
22 Other escort 12364 2.1%23 Home 250596 42.2%Total 593761 100%
Missing values in J24 and J26 arepatched using J26 and J24 of theprevious and next trips or, if notavailable, by inspecting the rest of thetrip record.
J28 Purpose
1 Commuting 99528 16.8%2 Business 21921 3.7%3 Other work 6626 1.1%4 Education 33820 5.7%5 Food shopping 52221 8.8%6 Non-food shopping 61813 10.4%7 Personal businessmedical
10451 1.8%
8 Personal businesseat/drink
333 0.1%
9 Personal businessother
43091 7.3%
10 Visit friends atprivate home
72488 12.2%
11 Eat/drink withfriends
16795 2.8%
12 Other social 8971 1.5%13 Entertain/publicactivity
29414 5.0%
14 Sport: participate 12683 2.1%15 Holiday: base 6868 1.2%16 Day trip 16798 2.8%17 Just walk 14358 2.4%18 Other non-escort 216 0.0%19 Escort commuting 9947 1.7%
J28 Purpose20 Escort business &other work
1587 0.3%
21 Escort education 23816 4.0%22 Escort shopping/personal business
22812 3.8%
23 Escort home (notown) and other escort
27204 4.6%
Total 593761 100%
The overall purpose of a trip isgenerally derived from the ‘purposeto’, unless the purpose was to returnhome, (in which case the overallpurpose is defined by the ‘purposefrom’) or to go to work, for whichspecial categories apply:
• Commuting includes trips fromhome to the respondent’s usualplace of work and vice versa.
• Other work includes all othertrips to ‘work’, and trips from‘work’ to ‘escort home’.
• Business includes all trips to ‘incourse of work’ and trips from‘in course of work’ back to‘home’, ‘work’ or ‘escort home’.
• Escort commuting and escortbusiness and other work tripsare the equivalent of the threecategories above, but occurwhen the respondent istravelling only to accompanysomeone else on a trip for sucha purpose (for example, arespondent driving their spouseto work).
Where a respondent records a trip toeat or drink, it is coded as either‘personal business eat/drink’ (wherethe purpose is for personalsustenance) or ‘eat/drink with friends’(where the primary purpose was tosocialise).

National Centre for Social Research
120
Mode
J36 Main mode of transport
1 Walk, less than 1mile
17171 2.9%
2 Walk, 1 mile or more 50255 8.5%3 Bicycle 10199 1.7%4 Private (hire) bus 4574 0.8%5 Private: car driver 274451 46.2%6 Private: carpassenger
155606 26.2%
7 Motorcycle/scooter/moped: driver
2202 0.4%
8 Motorcycle/scooter/moped: passenger
110 0.0%
9 Van/lorry: driver 11274 1.9%10 Van/lorry:passenger
3302 0.6%
11 Other privatetransport
1240 0.2%
12 London stage bus 8441 1.4%13 Other stage bus 32517 5.5%14 Express bus 286 0.0%15 Excursion/tour bus 294 0.0%16 LT underground 4431 0.7%17 Surface rail 8143 1.4%18 Light rail 1142 0.2%19 Air 118 0.0%20 Taxi 5299 0.9%21 Minicab 2517 0.4%22 Other publictransport
189 0.0%
Total 593761 100%
J36 is derived from S24 and stagelength data.
For a single-stage trip, the main modeof transport and the stage mode areequivalent (with walk trips divided intolong and short walks).
For a multi-stage trip, the mode usedfor the longest stage is coded into J36.If two or more stages are equivalent inlength, the latest stage is taken to bethe main stage.
See S2 for a fuller description of eachmode.
Missing values are patched from S24and S25.
Trip time and distance
J30 Overall travelling timeBased upon numeric variable J291 Less than 3 minutes 7064 1.2%2 3 to under 8 minutes 101761 17.1%3 8 to under 15minutes
128799 21.7%
3 15 to under 30minutes
206478 34.8%
4 30 to under 45minutes
85380 14.4%
5 45 minutes to under1 hour
26810 4.5%
6 1 to under 1.5 hours 21585 3.6%7 1.5 to under 2 hours 7278 1.2%8 2 to under 2.5 hours 3465 0.6%9 2.5 to under 3 hours 1741 0.3%10 3 to under 4 hours 1814 0.3%11 4 to under 5 hours 8722 0.1%12 5 to under 6 hours 346 0.1%13 6 hours and over 418 0.1%Total 593761 100%
J30 is the accumulated time in minutesover all stages of the trip. On days 1 to6, the time taken for short walk stageswere not recorded. Time spent waiting(for a train, for example) is notincluded.
J31 Start timeBased upon numeric variable J541 0000-0059 1502 0.3%2 0100-0159 746 0.1%3 0200-0259 591 0.1%4 0300-0359 449 0.1%5 0400-0459 845 0.1%6 0500-0559 3142 0.5%7 0600-0629 3036 0.5%8 0630-0659 5406 0.9%9 0700-0714 5384 0.9%10 0715-0729 4636 0.8%11 0730-0744 8444 1.4%12 0745-0759 7852 1.3%13 0800-0814 13269 2.3%14 0815-0829 11424 1.9%15 0830-0844 17272 2.9%16 0845-0859 11453 1.9%17 0900-0914 12293 2.1%18 0915-0929 6691 1.1%19 0930-0959 16879 2.9%20 1000-1029 21488 3.6%21 1030-1059 18252 3.1%

National Centre for Social Research
121
J31 Start time22 1100-1129 22148 3.8%23 1130-1159 20160 3.4%24 1200-1229 21586 3.7%25 1230-1259 18706 3.2%26 1300-1329 21355 3.6%27 1330-1359 17455 3.0%28 1400-1429 21117 3.6%29 1430-1459 18876 3.2%30 1500-1529 31331 5.3%31 1530-1559 26718 4.5%32 1600-1629 25054 4.3%33 1630-1644 14068 2.4%34 1645-1659 7746 1.3%35 1700-1714 19156 3.2%36 1715-1729 7961 1.4%37 1730-1744 13120 2.2%38 1745-1759 6923 1.2%39 1800-1814 14054 2.4%40 1815-1829 6065 1.0%41 1830-1859 14384 2.4%42 1900-1929 15057 2.6%43 1930-1959 10851 1.8%44 2000-2029 10184 1.7%45 2030-2059 6758 1.1%46 2100-2129 7140 1.2%47 2130-2159 5211 0.9%48 2200-2229 5434 0.9%49 2230-2259 3621 0.6%50 2300-2329 3649 0.6%51 2330-2359 2485 0.4%Total 589426 100%NA 4335
J31 records the start time of a trip.Band widths vary according to the timeof day.
Nighttime trips (0000-0559) are inhourly bands.
Off-peak-time trips (0600-0659, 0930-1629, 1830-2359) are in half-hourlybands. Peak-time trips (0700-0929,1630-1829) are in quarter-hourlybands.
Missing values are patched byinspecting known information from therest of the respondent’s travel record.
J33 Overall trip timeBased upon numeric variable J321 Less than 3 minutes 6352 1.1%2 3 to under 8 minutes 97254 16.4%3 8 to under 15minutes
124503 21.0%
4 15 to under 30minutes
205234 34.6%
5 30 to under 45minutes
89095 15.0%
6 45 minutes to under1 hour
28603 4.8%
7 1 to under 1.5 hours 24775 4.2%8 1.5 to under 2 hours 8381 1.4%9 2 to under 2.5 hours 3673 0.6%10 2.5 to under 3hours
1951 0.3%
11 3 to under 4 hours 2001 0.3%12 4 to under 5 hours 918 0.2%13 5 to under 6 hours 452 0.1%14 6 hours and over 569 0.1%Total 593761 100%
J33 records the time in minutesbetween the start time and end time. Itincludes waiting time as well asineligible travel (short walks on days 1-6, walking off the public highway, etc.)
J34 Trip lengthBased on numeric variable Jdungross1 Under 1 mile 54555 9.2%2 1 to under 2 miles 130804 22.0%3 2 to under 3 miles 84928 14.3%4 3 to under 5 miles 103271 17.4%5 5 to under 10 miles 107099 18.0%6 10 to under 15 miles 43808 7.4%7 15 to under 25 miles 33789 5.7%8 25 to under 35 miles 12843 2.2%9 35 to under 50 miles 8526 1.4%10 50 to under 100miles
9035 1.5%
11 100 to under 200miles
3878 0.7%
12 200 miles and over 1225 0.2%Total 593761 100%
J34 is derived from S25. This is theaccumulated distance over all stagesin the trip. Trip distance may beunderstated on days 1 to 6, as shortwalk stages were not recorded.

National Centre for Social Research
122
J40 Overall speed
1 Under 5 mph 81531 14.1%2 5 to under 7.5 mph 52900 9.2%3 7.5 to under 10 mph 47209 8.2%4 10 to under 12.5mph
86615 15.0%
5 12.5 to under 15mph
21956 3.8%
6 15 to under 17.5mph
46241 8.0%
7 17.5 to under 20mph
42579 7.4%
8 20 to under 25 mph 79322 13.8%9 25 to under 30 mph 31047 5.4%10 30 to under 35 mph 35898 6.2%11 35 to under 40 mph 19347 3.4%12 40 to under 45 mph 13159 2.3%13 45 to under 50 mph 7802 1.4%14 50 mph or higher 10984 1.9%Total 576590 100%DNA 17171
Derived from J32, S25-S26 and S28.
J41 Mean travel speed
1 Under 5 mph 74285 12.9%2 5 to under 7.5 mph 49925 8.7%3 7.5 to under 10 mph 45742 7.9%4 10 to under 12.5mph
88297 15.3%
5 12.5 to under 15mph
21639 3.8%
6 15 to under 17.5mph
47438 8.2%
7 17.5 to under 20mph
43888 7.6%
8 20 to under 25 mph 81363 14.1%9 25 to under 30 mph 31695 5.5%10 30 to under 35 mph 37647 6.5%11 35 to under 40 mph 20276 3.5%12 40 to under 45 mph 13901 2.4%13 45 to under 50 mph 8305 1.4%14 50 mph or higher 12189 2.1%Total 576590 100%DNA 17171
J41 is derived from S25, S28 and S37.
J40 and J41 are recorded for all tripsother than short walks.
J40 represents the overall meanspeed of the trip. It is calculated as the
sum of the lengths of all stages notknown to be short walks, divided bythe overall trip time (from J33) andexpressed in miles per hour.
J41 represents the overall meanspeed of the portions of the trip spentactually travelling. It is calculated asthe lengths of all stages not known tobe short walks, divided by the overalltravelling time (from the sum of theindividual stage times) and expressedin miles per hour.
Missing values are patched from J37
J56 Mid-point timeBased on numeric variable J551 0000-0059 1814 0.3%2 0100-0159 767 0.1%3 0200-0259 591 0.1%4 0300-0359 440 0.1%5 0400-0459 738 0.1%6 0500-0559 2718 0.5%7 0600-0629 2163 0.4%8 0630-0659 4468 0.8%9 0700-0714 3523 0.6%10 0715-0729 4572 0.8%11 0730-0744 5988 1.0%12 0745-0759 8373 1.4%13 0800-0814 10163 1.7%14 0815-0829 13159 2.2%15 0830-0844 17000 2.9%16 0845-0859 14858 2.5%17 0900-0914 10461 1.8%18 0915-0929 8543 1.4%19 0930-0959 17067 2.9%20 1000-1029 20531 3.5%21 1030-1059 18878 3.2%22 1100-1129 21551 3.7%23 1130-1159 20398 3.5%24 1200-1229 21619 3.7%25 1230-1259 19582 3.3%26 1300-1329 20786 3.5%27 1330-1359 18253 3.1%28 1400-1429 20072 3.4%29 1430-1459 19224 3.3%30 1500-1529 28484 4.8%31 1530-1559 28660 4.9%32 1600-1629 24370 4.1%33 1630-1644 11696 2.0%34 1645-1659 10599 1.8%35 1700-1714 13745 2.3%36 1715-1729 12253 2.1%
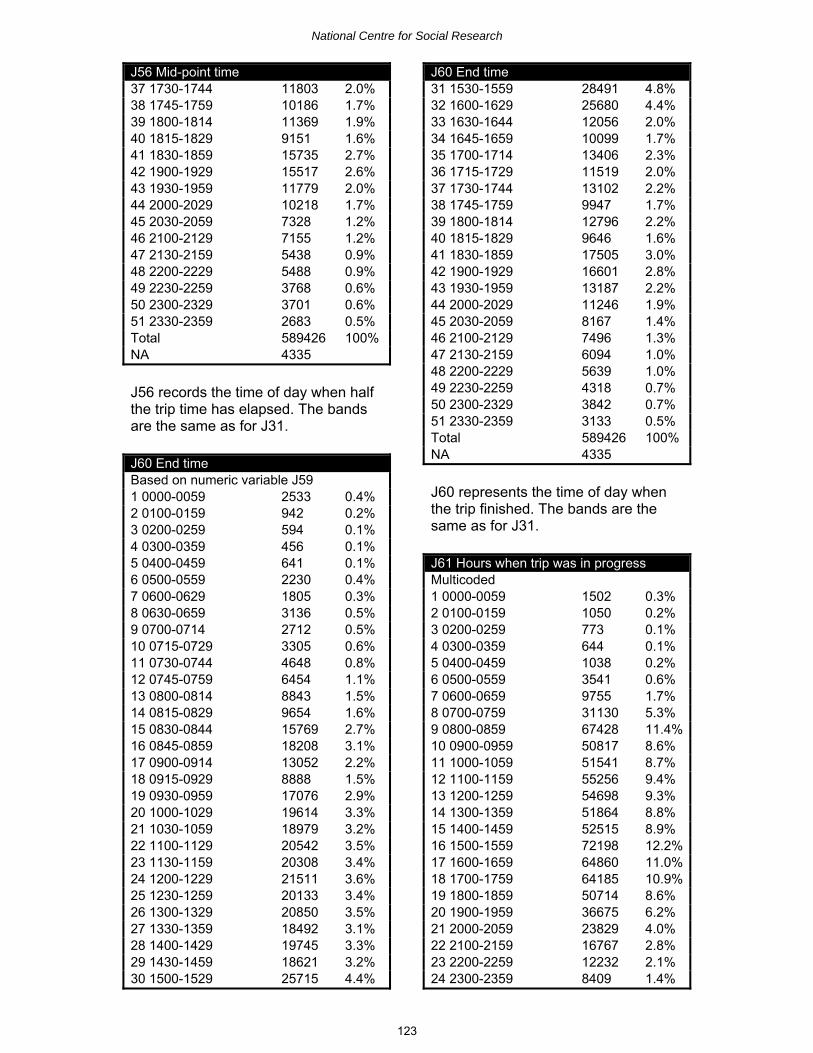
National Centre for Social Research
123
J56 Mid-point time37 1730-1744 11803 2.0%38 1745-1759 10186 1.7%39 1800-1814 11369 1.9%40 1815-1829 9151 1.6%41 1830-1859 15735 2.7%42 1900-1929 15517 2.6%43 1930-1959 11779 2.0%44 2000-2029 10218 1.7%45 2030-2059 7328 1.2%46 2100-2129 7155 1.2%47 2130-2159 5438 0.9%48 2200-2229 5488 0.9%49 2230-2259 3768 0.6%50 2300-2329 3701 0.6%51 2330-2359 2683 0.5%Total 589426 100%NA 4335
J56 records the time of day when halfthe trip time has elapsed. The bandsare the same as for J31.
J60 End timeBased on numeric variable J591 0000-0059 2533 0.4%2 0100-0159 942 0.2%3 0200-0259 594 0.1%4 0300-0359 456 0.1%5 0400-0459 641 0.1%6 0500-0559 2230 0.4%7 0600-0629 1805 0.3%8 0630-0659 3136 0.5%9 0700-0714 2712 0.5%10 0715-0729 3305 0.6%11 0730-0744 4648 0.8%12 0745-0759 6454 1.1%13 0800-0814 8843 1.5%14 0815-0829 9654 1.6%15 0830-0844 15769 2.7%16 0845-0859 18208 3.1%17 0900-0914 13052 2.2%18 0915-0929 8888 1.5%19 0930-0959 17076 2.9%20 1000-1029 19614 3.3%21 1030-1059 18979 3.2%22 1100-1129 20542 3.5%23 1130-1159 20308 3.4%24 1200-1229 21511 3.6%25 1230-1259 20133 3.4%26 1300-1329 20850 3.5%27 1330-1359 18492 3.1%28 1400-1429 19745 3.3%29 1430-1459 18621 3.2%30 1500-1529 25715 4.4%
J60 End time31 1530-1559 28491 4.8%32 1600-1629 25680 4.4%33 1630-1644 12056 2.0%34 1645-1659 10099 1.7%35 1700-1714 13406 2.3%36 1715-1729 11519 2.0%37 1730-1744 13102 2.2%38 1745-1759 9947 1.7%39 1800-1814 12796 2.2%40 1815-1829 9646 1.6%41 1830-1859 17505 3.0%42 1900-1929 16601 2.8%43 1930-1959 13187 2.2%44 2000-2029 11246 1.9%45 2030-2059 8167 1.4%46 2100-2129 7496 1.3%47 2130-2159 6094 1.0%48 2200-2229 5639 1.0%49 2230-2259 4318 0.7%50 2300-2329 3842 0.7%51 2330-2359 3133 0.5%Total 589426 100%NA 4335
J60 represents the time of day whenthe trip finished. The bands are thesame as for J31.
J61 Hours when trip was in progressMulticoded1 0000-0059 1502 0.3%2 0100-0159 1050 0.2%3 0200-0259 773 0.1%4 0300-0359 644 0.1%5 0400-0459 1038 0.2%6 0500-0559 3541 0.6%7 0600-0659 9755 1.7%8 0700-0759 31130 5.3%9 0800-0859 67428 11.4%10 0900-0959 50817 8.6%11 1000-1059 51541 8.7%12 1100-1159 55256 9.4%13 1200-1259 54698 9.3%14 1300-1359 51864 8.8%15 1400-1459 52515 8.9%16 1500-1559 72198 12.2%17 1600-1659 64860 11.0%18 1700-1759 64185 10.9%19 1800-1859 50714 8.6%20 1900-1959 36675 6.2%21 2000-2059 23829 4.0%22 2100-2159 16767 2.8%23 2200-2259 12232 2.1%24 2300-2359 8409 1.4%

National Centre for Social Research
124
J61 Hours when trip was in progress25 0000-0059 +1 1434 0.2%26 0100-0159 +1 99 0.0%27 0200 onwards +1 25 0.0%Total 589426 100%NA 4335
J61 represents the hours of the day inwhich a trip was in progress. Trips arecoded to each hour that applies. Forexample, a trip that began at 10.30and finished at 11.15 would be codedto both category 11 and category 12.
Origin and destination
J57 Origin (county)
1 Avon 8022 1.4%2 Bedfordshire 5447 0.9%3 Berkshire 8273 1.4%4 Buckinghamshire 6025 1.0%5 Cambridgeshire 9892 1.7%6 Cheshire 12474 2.1%7 Cleveland 3901 0.7%8 Cornwall 2285 0.4%9 Cumbria 9707 1.6%10 Derbyshire 10468 1.8%11 Devon 15302 2.6%12 Dorset 5524 0.9%13 Durham 4514 0.8%14 East Sussex 5273 0.9%15 Essex 16904 2.8%16 Gloucestershire 9348 1.6%17 GreaterManchester
15753 4.3%
18 Hampshire 18583 3.1%19 Hereford andWorcester
6885 1.2%
20 Hertfordshire 8102 1.4%21 Humberside 8430 1.4%22 Isle of Wight 1302 0.2%23 Kent 17762 3.0%24 Lancashire 12094 2.0%25 Leicestershire 10473 1.8%26 Lincolnshire 9145 1.5%27 London Central 4976 0.8%28 Other Inner London 19348 3.3%31 Other London notCentral
35782 6.0%
32 Merseyside 13503 2.3%33 Norfolk 8637 1.5%34 Northamptonshire 4126 0.7%35 Northumberland 6357 1.1%36 North Yorkshire 10202 1.7%
J57 Origin (county)37 Nottinghamshire 11634 2.0%38 Oxfordshire 8817 1.5%39 Shropshire 4741 0.8%40 Somerset 8176 1.4%41 South Yorkshire 11230 1.9%42 Staffordshire 10232 1.7%43 Suffolk 8606 1.4%44 Surrey 7398 1.2%45 Tyne and Wear 10569 1.8%46 Warwickshire 5575 0.9%47 West Midlands 26499 4.5%48 West Sussex 9734 1.6%49 West Yorkshire 20431 3.4%50 Wiltshire 8516 1.4%51 Clwyd 4166 0.7%52 Dyfed 4604 0.8%53 Gwent 5223 0.9%54 Gwynedd 2607 0.4%55 Mid Glamorgan 5331 0.9%56 Powys 630 0.1%57 South Glamorgan 5175 0.9%58 West Glamorgan 2807 0.5%59 Borders 896 0.2%60 Central 4900 0.8%61 Dumfries andGalloway
678 0.1%
62 Fife 3730 0.6%63 Grampian 5520 0.9%64 Highlands 1934 0.3%65 Lothian 7627 1.3%66 Strathclyde 24523 4.1%67 Tayside 4038 0.7%68 Essex within M25 15 0.0%69 Hertfordshire withinM25
1269 0.2%
70 Kent within M25 10 0.0%71 Surrey within M25 1101 0.2%Total 593761 100%
Missing values for J57 are patched byinspecting P15 and the knownvariables in the trip record.
J58 Destination (county)
1 Avon 8035 1.4%2 Bedfordshire 5443 0.9%3 Berkshire 8257 1.4%4 Buckinghamshire 6016 1.0%5 Cambridgeshire 9871 1.7%6 Cheshire 12464 2.1%7 Cleveland 3898 0.7%8 Cornwall 2308 0.4%9 Cumbria 9712 1.6%
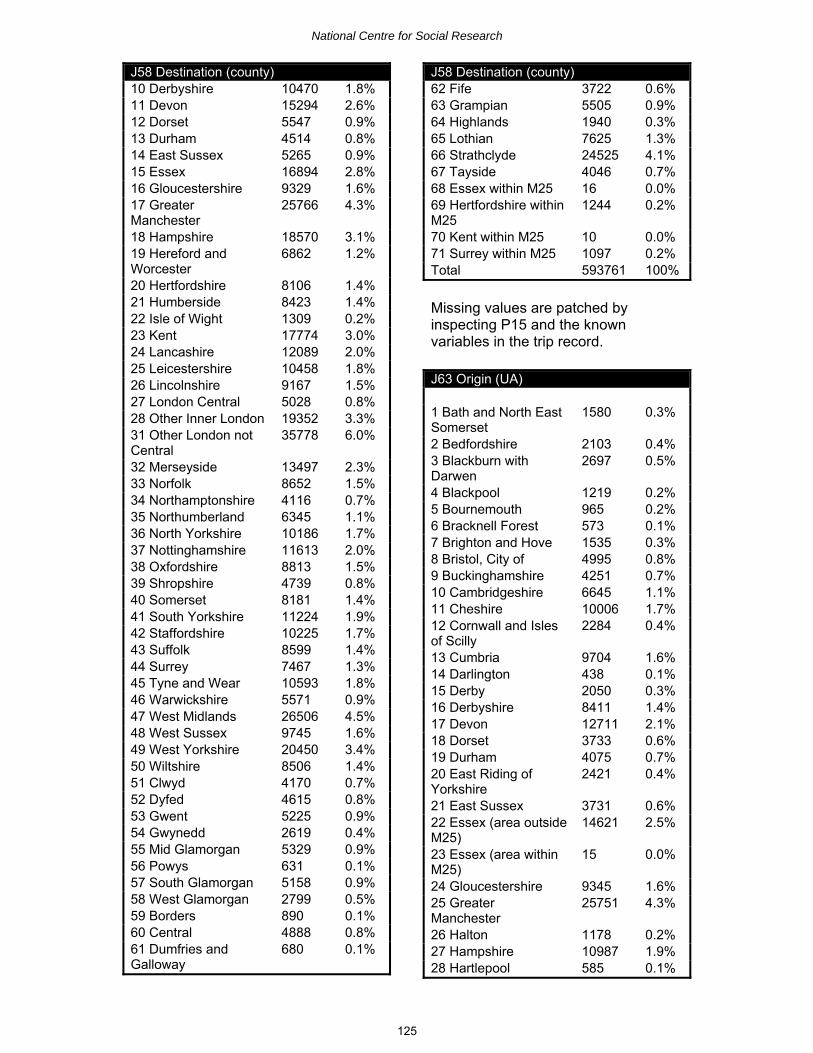
National Centre for Social Research
125
J58 Destination (county)10 Derbyshire 10470 1.8%11 Devon 15294 2.6%12 Dorset 5547 0.9%13 Durham 4514 0.8%14 East Sussex 5265 0.9%15 Essex 16894 2.8%16 Gloucestershire 9329 1.6%17 GreaterManchester
25766 4.3%
18 Hampshire 18570 3.1%19 Hereford andWorcester
6862 1.2%
20 Hertfordshire 8106 1.4%21 Humberside 8423 1.4%22 Isle of Wight 1309 0.2%23 Kent 17774 3.0%24 Lancashire 12089 2.0%25 Leicestershire 10458 1.8%26 Lincolnshire 9167 1.5%27 London Central 5028 0.8%28 Other Inner London 19352 3.3%31 Other London notCentral
35778 6.0%
32 Merseyside 13497 2.3%33 Norfolk 8652 1.5%34 Northamptonshire 4116 0.7%35 Northumberland 6345 1.1%36 North Yorkshire 10186 1.7%37 Nottinghamshire 11613 2.0%38 Oxfordshire 8813 1.5%39 Shropshire 4739 0.8%40 Somerset 8181 1.4%41 South Yorkshire 11224 1.9%42 Staffordshire 10225 1.7%43 Suffolk 8599 1.4%44 Surrey 7467 1.3%45 Tyne and Wear 10593 1.8%46 Warwickshire 5571 0.9%47 West Midlands 26506 4.5%48 West Sussex 9745 1.6%49 West Yorkshire 20450 3.4%50 Wiltshire 8506 1.4%51 Clwyd 4170 0.7%52 Dyfed 4615 0.8%53 Gwent 5225 0.9%54 Gwynedd 2619 0.4%55 Mid Glamorgan 5329 0.9%56 Powys 631 0.1%57 South Glamorgan 5158 0.9%58 West Glamorgan 2799 0.5%59 Borders 890 0.1%60 Central 4888 0.8%61 Dumfries andGalloway
680 0.1%
J58 Destination (county)62 Fife 3722 0.6%63 Grampian 5505 0.9%64 Highlands 1940 0.3%65 Lothian 7625 1.3%66 Strathclyde 24525 4.1%67 Tayside 4046 0.7%68 Essex within M25 16 0.0%69 Hertfordshire withinM25
1244 0.2%
70 Kent within M25 10 0.0%71 Surrey within M25 1097 0.2%Total 593761 100%
Missing values are patched byinspecting P15 and the knownvariables in the trip record.
J63 Origin (UA)
1 Bath and North EastSomerset
1580 0.3%
2 Bedfordshire 2103 0.4%3 Blackburn withDarwen
2697 0.5%
4 Blackpool 1219 0.2%5 Bournemouth 965 0.2%6 Bracknell Forest 573 0.1%7 Brighton and Hove 1535 0.3%8 Bristol, City of 4995 0.8%9 Buckinghamshire 4251 0.7%10 Cambridgeshire 6645 1.1%11 Cheshire 10006 1.7%12 Cornwall and Islesof Scilly
2284 0.4%
13 Cumbria 9704 1.6%14 Darlington 438 0.1%15 Derby 2050 0.3%16 Derbyshire 8411 1.4%17 Devon 12711 2.1%18 Dorset 3733 0.6%19 Durham 4075 0.7%20 East Riding ofYorkshire
2421 0.4%
21 East Sussex 3731 0.6%22 Essex (area outsideM25)
14621 2.5%
23 Essex (area withinM25)
15 0.0%
24 Gloucestershire 9345 1.6%25 GreaterManchester
25751 4.3%
26 Halton 1178 0.2%27 Hampshire 10987 1.9%28 Hartlepool 585 0.1%

National Centre for Social Research
126
J63 Origin (UA)29 Herefordshire 3920 0.7%30 Hertfordshire (areaoutside M25)
8101 1.4%
31 Hertfordshire (areawithin M25)
1269 0.2%
32 Inner London 19337 3.3%33 Isle of Wight 1302 0.2%34 Kent (area outsideM25)
16851 2.8%
35 Kent (area withinM25)
10 0.0%
36 Kingston upon Hull,City of
2320 0.4%
37 Lancashire 8173 1.4%38 Leicester 3320 0.6%39 Leicestershire 7083 1.2%40 Lincolnshire 9140 1.5%41 London Central 4970 0.8%42 London Outer 35760 6.0%43 Luton 3342 0.6%44 Medway Towns 903 0.2%45 Merseyside 13482 2.3%46 Middlesbrough 928 0.2%47 Milton Keynes 1772 0.3%48 Newbury 180 0.0%49 Norfolk 8633 1.5%50 North EastLincolnshire
1415 0.2%
51 North Lincolnshire 2270 0.4%52 North Somerset 1309 0.2%53 North Yorkshire 7160 1.2%54 Northamptonshire 4126 0.7%55 Northumberland 6356 1.1%56 Nottingham 5307 0.9%57 Nottinghamshire 6313 1.1%58 Oxfordshire 8812 1.5%59 Peterborough 3240 0.5%60 Plymouth 271 0.0%61 Poole 823 0.1%62 Portsmouth 4239 0.7%63 Reading 1858 0.3%64 Redcar &Cleveland
1086 0.2%
65 Rutland 65 0.0%66 Shropshire 2433 0.4%67 Slough 1803 0.3%68 Somerset 8171 1.4%69 SouthGloucestershire
137 0.0%
70 South Yorkshire 11228 1.9%71 Southampton 3346 0.6%72 Southend on Sea 1874 0.3%73 Staffordshire 5753 1.3%74 Stockton-on-Tees 1300 0.2%75 Stoke-on-Trent 4470 0.8%
J63 Origin (UA)76 Suffolk 8603 1.4%77 Surrey (areaoutside M25)
7391 1.2%
78 Surrey (area withinM25)
1101 0.2%
79 Swindon 3856 0.6%80 The Wrekin 2299 0.4%81 Thurrock 387 0.1%82 Torbay 2317 0.4%83 Tyne and Wear 10566 1.8%84 Warrington 1284 0.2%85 Warwickshire 5575 0.9%86 West Midlands 26488 4.5%87 West Sussex 9729 1.6%88 West Yorkshire 20419 3.4%89 Wiltshire 4656 0.8%90 Windsor &Maidenhead
2391 0.4%
91 Wokingham 14693 0.2%92 Worcestershire 2959 0.5%93 York 3026 0.5%94 Aberdeen City 3999 0.7%95 Aberdeenshire 1374 0.2%96 Angus 1372 0.2%97 Argyll and Bute 2421 0.4%98 Clackmannshire 314 0.1%99 Dumfries &Galloway
678 0.1%
100 Dundee, City of 1415 0.2%101 East Ayrshire 1950 0.3%102 EastDunbartonshire
0 0.0%
103 East Lothian 525 0.1%104 East Renfrewshire 381 0.1%105 Edinburgh, City of 4554 0.8%106 Falkirk 2630 0.4%107 Fife 3729 0.6%108 Glasgow, City of 8764 1.5%109 Highland 1886 0.3%110 Inverclyde 212 0.0%111 Midlothian 672 0.1%112 Moray 141 0.0%113 North Ayrshire 2075 0.3%114 North Lanarkshire 2697 0.5%115 Orkney Islands 46 0.0%116 Perth and Kinross 1249 0.2%117 Renfrewshire 839 0.1%118 Scottish Borders 896 0.2%119 Shetland Islands 0 0.0%120 South Ayrshire 525 0.1%121 South Lanarkshire 3097 0.5%122 Stirling 1956 0.3%123 WestDunbartonshire
1545 0.3%
124 West Lothian 1873 0.3%

National Centre for Social Research
127
J63 Origin (UA)125 Western Isles 1 0.0%126 Blaenau Gwent 749 0.1%127 Bridgend 460 0.1%128 Caerphilly 1782 0.3%129 Cardiff 4064 0.7%130 Carmarthenshire 1927 0.3%131 Ceredigion 1486 0.3%132 Conwy 174 0.0%133 Denbighshire 1806 0.3%134 Flintshire 1256 0.2%135 Gwynedd 1731 0.3%136 Isle of Anglesey 790 0.1%137 Merthyr Tydfil 2260 0.4%138 Monmouthshire 2010 0.3%139 Neath and PortTalbot
1401 0.2%
140 Newport 1821 0.3%141 Pembrokeshire 1188 0.2%142 Powys 629 0.1%143 Rhondda, Cynon,Taff
1369 0.2%
144 Swansea 1404 0.2%145 Torfaen 133 0.0%146 Vale ofGlamorgan
1076 0.2%
147 Wrexham 1011 0.2%Total 593423 100%NA 338
J64 Destination (UA)
1 Bath and North EastSomerset
1578 0.3%
2 Bedfordshire 2106 0.4%3 Blackburn withDarwen
2692 0.5%
4 Blackpool 1220 0.2%5 Bournemouth 975 0.2%6 Bracknell Forest 574 0.1%7 Brighton and Hove 1543 0.3%8 Bristol, City of 5001 0.8%9 Buckinghamshire 4239 0.7%10 Cambridgeshire 6631 1.1%11 Cheshire 10005 1.7%12 Cornwall and Islesof Scilly
2307 0.4%
13 Cumbria 9709 1.6%14 Darlington 439 0.1%15 Derby 2052 0.3%16 Derbyshire 8411 1.4%17 Devon 12702 2.1%18 Dorset 3737 0.6%19 Durham 4074 0.7%20 East Riding of 2420 0.4%
J64 Destination (UA)Yorkshire21 East Sussex 3719 0.6%22 Essex (area outsideM25)
14607 2.5%
23 Essex (area withinM25)
16 0.0%
24 Gloucestershire 9326 1.6%25 GreaterManchester
25763 4.3%
26 Halton 1173 0.2%27 Hampshire 10970 1.8%28 Hartlepool 585 0.1%29 Herefordshire 3908 0.7%30 Hertfordshire (areaoutside M25)
8104 1.4%
31 Hertfordshire (areawithin M25)
1244 0.2%
32 Inner London 19340 3.3%33 Isle of Wight 1309 0.2%34 Kent (area outsideM25)
16869 2.8%
35 Kent (area withinM25)
10 0.0%
36 Kingston upon Hull,City of
2320 0.4%
37 Lancashire 8172 1.4%38 Leicester 3308 0.6%39 Leicestershire 7079 1.2%40 Lincolnshire 9162 1.5%41 London Central 5019 0.8%42 London Outer 35759 6.0%43 Luton 3334 0.6%44 Medway Towns 897 0.2%45 Merseyside 13473 2.3%46 Middlesbrough 930 0.2%47 Milton Keynes 1774 0.3%48 Newbury 186 0.0%49 Norfolk 8648 1.5%50 North EastLincolnshire
1414 0.2%
51 North Lincolnshire 2265 0.4%52 North Somerset 1319 0.2%53 North Yorkshire 7153 1.2%54 Northamptonshire 4114 0.7%55 Northumberland 6344 1.1%56 Nottingham 5308 0.9%57 Nottinghamshire 6292 1.1%58 Oxfordshire 8805 1.5%59 Peterborough 3235 0.5%60 Plymouth 273 0.0%61 Poole 832 0.1%62 Portsmouth 4232 0.7%63 Reading 1864 0.3%64 Redcar &Cleveland
1089 0.2%

National Centre for Social Research
128
J64 Destination (UA)65 Rutland 67 0.0%66 Shropshire 2429 0.4%67 Slough 1790 0.3%68 Somerset 8176 1.4%69 SouthGloucestershire
135 0.0%
70 South Yorkshire 11222 1.9%71 Southampton 3356 0.6%72 Southend on Sea 1873 0.3%73 Staffordshire 5760 1.0%74 Stockton-on-Tees 1292 0.2%75 Stoke-on-Trent 4456 0.8%76 Suffolk 8596 1.4%77 Surrey (areaoutside M25)
7460 1.3%
78 Surrey (area withinM25)
1097 0.2%
79 Swindon 3867 0.7%80 The Wrekin 2302 0.4%81 Thurrock 390 0.1%82 Torbay 2316 0.4%83 Tyne and Wear 10590 1.8%84 Warrington 1279 0.2%85 Warwickshire 5570 0.9%86 West Midlands 26495 4.5%87 West Sussex 9740 1.6%88 West Yorkshire 20439 3.4%89 Wiltshire 4634 0.8%90 Windsor &Maidenhead
2392 0.4%
91 Wokingham 1445 0.2%92 Worcestershire 2948 0.5%93 York 3017 0.5%94 Aberdeen City 3995 0.7%95 Aberdeenshire 1369 0.2%96 Angus 1379 0.2%97 Argyll and Bute 2402 0.4%98 Clackmannshire 314 0.1%99 Dumfries &Galloway
680 0.1%
100 Dundee, City of 1416 0.2%101 East Ayrshire 1945 0.3%102 EastDunbartonshire
0 0.0%
103 East Lothian 520 0.1%104 East Renfrewshire 377 0.1%105 Edinburgh, City of 4562 0.8%106 Falkirk 2621 0.4%107 Fife 3722 0.6%108 Glasgow, City of 8785 1.5%109 Highland 1894 0.3%110 Inverclyde 212 0.0%111 Midlothian 674 0.1%112 Moray 135 0.0%113 North Ayrshire 2079 0.4%
J64 Destination (UA)114 North Lanarkshire 2692 0.5%115 Orkney Islands 46 0.0%116 Perth and Kinross 1251 0.2%117 Renfrewshire 845 0.1%118 Scottish Borders 890 0.1%119 Shetland Islands 0 0.0%120 South Ayrshire 527 0.1%121 South Lanarkshire 3094 0.5%122 Stirling 1953 0.3%123 WestDunbartonshire
1550 0.3%
124 West Lothian 1866 0.3%125 Western Isles 0 0.0%126 Blaenau Gwent 750 0.1%127 Bridgend 466 0.1%128 Caerphilly 1794 0.3%129 Cardiff 4050 0.7%130 Carmarthenshire 1923 0.3%131 Ceredigion 1481 0.2%132 Conwy 171 0.0%133 Denbighshire 1804 0.3%134 Flintshire 1256 0.2%135 Gwynedd 1747 0.3%136 Isle of Anglesey 790 0.1%137 Merthyr Tydfil 2252 0.4%138 Monmouthshire 2008 0.3%139 Neath and PortTalbot
1400 0.2%
140 Newport 1821 0.3%141 Pembrokeshire 1208 0.2%142 Powys 630 0.1%143 Rhondda, Cynon,Taff
1358 0.2%
144 Swansea 1397 0.2%145 Torfaen 136 0.0%146 Vale ofGlamorgan
1071 0.2%
147 Wrexham 1016 0.2%Total 593416 100%NA 345
J65 Urban/rural coding of origin
1 Inner London 24306 4.1%2 Outer London built-up area
46964 7.9%
3 West Midlands built-up area
20395 3.4%
4 Greater Manchesterbuilt-up area
25761 4.3%
5 West Yorkshire built-up area
16432 2.8%
6 Glasgow built-uparea
8764 1.5%

National Centre for Social Research
129
J65 Urban/rural coding of origin7 Liverpool built-uparea
9958 1.7%
8 Tyneside built-uparea
8839 1.5%
9 Other urban over250K
79011 13.3%
10 Other urban over100K to 250K
77706 13.1%
11 Other urban over50K to 100K
60752 10.2%
12 Other urban over25K to 50K
70234 11.8%
13 Other urban over10K to 25K
73477 12.4%
14 Other urban over3K to 10K
42054 7.1%
15 Rural 28766 4.8%Total 593419 100%NA 342
J66 Urban/rural coding of destination
1 Inner London 24359 4.1%2 Outer London built-up area
46950 7.9%
3 West Midlands built-up area
20412 3.4%
4 Greater Manchesterbuilt-up area
25772 4.3%
5 West Yorkshire built-up area
16453 2.8%
6 Glasgow built-uparea
8785 1.5%
7 Liverpool built-uparea
9952 1.7%
8 Tyneside built-uparea
8857 1.5%
9 Other urban over250K
79028 13.3%
10 Other urban over100K to 250K
77710 13.1%
11 Other urban over50K to 100K
60784 10.2%
12 Other urban over25K to 50K
70176 11.8%
13 Other urban over10K to 25K
73465 12.4%
14 Other urban over3K to 10K
42011 7.1%
15 Rural 28706 4.8%Total 593410 100%NA 351
Cost
J62 Total cost of public transport tripBased upon numeric variable Jtotcost1 Nil 14768 23.3%2 1-49p 9209 14.5%3 50-99p 14364 22.7%4 £1-£1.99 13132 20.7%5 £2-£4.99 8360 13.2%6 £5-£9.99 2211 3.5%7 £10 and over 1333 2.1%Total 63377 100%
The numeric variable that defines thisvariable is derived from the sum ofS34 for each public transport stage ofthe trip.
5.9 Stage level variables
A stage is a part of a trip (see previoussection). A new stage of a trip isdefined when a new mode is used, orwhere there is a change of vehicle(which, in the case of a publictransport trip, must require a newticket.)

National Centre for Social Research
130
Stage details
S2 Mode of transport
1 Walk, less than 1mile
21727 3.5%
2 Walk, 1 mile or more 54806 8.9%3 Bicycle 10528 1.7%4 Private (hire) bus 4810 0.8%5 Car 434572 70.5%6 Motorcycle, scooter,moped
2317 0.4%
7 Van/lorry 14635 2.4%8 Other private 1249 0.2%9 London stage bus 10403 1.7%10 Other stage bus 34616 5.6%11 Coach/express bus 294 0.0%12 Excursion/tour bus 316 0.1%13 LT Underground 6312 1.0%14 Surface rail 8799 1.4%15 Light rail 1608 0.3%16 Air 118 0.0%17 Taxi 6036 1.0%18 Minicab 2699 0.4%19 Other public 433 0.1%Total 616278 100%
Walk includes only walk trips made onthe public highway. Thus walks inparks, countryside areas or on privateland etc. are excluded.
On days 1 to 6, walks of less than onemile were not recorded. On day 7, allwalks of more than 50 yards areincluded.
Children playing in the street areexcluded and these periods arerecorded separately (see I366 et al).
Children riding in prams, pushchairsetc are included here whereappropriate.
Bicycle trips include all forms of non-motorised bicycle and tricycle, with theexception of children on toy bicycles.These trips would either be coded as‘walk’ (where the intention was to gosomewhere), or recorded as playing inthe street (see I366 et al).
As with all trips, bicycle stages areonly recorded if they are on the publichighway. Thus, mountain biking andcycling in parks would be excluded.However, cycling on the pavement oron cycle lanes is included.
Private (hire) bus includes a bus (orminibus) that, for the trip concerned, isprovided for use by a specific group ofpeople and not for use by the public.The use of school buses or employer’sbuses is generally included here.
Car includes conventional 3-wheeledor 4-wheeled cars, land rovers andjeeps. Hire cars are included, unless adriver is provided (in which case thecar is coded as a taxi or minicab).
Motorcycle, scooter, moped comprisesall two-wheeled motor vehicles.
Van/lorry is defined as a motor vehiclewith at least three wheels and no sidewindows to the rear of the driver’sseat.
Other private includes travel by otherprivately available modes such asmotorised caravans, invalid carriages,private aircraft or horses.
London stage bus/other stage buscomprise buses that operate on stageservices and are available to the publicfor short-distance travel. Fast servicesto suburban areas, althoughsometimes marketed as ‘express’routes, are generally included here.
London buses include all local busesin London, regardless of whether theyare run by TfL. London expressservices to Heathrow are coded as‘Coach/express bus’.
Coach/express bus includes regularservices available to the public,designed for long-distance travel withfew or no intermediate stops.

National Centre for Social Research
131
Excursion/tour bus refers toexcursions and tours by fare-payingmembers of the public. Seats do notneed to be available on the day oftravel, but they must have beenavailable for the public to book atsome point prior to travel. Buses thatoffer private travel only for a privategroup are coded as ‘private/hire bus’(see above).
LT Underground is confined to trainservices, on the London Undergroundnetwork, operated by Transport forLondon.
Surface rail consists of all trainservices not included under ‘LTUnderground’ above, or ‘Light rail’below.
Services such as the Bluebell Line,Romney, Hythe and Dymchurch areexcluded, and included in ‘other publictransport’
Light Rail includes the Docklands LightRailway, all metro systems outside ofLondon, trams and similar systems.
Air includes all public domestic airtravel within Great Britain. Private airtravel is coded as ‘other private’ (seeabove). Trips made for the pleasure ofgoing in a plane rather than to getsomewhere are excluded from thesurvey.
Taxi refers to all private hire vehiclesthat a member of the public couldlegally hail in the street.
Minicab refers to private hire cars thatshould legally be booked in advance.Where there is confusion as towhether a vehicle is a taxi or aminicab, the interviewer will probe therespondent for information such as:
• How the taxi was ordered (bytelephone or being hailed in thestreet)
• Whether the vehicle had ameter (a taxi will always have ameter)
• Whether the vehicle displayeda ‘taxi’ sign on the roof, or a‘hackney carriage’ sign on therear (which would both indicatethe vehicle was a taxi)
Other public transport includes the fewpublic transport trips not elsewherespecified. This category includes tripsby trains excluded from ‘surface rail’(see above) are included here, alongwith travel by water.
Missing variables are patched byinspecting the known variables in thetravel record.
S15 Number of boardingsBased on numeric variable S381 641562 66933 6014 1165 136 97 78 39 6Total 71604DNA 544674
S15 applies to stages undertaken bypublic transport, and records thenumber of vehicles boarded during thestage.
If, however, the mode of transport wasdifferent, or if a new ticket wasrequired, the new boarding isconsidered a separate stage.
Missing values are patched using S2and S37.
S24 Means of travel1 Walk, less than 1mile
21727 3.5%
2 Walk, 1 mile or more 54806 8.9%3 Bicycle 10528 1.7%

National Centre for Social Research
132
S24 Means of travel4 Private (hire) bus 4810 0.8%5 Household car –driver
272186 44.2%
6 Non-household car –driver
4420 0.7%
7 Household car –passenger
115448 18.7%
8 Non-household car –passenger
42518 6.9%
9 Householdmotorcycle – driver
2058 0.3%
10 Non-householdmotorcycle – driver
147 0.0%
11 Householdmotorcycle –passenger
59 0.0%
12 Non-householdmotorcycle –passenger
53 0.0%
13 Householdvan/lorry – driver
8768 1.4%
14 Non-householdvan/lorry – driver
2539 0.4%
15 Householdvan/lorry – passenger
1251 0.2%
16 Non-householdvan/lorry – passenger
2077 0.3%
17 Other privatetransport
1249 0.2%
18 London stage bus 10403 1.7%19 Other stage bus 34616 5.6%20 Public expressbus/coach
294 0.0%
21 Excursion/tour bus 316 0.1%22 LT Underground 6312 1.0%23 Surface Rail 8799 1.4%24 Light rail 1608 0.3%25 Air 118 0.0%26 Taxi 6036 1.0%27 Minicab 2699 0.4%28 Other publictransport
433 0.1%
Total 616278 100%
S24 is an extension of S2 (see above),but uses other variables to incorporateinformation such as ownership of aprivate vehicle, and whether therespondent was a driver or apassenger.
S26 Length of stageBased on numeric variable s251 Under 1 mile 60225 9.8%2 1 to under 2 miles 138716 22.5%3 2 to under 3 miles 88567 14.4%4 3 to under 5 miles 106544 17.3%5 5 to under 10 miles 109135 17.7%6 10 to under 15 miles 44031 7.1%7 15 to under 25 miles 33780 5.5%8 25 to under 35 miles 12902 2.1%9 35 to under 50 miles 8386 1.4%10 50 to under 75miles
6263 1.0%
11 75 to under 100miles
2740 0.4%
12 100 to under 150miles
2616 0.4%
13 150 to under 200miles
1205 0.2%
14 200 miles and over 1168 0.2%Total 616278 100%
The count of trips under 1 mile in S26is understated on days 1 to 6, sinceshort walks are not recorded.
Missing values are patched using J51,S24, S36 and S37.
S27 Stage speed
1 Less than 5 mph 98730 16.0%2 5 mph to under 10mph
100796 16.4%
3 10 mph to under 20mph
206056 33.4%
4 20 mph to under 30mph
114740 18.6%
5 30 mph to under 40mph
59605 9.7%
6 40 mph to under 50mph
22903 3.7%
7 50 mph and over 13448 2.2%Total 616278 100%
Derived from S2, S9, S25 and S36.
S28 Short walk
1 Yes 21727 3.5%2 No 594551 96.5%Total 616278 100%

National Centre for Social Research
133
S28 is derived from D1 (day of travelrecord) and S24-25.
Short walks are walks shorter than onemile in length, and are recorded onlyon the last day of the Travel Week.
S37 Travel timeBased on numeric variable S361 Less than 3 minutes 7880 1.3%2 3 to under 8 minutes 107284 17.4%3 8 to under 15minutes
135571 22.0%
4 15 to under 30minutes
217542 35.3%
5 30 to under 45minutes
87756 14.2%
6 45 to under 1 hour 25815 4.2%7 1 hour to under 1.5hours
19751 3.2%
8 1.5 to under 2 hours 6706 1.1%9 2 to under 2.5 hours 3268 0.5%10 2.5 to 3 hours 1600 0.3%11 3 to under 4 hours 1683 0.3%12 4 to under 5 hours 729 0.1%13 5 to under 6 hours 318 0.1%14 6 hours and over 375 0.1%Total 616278 100%
S37 may be understated on days 1-6,since short walks are not recorded.
Missing values are patched using allknown information from the travelrecord.
Number in party
S8a Number in party (adults)Based on numeric variable S7a0 16064 15.0%1 62558 58.5%2 25331 23.7%3 2215 2.1%4 576 0.5%5 124 0.1%6 74 0.1%7 or more 42 0.0%Total 106984 100%Adult journey 509294
S8c Number in party (children)Based on numeric variable s7c0 0 0.0%1 43548 40.7%2 41300 38.6%3 14955 14.0%4 4496 4.2%5 1162 1.1%6 484 0.5%7 or more 1039 1.0%Total 106984 100%Adult journey 509294
S8t Number in party (total)Based on numeric variable s71 272963 44.3%2 190271 30.9%3 81921 13.3%4 46650 7.6%5 16819 2.7%6 3960 0.6%7 or more 3694 0.6%Total 616278 100%
A party is a group of people whodecide to travel together, set outtogether and stay together for at leasthalf the distance of the stage. Fortravel in private vehicles, the partycomprises people using the samevehicle and is a measure of vehicleoccupancy, which may be used toestimate passenger-miles.
The number in party the does notinclude, for example, other passengerson a bus.
All trips are recorded for the purposesof S8t (previously called S8), while alltrips with children present are nowadditionally recorded in S8a and S8c.
Missing values are patched to themean value of 2.

National Centre for Social Research
134
Private vehicles
S18 Private vehicle occupant
1 Front passenger 95665 21.1%2 Rear passenger 66495 14.7%3 Driver 290613 64.2%Total 452773 100%DNA 163505
S18 applies to stages in privatevehicles (other than hire buses), andrecords whether the respondent was adriver or passenger of the vehicle.
Missing values are patched usingI182, S8 and S2.
S19 Where parked
1 On own/friend’spremises
98897 34.6%
2 Firm/work car park 30637 10.7%3 Other private carpark
4450 1.6%
4 Park & ride car park 181 0.1%5 Public car park 63313 22.1%6 Street 76839 26.9%7 Not parked 10605 3.7%8 Other 941 0.3%Total 285863 100%NA 4750DNA 325665
S19 indicates where a respondentparked the vehicle at the end of a cardriver stage.
‘Not parked’ indicates where a vehiclewas not parked, but the vehicle wasdriven away buy someone other thanthe respondent.
‘Street’ parking includes all parking onthe street, including the street at therespondent’s home or workplace.
S21 Parking cost (pence)Based on numeric variable S391 Nil 281819 97.0%2 1p to 9p 61 0.0%3 10p to 19p 101 0.0%4 20p to 29p 326 0.1%
3 30p to 39p 367 0.1%6 40p to 49p 371 0.1%7 50p to 99p 2002 0.7%8 £1 to £1.49 1958 0.7%9 £1.50 to £1.99 868 0.3%10 £2 and over 2740 0.9%Total 290613 100%DNA 325665
S21 applies to driver stages in privatevehicles. If a respondent paid a lumpsum to cover all parking over a period,the interviewer apportioned the costover each period of parking to deriveparking costs for each stage.
Where no value is supplied, S21 ispatched to the modal value, nil.
Tickets and costs
S30 Ticket cost (1)Based on numeric variable S291 Nil 30792 43.0%2 Under 10p 27 0.0%3 10p to under 15p 31 0.0%4 15p to under 20p 103 0.1%5 20p to under 30p 894 1.2%6 30p to under 50p 5468 7.6%7 50p to under 75p 7471 10.4%8 75p to under £1 5120 7.2%9 £1 to under £1.50 8718 12.2%10 £1.50 to under £2 3090 4.3%11 £2 to under £3 3973 5.5%12 £3 to under £5 2765 3.9%13 £5 and over 3152 4.4%Total 71604 100%DNA 544674
S30 records the cost paid for aparticular public transport stage (inmoney or travel tokens). Cards thatcan be charged with prepaid credit(such as the pre-pay Oyster, inLondon) are included here. It does notinclude any costs paid for seasontickets, travelcards etc, which arerecorded in S32.
Missing values for public transporttrips are patched using the mostcommon value, nil.

National Centre for Social Research
135
S32 Ticket cost (2)Based on numeric variable S311 Nil 17263 53.3%2 Under 10p 1162 3.6%3 10p to under 15p 546 1.7%4 15p to under 20p 784 2.4%5 20p to under 30p 1212 3.7%6 30p to under 50p 2433 7.5%7 50p to under 75p 2244 6.9%8 75p to under £1 1572 4.9%9 £1 to under £1.50 1970 6.1%10 £1.50 to under £2 1053 3.3%11 £2 to under £3 1031 3.2%12 £3 to under £5 752 2.3%13 £5 and over 374 1.2%Total 32396 100%NA 9DNA 583873
S32 applies where the respondentused a special pass that may be usedfor an unlimited of trips, and refers tothe estimated cost of a single use.
The cost of a single stage wasestimated from the informationobtained on the individualquestionnaire about the cost of theticket/pass, the method(s) of travel forwhich it was valid, how long it lastedfor, and how often it was used. Theresulting estimate of stage cost wasallocated to each stage for which theticket/pass was used, assuming thatthe cost for multi-mode trips wasproportional to the length of the trip.
The use of travel tokens/carnets wasrecorded at S29 rather than herebecause they have an identifiable costper token, which was recorded in thetravel record.
S32 is patched for public transporttrips, to the most likely value, DNA.This indicates that a special pass wasnot used.
S34 Total costBased on numeric variable S331 Nil 16784 23.4%2 Under 10p 713 1.0%3 10p to under 15p 504 0.7%4 15p to under 20p 744 1.0%
5 20p to under 30p 2069 2.9%6 30p to under 50p 7702 10.8%7 50p to under 75p 9628 13.4%8 75p to under £1 6689 9.3%9 £1 to under £1.50 10628 14.8%10 £1.50 to under £2 4152 5.8%11 £2 to under £3 4992 7.0%12 £3 to under £5 3508 4.9%13 £5 and over 3491 4.9%Total 71604 100%DNA 544674
S34 is the sum of S30 and S32.
S35 Type of ticket
1 Ordinary adult 29676 41.4%2 Ordinary child 4592 6.4%3 Reduced ordinaryadult
2000 2.8%
4 Reduced ordinarychild
438 0.6%
5 Special categoryreduced
2124 3.0%
6 Other (including free) 481 0.7%7 Season ticket 5738 8.0%8 Travelcard 7396 10.3%9 Combinedseason/travelcard
1586 2.2%
10 Railcard 298 0.4%11 Other non-concessionary
879 1.2%
12 OAP Pass 10247 14.3%13 Scholar’s pass 3362 4.7%14 Disabled person’spass
1059 1.5%
15 Subsidised traveltickets
100 0.1%
16 Concessionary –employees
638 0.9%
17 Concessionary –unemployed
0 0.0%
18 Otherconcessionary
1102 1.5%
Total 71716 100%DNA (not public stage) 544562
S35 applies to all public transportstages.
Ordinary adult means the full adult farefor a single trip. All taxi fares areentered here.

National Centre for Social Research
136
Ordinary child means the full child farefor a single trip.
Reduced ordinary adult, reducedordinary child, special categoryreduced and other (inc. free) arereduced-rate tickets for single or returntrips, representing reductions offeredby the travel operator. Examples ofthose entitled in some or all areas arechildren under five, pensioners or theunemployed.
Other tickets include free travelavailable to the public and ticketspurchased as part of a larger packagesuch as a combined hotel and travelbooking. See also I185 for examplesof ticket types.
Missing values are patched usinginformation from the individualquestionnaire.
National Centre for Social Research
137
6 DEFINITIONS COMPARED WITH EARLIER SURVEYS
This chapter consists of two parts. The first part summarises the main differencesbetween previous NTS surveys and the current continuous survey (2002 to 2004). Thesecond part gives a more detailed description of the changes made to the NTS overtime.
6.1 Summary of differences for each NTS
The summaries below draw upon comparative analyses of past NTS data and highlightthe main effects of the changes to the survey over time, such as changes in definitionsand questions. These changes are described in the more detail in Section 6.2.
Series of calls
The summaries below do not refer to the various treatments of multiple-stop trips,typically trips from shop to shop, known in this report as ‘series of calls’ trips. Startingwith the 1985/86 NTS, a trip to the shops, around the shops and then back again wasregarded as three trips with the trip around the shops being treated as a series of callstrip.
Previously a trip around the shops was either omitted (1965 to 1975/76) or else includedas part of the original trip to the shops (1978/79). Series of calls trips are generallyexcluded from analyses of the latest surveys, so that the number of trips on a shoppingtrip is comparable with that in earlier surveys, i.e. two. However, it is possible that someseries of calls-type trips may have been treated as two or more trips in some of theearlier surveys. Analyses of distance travelled normally include series of calls trips.However they are normally short trips and it is assumed that the omission of these tripsfrom the 1975/76 and earlier NTSs does not lead to too much bias in the estimate ofdistance travelled for these surveys.
1965
a. The first National Travel Survey was run in 1965. There are many differencesbetween this first survey and the 2002 to 2004 survey. These are given in detail insection 6.2.
b. In 1965 information was not held on computer files, so analyses were restrictedto those tabulations prepared immediately after the survey.
1972/73
a. The 1972/73 survey had the smallest sample size of all NTSs.
b. London residents were under-represented by 30 per cent.
c. Trips by children under 3 were not collected.

National Centre for Social Research
138
d. The 1972/73 database includes information from households that did not co-operate fully with the survey. For 2002 to 2004, analyses are restricted to fullyco-operating households – this was also done between 1985 and 2001. Thismay lead to differences with figures given in earlier reports.
e. The number of trips recorded was overcounted relative to the 2002 to 2004survey, mainly because trips were more ‘broken up’ in 1972/73 than in latersurveys. In 1972/73, no guidance was given on the treatment of subsidiarypurposes when defining trips. For example, it is thought that some subsidiarypurposes, such as stopping for a newspaper on the way to work were oftencoded as two trips in 1972/73 rather than one, as in later surveys. Also, veryshort walks under of 50 yards were included. The extra trips were mainlyshopping trips under 1 mile, and education and entertainment trips of all lengths.For rough comparisons with 2002 to 2004 data, the overall the number of trips in1972/73 should be reduced by about 15 per cent.
f. The number of escort trips was around half that for the 2002 to 2004 surveys,mainly because accompanying travellers took their trip purpose from that of theperson being accompanied and were not coded as ‘escort’. Education, shoppingand personal business trips were boosted as a result of this switch.
g. The number of holiday trips was about one-third of that on more recent surveys,and day trips were also a little higher. There is no clear reason for the apparentmisclassification in 1972/73.
h. Evidence suggests that respondents’ estimates of walk distance were too high.
i. Information on trip time and travelling time were less reliable because they wereonly collected on the 7th day of the travel week.
j. The type of area variable is biased in favour of larger types of area. In particular,areas with low population densities were often coded as areas with higherdensities. Data on type of area are not therefore strictly comparable with otherNTSs.
k. Population density was given in terms of persons per acre and is therefore notcomparable with other NTSs.
l. Availability of numerical data is severely limited. Only stage distance, time andcost is available.
m. No data are available for health-related travel difficulties, fuel put into householdvehicles and a few other topics.
1975/76
a. No information was collected about children under 3.

National Centre for Social Research
139
b. London residents were under-represented by 25 per cent.
c. Information on partially cooperating households is held on the database (see1972/73 d. above).
d. The number of trips recorded is reasonably consistent with more recent surveys,although there were some differences in the coding of trip purpose (see e. and f.below).
e. Escort trips were under-recorded (see 1972/73 f. above).
f. A short walk stage, i.e. over 50 yards and under 1 mile, was only included if itwas the final or only stage. Attempts to impute short walk stages at the start of atrip from information on trip times were not entirely successful. Walk stages in themiddle of trips were not counted at all.
g. Short day trips, mostly walks, were slightly under recorded compared with otherNTSs, possibly because interviewers misunderstood the advice to record themonly if it was a final or only stage on the 7th day. (Note: A similar differenceoccurred in 2002 and 2003, see below.)
h. Unlike all other NTSs, works/school buses were regarded as being part of thepublic transport system. In all other NTSs they were treated as private transport.(Note: A new variable has been developed which allows 1975/76 data to becompared with those of other NTSs).
i. Total trip time and travelling time (but not start time) are unreliable because theywere only collected on the 7th day of the travel week.
j. Compared with the more recent NTSs, type of area data was biased in favour ofless densely populated areas, mainly because the classification was based onward level information, not postcode sectors.
k. Data on population density are not comparable with other NTSs.
l. The availability of numerical data is severely limited. Only eligible vehicle mileageand journey stage distance, time and cost are available.
m. No data are available for health-related travel difficulties, fuel put into householdvehicles and a few other topics.
1978/79
a. The response rate was very poor. Car-owning households were badly under-represented.
b. London residents were under-represented by 40 per cent.
National Centre for Social Research
140
c. The number of trips was over-recorded relative to 2002 to 2004. Shopping andsocial trips were particularly over-recorded. It is assumed that this is because theinterviewers ‘broke up’ trips to a greater extent than in 1975/76 or in later surveysand included more trips with just subsidiary purposes.
d. Escort trips were under-recorded. See 1972/73 f. above
e. Day trips under 1 mile, mostly of the ‘just walk’ category, were almost half thenumber expected. This was possibly because the code was split into two on thequestionnaire – day trip countryside and day trip other – neither of which mayhave seemed appropriate for a short round trip walk.
f. Type of area data was biased in favour of less densely populated areas. See1975/76 j. above.
g. Population density data are not comparable with other NTSs because they werederived from a special method to link the data with the 1971 Census.
h. The availability of numerical data is a little limited; e.g. age is only available from18 groups of age ranges.
i. No data are available for health-related travel difficulties, fuel put into householdvehicles and a few other topics.
1985/86 and continuous survey 1988 to 2001
a. The sample size in each survey year was around a third of the 2002 to 2004continuous survey. Details of particular sample size changes are described insection 6.2.
b. Travel diary data was coded by interviewers. From 2002, the diary data wascoded centrally and considerable efforts were made by the contractor to clarifydefinitions to ensure greater consistency for trip mode and purpose. This resulted insome discontinuities for some mode and purpose categories.
c. Survey years from 1988 to 2001 relate to calendar year 1 January - 31December. From 2002, the survey year relates to mid-January to mid-January.
d. London residents were under-represented by about 14 per cent in 1985/86 and in1989/91. Boosts to the London sample were introduced in 1993; further details aregiven in section 6.2.
e. Response rates were higher in the 1980s and 1990s compared with the currentsurvey (see Table 6.1):
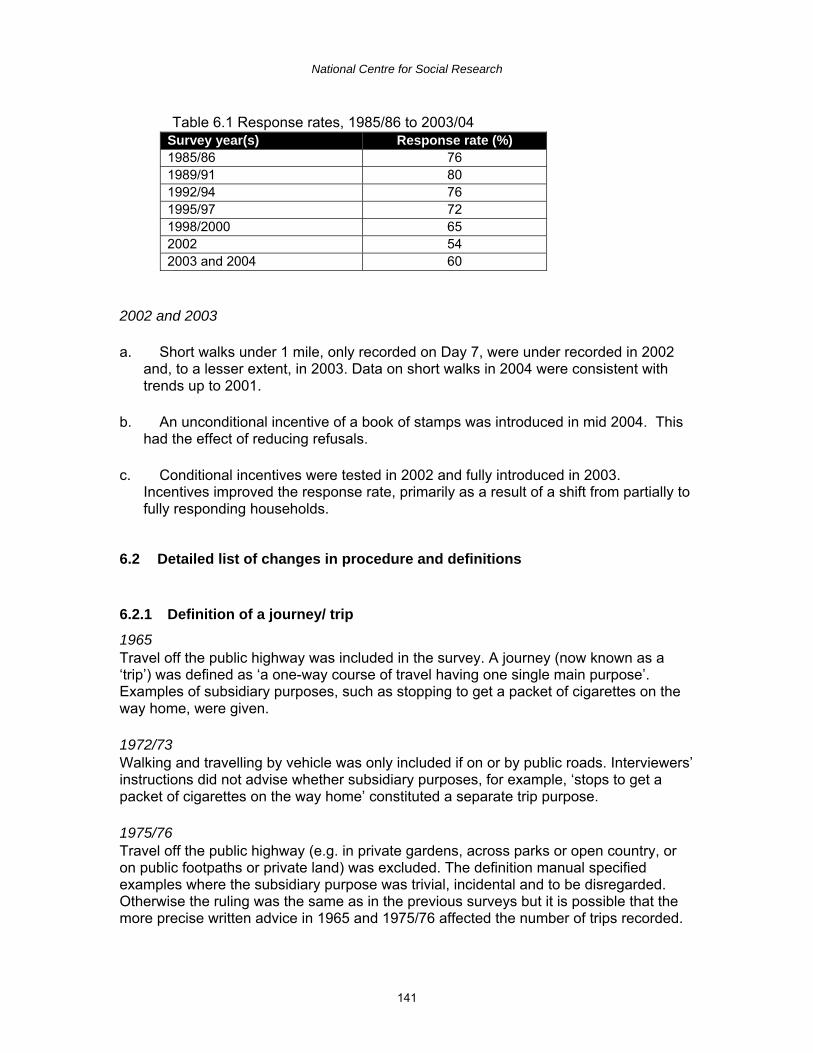
National Centre for Social Research
141
Table 6.1 Response rates, 1985/86 to 2003/04Survey year(s) Response rate (%)1985/86 761989/91 801992/94 761995/97 721998/2000 652002 542003 and 2004 60
2002 and 2003
a. Short walks under 1 mile, only recorded on Day 7, were under recorded in 2002and, to a lesser extent, in 2003. Data on short walks in 2004 were consistent withtrends up to 2001.
b. An unconditional incentive of a book of stamps was introduced in mid 2004. Thishad the effect of reducing refusals.
c. Conditional incentives were tested in 2002 and fully introduced in 2003.Incentives improved the response rate, primarily as a result of a shift from partially tofully responding households.
6.2 Detailed list of changes in procedure and definitions
6.2.1 Definition of a journey/ trip
1965Travel off the public highway was included in the survey. A journey (now known as a‘trip’) was defined as ‘a one-way course of travel having one single main purpose’.Examples of subsidiary purposes, such as stopping to get a packet of cigarettes on theway home, were given.
1972/73Walking and travelling by vehicle was only included if on or by public roads. Interviewers’instructions did not advise whether subsidiary purposes, for example, ‘stops to get apacket of cigarettes on the way home’ constituted a separate trip purpose.
1975/76Travel off the public highway (e.g. in private gardens, across parks or open country, oron public footpaths or private land) was excluded. The definition manual specifiedexamples where the subsidiary purpose was trivial, incidental and to be disregarded.Otherwise the ruling was the same as in the previous surveys but it is possible that themore precise written advice in 1965 and 1975/76 affected the number of trips recorded.

National Centre for Social Research
142
1978/79As 1975/76, except that walking around the shops was also included.
1985/86The definition manual was re-written to give more emphasis to the criteria to be used byinterviewers in deciding how to break travel into trips. The most important was therespondent’s own opinion on their journey purpose.
A new concept was introduced to deal with trips containing multiple stops. Series of callswere trips made up of frequently broken travel between many stops. See notes onshopping trips below.
1988 to 2001 continuous surveyAs 1985/86, except that interviewers were instructed to restrict the use of series of callsto single-stage trips made for the purpose of either ‘shopping’ or ‘in course of work’.
2002 to 2004 continuous surveyAs 1988 to 2001.
6.2.2 Trip purpose
1965The purpose of a trip was defined by its destination, except in cases where the trip wasmade to home in which case the purpose was determined by the place of origin. There isa possibility that more trips made on holiday were missed than in other surveys becausethe number of days between the contact interview and start of the travel period was keptshort. Shopping trips were separated into ‘convenience’ and ‘goods’.
1972/73The interviewers instructions were less specific: for overall trip purpose it was stated that‘the trip homeward takes the same purpose as the trip outward’. It is not clear how'outward' was interpreted (for example, for trips from home to shops, shops to friendsthen friends to home); neither is it clear how 'homeward' was to be interpreted (forexample, for trips from work to shops and back).
On the 7th day only, trip purpose from and trip purpose to were generated from originand destination land use codes together with the overall trip purpose. Where the landuse origin or destination was home the trip purposes from and to could be generateddirectly. In other cases the trip purpose from was based on the destination of theprevious trip, while trip purpose to took the same value as the overall trip purpose.Difficulties with unknown land use led to the under recording of holiday trips. Thesedefinitions are not directly comparable with the later surveys. After one month in the fieldseveral codes were changed from the 1965 definition to the 1975/76 definition; i.e. sportwas sub-divided into ‘watching’ and ‘participating’ and holidays and day trips were split.

National Centre for Social Research
143
1975/76On all days of the recording period, overall purpose was derived from recordedinformation of trip purpose to and trip purpose from e.g. from ‘work’ to ‘shops’. The trippurpose to was the overall purpose in all cases except where it was ‘home’ in whichcase the trip purpose from applied.
1978/79Derived as in 1975/76. However the inclusion of the 3-week car diaries, which had adifferent trip purpose structure, led to some changes. In particular, holidays, which in1975/76 were defined as ‘at least one night away from home for leisure/recreationpurposes’, in 1978/79 excluded staying with friends or relatives for 1-3 nights. Insteadthese short stops with friends were coded as social. The changed treatment of shoppinground trips and walking between shops (see below) led to an increase in shopping andpersonal business trips. The holiday and day trip purposes were sub-divided into‘countryside’ and ‘elsewhere’.
1985/86The main change from 1978/79 was to extend the ‘escort’ category to include tripsaccompanying others. For instance, a child taken shopping by an adult would beclassified as ‘escorting’ in 1985/86, rather than as shopping, as was the case in 1978/79.The 1985/86 dataset identifies the purpose of the person accompanied or escorted aswell as the main purpose where this was escorting. Other changes were made to thegrouping of purposes, but definitions were generally as in 1978/79. An extra categorywas introduced for ‘personal medical business’ to identify trips to receive medical adviceor treatment.
1988 to 2001 continuous surveyNew overall trip purpose categories were introduced from 1988. ‘Commuting’ was strictlyhome to work and work to home trips. ‘Business’ was defined as trips to ‘in course ofwork’ and from ‘in course of work’ to either home or work. ‘Other work’ included all othertrips to work, for example returning to work from a visit to the shops in the lunch break.The ‘escort’ categories were simplified. The new categories for trip purpose to and trippurpose from were: escort home, escort work, escort in course of work, escorteducation, escort shopping/personal business and other escort. These were then usedto derive the new overall trip purpose categories of escort commuting, escort businessand other work, escort education, escort shopping/personal business and escort homeand other escort.
From 1998 shopping trips were categorised according to whether the main purpose wasfood shopping or other shopping.
2002 to 2004 continuous surveyThe coding of diary data, which includes trip purpose, was done centrally rather than byinterviewers. This caused discontinuities for some trip purpose data when compared withearlier surveys.

National Centre for Social Research
144
6.2.3 Round trips
1965Round trips (starting and finishing at the same point) were split into 2 (both apparentlywith the same purpose).
1972/73Interviewers were asked to leave the next trip space blank when there was a round trip(in order to prevent confusion). The trip was to be split into 2 at the editing stage.However, there is some evidence that round trips were treated inconsistently byinterviewers.
1975/76The definition manual used was less confusing on round trips. Interviewers wereinstructed to divide a round trip into 2 trips, outward and homeward. Travel involving acontinuous series of calls made for the same purpose (by a doctor, for example) wastreated as a round trip.
1978/79, 1985/86, 1988 to 2001 continuous surveyAs 1975/76, but see section on shopping trips below.
2002 to 2004 continuous surveyAs 1988 to 2001.
6.2.4 Shopping trips
1965Walks in the course of shopping were excluded.
1972/73Walks in the course of shopping were deleted at the editing stage.
1975/76Walks and private vehicle trips in the course of shopping in the same shopping centrewere excluded.
1978/79A round trip for the purpose of shopping was treated as a round trip with the 2 trips beingto and from the last shop. Thus walks or private vehicle trips in the course of shoppingwere included. If a mode of transport other than walking was used to get from one groupof shops to another then that mode and the subsequent walking were treated asseparate trips.
1985/86Trips involving many stops, of which shopping trips are the typical example, were treatedin a new way using the concept of a series of calls. Travel between the first and lastshops was coded as a separate trip, and the preceding trip represented travel only to thefirst shop, while the following trip represented travel from the last shop (as before). Thus,in 1985/86, two trips were counted where, in 1978/79, there was only one. For

National Centre for Social Research
145
consistency, series of calls should be excluded from counts of trips; however, thedistance travelled on such trips should be included in analyses of distance travelled.Series of calls represented less than 2 per cent of the final sample, a lower proportionthan had been expected. The explanation may be that most travel which could betreated this way waswalking between shops covering an overall distance of less than 1 mile, so that theseries of calls trips was out of scope on six days out of seven.
1988 to 2001 continuous surveyThe definition of series of calls trips was made more restrictive - see I. above.
2002 to 2004 continuous surveyAs 1988 to 2001.
6.2.5 Walking jobs
1965Travel in the course of work by policemen and postmen was specifically excluded.Where the main paid employment was less than 10 hours a week the travel to work wasrecorded as being in course of work.
1972/73Walks by traffic wardens, policemen, etc. were included under ‘in course of work’.Driving jobs were excluded.
1975/76Both walking and driving jobs were excluded.
1978/79, 1985/86, 1988 to 2001and 2002 to 2004 continuous surveysAs 1975/76.
6.2.6 Short walks
1965Short walks, under one mile, were excluded altogether.
1972/73On the 7th day short walks were recorded separately, as a separate stage. Howeversome interviewers ignored very short walks (e.g. to the car) whilst others included them.
1975/76On the 7th day, a short walk over 50 yards was recorded as a separate stage but only ifit was the final or only stage. In most cases a walk stage was generated during computerediting when the trip sheet recorded that some minutes had been spent walking prior tothe bus, train, etc. stage. In a large number of cases, it was difficult to allocate the mainmode of the trip, because the length of a short walk was not known (see below).

National Centre for Social Research
146
1978/79On the 7th day all short walks over 50 yards were recorded as separate stages. Walkingaround the shops, as well as to and from the shops, was included (but not aroundshopping precincts).
1985/86As 1978/79, but walking in a precinct that was permanently open as a publicthoroughfare was included.
1988 to 2001 continuous surveyAs 1985/86.
2002 to 2004 continuous surveyShort walks under 1 mile, only recorded on Day 7, were under-recorded in 2002 and, toa lesser extent, in 2003. Short walks in 2004 appear to be in line with trends up to 2001.Under-recording of short walks affects the number, average time and length of trips,especially walking trips, and school trip length.
6.2.7 Length of walk
1965Respondents’ estimates of distance were used. More long walks would be expectedbecause of the inclusion of travel off the public highway.
1972/73Respondents’ estimates of distance were used. ‘No answers’ formed only a smallproportion of responses. There was evidence that respondents tended to overestimatedistances walked.
1975/76To overcome the 1972/73 problem, distance walked in general, and in particular thelength (in miles) of walks preceding a further stage in the same trip, was estimated bydividing the respondent’s estimate of time taken (in minutes) by 20. This was obviouslyan approximation, possibly an under-estimate on average. Distance comparisonsbetween 1972/73 and 1975/76 are distorted. A large number of the walks preceding acar, train, etc. stage had no time estimate. Therefore, a short walk was recorded, but ofunknown length. This had serious implications for the main mode, as shown below.
1978/79Respondents’ estimates of distance were used, although travelling time was alsorecorded. If distance was not given it was estimated at the computer editing stage fromtravelling time (where known) divided by 20. More long shopping walks would beexpected because of the inclusion of the distance travelled between shops.
1985/86As 1978/79, except that missing data were estimated by dividing travel time in minutesby 25, not 20. Very few records had distance missing.

National Centre for Social Research
147
1988 to 2001 continuous surveyAs 1985/86.
2002 to 2004 continuous surveyAs mentioned in VI, short walks were under-recorded in 2002 and 2003. This affects theaverage length of walking trips.
6.2.8 Main mode of transport
1965The main mode of transport was coded as the mode used in the longest (distance)stage. If 2 stages were the same length the earlier stage mode was used, i.e. the onewith the lower stage number.
1972/73As 1965
1975/76The 1965 method was used. However, in a large number of cases, the length of a stagewas not known. As a result, it was not possible to know the longest stage of the trip.Analysis of these trips has shown that it was mainly two stage car trips and multi-stagebus trips that were affected. This is because it is these types of trips that were most likelyto include one or more walking stages (see problem with short walks above). For 7th daydata some 15 per cent of trips had no main mode coded. This affected the main modes(such as bus), which were likely to have been associated with short walk stages, muchmore than main modes, such as bicycle, which often did not involve walking. When allseven days data are used the overall modal split is not seriously affected, although forcomparison with other data the under-recording (of up to 3–4 per cent for certain modes)can be more of a problem, e.g. for numbers of trips per person. The estimates of lengthof trip and counts of mileage were also affected, although it is often possible toovercome this problem by using stage mode instead of main mode.
1978/79The main mode of transport was coded as the mode used over the longest (distance)stage. If 2 stages were the same length then the first or second was selected at random.Walk stages where both length and time were unknown were ignored and only the otherstages in the trips were used to produce main mode. A secondary mode is alsoavailable, the second longest stage in a multi-stage trip.
1985/86Similar to 1965; where two or more stages had equal length, the mode of the lateststage was taken. If any stage length was missing, main mode was not coded until‘patching’.
1988 to 2001 and 2002 to 2004 continuous surveyAs 1985/86.

National Centre for Social Research
148
6.2.9 Mode of transport
Some bus services were shown separately in earlier National Travel Surveys.
Works/school bus trips on the 1975/76 NTS were treated as other public transport. Arevised grouping has been produced which includes these trips as other privatetransport, the classification used on all other National Travel Surveys.
Public tour/excursion bus stages were included with public express bus stages in1975/76, and not identified separately.
2002 to 2004 continuous surveyThe coding of diary data, which includes stage mode, was done centrally rather than byinterviewers. This causes discontinuities for some mode data when compared withearlier surveys.
6.2.10 Trip start time and travelling time
1965Information on trip start time and travel time was not collected.
1972/73On the 7th day information was collected on the trip start time, overall trip time and stagetravelling time for each stage, excluding waiting.
1975/76Trip start time was collected throughout the travel week. On the 7th day total trip timeand travelling time for each stage (excluding waiting) were collected.
1978/79Trip start time, total duration time and travelling time for each stage were collectedthroughout the travel week.
1985/86,1988 to 2001 and 2002 to 2004 continuous surveysAs 1978/79.
6.2.11 Treatment of part miles
1965Distances were recorded to the nearest half mile for distances of less than 5 miles and tothe nearest mile for distances of 5 miles or more.
1972/73Distances were allowed down to quarter miles but edited into tenths of a mile. A quarterof a mile was recorded as 2 tenths, three quarters as 8 tenths.
National Centre for Social Research
149
1975/76Distances were allowed down to quarter miles but edited into tenths of a mile. A quartermile was recorded as 3 tenths, three quarters as 8 tenths. Distances of 4, 6 or 7 tenthswere not allowed.
1978/79Distances were coded as tenths of miles. Where respondents quoted a quarter of a milethis was coded as 2 tenths, three quarters of a mile being coded as 8 tenths.
1985/86, 1988 to 2001 and 2002 to 2004 continuous surveysAs 1978/79.
6.2.12 Type of area
1965In the absence of the 1966 de facto urban area analysis, a more subjective estimate fortype of area was used. It was based partly on the classification of district councils intourban and rural, partly on the advice of planners and partly on density of population datafrom the 1961 Census. For these reasons it is not comparable with the other surveys.
1972/73Local authorities were, in general, coded to the largest type of area containing any partof the local authority, based mainly upon an unpublished analysis of the 1966 Census:‘De Facto Urban Areas in England and Wales, 1966’. This makes the sample appearbiased in favour of the larger type of area. As a result it is not comparable with the othersurveys. It should be noted that the 235 areas with populations under 3,000 consideredto be ‘urban’ in the original ‘De Facto’ exercise have been counted as ‘rural’ in all NTSanalyses.
1975/76The 1966 de facto urban area analysis was used but at ward level rather than localauthority level, thus eliminating the 1972/73 bias. The 1966 classification of areas mayhave become out of date due to shifts of population from densely populated to lesspopulated areas.
1978/79The 1966 de facto urban area analysis was used to classify each 1978/79 ward. In anumber of cases it was possible to identify the 1978/79 ward with a pre- 1974 localauthority area and hence to find the appropriate classification. In other cases thecentroid of the 1978/79 ward was calculated and then located on a map of the 1966 defacto urban areas to find the appropriate classification. The 1978/79 and 1975/76methods used were sufficiently similar for the results to be regarded as comparable.
1985/86A new classification was derived using the urban areas defined for England and Walesfor the analysis of the 1981 Census (OPCS, 1984), and localities in Scotland defined bythe Scottish Office (GRO(S), 1984). Postcode sectors were classified according to the
National Centre for Social Research
150
nature of the dominant type of area represented in the sector. Urban areas with apopulation below 3,000 were regarded as rural.
1988 to 2001 continuous surveyAs 1985/86 for years up to 1992. Data for 1993 to 2001 use a classification whichreflects built-up areas and population at the time of the 1991 Census.
2002 to 2004 continuous surveyData for 2002 to 2004 use a classification which reflects built-up areas and population atthe time of the 2001 Census.
6.2.13 Population density
1965Based on the 1961 Census, this variable was the population density of the ward or groupof parishes in which the household was sampled.
1972/73Population density was based on the preliminary report from the 1971 Census, andacreage from the 1966 Census county reports. This variable was the population densityof the local authority in which the household was sampled.
1975/76Based on the 1971 Census, both the population densities of the ward and the localauthority in which the household was sampled were estimated. The data were given inpersons per hectare rather than per acre, but the grouping was made to correspondclosely to that used in other surveys.
1978/79Ward density could not be calculated for the wards used in 1978/79 as they were oftenvery different from those used for the 1971 Census. Therefore the method used was todraw a circle around the centroid of the ward sample and accumulate 1971 Census datafor all 1971 enumeration districts whose centroids fell within the circle. Each ward wasthen classified according to the data accumulated. The 1978/79 analysis is notcomparable with the other surveys.
1985/86The population density figures, for local authorities and for the postal sectors comprisingthe primary sampling units, were taken from the ONS sampling frame, which was basedon the Postcode Address File. Population figures were from the 1981 Census.
1988 to 2001 continuous surveyAs 1985/86 for years up to 1992. Data for 1993 to 2001 use a classification whichreflects population at the time of the 1991 Census.
2002 to 2004 continuous surveyData for 2002 to 2004 use a classification which reflects population at the time of the1991 Census.

National Centre for Social Research
151
6.2.14 Household income
1965Of responding households, 21 per cent failed to supply full information on the incomequestion.
1972/73Of responding households 16 per cent failed to give information on income. However,there were a further 334 households with zero income, of which 332 were miscoded. Inpractice it is reasonable to assume that most of these 332 households belonged to thelowest income band.
1975/76Of responding households 31 per cent refused to give their income, and a further 36households said they had zero income. In order to overcome this high refusal rate aprocedure for estimating the household income of the non-respondents was devised.This was based on the number of employed members, the income of the head ofhousehold, the socio-economic group of the head of household, and the number of carsin the household.
1978/79A question on actual income was asked of each individual and only if this was refusedwas the question attempted in terms of bands of income. Of responding households, 31per cent gave full information, 35 per cent partial or banded income from which anestimate was possible, and 34 per cent gave insufficient income information to enablehousehold income to be estimated directly. A similar technique to that used in 1975/76was used to estimate the household income of the 34 per cent using: the number offulltime employed members, the number of cars in the household, the working status ofthe head of the household, and household structure.
1985/86Income was requested only as a banded estimate. A figure was obtained for 85 per centof the fully responding households in the database. Missing information was estimated ina similar fashion to the previous two surveys.
1988 to 2001 and 2002 to 2004 continuous surveyAs 1985/86.
6.2.15 Walking time to various facilities
1965Walking time to the bus stop or railway station was based on the respondent’s estimateof how long it would take them (the respondent) to walk there. It was asked of allpersons.
1972/73As 1965.
National Centre for Social Research
152
1975/76Walking time to various facilities was based on the respondent’s estimate of how long itwould take the interviewer to walk there.
1978/79, 1985/86, 1988 to 2001 continuous surveyAs 1975/76.
2002 to 2004 continuous surveyWalking time to various facilities was based on the respondent’s estimate of how long itwould take them to walk there. If however, the interviewer noticed that the respondenthad difficulties walking, they asked the respondent to estimate how long it would take theinterviewer to walk there.
6.2.16 Miscellaneous differences
1965Business expenses for motoring were not collected.
1975/76Information on the value of the car was not collected. A system of identifying duplicatedtrips was used in order to save interviewer (and respondents’) time. This was furtherdeveloped in 1978/79 and in 1985/86.
1978/79Travel of children under 3 was included for the first time.
1985/86New questions were asked about the use of particular modes of travel, health-relatedtravel difficulties, fuel put into household vehicles, and the number of boardings duringthe use of a single ticket on a particular trip. A number of questions including make andmodel of car, value of car and a split of annual vehicle mileage into business, commutingand other were dropped. The vehicle database and that of later NTSs was split into twoduring 1994. Those cars believed to have been available to the household at the start ofthe travel week were designated primary vehicles, the rest were deemed secondaryvehicles. Information about primary vehicles is now used for all standard analyses ofvehicles, as these represent a point estimate of the vehicle stock. Information on theother vehicles is only used for analyses of journey stages by household vehicles duringthe travel week.
1988From July 1988 a fuel and mileage chart was placed in the vehicle at the beginning ofthe travel week. This led to an increase in the accuracy of NTS estimates of vehiclemileage, making it more comparable with estimates from other sources.
1992From January 1992, some additions to the questionnaire were made. The origins anddestinations of trips were collected, and also the make and model of cars and vans.Summary details of ‘long distance’ trips of 50 miles or more in the three weeks precedingthe travel diary week were added to improve the coverage of these important but less

National Centre for Social Research
153
common trips. A number of other minor changes were made, including the dropping ofquestions about the time taken to reach various local services and amenities. Theincome bands used were also updated in 1992.
In January 1992 some changes to the placing pattern of interviews were introduced.After a transitional quota period in the first half of January 1992, all interviewer quotasfrom this point on ran from midmonth to mid-month. This has improved the coverage ofbank holiday travel.
1993From mid-January 1993, the set sample size of Inner London Boroughs was increasedfrom 12 to 15 interviewer quotas per year, whilst that for Outer London boroughs wasincreased from 18 to 20. A compensating reduction of 5 quotas outside London wasintroduced at the same time so that there was no overall change in the set sample size.The change was introduced to address the perennial problem of the under-representation of London residents in the achieved sample, due to lower response ratesand other factors. In 1993, opinion questions on bus services and a question on the splitof annual vehicle mileage between commuting, business and other private wereintroduced. More details of the changes in 1992 and 1993 can be found in Appendix A ofthe 1991/93 report.
1994In October 1994 Computer Assisted Personal Interviewing (CAPI) was introduced.
1995In 1995, a number of changes were made to the questionnaire. Questions on disabilityand travel difficulties were restricted to those aged 16 and over, and new questions wereintroduced for disabled drivers. New questions on parking facilities at home wereintroduced. The industry grouping and income bands used were also updated in 1995.
1998From January 1998, a large number of harmonised questions were introduced onto thequestionnaire, mostly as replacements for existing questions or question blocks. A fulllist of the harmonised questions introduced can be found in Chapter 3 of this report. InJanuary 1998, several other questions were also added. These were the questions onthe time taken to reach various local services and amenities, which had been dropped inJanuary 1992.
1999In 1999, the placing pattern for diaries was altered, in order to allow more chance for afull response, by giving interviewers more time to contact households within the quotamonth. Firstly, in May, diary start dates were allocated on a first-come, first-served basis,but within the restriction of interviewers having to contact the households in a pre-determined (random) order. This was altered again in September, from wheninterviewers were allowed to contact households in any order. Also in 1999, two furtherharmonised questions were added, covering marital status and living arrangements.

National Centre for Social Research
154
2000In 2000, there were some significant alterations to the sample of the NTS, intended tohalt the continued decline in the achieved sample resulting from increasing non-response. The size of each PSU was increased from 21 to 23 addresses. Furthermore,the total number of PSUs was increased from 240 to 252, giving a new total of 5,796addresses in the starting sample, compared with the old total of 5,040. Adisproportionate number of the additional PSUs were placed in London, to compensatefor the even worse response problems in this area. Several additional harmonisedquestions were included from January 2000 (see chapter 3). New questions on cyclingwere also added during 2000.
2001New questions on the reliability and frequency of local bus and rail services andharmonised questions on ethnicity, supervising employees and supervisionresponsibilities (see chapter 3) were introduced.
6.3 2002 Survey Year
From January 2002 the NTS contractor changed from the ONS to the National Centre forSocial Research (NatCen). Several changes were made to the survey some of whichwere a result of the National Statistics Quality Assurance Review (see chapter 9).In 2002 there was a considerable fall in the fully co-operating response rate from 65 percent to 54 per cent, which is common when a new contractor takes over a survey.
The sample
In 2002 the sample size was increased to 15,048 addresses from 5,796 in 2001. ThePSUs were increased from 252 to 684 and the size of PSU's was changed from 23addresses to 22. This enabled DfT to look at travel data from one year rather thanhaving to combine two years data. The NTS also introduced a quasi panel design in2002 whereby half the PSUs selected in any year are retained and the other half arereplaced (see section 2.8 and 2.9 of the 2002 technical report). This was introduced toreduce variability from year to year as a result of changes in areas surveyed.
Stratification variables for the NTS sample changed in 2002. The region stratifier used in2001 was based on Government Office Regions (GOR) split into metropolitan and non-metropolitan areas. The region stratifier used in 2002 was based on NUTS2 and waschosen to correspond with GORs but has a finer breakdown of areas (see section 2.2 ofthe 2002 technical report). In particular the 2001 region stratifier split London into twogroups (Inner and Outer London) whereas the 2002 region stratifier based on theNUTS2 separates London into five areas.
In addition to the new region startifier, the 2002 NTS sample was also stratified bypopulation density (people per hectare) instead of the proportion of heads of householdsin socio-economic groups 1 to 5 and 13 (that is a professional employer or manager)which had been used in 2001 (see section 2.8. of the 2002 technical report). The use ofthe stratifier proportion of households with no car was continued.

National Centre for Social Research
155
In 2002 London was oversampled, as in 2001, in order to compensate for lowerresponse rates in London, although the degree of oversampling was slightly different(see section 2.9 of the 2002 technical report).
The proportion of deeply rural households in the rural sample fluctuates from year toyear. This proportion was relatively high in 2002 compared with earlier years. This willaffect comparison of car ownership figures for rural areas, and the bus availabilityindicator, and may affect trip lengths and times for the country as a whole.
New questions
In 2002 rotated modules of questions were introduced into the survey, with somequestions relating to the rating of local public transport services and vehicle use(amongst others) being rotated between even and odd years of the survey. See section3.7.1 in the 2002 Technical report.
In 2002 several Individual level questions were added or revised:
• New questions on walking over 20 minutes were introduced owing to an interest inthe health benefits of walking. These questions include all walks, unlike the travelrecord which excludes walks not on the public highway.
• Questions on transport barriers to employment were asked of the unemployed toestablish if there were any transport issues which affected their employmentprospects.
• Employees were asked whether their employer offered any transport related benefitsfirstly, to all employees at their workplace and secondly the respondent.Respondents were also asked whether they used the transport related benefitsoffered to them.
• Questions on home working were expanded owing to an interest in any reduction intravel congestion that might result from people working at home rather than travellingto work. If respondents did not work from home they were asked whether it waspossible to do their type of work at home.
• Respondents were asked whether they had any difficulties travelling to work,shopping or other activities, and if so, what these difficulties were.
• The question set regarding travel difficulties related to disabilities was revised.
• Respondents were asked whether any household vehicles remained unused athome when they were at work.
Household level questions:
• A new question was introduced to ask respondents why they had moved house. Thisassesses whether any recent move was influenced by transport considerations.
National Centre for Social Research
156
• A new question on methods of shopping asked whether respondents ordered anyshopping by post, phone or the internet because of the effect changes in thesemethods may have on traffic levels.
• Respondents were asked whether they did the main food shopping for theirhousehold. If so, they were asked about difficulties with travel for food shoppingduring the individual questionnaire.
• Questions on children’s travel to and from school, and about crossing roads werealso asked where the household had children aged 7-13. These questions wereintroduced in order to look at children’s independence.
• Harmonised questions on ownership of accommodation and on joint ownership ofaccommodation were introduced.
Vehicle level questions:
• For the first time in 2002, respondents were asked to give the registration number ofall household vehicles. The reason for this is that the more technical informationabout the vehicle (for example, type of fuel used and taxation class) can be obtainedthrough the DVLA database of vehicles, rather than asking respondents directly. Itwas felt that information gained in this way would be more accurate, and it alsomeant that the interview could be slightly shorter as these questions did not thenneed to be asked. Respondents were asked for their permission to use theirregistration number to consult the DVLA database. If they refused, their registrationnumber was removed from the questionnaire. If the respondent refused to give theregistration number, then questions were asked directly as in previous years.
• Questions were added about the use of vehicles for making deliveries.
• Questions were added about the use of vehicles for travel outside of Great Britain.
Other changes in 2002
Centralised coding of diary data was introduced instead of coding by interviewers.
The level of detail for the origin and destination of journeys on day 7 of the travel weekwas increased to allow geocoding of NTS data. On day 7 respondents were asked torecord the full address (including the postcode if they knew it) of their journey origin anddestination. Prior to 2002, respondents had only been required to record the name of thetown or village.
Children were asked to record in their travel diary any time they spent playing on thestreet on day 7 of the travel week.
Distance and area checks for journeys were introduced into the diary coding and editingprocess.

National Centre for Social Research
157
The survey year changed to relate to mid-January to mid-January, whereas data forprevious years related to the calendar year 1 January - 31 December.
A non-response form was introduced with a view to informing the development of aweighting strategy for the NTS.
6.4 2003 Survey Year
Following an investigation into the use of conditional incentives in late 2002, £5 voucherswere given to all household members in households classified as fully co-operating. Thismeasure was introduced in order to increase response rates, especially amongst largefamilies. The incentive had the effect of converting partially responding households tofully cooperating households.
Details of any congestion charges paid by drivers were collected in the travel diary.
6.5 2004 Survey Year
In mid 2004, an unconditional incentive of postage stamps was introduced in order toencourage respondents to take part in the survey. A book of six first-class stamps wasincluded with the advance letter to each household. The incentive converted somerefusals to fully cooperating.
New questions on the planning of journeys by both private and public transport wasintroduced in 2004. These questions are intended to collect data about the use ofTransport Direct. A question on satisfaction with local bus services, which was droppedin 2001, was reinstated in 2004. A harmonised question on how long someone had beenlooking for a job if they were currently out of work was added. An open question wasalso added at the end of the placement interview to give the interviewer the opportunityto record any general comments about travel that the respondent wanted to make.
Weighting the NTSWork is being carried out by DfT to weight NTS data to address non-response, samplingvariations and other factors. It is intended that trend data up to 2004 will be published inSpring 2006.

National Centre for Social Research
158

National Centre for Social Research
159
7 COMPARISON OF NTS DATA WITH OTHER SOURCES
This chapter compares NTS data with several other sources. The topics covered aredemographic characteristics, stock and mileage of cars, household car availability, travelto work, bicycle mileage, bus boardings, van mileage and driving licence holding.Commentary is given to highlight and explain some of the differences between the NTSand other sources.
7.1 Age and sex of NTS respondents
This section compares the NTS sample with ONS population estimates.
The NTS is a household survey, so the NTS sample represents the population of peoplewithin households in Great Britain. This should be taken into consideration whencomparisons are made with resident population estimates. The resident populationincludes people in communal and institutional establishments, for example, care homesand student halls of residence. These are excluded from the NTS sample. Tables 7.1,7.2 and 7.3 compare the NTS sample with the resident population of GB. The ONShave produced experimental household population estimates for England and Wales in2002 and 2003. Tables 7.4 and 7.5 compares the NTS sample with the householdpopulation.
Compared with GB resident population estimates, in 2002 to 2004, the NTS under-represented males overall and all people between the ages of 16 and 29 (Tables 7.1, 7.2and 7.3). Children and the elderly were over represented. The under representation ofyoung men particularly affects data on travel by bicycle and motorcycles, which are usedmore frequently by young men. Figure 7.1 shows the percentage under representationfor people in their twenties since 1989. Over this period men are consistently underrepresented more than women. In the last five years the male under representation hasfallen, whilst for women the under representation has been more stable.
Since the introduction of incentives to all households from 2003 (see Simmonds et al,2003), larger families have become more likely to take part in the survey. This shows upclearly in the increase in the over-representation of children up to 15. At the other end ofthe age scale, there is now less over-representation by older people.
It is intended that NTS data will be weighted for non-response bias from 2006. Theweighting method will adjust the NTS sample to represent the distribution of residentpopulation by age, sex and GOR. The weighting method will use household populationfigures instead, should estimates become available for the last decade.

National Centre for Social Research
160
Table 7-1 Comparison of the distribution of age and sex of NTS respondents withthe mid-year population estimates for 2002
PercentageNTS Sample 2002 Population estimate
2002NTS Percentage over-
representationMale Female Male Female Male Female
0-4 3.0 2.8 2.9 2.8 1 25-10 4.0 3.9 3.8 3.7 5 611-15 3.3 3.2 3.4 3.2 -3 116-20 2.5 2.5 3.2 3.0 -22 -1721-25 2.1 2.4 3.0 3.0 -32 -2026-29 2.1 2.4 2.6 2.6 -19 -630-39 7.1 7.6 7.7 7.8 -8 -440-49 6.5 7.2 6.8 6.9 -4 550-59 6.8 7.0 6.3 6.4 8 960-69 5.3 5.8 4.5 4.8 18 2070+ 5.3 7.2 4.6 6.9 15 4
All ages 47.9 52.1 48.8 51.2 -2 2
Table 7-2 Comparison of the distribution of age and sex of NTS respondents withthe mid-year population estimates for 2003
PercentageNTS Sample 2003 Population estimate
2003NTS Percentage over-
representationMale Female Male Female Male Female
0-4 3.3 3.0 2.9 2.8 12 105-10 4.1 3.9 3.8 3.6 10 911-15 3.5 3.6 3.4 3.2 4 1316-20 2.7 2.7 3.3 3.1 -18 -1321-25 2.2 2.6 3.1 3.1 -28 -1626-29 2.2 2.3 2.5 2.5 -11 -830-39 6.7 7.9 7.6 7.7 -11 340-49 6.9 7.1 6.9 7.0 - 250-59 6.2 6.5 6.3 6.4 -2 260-69 5.0 5.4 4.6 4.9 10 1270+ 5.3 6.8 4.7 6.9 13 -2
All ages 48.1 51.9 48.9 51.1 -2 2

National Centre for Social Research
161
Table 7-3 Comparison of the distribution of age and sex of NTS respondents withthe mid-year population estimates for 2004
PercentageNTS Sample 2004 Population estimate
2004NTS Percentage over-
representationMale Female Male Female Male Female
0-4 3 3 3 3 8 105-10 4 4 4 4 6 1911-15 4 3 3 3 15 416-20 3 3 3 3 -23 -1321-25 3 3 3 3 -15 -1826-29 2 2 2 2 -22 -830-39 7 7 7 8 -11 -340-49 7 7 7 7 -5 250-59 6 7 6 6 -1 560-69 5 6 5 5 11 1470+ 5 7 5 7 10 -2
All ages 48 52 49 51 -2 1
Figure 7-1 Under representation of 21-29 olds in the NTS sample compared with ONSpopulation estimates: 1989 to 2004
-505
101520253035
Percent
MalesFemales
Males 17 18 16 20 21 17 20 19 20 17 25 30 25 26 20 18
Females 5 9 7 6 10 2 11 15 8 -2 17 15 19 14 12 14
1989 1990 1991 1992 1993 1994 1995 1996 1997 1998 1999 2000 2001 2002 2003 2004

National Centre for Social Research
162
The differences between the NTS sample and household population displayed in Tables7.4 and 7.5 are relatively similar to those between the sample and the residentpopulation. However, when comparing the sample with the household population themain difference is the slightly greater over representation of women over 70. This is dueto the high response among older women and the large proportion of older women whoare residents in care homes.
Table 7-4 Comparison of the distribution of age and sex of NTS respondents withthe mid-year household1 population estimates (experimental): England & Wales 2002
PercentageNTS Sample 2002 Household population
estimate 2002NTS Percentage over-
representationMale Female Male Female Male Female
0-17 11.6 11.0 11.6 11.1 - -118-49 19.0 20.8 21.9 22.2 -13 -650-59 6.8 7.0 6.4 6.5 7 860-69 5.4 5.8 4.6 4.8 18 2070+ 5.4 7.3 4.6 6.5 18 12
All 48.1 51.9 48.9 51.1 -2 21 The estimated household population of an area includes only those residents living in private households,and excludes the residents of communal/ institutional establishments.
Table 7-5 Comparison of the distribution of age and sex of NTS respondents withthe mid-year household1 population estimates (experimental): England & Wales 2003
PercentageNTS Sample 2003 Household population
estimate 2003NTS Percentage over-
representationMale Female Male Female Male Female
0-17 12.2 11.8 11.5 11.0 6 818-49 19.5 21.4 21.9 22.2 -11 -350-59 6.2 6.5 6.4 6.5 -2 -60-69 4.9 5.3 4.6 4.9 7 970+ 5.3 6.8 4.6 6.5 14 6
All 48.1 51.9 49.0 51.0 -2 21 The estimated household population of an area includes only those residents living in private households,and excludes the residents of communal/ institutional establishments.

National Centre for Social Research
163
7.2 Region of residence of NTS respondents
Table 7.6 gives details of response for the Government Office Regions of England, andfor Scotland and Wales. London households are over sampled to compensate for theknown lower response rate in London, although, London was still under represented in2002 to 2004. As stated in the previous section weighting the NTS will ensureconsistency in the NTS sample with population distributions by GOR.
Table 7-6 Comparison of the region of residents of NTS respondents with the mid-year population estimates, 2002 to 2004
PercentageNTS Sample Population estimate NTS Percentage over-
representation2002 2003 2004 2002 2003 2004 2002 2003 2004
North East 4.8 4.3 4.9 4.4 4.4 4.4 9 -1 12North West 12.2 11.7 11.6 11.8 11.8 11.7 3 -1 -1Yorkshire andthe Humber 8.6 8.8 8.8 8.7 8.7 8.7 - 2 1
East Midlands 8.0 7.1 7.3 7.3 7.4 7.4 9 -3 -1West Midlands 8.7 9.4 9.3 9.2 9.2 9.2 -6 2 1Eastern 9.4 9.6 9.8 9.4 9.4 9.4 - 1 4London 10.9 12.2 11.8 12.8 12.8 12.8 -15 -4 -8
ow: InnerLondon 4.3 4.7 4.5 5.0 5.0 5.0 -14 -7 -10
Outer London 6.6 7.5 7.3 7.8 7.7 7.7 -15 -3 -6South East 13.0 13.7 13.0 14.0 14.0 14.0 -7 -2 -6South West 9.6 9.0 9.5 8.6 8.6 8.7 11 4 9Wales 5.5 5.0 4.5 5.1 5.1 5.1 9 -2 -11Scotland 9.4 9.3 9.6 8.8 8.7 8.7 7 7 10
Great Britain 100 100 100 100 100 100
7.3 Vehicle stock of household 4-wheeled cars
Figure 7.2 gives estimates of vehicle stock from the NTS, compared with data from theDriver and Vehicle Licensing Agency (DVLA). The NTS estimate of vehicle stock hasbeen consistently lower than the DVLA estimate, though has broadly followed the sametrend.
The DVLA estimate of stock is derived as shown in Table 7.7. Prior to 2002 the stockevading taxation was estimated to be just under 4 percent of known stock. In 2002 and2004, surveys of tax evasion were carried out and results from these surveys were usedto estimate the stock of cars evading taxation.
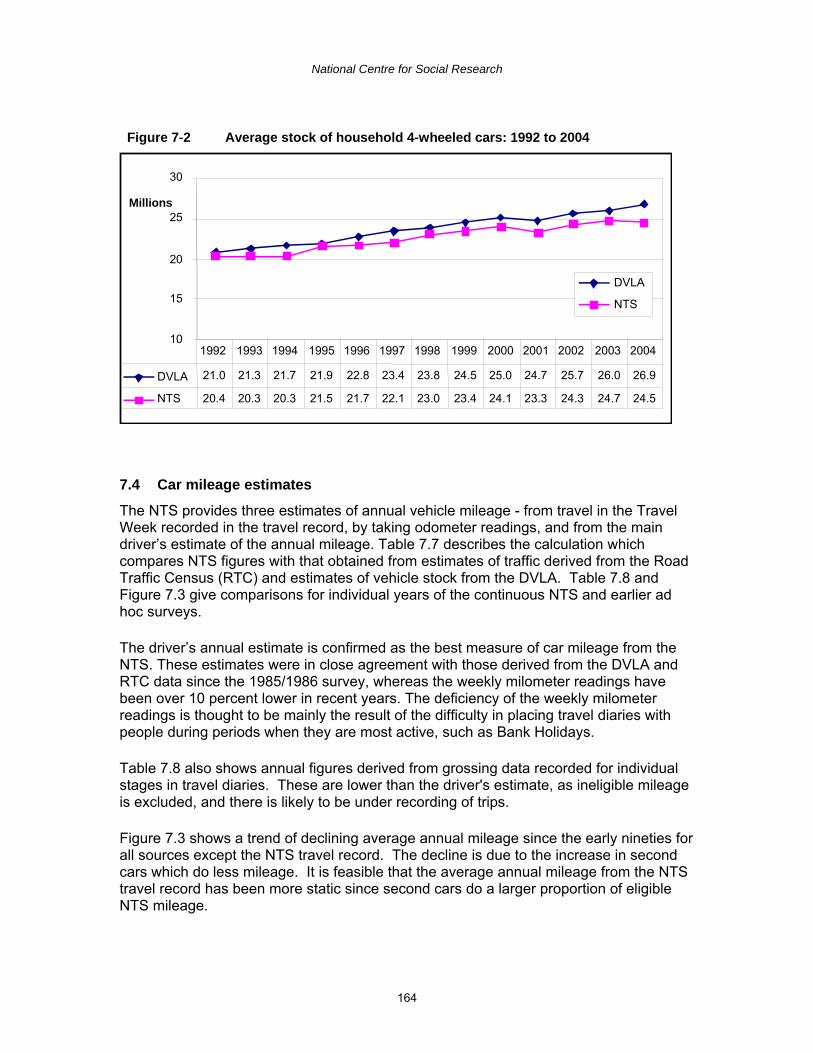
National Centre for Social Research
164
Figure 7-2 Average stock of household 4-wheeled cars: 1992 to 2004
10
15
20
25
30
Millions
DVLA
NTS
DVLA 21.0 21.3 21.7 21.9 22.8 23.4 23.8 24.5 25.0 24.7 25.7 26.0 26.9
NTS 20.4 20.3 20.3 21.5 21.7 22.1 23.0 23.4 24.1 23.3 24.3 24.7 24.5
1992 1993 1994 1995 1996 1997 1998 1999 2000 2001 2002 2003 2004
7.4 Car mileage estimates
The NTS provides three estimates of annual vehicle mileage - from travel in the TravelWeek recorded in the travel record, by taking odometer readings, and from the maindriver’s estimate of the annual mileage. Table 7.7 describes the calculation whichcompares NTS figures with that obtained from estimates of traffic derived from the RoadTraffic Census (RTC) and estimates of vehicle stock from the DVLA. Table 7.8 andFigure 7.3 give comparisons for individual years of the continuous NTS and earlier adhoc surveys.
The driver’s annual estimate is confirmed as the best measure of car mileage from theNTS. These estimates were in close agreement with those derived from the DVLA andRTC data since the 1985/1986 survey, whereas the weekly milometer readings havebeen over 10 percent lower in recent years. The deficiency of the weekly milometerreadings is thought to be mainly the result of the difficulty in placing travel diaries withpeople during periods when they are most active, such as Bank Holidays.
Table 7.8 also shows annual figures derived from grossing data recorded for individualstages in travel diaries. These are lower than the driver's estimate, as ineligible mileageis excluded, and there is likely to be under recording of trips.
Figure 7.3 shows a trend of declining average annual mileage since the early nineties forall sources except the NTS travel record. The decline is due to the increase in secondcars which do less mileage. It is feasible that the average annual mileage from the NTStravel record has been more static since second cars do a larger proportion of eligibleNTS mileage.

National Centre for Social Research
165
Table 7-7 Comparison of NTS car mileage estimates with other sources: 2002 to2004
2002 2003 2004VEHICLE MILES (billions)RTC estimated traffic of cars and taxis, GB 244.2 244.3 247.4
(=392.9 bnkm.)
(=392.0 bnkm.)
(=398.1 bnkm.)
less traffic of: non-household cars1 15.6 14.9 14.1 vehicles other than car body types1 4.2 4.2 4.2 foreign cars, from IPS2 2001 1.8 1.8 1.8
Total GB public highway mileage of household cars 222.7 223.3 227.3
Overseas trips using GB cars, from IPS2 2001 & 2003(thousand trips)
6,453 6,256 6,256
Foreign mileage per trip, from IPS2 2001 (vehicle miles) 620 620 620Total foreign mileage, from IPS2 2001 4.0 3.9 3.9Total mileage in GB off public highways 0.3 0.3 0.3
A. Total mileage of household 4-wheeled cars 227.0 227.5 231.4
VEHICLE STOCK (thousands)
DVLA stock of licensed Private & Light Goods: Cars 24,543 24,985 25,754
plus cars exempt from licence fees, from DVLA stock data 1,159 1,177 1,196
plus cars evading taxation, from 2002 and 2004 evasion surveys 1,080 912 912
less non household cars, e.g. rental cars 1,114 1,067 1,009
B. Stock of household cars 25,668 26,006 26,852
ANNUAL AVERAGE MILEAGE PER HOUSEHOLD CAR
Using RTC, IPS and DVLA stock index [A/B] (miles) 8,840 8,750 8,620
Using NTS data: Annual mileage per care, from drivers' estimates of annual mileage 9,000 9,100 9,020
Average annual mileage per car, from weekly milometer readings 7,850 7,820 7,7501 Traffic of non-household cars (which includes rental cars) and vehicles other than car body types (whichincludes taxi & minicabs) are derived from vehicle stock figures and assumed annual average of 14 and 26thousand miles respectively.2 International Passenger Survey

National Centre for Social Research
166
Table 7-8 Comparison of NTS car mileage figures with traffic census-based figuresfor household cars
MilesTraffic census
and DVLAstock figures1
NTS driversannual
estimates
NTS weeklymilometerreadings
NTS driverstages from
diary
April 1972 - March 1973 9,240 9,590 8,310 7,930July 1975 - June 1976 8,330 9,210 7,960 7,540May 1978 - May 1979 8,490 9,090 8,210 7,540July 1985 - June 1986 8,970 8,900 7,650 7,400
Calendar years:1989 10,000 9,630 8,220 8,0401990 9,790 9,860 8,350 8,1001991 9,610 9,410 8,370 7,9301992 9,380 9,550 8,590 8,0101993 9,410 9,620 8,510 8,1301994 9,400 9,580 8,430 8,0701995 9,600 9,610 8,520 8,2601996 9,600 9,460 8,600 8,4901997 9,400 9,180 8,370 8,2601998 9,440 9,500 8,170 8,3401999 9,190 9,300 8,200 8,0402000 9,010 9,400 8,050 8,0602001 8,820 8,780 7,900 8,4202002 8,840 9,000 7,850 8,1102003 8,750 9,100 7,820 8,1202004 8,620 9,020 7,750 8,290
1 Derived as shown in Table 7.7.

National Centre for Social Research
167
Figure 7-3 Comparison of NTS car mileage figures with traffic census based figuresfor household cars: 1989 to 2004
7.5 Household car availability
Tables 7.9, 7.10 and 7.11 compare car availability by country and English region(percentage of households with no, one and more than one car or van) as measured bythe 2001 Census, NTS, General Household Survey (GHS) and Expenditure and FoodSurvey (EFS). The NTS sample was tripled in 2002, thus 2001 figures shown are not asrobust as later years. In particular, the North East and Wales have the smallestsamples. There is fairly good agreement among the different surveys, though estimatesfor London are relatively volatile between surveys. In general in transport statisticspublications car availability for single years at a national and regional level are based onaggregated data from the NTS, GHS and EFS.
6,000
6,500
7,000
7,500
8,000
8,500
9,000
9,500
10,000
10,500
1989
1990
1991
1992
1993
1994
1995
1996
1997
1998
1999
2000
2001
2002
2003
2004
Mile
s Traff ic census and DVLA stock
NTS drivers annual estimates
NTS w eekly milometer readings
NTS diary

National Centre for Social Research
168
Table 7-9 Households with no car available by GOR from NTS, GHS, EFS and 2001Census: 2001-2003
Percentage2001 2002 2003
NTS GHS EFS Census NTS GHS EFS NTS GHS EFS
No cars
North East 38 32 36 36 38 36 38 38 34 39North West 29 29 29 30 26 26 29 28 29 28Yorks' andHumberside 29 32 32 30 33 28 29 30 33 28
East Midlands 23 26 19 24 20 25 22 22 23 21WestMidlands 26 25 24 27 29 27 25 25 26 24
Eastern 20 20 21 20 21 19 16 21 15 20London 37 33 33 37 41 41 35 39 40 33South East 19 20 15 19 19 19 17 18 17 17South West 21 20 17 20 18 18 18 20 19 17England 26 26 24 27 26 26 24 26 26 24Wales 28 26 25 26 26 26 29 28 24 22Scotland 32 36 35 34 34 34 34 32 32 32
Great Britain 27 27 25 27 27 27 26 27 26 25
Table 7-10 Households with one car available by GOR from NTS, GHS, EFS and 2001Census: 2001-2003
Percentage2001 2002 2003
NTS GHS EFS Census NTS GHS EFS NTS GHS EFS
One car
North East 44 44 42 43 44 45 40 43 50 39North West 49 45 44 44 47 47 42 45 46 45Yorks' andHumberside 47 44 46 44 44 47 48 46 44 42
East Midlands 52 43 48 44 47 44 44 46 47 45WestMidlands 49 44 45 43 41 45 42 39 44 44
Eastern 47 45 46 44 43 45 48 42 47 41London 46 46 46 43 41 42 43 41 43 45South East 45 43 46 43 46 45 44 42 43 44South West 49 47 44 46 48 45 46 48 47 47England 47 44 45 44 45 45 44 43 45 44Wales 49 46 46 46 44 45 46 47 46 46Scotland 51 43 44 43 48 46 43 43 44 46
Great Britain 48 44 45 44 45 45 44 44 45 44
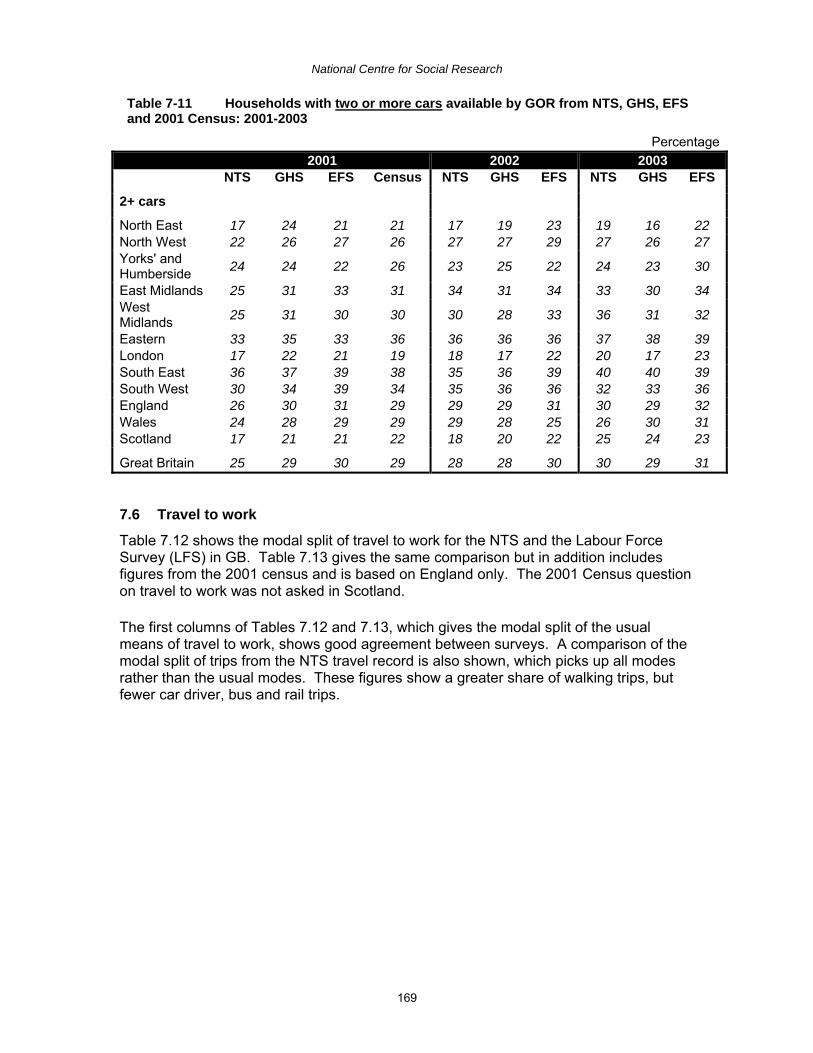
National Centre for Social Research
169
Table 7-11 Households with two or more cars available by GOR from NTS, GHS, EFSand 2001 Census: 2001-2003
Percentage2001 2002 2003
NTS GHS EFS Census NTS GHS EFS NTS GHS EFS
2+ cars
North East 17 24 21 21 17 19 23 19 16 22North West 22 26 27 26 27 27 29 27 26 27Yorks' andHumberside 24 24 22 26 23 25 22 24 23 30
East Midlands 25 31 33 31 34 31 34 33 30 34WestMidlands 25 31 30 30 30 28 33 36 31 32
Eastern 33 35 33 36 36 36 36 37 38 39London 17 22 21 19 18 17 22 20 17 23South East 36 37 39 38 35 36 39 40 40 39South West 30 34 39 34 35 36 36 32 33 36England 26 30 31 29 29 29 31 30 29 32Wales 24 28 29 29 29 28 25 26 30 31Scotland 17 21 21 22 18 20 22 25 24 23
Great Britain 25 29 30 29 28 28 30 30 29 31
7.6 Travel to work
Table 7.12 shows the modal split of travel to work for the NTS and the Labour ForceSurvey (LFS) in GB. Table 7.13 gives the same comparison but in addition includesfigures from the 2001 census and is based on England only. The 2001 Census questionon travel to work was not asked in Scotland.
The first columns of Tables 7.12 and 7.13, which gives the modal split of the usualmeans of travel to work, shows good agreement between surveys. A comparison of themodal split of trips from the NTS travel record is also shown, which picks up all modesrather than the usual modes. These figures show a greater share of walking trips, butfewer car driver, bus and rail trips.

National Centre for Social Research
170
Table 7-12 Travel to work by mode from LFS and NTS: GB 1999/01 to 2004
PercentageUsual means of travel to work (based on
individuals)Trips to work (based on
diary)LFS NTS LFS NTS LFS NTS LFS NTS NTS NTS NTS NTS200
11999/01
2002
2002
2003
2003
2004
2004
1999/01
2002
2003
2004
Walk 11 9 11 11 10 11 10 12 14 13 13 14Bicycle 3 4 3 3 3 3 3 3 3 3 3 3Car users 70 70 70 70 71 69 71 69 68 70 70 68of which:
Car/van driver .. 59 .. 61 .. 61 .. 60 57 60 60 59Car/van
passenger .. 11 .. 9 .. 8 .. 8 11 10 9 9
Motorcycle 1 1 1 1 1 1 1 1 1 1 1 1All bus andcoach 8 9 8 8 8 8 8 8 7 7 7 7
of which:Local stage bus .. .. .. .. .. .. .. .. 7 7 7 7
Non-local bus .. .. .. .. .. .. .. .. - - - -
All rail 7 7 6 6 6 6 6 7 6 5 6 6of which:
Surface rail .. 4 .. 4 .. 4 .. 4 4 3 3 4Other rail .. 0 .. 0 .. 1 .. 1 2 2 2 2
Taxi/minicab - .. - .. - .. - .. 1 1 1 1Other - - - - - 1 - 1 - - 1 1
All modes 100 100 100 100 100 100 100 100 100 100 100 100

National Centre for Social Research
171
Table 7-13 Travel to work by mode from Census, LFS and NTS: England 1999/01 to2004
PercentageUsual means of travel to work (based on individuals) Trips to work (based
on diary)Cen-us
LFS NTS
LFS NTS
LFS NTS
LFS NTS
NTS
NTS
NTS
NTS
2001
2001
1999/0
1
2002
2002
2003
2003
2004
2004
1999/0
1
2002
2003
2004
Walk 11 11 10 10 10 10 11 10 12 14 13 12 15Bicycle 3 3 4 3 4 3 3 3 3 4 3 3 3Car users 67 69 69 70 69 70 69 71 68 67 69 70 67of which:
Car/vandriver 60 .. 59 .. 61 .. 61 .. 60 57 60 60 58
Car/vanpassenger 7 .. 11 .. 8 .. 8 .. 8 10 9 9 9
Motorcycle 1 1 1 1 1 1 1 1 1 1 1 1 1All bus andcoach 8 8 8 8 8 8 7 8 8 7 6 6 7
of which:Local stage
bus .. .. .. .. .. .. .. .. .. 6 6 6 7
Non-localbus .. .. .. .. .. .. .. .. .. - - - -
All rail 8 7 6 7 7 7 7 7 7 6 6 6 6of which:
Surface rail 5 .. 4 .. 4 .. 4 .. 5 4 3 4 4Other rail 4 .. 1 .. - .. 1 .. 1 2 2 3 2
Taxi/mini-cab 1 - .. - .. - .. - .. 1 1 1 1
Other 1 - 1 - - - 1 - 1 - 1 - 1
All modes 100 100 100 100 100 100 100 100 100 100 100 100 100
7.7 Bicycle mileage
Table 7.14 and Figure 7.4 show estimates of average distance travelled from the NTSand the Road Traffic Census (RTC). Both surveys have deficiencies for estimatingbicycle travel due to relatively small sample size in the NTS and insufficient roadcoverage for bicycles on the RTC. The RTC of average distance has been consistentlyhigher than NTS figures over the last decade and each have shown different trends.

National Centre for Social Research
172
Table 7-14 Comparison of NTS bicycle mileage figures with traffic census-basedfigures
National Travel Survey Traffic censusTripsper
personper year
Averagetrip
length(miles)
Averagedistance
perperson(miles)
Percentchangeon prev-
iousyear
Bicycle(billion
km)
Totalbicyclemileage(billion)
GB Pop-ulation
(million)
Averagedistance
perperson(miles)
Percentchangeon prev-
iousyear
1985/1986 25 1.8 44 5.8 3.6 55 65
1991/1993 19 2.1 39 4.6 2.9 56 52
1996 17 2.3 38 4.1 2.5 56 451997 18 2.2 41 6 4.1 2.5 56 45 -1998 15 2.4 36 -11 4.0 2.5 57 43 -31999 17 2.5 42 17 4.1 2.5 57 45 32000 17 2.2 37 -13 4.2 2.6 57 45 22001 14 2.6 37 2 4.2 2.6 57 46 12002 15 2.2 33 -12 4.4 2.7 58 48 42003 15 2.3 34 3 4.5 2.8 58 48 22004 15 2.4 36 4 3.9 2.4 58 41 -15
Figure 7-4 Average annual bicycle distance travelled per person from NTS and roadtraffic census
7.8 Bus boardings
Table 7.15 compares bus boardings from the NTS grossed to the total population andthe survey of bus operators for London and the rest of GB. There is good agreement for
0
10
20
30
40
50
60
1996 1997 1998 1999 2000 2001 2002 2003 2004
Mile
s NTS
Traff ic census

National Centre for Social Research
173
boardings outside London. The shortfall in London reflects the fact that the NTS doesnot pick up foreign visitors.
Table 7-15 Comparison of bus boardings from the NTS and surveys of busoperators, financial years1
NTS Survey of bus operators(SBO)
Percentage differenceSBO-NTS
Bus boarding(thousands)
Bus boarding(thousands)
London Other inGB
London Other inGB
London Other inGB
1994/1995 925 3,274 1,167 3,247 26 -11995/1996 918 3,230 1,205 3,173 31 -21996/1997 897 3,109 1,242 3,103 38 -1997/1998 846 3,083 1,294 3,032 53 -21998/1999 844 2,985 1,279 2,965 51 -11999/2000 898 2,900 1,307 2,969 46 22000/2001 948 2,814 1,359 2,945 43 52001/2002 946 2,835 1,434 2,908 52 32002/2003 916 2,923 1,542 2,900 68 -12003/2004 910 2,859 1,702 2,833 87 -11 NTS data is based on three year rolling averages from 1993 to 2002.
7.9 Van mileage
In 2003, the NTS estimated annual van mileage to be 12,927. For the same period, theroad freight surveys of van activity estimate annual mileage to be 13,332.
The NTS annual mileage is estimated by respondents. The road freight estimate of vanmileage is based on two surveys: the survey of privately owned vans 2002/03; andsurvey of company owned vans 2003.
There is a reasonably good agreement for annual mileage between the NTS and roadfreight estimate of all vans, with the NTS figure being slightly lower. This is due tocompany owned vans (which solely do ineligible NTS mileage (e.g. parcel delivery vans)and tend to travel more), being excluded from the NTS.
7.10 Driving licence holding
Driving licence holding information is available from the NTS and DVLA database. Up tothe age of 69 years the DVLA database contains extraneous records, including deadpersons and emigrants, and some duplicates of licences in maiden and married name.The requirement to renew licences at the age of 70 years removes these records. Dueto the inaccuracy of the DVLA figures for those below 70 years the NTS figures are moreaccurate (see Table 7.16).
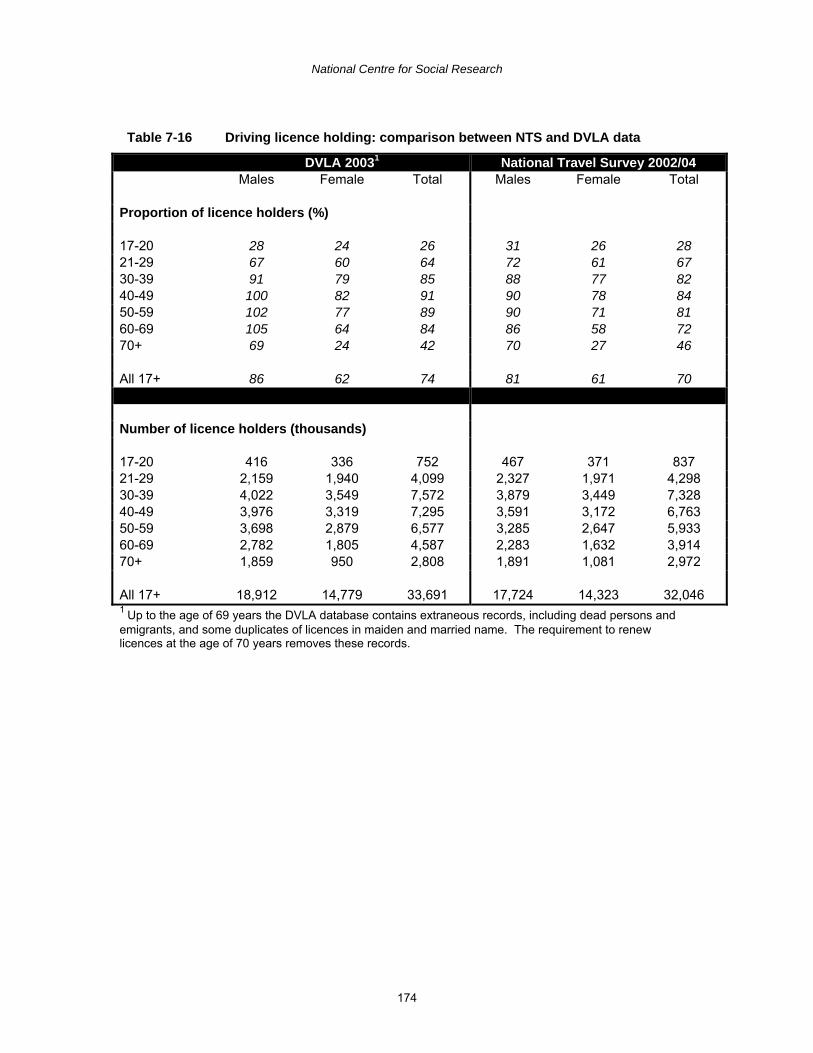
National Centre for Social Research
174
Table 7-16 Driving licence holding: comparison between NTS and DVLA data
DVLA 20031 National Travel Survey 2002/04Males Female Total Males Female Total
Proportion of licence holders (%)
17-20 28 24 26 31 26 2821-29 67 60 64 72 61 6730-39 91 79 85 88 77 8240-49 100 82 91 90 78 8450-59 102 77 89 90 71 8160-69 105 64 84 86 58 7270+ 69 24 42 70 27 46
All 17+ 86 62 74 81 61 70
Number of licence holders (thousands)
17-20 416 336 752 467 371 83721-29 2,159 1,940 4,099 2,327 1,971 4,29830-39 4,022 3,549 7,572 3,879 3,449 7,32840-49 3,976 3,319 7,295 3,591 3,172 6,76350-59 3,698 2,879 6,577 3,285 2,647 5,93360-69 2,782 1,805 4,587 2,283 1,632 3,91470+ 1,859 950 2,808 1,891 1,081 2,972
All 17+ 18,912 14,779 33,691 17,724 14,323 32,0461 Up to the age of 69 years the DVLA database contains extraneous records, including dead persons andemigrants, and some duplicates of licences in maiden and married name. The requirement to renewlicences at the age of 70 years removes these records.

National Centre for Social Research
175
8 SAMPLING ERRORS
8.1 Introduction
Sample statistics (e.g. means or proportions) are estimates of the true populationstatistics for a country or sub-region.
Estimates derived from sample surveys are subject to two types of errors: samplingerrors; and non-sampling errors. Non-sampling errors can be attributed to many sources,such as non-response bias, definitional difficulties, differing respondent interpretations,and respondent inability to recall information.
Sampling errors occur when estimates are derived from a sample rather than a censusof the population. The sample used for a particular survey is only one of a large numberof possible samples of the same size. Even if the same questionnaire, instructions andtravel diaries were used, the estimates from each sample would differ from the others.This difference, termed sampling error, occurs by chance, and its variability is measuredby the 'standard error' associated with a survey.
The extent of the sampling error can also be expressed in terms of a confidence intervalabout the sample estimate. A '95 percent confidence interval' is a measure frequentlyused to quantify this variability. It is expressed as a range of values around a centralestimate and this range is within ±1.96 standard errors of the central estimate. If thesurvey were repeated many times under the same circumstances we would expect sucha confidence interval to contain the true value 95 percent of the time. For example, thenumber of trips per person per year is estimated for 2002/2003 as 998 with a standarderror of 5.1 (see Table 8.5). Hence the 95 percent confidence interval is [998 ± 1.96 x5.1], i.e. [998 ± 10.0], or [988 to 1,008].
Survey estimates are usable only if they are sufficiently accurate for the particularpurposes for which they are used, i.e. the standard errors are sufficiently small. The sizeof a standard error depends upon three factors: the size of the sample; the surveydesign; and the variability in the population of the attribute being measured. In general,the larger the sample size the smaller the standard error of a generated statistic. Thestandard error reduces in proportion to the square root of the sample size – hence afour-fold increase in sample size causes a two-fold reduction in the standard error. Forsmall sub-samples of the population (e.g. households, individuals and vehicles) thestandard error is related to the size of the sub-sample.
Guidelines on the use of NTS data have been developed to avoid publishing misleadingresults based on very small sample sizes. For estimates of households, individuals andvehicles, samples of under 100 should not be used, while sub-samples of fewer than300 should be used cautiously. For trip and stage estimates, even more caution shouldbe exercised: sub-samples under 300 should not be used to generate estimates, whilstsub-samples of under 1,000 should be used cautiously.

National Centre for Social Research
176
8.2 Sampling error calculations and tables
Simple random sample (SRS) designs8 are costly in terms of the travelling times ofinterviewers, as the sampled addresses would be spread evenly across the whole ofGreat Britain. So the NTS, like most other household surveys, uses a multi-stage designwhich groups addresses on the sampling frame into clusters of relatively small areasbefore sample selection. These areas, known as primary sampling units (PSUs) can becovered economically as one interviewer’s quota of work. The PSUs on the NTS arepostcode sectors, or groupings of sectors. This design tends to lead to larger standarderrors than an SRS would, because the PSUs are usually more homogeneous than thepopulation as a whole. This is offset to some extent by the stratification of the samplingframe (see section 2.3).
Sampling errors can be calculated for all the estimates derived from the National TravelSurvey. However, the multi-stage design of the survey makes computation of samplingerrors more complicated than if the survey was a simple random sample. The NTSanalysis system requires two additional pieces of information for the calculation ofsampling errors: the five digit area number can be used to identify and arrange the PSUselections in the correct order; the first two digits of the area number identify the majorstrata (region). Once the PSUs have been ordered within major strata they are pairedwith the following PSU to form minor strata9.
As recommended by ONS, the software package 'STATA' has been used to calculatethe standard errors.
The formula used to calculate the standard error of an NTS estimate, r, is as follows:
)z-z( x1)-(a
a = SE(r) 2i
a
=1i2
pair∑∑
Where
r = statistic being considered,i.e. the mean or proportion,
a = no. of PSUs,y i = the sum of the statistic in PSU i,
i.e. The total if r is a mean or the number of occurrences if r is aproportionx i = sample size in PSU ix = Σ x iz i = y i - rx i,,
z = minor strata mean,
Full mathematical details can be obtained from the DfT NTS enquiry point.
8 A sample where each selection is statistically independent and made in the same way, gives eachpopulation element the same chance of selection.9 Sometimes a ‘pair’ will contain 3 PSUs if there is an odd number of PSUs within the major stratum.

National Centre for Social Research
177
The tables in this section present the standard error SE(r), the 95 percent confidenceinterval and the sample size10, or base, on which the estimate was based. It is alsouseful to have an idea of how much higher the standard error is than if a simple randomsample (SRS) had been used. The effect of the sample design on the standard error ofan estimate is called the Design Factor (DEFT) and is calculated as the complexstandard error SE(r) derived above divided by the standard error that would be achievedwith an SRS. The size of the DEFT varies from one estimate to another depending onthe relative homogeneity of households (or individuals) within PSUs with respect to theestimates being measured. DEFT increases with average PSU size. Additionally, DEFTtends to be particularly large for estimates at the trip and stage level since trips tend tobe repeated; trips are not independent events. Thus the precision of the trip and stagelevel estimates is considerably less than might be supposed from their total sample size.Note, this does not apply to estimates of trips and stages per person per year as theseare estimates at the individual level. The DEFT is also given in the tables in this section.
The table below gives details of the information shown in the Tables 8.1-8.14.
Base Estimate Standard error 95% confidencerange (+/-)
DEFT
n r SE(r) 1.96*SE(r) SE(r )/ SESRS (r )
Sample size ofhouseholds,individuals,vehicles, trips orstages.
Estimate e.g.Proportion ofhouseholds withno cars, averagetrips per personper year.
Standard error ofthe estimate r.
+/-1.96*SE(r ) isthe range ofvalues in theconfidenceinterval i.e.[r-1.96*SE(r ),r+1.96*SE(r )].
Design Factor.SESRS (r ) is thestandard errorassuming asimple randomsample.
For a quick estimate of the confidence limits for any estimate not shown below, use thesample size and estimate which best approximates to the one required. Adjust asnecessary, bearing in mind that the standard error, and hence the 95 percent confidencelimits, are proportional to 1/ √n, where n equals the size of the sample being considered.
10 For trip and stage estimates, sample sizes adjusted for short walks are shown to be consistent with NTSpublications.

National Centre for Social Research
178
Table 8-1 Percentage of households by car access by GOR and country: 2002/03
Households/ percentageBase Estimate Standard
error95%
confidencerange (+/-)
DEFT
North East 0 cars 745 38.0 2.8 5.6 1.601 car 745 43.6 1.7 3.4 0.962 cars 745 16.5 2.1 4.0 1.513+ cars 745 1.9 0.5 1.0 1.04
North West 0 cars 1,849 26.8 1.6 3.2 1.591 car 1,849 46.0 1.2 2.4 1.052 cars 1,849 24.3 1.3 2.6 1.313+ cars 1,849 2.9 0.4 0.9 1.14
Yorkshire &the Humber
0 cars 1,395 31.3 1.9 3.7 1.50
1 car 1,395 45.1 1.2 2.4 0.932 cars 1,395 20.5 1.3 2.5 1.163+ cars 1,395 3.1 0.5 1.1 1.17
East Midlands 0 cars 1,177 20.6 1.8 3.5 1.501 car 1,177 46.3 1.6 3.1 1.082 cars 1,177 28.5 1.6 3.1 1.203+ cars 1,177 4.6 0.7 1.3 1.10
West Midlands 0 cars 1,392 26.5 1.5 3.0 1.291 car 1,392 40.3 1.2 2.3 0.902 cars 1,392 27.2 1.5 3.0 1.273+ cars 1,392 6.0 0.8 1.5 1.18
East 0 cars 1,432 20.7 1.3 2.5 1.181 car 1,432 42.8 1.1 2.2 0.872 cars 1,432 30.1 1.4 2.7 1.123+ cars 1,432 6.4 0.6 1.2 0.99
London 0 cars 1,809 39.7 1.4 2.7 1.191 car 1,809 40.8 1.0 2.0 0.892 cars 1,809 17.2 1.0 2.0 1.173+ cars 1,809 2.3 0.4 0.7 1.03
South East 0 cars 2,056 18.5 1.3 2.5 1.481 car 2,056 43.8 1.2 2.4 1.142 cars 2,056 31.1 1.5 3.0 1.503+ cars 2,056 6.6 0.7 1.3 1.20
South West 0 cars 1,500 18.9 1.3 2.6 1.301 car 1,500 47.7 1.3 2.5 0.992 cars 1,500 27.5 1.3 2.6 1.133+ cars 1,500 5.8 0.7 1.3 1.09

National Centre for Social Research
179
Table 8.1 continuedHouseholds/ percentage
Base Estimate Standarderror
95%confidencerange (+/-)
DEFT
Wales 0 cars 829 27.0 2.4 4.8 1.581 car 829 45.6 2.1 4.1 1.212 cars 829 23.3 2.1 4.1 1.413+ cars 829 4.1 0.7 1.3 0.99
Scotland 0 cars 1,511 32.6 1.7 3.4 1.441 car 1,511 45.5 1.3 2.6 1.042 cars 1,511 19.4 1.3 2.6 1.293+ cars 1,511 2.6 0.4 0.8 0.98
Great Britain 0 cars 15,695 26.9 0.5 1.0 1.411 car 15,695 44.2 0.4 0.8 1.012 cars 15,695 24.5 0.4 0.9 1.283+ cars 15,695 4.3 0.2 0.4 1.10
Table 8-2 Percentage of households living within 13 minutes of an hourly or betterbus service by area type: 2002/03
Households/ percentageBase Estimate Standard
error95%
confidencerange (+/-)
DEFT
GB 15,695 89.5 0.6 1.1 2.27London Boroughs 1,809 98.2 0.3 0.6 1.07Met. Built up areas 2,286 98.5 0.3 0.6 1.14Large urban over250k 2,170 97.0 0.5 0.9 1.25
Medium urban 25to 250k 4,156 96.2 0.4 0.8 1.33
Small urban 10 to25k 1,898 92.0 0.9 1.8 1.49
Small urban 3 to10k 1,240 86.7 1.8 3.5 1.84
Rural 2,136 51.5 2.1 4.2 1.97

National Centre for Social Research
180
Table 8-3 Percentage of individuals aged 17+ with full driving licence by gender andage: 2002/03
Individuals/ percentageBase Estimate Standard
error95%
confidencerange (+/-)
DEFT
All persons 28,317 70.5 0.4 0.8 1.53
All males 13,352 81.3 0.4 0.8 1.24Males:
17-20 698 32.2 2.0 3.8 1.1021-29 1,568 74.2 1.1 2.2 1.0430-39 2,504 88.1 0.7 1.4 1.0840-49 2,432 90.8 0.6 1.2 1.0650-59 2,350 89.9 0.6 1.2 1.0060-69 1,879 86.1 0.9 1.7 1.0870+ 1,921 68.6 1.1 2.1 1.00
All Females 14,965 60.9 0.5 1.0 1.29Females:
17-20 740 27.3 1.7 3.3 1.0221-29 1,770 61.5 1.2 2.4 1.0430-39 2,819 77.1 0.9 1.7 1.1140-49 2,611 78.1 0.9 1.7 1.0850-59 2,454 71.4 1.0 1.9 1.0560-69 2,028 57.5 1.1 2.2 1.0370+ 2,543 27.5 0.9 1.8 1.05

National Centre for Social Research
181
Table 8-4 Percentage of individuals aged 17+ with full driving licence by GOR:2002/03
Individuals/ percentageBase Estimate Standard
error95%
confidencerange (+/-)
DEFT
GB 28,317 70.5 0.4 0.8 1.5
North East 1,327 58.5 2.2 4.4 1.6North West 3,350 68.1 1.5 2.9 1.8Yorkshire and theHumber 2,456 66.7 1.5 3.0 1.6
East Midlands 2,157 74.4 1.5 3.0 1.6West Midlands 2,570 70.4 1.5 3.0 1.7East of England 2,609 74.8 1.2 2.3 1.4London 3,212 63.7 1.1 2.1 1.3South East 3,776 78.5 0.9 1.9 1.4South West 2,689 77.1 1.0 2.0 1.2Wales 1,507 69.1 2.2 4.4 1.9Scotland 2,664 67.0 1.3 2.5 1.4

National Centre for Social Research
182
Table 8-5 Trips per person per year1 by main mode and purpose: 2002/03Individuals/ trips
Base Estimate Standarderror
95%confidencerange (+/-)
DEFT
Main Mode:Walk2 36,353 244 3.8 7.4 1.65Bicycle 36,353 15 0.6 1.1 1.28Car/van driver 36,353 410 4.0 7.9 1.36Car/van passenger 36,353 228 2.1 4.1 1.26Motorcycle 36,353 3 0.2 0.5 1.03Other private 36,353 8 0.4 0.7 1.25London stage bus 36,353 12 0.7 1.4 1.80Other stage bus 36,353 47 1.1 2.1 1.58Non-local bus 36,353 1 0.1 0.1 1.20LT Underground 36,353 6 0.5 0.9 1.72Surface rail 36,353 12 0.4 0.8 1.36Taxi/minicab 36,353 11 0.4 0.7 1.51Other public 36,353 2 0.3 0.6 2.42
Purpose2:Commuting 36,353 150 1.5 3.0 1.25Business 36,353 33 0.8 1.5 1.08Education 36,353 65 1.3 2.6 1.46Escort education 36,353 47 1.3 2.6 1.31Shopping 36,353 197 1.6 3.2 1.26Other escort 36,353 95 1.4 2.8 1.32Personal business 36,353 106 1.3 2.5 1.31Visiting friends atprivate home 36,353 119 1.4 2.7 1.39
Visiting friendselsewhere 36,353 45 0.8 1.6 1.35
Entertainment/public activity 36,353 46 0.8 1.5 1.41
Sport: participate 36,353 19 0.5 0.9 1.34Holiday: base 36,353 11 0.5 1.0 1.64Day trip 36,353 24 0.6 1.2 1.46Other inc. just walk 36,353 40 1.1 2.2 1.23
All trips 36,353 998 5.1 10.0 1.551 Excluding series of calls trips.2 After reweighting for short walk trips.

National Centre for Social Research
183
Table 8-6 Trips per person per year1,2 by gender and GOR: 2002/03
Individuals/ tripsBase Estimate Standard
error95%
confidencerange (+/-)
DEFT
Gender:Male 17,445 994 5.6 11.0 1.2Female 18,908 1003 6.2 12.1 1.3
GOR:North East 1,652 980 25.1 49.3 1.5North West 4,332 1027 15.9 31.2 1.6Yorkshire &Humberside 3,172 975 15.6 30.6 1.4
East Midlands 2,733 1059 17.1 33.5 1.4West Midlands 3,293 998 19.5 38.2 1.7Eastern 3,442 1005 15.6 30.5 1.5Greater London 4,220 880 14.2 27.9 1.6South East 4,854 1048 12.7 24.9 1.4South West 3,360 1050 17.5 34.4 1.6Wales 1,899 948 22.9 44.9 1.6Scotland 3,396 991 16.6 32.6 1.6
All individuals 36,353 998 5.1 10.0 1.61 Excluding series of calls trips.2 After reweighting for short walk trips.
Table 8-7 Miles per person per year1 by main mode and purpose: 2002/03
Individuals/ milesBase Estimate Standard
error95%
confidencerange (+/-)
DEFT
Main Mode:Walk2 36,353 168 2.5 4.9 1.58Bicycle 36,353 33 1.4 2.7 1.09Car/van driver 36,353 3,497 48.1 94.2 1.39Car/van passenger 36,353 2,046 30.4 59.6 1.42Motorcycle 36,353 34 3.1 6.2 1.05Other private 36,353 155 8.4 16.5 1.16London stage bus 36,353 43 2.9 5.7 1.80Other stage bus 36,353 211 5.2 10.3 1.31Non-local bus 36,353 76 7.6 14.8 1.32LT Underground 36,353 53 4.1 8.0 1.64Surface rail 36,353 396 15.0 29.4 1.17Taxi/minicab 36,353 47 2.0 3.9 1.30

National Centre for Social Research
184
Individuals/ milesBase Estimate Standard
error95%
confidencerange (+/-)
DEFT
Other public 36,353 80 9.7 19.0 1.03
Purpose2:Commuting 36,353 1,280 20.6 40.5 1.17Business 36,353 682 21.0 41.1 1.08Education 36,353 202 5.7 11.2 1.11Escort education 36,353 103 4.5 8.8 1.32Shopping 36,353 843 12.5 24.5 1.73Other escort 36,353 477 9.7 19.1 1.35Personal business 36,353 465 9.8 19.2 1.39Visiting friends atprivate home 36,353 1,097 21.8 42.8 1.49
Visiting friendselsewhere 36,353 254 7.2 14.1 1.45
Entertainment/public activity 36,353 362 10.0 19.6 1.40
Sport: participate 36,353 123 4.1 8.1 1.17Holiday: base 36,353 541 23.8 46.7 1.61Day trip 36,353 383 12.9 25.3 1.55Other inc. just walk 36,353 42 1.2 2.3 1.24
All trips 36,353 6,855 71.3 139.7 1.701 Excluding series of calls trips.2 After reweighting for short walk trips.

National Centre for Social Research
185
Table 8-8 Miles per person per year1,2 by gender and GOR: 2002/03
Individuals/ milesBase Estimate Standard
error95%
confidencerange (+/-)
DEFT
Gender:Male 17,445 7,899 90.3 177.0 1.31Female 18,908 5,891 68.7 134.6 1.41
GOR:North East 1,652 5,902 345.8 677.7 1.98North West 4,332 6,185 196.6 385.3 1.77Yorkshire &Humberside 3,172 6,428 249.5 489.1 1.87
East Midlands 2,733 7,652 323.1 633.2 1.93West Midlands 3,293 6,716 230.2 451.2 1.63Eastern 3,442 7,591 228.0 447.0 1.62Greater London 4,220 5,224 144.1 282.5 1.48South East 4,854 8,021 209.7 411.1 1.72South West 3,360 7,957 233.2 457.0 1.47Wales 1,899 6,712 325.0 636.9 1.89Scotland 3,396 6,667 223.0 437.1 1.57
All individuals 36,353 6,855 71.3 139.7 1.701 Excluding series of calls trips.2 After reweighting for short walk trips.
Table 8-9 Total time per person per year1,2: 2002/03
Individuals/ hoursBase Estimate Standard
error95%
confidencerange (+/-)
DEFT
All trips 36,353 362 2.1 4.0 1.531 Excluding series of calls trips.2 After reweighting for short walk trips.

National Centre for Social Research
186
Table 8-10 Average trip length1 by main mode and purpose: 2002/03
Trips/ milesBase Estimate Standard
error95%
confidencerange (+/-)
DEFT
Main Mode:Walk2 170,027 0.7 0.007 0.013 4.24Bicycle 10,198 2.2 0.07 0.14 2.42Car/van driver 285,540 8.5 0.08 0.16 2.45Car/van passenger 158,894 9.0 0.12 0.23 2.24Motorcycle 2,312 10.4 0.73 1.43 2.27Other private 5,813 18.6 0.93 1.82 1.90London stage bus 8,439 3.7 0.09 0.18 2.90Other stage bus 32,517 4.6 0.08 0.15 3.18Non-local bus 580 91.0 5.53 10.83 1.71LT Underground 4,431 8.6 0.27 0.53 3.73Surface rail 8,143 34.1 1.05 2.05 2.02Taxi/minicab 7,816 4.2 0.14 0.28 1.87Other public 1,449 40.8 7.17 14.06 2.26
Purpose2:Commuting 104,592 8.5 0.12 0.24 3.08Business 23,081 20.6 0.50 0.98 1.82Education 45,268 3.1 0.08 0.16 2.28Escort education 32,642 2.2 0.08 0.16 2.30Shopping 137,332 4.3 0.06 0.12 2.94Other escort 66,320 5.0 0.09 0.17 2.13Personal business 74,223 4.4 0.08 0.17 2.13Visiting friends atprivate home 83,066 9.2 0.18 0.36 2.21
Visiting friendselsewhere 31,466 5.6 0.14 0.28 1.94
Entertainment/public activity 32,120 7.9 0.19 0.37 1.95
Sport: participate 13,439 6.4 0.17 0.33 1.69Holiday: base 7,534 50.1 1.85 3.64 2.06Day trip 16,936 15.8 0.45 0.88 2.28Other inc. just walk 28,140 1.1 0.02 0.04 2.20
All trips 696,159 6.9 0.07 0.13 3.071 Excluding series of calls trips.2 After reweighting for short walk trips.
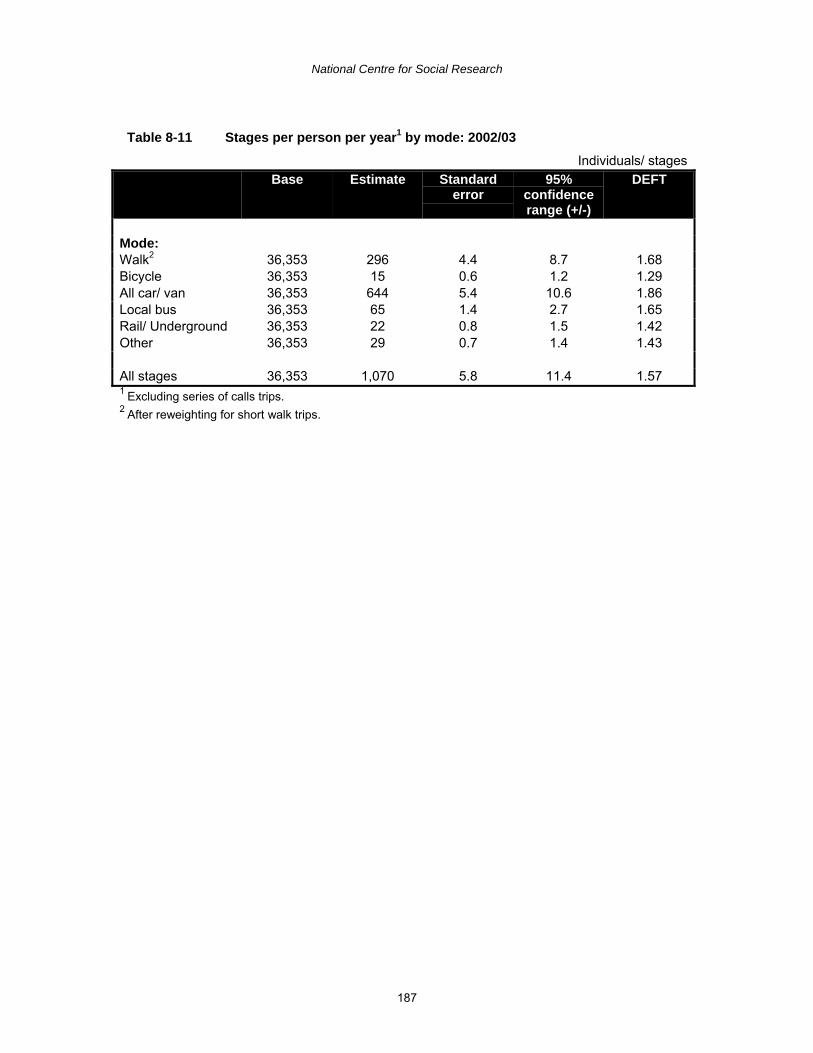
National Centre for Social Research
187
Table 8-11 Stages per person per year1 by mode: 2002/03
Individuals/ stagesBase Estimate Standard
error95%
confidencerange (+/-)
DEFT
Mode:Walk2 36,353 296 4.4 8.7 1.68Bicycle 36,353 15 0.6 1.2 1.29All car/ van 36,353 644 5.4 10.6 1.86Local bus 36,353 65 1.4 2.7 1.65Rail/ Underground 36,353 22 0.8 1.5 1.42Other 36,353 29 0.7 1.4 1.43
All stages 36,353 1,070 5.8 11.4 1.571 Excluding series of calls trips.2 After reweighting for short walk trips.

National Centre for Social Research
188
Table 8-12 Stage distance per person per year1 by mode: 2002/03
Individuals/ milesBase Estimate Standard
error95%
confidencerange (+/-)
DEFT
Mode:Walk2 36,353 191 2.7 5.3 1.60Bicycle 36,353 34 1.4 2.7 1.10All car/ van 36,353 5,562 68.4 134.0 1.79Local bus 36,353 260 5.9 11.5 1.39Rail/ Underground 36,353 417 14.6 28.7 1.19Other 36,353 391 15.2 29.8 1.16
All stages 36,353 6,855 71.3 139.7 1.701 Excluding series of calls trips.2 After reweighting for short walk trips.
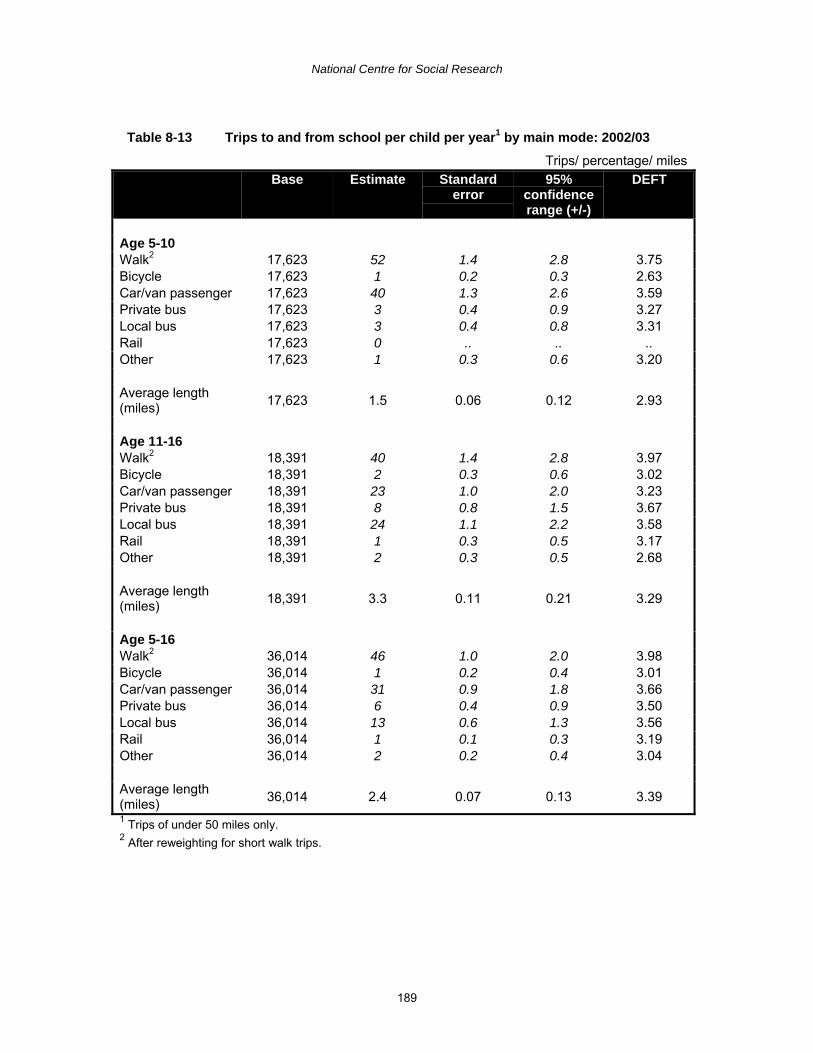
National Centre for Social Research
189
Table 8-13 Trips to and from school per child per year1 by main mode: 2002/03
Trips/ percentage/ milesBase Estimate Standard
error95%
confidencerange (+/-)
DEFT
Age 5-10Walk2 17,623 52 1.4 2.8 3.75Bicycle 17,623 1 0.2 0.3 2.63Car/van passenger 17,623 40 1.3 2.6 3.59Private bus 17,623 3 0.4 0.9 3.27Local bus 17,623 3 0.4 0.8 3.31Rail 17,623 0 .. .. ..Other 17,623 1 0.3 0.6 3.20
Average length(miles) 17,623 1.5 0.06 0.12 2.93
Age 11-16Walk2 18,391 40 1.4 2.8 3.97Bicycle 18,391 2 0.3 0.6 3.02Car/van passenger 18,391 23 1.0 2.0 3.23Private bus 18,391 8 0.8 1.5 3.67Local bus 18,391 24 1.1 2.2 3.58Rail 18,391 1 0.3 0.5 3.17Other 18,391 2 0.3 0.5 2.68
Average length(miles) 18,391 3.3 0.11 0.21 3.29
Age 5-16Walk2 36,014 46 1.0 2.0 3.98Bicycle 36,014 1 0.2 0.4 3.01Car/van passenger 36,014 31 0.9 1.8 3.66Private bus 36,014 6 0.4 0.9 3.50Local bus 36,014 13 0.6 1.3 3.56Rail 36,014 1 0.1 0.3 3.19Other 36,014 2 0.2 0.4 3.04
Average length(miles) 36,014 2.4 0.07 0.13 3.391 Trips of under 50 miles only.2 After reweighting for short walk trips.
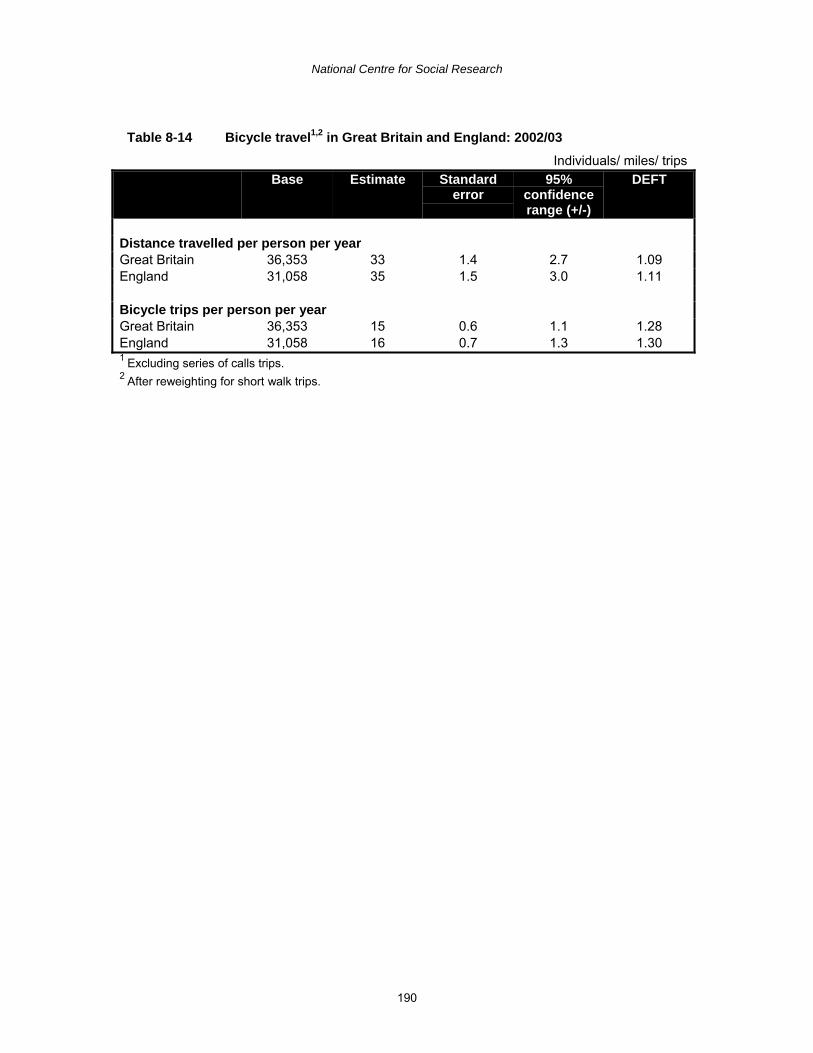
National Centre for Social Research
190
Table 8-14 Bicycle travel1,2 in Great Britain and England: 2002/03
Individuals/ miles/ tripsBase Estimate Standard
error95%
confidencerange (+/-)
DEFT
Distance travelled per person per yearGreat Britain 36,353 33 1.4 2.7 1.09England 31,058 35 1.5 3.0 1.11
Bicycle trips per person per yearGreat Britain 36,353 15 0.6 1.1 1.28England 31,058 16 0.7 1.3 1.301 Excluding series of calls trips.2 After reweighting for short walk trips.

National Centre for Social Research
191
9 PROGRESS ON IMPLEMENTING THE RECOMMENDATIONSOF THE NATIONAL STATISTICS QUALITY REVIEW
9.1 Introduction
This chapter summarises progress in implementing the recommendations made in theNational Statistics Review in 2000 that were accepted by the Department for Transport(formerly DETR). The Department's response to issues raised on the future of the NTSduring the review is summarised in Annex F of the report on the Review (DETR, 2001).Most changes were implemented for the 2002 survey, but some developments, such asweighting the data and improving imputation routines, are still ongoing. Many of thechanges that took place in 2002 are described in more detail earlier in this report. Thischapter brings them together in summary form and provides cross-references to earliersections.
9.2 Sample size and survey design
The basic format of a household survey with a seven day travel record has beenmaintained as this received strong support from users.
9.2.1 Sample size
The drawn sample size was increased from 5,796 households at the time of the Reviewto 15,048 households from 2002. This has enabled key results to be published for singleyears and in time will enable more robust data for regions, metropolitan areas and largecounties to be produced by aggregating years together. The sample comprises 684Primary Sampling Units (PSUs), each containing 22 households, which are allocated toa single interviewer (see section 2.1)
London is oversampled in order to compensate for lower response rates there. The sizeof the London boost was reviewed and Inner and Outer London were oversampled from2002 on the basis of response rates for 1995-2000 (see section 2.4).
9.2.2 Stratification
With the increase in sample size, the number of geographic units in the first stage ofstratification was increased from 20 to 40. The number of sub-divisions were increasedin London, Wales and Scotland; the former metropolitan counties became strata; andstrata in the rest of England are either single counties or groups of counties (see section2.3).
The car ownership stratifier was retained, but the socio-economic stratifier was replacedby population density. Both these are based on 1991 Census data. The Reviewrecommended that the assessment of optimal stratifiers should be repeated once the2001 Census data become available. This work has not yet been done but will becarried out in time for the 2007 survey.

National Centre for Social Research
192
9.2.3 Quasi-panel design
Half the Primary Sampling units (PSUs) in a given year's sample are retained for thenext year's sample and the other half replaced. This should have the effect of reducingthe variance of year-on-year change. Controls ensure that a household cannot beselected two years running and that PSUs cannot be selected 3 years running (seesection 2.2).
9.2.4 Sample frame
The sample frame excludes people not living in households. An experiment was carriedout on the 2001 survey to try to include students who live in halls of residence in term-time by asking parents for contact details. However, the number of students identifiedwas extremely small and it was decided that this was not a viable option.
9.3 Questionnaire topics
Annex D of the Review report sets out changes to the questions suggested by users.Questions covering the following topics were introduced in 2002 (see section 3.7.1 of the2002 Technical Report):
Household level
• Reasons for moving to current address• Deliveries to households• Rating of bus and rail frequency and reliability (even years)• Rating of condition of pavements and provision of cycle lanes (even years)
Individual level
• Difficulty getting in and out of a car• Awareness of special transport services• Travel difficulties going to work, shopping and other facilities• Travel benefits at work• Working from home• Whether children are accompanied to school or crossing roads• Walks of 20 minutes or more• Periods children play in the street (diary)
Vehicle level
• Registration number• How often car/light van is used to deliver goods in course of work• Number of delivery points• Use of vehicle outside GB (even years)

National Centre for Social Research
193
Rotated questions
To enable more questions to be added in 2002, some existing questions are now onlyasked every other year. These include:
• Walk and bus times to local facilities• Ratings of reliability and frequency, condition of pavements and cycle paths• Use of vehicle outside GB• Frequency of use of public transport and bicycles (changed back to annual from
2003)
Questions added for 2003-2005
From 2003 the payment of road user or congestion charges was collected in the travelrecord. Further questions have been added in 2004 and 2005 as follows:
• Methods used by individuals to plan journeys by private vehicle or publictransport in the last 6 months (2004)
• Availability and use of powered wheelchairs and scooters (2005)• Willingness to use online travel record or Personal Digital Assistant (PDA) (2005)• How many times the respondent left the house the previous day (2005)• Educational attainment (2005)
In 2005 the accessibility questions were changed to be in line with the Department's coreaccessibility indicators.
Questions removed in 2002 are listed in Appendix E to the 2002 Technical Report andthose removed in 2003 and 2004 are listed in Appendix [E] to this report.
9.4 Diary data
9.4.1 Geocoding
From 2002 respondents have been asked to give the full address, including postcode,for all origins and destinations of trips on day 7 of the travel record. The coding of thesedata has been very successful with over 88% being coded to the exact postcode in both2002 and 200311 (see section 4.3 for more details). The postcoded data have then beencoded to provide data for origins and destinations for the following geographic areas:county/unitary authority, ward, postcode sector, the NTS urban/rural areas, and theNational Transport Model (NTM) areas.
The geocoded data are also being used to produce road and crow fly distances of tripsfor comparison with trip lengths recorded by respondents.
11 Accuracy data for 2004 were not available at the time of writing.

National Centre for Social Research
194
9.4.2 New technologies
DfT are looking at how to exploit new technology to improve the information availablefrom the NTS. The 2005 NTS questionnaire asks whether respondents would prefer torecord their journeys in a travel record:
• on a computer or on the internet• in a small hand held computer or PDA which they would carry with them or• in the current paper Travel Diaries.
DfT have followed development in the use of personal Global Positioning System (GPS)recorders to track the routes made by respondents, as trialled by TfL.
DfT hopes to undertake research in 2006 to test the use of latest advances in GPSagainst normal recording; test recording trips on a PDA; and develop an on-line travelrecord.
9.5 Response rates
9.5.1 Incentives
Response rates for the NTS, as for other household surveys, fell during the 1990s. Anexperiment to test monetary incentives was carried out in the second half of 2002. Themain aim of the experiment was to test whether or not incentives could significantlyimprove the response rate for ‘fully co-operating’ households. Receipt of an incentivepayment by an individual was conditional on full co-operation from the whole household.Two different levels of incentive (£5 and £10) were tested against a control group whoreceived no incentive.
There was a significant and large rise in response rate using a £5 incentive, caused byprimarily a shift from partial to full responses. The additional increase in response ratewith a £10 incentive was small and not significant. Incentives were successful inencouraging under-represented groups such as large and single parent families to takepart (see section 3.11 and 3.12 in the 2002 Technical Report and Stratford et al (2003))
From June 2004 a book of stamps has been included with the advance letter as a pre-incentive.
9.6 Data processing
9.6.1 WeightingThe NTS data are currently not weighted to correct for non-response or sampleselection. Weighting the NTS is not straightforward because of the many levels used foranalysis (household, individual, vehicle, trip etc). In collaboration with NatCen, amethodology for weighting the NTS has been developed and applied to data from the2002 NTS. This provides two sets of weights. One set, referred to as the 'diary weights',is for the sample of fully co-operating households where all members completed a travelrecord and the data are used for analysing trips. The other set, the 'interview weights',

National Centre for Social Research
195
comprises all households which completed an interview, and therefore as well as fullyco-operating households it includes 'partially responding' households, where not allindividuals completed a travel record. This sample is only used for analyses that do notrequire travel record trip data.
The weighting for both sets adjusts for household selection, household non-participation,and removal of households with missing individual interviews. The weighting for the fullyco-operating sample additionally allows for removal of the interview sample householdsthat were not fully responding. Calibration weighting was carried out to adjust theweights so that the age/sex and GOR distributions of the respondents matchedpopulation estimates. For the fully co-operating sample weights were also adjusted sothat weighted estimates for key survey measures matched the weighted estimates forthe sample of all households completing an interview. Weights were also produced toadjust for drop-off during the week of the travel record and for the short-fall in reportinglong distance journeys. The final report on the methodology developed for the weightingproject was released on the DfT website in September 2005 (Pickering et al, 2005)together with a report comparing weighted and unweighted data for 2002. The intentionis to weight data for 1995-2001 and 2003-04 and publish trends for key variables basedon weighted data, in Spring 2006. Data for 2005 will be published on a weighted basisin Summer 2006.
9.6.2 Non-response survey
A non-response survey was introduced in 2002 to collect information about thedemographic characteristics and travel behaviour of household members (see section3.14). Some households that completed the non-response form subsequentlyparticipated in the NTS survey and analyses suggest that there were no substantialdifferences between participating households and non-participating households thatcompleted a non-response form. Use of data from the non-response survey forweighting was considered but rejected because of inconsistencies between informationfrom the non-response survey and the main NTS survey. In 2005 questions have beenadded to the main NTS survey to allow direct comparison of key measures with the non-response survey.
9.6.3 Partially responding households
Data from partially responding households are currently excluded from NTS analysis but,as indicated in the section on weighting above, these data have been incorporated intothe weighting strategy for the NTS.
9.6.4 Census-linked Study of survey non-response (CLS)
The NTS was included in the study by ONS to link data from households selected forvarious surveys with data from the 2001 Census (Freeth et al, 2005). Use of the CLS togenerate weights for the NTS was considered but rejected on the grounds that there wasno guarantee that a correction weight developed in 2001 would be appropriate forsubsequent years.

National Centre for Social Research
196
9.6.5 Imputation
The Review recommended that methods to impute missing data items be reviewed. DfThave examined all the imputation routines and identified those that needed changing orupdating. The most important changes have been made and work is ongoing on the rest.
9.6.6 Area classifications
The accuracy of the classification of data to urban/rural areas has been considerablyimproved by moving to a GIS based system, updating settlement areas using data fromthe 2001 Census and by using the classification at household rather than PrimarySampling Unit level.
Data from 2002 can also be analysed by the ONS Area Classification, the newurban/rural classification, and the 2004 Index of Multiple Deprivation.
9.6.7 Rolling three year dataThe Review suggested that more data should be presented on a three year rollingaverage basis. This was done in the 2002 and 2004 NTS Statistical Bulletins and in the2005 edition of Focus on Personal Travel.
9.6.8 Tours databaseThe Review stated that a 'tours' database should be developed by linking series of tripsstarting and finishing at home. DfT plan to do this when resources are available.
9.7 Data Access
Currently the NTS branch meets requests from users for tables of data and supplies datain SPSS format to the UK Data Archive or direct to users on CD-ROM. DfT recognisethat users would like to be able to extract NTS tables from the web. A pilot system to runtables via a web-based interface was developed but proved to be unreliable. DfT plan todevelop a better web-based interface when resources permit. Web-based access raisesissues of small sample sizes in terms of robustness of data and disclosure issues.
9.8 Other issues
9.8.1 Local authority boosts
For 2003 onwards local authorities have been able to buy additional samples in theirarea. There were two boosts in 2003: one covered the area of all the Essex districtsplus Southend-on-Sea Unitary Authority and the other covered the Thames Gatewayarea in Essex. It is unlikely that further boosts will be carried out because of the highcost, and the lack of sufficient resource in DfT to manage boosts and produce extradatabases. No other areas have requested boosts. For areas which are strata it will bepossible to provide data by aggregating over several years.

National Centre for Social Research
197
9.9 Other changes from 2002 not covered in the Review
9.9.1 Registration number
From 2002 respondents were asked to give the registration number of all householdvehicles. This enabled the more technical information about vehicles (e.g. engine size,type of fuel, taxation class) to be obtained through the DVLA database of vehicles with aview to improving data quality and reducing the burden on respondents. See section4.4.4 for more details on registration number checking.
9.9.2 Coding
From 2002 the travel record data was coded centrally rather than by interviewers (seesections 4.1 and 4.2) and considerable efforts were made by the new contractor to clarifydefinitions to ensure greater consistency. This may have led to some discontinuitiesbetween data for 2002 onwards with data for earlier years.
9.9.3 Distance checksPrior to 2002, DfT applied inter-county distance checks to the data after delivery, andimplausible cases were fed back to the contractor. From 2002 this procedure wasbrought forward and the checks were applied during editing by NatCen (see section4.4.6).

National Centre for Social Research
199
REPORTS AND PAPERS ON THE NATIONAL TRAVEL SURVEYWebsite address for publications: www.dft.gov.uk/transtat/personaltravelEnquiries to: [email protected] or 020 7944 3097
Reports of National Travel Survey results
National Travel Survey 1985/86 Report, HMSO 1988.Reports on the continuous survey (publication date in brackets):National Travel Survey 1989/91 (1993), 1989/91 (1993), 1991/93 (1994), 1992/94(1995), 1993/95 (1996), 1994/96 (1997) (all HMSO).National Travel Survey Bulletins: 1996/98 (DETR, 1999), 1997/99 (DETR, 2000),1998/2000 (DTLR, 2001), 1999/2001 (DfT, 2002), 2002 (DfT, 2004), 2003 (DfT, 2004),2004 (DfT, 2005)Focus on Personal Travel (TSO) 1998, 2001, 2005.Articles: each edition of Transport Trends from 1998 to 2001 (TSO) has articles onaspects of personal travel, using NTS data.Factsheets: factsheets on 14 different NTS topics are available from the website or inhard copy (see contact details above).
National Travel Survey Technical Reports
Butcher, B, National Travel Survey Technical Report 1985/6, Office of PopulationCensuses and SurveysWilmot, A (1993), National Travel Survey Technical Report, July 1988 - December 1991,Office of Population Censuses and SurveysWilmot, A (1994), National Travel Survey Technical Report 1992, Office of PopulationCensuses and SurveysWilmot A (1995), National Travel Survey Technical Report 1994, Office of PopulationCensuses and SurveysWilmot A, (1996), National Travel Survey Technical Report 1995, Office for NationalStatistics,Freeth S (1997), National Travel Survey Technical Report 1996, Office for NationalStatisticsFreeth, S, Barton, J, Noble,B, Sullivan, B & Williams, D (1999), National Travel SurveyTechnical Report 1997, Office for National StatisticsFreeth, S, National Travel Survey Technical Report 1998, Office for National Statistics,(1999).Kershaw, A (2000), National Travel Survey Technical Report 1999, Office for NationalStatisticsKershaw, A, Barton, J, Noble, B, Williams, D, & Hird, D (2001), National Travel SurveyTechnical Report 2000, Office for National StatisticsStratford, N, Simmonds, N, Nicolaas, G, Costigan, P (2003), National Travel Survey2002 Technical Report. National Centre for Social Research

National Centre for Social Research
200
Other reports
Office for National Statistics. Report on the pilot work for 1985/6 survey.Dodd, T, ‘The use of reinterviewing on the National Travel Survey pilot’ in SSD SurveyMethodology Bulletin No. 17, June 1985.Butcher, R and Eldridge, J (1990), The use of diaries in data collection, The Statistician39, 25–41.Bushnell, D (1994), ‘The National Travel Survey Report of the 1991 Census-linked studyof survey non-respondents’, UnpublishedBushnell, D (1995), Weighting the National Travel Survey to compensate for non-response, An investigation into Census-based weighting schemes. UnpublishedWilmot, A & Bateson, B (1995). ‘Computer Assisted Personal Interviewing Techniqueson the National Travel Survey’ in SSD Survey Methodology Bulletin No. 37.Barton, J (1996), ‘Investigating stratification options for the National Travel Survey’,UnpublishedFreeth, S (1997), Using a range of methods to collect travel data, the experience of theBritish National Travel Survey. Paper for the International Conference on TransportSurvey Quality and Innovation, Grainau, GermanyJackson, B (1998), ‘National Travel Survey 1997 Validation of Cycle Journeys’,UnpublishedHird, D (2000), Partially responding households in the National Travel Survey,Unpublished.DETR (2001), Review of the National Travel Survey, National Statistics Review QualitySeries Report No 3, DETR, LondonNoble, B. (2001). Using simple time use surveys to investigate travel. Paper for theInternational Conference on Transport Survey Quality and Innovation, Kruger NationalPark, South AfricaDepartment for Transport, 'National Travel Survey: Comparison of weighted andunweighted data for 2002'Gleave, S, D (2003), The use of GPS to improve travel data, Report prepared for theDTLR New Horizons ProgrammeSimmonds, N. and N. Stratford, G. Nicolaas (2003) National Travel Survey 2002: Reporton Incentives Experiment. London: National Centre for Social ResearchSalathiel, D, & Nicolaas, G (2004). The effects of monetary incentives on response ratesand sample bias, Paper for the International Conference on Transport Survey Qualityand Innovation, Costa Rica.Freeth,S. and P.Sowman, C. Greenwood (2005) The National Travel Survey: Report ofthe2001 Census-linked study of survey non-response, UnpublishedPickering, K, Tipping, S, & S, Scholes, 'Weighting the National Travel Survey:Methodology Final Report'

National Centre for Social Research
201
APPENDIX A QUESTIONNAIRE DOCUMENTATION 2003 AND 2004
Introduction to Questionnaire Documentation: Changes for 2003 and 2004
This questionnaire documentation for the survey years 2003 and 2004 is based on thedocumentation for 2002. Changes within 2002 and from 2002 for 2003 and then for 2004are in underlined text and are marked in the documentation with the following comments:
Changes for 2002
(QUESTION DELETED MID 2002 ONWARDS)
Changes for 2003
(EXTRA INT. INSTRUCTION ADDED 2003 ONWARDS)
(INT. INSTRUCTION DELETED 2003 ONWARDS)
(PRECODE NUMBERING CHANGED 2003 ONWARDS TO:)
(HELP <F9>)(HELPNOTE ADDED 2003 ONWARDS)
(PRECODES CHANGED 2003 ONWARDS TO:)
(CHANGED 2003 ONWARDS TO:)
(PRECODES CHANGED 2003 ONLY TO:)
(EXTRA INT. INSTRUCTION ADDED 2003 ONLY)
(CHANGED 2003 ONLY TO:)
(QUESTION ADDED 2003 ONWARDS:)
(QUESTION AND ROUTING CHANGED 2003 ONWARDS TO:)
(ROUTING CHANGED 2003 ONWARDS TO:)
(QUESTION AND ROUTING CHANGED 2003 ONLY TO:)
(ROUTING CHANGED 2003 ONLY TO:)
Changes for 2004
(EXTRA INT. INSTRUCTION ADDED 2004 ONWARDS)
(INT. INSTRUCTION DELETED 2004 ONWARDS)
(PRECODE NUMBERING CHANGED 2004 ONWARDS TO:)
(HELP <F9>)(HELPNOTE ADDED 2004 ONWARDS)
(PRECODES CHANGED 2004 ONWARDS TO:)
National Centre for Social Research
202
(CHANGED 2004 ONWARDS TO:)
(EXTRA INT. INSTRUCTION ADDED 2004 ONLY)
(QUESTION ADDED 2004 ONWARDS:)
(QUESTION AND ROUTING CHANGED 2004 ONWARDS TO:)
(QUESTION DELETED 2004 ONWARDS)
(ROUTING CHANGED 2004 ONWARDS TO:)
Introduction to Questionnaire Documentation: Block routing
The NTS questionnaire is in distinct sections, such as the household questionnaire,individual questionnaire, the vehicle questionnaire, pick-up questionnaires and Adminblock. In the Blaise programme used to create the CAPI, the whole programme iscreated out of blocks that tend to hold related questions on a particular topic or theme.
The block routing shown in the text boxes below displays the rules governing eachquestion block as a whole as opposed to the rules between individual questions. Eachtext box contains the rules governing the asking of the questions below it (as thesequestions fit into the block mentioned in the text box).
If no routing is noted in the text box, assume there is no routing between the blocksreliant on specific respondent attributes (such as age) or responses to certain questions.
Therefore within the:
• Household questionnaire – if there is no routing noted, then assume that thequestions within a block will either be asked of the household reference person ortheir partner, or in exceptional occasions another adult (person aged 16 and over)
• Individual questionnaire – if there is no routing noted, then assume that thequestions will be asked of every individual respondent (either through face to face orby proxy interviewing)
• Vehicle questionnaire – if there is no routing noted, then assume the questions willbe asked of the respondent who best knows about the vehicle (normally the maindriver but not necessarily so)
• Pick-up interviews – if there is no routing noted, then assume the questions will beasked of the individual respondents available at the time of pick-up with the vehiclequestions (vehicle pick up interview) being asked of the respondent who best knowsabout the vehicle (normally the main driver but not necessarily so as they might beunavailable at pick up)
Please note that no block routing is provided for the Admin block or the Diary EntrySystem. Also note that the block routing is not exhaustive as there are other blocks

National Centre for Social Research
203
contained within the NTS programme that do not contain any of the questions listedbelow (so they are not listed).
Wthin each text box below, the specific question block and its module name within Blaise(the CAPI software) are displayed at the top of the box in bold text separated by aforward slash. Sub-block names are displayed directly below (and to the right) in boldtext as well. Below this are the rules governing each block. For example:
TChTrav / QTCHTRAV.NTS]• BchTrav
Questions asked if :Any individual household member is aged 7-13, asked for each member in turn,answered by HRP or another respondentaged 16 or over
IF HRP has child/ren THENSchInt"I'd now like to ask a few questions about your/the ^children's journey to and from school."1. "Press 1 and <Enter> to continue."
Etc.
This is the name of the block / The name of themodule within Blaise that holds the block
This is the sub-block
These are the rules governing the block orsub block
These are the questionswithin the block or subblock (until the next textbox is reached)

National Centre for Social Research
204
Household Questionnaire
BID/ QID.NTS
Area"AREA NUMBER.JUST PRESS <Enter>."
Address"ADDRESS NUMBER.@IJUST PRESS <Enter>@I."
Hhold"HOUSEHOLD NUMBER.JUST PRESS <Enter>."
BSignin/ QSIGNIN.NTS
RECORD ALWAYSStatusQ"What is the status of this interview? INTERVIEWER: IF YOU ARE NOWSTARTING THE PICK-UPINTERVIEW, CHANGE THE CODE TO '2' THENPRESS <ENTER> AND <END> TOGO TO THE FIRST PICK UP QUESTION. YOU CANNOT GO BACK TO CODE'1' ONCE YOU HAVE CODED '2' "1. "Placement interview"2. "Pick-up interview"
RECORD ALWAYSStartDat"DATE PLACEMENT INTERVIEWWITH THIS HOUSEHOLD WASSTARTEDPRESS ENTER TO CONFIRM DATE"
RECORD ALWAYSFirstQ"INTERVIEWER: You are in thequestionnaire for: ^SerFillIS THIS:
- TO UPDATE ADMIN DETAILSPRESS <CTRL + ENTER>"1. "the first time you've opened thisquestionnaire"2. "or the second or later time?"5. "EMERGENCY CODE IFCOMPUTER'S DATE IS WRONG ATLATER CHECK"
RECORD ALWAYSTravDate"INTERVIEWER: ENTER STARTDATE OF TRAVEL WEEK FOR THISHOUSEHOLD."
BNames/ QNAMES.HAR BBNames
ASK ALWAYSName"RECORD NAME/IDENTIFIER FOREACH MEMBER OF THEHOUSEHOLD. (HELP <F9>) WHEN ALL HOUSEHOLDMEMBERS HAVE BEEN ENTERED,PRESS PgDn "
THComp / QTHCOMP.NTS
ASK ALWAYSSex"^DMNAMES] INTERVIEWER: CODE SEX OFRESPONDENT"1. "Male"2. "Female"
ASK ALWAYSBirth"^DMNAMES[LTLooper] What is your date of birth?FOR DAY NOT GIVEN....ENTER 15FOR DAY.FOR MONTH NOT GIVEN....ENTER 6FOR MONTHENTER FULL YEAR, eg. 9/11/1952RATHER THAN 52 (EXTRA INT.INSTRUCTION ADDED 2003ONWARDS)"
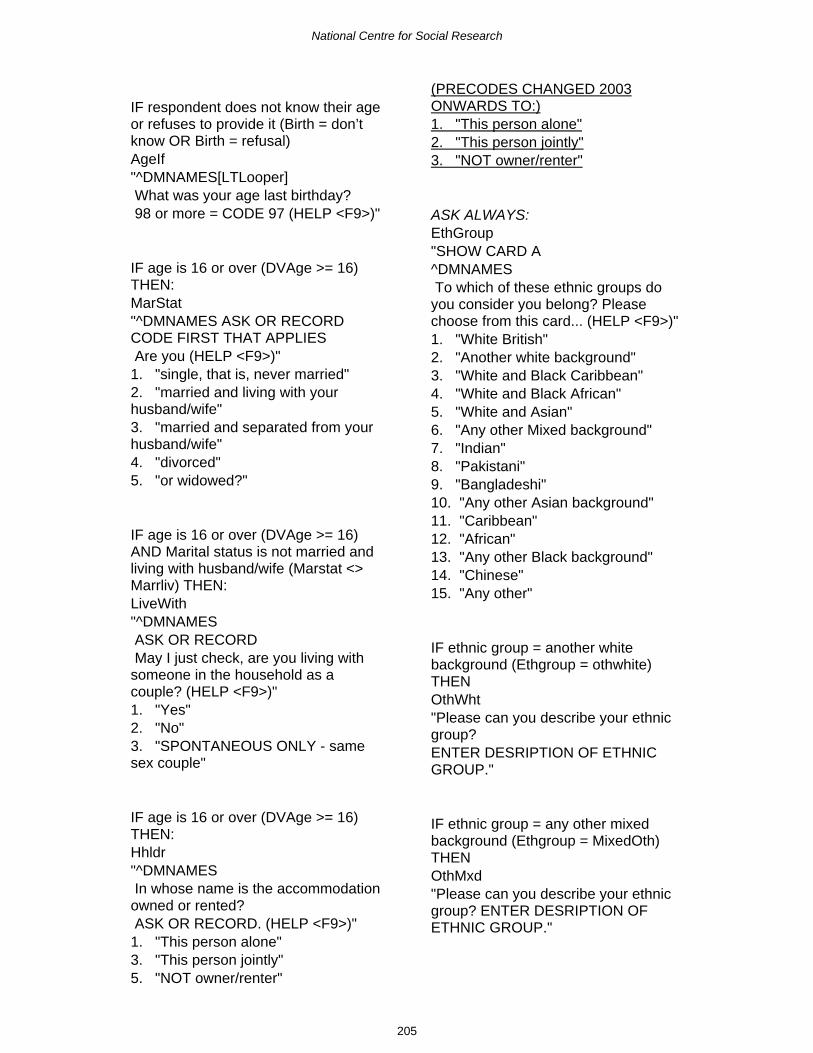
National Centre for Social Research
205
IF respondent does not know their ageor refuses to provide it (Birth = don’tknow OR Birth = refusal)AgeIf"^DMNAMES[LTLooper] What was your age last birthday? 98 or more = CODE 97 (HELP <F9>)"
IF age is 16 or over (DVAge >= 16)THEN:MarStat"^DMNAMES ASK OR RECORDCODE FIRST THAT APPLIES Are you (HELP <F9>)"1. "single, that is, never married"2. "married and living with yourhusband/wife"3. "married and separated from yourhusband/wife"4. "divorced"5. "or widowed?"
IF age is 16 or over (DVAge >= 16)AND Marital status is not married andliving with husband/wife (Marstat <>Marrliv) THEN:LiveWith"^DMNAMES ASK OR RECORD May I just check, are you living withsomeone in the household as acouple? (HELP <F9>)"1. "Yes"2. "No"3. "SPONTANEOUS ONLY - samesex couple"
IF age is 16 or over (DVAge >= 16)THEN:Hhldr"^DMNAMES In whose name is the accommodationowned or rented? ASK OR RECORD. (HELP <F9>)"1. "This person alone"3. "This person jointly"5. "NOT owner/renter"
(PRECODES CHANGED 2003ONWARDS TO:)1. "This person alone"2. "This person jointly"3. "NOT owner/renter"
ASK ALWAYS:EthGroup"SHOW CARD A^DMNAMES To which of these ethnic groups doyou consider you belong? Pleasechoose from this card... (HELP <F9>)"1. "White British"2. "Another white background"3. "White and Black Caribbean"4. "White and Black African"5. "White and Asian"6. "Any other Mixed background"7. "Indian"8. "Pakistani"9. "Bangladeshi"10. "Any other Asian background"11. "Caribbean"12. "African"13. "Any other Black background"14. "Chinese"15. "Any other"
IF ethnic group = another whitebackground (Ethgroup = othwhite)THENOthWht"Please can you describe your ethnicgroup?ENTER DESRIPTION OF ETHNICGROUP."
IF ethnic group = any other mixedbackground (Ethgroup = MixedOth)THENOthMxd"Please can you describe your ethnicgroup? ENTER DESRIPTION OFETHNIC GROUP."

National Centre for Social Research
206
IF ethnic group = any other asianbackground (Ethgroup = OthAs) THENOthAsn"Please can you describe your ethnicgroup?ENTER DESRIPTION OF ETHNICGROUP."
IF ethnic group = any other blackbackground (Ethgroup = OtherBl)THENOthBlk"Please can you describe your ethnicgroup?ENTER DESRIPTION OF ETHNICGROUP."
IF ethnic group = any other (Ethgroup= AnyOth) THENOthETh"Please can you describe your ethnicgroup?ENTER DESRIPTION OF ETHNICGROUP."
BHRP / QHRP.NTS
IF the accommodation is jointly ownedor rented/there is more than onehouseholder (QTHComp.NumHHldr >1) THENHiHNum"You have told me that ^HhldrTxtjointly own or rent the accommodation.Of these, who has the highest income(from earnings, benefits, pensions andany other sources)? (HELP <F9>)IF THEY HAVE THE SAME INCOME,CODE 11INTERVIEWER: THESE ARE THEJOINT HOUSEHOLDERS (1) ^HhldrNme[1]^s^s^HhldrAge[1]^HhldrDOB[1] (2) ^HhldrNme[2]^s^s^HhldrAge[2]^HhldrDOB[2] (3) ^HhldrNme[3]^s^s^HhldrAge[3]^HhldrDOB[3] (4) ^HhldrNme[4]^s^s^HhldrAge[4]^HhldrDOB[4]
(5) ^HhldrNme[5]^s^s^HhldrAge[5]^HhldrDOB[5] (6) ^HhldrNme[6]^s^s^HhldrAge[6]^HhldrDOB[6] (7) ^HhldrNme[7]^s^s^HhldrAge[7]^HhldrDOB[7] (8) ^HhldrNme[8]^s^s^HhldrAge[8]^HhldrDOB[8] (9) ^HhldrNme[9]^s^s^HhldrAge[9]^HhldrDOB[9] (10)^HhldrNme[10]^s^s^HhldrAge[10]^HhldrDOB[10]^s^sENTER PERSON NUMBER"
IF the accommodation is jointly ownedor rented/there is more than onehouseholder (QTHComp.NumHHldr >1) AND joint householders have thesame income (HiHNum = 11) THENJntEldA"ENTER PERSON NUMBER OF THEELDEST JOINT HOUSEHOLDERFROM THOSE WITH THE SAMEHIGHEST INCOMEASK OR RECORD (1) ^HhldrNme[1]^s^s^HhldrAge[1]^HhldrDOB[1] (2) ^HhldrNme[2]^s^s^HhldrAge[2]^HhldrDOB[2] (3) ^HhldrNme[3]^s^s^HhldrAge[3]^HhldrDOB[3] (4) ^HhldrNme[4]^s^s^HhldrAge[4]^HhldrDOB[4] (5) ^HhldrNme[5]^s^s^HhldrAge[5]^HhldrDOB[5] (6) ^HhldrNme[6]^s^s^HhldrAge[6]^HhldrDOB[6] (7) ^HhldrNme[7]^s^s^HhldrAge[7]^HhldrDOB[7] (8) ^HhldrNme[8]^s^s^HhldrAge[8]^HhldrDOB[8] (9) ^HhldrNme[9]^s^s^HhldrAge[9]^HhldrDOB[9] (10)^HhldrNme[10]^s^s^HhldrAge[10]^HhldrDOB[10]^s^s"
IF the accommodation is jointly ownedor rented/there is more than onehouseholder (QTHComp.NumHHldr >1) AND the highest income of jointhouseholders is refused or not known

National Centre for Social Research
207
(HiHNum = Don’t Know OR HiHNum =Refusal) THENJntEldB"ENTER PERSON NUMBER OF THEELDEST JOINT HOUSEHOLDER ASK OR RECORD (1) ^HhldrNme[1]^s^s^HhldrAge[1]^HhldrDOB[1] (2) ^HhldrNme[2]^s^s^HhldrAge[2]^HhldrDOB[2] (3) ^HhldrNme[3]^s^s^HhldrAge[3]^HhldrDOB[3] (4) ^HhldrNme[4]^s^s^HhldrAge[4]^HhldrDOB[4] (5) ^HhldrNme[5]^s^s^HhldrAge[5]^HhldrDOB[5] (6) ^HhldrNme[6]^s^s^HhldrAge[6]^HhldrDOB[6] (7) ^HhldrNme[7]^s^s^HhldrAge[7]^HhldrDOB[7] (8) ^HhldrNme[8]^s^s^HhldrAge[8]^HhldrDOB[8] (9) ^HhldrNme[9]^s^s^HhldrAge[9]^HhldrDOB[9] (10)^HhldrNme[10]^s^s^HhldrAge[10]^HhldrDOB[10]^s^s"
THRels / QTHRELS.HARBHRels
ASK ALWAYSR"CODE RELATIONSHIP OF EACHHOUSEHOLD MEMBER TO THEOTHERS - ^NameRels IS^NameR[LHRels1]'S... @|(HLP<F9>)"1. "Spouse"2. "Cohabitee"3. "Son/daughter (incl. adopted)"4. "Step-son/daughter"5. "Foster child"6. "Son-in-law/daughter-in-law"7. "Parent/guardian"8. "Step-parent"9. "Foster parent"10. "Parent-in-law"11. "Brother/sister (incl. adopted)"12. "Step-brother/sister"13. "Foster brother/sister"14. "Brother/sister-in-law"15. "Grand-child"
16. "Grand-parent"17. "Other relative"18. "Other non-relative"
BSPout / QSPOUT.NTS
IF respondent has said they aremarried and living with spouse butthey are without a spouse in thehousehold ((QTHComp.QHComp{Loop1}.MarStat = MarrLiv AND(Spouses [Loop1] = 0)) THENSpOut"INTERVIEWER:You've recorded@I^DMNAMES[Loop1]@I as 'Married& living with spouse', but without aspouse in the household. PLEASECHECK THIS. If spouse is away for sixmonths or more, press 1 and enter tocontinue.BUT IF NOT (eg if separated), ENTER2 AND AMEND HOUSEHOLD GRID."1. "Married, spouse not in household"2. "Other - AMEND HOUSEHOLDGRID"No Don't Know, No Refusal
BAccom / QACCOM.NTS
RECORD ALWAYSAccom"INTERVIEWER CODE: IS THEHOUSEHOLD'S ACCOMMODATION: N.B. MUST BE SPACE USED BYHOUSEHOLD (HELP <F9>)"1. "a house or bungalow"2. "a flat or maisonette"3. "a room/rooms"4. "...other?"
IF Household accommodation is ahouse or bungalow (Accom = Hse)THENHseType"INTERVIEWER CODE: IS THEHOUSE/BUNGALOW: (HELP <F9>)"1. "detached"2. "semi-detached"3. "or terraced/end of terrace?"

National Centre for Social Research
208
IF Household accommodation is a flator maisonette (Accom = Flat) THENFltTyp"INTERVIEWER CODE: IS THEFLAT/MAISONETTE:"1. "a purpose-built block"2. "a converted house/some otherkind of building?"
IF Household accommodation isanother type (Accom = Other) THENAccOth"INTERVIEWER CODE: IS THEACCOMMODATION A:"1. "caravan, mobile home orhouseboat"2. "or some other kind ofaccommodation?"
BTenure / QTENURE.NTS
ASK ALWAYSTen1"SHOW CARD B In which of these ways do you occupythis accommodation?MAKE SURE ANSWER APPLIES TO^DMNAMES[QHRP.DVHRPNum] -THE HRP (HELP <F9>)"1. "Own outright"2. "Buying it with the help of amortgage or loan"3. "Pay part rent and part mortgage(shared ownership)"4. "Rent it""Live here rent-free (including rent-freein relative's/friend'sproperty; excluding squatting)"6. "Squatting"
BResLen / QRESLen.NTS
ASK ALWAYSHLong"RECORDED FOR HOUSEHOLDREFERENCE PERSON(^LDMIntName) ONLY
How long have you (has^LDMIntName) lived at this address?... (HELP <F9>)"1. "Less than 12 months"2. "12 months but less than 2 years"3. "2 years but less than 3 years"4. "3 years but less than 5 years"5. "5 years but less than 10 years"6. "10 years but less than 20 years"7. "20 years or longer"
IF HRP has lived at address for lessthan three years (Hlong IN [L12M,M12L2Y, M2YL3Y]) THENYMove"SHOW CARD C1Here are some reasons why peoplemove. Can you tell me whyyou/^LDMIntName moved to thisaddress?PROBE: Any other reasons?CODE ALL THAT APPLY(HELP <F9>)(HELPNOTE ADDED2003 ONWARDS)"1. "To move to a betterneighbourhood/more pleasant area"2. "Change of employment"3. "To be closer to work/school"4. "To be closer to family/friends"5. "To be closer to shops/leisurefacilities"6. "Better public transport"7. "Wanted larger or better house/flat"8. "Wanted smaller or cheaperhouse/flat"9. "Moved in with or split up with apartner"10. "Wanted to buy"11. "Wanted own home/to liveindependently"97. "Other reason (SPECIFY)"
IF respondent moved for other reason(Other IN Ymove) THENOthYMove"Please specify other reasons.TEXT SHOULD BE NO MORE THAN60 CHARACTERS"

National Centre for Social Research
209
IF HRP gave more than one reason formoving (CARDINAL (Ymove) > 1)THENYMoveM"SHOW CARD C1 AGAINAnd what was the main reasonyou/^LDMIntName moved?CODE ONE ONLY"1. "To move to a betterneighbourhood/more pleasant area"2. "Change of employment"3. "To be closer to work/school"4. "To be closer to family/friends"5. "To be closer to shops/leisurefacilities"6. "Better public transport"7. "Wanted larger or better house/flat"8. "Wanted smaller or cheaperhouse/flat"9. "Moved in with or split up with apartner"10. "Wanted to buy"11. "Wanted own home/to liveindependently"97. "Other reason (SPECIFY)"
IF HRP moved for other reason(YmoveM= other) THENOthYMovM"Please specify other main reason.TEXT SHOULD BE NO MORE THAN60 CHARACTERS"
IF HRP has lived at address for lessthan three years (Hlong IN [L12M,M12L2Y, M2YL3Y]) THENPTImp"SHOW CARD C2When you/^LDMIntName werechoosing this home, how importantwas the availability of public transportin the local area? "1. "Very important"2. "Fairly important"3. "Not very important"4. "Not at all important"
IF HRP has lived at address for lessthan one year (Hlong = L12M) THENOldAdd"Is your (is ^LDMIntName)'s oldaddress more than one mile from hereor less than that?"1. "More than one mile"2. "One mile or less"
BLocServ / QLOCSERV.NTS
ASK ALWAYSServIntr"INTERVIEWER: ANYONE IN THEHOUSEHOLD WHO KNOWS THEANSWERS CAN BE ASKED THESEQUESTIONS.I would like to ask you a few questionsabout local bus and train services.First I would like to ask about yourlocal bus service..."1. "Press <Enter> to continue."
ASK ALWAYSNearBus"About how long would it take (me) towalk from here to the nearest bus stopor place where I could get on a bus? Iam interested in the nearest one evenif it isn't the main one you use. (HELP<F9>)RECORD TO NEAREST MINUTEIF RESPONDENT DOES NOTKNOW, ENTER <CTRL-K> ANDENCOURAGE ESTIMATE AT NEXTQUESTION"
IF the time it would take to walk to thenearest bus stop is not known(NearBus = DK) THENNearBand"SHOW CARD D1Taking your answer from this card,approximately how long would it take(me) (to walk to your nearest busstop)? INTERVIEWER: IF DK ENCOURAGEESTIMATE."1. "6 minutes or less"

National Centre for Social Research
210
2. "7-13 minutes"3. "14-26 minutes"4. "27-43 minutes"5. "44 minutes or longer"
ASK ALWAYSGetBus"How frequent are the buses from thatbus stop during the day? Is there ...READ OUT ...IF 'VARIES' TAKE WEEK DAY OFF-PEAK FREQUENCY"1. "...Less than one a day,"2. "at least one a day,"3. "at least one an hour,"4. "at least one every half-hour,"5. "or, at least one every quarter ofan hour?"
ASK ALWAYSNearSta"Now thinking of your local trainservice, how long would it take (me) towalk to your nearest railway station?(Again I am interested in theNEAREST one, even if it is not themain one or the one you use).RECORD TO NEAREST MINUTEIF RESPONDENT DOES NOTKNOW, ENTER <CTRL-K> ANDENCOURAGE ESTIMATE AT NEXTQUESTION"
(CHANGED 2003 ONWARDS TO:)"Now thinking of your local trainservice, how long would it take (me) towalk to your nearest railway (that isEx-BR) station?(Again I am interested in theNEAREST one, even if it is not themain one or the one you use).IF TOO FAR TO WALK, PROBE: Ifyou did walk, how long would it take?DO NOT INCLUDE UNDERGROUNDSTATIONS.RECORD TO NEAREST MINUTEIF RESPONDENT DOES NOTKNOW, ENTER <CTRL-K> ANDENCOURAGE ESTIMATE AT NEXTQUESTION"
IF the time it would take to walk to thenearest train station is not known(NearSta = DK) THENBanRail"SHOW CARD D1Taking your answer from this card,approximately how long would it take(me) (to walk to your nearest railwaystation)? INTERVIEWER: IF DK ENCOURAGEESTIMATE."1. "6 minutes or less"2. "7-13 minutes"3. "14-26 minutes"4. "27-43 minutes"5. "44 minutes or longer"
ASK ALWAYSBusSta"How long would it take (me) to get tothe railway station by bus? Pleaseinclude any time spent walking but notwaiting time.RECORD TO NEAREST MINUTEIF RESPONDENT DOES NOTKNOW, ENTER <CTRL-K> ANDENCOURAGE ESTIMATE AT NEXTQUESTIONIF QUICKER TO WALK, ENTER<CTRL K> AND CODE 6 AT NEXTQUESTIONIF NO CONVENIENT BUS SERVICE,ENTER <CTRL K> AND CODE 7 ATNEXT QUESTION (HELP <F9>)."
IF the time it would take to take thebus to the nearest railway station isnot known (BusSta = DK) OR if it isquicker to walk or there is noconvenient bus service THENBanBus"SHOW CARD D2Taking your answer from this card,approximately how long would it take(me) (to get to your nearest railwaystation by bus)? INTERVIEWER: IF DK ENCOURAGEESTIMATE

National Centre for Social Research
211
IF BOTH CODE 6 AND 7 APPLY,USE CODE 7. (EXTRA INT.INSTRUCTION ADDED 2003ONWARDS)"1. "6 minutes or less"2. "7-13 minutes"3. "14-26 minutes"4. "27-43 minutes"5. "44 minutes or longer"6. "Quicker to walk"7. "No convenient bus service"
ASK ALWAYSDescTa"What is your nearest railway stationlike? Is it ... READ OUT..."1. "...a station with frequent servicesthroughout the day (at least once perhour),"2. "a station with frequent servicesonly during rush hours (at least onceper hour),"3. "or a station with less frequentservices?"
ASK ALWAYSClosSta"Is there a (London Underground),metro, light rail or tram stop which iscloser?IF YES, PROBE: Which type of stop iscloser?HELP <F9>)(HELPNOTE ADDED2003 ONWARDS)"1. "London Underground"2. "Metro"3. "Light Rail"4. "Tram"5. "No, no other stop is closer"
IF there is a tube (LondonUnderground/metro/light rail/tram)closer than the nearest railway station(ClosSta IN [LU, Metro, Lrail, Tram])THENNearTube"How long would it take (me) to walk toyour nearest ^tubetxt stop?RECORD TO NEAREST MINUTE
IF RESPONDENT DOES NOTKNOW, ENTER <CTRL-K> ANDENCOURAGE ESTIMATE AT NEXTQUESTION"
IF there is a tube (LondonUnderground/metro/light rail/tram)closer than the nearest railway station(ClosSta IN [LU, Metro, Lrail, Tram])AND IF the time it would take to walkto nearest tube (LondonUnderground/metro/light rail/tram) stopis not known (NearTube = DK)) THENBanTube"SHOW CARD D1.Taking your answer from this card,approximately how long would it take(me) (to walk to your nearest ^tubetxtstop)?INTERVIEWER: IF DK ENCOURAGEESTIMATE"1. "6 minutes or less"2. "7-13 minutes"3. "14-26 minutes"4. "27-43 minutes"5. "44 minutes or longer"
IF there is a tube (LondonUnderground/metro/light rail/tram)closer than the nearest railway station(ClosSta IN [LU, Metro, Lrail, Tram])THENBusTube"And how long would it take (me) toget to the nearest ^tubetxt stop BYBUS? (including any time spentwalking but not waiting time)?RECORD TO NEAREST MINUTEIF RESPONDENT DOES NOTKNOW, ENTER <CTRL-K> ANDENCOURAGE ESTIMATE AT NEXTQUESTIONIF QUICKER TO WALK, ENTER<CTRL K> AND CODE 6 AT NEXTQUESTIONIF NO CONVENIENT BUS SERVICE,ENTER <CTRL K> AND CODE 7 ATNEXT QUESTION (HELP <F9>)."
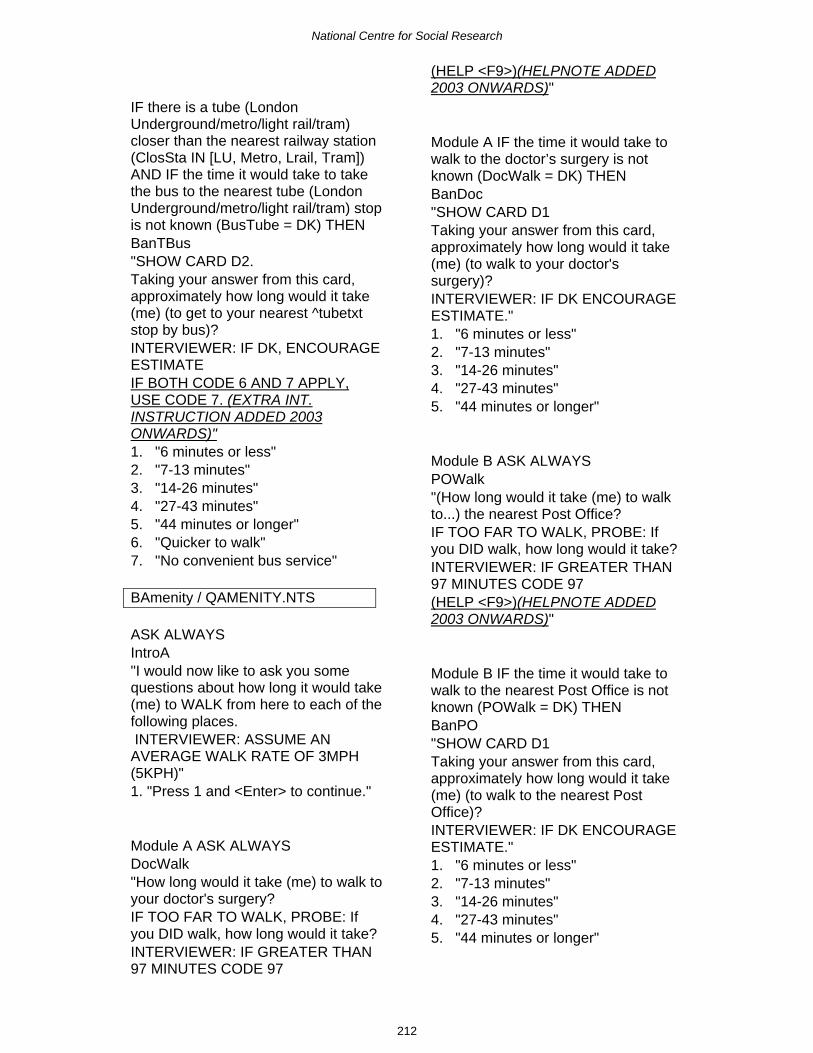
National Centre for Social Research
212
IF there is a tube (LondonUnderground/metro/light rail/tram)closer than the nearest railway station(ClosSta IN [LU, Metro, Lrail, Tram])AND IF the time it would take to takethe bus to the nearest tube (LondonUnderground/metro/light rail/tram) stopis not known (BusTube = DK) THENBanTBus"SHOW CARD D2.Taking your answer from this card,approximately how long would it take(me) (to get to your nearest ^tubetxtstop by bus)?INTERVIEWER: IF DK, ENCOURAGEESTIMATEIF BOTH CODE 6 AND 7 APPLY,USE CODE 7. (EXTRA INT.INSTRUCTION ADDED 2003ONWARDS)"1. "6 minutes or less"2. "7-13 minutes"3. "14-26 minutes"4. "27-43 minutes"5. "44 minutes or longer"6. "Quicker to walk"7. "No convenient bus service"
BAmenity / QAMENITY.NTS
ASK ALWAYSIntroA"I would now like to ask you somequestions about how long it would take(me) to WALK from here to each of thefollowing places. INTERVIEWER: ASSUME ANAVERAGE WALK RATE OF 3MPH(5KPH)"1. "Press 1 and <Enter> to continue."
Module A ASK ALWAYSDocWalk"How long would it take (me) to walk toyour doctor's surgery?IF TOO FAR TO WALK, PROBE: Ifyou DID walk, how long would it take?INTERVIEWER: IF GREATER THAN97 MINUTES CODE 97
(HELP <F9>)(HELPNOTE ADDED2003 ONWARDS)"
Module A IF the time it would take towalk to the doctor’s surgery is notknown (DocWalk = DK) THENBanDoc"SHOW CARD D1Taking your answer from this card,approximately how long would it take(me) (to walk to your doctor'ssurgery)?INTERVIEWER: IF DK ENCOURAGEESTIMATE."1. "6 minutes or less"2. "7-13 minutes"3. "14-26 minutes"4. "27-43 minutes"5. "44 minutes or longer"
Module B ASK ALWAYSPOWalk"(How long would it take (me) to walkto...) the nearest Post Office?IF TOO FAR TO WALK, PROBE: Ifyou DID walk, how long would it take?INTERVIEWER: IF GREATER THAN97 MINUTES CODE 97(HELP <F9>)(HELPNOTE ADDED2003 ONWARDS)"
Module B IF the time it would take towalk to the nearest Post Office is notknown (POWalk = DK) THENBanPO"SHOW CARD D1Taking your answer from this card,approximately how long would it take(me) (to walk to the nearest PostOffice)?INTERVIEWER: IF DK ENCOURAGEESTIMATE."1. "6 minutes or less"2. "7-13 minutes"3. "14-26 minutes"4. "27-43 minutes"5. "44 minutes or longer"

National Centre for Social Research
213
Module A ASK ALWAYSChemWalk"(How long would it take (me) to walkto...) the nearest chemist? IF TOO FAR TO WALK, PROBE: Ifyou DID walk, how long would it take?INTERVIEWER: IF GREATER THAN97 MINUTES CODE 97(HELP <F9>)(HELPNOTE ADDED2003 ONWARDS)"
Module A IF the time it would take towalk to the nearest chemist is notknown (ChemWalk = DK) THENBanChem"SHOW CARD D1Taking your answer from this card,approximately how long would it take(me) (to walk to the nearest chemist)? INTERVIEWER: IF DK ENCOURAGEESTIMATE."1. "6 minutes or less"2. "7-13 minutes"3. "14-26 minutes"4. "27-43 minutes"5. "44 minutes or longer"
ASK ALWAYSGrocWalk"(How long would it take (me) to walkto...) the nearest shop sellinggroceries? IF TOO FAR TO WALK, PROBE: Ifyou DID walk, how long would it take?INTERVIEWER: IF GREATER THAN97 MINUTES CODE 97(HELP <F9>)(HELPNOTE ADDED2003 ONWARDS)"
IF the time it would take to walk to thenearest shop selling groceries is notknown (GrocWalk) THENBanGroc"SHOW CARD D1Taking your answer from this card,approximately how long would it take(me) (to walk to the nearest shopselling groceries)?
INTERVIEWER: IF DK ENCOURAGEESTIMATE."1. "6 minutes or less"2. "7-13 minutes"3. "14-26 minutes"4. "27-43 minutes"5. "44 minutes or longer"
Module B ASK ALWAYSSCenWalk"(How long would it take (me) to walkto...) the nearest main shoppingcentre?IF TOO FAR TO WALK, PROBE: Ifyou DID walk, how long would it take?INTERVIEWER: IF GREATER THAN97 MINUTES CODE 97 HELP <F9>."
Module B IF the time it would take towalk to the nearest main shoppingcentre is not known (ScenWalk = DK)THENBanSCen"SHOW CARD D1Taking your answer from this card,approximately how long would it take(me) (to walk to the nearest shoppingcentre)? INTERVIEWER: IF DK ENCOURAGEESTIMATE."1. "6 minutes or less"2. "7-13 minutes"3. "14-26 minutes"4. "27-43 minutes"5. "44 minutes or longer"
Module A ASK ALWAYSHospWalk"(How long would it take (me) to walkto...) the nearest hospital providinggeneral treatment? IF TOO FAR TO WALK, PROBE: Ifyou DID walk, how long would it take?INTERVIEWER: IF GREATER THAN97 MINUTES CODE 97(HELP <F9>)(HELPNOTE ADDED2003 ONWARDS)NOTE: The hospital does not need tohave an Accident & Emergency

National Centre for Social Research
214
department but should have an out-patients. Exclude private, 'cottage' andspecialist hospitals."
Module A IF the time it would take towalk to the nearest hospital is notknown (HospWalk = DK) THENBanHosp"SHOW CARD D1Taking your answer from this card,approximately how long would it take(me) (to walk to the nearest hospital)? INTERVIEWER: IF DK ENCOURAGEESTIMATE."1. "6 minutes or less"2. "7-13 minutes"3. "14-26 minutes"4. "27-43 minutes"5. "44 minutes or longer"
ASK ALWAYSIntroB"I would now like to ask how long itwould take to get to each of thoseplaces BY BUS. Please includewalking to and from the bus stop butassume there is no waiting time."1. "Press 1 and <Enter> to continue."
Module A ASK ALWAYSDocBus"How long would it take (me) to go bybus to your doctor's surgery?RECORD NORMAL JOURNEY TIME,TO NEAREST MINUTE.DO NOT INCLUDE ONE-OFFDELAYS.NOTES: IF RESPONDENT DOESNOT KNOW, ENTER <CTRL-K> ANDENCOURAGE ESTIMATE AT NEXTQUESTION.IF QUICKER TO WALK, ENTER<CTRL K> AND CODE 6 AT NEXTQUESTIONIF NO CONVENIENT BUS SERVICE,ENTER <CTRL K> AND CODE 7 ATNEXT QUESTION (HELP <F9>)."
Module A IF the time it would take totake a bus to the nearest doctor is notknown (DocBus = DK) THENBanDocB"SHOW CARD D2Taking your answer from this card,approximately how long would it take(me) (to go by bus to your doctor'ssurgery)?INTERVIEWER: IF DK ENCOURAGEESTIMATEIF BOTH CODE 6 AND 7 APPLY,USE CODE 7.(EXTRA INT.INSTRUCTION ADDED 2003ONWARDS)"1. "6 minutes or less"2. "7-13 minutes"3. "14-26 minutes"4. "27-43 minutes"5. "44 minutes or longer"6. "Quicker to walk"7. "No convenient bus service"
Module B ASK ALWAYSPOBus"How long would it take (me) to go bybus to the nearest Post Office?RECORD NORMAL JOURNEY TIME,TO NEAREST MINUTE.DO NOT INCLUDE ONE-OFFDELAYS.NOTES: IF RESPONDENT DOESNOT KNOW, ENTER <CTRL-K> ANDENCOURAGE ESTIMATE AT NEXTQUESTION.IF QUICKER TO WALK, ENTER<CTRL K> AND CODE 6 AT NEXTQUESTIONIF NO CONVENIENT BUS SERVICE,ENTER <CTRL K> AND CODE 7 ATNEXT QUESTION (HELP <F9>)."
Module B IF the time it would take totake a bus to the nearest Post Office isnot known (POBus = DK) THENBanPOB"SHOW CARD D2Taking your answer from this card,approximately how long would it take

National Centre for Social Research
215
(me) (to go by bus to the nearest PostOffice)?INTERVIEWER: IF DK ENCOURAGEESTIMATEIF BOTH CODE 6 AND 7 APPLY,USE CODE 7.(EXTRA INT.INSTRUCTION ADDED 2003ONWARDS)"1. "6 minutes or less"2. "7-13 minutes"3. "14-26 minutes"4. "27-43 minutes"5. "44 minutes or longer"6. "Quicker to walk"7. "No convenient bus service"
Module A ASK ALWAYSChemBus"(How long would it take (me) to go bybus to) the nearest chemist?RECORD NORMAL JOURNEY TIME,TO NEAREST MINUTE.DO NOT INCLUDE ONE-OFFDELAYS.NOTES: IF RESPONDENT DOESNOT KNOW, ENTER <CTRL-K> ANDENCOURAGE ESTIMATE AT NEXTQUESTION.IF QUICKER TO WALK, ENTER<CTRL K> AND CODE 6 AT NEXTQUESTIONIF NO CONVENIENT BUS SERVICE,ENTER <CTRL K> AND CODE 7 ATNEXT QUESTION (HELP <F9>)."
Module A IF the time it would take totake a bus to the nearest chemist isnot known (ChemBus = DK) THENBanChemB"SHOW CARD D2Taking your answer from this card,approximately how long would it take(me) (to go by bus to the nearestchemist)? INTERVIEWER: IF DK ENCOURAGEESTIMATEIF BOTH CODE 6 AND 7 APPLY,USE CODE 7.(EXTRA INT.INSTRUCTION ADDED 2003ONWARDS)"
1. "6 minutes or less"2. "7-13 minutes"3. "14-26 minutes"4. "27-43 minutes"5. "44 minutes or longer"6. "Quicker to walk"7. "No convenient bus service"
ASK ALWAYSGrocBus"(How long would it take (me) to go bybus to) the nearest shop sellinggroceriesRECORD NORMAL JOURNEY TIME,TO NEAREST MINUTE.DO NOT INCLUDE ONE-OFFDELAYS.NOTES: IF RESPONDENT DOESNOT KNOW, ENTER <CTRL-K> ANDENCOURAGE ESTIMATE AT NEXTQUESTION.IF QUICKER TO WALK, ENTER<CTRL K> AND CODE 6 AT NEXTQUESTIONIF NO CONVENIENT BUS SERVICE,ENTER <CTRL K> AND CODE 7 ATNEXT QUESTION (HELP <F9>)."
IF the time it would take to take a busto the nearest shop selling groceries isnot known (GrocBus = DK) THENBanGrocB"SHOW CARD D2Taking your answer from this card,approximately how long would it take(me) (to go by bus to the nearest shopselling groceries)? INTERVIEWER: IF DK ENCOURAGEESTIMATEIF BOTH CODE 6 AND 7 APPLY,USE CODE 7.(EXTRA INT.INSTRUCTION ADDED 2003ONWARDS)"1. "6 minutes or less"2. "7-13 minutes"3. "14-26 minutes"4. "27-43 minutes"5. "44 minutes or longer"6. "Quicker to walk"7. "No convenient bus service"

National Centre for Social Research
216
Module B ASK ALWAYSScenBus"(How long would it take (me) to go bybus to) the nearest main shoppingcentre?RECORD NORMAL JOURNEY TIME,TO NEAREST MINUTE.DO NOT INCLUDE ONE-OFFDELAYS.NOTES: IF RESPONDENT DOESNOT KNOW, ENTER <CTRL-K> ANDENCOURAGE ESTIMATE AT NEXTQUESTION.IF QUICKER TO WALK, ENTER<CTRL K> AND CODE 6 AT NEXTQUESTIONIF NO CONVENIENT BUS SERVICE,ENTER <CTRL K> AND CODE 7 ATNEXT QUESTION (HELP <F9>)."
Module B IF the time it would take totake a bus to the nearest mainshopping centre is not known(SCenBus = DK) THENBanSCenB"SHOW CARD D2Taking your answer from this card,approximately how long would it take(me) (to go by bus to the nearestshopping centre)? INTERVIEWER: IF DK ENCOURAGEESTIMATEIF BOTH CODE 6 AND 7 APPLY,USE CODE 7.(EXTRA INT.INSTRUCTION ADDED 2003ONWARDS)"1. "6 minutes or less"2. "7-13 minutes"3. "14-26 minutes"4. "27-43 minutes"5. "44 minutes or longer"6. "Quicker to walk"7. "No convenient bus service"
Module A ASK ALWAYSHospBus
"(How long would it take (me) to go bybus to) the nearest hospital providinggeneral treatment?RECORD NORMAL JOURNEY TIME,TO NEAREST MINUTE.DO NOT INCLUDE ONE-OFFDELAYS.NOTES: IF RESPONDENT DOESNOT KNOW, ENTER <CTRL-K> ANDENCOURAGE ESTIMATE AT NEXTQUESTION.IF QUICKER TO WALK, ENTER<CTRL K> AND CODE 6 AT NEXTQUESTIONIF NO CONVENIENT BUS SERVICE,ENTER <CTRL K> AND CODE 7 ATNEXT QUESTION (HELP <F9>)."
Module A IF the time it would take totake a bus to the nearest hospital isnot known (HospBus = DK) THENBanHospB"SHOW CARD D2Taking your answer from this card,approximately how long would it take(me) (to go by bus to the nearesthospital)? INTERVIEWER: IF DK ENCOURAGEESTIMATEIF BOTH CODE 6 AND 7 APPLY,USE CODE 7.(EXTRA INT.INSTRUCTION ADDED 2003ONWARDS)"1. "6 minutes or less"2. "7-13 minutes"3. "14-26 minutes"4. "27-43 minutes"5. "44 minutes or longer"6. "Quicker to walk"7. "No convenient bus service"
ASK ALWAYSOrder"SHOW CARD E1.I'd now like to ask a few questionsabout things which your householdmight have had delivered.Nowadays, does anyone in yourhousehold (do you) ever order any ofthese things over the phone, by postor on the internet?
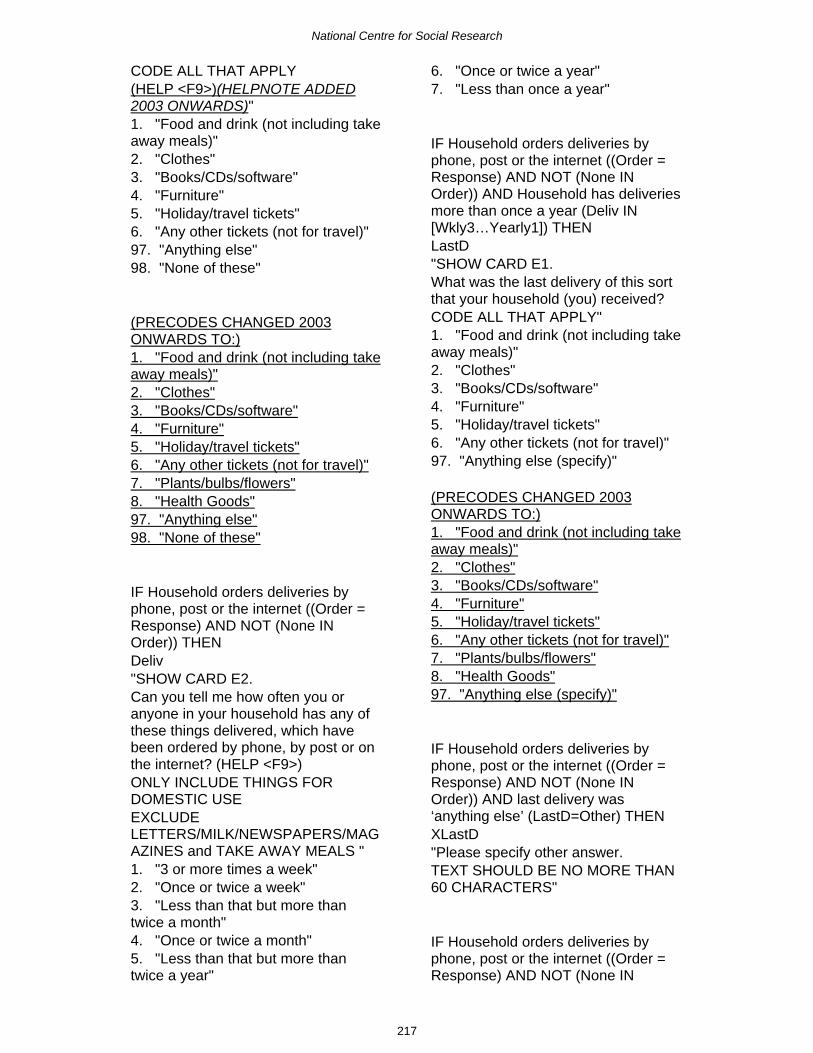
National Centre for Social Research
217
CODE ALL THAT APPLY(HELP <F9>)(HELPNOTE ADDED2003 ONWARDS)"1. "Food and drink (not including takeaway meals)"2. "Clothes"3. "Books/CDs/software"4. "Furniture"5. "Holiday/travel tickets"6. "Any other tickets (not for travel)"97. "Anything else"98. "None of these"
(PRECODES CHANGED 2003ONWARDS TO:)1. "Food and drink (not including takeaway meals)"2. "Clothes"3. "Books/CDs/software"4. "Furniture"5. "Holiday/travel tickets"6. "Any other tickets (not for travel)"7. "Plants/bulbs/flowers"8. "Health Goods"97. "Anything else"98. "None of these"
IF Household orders deliveries byphone, post or the internet ((Order =Response) AND NOT (None INOrder)) THENDeliv"SHOW CARD E2.Can you tell me how often you oranyone in your household has any ofthese things delivered, which havebeen ordered by phone, by post or onthe internet? (HELP <F9>)ONLY INCLUDE THINGS FORDOMESTIC USEEXCLUDELETTERS/MILK/NEWSPAPERS/MAGAZINES and TAKE AWAY MEALS "1. "3 or more times a week"2. "Once or twice a week"3. "Less than that but more thantwice a month"4. "Once or twice a month"5. "Less than that but more thantwice a year"
6. "Once or twice a year"7. "Less than once a year"
IF Household orders deliveries byphone, post or the internet ((Order =Response) AND NOT (None INOrder)) AND Household has deliveriesmore than once a year (Deliv IN[Wkly3…Yearly1]) THENLastD"SHOW CARD E1.What was the last delivery of this sortthat your household (you) received?CODE ALL THAT APPLY"1. "Food and drink (not including takeaway meals)"2. "Clothes"3. "Books/CDs/software"4. "Furniture"5. "Holiday/travel tickets"6. "Any other tickets (not for travel)"97. "Anything else (specify)"
(PRECODES CHANGED 2003ONWARDS TO:)1. "Food and drink (not including takeaway meals)"2. "Clothes"3. "Books/CDs/software"4. "Furniture"5. "Holiday/travel tickets"6. "Any other tickets (not for travel)"7. "Plants/bulbs/flowers"8. "Health Goods"97. "Anything else (specify)"
IF Household orders deliveries byphone, post or the internet ((Order =Response) AND NOT (None INOrder)) AND last delivery was‘anything else’ (LastD=Other) THENXLastD"Please specify other answer.TEXT SHOULD BE NO MORE THAN60 CHARACTERS"
IF Household orders deliveries byphone, post or the internet ((Order =Response) AND NOT (None IN

National Centre for Social Research
218
Order)) AND Household has deliveriesmore than once a year (Deliv IN[Wkly3…Yearly1]) AND IF the lastdelivery can be coded at LastD(LastD= Response) THENHowOrd"And was this ordered by phone, bypost or on the internet?"1. "by phone"2. "by post"3. "on the internet"
IF Household orders deliveries byphone, post or the internet ((Order =Response) AND NOT (None INOrder)) AND Household has deliveriesmore than once a year (Deliv IN[Wkly3…Yearly1]) AND IF the lastdelivery can be coded at LastD (LastD= Response) AND IF the delivery wasordered by phone, by post or on theInternet (HowOrd IN [Phone…IntNet])THENHowB"SHOW CARD E3. And if you had not ordered this^HowOTxt, how do you think youwould have bought it?CODE ONE ONLYIF MORE THAN ONE ANSWER,PROBE FOR MOST LIKELYMETHOD"1. "In person e.g. from a shop ortravel agent"2. "By phone"3. "By post"4. "On the internet"5. "By fax"6. "On the doorstep"7. "Would have asked someone elseto buy it in person"8. "Would not have bought it"97. "Other (Specify)"
(PRECODES CHANGED 2003ONWARDS TO:)1. "In person e.g. from a shop ortravel agent, railway station etc."2. "By phone"3. "By post"4. "On the internet"
5. "By fax"6. "On the doorstep"7. "Would have asked someone elseto buy it in person"8. "Would not have bought it"97. "Other (Specify)"
IF Household orders deliveries byphone, post or the internet ((Order =Response) AND NOT (None INOrder)) AND Household has deliveriesmore than once a year (Deliv IN[Wkly3…Yearly1]) AND IF the lastdelivery can be coded at LastD (LastD= Response) AND IF the delivery wasordered by phone, by post or on theInternet (HowOrd IN [Phone…IntNet])AND HRP would have bought it someother way (HowB=other) THENXHowB"Please specify other reasons.TEXT SHOULD BE NO MORE THAN60 CHARACTERS"
ASK ALWAYSWhoShop"Can I check, who does the main foodshopping for your household?NOTE: IF DOES NOT TRAVEL TODO FOOD SHOPPING (E.G.INTERNET SHOPPING, GETSSHOPPING DELIVERED) THEN USECODE 12.CODE ALL THAT APPLY"1. "^Shopper[1]"2. "^Shopper[2]"3. "^Shopper[3]"4. "^Shopper[4]"5. "^Shopper[5]"6. "^Shopper[6]"7. "^Shopper[7]"8. "^Shopper[8]"9. "^Shopper[9]"10. "^Shopper[10]"11. "Non-household member"12. "Household does not do foodshopping"

National Centre for Social Research
219
IF more than one person does thefood shopping (whoshop >1) THENShopOft"And which one person does the mainfood shopping most often? Is it^ShopTxt?INTERVIEWER: If respondent says allor equal prompt for who did main foodshopping by themselves most recently.Otherwise ask respondent to nominateperson to answer later questions aboutshopping.CODE ONE ONLY"1. "^Shopper[1]"2. "^Shopper[2]"3. "^Shopper[3]"4. "^Shopper[4]"5. "^Shopper[5]"6. "^Shopper[6]"7. "^Shopper[7]"8. "^Shopper[8]"9. "^Shopper[9]"10. "^Shopper[10]"
IF the household does not do foodshopping (None IN WhoShop) THENYNoShop"Why is this?CODE ALL THAT APPLY"1. "Delivered by shop"2. "Most food from meals onwheels/day centre/restaurant etc."97. "Other reason (specify)"
IF ‘other reason’ why household doesnot do food shopping (Other INYNoShop)THENXYNoShop"Please specify other reasons.TEXT SHOULD BE NO MORE THAN60 CHARACTERS"
TChTrav / QTCHTRAV.NTS]BchTrav
Questions asked if :Any individual household member isaged 7- 13, asked for each memberin turn, answered by HRP or anotherrespondent aged 16 or over
IF HRP has child/ren THENSchInt"I'd now like to ask a few questionsabout your/the ^children's journey toand from school."1. "Press 1 and <Enter> to continue."
IF HRP has child/ren THENSchDly"Does ^Name make a daily journey toand from school?"1. "Makes daily journey"2. "No daily journey (e.g. educated athome/boarding school)"
IF HRP’s child makes a daily journeyto and from school (SchDly = Daily)THENSchFar"How far is it from your home to^Name's school?FIRST ENTER UNIT OFMEASUREMENT.INTERVIEWER: USE MILES ORKILOMETERS FOR LONGERDISTANCES"1. "Minutes Walk"2. "Miles"3. "Kilometres"4. "Yards"5. "Metres"
(PRECODES CHANGED 2004ONWARDS TO:)1. "Miles"2. "Kilometres"3. "Yards"4. "Metres"
IF HRP’s child makes a daily journeyto and from school (SchDly =Daily)AND IF distance to child’s schoolcan be measured by ‘minutes walk’(SchFar = Mins) THENSchMins"NOW ENTER DISTANCE INMINUTES WALKING TIME"

National Centre for Social Research
220
SchMins (QUESTION DELETED 2004ONWARDS)
IF HRP’s child makes a daily journeyto and from school (SchDly = Daily)AND IF distance to child’s school ismeasured by miles (SchFar = Miles)THENSchMil"NOW ENTER DISTANCE IN MILES"
IF HRP’s child makes a daily journeyto and from school (SchDly = Daily)AND IF distance to child’s school ismeasured by kilometres (SchFar =KM) THENSchKm"NOW ENTER DISTANCE INKILOMETRES"
IF HRP’s child makes a daily journeyto and from school (SchDly = Daily)AND IF distance to child’s school ismeasured by yards (Schfar = Yards)THENSchYard"NOW ENTER DISTANCE IN YARDS"
IF HRP’s child makes a daily journeyto and from school (SchDly = Daily)AND IF distance to child’s school ismeasured by metres (SchFar =Metres) THENSchM"NOW ENTER DISTANCE INMETRES"
IF HRP’s child makes a daily journeyto and from school (SchDly = Daily)THENTravSc"And how does ^Name usually travelto school? (HELP <F9>)CODE ONE ONLY, FOR THELONGEST PART, BY DISTANCE, OFTHE CHILD'S USUAL JOURNEY TOSCHOOL
IF DIFFERENT METHOD USED TOAND FROM SCHOOL, CODEMETHOD TO SCHOOL. (EXTRA INT.INSTRUCTION ADDED 2003ONWARDS)"1. "Underground, metro, light rail,tram"2. "Train"3. "Public bus, minibus or coach"4. "School or local authority bus,minibus or coach"5. "Motorcycle, scooter or moped"6. "Car or van"7. "Taxi/minicab"8. "Bicycle"9. "On foot"97. "Other (specify)"
IF child travels to school by ‘other’method (TravSc=Other) THENXTravSc"Please specify other answer.TEXT SHOULD BE NO MORE THAN60 CHARACTERS"
IF HRP’s child makes a daily journeyto and from school (SchDly = Daily)THENAccAd"When ^Name travels to or fromschool is he/she ...READ OUT...NOTE: BUS DRIVERS DO NOTCOUNT AS AN ACCOMPANYINGADULT"1. "...usually accompanied by anadult,"2. "not usually accompanied by anadult,"3. "or sometimes accompanied andsometimes not?"4. "(part of way accompanied, part ofway not)"
IF HRP’s child makes a daily journeyto and from school (SchDly = Daily)AND IF child is accompanied to schoolby an adult (AccAd = Acc) THENNotAlw1"SHOW CARD F

National Centre for Social Research
221
What are the reasons ^Name does notusually travel to and from school onhis/her own?CODE ALL THAT APPLY.IF TOO YOUNG, PROBE: Why do youthink he/she's too young?"1. "Traffic danger"2. "Child might get lost/doesn't knowthe way"3. "Child might not arrive (on time)"4. "Fear of assault/molestation by anadult"5. "Fear of bullying by other children"6. "School too far away"97. "Other reason (specify)"
IF there is another reason why childdoes not usually travel to and fromschool on their own (NotAlw1 = other)THENXnotAlw1"Please specify other reasons.TEXT SHOULD BE NO MORE THAN60 CHARACTERS"
IF HRP’s child makes a daily journeyto and from school (SchDly = Daily)AND IF child is not usuallyaccompanied or sometimesaccompanied sometimes not (AccAdIN [NotAcc, SomeAcc]) THENAgeAlw"At what age did ^Name first travel toor from school without an adult?ENTER AGE FIRST DID THIS, EVENIF DID NOT ALWAYS TRAVELUNACCOMPANIED AT THAT AGE"
IF HRP’s child makes a daily journeyto and from school (SchDly = Daily)AND IF child is not usuallyaccompanied or sometimesaccompanied sometimes not (AccAdIN [NotAcc, SomeAcc]) AND IF theage of when the child first travelled toor from school without an adult isgiven (AgeALw = Response) THENNotAlw2"SHOW CARD F
What were the reasons ^Name wasnot allowed to travel on his/her ownbefore then?CODE ALL THAT APPLY IF TOO YOUNG, PROBE: Why doyou think he/she was too young?"1. "Traffic danger"2. "Child might get lost/doesn't knowthe way"3. "Child might not arrive (on time)"4. "Fear of assault/molestation by anadult"5. "Fear of bullying by other children"6. "School too far away"97. "Other reason (specify)"
IF there is another reason why thechild was not allowed to travel on theirown before then (NotAlw2= other)THENXNotAlw2"Please specify other reasons.TEXT SHOULD BE NO MORE THAN60 CHARACTERS"
ASK ALWAYSRoads"Is ^Name ever allowed to cross roadswithout being accompanied by anadult?IF YES, PROBE: Is that always orsometimes?NOTE: IF ONLY ALLOWED TOCROSS SOME ROADS, CODE'SOMETIMES'"1. "Yes, (almost) always"2. "Yes, sometimes/depends"3. "No, never"
IF HRP’s child is always or sometimesallowed to cross roads without beingaccompanied by an adult (Roads IN[Always, Some]) THENMainRd"And is ^Name allowed to cross mainroads or only minor roads?"1. "Main roads"2. "Only minor roads"

National Centre for Social Research
222
BVehNum / QVEHNUM.NTS
ASK ALWAYSIchEmp"INTERVIEWER: ASK OR RECORD May I just check is anyone in thishousehold (are you) in paidemployment?NOTE: INCLUDE SELF-EMPLOYMENT"1. "Yes (Someone in householdworking)"2. "No-one in household working"
IF Household member is in paidemployment (IchEmp = Yes) THENCarPool" Some companies have a car-poolfrom which employees take a carwhen they need one. Does yourhousehold use cars from a companycar-pool?NOTE: AS A DRIVER(HELP <F9>)(HELPNOTE ADDED2003 ONWARDS)"1. "Yes"2. "No"
ASK ALWAYSUseVcl"SHOW CARD H1 Do you, or any members of yourhousehold, at present own or havecontinuous use of any motor vehicles?Please choose your answer from thiscard.INCLUDE COMPANY CARS (IFAVAILABLE FOR PRIVATE USE)"1. "Yes"2. "No"
(CHANGED 2004 ONWARDS TO:)"SHOW CARD H1 Do you, or any members of yourhousehold, at present own or havecontinuous use of any of the motorvehicles listed on this card?Please choose your answer from thiscard.
INCLUDE COMPANY CARS (IFAVAILABLE FOR PRIVATE USE)"1. "Yes"2. "No"
ASK ALWAYSBrokenV"And are there any other motorvehicles which are broken down or notin use but which your household maybegin to use in the next month?(HELP <F9>)(HELPNOTE ADDED2003 ONWARDS)"1. "Yes"2. "No"
IF household has continuous use ofmotor vehicle OR there are brokenvehicles which may be used in thenext month ((UseVcl= Yes) OR(BrokenV=Yes))THENNoPlveh"NUMBER OF VEHICLES^LVehNum1 INTERVIEWER: INCLUDE ANYBROKEN DOWN VEHICLES WHICHMAY BE IN USE WITHIN THE NEXTMONTH BUT EXCLUDE COMPANYPOOL CARS"
(CHANGED 2003 ONWARDS TO:)How many vehicles does yourhousehold own or have continuoususe of at present?^LVehNum1INTERVIEWER: INCLUDE ANYBROKEN DOWN VEHICLES WHICHMAY BE IN USE WITHIN THE NEXTMONTH BUT EXCLUDE COMPANYPOOL CARS"
IF pick up interview is being conducted(StatusQ=pick up) THENNewVeh"When we completed the maininterview together on(^QSignin.StartTxt), I asked you aboutany vehicles that your household hadregular use of:

National Centre for Social Research
223
(May I just check), have you acquiredthe use of any (other) vehicles sincethen? ENTER RESPONSE AND <ENTER>,THEN PRESS <END> TO GO TOTHE NEXT PICK-UP QUESTION SEE HELP SCREEN <F9> FORHOUSEHOLD VEHICLEDEFINITION...(HELP <F9>)"1. "Yes"2. "No"
IF Household has acquired newvehicle since main interview(StatusQ=Pick up) AND (NewVeh =Yes) THENNewNo"How many other vehicles have youacquired since ^QSignin.StartTxt? ENTER RESPONSE AND <ENTER>,THEN PRESS <END> TO GO TONEXT PICK-UP QUESTION"
IF Household has continuous use ofmotor vehicle OR there are brokenvehicles which may be used in thenext month OR Household hasacquired new vehicle since maininterview ((UseVcl= Yes) OR(BrokenV=Yes) OR (NewVeh = Yes))THENNumVeh"PRECODED. PRESS ENTER TOCONTINUE"
TVehTab/ QTVEHTAB.NTSBVehTab
Questions asked of:Respondent who best knows aboutvehicle (normally main driver but notnecessarily) if QVehnum.Numveh>0
IF Household has acquired newvehicle since main interview (NewVeh= Yes) THENWhenAcq
"When did you acquire the use of your^LTVehTab1[LTLooper] additionalvehicle?. Was it...READ OUT...NOTE: Travel Week was from^QSignIn.TravDate to^QSignIn.TrEndDat"1. "...before the start of the TravelWeek,"2. "during the Travel Week,""or, after the end of the Travel Week?"
IF Household has acquired newvehicle since main interview (NewVeh= Yes) AND IF Household acquirednew vehicle during the Travel Week ordoes not know when they acquired thevehicle in relation to the Travel Week((WhenAcq = During) OR (WhenAcq =DK)) THENDateAcq"Can you tell me the date on whichyou acquired the vehicle?"
FOR EACH HOUSEHOLD VEHICLEMake"ENTER A DESCRIPTION OF THEMAKE OF VEHICLE NUMBER^LTLooper.E.G. FORD, VAUXHALL, RENAULT,PEUGEOT"
(CHANGED 2003 ONWARDS TO:)What is the make of vehicle number^LTLooper.E.G. FORD, VAUXHALL, RENAULT,PEUGEOT"
FOR EACH HOUSEHOLD VEHICLEModel"ENTER DESCRIPTION OF THEMODEL OF VEHICLE NUMBER^LTLooper. E.G FIESTA, CLIO, MICRA, 106"
(CHANGED 2003 ONWARDS TO:)"And the model? ^LTLooper. E.G FIESTA, CLIO, MICRA, 106"

National Centre for Social Research
224
IF the model is known (Model =Response) THENModSpec"ENTER ANY MODEL TYPE ORSPECIFICATION OF VEHICLENUMBER ^LTLooper. E.G 1.6, XR2i, TURBO, ESTATE,CONVERTIBLE, 5 DOOR IT IS IMPORTANT THAT YOUCOLLECT FULL DETAILS ABOUTTHE VEHICLE AS YOU WILL NEEDTHIS INFORMATION FOR CODINGLATER IN THE INTERVIEW"
(CHANGED 2003 ONWARDS TO:)"Is there a model type or specificationfor this vehicle? If so enter it here.^LTLooper.E.G 1.6, XR2i, TURBO, ESTATE,CONVERTIBLE, 5 DOORIT IS IMPORTANT THAT YOUCOLLECT FULL DETAILS ABOUTTHE VEHICLE AS YOU WILL NEEDTHIS INFORMATION FOR CODINGLATER IN THE INTERVIEW"
FOR EACH HOUSEHOLD VEHICLEVehUse"CODE WHETHER the ^Make^Model"1. "is in regular use,"2. "may begin to be used in the nextmonth,"3. "ONLY ASK AT PICK UP: vehicleacquired since placement?"
(IMPUTED FROM TypeVcl2 from2004 ONWARDS:)
IF household has continuous use of amotor vehicle/s THENTypeVcl"I would now like to ask about the^Make ^Model ^ModSpec vehicle. Isit...READ OUT...^s^s^s^s^s^s^s^s^s^s^s^s^s^s (HELP<F9>) CAR INCLUDES MINIBUSES,MOTOR CARAVANS, 'PEOPLECARRIERS' AND 4-WHEEL DRIVEPASSENGER VEHICLES.
LIGHT VAN INCLUDES PICKUPSAND THOSE 4-WHEEL DRIVEVEHICLES, LAND ROVERS ANDJEEPS THAT DO NOT HAVE SIDEWINDOWS BEHIND THE DRIVER"1. "a car"2. "a light van"3. "a motor cycle"4. "or some other motor vehicle?"
(IMPUTED FROM TypeVcl2 from2004 ONWARDS:)
IF Household vehicle is a car (IFTypeVcl = Car) THENCarType"ASK OR RECORD: Is the ^Make^Model a...INTERVIEWER: '4-WHEEL CAR'INCLUDES PEOPLE CARRIERS ANDLIGHT VANS WITH SIDE WINDOWSBEHIND THE DRIVER (1.5 tonsunladen weight or less)CODE MINIBUSES AND MOTORCARAVANS AS '3'.4-WHEEL DRIVE PASSENGERVEHICLES (E.G. LAND ROVERSAND JEEPS) SHOULD BE CODEDAS '3'"1. "...4-wheel car,"2. "a 3-wheel vehicle,"3. "or, some other motor vehicle?"
(CHANGED 2003 ONLY TO:)"ASK OR RECORD: Is the ^Make^Model a...INTERVIEWER: '4-WHEEL CAR'INCLUDES PEOPLE CARRIERS ANDLIGHT VANS WITH SIDE WINDOWSBEHIND THE DRIVER(3.5 tons grossweight or less)CODE MINIBUSES AND MOTORCARAVANS AS '3'.4-WHEEL DRIVE PASSENGERVEHICLES (E.G. LAND ROVERSAND JEEPS) SHOULD BE CODEDAS '3'"1. "...4-wheel car,"2. "a 3-wheel vehicle,"3. "or, some other motor vehicle?"

National Centre for Social Research
225
(IMPUTED FROM TypeVcl2 from2004 ONWARDS:)
IF Household vehicle is a motorcycle(TypeVcl = MotorCycle) THENBikeType"ASK OR RECORD Is the ^Make ^Model a..."1. "Motorcycle/scooter with sidecar"2. "Motorcycle/scooter"3. "Moped"
(IMPUTED FROM TypeVcl2 from2004 ONWARDS:)
IF Household vehicle is another typeof vehicle OR if household car isanother type of car ((TypeVcL =OtherVehicle) OR (CarType =OtherC)) THENOthType"ASK OR RECORD Is the ^Make ^Model a...INTERVIEWER: 'LIGHT VAN'INCLUDES PICK-UPS THAT DO NOTHAVE SIDE WINDOWS BEHIND THEDRIVER AND INCLUDES MOSTTRANSIT TYPE VANS."1. "...4-wheel drive passenger vehicle(e.g. Landrover, Jeep or similar),"2. "a light van (1.5 tons unladenweight or less),"3. "some other type of van or lorry(more than 1.5 tons unladen weight),"4. "a minibus, caravan, dormobileetc,"5. "or, some other motor vehicle(SPECIFY)?"
(CHANGED 2003 ONLY TO:)"ASK OR RECORD Is the ^Make ^Model a...INTERVIEWER: 'LIGHT VAN'INCLUDES PICK-UPS THAT DO NOTHAVE SIDE WINDOWS BEHIND THEDRIVER AND INCLUDES MOSTTRANSIT TYPE VANS."1. "...4-wheel drive passenger vehicle(e.g. Landrover, Jeep or similar),"
2. "a light van (1.5 tons unladenweight or less),"3. "some other type of van or lorry(more than 3.5 tons gross,"4. "a minibus, caravan, dormobileetc,"5. "or, some other motor vehicle(SPECIFY)?"
IF household owns some othervehicle (OthType = other) THENXOthType"INTERVIEWER: Record other type ofmotor vehicle"
(QUESTION INTRODUCED IN 2004:)
IF household has continuous use of amotor vehicle/s THENTypeVcl2"I would now like to ask about the^Make ^Model ^ModSpec vehicle. Canyou tell the type of vehicle this is fromthe list on this card.(1) 4-wheel car (side windows behinddriver) (includes Multi PurposeVehicles and people carriers(2) 4-wheel drive passenger vehicle(side windows behind driver)(egLandrover, Jeep or similar)(3) 3-wheel car (side windows behinddriver)(4) Minibus, motor-caravan, dormobileetc (side windows behind driver)(5) Light van (@Ino side windowsbehind driver@I) (includes pick upsand car based vans(6) Some other type of van or lorry(7) Motorcycle/scooter with sidecar(8) Motorcycle/scooter(9) Moped(10) Some other motor vehicle(SPECIFY)
IF household vehicle is a car(TypeVcl=car)(IN 2004, FILTER CHANGED TO:TypeVcl2=Wheel4..LightVan)

National Centre for Social Research
226
PrivVcl"FOR EACH VEHICLE IN TURN Is the ^Make^Model...^s^s^s^s^s^s^s^s^s^s^s^s(HELP <F9>)"1. "privately owned"2. "or is it a company vehicle?"
IF household vehicle is a company car(TypeVcl=car & PrivVcl = company)CompCar"SHOW CARD H2.Can I just check which of thesebusiness mileage bands does the carbelong to?"1. "1-2,499 business miles"2. "2,500 - 17,999 business miles"3. "18,000 business miles or more"4. "NONE OF BANDS APPLY(SPECIFY)"
CompCar(QUESTION DELETED MID2002 ONWARDS)
IF none of business mileage bandsapply THENXCompCar"INTERVIEWER: Record here whynone of the Business Mileage Bandsapply"
XCompCar(QUESTION DELETEDMID 2002 ONWARDS)
ASK ALWAYSHmnDriv"Who drives the most mileage in the^Make ^Model (taken over the year asa whole)? IF MAIN DRIVER NOT HOUSEHOLDMEMBER, ENTER 89 ^DMADNAME[1](1)^s^s^DMADNAME[2](2)^s^s^DMADNAME[3](3)^s^s^DMADNAME[4](4)^s^s^DMADNAME[5](5)^s^s^DMADNAME[6](6)^s^s^DMADNAME[7](7)^s^s^DMADNAME[8](8)^s^s
^DMADNAME[9](9)^s^s^DMADNAME[10](10)"
(CHANGED 2003 ONWARDS TO:)"Who drives the most mileage in the^Make ^Model taken over the year asa whole)?(1) ^DMADNAME[1](2) ^DMADNAME[2](3) ^DMADNAME[3](4) ^DMADNAME[4](5) ^DMADNAME[5](6) ^DMADNAME[6](7) ^DMADNAME[7](8) ^DMADNAME[8](9) ^DMADNAME[9](10) ^DMADNAME[10](89) IF MAIN DRIVER NOTHOUSEHOLD MEMBER, ENTER 89"
IF pick up interview is being conducted(StatusQ=pick up) THENStillGot"INTERVIEWER: CODE OR ASK: Does the household still have the^Make ^Model? ENTER RESPONSE THEN<ENTER>, THEN PRESS <END> TOGO TO NEXT PICK-UP QUESTION"1. "Yes"2. "No"
IF the household no longer has theirvehicle at pick up ((StatusQ=pick up)& (StillGot = No)) THENWhenDis"Was the ^Make ^Model sold ordisposed of...READ OUT...NOTE: Travel Week was from^QSignIn.TravDate to^QSignIn.TrEndDat"1. "...before the start of the TravelWeek,"2. "during the Travel Week,"3. "or, after the end of the TravelWeek?"
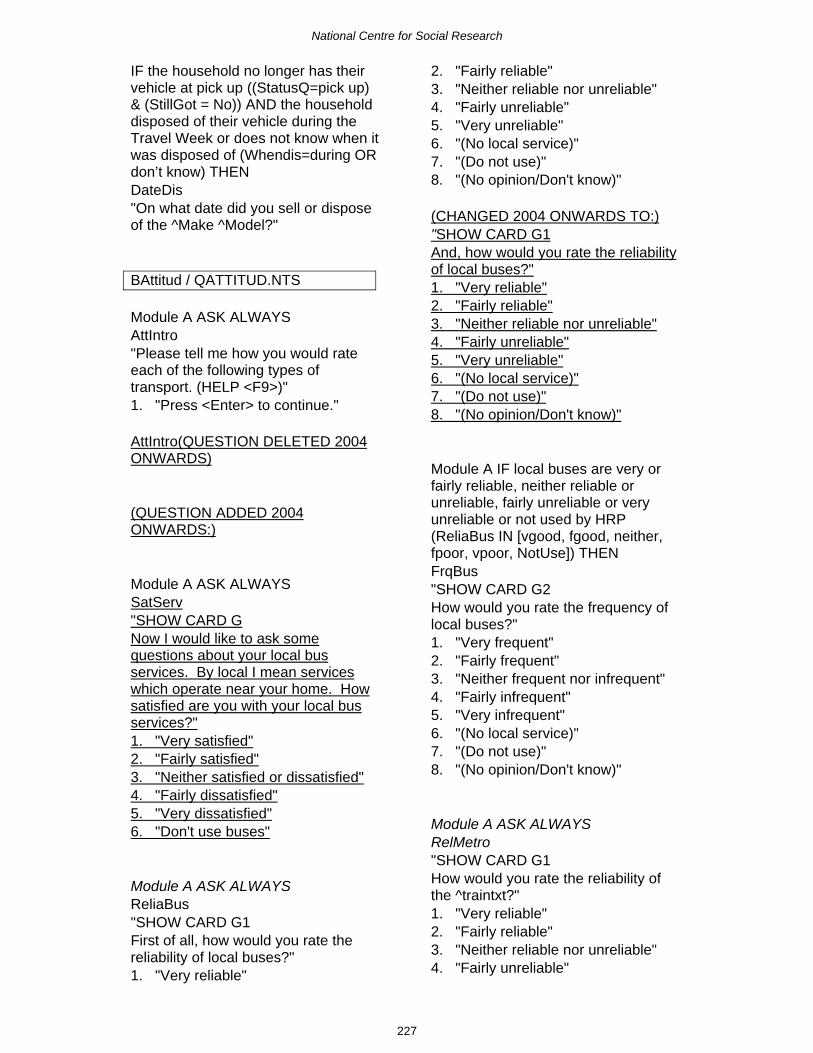
National Centre for Social Research
227
IF the household no longer has theirvehicle at pick up ((StatusQ=pick up)& (StillGot = No)) AND the householddisposed of their vehicle during theTravel Week or does not know when itwas disposed of (Whendis=during ORdon’t know) THENDateDis"On what date did you sell or disposeof the ^Make ^Model?"
BAttitud / QATTITUD.NTS
Module A ASK ALWAYSAttIntro"Please tell me how you would rateeach of the following types oftransport. (HELP <F9>)"1. "Press <Enter> to continue."
AttIntro(QUESTION DELETED 2004ONWARDS)
(QUESTION ADDED 2004ONWARDS:)
Module A ASK ALWAYSSatServ"SHOW CARD GNow I would like to ask somequestions about your local busservices. By local I mean serviceswhich operate near your home. Howsatisfied are you with your local busservices?"1. "Very satisfied"2. "Fairly satisfied"3. "Neither satisfied or dissatisfied"4. "Fairly dissatisfied"5. "Very dissatisfied"6. "Don't use buses"
Module A ASK ALWAYSReliaBus"SHOW CARD G1First of all, how would you rate thereliability of local buses?"1. "Very reliable"
2. "Fairly reliable"3. "Neither reliable nor unreliable"4. "Fairly unreliable"5. "Very unreliable"6. "(No local service)"7. "(Do not use)"8. "(No opinion/Don't know)"
(CHANGED 2004 ONWARDS TO:)"SHOW CARD G1And, how would you rate the reliabilityof local buses?"1. "Very reliable"2. "Fairly reliable"3. "Neither reliable nor unreliable"4. "Fairly unreliable"5. "Very unreliable"6. "(No local service)"7. "(Do not use)"8. "(No opinion/Don't know)"
Module A IF local buses are very orfairly reliable, neither reliable orunreliable, fairly unreliable or veryunreliable or not used by HRP(ReliaBus IN [vgood, fgood, neither,fpoor, vpoor, NotUse]) THENFrqBus"SHOW CARD G2How would you rate the frequency oflocal buses?"1. "Very frequent"2. "Fairly frequent"3. "Neither frequent nor infrequent"4. "Fairly infrequent"5. "Very infrequent"6. "(No local service)"7. "(Do not use)"8. "(No opinion/Don't know)"
Module A ASK ALWAYSRelMetro"SHOW CARD G1How would you rate the reliability ofthe ^traintxt?"1. "Very reliable"2. "Fairly reliable"3. "Neither reliable nor unreliable"4. "Fairly unreliable"

National Centre for Social Research
228
5. "Very unreliable"6. "(No local service)"7. "(Do not use)"8. "(No opinion/Don't know)"
Module A IF localtrains/tubes/metros/light rails/tramsfairly reliable, neither reliable orunreliable, fairly unreliable or veryunreliable or not used by HRP(RelMetro IN [vgood, fgood, neither,fpoor, vpoor, NotUse]) THEN
FrqMetro"SHOW CARD G2How would you rate the frequency ofthe ^traintxt?"1. "Very frequent"2. "Fairly frequent"3. "Neither frequent nor infrequent"4. "Fairly infrequent"5. "Very infrequent"6. "(No local service)"7. "(Do not use)"8. "(No opinion/Don't know)"
Module A ASK ALWAYSIntegr"Are combined rail and bus ticketsavailable in your area?"1. "Yes"2. "No"3. "Don't know"4. "No local service"
Module A ASK ALWAYSCyclane"SHOW CARD G3How would you rate the provision ofcycle lanes/paths locally (WITHIN 5MILES OF THE RESPONDENT'SHOME)? (HELP <F9>)"1. "Very good"2. "Fairly good"3. "Neither good nor poor"4. "Fairly poor"5. "Very poor"6. "(No local cycle lanes)"
7. "(Do not use)""(No opinion/Don't know)"
Module A ASK ALWAYSPavement"SHOW CARD G4How would you rate the condition ofpavements locally where you live?(HELP <F9>)"1. "Very good"2. "Fairly good"3. "Neither good nor poor"4. "Fairly poor"5. "Very poor"6. "(Not many pavements in thearea)"7. "(Do not use)"8. "(No opinion/Don't know)"

National Centre for Social Research
229
Individual Questionnaire
TWhoInt / QTWhoInt.NTSBWhoInt
RECORD ALWAYSWhoInt"ENTER THE NUMBER OF THEPERSON YOU WANT TOINTERVIEW (OR RECORD AS NOTAVAILABLE) FROM THE LISTBELOW ^LTWhoInt1"
RECORD ALWAYSIndQn"CODE WHETHER FACE TO FACEINTERVIEW, PROXY INTERVIEW,OR PERSON NOT AVAILABLE. INTERVIEWER: IN GENERAL, FORCHILDREN UNDER ELEVEN,INTERVIEW AN ADULT AND CODEAS 'PROXY'"1. "Face to face"2. "Proxy"3. "Not available"
TDisab / QTDisab.NTSBDisab
Questions asked of:Each individual household memberaged 16 and over in turn
IF age is 16 or over (DVAge>= 16)THENDiffoot"^LDMIntname (First of all I want to ask somequestions about any health problem orphysical disability that affectstravelling). Do you have any disability or otherlong standing health problem thatmakes it difficult for you to go out onfoot?NOTE: INCLUDE PROBLEMS DUETO OLD AGE"
1. "Yes"2. "No"
IF age is 16 or over (DVAge>= 16)AND respondent has health problemthat makes it difficult for them to go outon foot (Diffoot = Yes) THENFootout"^LDMIntName Do you go out on foot at all?IF YES, PROBE: on your own or onlywith someone to assist you"1. "Yes, on own"2. "Yes, only with someone to assist"3. "No"
IF age is 16 or over (DVAge>= 16)AND respondent has health problemthat makes it difficult for them to go outon foot (Diffoot = Yes) ANDrespondent does not go out on footalone (Footout IN [Assis, No]) THENGoOut"^LDMIntName Is it impossible for you to go out^alone on foot or could you manage itbut with difficulty?"1. "Impossible"2. "Difficult"
IF age is 16 or over (DVAge>= 16)THENDifBus"^LDMIntName (Do you have a disability or other longstanding health problem that makes itdifficult for you) to use local buses?NOTE: IF DOES NOT USEBUSES,PROBE: Would you have anyprobelems if you didi use them?INCLUDE PROBLEMS DUE TO OLDAGE(EXTRA INT. INSTRUCTIONADDED 2003 ONWARDS)NOTE: INCLUDE PROBLEMS DUETO OLD AGE"1. "Yes"2. "No"

National Centre for Social Research
230
IF age is 16 or over (DVAge>= 16)AND respondent has health problemthat makes it difficult for them to uselocal buses (DifBus = Yes) THENDifBusY"^LDMIntName How does this disability or healthproblem make it difficult for you to uselocal buses?PROBE: How else?CODE ALL THAT APPLY"1. "Difficulty getting to the bus stop"2. "Difficulty standing waiting at thebus stop"3. "Difficulty getting on or off buses"4. "Difficulty getting to and from theseat "5. "Difficulty communicating with thedriver/conductor"6. "Difficulty finding out timetableinformation"97. "Other (specify)"
(PRECODES CHANGED 2003ONWARDS TO:)1. "Difficulty getting to and from thebus stop"2. "Difficulty standing waiting at thebus stop"3. "Difficulty identifying destination ofbus"4. "Difficulty getting on or off buses"5. "Difficulty getting to and from theseat "6. "Difficulty communicating with thedriver/conductor"
If respondents disability makes itdifficult to use buses for other reason(Other IN DifBusY) THENXDifBusY"^LDMIntNamePlease specify other answer.TEXT SHOULD BE NO MORE THAN60 CHARACTERS"
IF age is 16 or over (DVAge>= 16)AND respondent has health problemthat makes it difficult for them to uselocal buses (DifBus = Yes) THEN
BusOut"^LDMIntName Can I check, do you use local busesat all nowadays?"1. "Yes"2. "No"
IF age is 16 or over (DVAge>= 16)AND respondent has health problemthat makes it difficult for them to uselocal buses (DifBus = Yes) ANDrespondent does not use local busesat all nowadays (BusOut = No) THENBusPrb95"^LDMIntName CODE FIRST THAT APPLIES Is it because of a disability or healthproblems or because the bus serviceis poor or for some other reasons?"1. "Disability or health problem"2. "Poor bus service"3. "Other (SPECIFY)"
IF respondent does not use localbuses at all nowadays for otherreasons (BusPrb95=Other)THENXBusPb95"^LDMIntName INTERVIEWER: Record other reason"
IF age is 16 or over (DVAge>= 16)THENDifCar"^LDMIntName (And do you have a disability or long-standing health problem that makes itdifficult for you) to get in or out of acar?NOTE: INCLUDE PROBLEMS DUETO OLD AGE"1. "Yes"2. "No"
IF age is 16 or over (DVAge>= 16)AND respondent has disability/longstanding health problem that makes itdifficult to go out on foot, use a localbus or get in or out of a car ((Diffoot =

National Centre for Social Research
231
Yes) OR (DifBus = Yes)) OR (DifCar =Yes)) THENSpecTr"^LDMIntNameSHOW CARD IAs far as you know or have heard, arethere any of these special transportservices in your area for people whohave difficulties in getting about?CODE ALL THAT APPLY"1. "Dial-a-ride service"2. "Supermarket bus "3. "Hospital car or service"4. "Day centre car or service"5. "Shared taxi scheme"6. "Taxi voucher scheme"7. "Postbus"8. "Community owned minibus"97. "Other special service (specify)"98. "(Don't know type/name ofservice)"99. "(Not aware of any of theseservices)"
IF respondent has heard of otherspecial transport service (SpecTr =Other)THENXSpecTr"^LDMIntNamePlease specify other answer.TEXT SHOULD BE NO MORE THAN60 CHARACTERS"
TMethod / QTMethod.NTSBMethod
Module A ASK ALWAYS IF age is 1 orover (DVAge >=1) THENIntroC"^LDMIntName I would now like to ask you aboutdifferent methods of transport youcurrently use. You may have told mesome of this already but I just need tocheck."1. "Press 1 and <Enter> to continue."
(QUESTION AND ROUTINGCHANGED 2004 ONWARDS TO:)
Module B ASK ALWAYS IF age is 1 orover (DVAge >=1) THENIntroC"^LDMIntNameI would now like to ask you about howmuch walking you do. You may havetold me some of this already but I justneed to check."1. "Press 1 and <Enter> to continue."
MOCULE B ASK ALWAYS IF age is 1or over (DVAge >=1) THENOrdbus" ^LDMIntNameSHOW CARD JHow frequently do you use an ordinarybus?PLEASE COUNT EACH SINGLETRIP AS ONE JOURNEY AND EACHRETURN TRIP AS TWO.NOTE: ONLY INCLUDE TRAVELWITHIN GREAT BRITAIN, OVER THELAST YEAR OR SO."1. "3 or more times a week"2. "Once or twice a week"3. "Less than that but more thantwice a month"4. "Once or twice a month"5. "Less than that but more thantwice a year"6. "Once or twice a year"7. "Less than that or never"
MOCULE B ASK ALWAYS IF age is 1or over (DVAge>=1) THENCoach" ^LDMIntNameSHOW CARD JHow frequently do you use) anexpress bus or coach within GreatBritainPLEASE COUNT EACH SINGLETRIP AS ONE JOURNEY AND EACHRETURN TRIP AS TWO.NOTE: ONLY INCLUDE TRAVELWITHIN GREAT BRITAIN, OVER THELAST YEAR OR SO."1. "3 or more times a week"2. "Once or twice a week"
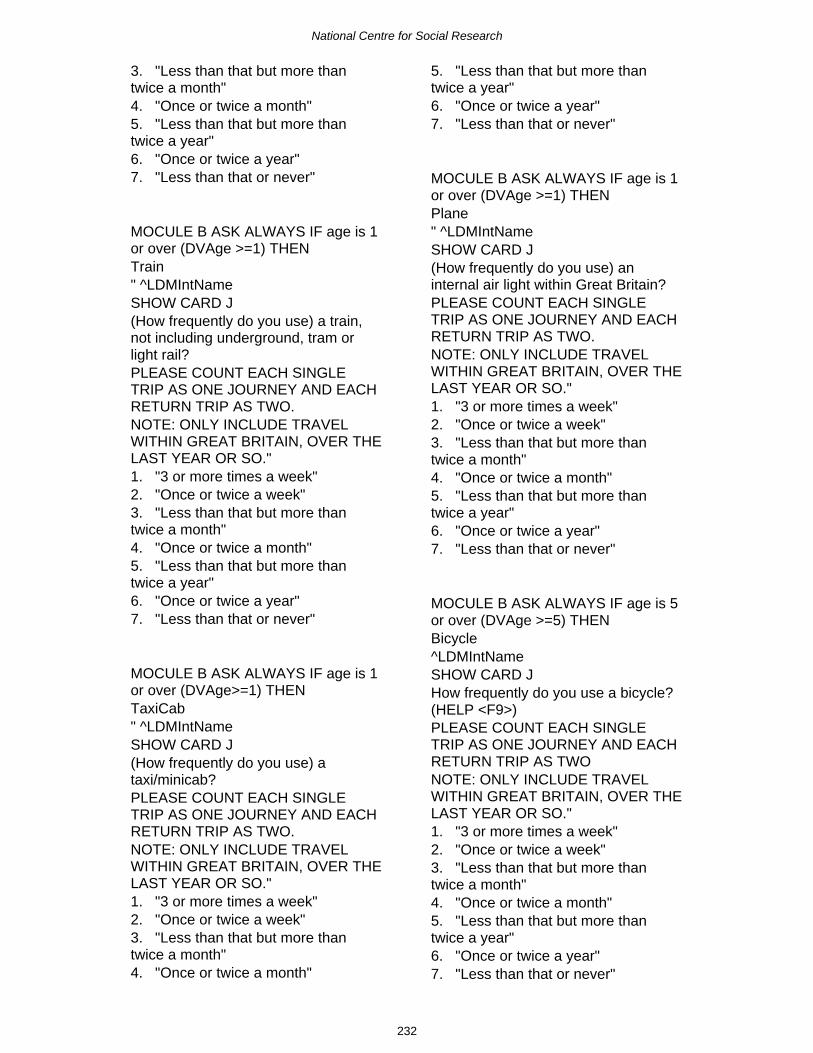
National Centre for Social Research
232
3. "Less than that but more thantwice a month"4. "Once or twice a month"5. "Less than that but more thantwice a year"6. "Once or twice a year"7. "Less than that or never"
MOCULE B ASK ALWAYS IF age is 1or over (DVAge >=1) THENTrain" ^LDMIntNameSHOW CARD J(How frequently do you use) a train,not including underground, tram orlight rail?PLEASE COUNT EACH SINGLETRIP AS ONE JOURNEY AND EACHRETURN TRIP AS TWO.NOTE: ONLY INCLUDE TRAVELWITHIN GREAT BRITAIN, OVER THELAST YEAR OR SO."1. "3 or more times a week"2. "Once or twice a week"3. "Less than that but more thantwice a month"4. "Once or twice a month"5. "Less than that but more thantwice a year"6. "Once or twice a year"7. "Less than that or never"
MOCULE B ASK ALWAYS IF age is 1or over (DVAge>=1) THENTaxiCab" ^LDMIntNameSHOW CARD J(How frequently do you use) ataxi/minicab?PLEASE COUNT EACH SINGLETRIP AS ONE JOURNEY AND EACHRETURN TRIP AS TWO.NOTE: ONLY INCLUDE TRAVELWITHIN GREAT BRITAIN, OVER THELAST YEAR OR SO."1. "3 or more times a week"2. "Once or twice a week"3. "Less than that but more thantwice a month"4. "Once or twice a month"
5. "Less than that but more thantwice a year"6. "Once or twice a year"7. "Less than that or never"
MOCULE B ASK ALWAYS IF age is 1or over (DVAge >=1) THENPlane" ^LDMIntNameSHOW CARD J(How frequently do you use) aninternal air light within Great Britain?PLEASE COUNT EACH SINGLETRIP AS ONE JOURNEY AND EACHRETURN TRIP AS TWO.NOTE: ONLY INCLUDE TRAVELWITHIN GREAT BRITAIN, OVER THELAST YEAR OR SO."1. "3 or more times a week"2. "Once or twice a week"3. "Less than that but more thantwice a month"4. "Once or twice a month"5. "Less than that but more thantwice a year"6. "Once or twice a year"7. "Less than that or never"
MOCULE B ASK ALWAYS IF age is 5or over (DVAge >=5) THENBicycle^LDMIntNameSHOW CARD JHow frequently do you use a bicycle?(HELP <F9>)PLEASE COUNT EACH SINGLETRIP AS ONE JOURNEY AND EACHRETURN TRIP AS TWONOTE: ONLY INCLUDE TRAVELWITHIN GREAT BRITAIN, OVER THELAST YEAR OR SO."1. "3 or more times a week"2. "Once or twice a week"3. "Less than that but more thantwice a month"4. "Once or twice a month"5. "Less than that but more thantwice a year"6. "Once or twice a year"7. "Less than that or never"

National Centre for Social Research
233
IF age is 1 or over (DVAge > 1) andrespondent goes out on foot(NOT(Footout = No)) THENWalk"^LDMIntNameSHOW CARD J How frequently do you walk anywherefor 20 minutes or more withoutstopping. Please count each single tripas one journey and each return trip astwo? (HELP <F9>)INCLUDE ALL WALKS, WHETHERFOR PLEASURE OR WITH APURPOSE. (EXTRA INT.INSTRUCTION ADDED 2003ONWARDS)IF ROUND TRIP, COUNT AS ONEJOURNEYNOTE: ONLY INCLUDE TRAVELWITHIN GREAT BRITAIN, OVER THELAST YEAR OR SO."1. "3 or more times a week"2. "Once or twice a week"3. "Less than that but more thantwice a month"4. "Once or twice a month"5. "Less than that but more thantwice a year"6. "Once or twice a year"7. "Less than that or never"
IF age is 1 or over (DVAge > 1) andrespondent goes out on foot (NOT(Footout = No)) AND respondentwalks for more than 20 minutes atleast once a year Walk IN[Wkly3..Yearly1] THENWhWalk"^LDMIntNameThinking about your @Ilast@I walk of20 minutes or more, where did youwalk ... READ OUTCODE ONE ONLY"1. "...mostly on pavements alongsidea road,"2. "mostly on country roads withoutpavements,"3. "mostly in a town or city park, orother urban area away from the road,"
4. "mostly in the countryside (awayfrom roads),"5. "or a mixture of these?"97. "Other (SPECIFY)"
(CHANGED 2003 ONWARDS TO:)"^LDMIntName Thinking about your@Ilast@I walk of 20 minutes or more,where did you walk? Please chooseyour answer from this card.CODE ONE ONLY"1. "...mostly on pavements alongsidea road,"2. "mostly on country roads withoutpavements,"3. "mostly in a town or city park, orother urban area away from the road,"4. "mostly in the countryside (awayfrom roads),"5. "or a mixture of these?"97. "Other (SPECIFY)"
IF respondent walked on anothersurface (WhWalk = other)THENXWhWalk"^LDMIntNamePlease specify other answer.TEXT SHOULD BE NO MORE THAN60 CHARACTERS"
IF age is 1 or over (DVAge > 1) andrespondent goes out on foot(NOT(Footout = No)) AND respondentwalks for more than 20 minutes atleast once a year Walk IN[Wkly3..Yearly1] THENFarWalk"^LDMIntNameHow long did the walk take you, oneway?PLEASE COUNT EACH SINGLETRIP AS ONE JOURNEYBUT IF NO PARTICULARDESTINATION, RECORD TIMETAKEN FOR ROUND TRIPENTER ANSWER IN MINUTES ORCODE 997 IF PREFERS TO GIVEDISTANCE"

National Centre for Social Research
234
If respondent prefers to give distanceof walk (FarWalk = 997) THENDistWalk"^LDMIntNameENTER DISTANCE WALKED TONEAREST MILE"
IF age is 1 or over (DVAge > 1) andrespondent goes out on foot(NOT(Footout = No)) AND respondentwalks for more than 20 minutes atleast once a year Walk IN[Wkly3..Yearly1] THENTrWalk"^LDMIntNameDid you have to travel to get to thestart of the walk?ADD IF NECESSARY: By meansother than walking"1. "Yes"2. "No"
IF respondent travelled to get to startof walk (TrWalk = Yes) THENHtrWalk"^LDMIntNameHow did you travel there?CODE METHOD USED FORLONGEST DISTANCE"1. "Underground, metro, light rail,tram"2. "Train"3. "Bus, minibus or coach"4. "Motorcycle, scooter or moped"5. "Car or van"6. "Taxi/minicab"7. "Bicycle"97. "Other (specify)"
If respondent used other method oftravel (HtrWalk = other)XHTrWalk"^LDMIntNamePlease specify other answer.TEXT SHOULD BE NO MORE THAN60 CHARACTERS"
TCycle / QTCycle.NTS
BCycle
Questions asked of:Each individual household memberaged 5 and over in turn
IF age is greater than 4 (DVAge > 4)THENGenCycle"^LDMIntName (The next few questions are aboutcycling.) Excluding exercise bikes, doyou... READ OUT..."1. "...own a bicycle yourself,"2. "have regular use of a bicycleowned by someone else,"3. "or have no regular use of abicycle?"
IF age is greater than 4 (DVAge > 4)AND respondent regularly uses bicycleowned by someone else (GenCycle =UseElse) THENCycElse"^LDMIntName Is that bicycle owned by someone inyour household or someone outsidethe household?"1. "Someone in the household"2. "Someone outside the household"
IF age is greater than 4 (DVAge > 4)THENCycle12"^LDMIntName (May I just check,) have you ridden abicycle during the last 12 months, (thatis since ^DLYEARTXT)? (HELP<F9>)"1. "Yes"2. "No"3. "Don't know / Can't remember"
IF age is 4 or more (DVAge > 4) ANDrespondent has ridden bike in last 12months (Cycle12 = Yes) THENCycRoute"^LDMIntName

National Centre for Social Research
235
When you cycled in the last 12months, did you usually cycle... READOUT..."1. "...mainly on the road,"2. "mainly on pavements, cycle pathsor cycle lanes that were not part of aroad,"3. "mainly off the road in parks, opencountry, or private land,"4. "or on a variety of differentsurfaces?"
CHANGED 2003 onwards to:"^LDMIntNameWhen you cycled in the last 12months, where did you usually cycle?Please choose an answer from thiscard.1. "...mainly on the road,"2. "mainly on pavements, cycle pathsor cycle lanes that were not part of aroad,"3. "mainly off the road in parks, opencountry, or private land,"4. "or on a variety of differentsurfaces?"
TDrLic / QTDrLic.NTSBDrlic
Questions asked of :Each individual household memberaged 16 and over in turn
If age is 16 or over (DVAge >= 16)THENDLFull"^LDMIntName Do you hold a full driving licence validin Great Britain to drive either a car, ora motorcycle, scooter or moped? INCLUDE: DISQUALIFIED DRIVERSAND INTERNATIONALPERMITS/OTHER LICENCES VALIDIN THE UK."1. "Yes"2. "No"
If respondent has full driving licence(DLFull = Yes) THENDLTyp95"^LDMIntName Is it for a car only, a motorcycle onlyor for both, or is it for a car with specialadaptations? THE CODES AFTER THE '/' APPLYTO LICENCES ISSUED AFTER JUNE1990INTERVIEWER: ASK RESPONDENTTO CHECK DRIVING LICENCE"1. "Car (A or B) / (B)"2. "Car (A or B) / (B) - (AUTOMATICONLY)"3. "Both car and motorcycle(A&D)/(A&B)"4. "Motorcycle (D) / (A)/P"5. "Car with special adaptations (Arestricted, B)"6. "Moped (E) / (P)"
If respondent has full driving licence(DLFull = Yes) AND licence typeappears in the list above DLTyp95 IN[Car .. Moped] THEN LicChk"^LDMIntNameINTERVIEWER: CODE WHETHERDRIVING LICENCE CHECKED FORPREVIOUS QUESTION"1. "Seen by interviewer"2. "Consulted by informant"3. "Not seen/consulted"
IF driving licence is for both a car andmotorcycle (DLTyp95 = CarMot) THENCarMot95"^LDMIntName May I just check, have you actuallypassed a test to drive a motorcycle ofover 125CC?"1. "Yes"2. "No"
IF respondent has licence for a car orcar with special adaptations (DLTyp95= Car OR DLTyp95 = Auto OR

National Centre for Social Research
236
DLTyp95 = CarRes OR CarMot95 =RESPONSE) THENDrive95"^LDMIntName Do you drive... READ OUT ...(HELP <F9>)CODE AUTOMATIC CAR AS ANORDINARY CARCODE ALL THAT APPLY"1. "...an ordinary car (without specialadaptations for people withdisabilities),"2. "...a car with special adaptationsfor people with disabilities,"3. "...or some other kind of vehicle?"4. "(no longer drive)"
IF respondent drives some other kindof vehicle (Drive95 = other) THENXOthVeh"^LDMIntName INTERVIEWER: DESCRIBE THISOTHER TYPE OF VEHICLE"
If respondent has licence for a car orcar with special adaptations (DLTyp95= Car OR DLTyp95 = Auto ORDLTyp95 = CarRes OR CarMot95 =RESPONSE) AND respondent usesvehicles from a car pool, or has ahousehold vehicle or broken vehicleand drives an ordinary car or a carwith special adaptations or some otherkind of vehicle ((CarPool = Yes ORUseVcl = Yes OR BrokenV = Yes)AND (Drive95 = OrdVeh OR Drive95 =OrdAdp OR OthVeh)) THENVehUsu"^LDMIntName READ OUT IF MORE THAN ONEVEHICLE(May I check) which is the car/(vehicle)you usually drive? INTERVIEWER: ENTER VEHICLENUMBER OR CODE 89 IFINFORMANT USUALLY DRIVES ANON-HOUSEHOLD CAR^DMVEH[1](1)^s^s ^DMVEH[2](2)^s^s^DMVEH[3](3)^s^s ^DMVEH[4](4)^s^s^DMVEH[5](5)^s^s ^DMVEH[6](6)^s^s^DMVEH[7](7)^s^s ^DMVEH[8](8)^s^s
^DMVEH[9](9)^s^s^DMVEH[10](10)^s^s"
(CHANGED 2003 ONWARDS TO:)"^LDMIntName READ OUT IF MORE THAN ONEVEHICLE(May I check) which is the car/(vehicle)you usually drive? INTERVIEWER: ENTER VEHICLENUMBER OR CODE 89 IFINFORMANT USUALLY DRIVES ANON-HOUSEHOLD CAR(1) ^DMVEH[1](2) ^DMVEH[2](3) ^DMVEH[3](4) ^DMVEH[4](5) ^DMVEH[5](6) ^DMVEH[6](7) ^DMVEH[7](8) ^DMVEH[8](9) ^DMVEH[9](10) ^DMVEH[10](89) Usually drives non householdvehicle"
If respondent has licence for a car orcar with special adaptations (DLTyp95= Car OR DLTyp95 = Auto ORDLTyp95 = CarRes OR CarMot95 =RESPONSE) AND respondent nolonger drives (Drive95=NoDrv) THENNodriv95"^LDMIntNameIs that because of a disability or healthproblem or for some other reason?"1. "Disability or health problem"2. "Other (SPECIFY)"
If respondent does not drive for someother reason (NoDrive95 =other)THENXNodriv"^LDMIntName INTERVIEWER: EXPLAIN WHYINFORMANT NO LONGER DRIVES."

National Centre for Social Research
237
IF respondent (does not hold a fulldriving licence or has a motorcyle ormoped licence) and is older than 59((DLFull = No OR DLTyp95 = McycleOR DLTyp95 = Moped) AND (DVAge> 59)) THENEvDLic95"^LDMIntName Have you ever held a full drivinglicence valid in Great Britain to drive a car?"1. "Yes"2. "No"
If respondent (does not hold a fulldriving licence or has a motorcyle ormoped licence) ((DLFull = No ORDLTyp95 = Mcycle OR DLTyp95 =Moped) AND is older than 59 (DVAge> 59)) AND respondent had a fulldriving licence to drive a car(EvDLic95 = Yes) THENNolic95"^LDMIntNameWhy do you no longer hold a licence?Is it because of a disability or healthproblem or for some other reason?"1. "Disability or health problem"2. "Other (SPECIFY)"
IF there is some other reason whyrespondent no longer holds a licence(Nolic95 = other)THENXNoLic95"^LDMIntName INTERVIEWER: EXPLAIN WHYINFORMANT NO LONGER HOLDS ALICENCE."
IF respondent held a full drivinglicence to drive a car or respondent nolonger drives (EvDLic95 = Yes ORDrive95 = NoDrv) THENLastDr95"^LDMIntName How old were you when you lastdrove?"
IF respondent has full driving licencefor car, motorcycle, scooter, or moped(DLFull = Yes) THENDLAge"^LDMIntName How old were you when you FIRSTobtained a full licence?"
IF respondent does not have a fulldriving licence for a car, motorcycle,scooter or moped and respondent hasnever held a full driving licence for acar (DLFull = No AND EvDLic95 = No)THENDLProv"^LDMIntName Do you hold a provisional drivinglicence for a car, motorcycle, scooteror moped?"1. "Yes"2. "No"
If age is 16 or over (DVAge >= 16)AND respondent does not have a fulldriving licence for a car, motorcycle,scooter or moped and respondent hasnever held a full driving licence for acar (DLFull = No AND EvDLic95 = No)AND respondent has a provisionallicence for a car, motorcycle, scooteror moped (DLProv = Yes) THENProTyp95"^LDMIntName Is it for a car only, acar and motorcycle, a car with specialadaptations or something else? CODE FIRST THAT APPLIES"1. "Car only"2. "Car and motorcycle"3. "Car with special adaptations"4. "Something else (SPECIFY)"
IF provisional licence is for some othervehicle (ProTyp95 = Other) THENXProTp95"^LDMIntNameINTERVIEWER: Record other answer"

National Centre for Social Research
238
TILO / QTILO.NTSBILO
Questions asked of:Each individual household memberaged 16 and over in turn
(QUESTION ADDED 2004ONWARDS:)
IF aged 16 or over (DvAge >=16)THENTDirPriv"SHOW CARD L1LDMIntNameThinking of any journeys you havemade by car, van or motorcycle withinthe last 6 months, which (if any)ofthese have you done to plan yourroute before setting out?CODE ALL THAT APPLY"1. "Looked at a road map",2. "Asked a friend",3. "Telephoned the AA or RAC",4. "Contacted the venue/attractionyou are visiting",5. "Used Transport Direct",6. "Used another journey planner onthe Internet",7. "Used a computer-based journeyplanner on CD",8. "Checked Teletext/Ceefax forroadworks/congestion",9. "Used an in-car navigationsystem",10. "Relied on road signs",11. "None - never to go unfamiliarplaces",12. "None - someone else usuallyplans the route for me",13. "None - have not done a journey",97. "Anything else (specify)"
(QUESTION ADDED 2004ONWARDS:)
If respondent had other method ofplanning jounreys (Anything else INTDirPriv) THENXTDirPr
"^LDMIntNamePlease specify other answer.TEXT SHOULD BE NO MORE THAN60 CHARACTERS"
(QUESTION ADDED 2004ONWARDS:)
IF aged 16 or over (DvAge >=16)THENTDirPub"SHOW CARD L2Thinking of any journeys you havemade by bus, tram, train orunderground within the last 6 months,which (if any)of these have you usedto get travel information or adviceabout your journey?CODE ALL THAT APPLY"1. "Asked a friend"2. "Public transport telephone inquiryservice"3. "Timetable delivered throughdoor/picked up at stations"4. "Timetable displayed at stationsand stops"5. "Asked at a local station"6. "Contacted the venue/attractionyou are visiting"7. "Teletext/Ceefax"8. "Digital TV interactive services"9. "Electronic kiosks/terminals"10. "Used Transport Direct"11. "Used other web sites"12. "None - someone else usuallyfinds out for me"13. "None - have not done a journey"14. "None"97. "Other (please specify)"
(QUESTION ADDED 2004ONWARDS:)
If respondent had other method ofgetting travel information or advice forjourneys (Other IN TdirPriv) THENXTDirPub"LDMIntNamePlease specify other answer.
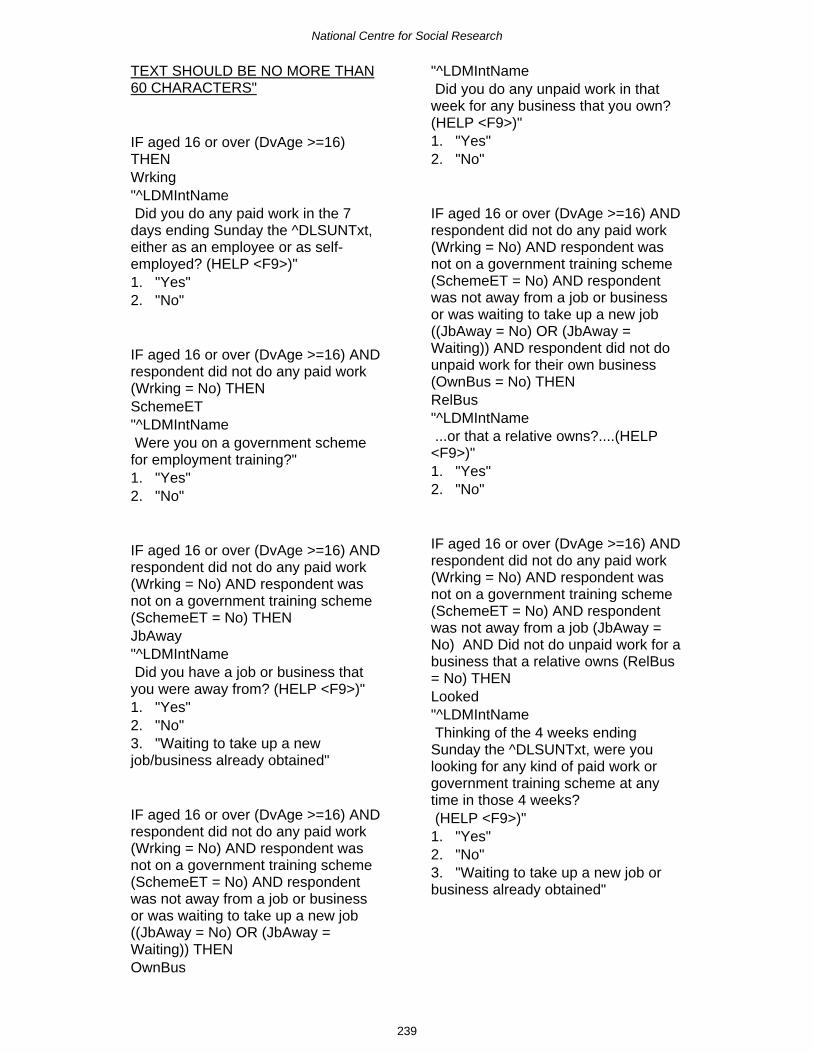
National Centre for Social Research
239
TEXT SHOULD BE NO MORE THAN60 CHARACTERS"
IF aged 16 or over (DvAge >=16)THENWrking"^LDMIntName Did you do any paid work in the 7days ending Sunday the ^DLSUNTxt,either as an employee or as self-employed? (HELP <F9>)"1. "Yes"2. "No"
IF aged 16 or over (DvAge >=16) ANDrespondent did not do any paid work(Wrking = No) THENSchemeET"^LDMIntName Were you on a government schemefor employment training?"1. "Yes"2. "No"
IF aged 16 or over (DvAge >=16) ANDrespondent did not do any paid work(Wrking = No) AND respondent wasnot on a government training scheme(SchemeET = No) THENJbAway"^LDMIntName Did you have a job or business thatyou were away from? (HELP <F9>)"1. "Yes"2. "No"3. "Waiting to take up a newjob/business already obtained"
IF aged 16 or over (DvAge >=16) ANDrespondent did not do any paid work(Wrking = No) AND respondent wasnot on a government training scheme(SchemeET = No) AND respondentwas not away from a job or businessor was waiting to take up a new job((JbAway = No) OR (JbAway =Waiting)) THENOwnBus
"^LDMIntName Did you do any unpaid work in thatweek for any business that you own?(HELP <F9>)"1. "Yes"2. "No"
IF aged 16 or over (DvAge >=16) ANDrespondent did not do any paid work(Wrking = No) AND respondent wasnot on a government training scheme(SchemeET = No) AND respondentwas not away from a job or businessor was waiting to take up a new job((JbAway = No) OR (JbAway =Waiting)) AND respondent did not dounpaid work for their own business(OwnBus = No) THENRelBus"^LDMIntName ...or that a relative owns?....(HELP<F9>)"1. "Yes"2. "No"
IF aged 16 or over (DvAge >=16) ANDrespondent did not do any paid work(Wrking = No) AND respondent wasnot on a government training scheme(SchemeET = No) AND respondentwas not away from a job (JbAway =No) AND Did not do unpaid work for abusiness that a relative owns (RelBus= No) THENLooked"^LDMIntName Thinking of the 4 weeks endingSunday the ^DLSUNTxt, were youlooking for any kind of paid work orgovernment training scheme at anytime in those 4 weeks? (HELP <F9>)"1. "Yes"2. "No"3. "Waiting to take up a new job orbusiness already obtained"

National Centre for Social Research
240
(QUESTION ADDED 2004ONWARDS:)
IF aged 16 or over (DvAge >=16) ANDrespondent did not do any paid work(Wrking = No) AND respondent wasnot on a government training scheme(SchemeET = No) AND respondentwas looking for a job (Look=Yes) orwaiting to take up a new job orbusiness already obtained (JbAway=Waiting OR Looked= Waiting) THENHowLong"SHOW CARD L3LDMIntNameHow long have you been looking/wereyou looking for paid work/a place on agovenment scheme"1. "Not yet started"2. "Less than 1 month"3. "1 month or more, less than 3months"4. "3 months or more, less than 6months"5. "6 months or more, less than 12months"6. "12 Months or more"
IF aged 16 or over (DvAge >=16) ANDrespondent did not do any paid work(Wrking = No) AND respondent wasnot on a government training scheme(SchemeET = No) AND respondentwas looking for a job, or waiting to takeup a new job (Looked = Yes ORLooked = Wait OR JbAway = Waiting) THENStartJ"^LDMIntName If a job or a place on a governmentscheme had been available in theweek ending Sunday the ^DLSUNTxt,would you have been able to startwithin 2 weeks?"1. "Yes"2. "No"
IF aged 16 or over (DvAge >=16) ANDrespondent did not do any paid work
(Wrking = No) AND respondent wasnot on a government training scheme(SchemeET = No) AND respondentwas not looking for paid work or didnot have a job that they were awayfrom (Looked = No OR StartJ = No)THENYInAct"^LDMIntName What was the main reason you (didnot seek any work in the last 4weeks/would not be able to start in thenext 2 weeks?)(HELP <F9>)"1. "Student"2. "Looking after the family/home"3. "Temporarily sick or injured"4. "Long-term sick or disabled"5. "Retired from paid work"6. "Other reasons"
TEDUC / QTEduc.NTSBEDUC
Questions asked of:Each individual household memberaged 16 and over in turn, if any ofthe following conditions are met:
Wrking = Yes (1)
SchemeET = Yes (1)
JbAway = Yes (1) or “Waiting” (3)
Looked = Yes (1)
IF respondent did paid work or was ona government scheme for training orwas away from a job or business orwaiting to take up a new job or lookingfor paid work (Wrking = Yes ORSchemeET = Yes OR JbAway = YesOR JbAway = Waiting OR Looked =Yes) THENEduc"^LDMIntName Are you at present attending a schoolor college?"1. "Yes"

National Centre for Social Research
241
2. "No"
IF respondent did paid work or was ona government scheme for training orwas away from a job or business orwaiting to take up a new job or lookingfor paid work (Wrking = Yes ORSchemeET = Yes OR JbAway = YesOR JbAway = Waiting OR Looked =Yes) AND respondent is attendingschool or college (Educ = Yes) THENEducFT"^LDMIntName May I check, are you a full-timestudent?"1. "Yes"2. "No"
TTrEmp / QTTrEmp.NTSBTrEmp
Questions asked of:Each individual household memberin turn, if the following conditions aremet:
Male aged 16 to 64 (inclusive) ANDDVILO3a= “unemp“ or “ecinact” (ILOclassification of employment:Unemployed or EconomicallyInactive) AND Educ = No (2)
Female aged 16 to 59 (inclusive)AND DVILO3a= “unemp“ or“ecinact” (ILO classification ofemployment: Unemployed orEconomically Inactive) AND Educ =No (2)
IF respondent is unemployed orecomically inactive (DVILO3a =Unemp OR DVILO3a = EcInAct) AND(a male aged under 65 (DVAge < 65AND Sex = Male)OR a female aged under 60 (DVAge< 60 AND Sex = Female)) AND notattending school or college (Educ =No) THENPrbJob"^LDMIntName
Have you turned down a job in thepast 12 months due to problems withtransport?"1. "Yes"2. "No"
IF respondent is unemployed orecomically inactive (DVILO3a =Unemp OR DVILO3a = EcInAct) AND(a male aged under 65 (DVAge < 65AND Sex = Male) OR a female agedunder 60 (DVAge < 60 AND Sex =Female)) AND not attending school orcollege AND (Educ = No) ANDrespondent had problems withtransport (PrbJob = Yes) THENPrbTyp1"^LDMIntName What sort of problems with transportwere these?CODE ALL THAT APPLY"1. "Too far"2. "Car not available"3. "Don't have a current drivinglicence/can't drive"4. "Cost of petrol"5. "Lack of parking facilities"6. "Cost of parking"7. "Traffic congestion/roadworks"8. "Inadequate public transport"9. "Cost of using public transport"10. "Personal physicaldifficulties/disability"11. "Personal safety concerns"97. "Other (specify)"
IF respondent had other problem withtransport (Other IN PrbTyp1) THENXPrbTyp1"^LDMIntName Please specify other answer.TEXT SHOULD BE NO MORE THAN60 CHARACTERS"
IF respondent is unemployed orecomically inactive (DVILO3a =Unemp OR DVILO3a = EcInAct) AND(a male aged under 65 (DVAge < 65AND Sex = Male) OR a female aged

National Centre for Social Research
242
under 60 (DVAge < 60 AND Sex =Female)) AND not attending school orcollege AND (Educ = No) THENPrbNow"^LDMIntName And do you have any problems withtransport now which would stop youfrom taking a job?"1. "Yes"2. "No"
IF respondent is unemployed oreconomically inactive (DVILO3a =Unemp OR DVILO3a = EcInAct) AND(a male aged under 65 (DVAge < 65AND Sex = Male) OR a female agedunder 60 (DVAge < 60 AND Sex =Female)) AND not attending school orcollege (Educ = No) AND respondenthas a problem now that would stopthem taking a job AND If respondenthas mentioned a problem withtransport earlier (PrbNow = Yes andPrbTyp1 = RESPONSE) THENPrbSame"^LDMIntName Are these problems the same asthose you mentioned before?"1. "Yes"2. "No"
IF respondent does not have sameproblem as before (PrbSame = No)OR did not specify the earlier problem(PrbTyp1 <> RESPONSE) THENPrbTyp2"^LDMIntName What sort of problems with transportare these?CODE ALL THAT APPLY"1. "Too far"2. "Car not available"3. "Don't have a current drivinglicence/can't drive"4. "Cost of petrol"5. "Lack of parking facilities"6. "Cost of parking"7. "Traffic congestion/roadworks"8. "Inadequate public transport"9. "Cost of using public transport"
10. "Personal physicaldifficulties/disability"11. "Personal safety concerns"97. "Other (specify)"
IF respondent had other problem withtransport (PrbTyp2 = other) THENXPrbTyp2"^LDMIntNamePlease specify other answer.TEXT SHOULD BE NO MORE THAN60 CHARACTERS"TLastJb / QTLastJb.NTSBlastJb
Questions asked of:Each individual household memberaged 16 and over in turn, if thefollowing condition is met:
DVILO3a= “unemp“ or “ecinact” (ILOclassification of employment:Unemployed or EconomicallyInactive)
IF employment status derived aseconomically inactive or unemployed(DVILO3a = EcInAct or DVILO3a =Unemp) THENEverwk"^LDMIntName Have you ever had a paid job, apartfrom casual or holiday work?"1. "Yes"2. "No"
IF employment status derived aseconomically inactive or unemployed(DVILO3a = EcInAct or DVILO3a =Unemp) AND respondent has had apaid job (Everwk = Yes) THENDtJbL"^LDMIntName When did you leave your last PAIDjob? FOR DAY NOT GIVEN.....ENTER 15FOR DAY FOR MONTH NOT GIVEN....ENTER6 FOR MONTH

National Centre for Social Research
243
THIS QUESTION DOES NOTINCLUDE CASUAL OR HOLIDAYWORK (EXTRA INT. INSTRUCTIONADDED 2003 ONWARDS)(HELP <F9>)"
TMainJb / QTMainJb.NTSBMainJb
Questions asked of:Each individual household memberaged 16 and over in turn, if thefollowing conditions are met:
DVILO3a= “InEmp” (ILOclassification of employment:Employed)
AND
Everwk = Yes (1)
IF respondent is aged 16 orover(DvAge >=16) AND employmentstatus is derived as employed(DVILO3a = InEmp) OR respondenthas had a paid job (Everwk = Yes)THENIndD"^LDMIntNameCURRENT OR LAST JOBWhat did/(does) the firm/organisationyou work(ed) for mainly make or do (atthe place where you work(ed))?DESCRIBE FULLY - PROBEMANUFACTURING or PROCESSINGor DISTRIBUTING ETC. AND MAINGOODS PRODUCED, MATERIALSUSED, WHOLESALE or RETAILETC."
IF employment status is derived asemployed (DVILO3a = InEmp) ORrespondent has had a paid job(Everwk = Yes)OccT"^LDMIntName^s^s^s^s JOB TITLE^s^s^s CURRENTOR LAST JOB
What was/(is) your (main) job(^LMainJb2 ^DLSUNTxt)? (HELP<F9>)"
IF employment status is derived asemployed (DVILO3a = InEmp) ORrespondent has had a paid job(Everwk = Yes)OccD"^LDMIntName^s^s^s CURRENT OR LAST JOB What did/ (do) you mainly do in yourjob? CHECK SPECIALQUALIFICATIONS/TRAININGNEEDED TO DO THE JOB"
IF employment status is derived asemployed (DVILO3a = InEmp) ORrespondent has had a paid job(Everwk = Yes)Stat"^LDMIntName Were/(are) you working as anemployee or were/(are) you self-employed? (HELP <F9>)"1. "Employee"2. "Self-employed"
IF (employment status is derived asemployed (DVILO3a = InEmp) ORrespondent has had a paid job(Everwk = Yes)) AND respondent wasan employee (Stat = Emp) THENSVise"^LDMIntName In your job, do/(did) you have formalresponsibility for supervising the workof other employees?DO NOT INCLUDE PEOPLE WHOONLY SUPERVISE:- children, e.g. teachers, nannies,childminders- animals- security or buildings, e.g. caretakers,security guards "1. "Yes"2. "No"

National Centre for Social Research
244
IF (employment status is derived asemployed (DVILO3a = InEmp) ORrespondent has had a paid job(Everwk = Yes)) AND respondent wasan employee (Stat = Emp) ANDrespondent did supervise otheremployees (SVise = Yes) THENSViseDesc"^LDMIntNamePlease describe the type ofresponsibility you have for supervisingthe work of other employees.INTERVIEWER: PROBE FOR WHOAND WHAT IS BEING SUPERVISED"
IF (employment status is derived asemployed (DVILO3a = InEmp) ORrespondent has had a paid job(Everwk = Yes)) AND respondent wasan employee (Stat = Emp)EmpNo"^LDMIntName How many people work(ed) for youremployer at the place where youwork(ed)?Were there ^s^s^s ...READ OUT(HELP <F9>)"1. "...1 to 24,"2. "25 to 499,"3. "or 500 or more employees?"
IF (employment status is derived asemployed (DVILO3a = InEmp) ORrespondent has had a paid job(Everwk = Yes)) AND respondent wasnot an employee (NOT(Stat =Emp))AND respondent was/is selfemployed (Stat = SelfEmp) THENSolo"^LDMIntNameWere/(are) you working on your ownor did/(do) you have employees?ASK OR RECORD(HELP <F9>)"1. "on own/with partner(s) but noemployees"2. "with employees"
IF respondent works/has worked withemployees (Solo = WithEmp) THENSENo"^LDMIntNameHow many people did/(do) you employat the place where you work(ed)?Were/(Are) there ^s^s^s ... READ OUT... (HELP <F9>)"1. "...1 to 24,"2. "25 to 499,"3. "or 500 or more employees?"
(PRECODES CHANGED 2003ONWARDS TO:)1. "...1 to 24,"2. "or, 25 or more?"
IF employment status is derived asemployed (DVILO3a = InEmp) ORrespondent has had a paid job(Everwk = Yes) THENFtPtWk"^LDMIntNameIn your (main) job were/(are) youworking... READ OUT ...(HELP <F9>)"1. "...full time,"2. "or part time?"
TTrBen / QTTrBen.NTSBTrBen
Questions asked of:Each individual household memberaged 16 and over in turn, if thefollowing conditions are met:
DVILO3a= “InEmp” (ILOclassification of employment:Employed)
AND
Stat = Emp (respondent is anemployee)
IF respondents employment status isderived as employed and respondentwas working as an employee

National Centre for Social Research
245
(DVILO3a = InEmp AND Stat = Emp)THENTrBen"^LDMIntNameSHOW CARD K. Are any employees at your place ofwork (in your main job) offered any ofthe travel benefits on this card? IFYES, PROBE: Which ones? (HELP<F9>)EXCLUDE REIMBURSEDEXPENSES, TRAVEL WARRANTSETC.CODE ALL THAT APPLY"1. "Cut price or free bus tickets"2. "Cut price or free rail tickets"3. "Interest-free loan for a seasonticket or travel pass"4. "Interest-free loan for a seasonticket for parking"5. "Cut price or free car parking"6. "Company car or alternativebenefit in place of a car"7. "Special bus or van run by youremployer for your journey to work"8. "Other transport-related benefits(specify)"9. "No, none of these"
(PRECODES CHANGED 2003 ONLYTO:)1. "Cut price or free bus tickets"2. "Cut price or free rail tickets"3. "Interest-free loan for a seasonticket or travel pass"4. "Interest-free loan for a seasonticket for parking"5. "Cut price or free car parking"6. "Company car or alternativebenefit in place of a car"7. "Use of car(s) from company carpool"8. "Special bus or van run by youremployer for your journey to work"9. "Other transport-related benefits(specify)"10. "No, none of these"
TrBen (QUESTION DELETED 2004ONWARDS)
IF employees are offered othertransport related benefit (TrBen =other) THENXTrBen"^LDMIntName Please specify other answer.TEXT SHOULD BE NO MORE THAN60 CHARACTERS"
XtrBen (QUESTION DELETED 2004ONWARDS)
IF respondent is/was working as anemployee (DVILO3a = InEmp ANDStat = Emp) AND respondent receivestravel benefit (TrBen = RESPONSE)THENTrBenU"^LDMIntNameSHOW CARD K. And does your employer (in your mainjob) offer @Iyou@I any of the benefitson this card?IF YES, PROBE: Which ones? (HELP<F9>)EXCLUDE REIMBURSEDEXPENSES, TRAVEL WARRANTSETC.CODE ALL THAT APPLY"1. "Cut price or free bus tickets"2. "Cut price or free rail tickets"3. "Interest-free loan for a seasonticket or travel pass"4. "Interest-free loan for a seasonticket for parking"5. "Cut price or free car parking"6. "Company car or alternativebenefit in place of a car"7. "Special bus or van run by youremployer for your journey to work"8. "Other transport-related benefits(specify)"9. "No, none of these"
(PRECODES CHANGED 2003ONWARDS TO:)1. "Cut price or free bus tickets"2. "Cut price or free rail tickets"3. "Interest-free loan for a seasonticket or travel pass"

National Centre for Social Research
246
4. "Interest-free loan for a seasonticket for parking"5. "Cut price or free car parking"6. "Company car or alternativebenefit in place of a car"7. "Use of car(s) from company carpool"8. "Special bus or van run by youremployer for your journey to work"9. "Other transport-related benefits(specify)"10. "No, none of these"
(ROUTING CHANGED 2004ONWARDS TO:IF respondent is/was working as anemployee (DVILO3a = InEmp ANDStat = Emp) THENTrBenU
IF respondent was offered some othertravel benefit (TrBenU = other) THENXTrBenU"^LDMIntNamePlease specify other answer.TEXT SHOULD BE NO MORE THAN60 CHARACTERS"
IF respondent is/was working as anemployee (DVILO3a = InEmp ANDStat = Emp) ANDrespondent wasoffered cut price or free bus tickets(TrBenU = BusT) THENUseBusT"^LDMIntNameDo you make use of the cut price orfree bus tickets?"1. "Yes"2. "No"
IF respondent is/was working as anemployee (DVILO3a = InEmp ANDStat = Emp) ANDrespondent wasoffered cut price or free train tickets(TrBenU = TrnT) THENUseTrnT"^LDMIntNameDo you make use of the cut price orfree train tickets?"
1. "Yes"2. "No"
IF respondent is/was working as anemployee (DVILO3a = InEmp ANDStat = Emp) ANDrespondent wasoffered interest-free loan for a seasonticket or travel pass (TrBenU = Loan)THENUseLoan"^LDMIntNameDo you make use of the interest-freeloan for a season ticket or travelpass?"1. "Yes"2. "No"
IF respondent is/was working as anemployee (DVILO3a = InEmp ANDStat = Emp) ANDrespondent wasoffered interest-free loan for a seasonticket for parking (TrBenU =PLoan)THENUsePL"^LDMIntNameDo you make use of the interest-freeloan for a season ticket for parking?"1. "Yes"2. "No"
IF respondent is/was working as anemployee (DVILO3a = InEmp ANDStat = Emp) ANDrespondent wasoffered cut price or free car parking(TrBenU = FreeP) THENUseFP"^LDMIntNameDo you make use of the cut price orfree car parking?"1. "Yes"2. "No"
IF respondent is/was working as anemployee (DVILO3a = InEmp ANDStat = Emp) ANDrespondent wasoffered special bus or van run byemployer (TrBenU = WrkB) THENUseWrkB
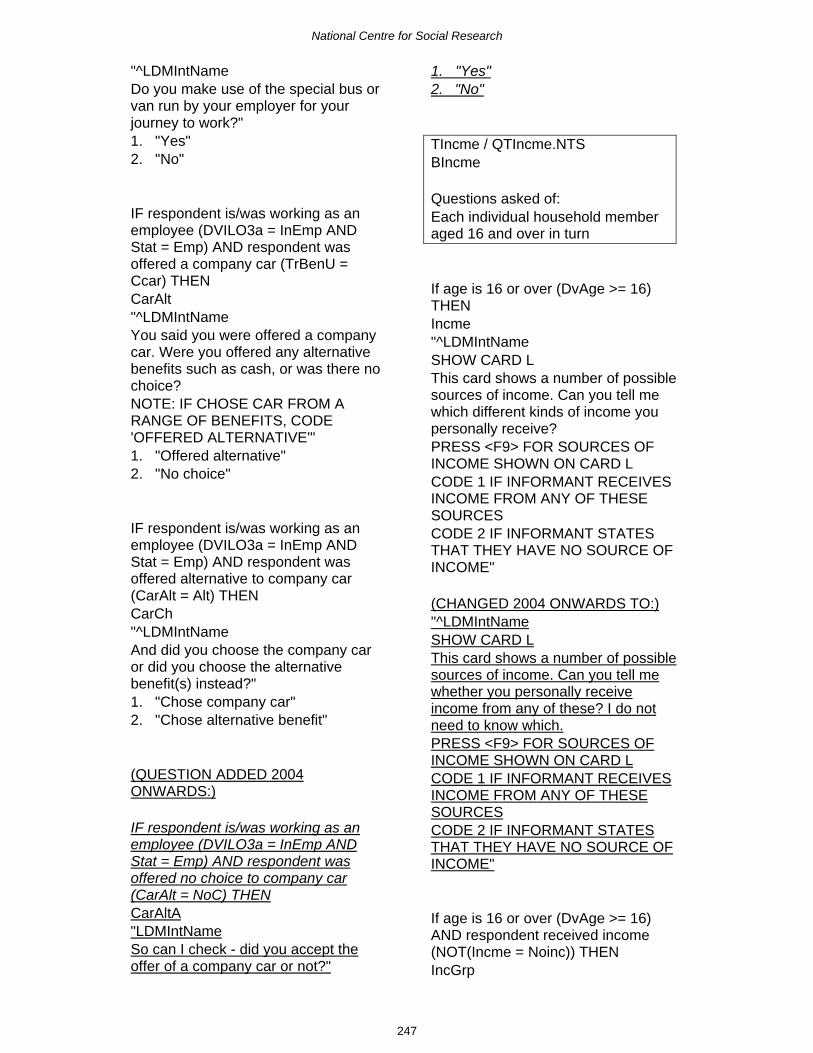
National Centre for Social Research
247
"^LDMIntNameDo you make use of the special bus orvan run by your employer for yourjourney to work?"1. "Yes"2. "No"
IF respondent is/was working as anemployee (DVILO3a = InEmp ANDStat = Emp) AND respondent wasoffered a company car (TrBenU =Ccar) THENCarAlt"^LDMIntNameYou said you were offered a companycar. Were you offered any alternativebenefits such as cash, or was there nochoice?NOTE: IF CHOSE CAR FROM ARANGE OF BENEFITS, CODE'OFFERED ALTERNATIVE'"1. "Offered alternative"2. "No choice"
IF respondent is/was working as anemployee (DVILO3a = InEmp ANDStat = Emp) AND respondent wasoffered alternative to company car(CarAlt = Alt) THENCarCh"^LDMIntNameAnd did you choose the company caror did you choose the alternativebenefit(s) instead?"1. "Chose company car"2. "Chose alternative benefit"
(QUESTION ADDED 2004ONWARDS:)
IF respondent is/was working as anemployee (DVILO3a = InEmp ANDStat = Emp) AND respondent wasoffered no choice to company car(CarAlt = NoC) THENCarAltA"LDMIntNameSo can I check - did you accept theoffer of a company car or not?"
1. "Yes"2. "No"
TIncme / QTIncme.NTSBIncme
Questions asked of:Each individual household memberaged 16 and over in turn
If age is 16 or over (DvAge >= 16)THENIncme"^LDMIntNameSHOW CARD LThis card shows a number of possiblesources of income. Can you tell mewhich different kinds of income youpersonally receive?PRESS <F9> FOR SOURCES OFINCOME SHOWN ON CARD LCODE 1 IF INFORMANT RECEIVESINCOME FROM ANY OF THESESOURCESCODE 2 IF INFORMANT STATESTHAT THEY HAVE NO SOURCE OFINCOME"
(CHANGED 2004 ONWARDS TO:)"^LDMIntNameSHOW CARD LThis card shows a number of possiblesources of income. Can you tell mewhether you personally receiveincome from any of these? I do notneed to know which.PRESS <F9> FOR SOURCES OFINCOME SHOWN ON CARD LCODE 1 IF INFORMANT RECEIVESINCOME FROM ANY OF THESESOURCESCODE 2 IF INFORMANT STATESTHAT THEY HAVE NO SOURCE OFINCOME"
If age is 16 or over (DvAge >= 16)AND respondent received income(NOT(Incme = Noinc)) THENIncGrp

National Centre for Social Research
248
"^LDMIntNameSHOW CARD M Which of the letters on this cardrepresents your own gross incomefrom all sources mentioned? By gross income, I mean income fromall sources before deductions forincome tax, National Insurance etc.Please just tell me the letter. (HELP<F9>)INTEVIEWER - PLEASE TYPE INTHE LETTER"
If respondent is the HouseholdReference Person AND the number ofadults in the household is greater than1 (QTHComp.NumAdult > 1) THENHIncGrp"^LDMIntName.SHOW CARD M INTERVIEWER: IF YOU ALREADYKNOW THAT THIS IS A ONEPERSON HOUSEHOLD, YOU CANENTER THE SAME ANSWER GIVENAT THE PREVIOUS QUESTION(^IncGrp)And now think of the income of thehousehold as a whole. Which of theletters on this card represents thegross income of the WHOLEhousehold? (HELP <F9>)INTEVIEWER - PLEASE TYPE INTHE LETTER"
TWorkPl / QTWorkPl.NTSBWorkPl
Questions asked of :Each individual household memberaged 16 and over in turn, if thefollowing condition is met:
DVILO3a= “InEmp” (ILOclassification of employment:Employed)
IF employment status derived asemployed (DVILO3a = InEmp)THENWkPlace"^LDMIntName
When you go to work do you... READOUT(HELP <F9>)"1. "...go to the same place everytime,"2. "go to the same place on at least 2days running each week,"3. "go to different places,"4. "or work at home or in the samebuilding as your home."
IF respondent goes to the sameworkplace each time or at least 2 daysa week (WkPlace = SameEv, orWkPlace = SameUse] THENWkCode"^LDMIntName Where do you go to work?ADD IF NECESSARY: Can you tell methe town or area?INTERVIEWER: TYPE IN FIRST FEWLETTERS OF PLACE NAME TOENTER CODING FRAME. IF THEPLACE IS NOT LISTED, TYPE XXXAND CODE AS 89 (NOTLISTED/DON'T KNOW)IF NECESSARY USE SHOW CARD NTO FIND OUT WHETHER THISPLACE IS WITHIN M25 BOUNDARY.ON EXITING CODING FRAMEPRESS ENTER TO MOVE TO NEXTQUESTION."
If placename is not listed (WkCode =89) THENXWkCode"^LDMIntName INTERVIEWER: TYPE IN NAME OFWORK PLACE, INCLUDING COUNTYOR NEAREST LARGE TOWN"
IF respondent goes to the sameworkplace each time or at least 2 daysa week (WkPlace = SameEv, orWkPlace = SameUse] IF respondentworks in central London (WkUrbCd =23) THENWkLon"^LDMIntName

National Centre for Social Research
249
SHOW CARD O Is it within the areashown on this map?SHOW CARD O FOR MAP OFCENTRAL LONDON"1. "Within"2. "Not within"
IF respondent goes to the sameworkplace each time or at least 2 daysa week (WkPlace = SameEv, orWkPlace = SameUse] ANDrespondent works in a town (WkUrbCd= 1..22 OR WkUrbCd = 24..48) THENWkTown"^LDMIntName Is it within ^LWorkPl1?"1. "Within"2. "Not within"
IF respondent goes to the sameworkplace each time or at least 2 daysa week (WkPlace = SameEv, orWkPlace = SameUse] ANDrespondent works in an urban area(WkUrbCd = 50, 89 AND UrbRural =1..14, 89] THENWkOthUrb"^LDMIntName Is it within 5 mins walk of the mainshopping/business centre?"1. "Within"2. "Not within"
TWkMeth / QTWkMeth.NTSBWkMeth
Questions asked of:Each individual household memberaged 16 and over in turn, if thefollowing condition is met:
WkPlace = (1) or (2) or (3)
IF respondent works at same placeevery time, or at least 2 days a weekor goes to different places (WkPlace =
SameEv, OR SameUse OR Differ)THENWkTrav"^LDMIntName How do you usually travel to work?THIS QUESTION APPLIES FOR THEMAIN JOB, THAT IS THE JOB INWHICH RESPONDENT USUALLYWORKS THE MOST HOURS.CODE ONE ONLY, FOR THELONGEST PART, BY DISTANCE, OFTHE RESPONDENT'S USUALJOURNEY TO WORK. (HELP <F9>)"1. "Underground, metro, light rail,tram"2. "Train"3. "Bus, minibus or coach"4. "Motorcycle, scooter or moped"5. "Car or van"6. "Taxi/minicab"7. "Bicycle"8. "On foot"97. "Other (specify)"
If respondent travels to work someother way (WkTrav = other) THENXWkTrav"^LDMIntName INTERVIEWER: Please record howinformant usually travels to work.Remember to recode WkTrav 1 to 8where possible. (HELP <F9>)If respondent now says they work andlive in the same premises then pleasego back and amend WkPlace"
IF respondent normally travels to workby car (WkTrav = Car) THENWkDrive"^LDMIntName When travelling to work areyou...READ OUT"1. "...usually the driver,"2. "usually the passenger,"3. "or sometimes driver andsometimes passenger"

National Centre for Social Research
250
IF respondent travels to work by car ormotorbike (WkTrav IN [Car, Mbike])THENWkVEH"^LDMIntName Does your household own or haveregular use of the vehicle that youtravel to work in? IF MORE THAN ONE, PROBE FORMAIN VEHICLE"1. "Yes"2. "No"
WkVEH(QUESTION DELETED 2004ONWARDS)
TWkHome / QTWkHome.NTSBWkHome
Questions asked of:Each individual household memberaged 16 and over in turn, if thefollowing condition is met:
DVILO3a= “InEmp” (ILOclassification of employment:Employed)
IF respondent works at same placeevery time, or at least 2 days a weekor goes to different places (WkPlace =SameEv, OR SameUse OR Differ)THENWkHome"^LDMIntNameCan I just check, in the week endinglast Sunday (the ^DLSUNTxt), did youwork at home on any of the daysINSTEAD of travelling to your usualplace of work? (HELP <F9>)"1. "Yes"2. "No"
IF respondent did work at home(WkHome = Yes) THENHomeDay"^LDMIntName On which days did you work at home?CODE ALL THAT APPLY"
1. "Monday"2. "Tuesday"3. "Wednesday"4. "Thursday"5. "Friday"6. "Saturday"7. "Sunday"
IF respondent did not work at home(WkHome = NO) THENPossHom"^LDMIntNameCan I check, in your (main) job, wouldit be possible to do your kind of workat home instead of travelling to work?IF SOMETIMES, CODE 'YES'IF POSSIBLE TO BORROWNECESSARY EQUIPMENT FROMWORK, (E.G. LAPTOP, SEWINGMACHINE), CODE YES"1. "Yes"2. "No"
IF respondent did work at home(WkHome = Yes) OR if it possible forrespondent to work from home(PossHom = Yes) THENOftHome"^LDMIntNameHow often do you work at home (inyour main job) instead of travelling towork?NOTE: DO NOT INCLUDE IFOUTSIDE NORMAL WORKINGHOURS E.G. ADDITIONAL WORK ATHOME IN EVENING/WEEKENDS"1. "3 or more times a week"2. "Once or twice a week"3. "Less than that but more thantwice a month"4. "Once or twice a month"5. "Less than that but more thantwice a year"6. "Once or twice a year"7. "Less than that or never"
IF respondent works at home less thanonce or twice a year (OftHome =LessYear) THEN
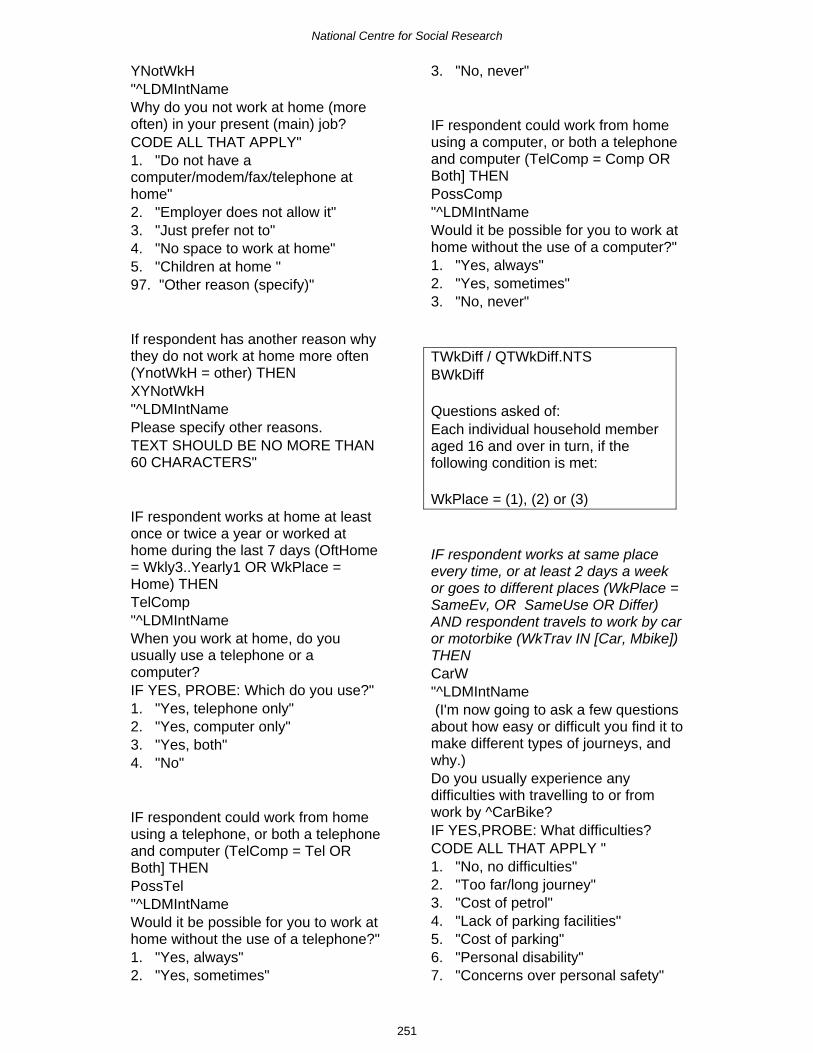
National Centre for Social Research
251
YNotWkH"^LDMIntNameWhy do you not work at home (moreoften) in your present (main) job?CODE ALL THAT APPLY"1. "Do not have acomputer/modem/fax/telephone athome"2. "Employer does not allow it"3. "Just prefer not to"4. "No space to work at home"5. "Children at home "97. "Other reason (specify)"
If respondent has another reason whythey do not work at home more often(YnotWkH = other) THENXYNotWkH"^LDMIntNamePlease specify other reasons.TEXT SHOULD BE NO MORE THAN60 CHARACTERS"
IF respondent works at home at leastonce or twice a year or worked athome during the last 7 days (OftHome= Wkly3..Yearly1 OR WkPlace =Home) THENTelComp"^LDMIntNameWhen you work at home, do youusually use a telephone or acomputer?IF YES, PROBE: Which do you use?"1. "Yes, telephone only"2. "Yes, computer only"3. "Yes, both"4. "No"
IF respondent could work from homeusing a telephone, or both a telephoneand computer (TelComp = Tel ORBoth] THENPossTel"^LDMIntNameWould it be possible for you to work athome without the use of a telephone?"1. "Yes, always"2. "Yes, sometimes"
3. "No, never"
IF respondent could work from homeusing a computer, or both a telephoneand computer (TelComp = Comp ORBoth] THENPossComp"^LDMIntNameWould it be possible for you to work athome without the use of a computer?"1. "Yes, always"2. "Yes, sometimes"3. "No, never"
TWkDiff / QTWkDiff.NTSBWkDiff
Questions asked of:Each individual household memberaged 16 and over in turn, if thefollowing condition is met:
WkPlace = (1), (2) or (3)
IF respondent works at same placeevery time, or at least 2 days a weekor goes to different places (WkPlace =SameEv, OR SameUse OR Differ)AND respondent travels to work by caror motorbike (WkTrav IN [Car, Mbike])THENCarW"^LDMIntName (I'm now going to ask a few questionsabout how easy or difficult you find it tomake different types of journeys, andwhy.)Do you usually experience anydifficulties with travelling to or fromwork by ^CarBike?IF YES,PROBE: What difficulties?CODE ALL THAT APPLY "1. "No, no difficulties"2. "Too far/long journey"3. "Cost of petrol"4. "Lack of parking facilities"5. "Cost of parking"6. "Personal disability"7. "Concerns over personal safety"
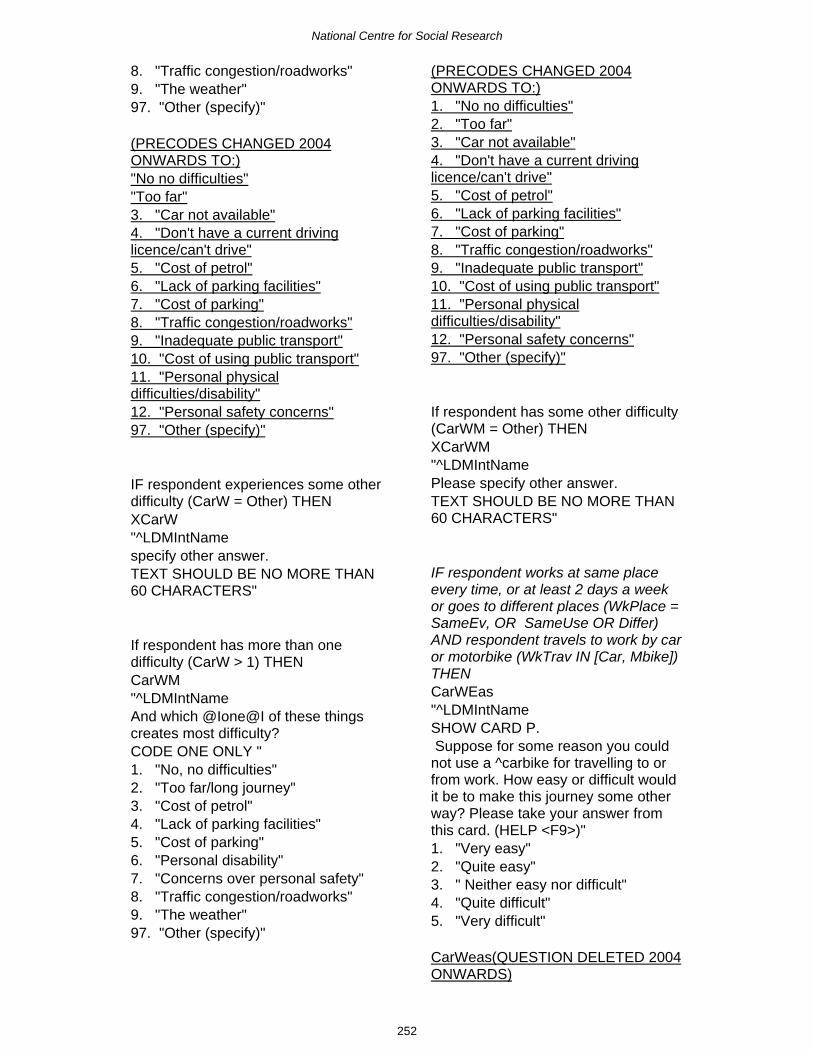
National Centre for Social Research
252
8. "Traffic congestion/roadworks"9. "The weather"97. "Other (specify)"
(PRECODES CHANGED 2004ONWARDS TO:)"No no difficulties""Too far"3. "Car not available"4. "Don't have a current drivinglicence/can't drive"5. "Cost of petrol"6. "Lack of parking facilities"7. "Cost of parking"8. "Traffic congestion/roadworks"9. "Inadequate public transport"10. "Cost of using public transport"11. "Personal physicaldifficulties/disability"12. "Personal safety concerns"97. "Other (specify)"
IF respondent experiences some otherdifficulty (CarW = Other) THENXCarW"^LDMIntNamespecify other answer.TEXT SHOULD BE NO MORE THAN60 CHARACTERS"
If respondent has more than onedifficulty (CarW > 1) THENCarWM"^LDMIntNameAnd which @Ione@I of these thingscreates most difficulty?CODE ONE ONLY "1. "No, no difficulties"2. "Too far/long journey"3. "Cost of petrol"4. "Lack of parking facilities"5. "Cost of parking"6. "Personal disability"7. "Concerns over personal safety"8. "Traffic congestion/roadworks"9. "The weather"97. "Other (specify)"
(PRECODES CHANGED 2004ONWARDS TO:)1. "No no difficulties"2. "Too far"3. "Car not available"4. "Don't have a current drivinglicence/can't drive"5. "Cost of petrol"6. "Lack of parking facilities"7. "Cost of parking"8. "Traffic congestion/roadworks"9. "Inadequate public transport"10. "Cost of using public transport"11. "Personal physicaldifficulties/disability"12. "Personal safety concerns"97. "Other (specify)"
If respondent has some other difficulty(CarWM = Other) THENXCarWM"^LDMIntNamePlease specify other answer.TEXT SHOULD BE NO MORE THAN60 CHARACTERS"
IF respondent works at same placeevery time, or at least 2 days a weekor goes to different places (WkPlace =SameEv, OR SameUse OR Differ)AND respondent travels to work by caror motorbike (WkTrav IN [Car, Mbike])THENCarWEas"^LDMIntNameSHOW CARD P. Suppose for some reason you couldnot use a ^carbike for travelling to orfrom work. How easy or difficult wouldit be to make this journey some otherway? Please take your answer fromthis card. (HELP <F9>)"1. "Very easy"2. "Quite easy"3. " Neither easy nor difficult"4. "Quite difficult"5. "Very difficult"
CarWeas(QUESTION DELETED 2004ONWARDS)
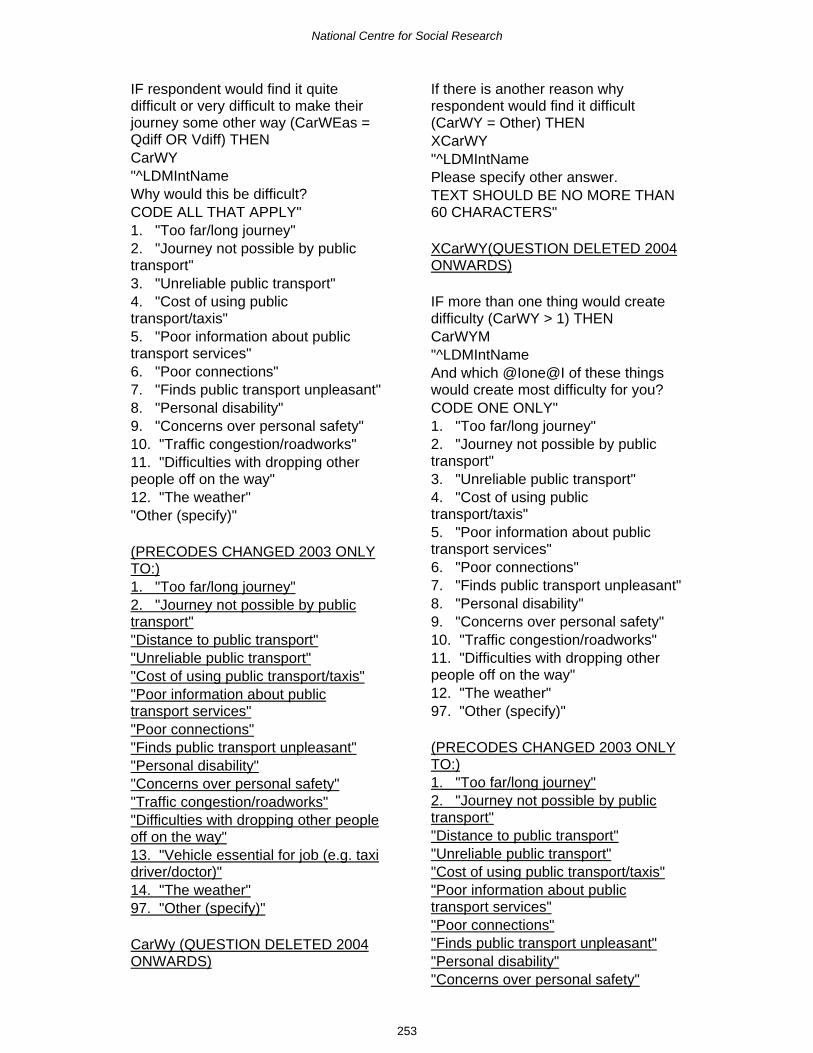
National Centre for Social Research
253
IF respondent would find it quitedifficult or very difficult to make theirjourney some other way (CarWEas =Qdiff OR Vdiff) THENCarWY"^LDMIntNameWhy would this be difficult?CODE ALL THAT APPLY"1. "Too far/long journey"2. "Journey not possible by publictransport"3. "Unreliable public transport"4. "Cost of using publictransport/taxis"5. "Poor information about publictransport services"6. "Poor connections"7. "Finds public transport unpleasant"8. "Personal disability"9. "Concerns over personal safety"10. "Traffic congestion/roadworks"11. "Difficulties with dropping otherpeople off on the way"12. "The weather""Other (specify)"
(PRECODES CHANGED 2003 ONLYTO:)1. "Too far/long journey"2. "Journey not possible by publictransport""Distance to public transport""Unreliable public transport""Cost of using public transport/taxis""Poor information about publictransport services""Poor connections""Finds public transport unpleasant""Personal disability""Concerns over personal safety""Traffic congestion/roadworks""Difficulties with dropping other peopleoff on the way"13. "Vehicle essential for job (e.g. taxidriver/doctor)"14. "The weather"97. "Other (specify)"
CarWy (QUESTION DELETED 2004ONWARDS)
If there is another reason whyrespondent would find it difficult(CarWY = Other) THENXCarWY"^LDMIntNamePlease specify other answer.TEXT SHOULD BE NO MORE THAN60 CHARACTERS"
XCarWY(QUESTION DELETED 2004ONWARDS)
IF more than one thing would createdifficulty (CarWY > 1) THENCarWYM"^LDMIntNameAnd which @Ione@I of these thingswould create most difficulty for you?CODE ONE ONLY"1. "Too far/long journey"2. "Journey not possible by publictransport"3. "Unreliable public transport"4. "Cost of using publictransport/taxis"5. "Poor information about publictransport services"6. "Poor connections"7. "Finds public transport unpleasant"8. "Personal disability"9. "Concerns over personal safety"10. "Traffic congestion/roadworks"11. "Difficulties with dropping otherpeople off on the way"12. "The weather"97. "Other (specify)"
(PRECODES CHANGED 2003 ONLYTO:)1. "Too far/long journey"2. "Journey not possible by publictransport""Distance to public transport""Unreliable public transport""Cost of using public transport/taxis""Poor information about publictransport services""Poor connections""Finds public transport unpleasant""Personal disability""Concerns over personal safety"

National Centre for Social Research
254
"Traffic congestion/roadworks""Difficulties with dropping other peopleoff on the way"13. "Vehicle essential for job (e.g. taxidriver/doctor)"14. "The weather"97. "Other (specify)"
CarWYM (QUESTION DELETED2004 ONWARDS)
If there is another reason that wouldcreate difficulty (CarWYM =Other)THENXCarWYM"^LDMIntNamePlease specify other answer.TEXT SHOULD BE NO MORE THAN60 CHARACTERS"
XCarWYM (QUESTION DELETED2004 ONWARDS)
IF respondent works at same placeevery time, or at least 2 days a weekor goes to different places (WkPlace =SameEv, OR SameUse OR Differ)AND respondent does not travel towork in a private car or motorbike(WkTrav IN [Tube, Train, Bus, Taxi ..Other]) THENOthW"^LDMIntName (I'm now going to ask a few questionsabout how easy or difficult you find it tomake different types of journeys, andwhy.)Do you usually experience anydifficulties with travelling to or fromwork by ^TrMode?IF YES, PROBE: What difficulties?CODE ALL THAT APPLY"1. "No, no difficulties"2. "Too far/long journey"3. "Journey not possible by publictransport"4. "Unreliable public transport"5. "Cost of using publictransport/taxis"
6. "Poor information about publictransport services"7. "Poor connections"8. "Finds public transport unpleasant"9. "Personal disability"10. "Concerns over personal safety"11. "Traffic congestion/roadworks"12. "The weather"97. "Other (specify)"
(PRECODES CHANGED 2003ONWARDS TO:)1. "No, no difficulties"2. "Too far/long journey"3. "Journey not possible by publictransport"4. "Unreliable public transport"5. "Cost of using publictransport/taxis"6. "Poor information about publictransport services"7. "Poor connections"8. "Finds public transport unpleasant"9. "Personal disability"10. "Concerns over personal safety""Traffic congestion/roadworks""Lack of/no cycle lanes13. "The weather"97. "Other (specify)"
IF respondent experiences some otherdifficulty (OthW = Other) THENXOthW"^LDMIntNamePlease specify other answer.TEXT SHOULD BE NO MORE THAN60 CHARACTERS"

National Centre for Social Research
255
If respondent has more than onedifficulty (OthW > 1) THENOthWM"^LDMIntNameAnd which @Ione@I of these thingscreates most difficulty?CODE ONE ONLY"1. "No, no difficulties"2. "Too far/long journey"3. "Journey not possible by publictransport"4. "Unreliable public transport"5. "Cost of using publictransport/taxis"6. "Poor information about publictransport services"7. "Poor connections"8. "Finds public transport unpleasant"9. "Personal disability"10. "Concerns over personal safety"11. "Traffic congestion/roadworks"12. "The weather"97. "Other (specify)"
(PRECODES CHANGED 2003ONWARDS TO:)1. "No, no difficulties"2. "Too far/long journey"3. "Journey not possible by publictransport"4. "Unreliable public transport"5. "Cost of using publictransport/taxis"6. "Poor information about publictransport services"7. "Poor connections"8. "Finds public transport unpleasant"9. "Personal disability"10. "Concerns over personal safety""Traffic congestion/roadworks""Lack of/no cycle lanes13. "The weather"97. "Other (specify)"
IF respondent has some other difficulty(CarWM = Other) THENXOthWM"^LDMIntNamePlease specify other answer.
TEXT SHOULD BE NO MORE THAN60 CHARACTERS"
IF respondent has full driving licencefor car, or both car and motorcycle orcar with special adaptations (DLTyp95= Car OR Auto OR CarMot ORCarRes] AND (DMCARVAN = 1))THENCarWN"^LDMIntName (Does/Do any of) your household'scar/van(s) usually stay at home,unused, while you are at work?IF UNUSED, PROBE: Are you insuredto drive it?"1. "No, (all) car(s) usually in use byothers"2. "Car(s) unused, but respondent notinsured to drive it"3. "Car unused and respondent isinsured to drive it"
CarWN (QUESTION DELETED 2004ONWARDS)
IF car is unused and respondent isinsured to drive it (CarWN = Unused)THENCarWNY"^LDMIntNameWhat are the reasons you don't usethe car to get to or from work?CODE ALL THAT APPLY"1. "Quicker by ^TrMode"2. "Cheaper by ^TrMode"3. "Enjoys using ^TrMode"4. "Healthier to use ^TrMode"5. "Can work/rest/read on train/busetc. "6. "Too far/long journey "7. "Don't have current drivinglicence/can't drive"8. "Don't like driving"9. "Cost of petrol"10. "Lack of parking facilities"11. "Cost of parking"12. "Personal disability"13. "Concerns over personal safety"14. "Traffic congestion/roadworks"

National Centre for Social Research
256
15. "Environmental concerns"97. "Other (specify)"
CarWNY(QUESTION DELETED 2004ONWARDS)
IF other reason why car is unused(CarWNY = other) THENXCarWNY"^LDMIntNamePlease specify other answer.TEXT SHOULD BE NO MORE THAN60 CHARACTERS"
XCarWNY (QUESTION DELETED2004 ONWARDS)
IF more than one reason why carremains unused during work(CarWNY) > 1) THENCarWNYM"^LDMIntNameAnd what is the main reason?CODE ONE ONLY"1. "Quicker by ^TrMode"2. "Cheaper by ^TrMode"3. "Enjoys using ^TrMode"4. "Healthier to use ^TrMode"5. "Can work/rest/read on train/busetc. "6. "Too far/long journey "7. "Don't have current drivinglicence/can't drive"8. "Don't like driving"9. "Cost of petrol"10. "Lack of parking facilities"11. "Cost of parking"12. "Personal disability"13. "Concerns over personal safety"14. "Traffic congestion/roadworks"15. "Environmental concerns"97. "Other (specify)"
CarWNYM (QUESTION DELETED2004 ONWARDS)
IF other reason why car remainsunused (CarWYNM = other) THEN
XCarWNYM"^LDMIntNamePlease specify other answer.TEXT SHOULD BE NO MORE THAN60 CHARACTERS"
XCarWNYM(QUESTION DELETED2004 ONWARDS)
TShDiff / QTShDiff.NTSBShDiff
Questions asked of:The household member who is themain food shopper in the household(DVShop)
IF respondent does the main foodshopping (WhoInt =Qamenity.DVShop) THENTravSh"^LDMIntName Now some questions about shopping.How do you usually travel when youdo your main food shopping?CODE ONE ONLY, FOR THELONGEST PART, BY DISTANCE, OFTHE RESPONDENT'S USUALJOURNEY TO THE SHOPS.IF DIFFERENT METHOD TO GET TOSHOPS AND RETURN HOME, CODEMETHOD TO GET HOMEIF NO USUAL METHOD, ASK ABOUTTHE LAST TIME"1. "Underground, metro, light rail,tram"2. "Train"3. "Bus, minibus or coach"4. "Motorcycle, scooter or moped"5. "Car or van"6. "Taxi/minicab"7. "Bicycle"8. "On foot"97. "Other (specify)"

National Centre for Social Research
257
IF respondent uses other method oftravel for food shopping (TravSh =Other) THENXTravSh"^LDMIntNamePlease specify other answer.TEXT SHOULD BE NO MORE THAN60 CHARACTERS"
IF respondent does the main foodshopping (WhoInt =Qamenity.DVShop) AND respondentusually does the food shopping in acar or motorbike (TravSh IN[Car,MBike]) THENCarS"^LDMIntName Do you usually experience anydifficulties with travelling by ^carbikewhen you do your main foodshopping? IF Yes, PROBE: What difficulties?CODE ALL THAT APPLY"1. "No, no difficulties"2. "Too far/ long journey"3. "Cost of petrol"4. "Lack of parking facilities"5. "Cost of parking"6. "Personal disability"7. "Concerns over personal safety"8. "Traffic congestion/roadworks"9. "The weather"97. "Other (specify)"
(PRECODES CHANGED 2003ONWARDS TO:)"No, no difficulties""Too far/ long journey""Cost of petrol""Lack of parking facilities""Cost of parking""Personal disability""Difficulty carrying shopping to car""Concerns over personal safety""Traffic congestion/roadworks""Rely on non-household membertaking them shopping""The weather""Other (specify)"
IF respondent experiences otherdifficulty with travelling to or from foodshopping (CarS = other) THENXCarS"^LDMIntNamePlease specify other answer.TEXT SHOULD BE NO MORE THAN60 CHARACTERS"
IF respondent experiences more thanone difficutly (CarS > 1) THENCarSM"^LDMIntNameAnd which @Ione@I of these thingscreates most difficulty?CODE ONE ONLY"1. "No, no difficulties"2. "Too far/ long journey"3. "Cost of petrol"4. "Lack of parking facilities"5. "Cost of parking"6. "Personal disability"7. "Concerns over personal safety"8. "Traffic congestion/roadworks"9. "The weather"97. "Other (specify)"
(PRECODES CHANGED 2003ONWARDS TO:)"No, no difficulties""Too far/ long journey""Cost of petrol""Lack of parking facilities""Cost of parking""Personal disability""Difficulty carrying shopping to car""Concerns over personal safety""Traffic congestion/roadworks""Rely on non-household membertaking them shopping""The weather""Other (specify)"

National Centre for Social Research
258
IF respondent experiences some otherdifficulty (CarSM = other) THENXCarSM"^LDMIntNamePlease specify other answer.TEXT SHOULD BE NO MORE THAN60 CHARACTERS"
IF respondent does the main foodshopping (WhoInt =Qamenity.DVShop) AND respondentusually does the food shopping in acar or motorbike (TravSh IN[Car,MBike]) THENCarSEas"^LDMIntNameSHOW CARD P.Suppose for some reason you could@Inot@I use a ^carbike for your mainfood shopping, how easy or difficult doyou think it would be to make thisjourney some other way? Please takeyour answer from this card. (HELP<F9>)THIS QUESTION REFERS TO EASEOF TRAVEL TO USUAL SHOPS FORMAIN FOOD SHOPPING, EVEN IFTHEY WOULD NOT BE VISITED IFTHE CAR COULD NOT BE USED.(EXTRA INT. INSTRUCTION ADDED2003 ONLY)"1. "Very easy"2. "Quite easy"3. " Neither easy nor difficult"4. "Quite difficult"5. "Very difficult"
CarSEas(QUESTION DELETED 2004ONWARDS)
IF respondent would find it quitedifficult or very difficult to make thejourney some other way (CarWEas =Qdiff OR Vdiff) THENCarSY"^LDMIntNameWhy would this be difficult?CODE ALL THAT APPLY"1. "Too far/long journey"
2. "Journey not possible by publictransport"3. "Unreliable public transport"4. "Cost of using publictransport/taxis"5. "Poor information about publictransport services"6. "Poor connections"7. "Finds public transport unpleasant"8. "Personal disability"9. "Concerns over personal safety"10. "Traffic congestion/roadworks"11. "Difficulties carrying the shopping"12. "Difficulties managing withchildren"13. "The weather"97. "Other (specify)"
(PRECODES CHANGED 2003 ONLYTO:)"Too far/long journey""Journey not possible by publictransport""Distance to public transport""Unreliable public transport""Cost of using public transport/taxis""Poor information about publictransport services""Poor connections""Finds public transport unpleasant""Personal disability""Concerns over personal safety""Traffic congestion/roadworks""Difficulties carrying the shopping""Difficulties managing with children""The weather"97 "Other (specify)"
CarSY(QUESTION DELETED 2004ONWARDS)
IF there was another reason whyrespondent would find it difficult(CarSY = other) THENXCarSY"^LDMIntNamePlease specify other answer.TEXT SHOULD BE NO MORE THAN60 CHARACTERS"

National Centre for Social Research
259
XCarSY (QUESTION DELETED 2004ONWARDS)
IF more than one reason why thiswould create difficulty (CarSY > 1)THENCarSYM"^LDMIntNameAnd which @Ione@I of these thingswould create most difficulty for you?CODE ONE ONLY"1. "Too far/long journey"2. "Journey not possible by publictransport"3. "Unreliable public transport"4. "Cost of using publictransport/taxis"5. "Poor information about publictransport services"6. "Poor connections"7. "Finds public transport unpleasant"8. "Personal disability"9. "Concerns over personal safety"10. "Traffic congestion/roadworks"11. "Difficulties carrying the shopping"12. "Difficulties managing withchildren"13. "The weather"97. "Other (specify)"
(PRECODES CHANGED 2003 ONLYTO:)"Too far/long journey""Journey not possible by publictransport""Distance to public transport""Unreliable public transport""Cost of using public transport/taxis""Poor information about publictransport services""Poor connections""Finds public transport unpleasant""Personal disability""Concerns over personal safety""Traffic congestion/roadworks""Difficulties carrying the shopping""Difficulties managing with children""The weather"97 "Other (specify)"
CarSYM (QUESTION DELETED 2004ONWARDS)
IF some other reason would createdifficulty (CarSYM = other) THENXCarSYM"^LDMIntNamePlease specify other answer.TEXT SHOULD BE NO MORE THAN60 CHARACTERS"
XCarSYM(QUESTION DELETED2004 ONWARDS)
IF respondent does the main foodshopping (WhoInt =Qamenity.DVShop) AND respondentdoes not usually do the food shoppingin a private vehicle (TravSh IN [Tube,Train, Bus, Taxi .. Other]) THENOthS"^LDMIntName Do you usually experience anydifficulties with travelling by ^TrModewhen you do your main foodshopping?IF Yes, PROBE: What difficulties?CODE ALL THAT APPLY "1. "No, no difficulties"2. "Too far/long journey"3. "Journey not possible by publictransport"4. "Unreliable public transport"5. "Cost of using publictransport/taxis"6. "Poor information about publictransport services"7. "Poor connections"8. "Finds public transport unpleasant"9. "Personal disability"10. "Concerns over personal safety"11. "Traffic congestion/roadworks"12. "Difficulties carrying the shopping"13. "Difficulties managing withchildren"14. "The weather"97. "Other (specify)"

National Centre for Social Research
260
IF respondent experiences some otherdifficulties when travelling for mainfood shopping (OthS = other) THENXOthS"^LDMIntNamePlease specify other answer.TEXT SHOULD BE NO MORE THAN60 CHARACTERS"
IF there is more than one reasonwhich creates difficulty when travellingfor the main food shopping (OthS > 1)THENOthSM"^LDMIntNameAnd which @Ione@I of these thingscreates most difficulty?CODE ONE ONLY"1. "No, no difficulties"2. "Too far/long journey"3. "Journey not possible by publictransport"4. "Unreliable public transport"5. "Cost of using publictransport/taxis"6. "Poor information about publictransport services"7. "Poor connections"8. "Finds public transport unpleasant"9. "Personal disability"10. "Concerns over personal safety"11. "Traffic congestion/roadworks"12. "Difficulties carrying the shopping"13. "Difficulties managing withchildren"14. "The weather"97. "Other (specify)"
IF there is some other reason whichcreates difficulty (OthSM = other)THENXothSM"^LDMIntNamePlease specify other answer.TEXT SHOULD BE NO MORE THAN60 CHARACTERS"
IF respondent has full driving licencefor car, or both car and motorcycle orcar with special adaptations (DLTyp95= Car OR Auto OR CarMot ORCarRes] AND (DMCARVAN = 1)) ANDrespondent does not usually do thefood shopping in a private vehicle(TravSh IN [Tube, Train, Bus, Taxi ..Other]) THENCarSN"^LDMIntName (Does/Do any of) your car/van(s)usually stay at home, unused, whileyou do the main food shopping?IF UNUSED, PROBE: Are you insuredto drive it?"1. "No, (all) car(s) usually in use byothers"2. "Car(s) unused, but respondent notinsured to drive it"3. "Car unused and respondent isinsured to drive it"
CarSN(QUESTION DELETED 2004ONWARDS)
IF car is unused and respondent isinsured to drive it (CarWN = Unused)THENCarSNY"^LDMIntNameWhat are the reasons you don't usethe car for your main food shopping?CODE ALL THAT APPLY "1. "Quicker by ^TrMode"2. "Cheaper by ^TrMode"3. "Enjoys using ^TrMode"4. "Healthier to use ^TrMode"5. "Can work/rest/read on train/busetc. "6. "Too far/long journey "7. "Don't have current drivinglicence/can't drive "8. "Don't like driving"9. "Cost of petrol"10. "Lack of parking facilities"11. "Cost of parking"12. "Personal disability"13. "Concerns over personal safety"14. "Traffic congestion/roadworks"15. "Environmental concerns"
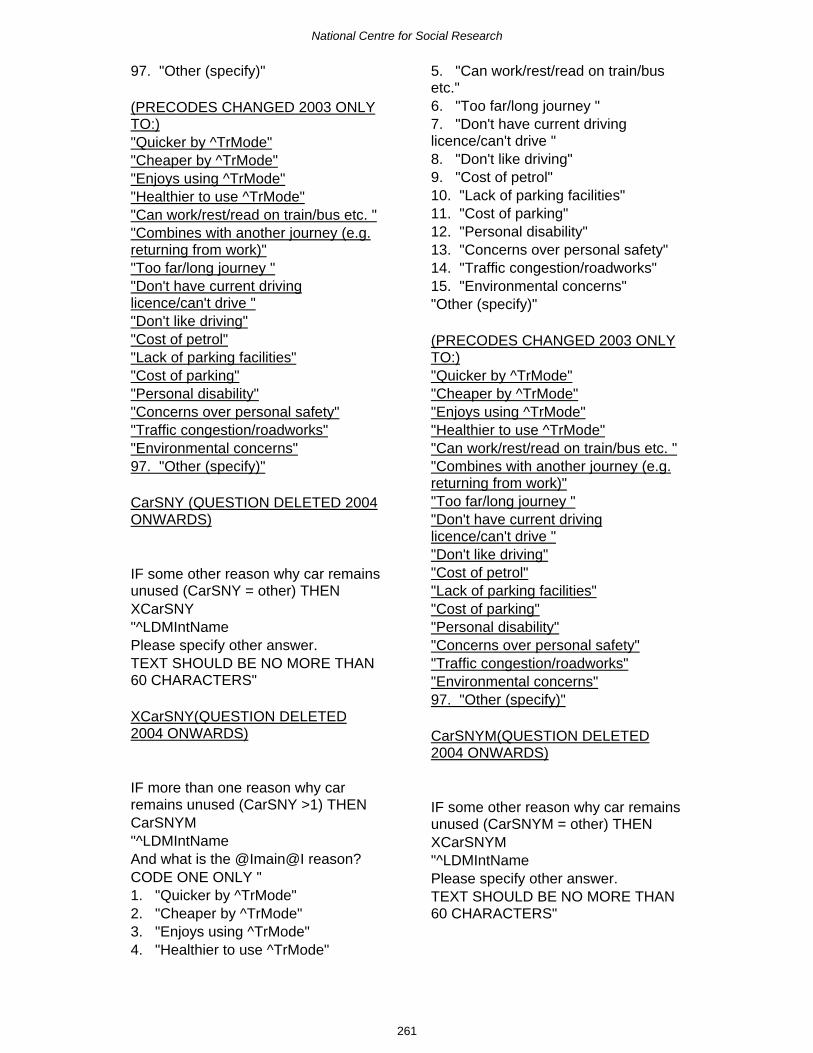
National Centre for Social Research
261
97. "Other (specify)"
(PRECODES CHANGED 2003 ONLYTO:)"Quicker by ^TrMode""Cheaper by ^TrMode""Enjoys using ^TrMode""Healthier to use ^TrMode""Can work/rest/read on train/bus etc. ""Combines with another journey (e.g.returning from work)""Too far/long journey ""Don't have current drivinglicence/can't drive ""Don't like driving""Cost of petrol""Lack of parking facilities""Cost of parking""Personal disability""Concerns over personal safety""Traffic congestion/roadworks""Environmental concerns"97. "Other (specify)"
CarSNY (QUESTION DELETED 2004ONWARDS)
IF some other reason why car remainsunused (CarSNY = other) THENXCarSNY"^LDMIntNamePlease specify other answer.TEXT SHOULD BE NO MORE THAN60 CHARACTERS"
XCarSNY(QUESTION DELETED2004 ONWARDS)
IF more than one reason why carremains unused (CarSNY >1) THENCarSNYM"^LDMIntNameAnd what is the @Imain@I reason?CODE ONE ONLY "1. "Quicker by ^TrMode"2. "Cheaper by ^TrMode"3. "Enjoys using ^TrMode"4. "Healthier to use ^TrMode"
5. "Can work/rest/read on train/busetc."6. "Too far/long journey "7. "Don't have current drivinglicence/can't drive "8. "Don't like driving"9. "Cost of petrol"10. "Lack of parking facilities"11. "Cost of parking"12. "Personal disability"13. "Concerns over personal safety"14. "Traffic congestion/roadworks"15. "Environmental concerns""Other (specify)"
(PRECODES CHANGED 2003 ONLYTO:)"Quicker by ^TrMode""Cheaper by ^TrMode""Enjoys using ^TrMode""Healthier to use ^TrMode""Can work/rest/read on train/bus etc. ""Combines with another journey (e.g.returning from work)""Too far/long journey ""Don't have current drivinglicence/can't drive ""Don't like driving""Cost of petrol""Lack of parking facilities""Cost of parking""Personal disability""Concerns over personal safety""Traffic congestion/roadworks""Environmental concerns"97. "Other (specify)"
CarSNYM(QUESTION DELETED2004 ONWARDS)
IF some other reason why car remainsunused (CarSNYM = other) THENXCarSNYM"^LDMIntNamePlease specify other answer.TEXT SHOULD BE NO MORE THAN60 CHARACTERS"

National Centre for Social Research
262
XCarSNYM(QUESTION DELETED2004 ONWARDS)
TDemTr / QTDemTr.NTSBDemTr
Questions asked of:Each individual household memberaged 16 and over in turn
IF aged 16 or over (DvAGE >= 16)THENOthDif"^LDMIntName SHOW CARD Q (Apart from anything you have alreadymentioned) Do you have any transportdifficulties for any of these types ofjourney?CODE ALL THAT APPLY"1. "Travelling to the doctors/hospital"2. "Visiting friends/relatives at theirhome"3. "Travelling to other socialactivities"4. "Taking the children toschool/social activities etc."5. "Travelling toschool/college/university"6. "Travelling for any other reason(specify)"7. "No difficulties with any of these"
IF respondent has transport difficultiesfor some other journey purpose(OthDif = Other) THENXOthDif"^LDMIntNamePLEASE SPECIFY OTHER REASONFOR TRAVELLING.TEXT SHOULD BE NO MORE THAN60 CHARACTERS"
IF respondent has transport difficultiestravelling to the doctors (OthDif = Med)THENYDiff1
"^LDMIntName What difficulties do you experiencewhen travelling to thedoctors/hospital?CODE ALL THAT APPLY"1. "Too far/long journey"2. "Journey not possible by publictransport"3. "Unreliable public transport"4. "Cost of using publictransport/taxis"5. "Poor information about publictransport services"6. "Poor connections"7. "Finds public transport unpleasant"8. "Don't have current drivinglicence/can't drive "9. "Cost of petrol"10. "Lack of parking facilities"11. "Cost of parking"12. "Personal disability"13. "Concerns over personal safety"14. "Traffic congestion/roadworks"97. "Other (SPECIFY)"
IF respondent has other transportdifficulties with travelling to thedoctors/hospital (YDiff1 = other) THENXYDiff1"^LDMIntNamePLEASE SPECIFY OTHER ANSWER.TEXT SHOULD BE NO MORE THAN60 CHARACTERS"

National Centre for Social Research
263
IF respondent has transport difficultieswhen visiting friends/relatives at theirhome (OthDif =Visit) THENYDiff2"^LDMIntName What difficulties do you experiencewhen visiting friends/relatives at theirhome?CODE ALL THAT APPLY"1. "Too far/long journey"2. "Journey not possible by publictransport"3. "Unreliable public transport"4. "Cost of using publictransport/taxis"5. "Poor information about publictransport services"6. "Poor connections"7. "Finds public transport unpleasant"8. "Don't have current drivinglicence/can't drive "9. "Cost of petrol"10. "Lack of parking facilities"11. "Cost of parking"12. "Personal disability"13. "Concerns over personal safety"14. "Traffic congestion/roadworks"97. "Other (SPECIFY)"
IF respondent has other transportdifficulties when visitingfriends/relatives at their home (YDiff2= other) THENXYDiff2"^LDMIntNamePLEASE SPECIFY OTHER ANSWER.TEXT SHOULD BE NO MORE THAN60 CHARACTERS"
IF respondent has transport difficultieswhen travelling to other socialactivities (OthDif = Social) THENYDiff3"^LDMIntNameWhat difficulties do you experiencewhen travelling to other socialactivities?CODE ALL THAT APPLY"1. "Too far/long journey"
2. "Journey not possible by publictransport"3. "Unreliable public transport"4. "Cost of using publictransport/taxis"5. "Poor information about publictransport services"6. "Poor connections"7. "Finds public transport unpleasant"8. "Don't have current drivinglicence/can't drive "9. "Cost of petrol"10. "Lack of parking facilities"11. "Cost of parking"12. "Personal disability"13. "Concerns over personal safety"14. "Traffic congestion/roadworks"97. "Other (SPECIFY)"
IF respondent has other transportdifficulties when travelling to othersocial activities (YDiff3 = other) THENXYDiff3"^LDMIntNamePLEASE SPECIFY OTHER ANSWER.TEXT SHOULD BE NO MORE THAN60 CHARACTERS"
IF respondent has transport difficultieswhen when taking the children toschool/social activities etc (OthDif =Escort) THENYDiff4"^LDMIntName What difficulties do you experiencewhen taking the children toschool/social activities etc?CODE ALL THAT APPLY"1. "Too far/long journey"2. "Journey not possible by publictransport"3. "Unreliable public transport"4. "Cost of using publictransport/taxis"5. "Poor information about publictransport services"6. "Poor connections"7. "Finds public transport unpleasant"8. "Don't have current drivinglicence/can't drive "

National Centre for Social Research
264
9. "Cost of petrol"10. "Lack of parking facilities"11. "Cost of parking"12. "Personal disability"13. "Concerns over personal safety"14. "Traffic congestion/roadworks"97. "Other (SPECIFY)"
IF respondent has other transportdifficulties when taking the children toschool/social activities etc (YDiff4 =other) THENXYDiff4"^LDMIntNamePLEASE SPECIFY OTHER ANSWER.TEXT SHOULD BE NO MORE THAN60 CHARACTERS"
IF respondent has transport difficultieswhen travelling toschool/college/university (OthDif =Educ) THENYDiff5"^LDMIntName What difficulties do you experiencewhen travelling toschool/college/university?CODE ALL THAT APPLY"1. "Too far/long journey"2. "Journey not possible by publictransport"3. "Unreliable public transport"4. "Cost of using publictransport/taxis"5. "Poor information about publictransport services"6. "Poor connections"7. "Finds public transport unpleasant"8. "Don't have current drivinglicence/can't drive "9. "Cost of petrol"10. "Lack of parking facilities"11. "Cost of parking"12. "Personal disability"13. "Concerns over personal safety"14. "Traffic congestion/roadworks"97. "Other (SPECIFY)"
IF respondent has other transportdifficulties when travelling toschool/college/university (YDiff5 =other) THENXYDiff5"^LDMIntNamePLEASE SPECIFY OTHER ANSWER.TEXT SHOULD BE NO MORE THAN60 CHARACTERS"
IF respondent has transport difficultieswhen travelling for some other journeypurpose (OthDif = Other) THENYDiff6"^LDMIntName What difficulties do you experiencewhen travelling: ^XOthDif ?CODE ALL THAT APPLY"1. "Too far/long journey"2. "Journey not possible by publictransport"3. "Unreliable public transport"4. "Cost of using publictransport/taxis"5. "Poor information about publictransport services"6. "Poor connections"7. "Finds public transport unpleasant"8. "Don't have current drivinglicence/can't drive "9. "Cost of petrol"10. "Lack of parking facilities"11. "Cost of parking"12. "Personal disability"13. "Concerns over personal safety"14. "Traffic congestion/roadworks"97. "Other (SPECIFY)"
IF respondent has other transportdifficulties when travelling for someother journey purpose (YDiff6 = other)THENXYDiff6"^LDMIntNamePLEASE SPECIFY OTHER ANSWER.TEXT SHOULD BE NO MORE THAN60 CHARACTERS"

National Centre for Social Research
265
BNoTick / QNOTICK.NTS
IF age is greater than 4 (DVAge > 4)THENStckT"^LDMIntNameSHOW CARD R Do you have any of these specialtickets or passes, valid for a week orlonger?INTERVIEWER: EXCLUDE ONE DAYTRAVELCARDS AND CARNETS.BLUE/ORANGE DISBALED BADGESARE NOT INCLUDED.ASK TO SEE TICKET/PASS. (EXTRAINT. INSTRUCTION ADDED 2003ONWARDS)"1. "Yes"2. "No"
IF respondent does have special ticket(StckT = Yes) THENSeeTick"^LDMIntName INTERVIEWER: Ask Respondent toget ticket/pass if possible."1. "Ticket/Pass seen"2. "Ticket/Pass NOT seen"
IF respondent does have special ticket(StckT = Yes) THENNoTckt"^LDMIntNameHow many of these do you have?"
TTicket / QTICKET.NTSBTicket
Questions asked of:Each individual household memberaged 5 and over, in turn
IF respondent does have special ticket(StckT = Yes) THENTckT"^LDMIntName TO RECORD DETAILS OF^LTTicket3 TICKETPRESS <ENTER> AND CONTINUE"
IF respondent does have special ticket(StckT = Yes) THENSpecTk"^LDMIntNameTICKET NUMBER: ^LTTicket1TYPE OF SPECIAL TICKET\PASS(HELP <F9>)INTERVIEWER: CODE TYPE OFTICKET"1. "NON-CONCESSIONARY Seasonticket"2. "NON-CONCESSIONARY Areatravel card"3. "NON-CONCESSIONARYCombined season/area travel card"4. "NON-CONCESSIONARYRailcard"5. "NON-CONCESSIONARYEmployee's special pass"6. "Other NON-CONCESSIONARYticket (SPECIFY)"7. "CONCESSIONARY OAP Pass"8. "CONCESSIONARY Scholar'spass"9. "CONCESSIONARY Disabledperson's pass"10. "CONCESSIONARY Subsidisedtravel tokens"11. "Other CONCESSIONARY ticket(SPECIFY)"
If respondent has some otherconcessionary ticket (SpecTk = other)THENXSpecTk"^LDMIntNameINTERVIEWER: Please describe whatkind of other concessionary or non-concessionary ticket the informanthas."

National Centre for Social Research
266
IF respondent does have special ticket(StckT = Yes) THENTkMode"^LDMIntNameTICKET NUMBER: ^LTTicket1What forms of transport does the ticketcover?"1. "Train"2. "LT underground/Tyne and WearMetro/ Glasgow underground"3. "Light Rail/Tram"4. "Bus"5. "Other single method"6. "Combined (ex-BR) train &underground"7. "Combined (ex-BR) train & bus(NOT IN LONDON)"8. "Combined underground/bus"9. "Combined (ex-BR) train &underground & bus"10. "Combined (ex-BR) train &underground & bus & light rail/tram"11. "Other combination of methods"
IF ticket covers combined methods oftransport (Tkmode = ComBRug –OthComb) THENMoMls"^LDMIntNameTICKET NUMBER: ^LTTicket1When you use your combined ticket,on which method of transport do youtravel furthest?"1. "Train"2. "Underground"3. "Light Rail/Tram"4. "Bus"5. "DK/Other"
(CHANGED 2003 ONWARDS TO:)When you use your combined ticket,on which method of transport do youtravel the most mileage?"1. "Train"2. "Underground"3. "Light Rail/Tram"4. "Bus"5. "DK/Other"
IF ticket type is anything other than asubsidised ticket (SpecTk <> Subsidy)THENTkTime"^LDMIntNameTICKET NUMBER: ^LTTicket1How long does the ticket\pass lastfor?"1. "1 week"2. "1 month"3. "3 months/school term"4. "6 months"5. "1 Year"6. "more than 1 year"7. "unlimited"97. "Other (SPECIFY)"
IF ticket lasts for a different time period(TkTime = Other)THENXTkTime"^LDMIntNameINTERVIEWER: Please record thelength of time the ticket covers.Remember to recode whereverpossible."
IF ticket type is anything other than asubsidised ticket (SpecTk <> Subsidy)THENTkCst"^LDMIntNameTICKET NUMBER: ^LTTicket1What was the actual (net) cost to youof the ticket?ENTER COST TO THE HOUSEHOLDIN POUNDS & PENCE. EXAMPLES10 pounds and 6p. Enter 10.067 pounds and 63p. Enter 7.63IF NIL ENTER 0"
IF ticket type is anything other than asubsidised ticket (SpecTk <> Subsidy)THENNumJrn"^LDMIntNameTICKET NUMBER: ^LTTicket1How many ^MMethtxt journeys perweek would you expect to use the
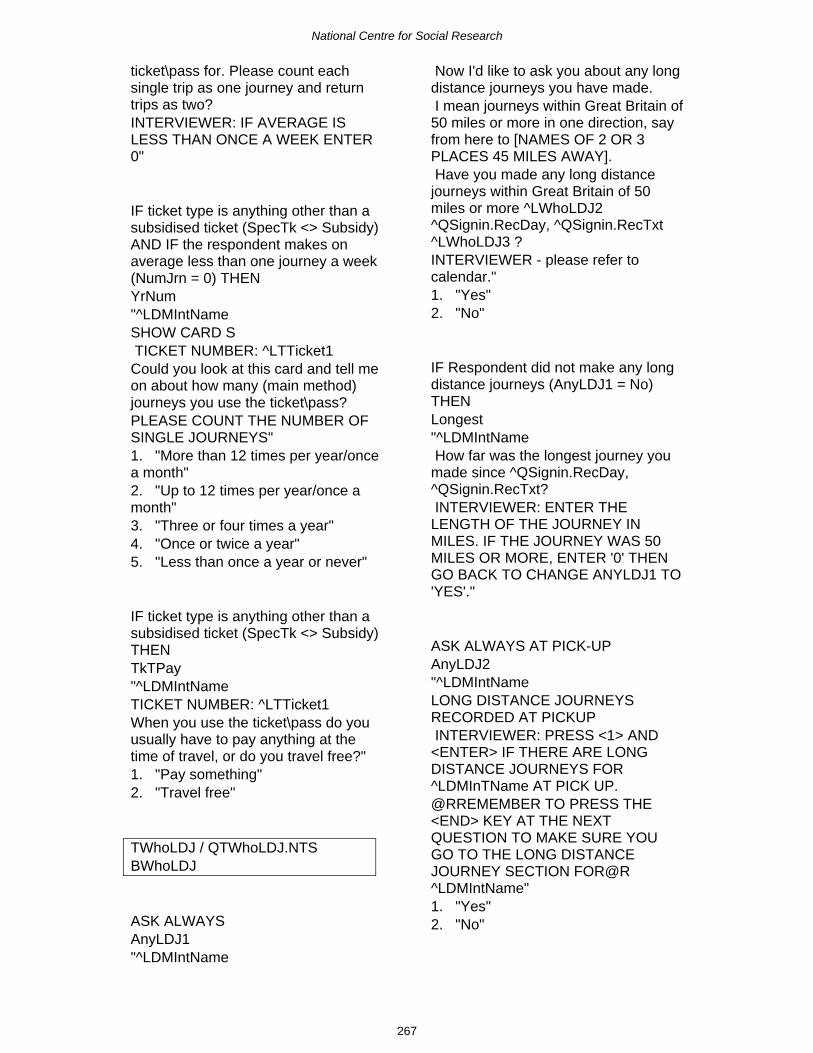
National Centre for Social Research
267
ticket\pass for. Please count eachsingle trip as one journey and returntrips as two?INTERVIEWER: IF AVERAGE ISLESS THAN ONCE A WEEK ENTER0"
IF ticket type is anything other than asubsidised ticket (SpecTk <> Subsidy)AND IF the respondent makes onaverage less than one journey a week(NumJrn = 0) THENYrNum"^LDMIntNameSHOW CARD S TICKET NUMBER: ^LTTicket1Could you look at this card and tell meon about how many (main method)journeys you use the ticket\pass?PLEASE COUNT THE NUMBER OFSINGLE JOURNEYS"1. "More than 12 times per year/oncea month"2. "Up to 12 times per year/once amonth"3. "Three or four times a year"4. "Once or twice a year"5. "Less than once a year or never"
IF ticket type is anything other than asubsidised ticket (SpecTk <> Subsidy)THENTkTPay"^LDMIntNameTICKET NUMBER: ^LTTicket1When you use the ticket\pass do youusually have to pay anything at thetime of travel, or do you travel free?"1. "Pay something"2. "Travel free"
TWhoLDJ / QTWhoLDJ.NTSBWhoLDJ
ASK ALWAYSAnyLDJ1"^LDMIntName
Now I'd like to ask you about any longdistance journeys you have made. I mean journeys within Great Britain of50 miles or more in one direction, sayfrom here to [NAMES OF 2 OR 3PLACES 45 MILES AWAY]. Have you made any long distancejourneys within Great Britain of 50miles or more ^LWhoLDJ2^QSignin.RecDay, ^QSignin.RecTxt^LWhoLDJ3 ?INTERVIEWER - please refer tocalendar."1. "Yes"2. "No"
IF Respondent did not make any longdistance journeys (AnyLDJ1 = No)THENLongest"^LDMIntName How far was the longest journey youmade since ^QSignin.RecDay,^QSignin.RecTxt? INTERVIEWER: ENTER THELENGTH OF THE JOURNEY INMILES. IF THE JOURNEY WAS 50MILES OR MORE, ENTER '0' THENGO BACK TO CHANGE ANYLDJ1 TO'YES'."
ASK ALWAYS AT PICK-UPAnyLDJ2"^LDMIntNameLONG DISTANCE JOURNEYSRECORDED AT PICKUP INTERVIEWER: PRESS <1> AND<ENTER> IF THERE ARE LONGDISTANCE JOURNEYS FOR^LDMInTName AT PICK UP.@RREMEMBER TO PRESS THE<END> KEY AT THE NEXTQUESTION TO MAKE SURE YOUGO TO THE LONG DISTANCEJOURNEY SECTION FOR@R^LDMIntName"1. "Yes"2. "No"

National Centre for Social Research
268
BLDJINT / QLDJINT.NTS
If Respondent made any long distancejournyeys (AnyLDJ2 = Yes) THENLDJInt"^LDMIntName INTERVIEWER: DO YOU WANT TOENTER THE JOURNEYS MADE BY^LDMIntname NOW OR LATER?"1. "Now"2. "Later"
TLDJQs / QTLDJQs.NTSBLDJQs
IF Respondent made any longdistance journyeys (AnyLDJ2 = Yes)THENLDJ"ENTER LONG DISTANCE JOURNEYNUMBER"
IF Respondent made any longdistance journyeys (AnyLDJ2 = Yes)THENLDJDate"^LDMIntName On what date did you make your^LOrdTxt long distance journey of 50miles or more ^LLDJQs2?"
IF Respondent made more than onelong distance journey (LTLDJQs1 > 1)THENRepJ"^LDMIntNameIF REPEAT OF PREVIOUSJOURNEY MADE BY THIS PERSON,ENTER JOURNEY NUMBER, THENPRESS <ENTER> THEN <END>.OTHERWISE ENTER 0"
(QUESTION ADDED 2003ONWARDS:)
IF Respondent made more than onelong distance journey (LTLDJQs1 > 1)THENRepJR"^LDMIntNameIF RETURN JOURNEY OFPREVIOUS JOURNEY MADE BYTHIS PERSON, ENTER JOURNEYNUMBER, THEN PRESS <ENTER>THEN <END>.OTHERWISE ENTER 0"
IF Respondent made more than onelong distance journey (LTLDJQs1 > 1)THENDupP"^LDMIntNameIF DUPLICATE OF JOURNEY MADEBY ANOTHER HOUSEHOLDMEMBER, ENTER THEIR PERSONNUMBER OTHERWISE ENTER 0
IF Respondent made more than onelong distance journey (LTLDJQs1 > 1)THENDupJ"^LDMIntName ENTER^QNames.QBNames[DupP].Name'sJOURNEY NUMBER FOR THEDUPLICATE JOURNEY, THENPRESS <ENTER> THEN <END>.^DupJTxt[1] ^DupJTxt[2]^DupJTxt[3] ^DupJTxt[4]^DupJTxt[5] ^DupJTxt[6]^DupJTxt[7] ^DupJTxt[8]^DupJTxt[9] ^DupJTxt[10]^DupJTxt[11] ^DupJTxt[12]^DupJTxt[13] ^DupJTxt[14]^DupJTxt[15] ^DupJTxt[16]^DupJTxt[17] ^DupJTxt[18]^DupJTxt[19] ^DupJTxt[20]^DupJTxt[21] ^DupJTxt[22]^DupJTxt[23] ^DupJTxt[24]^DupJTxt[25] ^DupJTxt[26]^DupJTxt[27] ^DupJTxt[28]^DupJTxt[29] ^DupJTxt[30]^DupJTxt[31] ^DupJTxt[32]^DupJTxt[33] ^DupJTxt[34]^DupJTxt[35] ^DupJTxt[36]

National Centre for Social Research
269
^DupJTxt[37] ^DupJTxt[38]^DupJTxt[39] ^DupJTxt[40]"
ASK FOR ALL LONG DISTANCEJOURNEYSOrig"^LDMIntName From where did your journey begin? INTERVIEWER: TYPE IN FIRSTFEW LETTERS OF PLACE NAME TOENTER CODING FRAME. IF THE PLACE ISNOT LISTED, TYPE XXX AND CODEAS 89 (NOT LISTED/DON'T KNOW).IF NECESSARY USE SHOW CARD NTO FIND OUT WHETHER THISPLACE IS WITHIN M25 BOUNDARY.ON EXITING THE CODING FRAMEPRESS ENTER AGAIN TO MOVE TONEXT QUESTION."
IF placename is not in codeframe(Orig = 89)THENXOrig"^LDMIntName INTERVIEWER: TYPE IN NAME OFPLACE FROM WHICH JOURNEYBEGAN, INCLUDING COUNTY ORNEAREST LARGE TOWN"
CODE FOR ALL LONG DISTANCEJOURNEYSOrigUA"^LDMIntName Unitary Authority code of origin PRECODED - PRESS ENTER TOCONTINUE"
ASK FOR ALL LONG DISTANCEJOURNEYSOrigUR"^LDMIntName Urban/Rural code of origin PRECODED - PRESS ENTER TOCONTINUE"
ASK FOR ALL LONG DISTANCEJOURNEYSOrigPl"Place of origin - from coding frame"
ASK FOR ALL LONG DISTANCEJOURNEYSPurpTo"^LDMIntNameWhat was the purpose of yourjourney?PROBE AS NECESSARY.Was it @Iprincipally@I to pick up oraccompany someone else?IF SO: What were @Ithey@I doing atthe time?TYPE IN AS MUCH DETAIL ASPOSSIBLE"
ASK FOR ALL LONG DISTANCEJOURNEYSPurpFro1"^LDMIntName ASK OR RECORD (Can I check) Did your journey startfrom home or from somewhere else?"1. "Home"2. "Somewhere else"
If the journey started from somewhereelse (PurpFro1 = Elsew) THENPurpFro"^LDMIntNameWhy were you at the place where yourjourney started from?ADD IF NECESSARY: 'for example,were you at work/college, visitingfriends, on holiday etc?'PROBE AS NECESSARY.Were you there @Iprincipally@I topick up or accompany someone else?IF SO: What were @Ithey@I doing atthe time?TYPE IN AS MUCH DETAIL ASPOSSIBLE"

National Centre for Social Research
270
ASK FOR ALL LONG DISTANCEJOURNEYSDest"^LDMIntName Where did your journey end?INTERVIEWER: TYPE IN FIRST FEWLETTERS OF PLACE NAME TOENTER CODING FRAME. IF THEPLACE IS NOT LISTED, TYPE XXXAND CODE AS 89 (NOTLISTED/DON'T KNOW).IF NECESSARY USE SHOW CARD NTO FIND OUT WHETHER THISPLACE IS WITHIN M25 BOUNDARYON EXITING THE CODING FRAME,PRESS ENTER AGAIN TO MOVE TOTHE NEXT QUESTION. (EXTRA INT.INSTRUCTION ADDED 2003ONWARDS)"
IF placename is not in codeframe(Dest = 89) THENXDest"^LDMIntName INTERVIEWER: TYPE IN NAME OFPLACE WHERE JOURNEY ENDED,INCLUDING COUNTY OR NEARESTLARGE TOWN"
ASK FOR ALL LONG DISTANCEJOURNEYSDist"^LDMIntName How far did you travel (in total on thisjourney)?IF INFORMANT ANSWERS DON'TKNOW, ASK FOR AN ESTIMATE.ENTER DISTANCE IN MILES"
ASK FOR ALL LONG DISTANCEJOURNEYSMeth95"^LDMIntNameWhat method of travel did you use forthe main part of your journey? (Bymain part I mean the part of yourjourney which covered the longestdistance) (HELP <F9>)"
1. "Walk"2. "Bicycle"3. "Private (hire) bus"4. "Car"5. "Motorcycle"6. "Van, lorry"7. "Other private"8. "Ordinary bus - London"9. "Ordinary bus - elsewhere"10. "Coach, express bus"11. "Excursion/tour bus"12. "LT Underground"13. "Train"14. "Light Rail"15. "Aircraft (public)"16. "Taxi"17. "Minicab"18. "Other public"19. "Private (unspecified)"20. "Public (unspecified)"
IF LDJ was undertaken in a privatevehicle (Meth95 IN [Car, MCycle,VanLorry, OthPriv]) AND age 16 ormore (DVAge >= 16) THENDriPas"^LDMIntName Were you the driver of this vehicle orthe passenger? (HELP <F9>)"1. "Driver"2. "Passenger"
ASK FOR ALL LONG DISTANCEJOURNEYSMore"^LDMIntNameDid you make any other long distancejourneys^LLDJQs2?Please include return journeys.@R^LLDJQs3@R"1. "Yes"2. "No"
EndInd
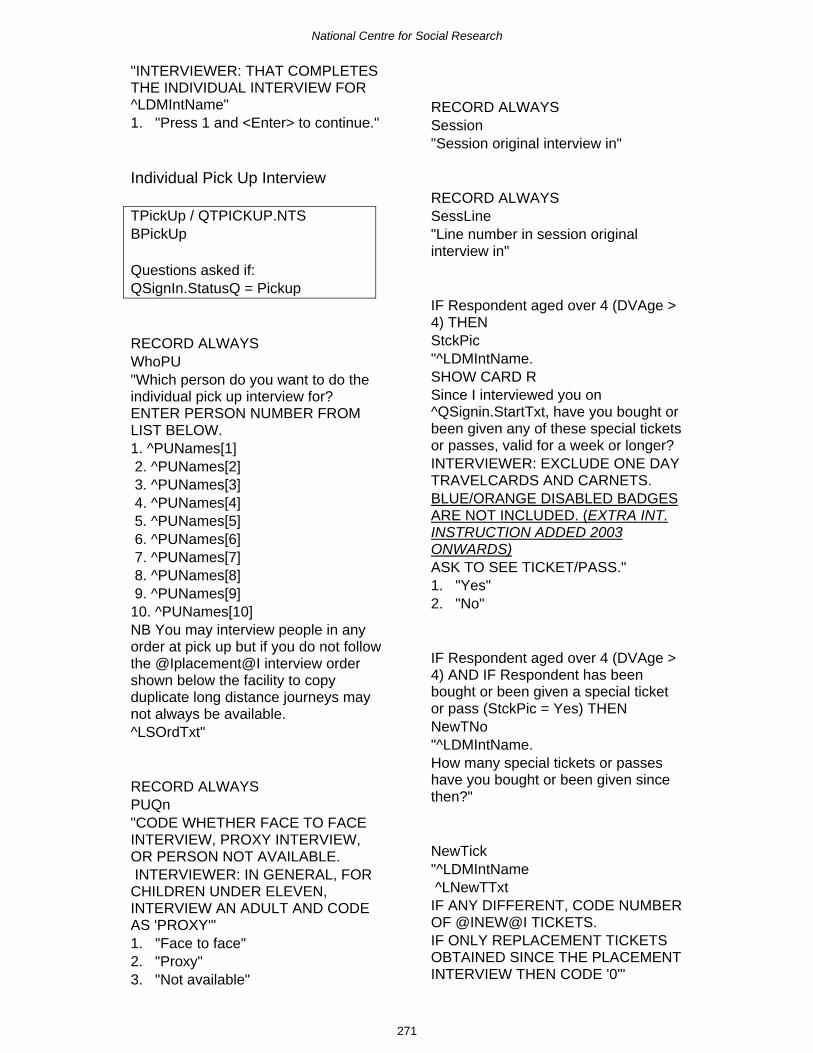
National Centre for Social Research
271
"INTERVIEWER: THAT COMPLETESTHE INDIVIDUAL INTERVIEW FOR^LDMIntName"1. "Press 1 and <Enter> to continue."
Individual Pick Up Interview
TPickUp / QTPICKUP.NTSBPickUp
Questions asked if:QSignIn.StatusQ = Pickup
RECORD ALWAYSWhoPU"Which person do you want to do theindividual pick up interview for?ENTER PERSON NUMBER FROMLIST BELOW.1. ^PUNames[1] 2. ^PUNames[2] 3. ^PUNames[3] 4. ^PUNames[4] 5. ^PUNames[5] 6. ^PUNames[6] 7. ^PUNames[7] 8. ^PUNames[8] 9. ^PUNames[9]10. ^PUNames[10]NB You may interview people in anyorder at pick up but if you do not followthe @Iplacement@I interview ordershown below the facility to copyduplicate long distance journeys maynot always be available.^LSOrdTxt"
RECORD ALWAYSPUQn"CODE WHETHER FACE TO FACEINTERVIEW, PROXY INTERVIEW,OR PERSON NOT AVAILABLE. INTERVIEWER: IN GENERAL, FORCHILDREN UNDER ELEVEN,INTERVIEW AN ADULT AND CODEAS 'PROXY'"1. "Face to face"2. "Proxy"3. "Not available"
RECORD ALWAYSSession"Session original interview in"
RECORD ALWAYSSessLine"Line number in session originalinterview in"
IF Respondent aged over 4 (DVAge >4) THENStckPic"^LDMIntName.SHOW CARD RSince I interviewed you on^QSignin.StartTxt, have you bought orbeen given any of these special ticketsor passes, valid for a week or longer?INTERVIEWER: EXCLUDE ONE DAYTRAVELCARDS AND CARNETS.BLUE/ORANGE DISABLED BADGESARE NOT INCLUDED. (EXTRA INT.INSTRUCTION ADDED 2003ONWARDS)ASK TO SEE TICKET/PASS."1. "Yes"2. "No"
IF Respondent aged over 4 (DVAge >4) AND IF Respondent has beenbought or been given a special ticketor pass (StckPic = Yes) THENNewTNo"^LDMIntName.How many special tickets or passeshave you bought or been given sincethen?"
NewTick"^LDMIntName ^LNewTTxtIF ANY DIFFERENT, CODE NUMBEROF @INEW@I TICKETS.IF ONLY REPLACEMENT TICKETSOBTAINED SINCE THE PLACEMENTINTERVIEW THEN CODE '0'"

National Centre for Social Research
272
ASK ALWAYSDLFNew"^LDMIntName Since I last interviewed you on^QSignin.StartTxt, have you acquireda full driving licence valid in GreatBritain to drive either a car, or amotorcycle, scooter or moped?"1. "Yes"2. "No"
IF Respondent has a driving licenceOR the respondent has a licence for amotorcycle over 125CC (IF DLTyp95 =Car OR Auto OR CarRes ORCarMot95 = RESPONSE) THENDrive95"^LDMIntName Do you drive... READ OUT ...(HELP <F9>)CODE AUTOMATIC CAR AS ANORDINARY CARCODE ALL THAT APPLY"1. "...an ordinary car (without specialadaptations for people withdisabilities),"2. "...a car with special adaptationsfor people with disabilities,"3. "...or some other kind of vehicle?"4. "(no longer drive)"
IF Respondent has not acquired a fulldriving licence (DLFNew = No) THENDLNPro"^LDMIntName Have you acquired a provisionaldriving licence since I last interviewed you on^QSignin.PlDay, ^QSignin.StartTxt?"1. "Yes"2. "No"
ASK ALWAYSAnyLDJP"^LDMIntName
(Now I'd like to ask you about longdistance journeys you may have madebetween ^LWhoLDJ1 and ^QSignin.Rec2day,^QSignin.Rec2. By long distance I mean a journeymade within Great Britain of 50 milesor more in one direction say from hereto [2 or 3 places 45 miles away]). Have you made any journeys withinGreat Britain of 50 miles or morebetween ^LWhoLDJ1 and^QSignin.Rec2Day, ^QSignin.Rec2?"1. "Yes and ready to enter now"2. "Yes but code later"3. "No"
(QUESTION ADDED 2003ONWARDS:)
LDJDisp"INTERVIEWER: Use <Ctrl+Enter>and select Session ^SessionN fromthe parallel block menu.Once you have selected the sessionuse the <END> key to takeyou to point where journey details canbe entered for ^LDMIntName.Do not enter '1' here until you haveentered the long distanceJourneys.1. "Press 1 and <Enter> to continue."
IF Respondent has not made a longdistance journey since the placementinterview (AnyLDJP = No) THENLong2"^LDMIntName@ Have you made a longer journeythan the one of^QTWhoLDJ[Session].WhoLDJ[SessLine].Longestx miles that you mentionedat the first interview? IF THE JOURNEY WAS 50 MILESOR MORE GO BACK AND CHANGEAnyLDJP TO 'YES'."1. "Yes"2. "No"

National Centre for Social Research
273
IF Respondent is aged between 5 and15 (DVAge <= 15 AND >= 5) THENYPDQ"INTERVIEWER: CHECK DAY 7 OF^LDMintName's DIARY TO SEE IF'TIME SPENT IN THE STREET' HASBEEN COMPLETED.IF NOT FULLY COMPLETED, ASKFOR THIS INFORMATION ANDENTER IT NOW.IF COMPLETED, ENTER LATER.(INT. INSTRUCTION DELETED 2003ONWARDS)IF NO TIME WAS SPENT IN THESTREET, ENTER 'NOW' ANDRECORD 'NO' AT THE NEXTQUESTION"1. "Now"2. "Later"
IF Respondent is aged between 5 and15 (DVAge <= 15 AND >= 5) AND IFTime spent on street is entered now(YPDQ = Now) THENInStreet"Did ^LDMIntName spend any time inthe street on day 7 that was notincluded in the journeys for that day?ASK OR RECORD."1. "Yes"2. "No"
(CHANGED 2003 ONWARDS TO:)"Did ^LDMIntName/you spend anytime playing in the street on day 7which was not included in the journeysfor that day? "ASK OR RECORD.1. "Yes"2. "No"
IF Respondent is aged between 5 and15 (DVAge <= 15 AND >= 5) AND IFRespondent spent time in the street onday 7 (InStreet = Yes) THENStart1"^LDMIntNameENTER START TIME OF 1st PERIODIN STREET IN 24 HOUR CLOCK(E.G. 13:00)"
(CHANGED 2003 ONLY TO:)"^LDMIntNameWhen did you go out to play for thefirst time on that day?ENTER START TIME OF 1st PERIODIN STREET IN 24 HOUR CLOCK(E.G. 13:00)"
(CHANGED 2004 ONWARDS TO:)"^LDMIntNameWhen did you go out to play for thefirst time on that day?ENTER START TIME OF 1st PERIODIN STREET IN 24 HOUR CLOCK(E.G. 13:00 for 1pm in the afternoon,18.30 for 6.30pm in the evening)"
End1"^LDMIntNameENTER END TIME OF 1st PERIOD INSTREET IN 24 HOUR CLOCK (E.G.13:00)"
(CHANGED 2003 ONLY TO:)"And when did you finish playing in thestreet?ENTER END TIME OF 1st PERIOD INSTREET IN 24 HOUR CLOCK (E.G.13:00)"
(CHANGED 2004 ONWARDS TO:)"And when did you finish playing in thestreet?ENTER END TIME OF 1st PERIOD INSTREET IN 24 HOUR CLOCK (E.G.13:00 for 1pm in the afternoon, 18.30for 6.30pm in the evening)"
Start2"^LDMIntNameENTER START TIME OF 2ndPERIOD IN STREET IN 24 HOURCLOCK (E.G. 13:00)IF NO MORE PERIODS IN STREETPRESS <END>"

National Centre for Social Research
274
(CHANGED 2003 ONLY TO:)"^LDMIntNameWhen did you go out to play for thesecond time on that day?ENTER START TIME OF 2ndPERIOD IN STREET IN 24 HOURCLOCK (E.G. 13:00)"
(CHANGED 2004 ONWARDS TO:)"^LDMIntNameWhen did you go out to play for thesecond time on that day?ENTER START TIME OF 2ndPERIOD IN STREET IN 24 HOURCLOCK (E.G. 13:00 for 1pm in theafternoon, 18.30 for 6.30pm in theevening)"
End2"^LDMIntNameENTER END TIME OF 2nd PERIODIN STREET IN 24 HOUR CLOCK(E.G. 13:00)
(CHANGED 2003 ONLY TO:)"And when did you finish playing in thestreet?ENTER END TIME OF 2nd PERIODIN STREET IN 24 HOUR CLOCK(E.G. 13:00)"
(CHANGED 2004 ONWARDS TO:)"And when did you finish playing in thestreet?ENTER END TIME OF 2nd PERIODIN STREET IN 24 HOUR CLOCK(E.G. 13:00 for 1pm in the afternoon,18.30 for 6.30pm in the evening)"
Start3"^LDMIntNameENTER START TIME OF 3rd PERIODIN STREET IN 24 HOUR CLOCK(E.G. 13:00)IF NO MORE PERIODS IN STREETPRESS <END>"
(CHANGED 2003 ONLY TO:)"^LDMIntName
When did you go out to play for thethird time on that day?ENTER START TIME OF 3rd PERIODIN STREET IN 24 HOUR CLOCK(E.G. 13:00)"
(CHANGED 2004 ONWARDS TO:)"^LDMIntNameWhen did you go out to play for thethird time on that day?ENTER START TIME OF 3rd PERIODIN STREET IN 24 HOUR CLOCK(E.G. 13:00 for 1pm in the afternoon,18.30 for 6.30pm in the evening)"
End3"^LDMIntNameENTER END TIME OF 3rd PERIOD INSTREET IN 24 HOUR CLOCK (E.G.13:00)
(CHANGED 2003 ONLY TO:)"And when did you finish playing in thestreet?ENTER END TIME OF 3rd PERIOD INSTREET IN 24 HOUR CLOCK (E.G.13:00)"
(CHANGED 2004 ONWARDS TO:)"And when did you finish playing in thestreet?ENTER END TIME OF 3rd PERIOD INSTREET IN 24 HOUR CLOCK (E.G.13:00 for 1pm in the afternoon, 18.30for 6.30pm in the evening)"
Start4"^LDMIntNameENTER START TIME OF 4th PERIODIN STREET IN 24 HOUR CLOCK(E.G. 13:00)IF NO MORE PERIODS IN STREETPRESS <END>"
(CHANGED 2003 ONLY TO:)"^LDMIntNameWhen did you go out to play for thefourth time on that day?

National Centre for Social Research
275
ENTER START TIME OF 4th PERIODIN STREET IN 24 HOUR CLOCK(E.G. 13:00)"
(CHANGED 2004 ONWARDS TO:)"^LDMIntNameWhen did you go out to play for thefourth time on that day?ENTER START TIME OF 4th PERIODIN STREET IN 24 HOUR CLOCK(E.G. 13:00 for 1pm in the afternoon,18.30 for 6.30pm in the evening)"
End4"^LDMIntNameENTER END TIME OF 4th PERIOD INSTREET IN 24 HOUR CLOCK (E.G.13:00)
(CHANGED 2003 ONLY TO:)"And when did you finish playing in thestreet?ENTER END TIME OF 4th PERIOD INSTREET IN 24 HOUR CLOCK (E.G.13:00)"
(CHANGED 2004 ONWARDS TO:)"And when did you finish playing in thestreet?ENTER END TIME OF 4th PERIOD INSTREET IN 24 HOUR CLOCK (E.G.13:00 for 1pm in the afternoon, 18.30for 6.30pm in the evening)"
Start5"^LDMIntNameENTER START TIME OF 5th PERIODIN STREET IN 24 HOUR CLOCK(E.G. 13:00)IF NO MORE PERIODS IN STREETPRESS <END>"
(CHANGED 2003 ONLY TO:)"^LDMIntNameWhen did you go out to play for thefifth time on that day?ENTER START TIME OF 5th PERIODIN STREET IN 24 HOUR CLOCK(E.G. 13:00)"
(CHANGED 2004 ONWARDS TO:)"^LDMIntNameWhen did you go out to play for thefifth time on that day?ENTER START TIME OF 5th PERIODIN STREET IN 24 HOUR CLOCK(E.G. 13:00 for 1pm in the afternoon,18.30 for 6.30pm in the evening)"
End5"^LDMIntNameENTER END TIME OF 5th PERIOD INSTREET IN 24 HOUR CLOCK (E.G.13:00)
(CHANGED 2003 ONLY TO:)"And when did you finish playing in thestreet?ENTER END TIME OF 5th PERIOD INSTREET IN 24 HOUR CLOCK (E.G.13:00)"
(CHANGED 2004 ONWARDS TO:)"And when did you finish playing in thestreet?ENTER END TIME OF 5th PERIOD INSTREET IN 24 HOUR CLOCK (E.G.13:00 for 1pm in the afternoon, 18.30for 6.30pm in the evening)"

National Centre for Social Research
276
Vehicle Questionnaire
BVehInt / QVehInt.NTS
Questions asked if:QVehNum.Numveh > 0
AND
QTVehTab.QVehTab[LVLoop].WhenAcq <> Aftr
Questions asked of:Respondent who best knows aboutvehicle (normally main driver but notnecessarily)
ALWAYS RECORDIntro"THIS IS THE START OF THEVEHICLE QUESTIONNAIRE FORTHE ^DMVEH[LVLoop]INTERVIEWER: DO YOU WANT TOCOMPLETE THE QUESTIONNAIREFOR THIS VEHICLE NOW ORLATER?INTERVIEWER: ASK THESEQUESTIONS OF THE MAIN DRIVER(^MDName) IF POSSIBLE^LPUTxt"1. "Now"2. "Later"
ASK ALWAYSRegIntr"I'd now like to ask for some detailsabout the ^DMVEH[LVLoop] so thatwe can collect information about thetypes of motor vehicles that peopleuse.First, could you give me theregistration number."1. "Willing to give (British) registrationnumber"2. "Not willing to give registrationnumber"3. "Foreign registration number"
(PRECODES CHANGED 2003ONWARDS TO:)1. "Willing to give (British) registrationnumber"2. "Not willing to give registrationnumber"3. "Willing to give registration numberbut cannot remember it correctly"4. "Foreign registration number"
IF Respondent is willing to giveregistration number (RegIntr = Willing)THEN:RegExpl"READ OUT: We will use this to lookup some details already held by DVLA.No information on your vehicle will begiven to anyone outside the statisticssection at DTLR and the registrationnumber will not be used to identify youor your household.DVLA = DRIVER AND VEHICLELICENSING AGENCY"1. "Acceptable to respondent -continue"2. "Not acceptable - change RegIntr"
(CHANGED 2004 ONWARDS TO:)"READ OUT: We will use this to lookup some details already held by DVLA.No information on your vehicle will begiven to anyone outside the statisticssection at DfT and the registrationnumber will not be used to identify youor your household.DVLA = DRIVER AND VEHICLELICENSING AGENCY"1. "Acceptable to respondent -continue"2. "Not acceptable - change RegIntr"
IF this is acceptable (RegExpl =Accept) THEN:VRegNo1"ENTER REGISTRATION NUMBERFOR THE ^DMVEH[LVLoop]INTERVIEWER: PLEASE USECAPITAL LETTERS AND DO NOTUSE SPACES BETWEEN PARTS OFTHE CODE."

National Centre for Social Research
277
IF this is acceptable (RegExpl =Accept) THEN:RFormat"INTERVIEWER: CODE FORMAT OFREGISTRATION NUMBER.(HOW REGISTRATION YEAR OFVEHICLE IS IDENTIFIED)."1. "AB@I12@ICDE (new format 2001onwards, with registration year shownby 2 numbers)."2. "@IA@I123CDE, @IA@I12BCD,@IA@I1BCD (old format 1983-2001with registration year letter at the@Istart@I)."3. "ABC123@ID@I, ABC12@ID@I,ABC1@ID@I (old pre-1983 formatwith registration year letter at the@Iend@I)."4. "None of these"
IF this is acceptable (RegExpl =Accept) THEN:RegNo"Can I ask you to repeat yourregistration number, so I can check itis recorded correctly.INTERVIEWER: ENTERREGISTRATION NUMBER FOR THE^DMVEH[LVLoop] AGAIN TOCONFIRM.PLEASE USE CAPITAL LETTERSAND DO NOT USE SPACESBETWEEN PARTS OF THE CODE.READ NUMBER BACK TORESPONDENT TO VERIFY.^LPUTxt"
IF Registration number not given(RegNo <> Response) THEN:FuelTyp"^DMVEH[LVLoop] What fuel does the^DMVEH[LVLoop]'s engine use?"1. "Petrol (INCLUDES LEAD FREEAND TWO STROKE)"2. "Diesel"3. "Electric/Battery"4. "Liquefied Petroleum Gas (LPG)"5. "Bi-fuel (petrol/gas)"97. "Other (SPECIFY)"
IF Some other fuel type is used(FuelTyp = Other) THEN:XFuelTyp"^DMVEH[LVLoop]PLEASE SPECIFY THE OTHERANSWER.TEXT SHOULD BE NO MORE THAN60 CHARACTERS"
IF Registration number not given(RegNo <> Response) AND thevehicle uses petrol (FuelTyp = Petrol)THEN:Leaded"^DMVEH[LVLoop]ASK OR RECORDIs the petrol... READ OUT...(HELP <F9>)"1. "...always unleaded,"2. "sometimes unleaded, sometimeslead replacement petrol (LRP),"3. "always lead replacement petrol,"4. "or always leaded (classic carsonly)?"
(PRECODES CHANGED 2003 ONLYTO:)1. "...always unleaded,"2. "sometimes unleaded, sometimeslead replacement petrol (LRP),"3. "always lead replacement petrol,"4. "CLASSIC CARS ONLY: or alwaysleaded?"
Leaded(QUESTION DELETED 2004ONWARDS)
BVMake / QVMake.NTS
Questions asked if:QVehNum.Numveh > 0
AND
QTVehTab.QVehTab[LVLoop].WhenAcq <> Aftr
AND

National Centre for Social Research
278
QVehInt.Intro = Now
AND
QVehInt.FuelTyp <> Electric
Questions asked of:Respondent who best knows aboutvehicle (normally main driver but notnecessarily)
IF Registration number not given(RegNo <> Response) AND IF vehicledoes not use electric/battery fuel(QVehInt.Fueltyp <> Electric) THEN:LogBook"^DMVEH[LVLoop]I need to obtain details about the^DMVEH[LVLoop] which are given inthe registration document (or logbook).ASK RESPONDENT TO GET LOGBOOK IF POSSIBLE."1. "Seen by interviewer"2. "Consulted by informant"3. "Not seen /consulted"
IF Registration number not given(RegNo <> Response) AND IF vehicledoes not use electric/battery fuel(QVehInt.Fueltyp <> Electric) THEN:Personal"^DMVEH[LVLoop]Is the registration number for thisvehicle a personalised or cherishednumber?"1. "Yes"2. "No"
IF Registration number not given(RegNo <> Response) AND IF vehicledoes not use electric/battery fuel(QVehInt.Fueltyp <> Electric) AND IFRegistration number is notpersonalised or cherished (Personal<> Yes) THEN:SimReg"SHOW CARD T1
^DMVEH[LVLoop]Which of the numbers on this cardlooks similiar to your registrationnumber?POINT TO EACH AND SAY:Is it likethis with two letters, then two numbers,or like this with a letter at the start, orlike this with a letter at the end?"1. "AB@I12@I CDE"2. "@IA@I123 CDE, @IA@I12 BCD,@IA@I1 BCD"3. "ABC 123@ID@I, ABC 12@ID@I,ABC 1@IA@I"4. "None of these"
(CHANGED 2003 ONWARDS TO:)"SHOW CARD U1^DMVEH[LVLoop]I would like to know the registrationyear of the ^DMVEH[LVLoop].To help with this, can you tell mewhich of the numbers on thiscard looks similar to the^DMVEH[LVLoop]'s registrationnumber?POINT TO EACH AND SAY:Is it likethis with two letters, then two numbers,or like this with a letter at the start, orlike this with a letter at the end?"1. "AB@I12@I CDE"2. "@IA@I123 CDE, @IA@I12 BCD,@IA@I1 BCD"3. "ABC 123@ID@I, ABC 12@ID@I,ABC 1@IA@I"4. "None of these"
IF Registration number not given(RegNo <> Response) AND IF vehicledoes not use electric/battery fuel(QVehInt.Fueltyp <> Electric) AND IFRegistration number is notpersonalised or cherished (Personal<> Yes) AND IF Registration numberis not in any given pattern (NOT(SimReg IN [Pat1..Pat3])) THEN:LookReg"^DMVEH[LVLoop]Could I look at the registration numberto find out which letter denotes theyear in your registration number? I willnot enter the whole number into thecomputer

National Centre for Social Research
279
INTERVIEWER: Please refer toCHECK CARD 1."1. "Yes"2. "No"
IF Registration number not given(RegNo <> Response) AND IF vehicledoes not use electric/battery fuel(QVehInt.Fueltyp <> Electric) AND IFRegistration number is notpersonalised or cherished (Personal<> Yes) AND IF Registration numberfollows format 1 above (SimReg =Pat1) THEN:WhatNum"^DMVEH[LVLoop]SHOW CARD T1What is the number in the middle ofyour registration number?RECORD THE RELEVANT NUMBER"
(CHANGED 2003 ONWARDS TO:)"^DMVEH[LVLoop]SHOW CARD T1What is the number in the middle ofthe registration number that denotesthe year?RECORD THE RELEVANT NUMBER"
IF Registration number not given(RegNo <> Response) AND IF vehicledoes not use electric/battery fuel(QVehInt.Fueltyp <> Electric) AND IFRegistration number is notpersonalised or cherished (Personal<> Yes) AND IF (Registration numberfollows format 2 or 3 above ORRespondent showed the registration)(SimReg IN [Pat2..Pat3] OR (LookReg= Yes)) THEN:Letter"^DMVEH[LVLoop]SHOW CARD T1Which letter denotes the year^LetTxtINTERVIEWER: IF PATTERNSELECTED AT QUESTION SimRegPOINT TO THE REGISTRATIONSEQUENCE SELECTED ON SHOWCARD T1, AND ASK WHATREGISTRATION LETTER IS IN THE
SAME POSITION AS THE LETTER@IIN COLOUR@I ON THE CARD.INTERVIEWER: Please refer toCHECK CARD 1.RECORD THE RELEVANT LETTER"
IF Registration number not given(RegNo <> Response) AND IF vehicledoes not use electric/battery fuel(QVehInt.Fueltyp <> Electric) AND IFRegistration number is notpersonalised or cherished (Personal<> Yes) AND IF the Respondent hasgiven the letter which denotes the yearof their vehicle’s registration (Letter =Response) AND Respondent showedthe registration (LookReg = Yes)THEN:Numba"^DMVEH[LVLoop]Does the letter come at the beginningor the end of the registration number?ASK OR RECORD AND CHECK"1. "Letter before number"2. "Letter after number"
IF Registration number not given(RegNo <> Response) AND IF vehicledoes not use electric/battery fuel(QVehInt.Fueltyp <> Electric) THEN:RegYear"^DMVEH[LVLoop]ASK OR RECORD AND CHECK.Could you tell me the exact year andmonth in which the vehicle was firstregistered?^LVMake3ENTER YEAR HERE"
IF Registration number not given(RegNo <> Response) AND IF vehicledoes not use electric/battery fuel(QVehInt.Fueltyp <> Electric) THEN:RegMon"^DMVEH[LVLoop]MONTH OF FIRST REGISTRATION"

National Centre for Social Research
280
IF Registration number not given(RegNo <> Response) AND IF vehicledoes not use electric/battery fuel(QVehInt.Fueltyp <> Electric) THEN:TaxCl"SHOW CARD T2^DMVEH[LVLoop]ASK OR RECORD AND CHECKTo which of these taxation classesdoes the ^DMVEH[LVLoop] belong?"1. "Private and Light Goods(1.5 tonsor less)"2. "Taxi (HACKNEY)"3. "3 wheel car (TRICYCLE)"4. "Disabled (DISABLED)"5. "Motorcycle, scooter, moped(BICYCLE)"6. "Heavy goods (more than 1.5tons)"97. "Other (SPECIFY)"
(PRECODES CHANGED 2003ONWARDS TO:)1. "Private and Light Goods (3.5 tonsgross weight or less)"2. "Motorcycle, scooter, moped, 3-wheeler"3. "Heavy goods (more than 3.5 tonsgross weight)"4. "Disabled - exempt"5. "Historic vehicle - exempt"97. "Other (SPECIFY)"
IF the vehicle belongs in another taxclass (TaxCl = Other) THEN:XTaxCl"Please specify other answer.Text should be no more than 60characters"
IF Registration number not given(RegNo <> Response) AND IF vehicledoes not use electric/battery fuel(QVehInt.Fueltyp <> Electric) AND IFVehicle is a 4-wheeled car or a lightvan ((DMVEHTYPE[LVLoop] ="Wheel4") OR (DMVEHTYPE[LVLoop]= "LightVan")) AND IF Vehicle wasmanufactured since 1983 (LVMake1IN [1983..2012]) THEN:
(IN 2004, asked of all cars,even ifregistration number is given, henceremoval of filter RegNo<>Response)
CarCoding"INTERVIEWER: Please code carmake and modelPRESS <SPACE BAR> TO STARTCODING (HELP <F9>)Car make, model and modspec are:^DMVEH[LVLoop]^QTVehTab.QVehTab[LVLoop].ModspecIf you can't find the right code type<Ctrl+K> for 'don't know'ON EXITING THE CODING FRAMEPRESS ENTER TO MOVE TO THENEXT QUESTION"
BEngFTS / QEngFts.NTS
Questions asked if:QVehNum.Numveh > 0
AND
QTVehTab.QVehTab[LVLoop].WhenAcq <> Aftr
Questions asked of:Respondent who best knows aboutvehicle (normally main driver but notnecessarily) if QVehNum.Numveh >0
IF Registration number not given(RegNo <> Response) AND IF vehicledoes not use electric/battery fuel(QVehInt.Fueltyp <> Electric) AND IFRegistration number is notpersonalised or cherished (Personal<> Yes) AND IF vehicle is notclassified as a heavy goods vehicle orvehicle is not given classification bythe respondent (QVMake.Taxcl IN[Private…Motobike, other} ORQVMake.TaxCl <> RESPONSE)THEN:

National Centre for Social Research
281
(IN 2004, asked of all cars,even ifregistration number is given, henceremoval of filter RegNo<>Response)
EnSize"^DMVEH[LVLoop]ASK OR RECORD AND CHECK What is the size of the^DMVEH[LVLoop]'s engine in cc's?(1 litre = 1000 cc)PROBE IF ANSWER IS GIVEN TONEAREST 100cc........(HELP <F9>):"
IF Registration number not given(RegNo <> Response) AND IF vehicledoes not use electric/battery fuel(QVehInt.Fueltyp <> Electric) AND IFRegistration number is notpersonalised or cherished (Personal<> Yes) AND IF vehicle is notclassified as a heavy goods vehicle orvehicle is not given classification bythe respondent (QVMake.Taxcl IN[Private…Motobike, other} ORQVMake.TaxCl <> RESPONSE) ANDIF engine size is not known (EnSize =Don’t Know) THEN:BenSize"SHOW CARD U^DMVEH[LVLoop]Taking your answer from this card,what is the engine size?"1. "up to 50cc"2. "51 to 125cc"3. "126 to 250cc"4. "251 to 700cc"5. "701 to 1000cc (0.7 to 1 litre)"6. "1001 to 1300cc (1.0 to 1.3 litres)"7. "1301 to 1400cc (1.3 to 1.4 litres)"8. "1401 to 1500cc (1.4 to 1.5 litres)"9. "1501 to 1800cc (1.5 to 1.8 litres)"10. "1801 to 2000cc (1.8 to 2.0 litres)"11. "2001 to 2500cc (2.0 to 2.5 litres)"12. "2501 to 3000cc (2.5 to 3.0 litres)"13. "3001cc and over (3 litres andover)"
IF Registration number not given(RegNo <> Response) AND IF vehicledoes not use electric/battery fuel
(QVehInt.Fueltyp <> Electric) AND IF(year of registration was before 1984((QVMake.RegYear = RESPONSE)AND (QVMake.RegYear < 1984)) ORIF registration letter was refused or notknown ((QVMake.Letter = REFUSAL)OR (QVMake.Letter = DONTKNOW))OR IF number in middle of registrationnumber is refused or not known((QVMake.WhatNum = REFUSAL) OR(QVMake.WhatNum = DONTKNOW))OR IF Fuel tank size is over 99 or notgiven ((QVMake.FuelTank =RESPONSE) AND (QVMake.FuelTank>= 99)) OR (QVMake.FuelTank <>RESPONSE)) THEN:IntQust"^DMVEH[LVLoop]^LEngFTS1"1. "Amount given in litres"2. "Amount given in gallons"
IF Amount is in litres (IntQust = Litres)THEN:TankLtr"^DMVEH[LVLoop]ENTER THE AMOUNT IN LITRES"
IF Amount is in litres (IntQust =Gallons) THEN:TankGal"^DMVEH[LVLoop]ENTER THE AMOUNT IN GALLONS.GIVE ANSWER TO ONE DECIMALPLACE"
BPark / QPark.NTS
Questions asked if:QVehNum.Numveh > 0
AND
QTVehTab.QVehTab[LVLoop].WhenAcq <> Aftr
Questions asked of :Respondent who best knows aboutvehicle (normally main driver but notnecessarily)
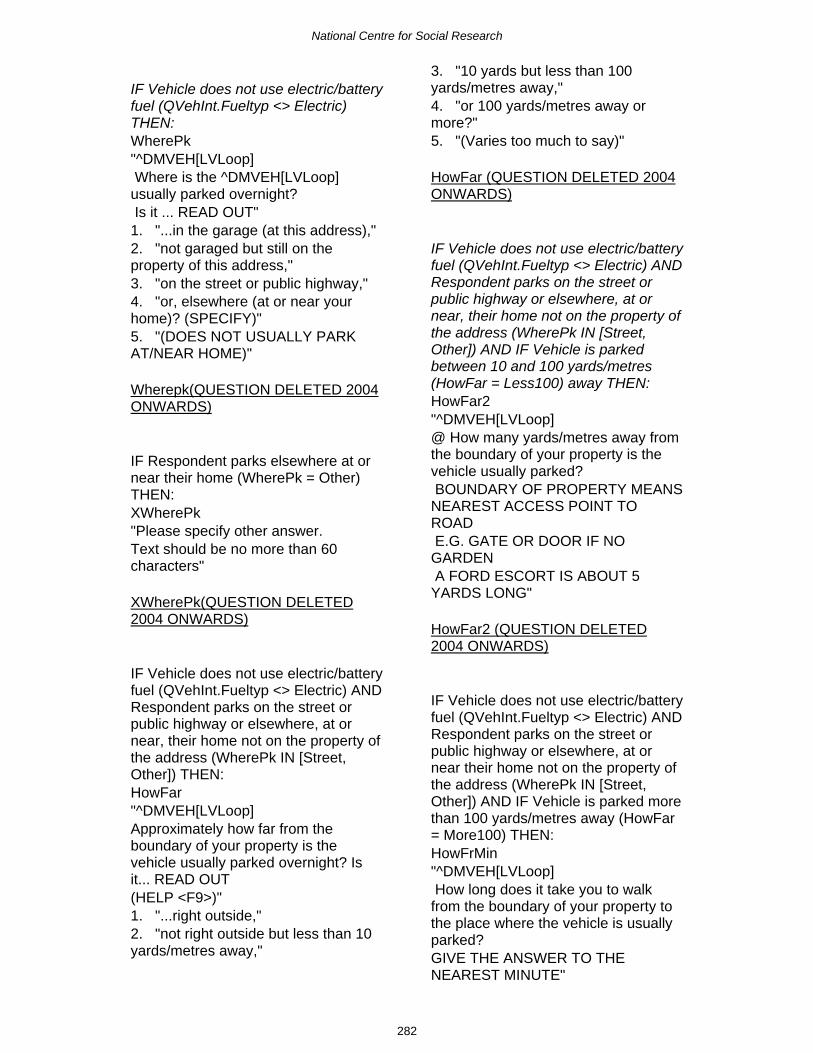
National Centre for Social Research
282
IF Vehicle does not use electric/batteryfuel (QVehInt.Fueltyp <> Electric)THEN:WherePk"^DMVEH[LVLoop] Where is the ^DMVEH[LVLoop]usually parked overnight? Is it ... READ OUT"1. "...in the garage (at this address),"2. "not garaged but still on theproperty of this address,"3. "on the street or public highway,"4. "or, elsewhere (at or near yourhome)? (SPECIFY)"5. "(DOES NOT USUALLY PARKAT/NEAR HOME)"
Wherepk(QUESTION DELETED 2004ONWARDS)
IF Respondent parks elsewhere at ornear their home (WherePk = Other)THEN:XWherePk"Please specify other answer.Text should be no more than 60characters"
XWherePk(QUESTION DELETED2004 ONWARDS)
IF Vehicle does not use electric/batteryfuel (QVehInt.Fueltyp <> Electric) ANDRespondent parks on the street orpublic highway or elsewhere, at ornear, their home not on the property ofthe address (WherePk IN [Street,Other]) THEN:HowFar"^DMVEH[LVLoop]Approximately how far from theboundary of your property is thevehicle usually parked overnight? Isit... READ OUT(HELP <F9>)"1. "...right outside,"2. "not right outside but less than 10yards/metres away,"
3. "10 yards but less than 100yards/metres away,"4. "or 100 yards/metres away ormore?"5. "(Varies too much to say)"
HowFar (QUESTION DELETED 2004ONWARDS)
IF Vehicle does not use electric/batteryfuel (QVehInt.Fueltyp <> Electric) ANDRespondent parks on the street orpublic highway or elsewhere, at ornear, their home not on the property ofthe address (WherePk IN [Street,Other]) AND IF Vehicle is parkedbetween 10 and 100 yards/metres(HowFar = Less100) away THEN:HowFar2"^DMVEH[LVLoop]@ How many yards/metres away fromthe boundary of your property is thevehicle usually parked? BOUNDARY OF PROPERTY MEANSNEAREST ACCESS POINT TOROAD E.G. GATE OR DOOR IF NOGARDEN A FORD ESCORT IS ABOUT 5YARDS LONG"
HowFar2 (QUESTION DELETED2004 ONWARDS)
IF Vehicle does not use electric/batteryfuel (QVehInt.Fueltyp <> Electric) ANDRespondent parks on the street orpublic highway or elsewhere, at ornear their home not on the property ofthe address (WherePk IN [Street,Other]) AND IF Vehicle is parked morethan 100 yards/metres away (HowFar= More100) THEN:HowFrMin"^DMVEH[LVLoop] How long does it take you to walkfrom the boundary of your property tothe place where the vehicle is usuallyparked?GIVE THE ANSWER TO THENEAREST MINUTE"

National Centre for Social Research
283
HowFrMin(QUESTION DELETED2004 ONWARDS)
IF Vehicle does not use electric/batteryfuel (QVehInt.Fueltyp <> Electric) ANDRespondent parks on the street orpublic highway or elsewhere, at ornear, their home not on the property ofthe address (WherePk IN [Street,Other]) THEN:IfPay"^DMVEH[LVLoop] Do you have to make any payment forparking the vehicle in this place?"1. "Yes"2. "No"
IfPay(QUESTION DELETED 2004ONWARDS)
IF Vehicle does not use electric/batteryfuel (QVehInt.Fueltyp <> Electric) ANDRespondent parks on the street orpublic highway or elsewhere, at ornear, their home not on the property ofthe address (WherePk IN [Street,Other]) AND IF Payment for parkingthe vehicle is made (IfPay = Yes)THEN:TypePay"^DMVEH[LVLoop] What is the payment for?"1. "Residents parking permit"2. "Other non-residents parkingpermit"3. "A hired garage"4. "Something else (SPECIFY)"
TypePay (QUESTION DELETED 2004ONWARDS)
IF parking payment is for somethingelse other than residents/other non-residents parking permit or a hiredgarage (TypePay = Other) THEN:XTyppay"^DMVEH[LVLoop]
INTERVIEWER: Describe the type ofpayment made for parking the vehicle"
XTyppay (QUESTION DELETED 2004ONWARDS)
IF Vehicle does not use electric/batteryfuel (QVehInt.Fueltyp <> Electric) ANDRespondent parks on the street orpublic highway or elsewhere, at ornear, their home not on the property ofthe address (WherePk IN [Street,Other]) AND IF Payment for parkingthe vehicle is made (IfPay = Yes)THEN:Annfee"^DMVEH[LVLoop] How much is the @Iannual@I parkingfee that you pay? INTERVIEWER: ENTER THEANNUAL FEE TO THE NEARESTPOUND. IF PAID MONTHLY, WORKOUT WHAT THIS WOULD BEANNUALLY."
Annfee(QUESTION DELETED 2004ONWARDS)
BComCar / QComCar.NTS
Questions asked if:QVehNum.Numveh > 0
AND
QTVehTab.QVehTab[LVLoop].WhenAcq <> Aftr
Questions asked of: Respondent who best knows aboutvehicle (normally main driver but notnecessarily)
IF the vehicle does not useelectric/battery fuel (QVehInt.FuelType<> Electric) THEN:HHReg"^DMVEH[LVLoop]
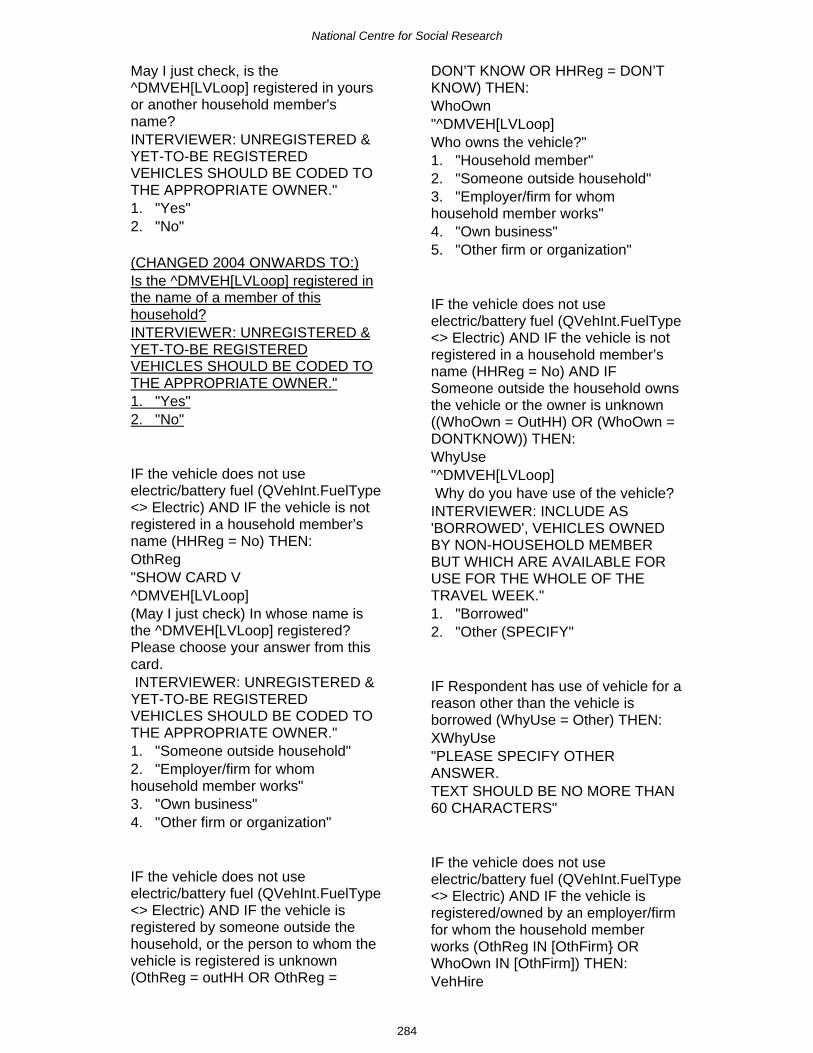
National Centre for Social Research
284
May I just check, is the^DMVEH[LVLoop] registered in yoursor another household member'sname?INTERVIEWER: UNREGISTERED &YET-TO-BE REGISTEREDVEHICLES SHOULD BE CODED TOTHE APPROPRIATE OWNER."1. "Yes"2. "No"
(CHANGED 2004 ONWARDS TO:)Is the ^DMVEH[LVLoop] registered inthe name of a member of thishousehold?INTERVIEWER: UNREGISTERED &YET-TO-BE REGISTEREDVEHICLES SHOULD BE CODED TOTHE APPROPRIATE OWNER."1. "Yes"2. "No"
IF the vehicle does not useelectric/battery fuel (QVehInt.FuelType<> Electric) AND IF the vehicle is notregistered in a household member’sname (HHReg = No) THEN:OthReg"SHOW CARD V^DMVEH[LVLoop](May I just check) In whose name isthe ^DMVEH[LVLoop] registered?Please choose your answer from thiscard. INTERVIEWER: UNREGISTERED &YET-TO-BE REGISTEREDVEHICLES SHOULD BE CODED TOTHE APPROPRIATE OWNER."1. "Someone outside household"2. "Employer/firm for whomhousehold member works"3. "Own business"4. "Other firm or organization"
IF the vehicle does not useelectric/battery fuel (QVehInt.FuelType<> Electric) AND IF the vehicle isregistered by someone outside thehousehold, or the person to whom thevehicle is registered is unknown(OthReg = outHH OR OthReg =
DON’T KNOW OR HHReg = DON’TKNOW) THEN:WhoOwn"^DMVEH[LVLoop]Who owns the vehicle?"1. "Household member"2. "Someone outside household"3. "Employer/firm for whomhousehold member works"4. "Own business"5. "Other firm or organization"
IF the vehicle does not useelectric/battery fuel (QVehInt.FuelType<> Electric) AND IF the vehicle is notregistered in a household member’sname (HHReg = No) AND IFSomeone outside the household ownsthe vehicle or the owner is unknown((WhoOwn = OutHH) OR (WhoOwn =DONTKNOW)) THEN:WhyUse"^DMVEH[LVLoop] Why do you have use of the vehicle?INTERVIEWER: INCLUDE AS'BORROWED', VEHICLES OWNEDBY NON-HOUSEHOLD MEMBERBUT WHICH ARE AVAILABLE FORUSE FOR THE WHOLE OF THETRAVEL WEEK."1. "Borrowed"2. "Other (SPECIFY"
IF Respondent has use of vehicle for areason other than the vehicle isborrowed (WhyUse = Other) THEN:XWhyUse"PLEASE SPECIFY OTHERANSWER.TEXT SHOULD BE NO MORE THAN60 CHARACTERS"
IF the vehicle does not useelectric/battery fuel (QVehInt.FuelType<> Electric) AND IF the vehicle isregistered/owned by an employer/firmfor whom the household memberworks (OthReg IN [OthFirm} ORWhoOwn IN [OthFirm]) THEN:VehHire

National Centre for Social Research
285
"^DMVEH[LVLoop] Is the vehicle on hire or lease? IF 'NO' SPECIFY WHY NOT IN ANOTE"1. "Yes"2. "No"
IF the vehicle does not useelectric/battery fuel (QVehInt.FuelType<> Electric) AND IF the vehicle isregistered/owned by an employer/firmfor whom the household memberworks (OthReg IN [OthFirm} ORWhoOwn IN [OthFirm]) AND IF thevehicle is on hire or lease (VehHire =Yes) THEN:WhoHire"^DMVEH[LVLoop] Who has hired or leased the vehicle?"1. "Household member"2. "Employer/firm for whomhousehold member works"3. "Own business"
IF the vehicle does not useelectric/battery fuel (QVehInt.FuelType<> Electric) AND IF the vehicle isprivate (DMPRIVCO = Private) ANDthe vehicle is hired/leased by ahousehold member or it is unknownwho hired/leased the vehicle (WhoHire= HHMem OR WhoHire = Don’t Know)THEN:CostHir"^DMVEH[LVLoop] Are any of the costs of hiring orleasing paid for by the employer of amember of your household?"1. "Yes"2. "No"
IF the vehicle does not useelectric/battery fuel (QVehInt.FuelType<> Electric) AND IF the vehicle isprivate (DMPRIVCO = Private) AND IFthe vehicle is registered or owned by ahousehold member (HHReg = Yes ORWhoOwn IN [Hhmem]) THEN:VehCost"^DMVEH[LVLoop]
Were any of the purchase costs of thevehicle paid for by a firm ororganization?"1. "Yes"2. "No"3. "(Costs paid for by Disability LivingAllowance)"
IF the vehicle does not useelectric/battery fuel (QVehInt.FuelType<> Electric) AND IF the vehicle isprivate (DMPRIVCO = Private) AND IFthe vehicle is registered or owned by ahousehold member (HHReg = Yes ORIF WhoOwn IN [Hhmem]) AND IF thepurchase costs of the vehicle werepaid for by a firm or organisation(VehCost = Yes) THEN:ComTax95"^DMVEH[LVLoop] For some people, having a vehiclemeans that they have to pay companycar tax. Do you have to pay companycar tax?"1. "Yes"2. "No"
IF the vehicle does not useelectric/battery fuel (QVehInt.FuelType<> Electric) AND ((IF the vehicle isprivate (DMPRIVCO = Private) AND(IF vehicle is registered/owned/leasedor hired by respondent’s own business(WhoOwn = OwnBus OR OthReg =OwnBus OR WhoHire = OwnBus)) OR((IF the purchase costs of the vehicleare not paid for by a firm ororganisation (or costs paid byDisability Living Allownace) (VehCost<> Yes) OR IF the respondent doesnot have to pay company car tax(ComTax95 = No)) AND IF therespondent is self-employed (Stat =SelfEmp)) THEN:
CapAll"^DMVEH[LVLoop](May I check) Can you claim capitalallowances for your vehicle and/or tax

National Centre for Social Research
286
refunds for costs of businessmileage?"1. "Yes"2. "No"
IF the vehicle does not useelectric/battery fuel (QVehInt.FuelType<> Electric) AND (IF the vehicle isprivate (DMPRIVCO = Private) AND IFthe vehicle is 4 wheeled car or a lightvan (DMVehType = 4wheel ORDMVehType = Lightvan) AND IFrespondent is in paid employment(IchEmp = Yes) AND IF a householdmember registered/owns/leases orhires the vehicle (HHReg = Yes ORWhoOwn = HHMem OR WhoHire =HHMem) AND IF Respondent doesnot pay company car tax (ComTax95<> Yes) OR (IF vehicle isregistered/owned/leased or hired byrespondent’s own business (WhoOwn= OwnBus OR IF OthReg = OwnBusOR WhoHire = OwnBus) AND IFRespondent cannot claim capitalallowances and/or tax refunds forcosts of business mileage (CapAll =No))) THEN:CourWk95"^DMVEH[LVLoop](May I check) Do 'you' use the vehiclein the course of your work?"1. "Yes"2. "No"
IF the vehicle does not useelectric/battery fuel (QVehInt.FuelType<> Electric) AND IF (the vehicle isprivate (DMPRIVCO = Private) AND IFVehicle is a 4 wheeled car or a lightvan (DMVehType = 4wheel OR IFDMVehType = Lightvan) AND IFrespondent is in paid employment(IchEmp = Yes) AND IF a householdmember registered/owns/leases orhires the vehicle (HHReg = Yes ORWhoOwn = HHMem OR WhoHire =HHMem) AND IF (the respondentdoes not pay company car tax(ComTax95 <> Yes) OR IF (vehicle isregistered/owned/leased or hired byrespondent’s own business (WhoOwn
= OwnBus OR OthReg = OwnBus ORWhoHire = OwnBus) AND IFRespondent cannot claim capitalallowances and/or tax refunds forcosts of business mileage (CapAll =No))) AND IF Respondent usesvehicle in the course of their work(CourWk95 = Yes)) THEN:Allow95"^DMVEH[LVLoop] For the mileage that 'you' do in thecourse of work do 'you' receive...READ OUT...a mileage allowance only,a mileage allowance and some otherallowance,or do you receive nothing and have topay yourself?"1. "A mileage allowance only"2. "A mileage allowance and someother allowance"3. "Receive nothing and have to payyourself?"4. "Other."
IF Respondent receives another typeof allowance other than a mileageallowance (Allow95 = OthAll ORAllow95 = Other) THEN:XAllow95"^DMVEH[LVLoop]INTERVIEWER: PLEASE DESCRIBEIN DETAIL EXACTLY WHAT KIND OFASSISTANCE THE INFORMANTRECEIVES FOR MILEAGE DONE 'INCOURSE OF WORK'."
IF the vehicle does not useelectric/battery fuel (QVehInt.FuelType<> Electric) AND (IF the vehicle is acompany vehicle (DMPRIVCO =Company) OR IF (the vehicle isowned/registered/hired or leased bythe employer/firm for whom thehousehold member works (WhoOwn =Firm OR OthReg = Firm OR WhoHire= Employ) OR IF the respondent payscompany car tax (ComTax95 = Yes)OR IF (the vehicle is registered bysomeone outside the household, orthe person to whom the vehicle is
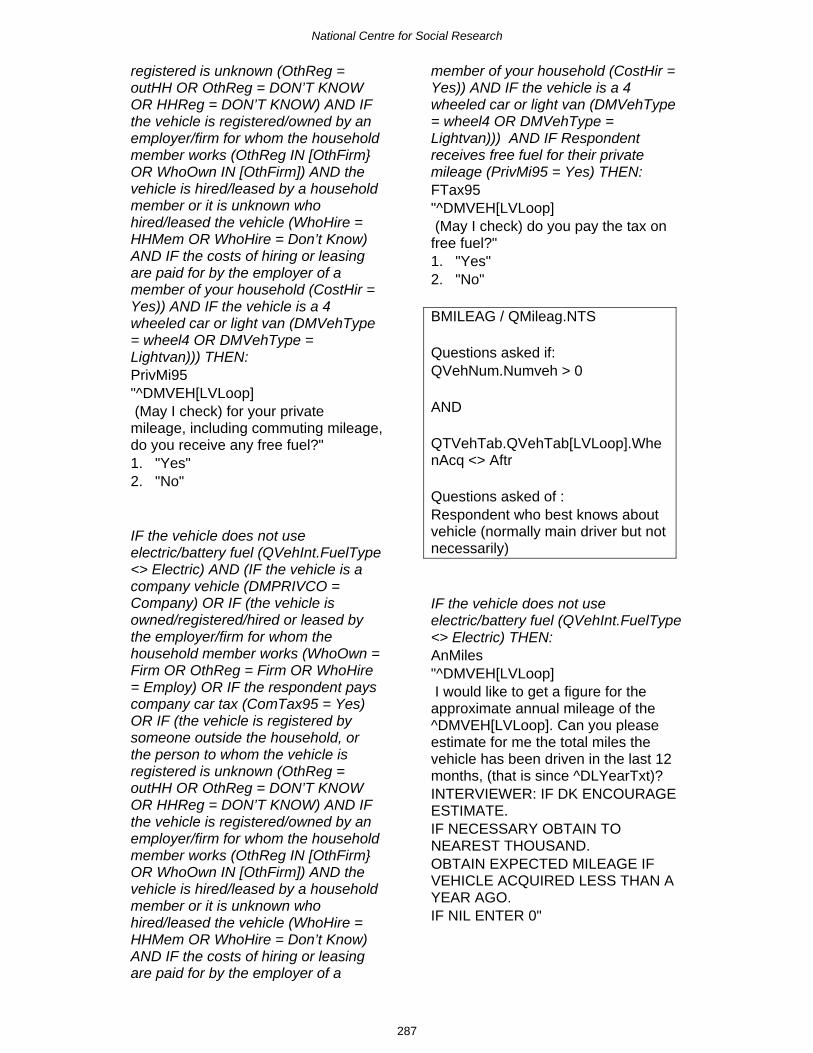
National Centre for Social Research
287
registered is unknown (OthReg =outHH OR OthReg = DON’T KNOWOR HHReg = DON’T KNOW) AND IFthe vehicle is registered/owned by anemployer/firm for whom the householdmember works (OthReg IN [OthFirm}OR WhoOwn IN [OthFirm]) AND thevehicle is hired/leased by a householdmember or it is unknown whohired/leased the vehicle (WhoHire =HHMem OR WhoHire = Don’t Know)AND IF the costs of hiring or leasingare paid for by the employer of amember of your household (CostHir =Yes)) AND IF the vehicle is a 4wheeled car or light van (DMVehType= wheel4 OR DMVehType =Lightvan))) THEN:PrivMi95"^DMVEH[LVLoop] (May I check) for your privatemileage, including commuting mileage,do you receive any free fuel?"1. "Yes"2. "No"
IF the vehicle does not useelectric/battery fuel (QVehInt.FuelType<> Electric) AND (IF the vehicle is acompany vehicle (DMPRIVCO =Company) OR IF (the vehicle isowned/registered/hired or leased bythe employer/firm for whom thehousehold member works (WhoOwn =Firm OR OthReg = Firm OR WhoHire= Employ) OR IF the respondent payscompany car tax (ComTax95 = Yes)OR IF (the vehicle is registered bysomeone outside the household, orthe person to whom the vehicle isregistered is unknown (OthReg =outHH OR OthReg = DON’T KNOWOR HHReg = DON’T KNOW) AND IFthe vehicle is registered/owned by anemployer/firm for whom the householdmember works (OthReg IN [OthFirm}OR WhoOwn IN [OthFirm]) AND thevehicle is hired/leased by a householdmember or it is unknown whohired/leased the vehicle (WhoHire =HHMem OR WhoHire = Don’t Know)AND IF the costs of hiring or leasingare paid for by the employer of a
member of your household (CostHir =Yes)) AND IF the vehicle is a 4wheeled car or light van (DMVehType= wheel4 OR DMVehType =Lightvan))) AND IF Respondentreceives free fuel for their privatemileage (PrivMi95 = Yes) THEN:FTax95"^DMVEH[LVLoop] (May I check) do you pay the tax onfree fuel?"1. "Yes"2. "No"
BMILEAG / QMileag.NTS
Questions asked if:QVehNum.Numveh > 0
AND
QTVehTab.QVehTab[LVLoop].WhenAcq <> Aftr
Questions asked of :Respondent who best knows aboutvehicle (normally main driver but notnecessarily)
IF the vehicle does not useelectric/battery fuel (QVehInt.FuelType<> Electric) THEN:AnMiles"^DMVEH[LVLoop] I would like to get a figure for theapproximate annual mileage of the^DMVEH[LVLoop]. Can you pleaseestimate for me the total miles thevehicle has been driven in the last 12months, (that is since ^DLYearTxt)?INTERVIEWER: IF DK ENCOURAGEESTIMATE.IF NECESSARY OBTAIN TONEAREST THOUSAND.OBTAIN EXPECTED MILEAGE IFVEHICLE ACQUIRED LESS THAN AYEAR AGO.IF NIL ENTER 0"

National Centre for Social Research
288
IF the vehicle does not useelectric/battery fuel (QVehInt.FuelType<> Electric) AND IF Respondent doesnot know the total number of milestheir vehicle has been driven in thelast 12 months (AnMiles = Don’tKnow) THEN:BAnMiles"SHOW CARD W ^DMVEH[LVLoop]Taking your answer from this card,approximately how manyMILES has this vehicle been driven inthe last 12 months, (that is since^DLYearTxt)?INTERVIEWER: IF DK ENCOURAGEESTIMATE. OBTAIN EXPECTEDMILEAGE IF VEHICLE ACQUIREDLESS THAN A YEAR AGO."1. "0 - 499 miles"2. "500 - 999 miles"3. "1,000 - 1,999 miles"4. "2,000 - 2,999 miles"5. "3,000 - 3,999 miles"6. "4,000 - 4,999 miles"7. "5,000 - 6,999 miles"8. "7,000 - 8,999 miles"9. "9,000 - 11,999 miles"10. "12,000 - 14,999 miles"11. "15,000 - 17,999 miles"12. "18,000 - 20,999 miles"13. "21,000 - 29,999 miles"14. "30,000 miles and over"
IF the vehicle does not useelectric/battery fuel (QVehInt.FuelType<> Electric) AND IF Respondent hasgiven the annual mileage of theirvehicle (AnMiles = RESPONSE ANDAnMiles > 0) THEN:KmOrMile"^DMVEH[LVLoop] INTERVIEWER ASK OR CODE: WAS THE ANSWER TO 'AnMiles' INMILES OR KILOMETRES?"1. "Miles"2. "Kilometres"
IF the vehicle does not useelectric/battery fuel (QVehInt.FuelType<> Electric) AND IF Respondent isemployed (QVehNum.IchEmp = Yes)and the Respondent has given theannual mileage of their vehicle(AnMiles = RESPONSE AND AnMiles> 0) and the respondent has giventheir annual mileage in miles OR IF(the Respondent has a 4 wheeled caror a light van and they have not giventheir annual mileage) (DMVEHTYPE =Wheel4 OR DMVEHTYPE = LightVanAND (AnMiles <> RESPONSE ORKMORMILE <> RESPONSE)) THEN:UsualWk"^DMVEH[LVLoop]Can you please estimate how many ofthe total annual miles, if any, aredriven by anyone in the household ingetting to or from a usual place ofwork, either all of the way or part of theway? IF NIL ENTER 0"
IF the vehicle does not useelectric/battery fuel (QVehInt.FuelType<> Electric) AND IF Respondent isemployed (QVehNum.IchEmp = Yes)AND IF the respondent has given theirannual mileage in kilometers(KmOrMile = Km) THEN:UsualKm"^DMVEH[LVLoop]Can you please estimate how many ofthe total annual kilometres, if any, aredriven by anyone in the household ingetting to or from a usual place ofwork, either all of the way or part of theway? IF NIL ENTER 0"

National Centre for Social Research
289
IF the vehicle does not useelectric/battery fuel (QVehInt.FuelType<> Electric) AND IF Respondent isemployed (QVehNum.IchEmp = Yes)and the Respondent has given theannual mileage of their vehicle(AnMiles = RESPONSE AND AnMiles> 0) and the respondent has giventheir annual mileage in miles OR IF(the Respondent has a 4 wheeled caror a light van and they have not giventheir annual mileage) (DMVEHTYPE =Wheel4 OR DMVEHTYPE = LightVanAND (AnMiles <> RESPONSE ORKMORMILE <> RESPONSE)) THEN:CoursWk"^DMVEH[LVLoop] Leaving aside these journeys, canyou estimate how many of the totalannual miles, if any, are driven byanyone in the household in the courseof work? IF NIL ENTER 0"
IF the vehicle does not useelectric/battery fuel (QVehInt.FuelType<> Electric) AND IF Respondent isemployed (QVehNum.IchEmp = Yes)AND IF the respondent has given theirannual mileage in kilometers(KmOrMile = Km) THEN:CoursKm"^DMVEH[LVLoop] Leaving aside these journeys, canyou estimate how many of the totalannual kilometres, if any, are driven byanyone in the household in the courseof work? IF NIL ENTER 0"
IF the vehicle does not useelectric/battery fuel (QVehInt.FuelType<> Electric) AND IF (Respondent isemployed (QVehNum.IchEmp = Yes)and the Respondent has given theannual mileage of their vehicle(AnMiles = RESPONSE AND AnMiles> 0) and the respondent has giventheir annual mileage in miles OR IF(the Respondent has a 4 wheeled car
or a light van and they have not giventheir annual mileage) (DMVEHTYPE =Wheel4 OR DMVEHTYPE = LightVanAND (AnMiles <> RESPONSE ORKMORMILE <> RESPONSE))) AND IFRespondent indicates that some of theannual mileage is driven in the courseof work (CoursWk = RESPONSE AND(CoursWk > 0) THEN:GoodsWk"^DMVEH[LVLoop] And can you estimate how many ofthese ^CoursWk miles are driven byanyone in the household whilstcarrying goods in the course of work? IF NIL ENTER 0"
IF the vehicle does not useelectric/battery fuel (QVehInt.FuelType<> Electric) AND IF Respondent isemployed (QVehNum.IchEmp = Yes)AND IF the respondent has given theirannual mileage in kilometers(KmOrMile = Km) AND Respondentindicates that some of the annualmileage is driven in the course of work(CoursKm = RESPONSE ANDCoursKm > 0) THEN::GoodsKM"^DMVEH[LVLoop] And can you estimate how many ofthese ^Courskm kilometres are drivenby anyone in the household whilstcarrying goods in the course of work? IF NIL ENTER 0"
IF the vehicle does not useelectric/battery fuel (QVehInt.FuelType<> Electric) AND IF Respondent isemployed (QVehNum.IchEmp = Yes)and the Respondent has given theannual mileage of their vehicle(AnMiles = RESPONSE AND AnMiles> 0) and the respondent has giventheir annual mileage in miles OR IF(the Respondent has a 4 wheeled caror a light van and they have not giventheir annual mileage) (DMVEHTYPE =Wheel4 OR DMVEHTYPE = LightVanAND (AnMiles <> RESPONSE ORKMORMILE <> RESPONSE)) AND (IFthe respondent has given the annual

National Centre for Social Research
290
mileage of their vehicle (AnMile =RESPONSE) AND IF the respondenthas given their vehicle’s annualmileage to and from work (UsualWk =RESPONSE) AND IF the respondenthas given their annual mileage in thecourse of work (CoursWk =RESPONSE) AND IF their annualmileage is more than or equal to theirannual mileage to and from work andin the course of work (AnMiles >=UsualWk + CoursWk)) THEN:OthMile"^DMVEH[LVLoop] So that means that the vehicle isdriven about ^OtherM miles a year forall other journeys? PRESS <ENTER> IF THE NUMBERSHOWN IS CORRECT, OR CHANGETO THE CORRECT NUMBER.INTERVIEWER: IF THE NUMBER ISCHANGED IT WILL BRING UP ANERROR MESSAGE - YOU WILLNEED TO MODIFY PREVIOUSANSWERS"
IF the vehicle does not useelectric/battery fuel (QVehInt.FuelType<> Electric) AND IF Respondent isemployed (QVehNum.IchEmp = Yes)AND IF the respondent has given theirannual mileage in kilometers(KmOrMile = Km) AND IF therespondent has given the annualmileage of their vehicle (AnMile =RESPONSE) AND IF the respondenthas given their vehicle’s annualkilometres to and from work (UsualKm= RESPONSE) AND IF therespondent has given their annualkilometres in the course of work(CoursKm = RESPONSE) AND IFtheir annual mileage (in kilometres) ismore than or equal to their annualkilometres to and from work and in thecourse of work (AnMiles >= UsualKm+ CoursKm) THEN:Othkm"^DMVEH[LVLoop] So that means that the vehicle isdriven about ^otherkm kilometres ayear for all other journeys.
PRESS ENTER IF THE NUMBERSHOWN IS CORRECT OR CHANGETO THE CORRECT NUMBERINTERVIEWER: IF THE ANSWER ISCHANGED IT WILL BRING UP ANERROR MESSAGE - YOU WILLNEED TO MODIFY PREVIOUSANSWERS."
IF the vehicle does not useelectric/battery fuel (QVehInt.FuelType<> Electric) THEN:Deliver"^DMVEH[LVLoop] May I check, is this vehicle ever usedby anyone in the household to delivergoods in the course of work?INCLUDE VEHICLES WHOSEPRIMARY PURPOSE IS THEDELIVERY OF GOODS EG PARCEL,NEWSPAPER OR OTHER ROUNDS.INCLUDE VEHICLES USEDOCCASIONALLY TO DELIVERGOODS TO CUSTOMERS AND/ORWORK COLLEAGUES EGDELIVERIES TO CUSTOMERSFROM SMALL BUSINESS,CARRYINGEQUIPMENT TO A WORKSITE FOROTHERSEXCLUDE TOOLS OR EQUIPMENTCARRIED BY THE DRIVER FORTHEIR OWN JOB EG PLUMBER ORGARDENER CARRYING TOOLS TOUNDERTAKE WORK ATCUSTOMER'S PREMISES"1. "Yes"2. "No"
IF the vehicle does not useelectric/battery fuel (QVehInt.FuelType<> Electric) AND IF Vehicle is used todeliver goods in the course of work(Deliver = Yes) THEN:HowOft"^DMVEH[LVLoop]How often is this vehicle used todeliver goods?"1. "3 or more times a week"2. "Once or twice a week"

National Centre for Social Research
291
3. "Less than that but more thantwice a month"4. "Once or twice a month"5. "Less than that but more thantwice a year"6. "Once or twice a year"7. "Less than that"
IF the vehicle does not useelectric/battery fuel (QVehInt.FuelType<> Electric) AND IF Vehicle is used todeliver goods in the course of work(Deliver = Yes) THEN:NumTrips"^DMVEH[LVLoop] How many times did the vehicle stopto deliver goods on the most recentday the vehicle was used fordeliveries?WE ARE INTERESTED IN THENUMBER OF DROP OFF POINTSNOT THE NUMBER OF TIMES THEVEHICLE WENT OUTINTERVIEWER: IF DK ENCOURAGEESTIMATE."1. "1"2. "2 to 4 times"3. "5 to 9 times"4. "10 to 19 times"5. "20 or more times"
Module A IF the vehicle does not useelectric/battery fuel (QVehInt.FuelType<> Electric) THEN:OutGB"^DMVEH[LVLoop] Has the vehicle been drivenOUTSIDE of Great Britain in the lastyear, (that is since ^DLYearTxt), byanyone in the household? (HELP<F9>)INCLUDE TRAVEL IN NORTHERNIRELAND, THE ISLE OF MAN &CHANNEL ISLANDS"1. "Yes"2. "No"
Module A IF the vehicle does not useelectric/battery fuel (QVehInt.FuelType
<> Electric) AND IF respondent’svehicle has been driven outside GreatBritain in the last year (OutGB = Yes)THEN:MileGB"^DMVEH[LVLoop] What was the vehicle's total mileageOUTSIDE GB on the last trip that wasmade?INCLUDE MILEAGE REGARDLESSOF WHO WAS DRIVING, INCLUDEMILEAGE IN NORTHERN IRELAND,THE ISLE OF MAN & CHANNELISLANDS"
Module A IF the vehicle does not useelectric/battery fuel (QVehInt.FuelType<> Electric) AND IF respondent’svehicle has been driven outside GreatBritain in the last year (OutGB = Yes)THEN:PurpGB"^DMVEH[LVLoop] What was the main purpose of thetrip?"1. "A holiday"2. "A business trip"3. "A shopping trip"4. "Visiting friends or relations"5. "Another reason"
Module A IF there is another reason,other than holiday, business, shoppingor visiting friends or relations, for thevehicle being driven outside GreatBritain (PurpGB = Other) THEN:OthPurp"^DMVEH[LVLoop] What was the reason for the trip?"
Module A IF the vehicle does not useelectric/battery fuel (QVehInt.FuelType<> Electric) THEN:OutNI"^DMVEH[LVLoop] Has the vehicle been driven inNorthern Ireland in the last year, (thatis since ^DLYearTxt), by anyone in thehousehold?"

National Centre for Social Research
292
1. "Yes"2. "No"
Module A IF the vehicle does not useelectric/battery fuel (QVehInt.FuelType<> Electric) AND the vehicle has beendriven in Northern Ireland in the lastyear (OutNI = Yes) THEN:MileNI"^DMVEH[LVLoop] What was the vehicle's total mileagein Northern Ireland on the last trip thatwas made.INCLUDE MILEAGE REGARDLESSOF WHO WAS DRIVING"
Moduel A IF the vehicle does not useelectric/battery fuel (QVehInt.FuelType<> Electric) AND the vehicle has beendriven in Northern Ireland in the lastyear (OutNI = Yes) THENPurpNI"^DMVEH[LVLoop]What was the main purpose of thetrip?"1. "A holiday"2. "A business trip"3. "A shopping trip"4. "Visiting friends or relations"5. "Another reason"
Module A IF the vehicle does not useelectric/battery fuel (QVehInt.FuelType<> Electric) AND IF respondent’svehicle has been driven in NorthernIreland in the last year (OutNI = Yes)AND IF there is another reason, otherthan holiday, business, shopping orvisiting friends or relations, for thevehicle being driven in NorthernIreland (PurpNI = Other) THEN:NIOther"^DMVEH[LVLoop] What was the reason for the trip?"
IF the vehicle does not useelectric/battery fuel (QVehInt.FuelType
<> Electric) THENSecCyc"^DMVEH[LVLoop] (May I just check) Is the milometer onits second cycle, in other words has itreached its maximum figure and beenthrough zero again?"1. "Yes"2. "No"
IF the vehicle does not useelectric/battery fuel (QVehInt.FuelType<> Electric) THENMiloRep"^DMVEH[LVLoop] Has the milometer been replacedsince the vehicle was new?^LPUTxt"1. "Yes"2. "No"
Vehicle Pick Up Interviw
TVPickU / QTVPickU.NTSBVPickU
Questions asked if:QSignIn.StatusQ = PickUp
AND
QTVehTab.QVehTab[LVLoop].WhenAcq <> Aftr
AND
[QTVehtab.QVehTab[LTLooper].WhenDIS <> Bfore
OR
QTVehtab.QVehTab[LTLooper].StillGot = Yes

National Centre for Social Research
293
ASK ALWAYSFuelNow"^DMVEH[LTLooper] INTERVIEWER: DO YOU WANT TOCOMPLETE THE FUEL GAUGEDETAILS NOW OR LATER? IF THE FIRST OR LAST GAUGEREADING WAS 'FULL' OR 'EMPTY',YOU MUST CODE 'NOW' AS YOUWILL NEED TO ASK SOME EXTRAQUESTIONS.^LFuelTxt"1. "Now"2. "Later"
ASK ALWAYSVFuelNow"SECURITY COPY"1. "Now"2. "Later"
IF Respondent would like to completethe fuel gauge details now (FuelNow =Now) THEN:AnyFuel"^DMVEH[LTLooper] INTERVIEWER: CHECK FUEL GRIDIN FUEL AND MILEAGE CHART,AND CODE WHETHER ANY FUELWAS PUT IN TANK IN TRAVELWEEK"1. "Fuel put in"2. "No fuel put in"
IF Respondent would like to completethe fuel gauge details now (FuelNow =Now) AND IF any fuel was put in thetank during the Travel Week (AnyFuel= FuelIn) THEN:IntQust1"^DMVEH[LTLooper] INTERVIEWER: IN THE NEXTQUESTIONS CODE THE TOTALQUANTITY PUT IN AND CHECKTOTAL WITH RESPONDENT. FIRST CODE IF AMOUNT IN LITRESOR GALLONS"
1. "Litres"2. "Gallons"
IF Respondent would like to completethe fuel gauge details now (FuelNow =Now) AND IF any fuel was put in thetank during the Travel Week (AnyFuel= FuelIn) AND IF Fuel quantity isentered in litres (IntQust1 = Litres)THEN:FuelLtr"^DMVEH[LTLooper] QUANTITY OF FUEL PUT IN, INLITRES (TO NEAREST WHOLELITRE)"
IF Respondent would like to completethe fuel gauge details now (FuelNow =Now) AND IF any fuel was put in thetank during the Travel Week (AnyFuel= FuelIn) AND IF Fuel quantity isentered in gallons (InQust1 = gallons)THEN:FuelGal"^DMVEH[LTLooper]QUANTITY OF FUEL PUT IN, INGALLONS (TO ONE DECIMALPOINT)"
IF Respondent would like to completethe fuel gauge details now (FuelNow =Now) AND IF any fuel was put in thetank during the Travel Week (AnyFuel= FuelIn) THEN:FuelPds"^DMVEH[LTLooper] ENTER AMOUNT HOUSEHOLDPAID IN POUNDS AND PENCE FORTHIS FUEL AND CHECK SUM WITHRESPONDENT"
IF Respondent would like to completethe fuel gauge details now (FuelNow =Now) THEN:FGauge"^DMVEH[LTLooper] CHECK FIRST FUEL GAUGEREADING ON FUEL AND MILEAGECHART.

National Centre for Social Research
294
'FIRST' FUEL READING WAS:"1. "Recorded from fuel gauge"2. "Estimated (including when fuelgauge faulty or absent)"3. "Not Available"
IF Respondent would like to completethe fuel gauge details now (FuelNow =Now) AND IF First fuel reading wasrecorded from fuel gauge or estimated(FGauge IN [Gauge..Estim]) THEN:FFGRead"^DMVEH[LTLooper]ENTER 'FIRST' FUEL GAUGEREADING (enter box no.)"
IF Respondent would like to completethe fuel gauge details now (FuelNow =Now) THEN:LGauge"^DMVEH[LTLooper] CHECK LAST FUEL GAUGEREADING ON FUEL AND MILEAGECHART. 'LAST' FUEL READINGWAS:"1. "Recorded from fuel gauge"2. "Estimated (including when fuelgauge faulty or absent)"3. "Not Available"
IF Respondent would like to completethe fuel gauge details now (FuelNow =Now) AND IF Last fuel reading wasrecorded from fuel gauge or estimated(LGauge IN [Gauge..Estim]) THEN:LFGRead"^DMVEH[LTLooper] ENTER LAST FUEL GAUGEREADING (enter box no.)"
IF Respondent would like to completethe fuel gauge details now (FuelNow =Now) AND IF First fuel reading wasrecorded from fuel gauge or estimated(LGauge IN [Gauge..Estim]) AND IFFuel gauge reads ‘9’ (Full) (FFGRead= 9) THEN:StikFul
"^DMVEH[LTLooper] (This may not apply to your vehiclebut in some vehicles the fuel gaugeindicator tends to stick for a while at'full'). I notice that your fuel gauge readingshows that your fuel tank was 'full' or'nearly full' at the start of your TravelWeek. Do you remember - had you driven for20 miles or more without the needlechanging position?"1. "Yes"2. "No"3. "DK/Can't remember"
IF Respondent would like to completethe fuel gauge details now (FuelNow =Now) AND IF Fuel gauge reads ‘1’(Empty) (FFGRead = 1) THEN:Stikem1"^DMVEH[LTLooper] (In some vehicles the fuel gaugeindicator shows 'empty' when there isstill quite a lot of fuel in the tank.) I notice that your tank was 'empty' or'nearly empty' at the start of yourTravel Week. So far as you canremember, was there enough fuel leftto do at least another 20 miles?"1. "Yes"2. "No"3. "DK/Can't remember"
IF Respondent would like to completethe fuel gauge details now (FuelNow =Now) AND IF Fuel gauge reads ‘9’(Full) (LFGRead = 9) THEN:StikFu2"^DMVEH[LTLooper] (This may not apply to your vehiclebut in some vehicles the fuel gaugeindicator tends to stick for a while at'full'). I notice that your fuel gauge readingshows that your fuel tank was 'full' or'nearly full' at the end of your TravelWeek. Do you remember - had youdriven for 20 miles or more without theneedle changing position?"1. "Yes"

National Centre for Social Research
295
2. "No"3. "DK/Can't remember"
IF Respondent would like to completethe fuel gauge details now (FuelNow =Now) AND IF Fuel gauge reads ‘1’(Empty) (LFGRead = 1) THEN:StikEm2"^DMVEH[LTLooper] (In some vehicles the fuel gaugeindicator shows 'empty' when there isstill quite a lot of fuel in the tank.) I notice that your tank was 'empty' or'nearly empty' at the end of your TravelWeek. So far as you can remember,was there enough fuel left to do atleast another 20 miles?"1. "Yes"2. "No"3. "DK/Can't remember"
ASK ALWAYSFMilo"^DMVEH[LTLooper] CHECK MILOMETER READING INFUEL AND MILEAGE CHART. 'FIRST'MILOMETER READING WAS:"1. "Recorded from milometer"2. "Estimated"3. "Not available"
ASK ALWAYSIntQust2"^DMVEH[LTLooper]INTERVIEWER: FOR THE NEXTQUESTIONS YOU NEED TO CODETHE MILOMETER READING FROMTHE FUEL AND MILEAGE CHART.ENTER WHETHER THE READING ISIN MILES OR KILOMETRES"1. "Miles"2. "kilometres"
IF First milometer reading wasrecorded from milometer or estimated(FMilo IN [Recorded..Estimated]) ANDIF Milometer reading is in miles(IntQust2 = Miles) THEN:
MilesF"^DMVEH[LTLooper] ENTER THE 'FIRST' MILEAGE (TOTHE NEAREST WHOLE MILE)"
IF First milometer reading wasrecorded from milometer or estimated(FMilo IN [Recorded..Estimated]) ANDIF Milometer reading is in kilometers(IntQust2 = Km) THEN:KmF"^DMVEH[LTLooper] ENTER THE 'FIRST' READING INKILOMETRES (TO THE NEARESTWHOLE KILOMETRE)"
ASK ALWAYSLMilo"^DMVEH[LTLooper] LAST MILOMETER READING WAS:"1. "Recorded from milometer"2. "Estimated"3. "Not available"
IF Last milometer reading wasrecorded from milometer or estimated(LMilo IN [Recorded..Estimated]) ANDIF Milometer reading is in miles(IntQust2 = Miles) THEN:MilesL"^DMVEH[LTLooper] ENTER THE 'LAST' MILEAGE (TOTHE NEAREST WHOLE MILE)"
IF Last milometer reading wasrecorded from milometer or estimated(LMilo IN [Recorded..Estimated]) ANDIF Milometer reading is in kilometres(IntQust2 = kilometres) THEN:KmL"^DMVEH[LTLooper] ENTER THE 'LAST' READING INKILOMETRES (TO THE NEARESTWHOLE KILOMETRE)"

National Centre for Social Research
296
IF Respondent gave first mileagereading AND IF the first mileagereading is equal to the last mileagereading (MilesF = RESPONSE ANDMilesF = MilesL) OR IF Respondentgave first kilometre reading AND thefirst kilometer reading is equal to thelast kilometre reading (KmF =RESPONSE AND KmF = KmL) THEN:WhyNUse"^DMVEH[LTLooper] Why was the vehicle not used duringthe Travel Week? CODE FIRST THAT APPLIES. ENTER THE RESPONSE ANDPRESS <END> TO GO TO THENEXT PICK-UP QUESTION (OR THEEND OF THE QUESTIONNIARE IFTHERE ARE NO MORE VEHICLES)"1. "Vehicle not insured/not taxed"2. "Vehicle being repaired/serviced"3. "Driver sick/on holiday"4. "Driver disqualified"5. "Vehicle not in everyday use"97. "Other (SPECIFY)"
IF ‘other’ reason is given for vehiclenot being used during the Travel Week(WhyNUse = Other) THEN:XWhyNUse"^DMVEH[LTLooper]PLEASE SPECIFY OTHER ANSWER.TEXT SHOULD BE NO MORE THAN60 CHARACTERS"
IF the last mileage reading is greaterthan the first mileage reading OR IFthe last kilometre reading is greaterthan the first kilometre reading (MilesL> MilesF OR KmL > KmF) THEN:InElm1"^DMVEH[LTLooper] May I just check: Were any of the ^LVPickU1^LVPickU2 driven by someone outsidethe household?"1. "Yes"2. "No"
IF the last mileage reading is greaterthan the first mileage reading OR IFthe last kilometre reading is greaterthan the first kilometre reading (MilesL> MilesF OR KmL > KmF) AND IF thevehicle was driven by someoneoutside the household (InElm1 = Yes)THEN:InElmA1"^DMVEH[LTLooper] How many ^LVPickU2 were driven bysomeone outside the household?"
IF the last mileage reading is greaterthan the first mileage reading OR IFthe last kilometre reading is greaterthan the first kilometre reading (MilesL> MilesF OR KmL > KmF) THEN:
InElm2"^DMVEH[LTLooper] (Were any of the ^LVPickU1^LVPickU2 driven in order) to carrygoods in the course of work?"1. "Yes"2. "No"
IF the last mileage reading is greaterthan the first mileage reading OR IFthe last kilometre reading is greaterthan the first kilometre reading (MilesL> MilesF OR KmL > KmF) AND IF thevehicle was driven to carry goods inthe course of work (InElm2 = Yes)THEN:InElmA2"^DMVEH[LTLooper] How many ^LVPickU2 were driven inorder to carry goods in the course ofwork?"
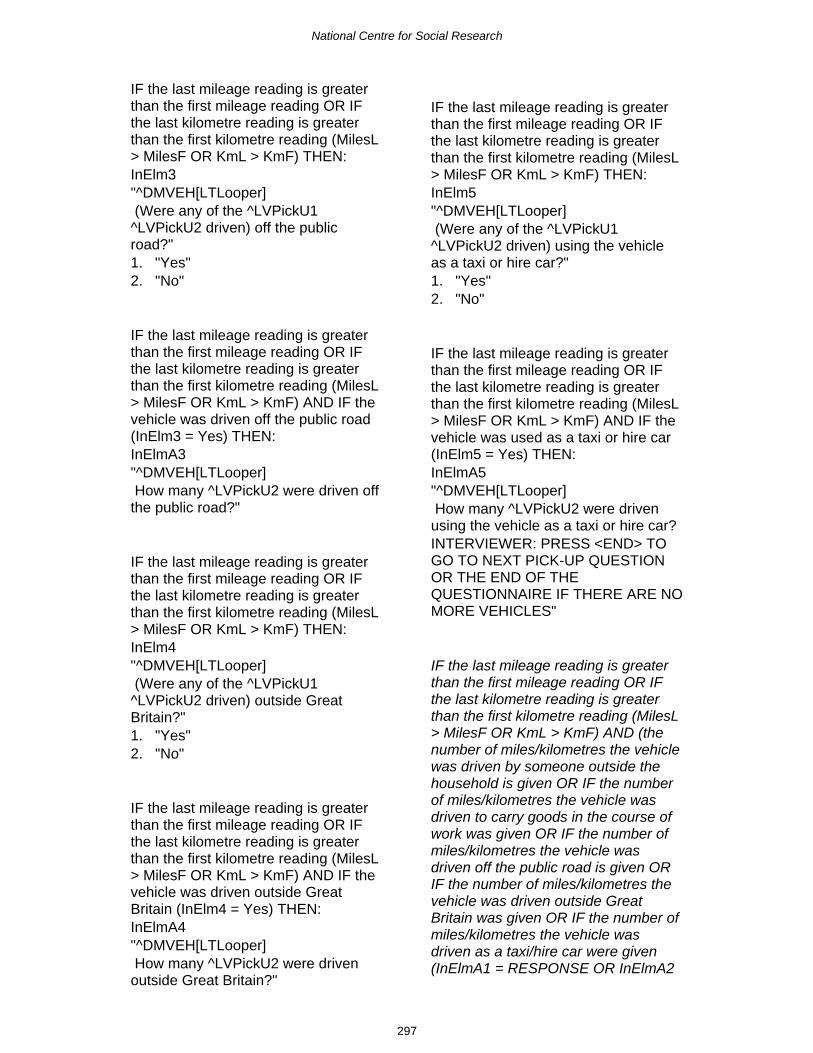
National Centre for Social Research
297
IF the last mileage reading is greaterthan the first mileage reading OR IFthe last kilometre reading is greaterthan the first kilometre reading (MilesL> MilesF OR KmL > KmF) THEN:InElm3"^DMVEH[LTLooper] (Were any of the ^LVPickU1^LVPickU2 driven) off the publicroad?"1. "Yes"2. "No"
IF the last mileage reading is greaterthan the first mileage reading OR IFthe last kilometre reading is greaterthan the first kilometre reading (MilesL> MilesF OR KmL > KmF) AND IF thevehicle was driven off the public road(InElm3 = Yes) THEN:InElmA3"^DMVEH[LTLooper] How many ^LVPickU2 were driven offthe public road?"
IF the last mileage reading is greaterthan the first mileage reading OR IFthe last kilometre reading is greaterthan the first kilometre reading (MilesL> MilesF OR KmL > KmF) THEN:InElm4"^DMVEH[LTLooper] (Were any of the ^LVPickU1^LVPickU2 driven) outside GreatBritain?"1. "Yes"2. "No"
IF the last mileage reading is greaterthan the first mileage reading OR IFthe last kilometre reading is greaterthan the first kilometre reading (MilesL> MilesF OR KmL > KmF) AND IF thevehicle was driven outside GreatBritain (InElm4 = Yes) THEN:InElmA4"^DMVEH[LTLooper] How many ^LVPickU2 were drivenoutside Great Britain?"
IF the last mileage reading is greaterthan the first mileage reading OR IFthe last kilometre reading is greaterthan the first kilometre reading (MilesL> MilesF OR KmL > KmF) THEN:InElm5"^DMVEH[LTLooper] (Were any of the ^LVPickU1^LVPickU2 driven) using the vehicleas a taxi or hire car?"1. "Yes"2. "No"
IF the last mileage reading is greaterthan the first mileage reading OR IFthe last kilometre reading is greaterthan the first kilometre reading (MilesL> MilesF OR KmL > KmF) AND IF thevehicle was used as a taxi or hire car(InElm5 = Yes) THEN:InElmA5"^DMVEH[LTLooper] How many ^LVPickU2 were drivenusing the vehicle as a taxi or hire car?INTERVIEWER: PRESS <END> TOGO TO NEXT PICK-UP QUESTIONOR THE END OF THEQUESTIONNAIRE IF THERE ARE NOMORE VEHICLES"
IF the last mileage reading is greaterthan the first mileage reading OR IFthe last kilometre reading is greaterthan the first kilometre reading (MilesL> MilesF OR KmL > KmF) AND (thenumber of miles/kilometres the vehiclewas driven by someone outside thehousehold is given OR IF the numberof miles/kilometres the vehicle wasdriven to carry goods in the course ofwork was given OR IF the number ofmiles/kilometres the vehicle wasdriven off the public road is given ORIF the number of miles/kilometres thevehicle was driven outside GreatBritain was given OR IF the number ofmiles/kilometres the vehicle wasdriven as a taxi/hire car were given(InElmA1 = RESPONSE OR InElmA2

National Centre for Social Research
298
= RESPONSE or InElmA3 =RESPONSE OR InElmA3 =RESPONSE OR InElmA4 =RESPONSE OR InElmA5 =RESPONSE)) OR (IF the vehicle wasnot driven by someone outside thehousehold (InElm1 = No) AND thevehicle was not driven to carry goodsin the course of work (InElm2 = No)AND the vehicle was not driven off thepublic road (InElm3 = No) AND thevehicle was not driven outside GreatBritain (InElm4 = No) AND the vehiclewas not used as a taxi or hire car(InElm5 = No))TotInel"^DMVEH[LTLooper] TOTAL INELIGIBLE MILEAGE:^LVPickU3INTERVIEWER: PRESS ENTER TOCONFIRM OR GO BACK ANDCHECK InElm QUESTIONS"
TotElig"^DMVEH[LTLooper] TOTAL ELIGIBLE MILES"
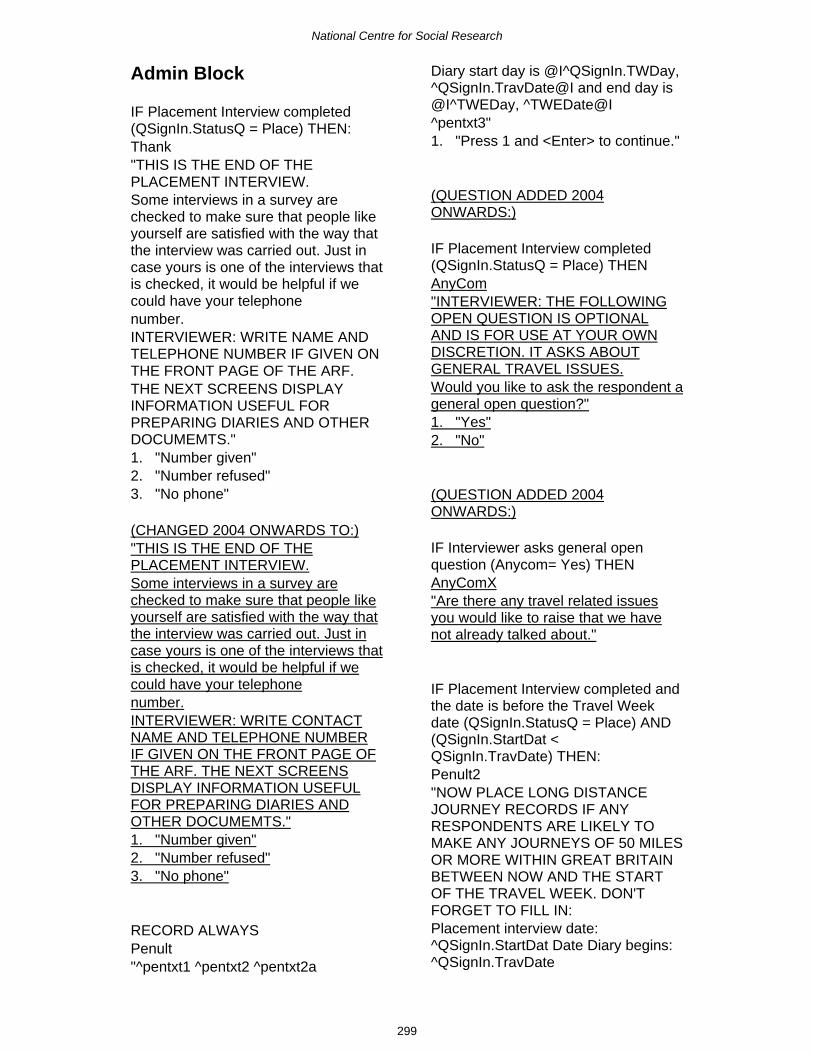
National Centre for Social Research
299
Admin Block
IF Placement Interview completed(QSignIn.StatusQ = Place) THEN:Thank"THIS IS THE END OF THEPLACEMENT INTERVIEW.Some interviews in a survey arechecked to make sure that people likeyourself are satisfied with the way thatthe interview was carried out. Just incase yours is one of the interviews thatis checked, it would be helpful if wecould have your telephonenumber.INTERVIEWER: WRITE NAME ANDTELEPHONE NUMBER IF GIVEN ONTHE FRONT PAGE OF THE ARF.THE NEXT SCREENS DISPLAYINFORMATION USEFUL FORPREPARING DIARIES AND OTHERDOCUMEMTS."1. "Number given"2. "Number refused"3. "No phone"
(CHANGED 2004 ONWARDS TO:)"THIS IS THE END OF THEPLACEMENT INTERVIEW.Some interviews in a survey arechecked to make sure that people likeyourself are satisfied with the way thatthe interview was carried out. Just incase yours is one of the interviews thatis checked, it would be helpful if wecould have your telephonenumber.INTERVIEWER: WRITE CONTACTNAME AND TELEPHONE NUMBERIF GIVEN ON THE FRONT PAGE OFTHE ARF. THE NEXT SCREENSDISPLAY INFORMATION USEFULFOR PREPARING DIARIES ANDOTHER DOCUMEMTS."1. "Number given"2. "Number refused"3. "No phone"
RECORD ALWAYSPenult"^pentxt1 ^pentxt2 ^pentxt2a
Diary start day is @I^QSignIn.TWDay,^QSignIn.TravDate@I and end day is@I^TWEDay, ^TWEDate@I^pentxt3"1. "Press 1 and <Enter> to continue."
(QUESTION ADDED 2004ONWARDS:)
IF Placement Interview completed(QSignIn.StatusQ = Place) THENAnyCom"INTERVIEWER: THE FOLLOWINGOPEN QUESTION IS OPTIONALAND IS FOR USE AT YOUR OWNDISCRETION. IT ASKS ABOUTGENERAL TRAVEL ISSUES.Would you like to ask the respondent ageneral open question?"1. "Yes"2. "No"
(QUESTION ADDED 2004ONWARDS:)
IF Interviewer asks general openquestion (Anycom= Yes) THENAnyComX"Are there any travel related issuesyou would like to raise that we havenot already talked about."
IF Placement Interview completed andthe date is before the Travel Weekdate (QSignIn.StatusQ = Place) AND(QSignIn.StartDat <QSignIn.TravDate) THEN:Penult2"NOW PLACE LONG DISTANCEJOURNEY RECORDS IF ANYRESPONDENTS ARE LIKELY TOMAKE ANY JOURNEYS OF 50 MILESOR MORE WITHIN GREAT BRITAINBETWEEN NOW AND THE STARTOF THE TRAVEL WEEK. DON'TFORGET TO FILL IN:Placement interview date:^QSignIn.StartDat Date Diary begins:^QSignIn.TravDate

National Centre for Social Research
300
Respondent names, serial number andperson numbers.^pentxt2"1. "Press 1 and <Enter> to continue."
(CHANGED 2003 ONWARDS TO:)"NOW PLACE LONG DISTANCEJOURNEY RECORDS IF ANYRESPONDENTS ARE LIKELY TOMAKE ANY JOURNEYS OF 50 MILESOR MORE WITHIN GREAT BRITAINBETWEEN @INOW AND THE DAYBEFORE THE TRAVEL WEEKBEGINS. DON'T FORGET TO FILLIN:Placement interview date:^QSignIn.StartDat Date Diary begins:^QSignIn.TravDateRespondent names, serial number andperson numbers.^pentxt2"1. "Press 1 and <Enter> to continue."
IF Placment Interview completed andrespondent has a vehicle(QSignIn.StatusQ = Place) AND(DMNOVEH > 0) THEN:Penult3"NOW PLACE A FUEL AND MILEAGECHART FOR EACH VEHICLE. DON'TFORGET TO FILL IN READINGDATES AND VEHICLE NUMBERS:Reading dates are before first use on@I^QSignIn.TWDay,^QSignIn.TravDate@I and after lastuse on @I^TWEDay, ^TWEDate@I^pentxt2"1. "Press 1 and <Enter> to continue."
RECORD ALWAYSPenult4"INTERVIEWER: HOW LONG DID ITTAKE TO PLACE AND EXPLAIN THEDIARY AND OTHER DOCUMENTS?RECORD TO NEAREST MINUTE"
(CHANGED 2003 ONWARDS TO:)"INTERVIEWER: HOW LONG DID ITTAKE TO PLACE AND EXPLAIN THEDIARY AND OTHER DOCUMENTS?
INCLUDE ANY TIME SPENTPREPARING THE DIARIESBEFOREHAND (E.G. FILLING IN THEFRONT).RECORD TO NEAREST MINUTE"
Penult5"INTERVIEWER: HOW LONG DID ITTAKE TO PICK UP AND CHECK THEDIARY(IES)?RECORD TO NEAREST MINUTE"
SOC2000"@T@BStandard OccupationalClassification (SOC2000)@BPerson@|@|@|: ^PNameJob Title @|@|: ^PJobTitleJob Description @|: ^PJobDescrResponsibilty @|@|: ^PSvDescIndustry @|@|: ^PIndustrySummary @|@|: ^ESSummary @T
XSOC2000"Standard Occupational Classification- SOC2000 - WITHOUT DOTS."
IndexNo"Index number of SOC2000 entryselected in coding index"
ES2000"Full employment status - derived fromJob block questions and SOC2000"1. "Self-employed : largeestablishment (25+ employees)"2. "Self-employed : smallestablishment (1-24 employees)"3. "Self-employed : no employees"4. "Manager : large establishment(25+ employees)"5. "Manager : small establishment (1-24 employees)"6. "Foreman or supervisor"7. "Employee (not elsewhereclassified)"8. "No employment status info given -for use in this program only"

National Centre for Social Research
301
NSSEC"NS-SEC Socio-economic Class (fullclassification)- derived variable"
SECFlag"Indicator for status of SEC0 - valid combination of SEC andES2000 1 - invalid combination 2 - noemployment status info - simplifiedSEC used"
SEG"Socio-economic Group (old scheme)"
Status"Current Interview StatusUPDATE THIS BEFORE EACHTRANSMISSION TO HEAD OFFICE."0. "No work done yet"1. "Calls made but no contact"2. "Contact made"3. "Interview started/Any interviewingdone."4. "Other - no interviewing required(eg. ineligible, refusal)"
MENUNOTE"REMINDER/NOTE FOR THEOPENING MENU (OPTIONAL)IF NOTHING TO SAY, JUST PRESS<Enter>.ENTER IN HERE ANY USEFULDETAILS YOU WISH TO APPEARON THE ADDRESS MENU>"
Choice"INTERVIEWER: DO YOU NOWWANT TO...INTERVIEWER: DON'T SELECTCODE 5 UNTIL ALL OTHER WORKON THIS HOUSEHOLD ISCOMPLETED."1. "LEAVE THIS QUESTIONNAIRE -without filling in the admin details?"
5. "FILL IN THE ADMIN DETAILS -and prepare this household fortransmission to Head Office?"
(QUESTION ADDED 2003ONWARDS:)
IF (Choice = Admin) AND (Penult =RESPONSE) AND (QSignin.StatusQ =Place) THENNoPU"Please explain why you did notconduct the pick up interview".
CallTot"INTERVIEWER: Enter the @Itotalnumber of calls@I made."
IF Household number equals 1(QID.HHold = 1) THEN:FindHH"How many households did you find atthis address?INTERVIEWER: TAKE THE ANSWERAS RECORDED AT Q6a ON THEA.R.F. FOR THIS ADDRESS.IF ADDRESS IS INELIGIBLE, ORNUMBER OF HOUSEHOLDS NOTESTABLISHED, ENTER '0'"
IF More than one household ataddress (FindHH > 1) THEN:HHSel"And how many households did youSELECT for interview? (May not bethe same as the number actuallyinterviewed)ENTER THE NUMBER@ISELECTED@I FOR INTERVIEW"
RECORD ALWAYSPIOut"Placement interview outcome"1. "Full"2. "Started"3. "NoInt"

National Centre for Social Research
302
Diary"Did you collect a completed diary for^QNames.QBNames[PND].Name?^DiaTxt PLACEMENT INTERVIEWFULLY COMPLETED = FILLED INFOR ALL 7 DAYS (DAYS WHEN NOJOURNEYS MADE COUNT ASFILLED IN).PARTIALLY COMPLETED = ATLEAST ONE JOURNEY RECORDEDBUT ONE OR MORE DAYS NOTFILLED IN.NO DIARY = NO JOURNEYSCOMPLETED AT ALL. (EXTRA INT.INSTRUCTION ADDED 2003ONWARDS)"1. "Yes - fully completed diary"2. "Yes - partially completed diary"3. "No - no diary completed for thisperson"
IF fully/partially completed diary forrespondent aged under 15 (Diary IN[YesFull_YesPart] AND (XAge <= 15)THEN:WhoFill"Who filled in the diary for ^XName?"1. "Child/young person filled it inthemselves"2. "Child/young person filled it in withhelp from an adult"3. "Adult filled it in on child's behalf"
(QUESTION AND ROUTINGCHANGED 2003 ONWARDS TO:)IF fully/partially completed diary forrespondent aged under 15 (Diary IN[YesFull_YesPart] THEN:WhoFill"Who filled in the diary for ^XName?"1. "Respondent filled it inthemselves"2. "Respondent filled it in with helpfrom another household member"3. "Another household member filledit in on respondent's behalf"4. "Respondent filled it in with helpfrom the interviewer",
5. "Interviewer filled it in onrespondent's behalf"
(QUESTION ADDED 2003ONWARDS:)
IF fully/partially completed diary forrespondent aged under 15 (Diary IN[YesFull_YesPart] AND (XAge <= 15)AND Respondent filled it in with helpfrom the interviewer OR Interviewerfilled it in on respondent's behalf(WhoFill= 4 or 5) THEN:DaysInt"Which day(s) did you (ieINTERVIEWER) fill in.CODE ALL THAT APPLY": SET OF1. "Day 1",2. "Day 2",3. "Day 3",4. "Day 4",5. "Day 5",6. "Day 6",7. "Day 7")
RECORD ALWAYSNFDiary"Number of full Diaries collected"
NDiary"Number of full/part Diaries collected"
NFull"Number of full productive interviews"
NProxy"Number of full proxy interviews"
IF Each household member hascompleted a full diary and thehousehold is entitled to the incentivevouchers(Area >= 20701) ANDAddress IN[1,2,3,5,6,8,9,11,12,14,15,17,18,20,21,22]) THEN:Promise

National Centre for Social Research
303
"Did you complete and leave behindthe promissory note for the incentivevouchers?"1. "Yes"2. "No"
IF Each household member hascompleted a full diary and thehousehold is entitled to the incentivevouchers(Area >= 20701) ANDAddress IN[1,2,3,5,6,8,9,11,12,14,15,17,18,20,21,22]) AND IF Promissory note not left(Promise = No) THEN:NoProm"Please explain why you did not leavethe promissory note?"
RECORD ALWAYSOutcome"FINAL OUTCOME FORHOUSEHOLD INTERVIEW, =Computed OR UnOut"
UnOut"ENTER OUTCOME CODE FROMARF."
(IF Unout IN [64, 65])ARFQ3"Was the information refused ?INTERVIEWER - QUESTION 3 INUNKNOWN ELIGIBILITY SECTIONON ARF"1. "REFUSED"2. "DID NOT MAKE CONTACT"
(IF Unout IN [43])ARFQ11"Was the refusal by the desired personor by proxy?INTERVIEWER - QUESTION 11 INUNPRODUCTIVE SECTION ON ARF"1. "REFUSAL BY THE DESIREDPERSON"2. "REFUSAL BY PROXY"
ALWAYS RECORDCallPlac"@ITHE OUTCOME CODE IS^Outcome.@IINTERVIEWER: Enter the totalnumber of calls up to Diaryplacement."
(CHANGED 2003 ONWARDS TO:)"@ITHE OUTCOME CODE IS^Outcome.@IINTERVIEWER: Enter the @Itotalnumber of calls@I up to (but NOTincluding) Diary placement."
(QUESTION ADDED 2004ONWARDS:)
ConName"INTERVIEWER:RECORD CONTACTNAME FROM FRONT OF ARF IFNOT AVAILABLE PRESS THE<ENTER> KEY"
TelNo"INTERVIEWER:RECORD TELEPHONE NUMBERFROM FRONT OF ARF(**** must be STD code and number****) IF NOT AVAILABLE PRESS THE<ENTER> KEY"
IF (Outcome IN[31,33,42,45,51,56,64,65] AND(QID.HHold = 1)ObsDone"Have you filled in the Observationform details on Page 7 of the ARF ?"1. "Yes"2. "No"
IF (Outcome IN [11, 13, 21, 31, 33, 43,45, 51, 54, 56]NRDone"Have you filled in the Non-Responseform details on Page 7 of the ARF ?"1. "Non response form completed"2. "Left postal version"

National Centre for Social Research
304
3. "No"
IF (Outcome IN[31,33,42,45,51,56,64,65] AND(QID.HHold = 1) AND IF Observationdetails have been completed on ARF(ObsDone = Yes) THEN:Obs1"What kind of accommodation is it?"1. "House or bungalow : detached"2. "House or bungalow : semi-detached"3. "House or bungalow : terraced /end of terrace"4. "Flat or maisonette : in a purpose-built block"5. "Flat or maisonette : part of aconverted house/other kind ofbuilding"6. "Room or rooms"7. "A caravan or mobile home"8. "Houseboat"9. "Some other kind ofaccommodation"
(QUESTION AND ROUTINGCHANGED 2004 ONWARDS TO:)IF (Outcome IN[31,33,42,45,51,56,64,65] AND(QID.HHold = 1)THEN:Obs1" Please enter the Observation formdetails from Page 7 of the ARF ?What kind of accommodation is it?"1. "House or bungalow : detached"2. "House or bungalow : semi-detached"3. "House or bungalow : terraced /end of terrace"4. "Flat or maisonette : in a purpose-built block"5. "Flat or maisonette : part of aconverted house/other kind ofbuilding"6. "Room or rooms"7. "A caravan or mobile home"8. "Houseboat"9. "Some other kind ofaccommodation"
IF (Outcome IN[31,33,42,45,51,56,64,65] AND(QID.HHold = 1) AND IF Observationdetails have been completed on ARF(ObsDone = Yes) AND IF Observedaccommodation is a house orbungalow (IF Obs1 IN[housed..houset] THEN:Obs2"Did you - at any visit - observe a carin the drive?"1. "Yes, car in driveway"2. "No car in driveway"3. "No driveway"
(QUESTION AND ROUTINGCHANGED 2004 ONWARDS TO:)IF (Outcome IN[31,33,42,45,51,56,64,65] AND(QID.HHold = 1)AND IF Observedaccommodation is a house orbungalow (IF Obs1 IN[housed..houset] THEN:Obs2"Did you - at any visit - observe a carin the drive?"1. "Yes, car in driveway"2. "No car in driveway"3. "No driveway"
Obs3"Does the house/bungalow have agarage or car port?"1. "Yes"2. "No"3. "Not sure"
(ROUTING CHANGED 2004ONWARDS TO:)IF (Outcome IN[31,33,42,45,51,56,64,65] AND(QID.HHold = 1)AND IF Observedaccommodation is a house orbungalow (IF Obs1 IN[housed..houset] THEN:Obs3"Does the house/bungalow have agarage or car port?"1. "Yes"2. "No"3. "Not sure"
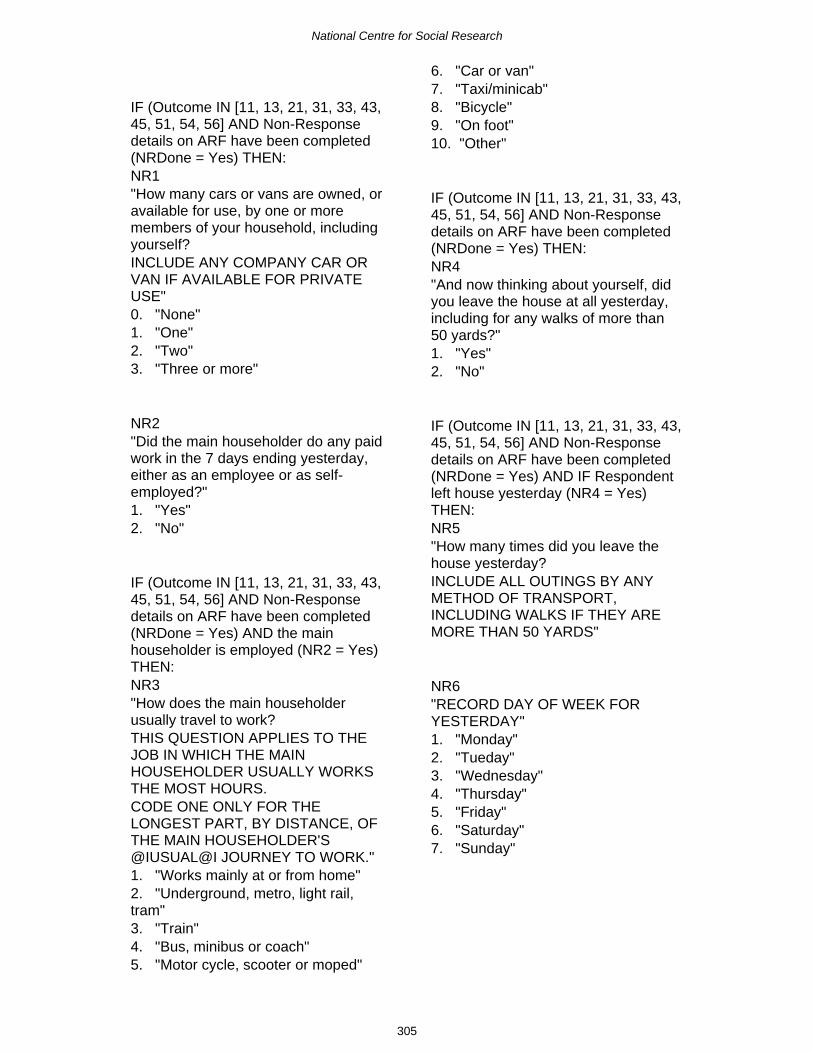
National Centre for Social Research
305
IF (Outcome IN [11, 13, 21, 31, 33, 43,45, 51, 54, 56] AND Non-Responsedetails on ARF have been completed(NRDone = Yes) THEN:NR1"How many cars or vans are owned, oravailable for use, by one or moremembers of your household, includingyourself?INCLUDE ANY COMPANY CAR ORVAN IF AVAILABLE FOR PRIVATEUSE"0. "None"1. "One"2. "Two"3. "Three or more"
NR2"Did the main householder do any paidwork in the 7 days ending yesterday,either as an employee or as self-employed?"1. "Yes"2. "No"
IF (Outcome IN [11, 13, 21, 31, 33, 43,45, 51, 54, 56] AND Non-Responsedetails on ARF have been completed(NRDone = Yes) AND the mainhouseholder is employed (NR2 = Yes)THEN:NR3"How does the main householderusually travel to work?THIS QUESTION APPLIES TO THEJOB IN WHICH THE MAINHOUSEHOLDER USUALLY WORKSTHE MOST HOURS.CODE ONE ONLY FOR THELONGEST PART, BY DISTANCE, OFTHE MAIN HOUSEHOLDER'S@IUSUAL@I JOURNEY TO WORK."1. "Works mainly at or from home"2. "Underground, metro, light rail,tram"3. "Train"4. "Bus, minibus or coach"5. "Motor cycle, scooter or moped"
6. "Car or van"7. "Taxi/minicab"8. "Bicycle"9. "On foot"10. "Other"
IF (Outcome IN [11, 13, 21, 31, 33, 43,45, 51, 54, 56] AND Non-Responsedetails on ARF have been completed(NRDone = Yes) THEN:NR4"And now thinking about yourself, didyou leave the house at all yesterday,including for any walks of more than50 yards?"1. "Yes"2. "No"
IF (Outcome IN [11, 13, 21, 31, 33, 43,45, 51, 54, 56] AND Non-Responsedetails on ARF have been completed(NRDone = Yes) AND IF Respondentleft house yesterday (NR4 = Yes)THEN:NR5"How many times did you leave thehouse yesterday?INCLUDE ALL OUTINGS BY ANYMETHOD OF TRANSPORT,INCLUDING WALKS IF THEY AREMORE THAN 50 YARDS"
NR6"RECORD DAY OF WEEK FORYESTERDAY"1. "Monday"2. "Tueday"3. "Wednesday"4. "Thursday"5. "Friday"6. "Saturday"7. "Sunday"

National Centre for Social Research
306
IF (Outcome IN [11, 13, 21, 31, 33, 43,45, 51, 54, 56] AND Non-Responsedetails on ARF have been completed(NRDone = Yes) THEN:NR7"Could you just tell me how manypeople there are altogether in yourhousehold - including any children orbabies?"
NR8"ASK OR RECORD: And how many ofthese people are aged 17 or over?"
NR9m"ASK OR RECORD: And of thoseaged 17 or over, how many are@Imen@I and how many are@Iwomen@I?ENTER NUMBER OF MEN AGED 17+AT THIS QUESTIONENTER NUMBER OF WOMEN ATTHE NEXT QUESTION"
NR9w"ENTER NUMBER OF WOMENAGED 17+ IN THE HOUSEHOLD"
NR10"RECORD SEX OF RESPONDENT"1. "Male"2. "Female"
NR11"What is your relationship to the mainhouseholder?CODE ONE ONLY"1. "I am main householder"2. "Husband, wife or partner"3. "Son, daughter, step-child, orfoster child"4. "Brother or sister"5. "Mother, father, step-mother orstep-father"6. "Other related"7. "Unrelated"
IF (Outcome IN [11, 13, 21, 31, 33, 43,45, 51, 54, 56] AND Non-Responsedetails on ARF have been completed(NRDone = Yes) AND IF Respondentis not main householder (NR11 IN[hwpart..unrel]) THEN:NR12"ASK OR RECORD: What is the mainhouseholder's sex?"1. "Male"2. "Female"
IF (Outcome IN [11…13, 21…23])THEN:RemCall"Did you make a Reminder Callbetween placing the diaries and thestart of the Travel Week?SEE FRONT PAGE OF ARF -Purpose* COLUMN OF CALLSRECORD"1. "Yes"2. "No"
(CHANGED 2003 ONWARDS TO:)"Did you make a reminder call or senda reminder card between placing thediaries and the start of the TravelWeek?SEE FRONT PAGE OF ARF -Purpose* COLUMN OF CALLSRECORD"1. "Yes, reminder call"2. "Yes, reminder card" "No reminder call or card"
IF (Outcome IN [11…13, 21…23])AND IF A reminder call was madebetween placing the diaries and thestart of the Travel Week (RemCall =YesCall) THEN:RemTime"How long did this reminder call take?RECORD TO NEAREST MINUTE"
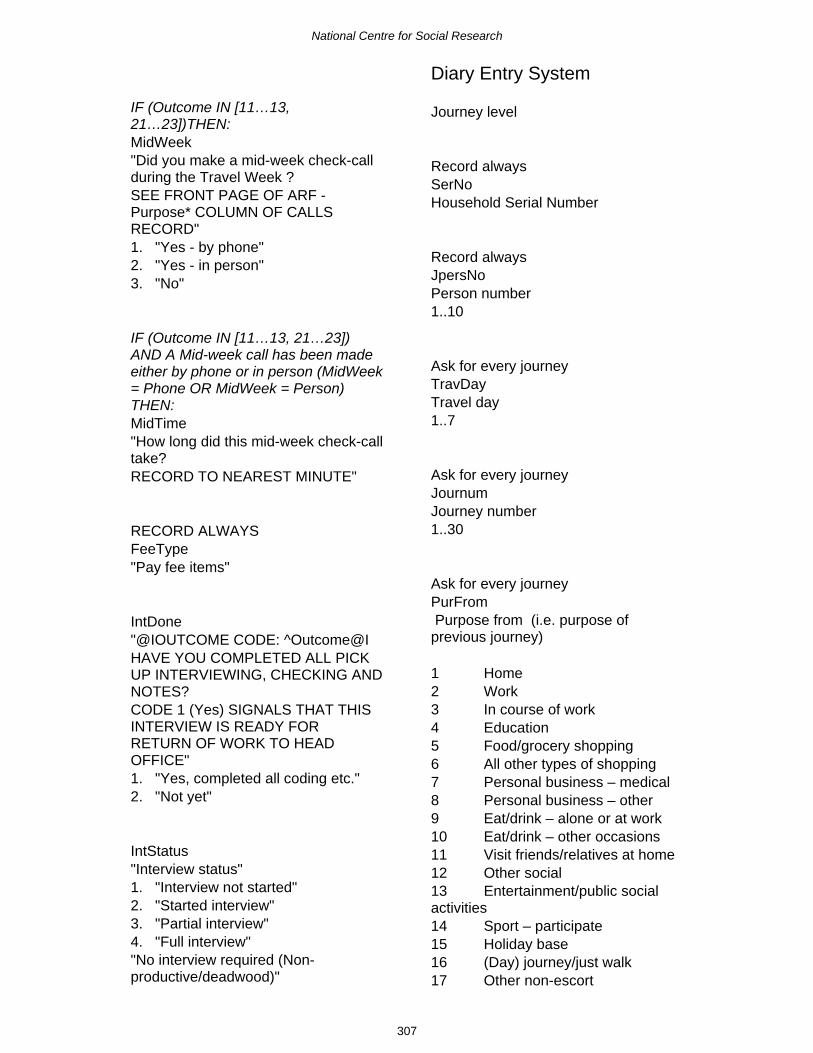
National Centre for Social Research
307
IF (Outcome IN [11…13,21…23])THEN:MidWeek"Did you make a mid-week check-callduring the Travel Week ?SEE FRONT PAGE OF ARF -Purpose* COLUMN OF CALLSRECORD"1. "Yes - by phone"2. "Yes - in person"3. "No"
IF (Outcome IN [11…13, 21…23])AND A Mid-week call has been madeeither by phone or in person (MidWeek= Phone OR MidWeek = Person)THEN:MidTime"How long did this mid-week check-calltake?RECORD TO NEAREST MINUTE"
RECORD ALWAYSFeeType"Pay fee items"
IntDone"@IOUTCOME CODE: ^Outcome@IHAVE YOU COMPLETED ALL PICKUP INTERVIEWING, CHECKING ANDNOTES?CODE 1 (Yes) SIGNALS THAT THISINTERVIEW IS READY FORRETURN OF WORK TO HEADOFFICE"1. "Yes, completed all coding etc."2. "Not yet"
IntStatus"Interview status"1. "Interview not started"2. "Started interview"3. "Partial interview"4. "Full interview""No interview required (Non-productive/deadwood)"
Diary Entry System
Journey level
Record alwaysSerNoHousehold Serial Number
Record alwaysJpersNoPerson number1..10
Ask for every journeyTravDayTravel day1..7
Ask for every journeyJournumJourney number1..30
Ask for every journeyPurFrom Purpose from (i.e. purpose ofprevious journey)
1 Home2 Work3 In course of work4 Education5 Food/grocery shopping6 All other types of shopping7 Personal business – medical8 Personal business – other9 Eat/drink – alone or at work10 Eat/drink – other occasions11 Visit friends/relatives at home12 Other social13 Entertainment/public socialactivities14 Sport – participate15 Holiday base16 (Day) journey/just walk17 Other non-escort

National Centre for Social Research
308
18 Escort home (not own)19 Escort work20 Escort in course of work21 Escort education22 Escort shopping/personalbusiness
Ask for every journeyPurToPurpose to
1 Home2 Work3 In course of work4 Education5 Food/grocery shopping6 All other types of shopping7 Personal business – medical8 Personal business – other9 Eat/drink – alone or at work10 Eat/drink – other occasions11 Visit friends/relatives at home12 Other social13 Entertainment/public socialactivities14 Sport – participate15 Holiday base16 (Day) journey/just walk17 Other non-escort18 Escort home (not own)19 Escort work20 Escort in course of work21 Escort education22 Escort shopping/personalbusiness23 Escort other
Ask for every journeyTimeleftTime left (12 hour clock)0..12
Ask for every journeyLeftMinTime left (minutes)00..59
Ask for every journeyTimeArrTime arrived (12 hour clock)0..12
Ask for every journeyArrminTime arrived (minutes)00..59
Ask for every journeyOrigCntyCounty code for journey origin
Ask for every journeyOriginUaUnitary authority code for journeyorigin
Ask for every journeyOriginUrUrban rural code for journey origin
Ask for every journeyDestCntyCounty code for journey destination
Ask for every journeyDestinUaUnitary authority code for journeydestination
Ask for every journeyDestinURUrban rural code for journeydestination
Ask for every journeySeriesWas the journey a series of calls?0 Not a series of calls (defaultsetting)1 Journey was a series of calls

National Centre for Social Research
309
Ask for every journeyNextDayWas the arrival time after midnight onthe next day?0 Arrival time before midnight (defaultsetting)1 Arrival time past midnight
Ask for every journeyNumStagNumber of stages in journey1..10
Ask for every journeyIdiscovInterviewer discovered journeyInterviewer did not discover journey(default setting)Interviewer discovered journey
Ask for every journeyIneligIs the journey ineligible?Eligible journey (default setting)Ineligible journey (but journey isincluded for information, e.g. to linktwo eligible journeys)
Ask if diary day is blankBlankWhy is day blank?1 No journeys made2 Day not filled in
RjdayRepeat journey (same person,same/different day)Enter travel day of original journey1..7
RjjnumRepeat journey number (same person,same/different journey number)
Enter journey number of originaljourney1..29
DjpnumDuplicate journey (another person)Enter journey number of originaljourney1..29
DjjnumDuplicate journey (another person,same/different journey number)Enter person number of originaljourney1..9
IF travday = 7OrigpnamOrigin placename
IF travday = 7DestpnamDestination placename
IF travday = 7Origad1First line of origin address
IF travday = 7Origad2Second line of origin address
IF travday = 7Origad3Third line of origin address
IF travday = 7OrigpcPost code of origin

National Centre for Social Research
310
IF travday = 7Destad1First line of destination address
IF travday = 7Destad2Second line of destination address
IF travday = 7Destad3Third line of destination address
IF travday = 7DestpcPost code of destination
Stages
Ask for each stageStagenumNumber of journey stage1.. 10
Ask for each stageMethodMethod of travel
1 Walk2 Bicycle3 Private (hire) Bus4 Car5 Motorcycle combination6 Van or lorry7 Other private transport8 Ordinary Bus (London)9 Ordinary Bus (Elsewhere)10 Coach/Express Bus11 Excursion/Tour Bus12 LT underground13 Train (formerly BR)14 Light rail15 Aircraft (public)16 Taxi17 Minicab/private hire vehicle18 Other public transport
19 Unspecified (private)20 Unspecified (public)
Ask for each stageDunitsDistance in miles0.25..500
Ask for each stageDtenthsDistance in tenths of miles
Ask for each stage in young person’sdiaryPartyNoaNumber of adults in party1..30
Ask for each stage in young person’sdiaryPartyNocNumber of children in party1..30
Ask for each stage in adult diaryPartynumNumber of people in party1..30
Ask for each stageTravminsTime travelling in minutes1..600
Ask for each stage involving ordinarybus London OR ordinary buselsewhere OR coach/express bus, ORexcursion/tour bus, OR LTunderground OR train OR light rail ORaircraft public OR other public ORunspecified publicTicktypeType of ticket (Season ticketinformation gathered during the CAPIplacement and pick up interviewersare coded 1-6).
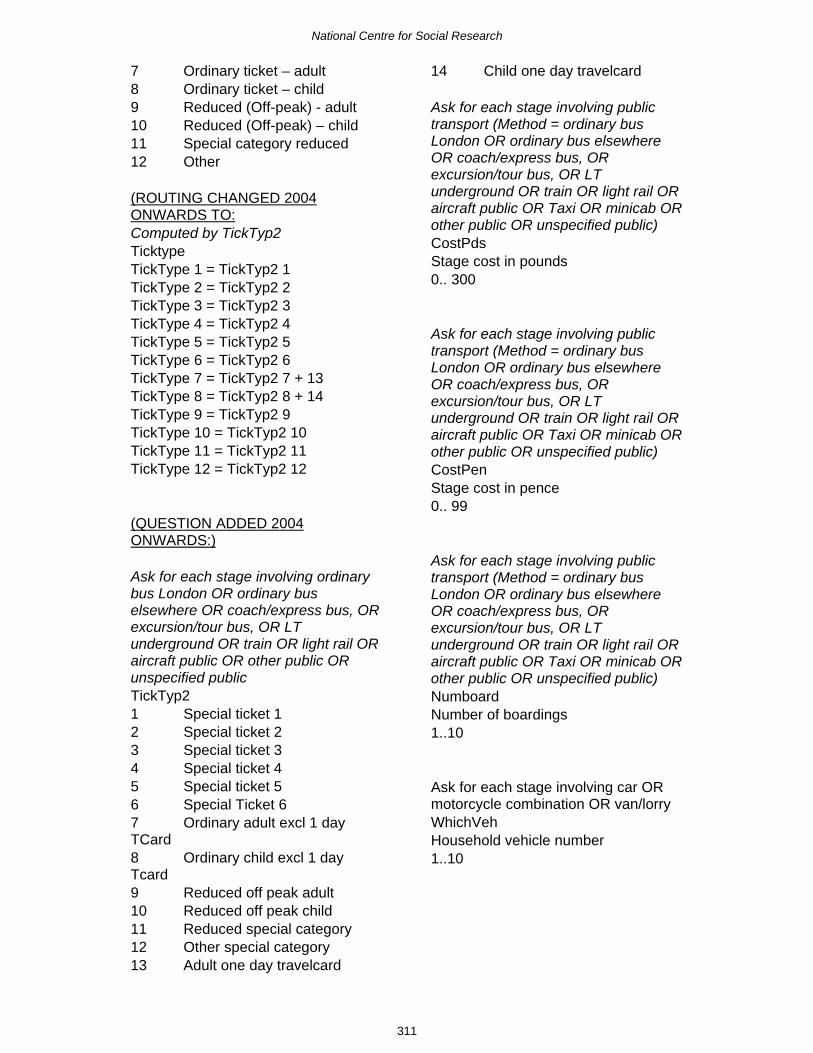
National Centre for Social Research
311
7 Ordinary ticket – adult8 Ordinary ticket – child9 Reduced (Off-peak) - adult10 Reduced (Off-peak) – child11 Special category reduced12 Other
(ROUTING CHANGED 2004ONWARDS TO:Computed by TickTyp2TicktypeTickType 1 = TickTyp2 1TickType 2 = TickTyp2 2TickType 3 = TickTyp2 3TickType 4 = TickTyp2 4TickType 5 = TickTyp2 5TickType 6 = TickTyp2 6TickType 7 = TickTyp2 7 + 13TickType 8 = TickTyp2 8 + 14TickType 9 = TickTyp2 9TickType 10 = TickTyp2 10TickType 11 = TickTyp2 11TickType 12 = TickTyp2 12
(QUESTION ADDED 2004ONWARDS:)
Ask for each stage involving ordinarybus London OR ordinary buselsewhere OR coach/express bus, ORexcursion/tour bus, OR LTunderground OR train OR light rail ORaircraft public OR other public ORunspecified publicTickTyp21 Special ticket 12 Special ticket 23 Special ticket 34 Special ticket 45 Special ticket 56 Special Ticket 67 Ordinary adult excl 1 dayTCard8 Ordinary child excl 1 dayTcard9 Reduced off peak adult10 Reduced off peak child11 Reduced special category12 Other special category13 Adult one day travelcard
14 Child one day travelcard
Ask for each stage involving publictransport (Method = ordinary busLondon OR ordinary bus elsewhereOR coach/express bus, ORexcursion/tour bus, OR LTunderground OR train OR light rail ORaircraft public OR Taxi OR minicab ORother public OR unspecified public)CostPdsStage cost in pounds0.. 300
Ask for each stage involving publictransport (Method = ordinary busLondon OR ordinary bus elsewhereOR coach/express bus, ORexcursion/tour bus, OR LTunderground OR train OR light rail ORaircraft public OR Taxi OR minicab ORother public OR unspecified public)CostPenStage cost in pence0.. 99
Ask for each stage involving publictransport (Method = ordinary busLondon OR ordinary bus elsewhereOR coach/express bus, ORexcursion/tour bus, OR LTunderground OR train OR light rail ORaircraft public OR Taxi OR minicab ORother public OR unspecified public)NumboardNumber of boardings1..10
Ask for each stage involving car ORmotorcycle combination OR van/lorryWhichVehHousehold vehicle number1..10
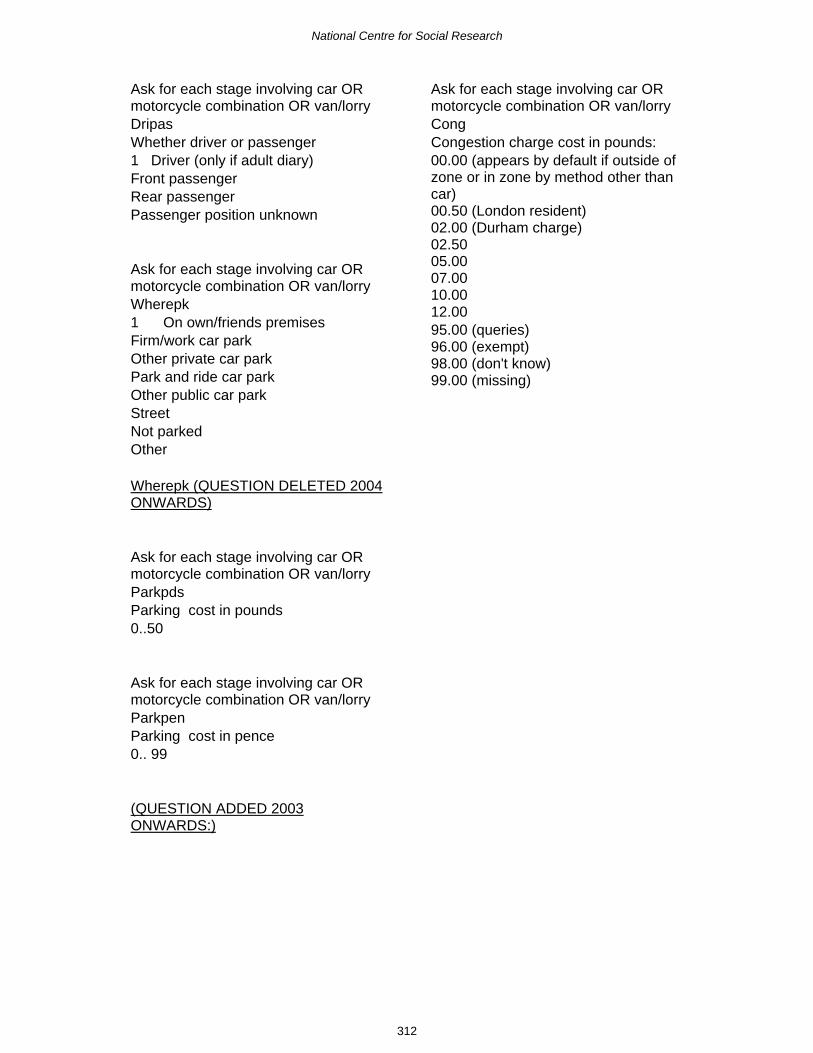
National Centre for Social Research
312
Ask for each stage involving car ORmotorcycle combination OR van/lorryDripasWhether driver or passenger1 Driver (only if adult diary)Front passengerRear passengerPassenger position unknown
Ask for each stage involving car ORmotorcycle combination OR van/lorryWherepk1 On own/friends premisesFirm/work car parkOther private car parkPark and ride car parkOther public car parkStreetNot parkedOther
Wherepk (QUESTION DELETED 2004ONWARDS)
Ask for each stage involving car ORmotorcycle combination OR van/lorryParkpdsParking cost in pounds0..50
Ask for each stage involving car ORmotorcycle combination OR van/lorryParkpenParking cost in pence0.. 99
(QUESTION ADDED 2003ONWARDS:)
Ask for each stage involving car ORmotorcycle combination OR van/lorryCongCongestion charge cost in pounds:00.00 (appears by default if outside ofzone or in zone by method other thancar)00.50 (London resident)02.00 (Durham charge)02.5005.0007.0010.0012.0095.00 (queries)96.00 (exempt)98.00 (don't know)99.00 (missing)

National Centre for Social Research
313
APPENDIX B 2003 AND 2004 ALLOCATION OF PSUS TO QUOTA MONTHS
MajorStratum
Jan Feb Mar Apr May Jun Jul Aug Sep Oct Nov Dec Total
1 2 2 3 3 2 2 2 2 2 3 3 2 282 2 2 0 0 2 2 1 1 3 1 1 1 163 1 1 3 3 1 1 2 2 0 2 2 2 204 2 2 0 0 2 2 1 1 2 1 1 1 155 1 1 3 3 1 1 2 2 1 2 2 2 216 3 2 1 0 2 2 1 1 3 1 1 1 187 0 1 2 3 2 1 2 2 0 2 2 2 198 3 2 2 1 1 2 2 2 3 1 1 1 219 1 2 1 2 3 2 2 2 1 2 2 3 23
10 2 1 2 1 1 2 2 2 2 3 2 0 2011 1 2 1 2 2 2 1 1 2 0 2 3 1912 2 1 2 1 1 1 2 2 1 3 1 1 1813 1 2 1 2 1 1 1 1 0 0 1 1 1214 2 1 2 1 2 2 1 1 3 1 1 1 1815 2 3 1 2 2 2 2 2 2 2 3 3 2616 1 0 3 2 1 1 2 2 1 3 1 1 1817 3 3 1 1 2 2 2 2 3 1 2 2 2418 0 0 2 2 1 1 1 1 0 2 2 2 1419 3 3 2 2 3 3 3 3 3 2 2 1 3020 1 2 1 2 1 1 1 1 1 1 1 3 1621 2 1 3 2 2 2 2 2 2 3 2 1 2422 1 2 0 1 1 1 1 1 0 0 1 2 1123 2 1 2 1 2 2 1 1 3 1 1 0 1724 2 3 2 2 2 2 2 2 3 3 3 3 2925 2 2 2 3 2 2 2 2 0 2 2 2 2326 2 1 1 0 1 1 1 2 3 1 1 1 1527 1 2 2 3 2 2 3 2 1 2 2 2 2428 2 1 2 1 2 2 1 1 2 2 2 1 1929 1 2 1 2 1 1 2 2 0 1 1 3 1730 2 1 1 0 1 1 1 1 3 1 1 0 1331 0 0 1 1 1 1 1 1 0 2 1 1 1032 0 1 1 2 1 1 0 0 0 0 1 1 833 1 1 0 0 0 1 1 1 1 0 0 1 734 2 1 1 0 1 0 0 0 2 1 1 0 935 0 0 1 1 1 1 2 2 0 1 1 0 1036 1 2 1 2 1 1 0 1 0 1 1 2 1337 1 1 0 0 1 1 1 0 3 1 1 1 1138 1 0 2 1 1 1 1 1 0 1 1 0 1039 0 1 1 2 1 1 1 1 0 1 1 2 1240 1 1 0 0 0 0 1 1 1 0 0 1 6
Total 57 57 57 57 57 57 57 57 57 57 57 57 684

National Centre for Social Research
314

National Centre for Social Research
315
APPENDIX C ALLOCATION OF PSUS TO QUOTA MONTHS
MajorStratum
Jan Feb Mar Apr May Jun Jul Aug Sep Oct Nov Dec Total
1 1 3 3 3 2 2 2 2 3 2 3 2 282 3 0 1 1 2 1 1 2 1 3 0 1 163 0 3 2 2 1 2 2 1 2 0 3 2 204 3 0 1 1 1 1 1 2 1 2 0 1 145 0 3 2 2 2 2 2 1 2 1 3 2 226 3 1 1 1 2 1 1 2 2 3 0 1 187 0 2 2 2 1 2 3 1 1 0 3 2 198 3 1 2 1 3 1 1 2 2 3 1 1 219 3 2 1 2 1 3 2 2 1 1 2 3 23
10 0 1 3 1 2 2 2 2 2 2 1 2 2011 3 2 0 2 1 1 1 2 1 2 2 1 1812 0 2 3 1 2 2 2 0 2 1 1 2 1813 1 1 0 2 1 0 1 2 1 0 2 1 1214 2 1 2 1 2 2 1 1 2 3 1 1 1915 3 2 2 3 1 2 2 3 1 2 2 2 2516 0 2 2 1 2 2 2 1 2 1 1 2 1817 3 2 1 2 3 1 1 2 3 3 3 1 2518 0 2 2 1 0 2 2 1 1 0 1 2 1419 3 1 3 2 3 3 3 2 2 3 2 3 3020 2 2 0 2 1 1 1 2 1 1 2 1 1621 1 2 3 1 2 2 2 2 2 2 2 2 2322 2 1 0 2 1 0 1 1 1 0 1 1 1123 1 1 2 1 2 2 1 1 2 3 1 0 1724 3 2 2 3 2 2 2 3 2 3 2 3 2925 1 3 2 2 1 2 3 1 2 0 3 3 2326 2 1 1 1 2 1 0 2 2 3 0 0 1527 1 2 2 2 2 2 3 2 1 0 3 3 2328 2 1 3 1 2 2 1 1 2 3 1 1 2029 2 2 0 2 1 1 2 1 1 0 2 2 1630 1 1 1 1 1 1 0 2 2 3 1 0 1431 0 1 2 0 1 2 2 0 0 0 0 2 1032 1 1 0 2 0 0 0 1 1 0 2 0 833 1 0 0 0 1 0 1 1 0 1 0 1 634 1 1 1 1 1 1 0 1 1 2 0 0 1035 0 0 2 0 1 2 2 0 1 0 1 1 1036 1 2 0 2 0 0 1 1 1 0 2 2 1237 2 0 1 1 2 1 0 2 1 2 0 0 1238 0 1 2 0 1 1 2 0 1 1 1 1 1139 1 2 0 2 0 1 1 1 1 0 2 1 1240 1 0 0 0 1 1 0 1 0 1 0 1 6
Total 57 57 57 57 57 57 57 57 57 57 57 57 684

National Centre for Social Research
316

National Centre for Social Research
317
APPENDIX D ADVANCE LETTERS
Your interviewer on this study will be
______________________________
Dear Sir/Madam,
National Travel Survey
Your address has been selected for this study and we are writing to ask for your help.It is about your daily experience of travelling and is used by the Department forTransport to shape travel policy.
Most people who take part find it interesting and are pleased to have their views andexperience taken into account by the Government. We rely on the voluntarycooperation of everyone we approach. To show our appreciation, if everyone inyour household completes the study, each person will receive a £5 gift voucherexchangeable at many High Street stores.
The research is being carried out by an independent research organisation, theNational Centre for Social Research. One of our interviewers will visit you in the nextfew days to arrange a convenient time for an interview. They will show you theirofficial identification card which includes their photograph and the NatCen logoshown at the top of this letter.
Your answers will be treated in strict confidence in accordance with the DataProtection Act, and the information will only be used for statistical purposes.
In the meantime, and as a gesture of good will, we are enclosing a book of first classstamps for you to keep.
You can find more information on the back of this letter but if you have any questionsplease call Joanne Day or Neil Barton at NatCen on 01277 690043. We thank you inadvance for your help.
Yours faithfully,
Joanne Day,Project Controller, NatCen
Dorothy Salathiel,Survey Manager, Department for Transport
Please turn over for more information…

National Centre for Social Research
318
?How was I chosen?
We have selected a sample of addresses from a list kept by the PostOffice of all addresses in Great Britain. This ensures that the peopleinvited to take part in the survey are representative of the wholecountry.
The findings will not identify you or your family because your name andaddress will not be passed to anyone outside NatCen.
?I do not travel very often - do you want to interview me?
We are interested in everybody’s day-to-day experience of travel,however much or little they do. The results are used to look at howtravelling changes over time, and to make decisions about the future.
We need information from a wide range of people including those in orout of work, children and the elderly. Otherwise we will not get a truepicture of travel in Great Britain.
The study provides up to date information about travel which cannot becollected in any other way.
?What kinds of travel are covered by the survey?
We are interested in all the different kinds of journeys that people makein Great Britain, as well as how often they make them. This includesjourneys to school or work, shopping trips and journeys for leisure orsocial purposes. Both local and long distance travel are covered, asare all forms of transport (such as cars, public transport, cycling andwalking).
?What is the survey used for?
The National Travel Survey is used to build up a picture of how andwhy different kinds of people travel. The information is used by policy-makers in Government, as well as by consultants, academics, pressuregroups and charities amongst others.
Some of the specific uses of the survey include studying schoolchildren's travel, monitoring road accidents, predicting future trafficlevels and finding out the transport needs of minority groups.
National Centre for Social Research
319
APPENDIX E QUESTIONS DELETED FROM THE NTS IN 2003 AND 2004
2003
There were no questions deleted from the questionnaire in 2003.
2004
Household Questionnaire
A series of questions about the type of a vehicle (and specifically whether they are 3or 4 wheeled vehicles for vans and cars, or a motor cycle or moped for motorcycles)have been condensed into one question which codes the vehicle type.
Individual Questionnaire
Questions concerning travel benefits (bus passes, tickets etc.) for employees.
A question about whether the household owns or has regular use of the vehicle arespondent uses to travel to work.
Questions about difficulties travelling to work if the respondent did not have use oftheir vehicle.
Questions about why a household vehicle is left unused when the respondent goesto work.
Questions about difficulties travelling to do the main food shopping if the respondentdid not have use of their vehicle.
Questions about why a household vehicle is left unused when the respondent goesto do their main food shopping.
Vehicle questionnaire
A question about the type of petrol used in a vehicle.
Questions about where a vehicle is usually parked overnight and the cost (and typeof payment) for any such parking.
Diary Entry System
From 2004, no details about where a vehicle is parked were available in the DESsystem for coders to use.

National Centre for Social Research
320
National Centre for Social Research
321
APPENDIX F SURVEY LEAFLET

National Centre for Social Research
322
What is the survey about?
The government makes many decis ions about travel and transport services and to do this it needs up-to-date and reliable information. The best way to do this is to ask people themselves about their travel and the National Travel Survey has been doing this s ince 1965.
The questions which you and several thousand other households answer each year, give important information an the different kinds of transport people use, distances travelled , where people travel to and why they travel.
Why have we come to you?
The households selected have been chosen by taking a representative national sample of addresses from the Post Office·s own list. We then approach the people who live at those addresses. To make sure that travelling done by all households is represented , it is important that everyone selected helps us by taking part in the survey.
To obtain a true representative picture we need to include people who make a lot of journeys, few journeys or no journeys, and people from all age groups.
How is the information used?
The National Travel survey is used to build up a p icture of how and why d ifferent kinds o f people trave l. It helps to find out the special transport needs of particular groups of people such as the elderly, the d isabled , schoolchildren and those in or out of work. It is a lso used to help plan and provide public transport and roads and to predict future traffic levels
Because the survey is carried out during every week of the year, seasonal changes in travel behaviour can be measured. It is the only source of national information on subjects such as cycling and walking.
How can you help us?
The information overleaf was produced with the assistance of people just like you , based on their travelling experiences. Now is your chance for your travel needs to be recognised. We rely on your voluntary co-operation and the information collected from you will be used to help produce statistics on travelling in Britain and wil l help with future transport and environment plans and policies
How we get to the shops
Did you know
• Nowadays, people travel on average 6 ,800 miles a year, nearly four times as far as they did in 1950_
• On average , we spend two weeks a year travelling - including nine days in our cars and three days walking
• Women make 20% more shopping trips than men, and are also more likely to take the children to school, and to visit mends in their homes_
• People over 60 use buses more often than ch ildren or those of working age. About half have a senior citizens bus pass.
• The average journey to work takes 23 minutes, but for those working in Central London the average is 48 minutes - twice as long.
• The average distance walked per person has fallen from about 250 miles a year to under 200 miles a year over the last 20 years.
• 4 out of 5 men and 3 out of 5 women now hold a full driving licence , compared with 3 in 5 men and 1 in 5 women in 1972.
These are just some of the facts collected by the National Travel Survey over the last few years with the help of the public.
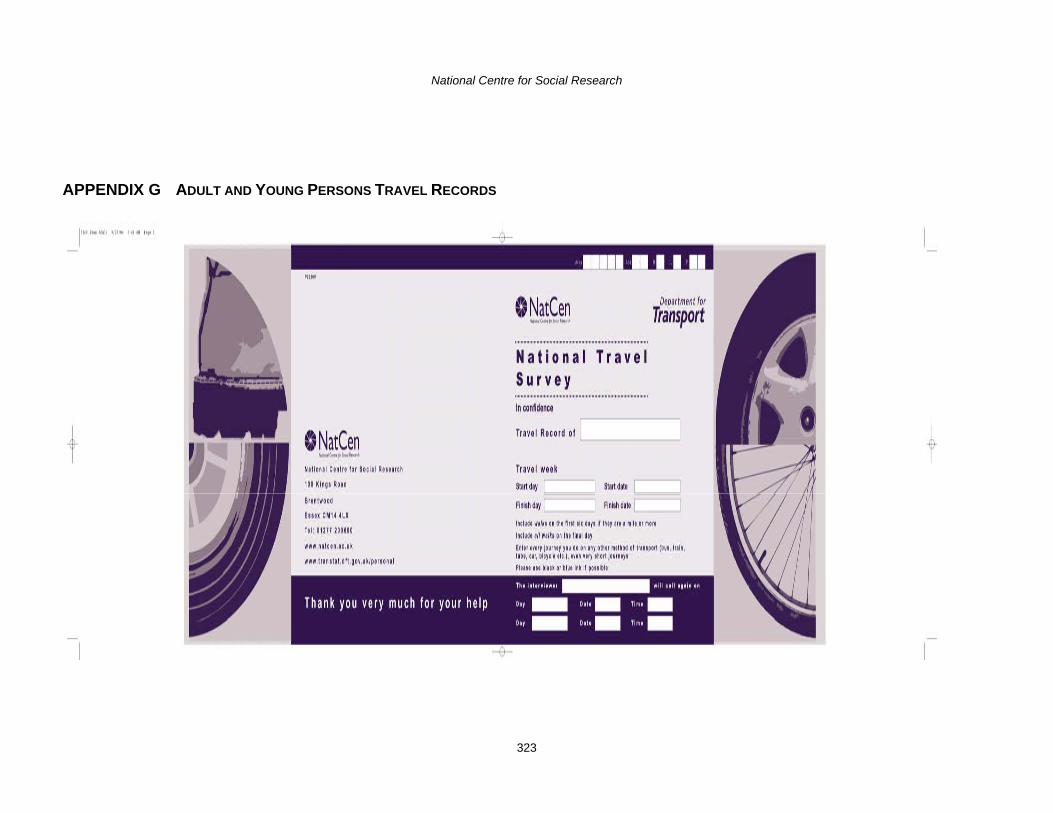
National Centre for Social Research
323
APPENDIX G ADULT AND YOUNG PERSONS TRAVEL RECORDS

National Centre for Social Research
324
+
How to fll' in your travel r ecord
,. 2' FH'ii,,, " eH R" • .,. is' eh' 'Hi El" i,j 'hi
,
PU""," '" ... ,~ '" G." ....
G.k-
T.k~ .. tulllJlJl/,J~t
G.k-
7.30 q.:
7.00
~ 9.30
cl::: 10.3(
@
-,m
-om
.m ~
-. -'" 8.50
'1:\ 8.30
~ 9.45
~ 104:
cJg
.m ~
. m
. m ~
,-ylllagolTo ......... oc. , . ...
'" If
C ... r;.,;".
If
r;.u.,,-
.1
Uoo '" iI • .,.., . .... on"nlc.g .... fO" .... ,10 ... , ...
" Ylh QOl'lownlL""., .... M
'" c....r;.,;".
If
~
If
, , , ,
-"", ..... '"
W.tf r...
B. r... W.tf
,lA< , , , lA< , , , , , , , , , , ,
D*oto...,. No.1n TImo mllw po..,. tr_Nng IQI (HJ _11)
I I ~~ 50 I
a.:: 50 I ~ 6~ I I !l0 5.3 3 15
1;3 I1 I;
'A' fH'I!,,," eH sa '''6'''5' ,,"',,":I'M" • Public TranSl>ortfTa.ls Car motOfblke other motor vehk:le
_MW: ~WUj4 ,-MW:
~
'" /IlL
••• .... «Ilngo
"' I
l'ifttV ~
Wh!o.~ ... 1 Of I P... 0rI0 .... on/J': R'*'I _<><1>1 •• , DRlFPlm> wl!on potMd C~tlo" 01<. o.JM<I (" ) (N) .. eo01 (0) <".~ (P)
, " . ,
• , 0 • 0
1- OR ~-,
''''"'''1 .FM , £ NIL p
R...J; OR "''<1
;'~::: • /IlL
• •
• o • 0
• , . ,
"".r dO" 1/10, . .. . _ . "" ont."""...,..
+

National Centre for Social Research
325
I"" ., ... <kt, .,,,,,. ',Of .. '-"
__ M a N TUE W ED THUR FRI S A T SUN
Date: ~ On !hi day ine)""" ALL WALk! t_ • me; . .. kI .. thin i iJiIIiIj
t
L-- -l 01 woU .... \tit! Io!!rn!Y"5You do
On this day please record !ha fuH address (including Ihe postcode) of whore you r journey Slarted al'd finished. You need only record 'H ' for home, but pklase enter all other addresses in fu ll For shopp;ng trips. please record the name of the first and last shop you visited. as well as 100 address I1 you do nol kflOw!ha lull address andJor postoode, please reoon.l as much inlormalion as possible On th is day only. please Include all wa lks (oven those less than one mile).
,
PUrpoN 01 ,..,~ ,.
-,m
-~ -~ -,m
,vmago1Town/lOO:l' .....
'" t . fuH ""d,_
,--om C""''''' i tl ,m
, . r ... .... ,-T_""'1Iy
om C"",,,,, -.-,m ~. ' '''1 "".,-T<>w""'1Iy
om CO<Inly - -1" ~ ,
7. foH .'-T_"'CIIy
om c ount; --,m I I
2. f u' -_. ,--~"' ' . ru' -_. ,--~"' .. ' uH -_. ,-.. ~"' .. fu~ --T ...... 1C1I}o
~"'
, , ,
Tt · , , ,
~i" ' , , ,
l""'t" 4
, , ,
ri"'iO
•
-. -~ '"
Dflv,", Remember to enter your final milomelElf ami foo l gauge reading on !he Fool and Mileage chart
Romo_ to In<l lIde ,"",n """n.,.. """k_
OJ.''neo No. In Ttmo mllM p • .." traoo"l~ 10) IHI _11)
!le""
'" W
Public TranseortfTaxll
,-, '"'
--.... "lIngo
'"
Ca. mote<blk. other moro. vehiel. WI1leh <err Or I PI.. om ... on", ~_ _onII,., DRJFPIRP ""'on po ...... C""i"tlon 0"' ....... (11) (N) .. o»ot (0) <"''9*0 (P)
, ,
, , , ,
, , , , ,
, , , ,
t
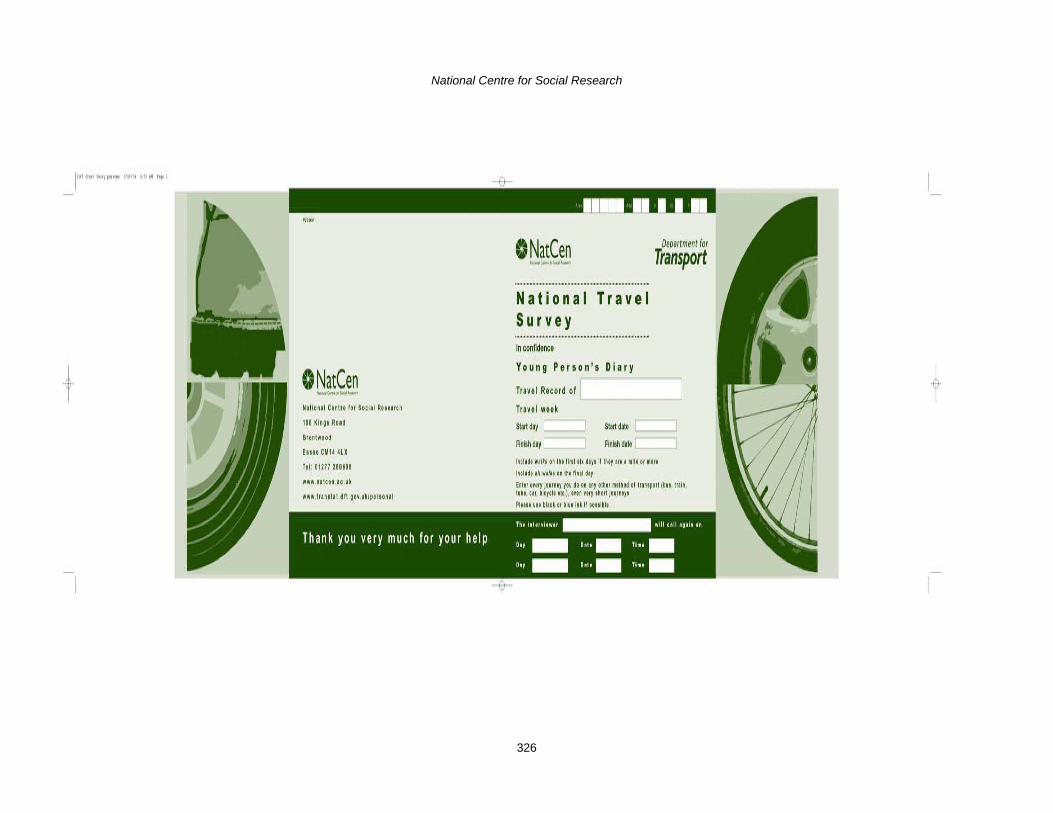
National Centre for Social Research
326
t NIII,",I ctnl" 10110cltl Rlllllch
100 KlnOI ROld
Br.nlwood
Elm Cilt Hx
TII ' Dim 2G01DO
WWW.nltoln .ltI .llk
.'.,I'tnllll.d!l .go',U!lpIlOO,tl
o NatCen c.., .. ,.... ........
National Travel Survey I" conffda"ca
Young Pu,on', Diuy
Traval Record of l Trm l wook
Department IQr
Transport
$I'~ dDy L.[ ___ l $11" dDlo L.-_-.i
FlnllhdlY [ 1 flnllhdolo
Iftoludl wil., O~ rftt 11rlll!. dlY'1f iftly .,1. mill er 1Il0f.
'OO',il,I/WllbonlhlilOllil, Enttrmrflournlyyow4oonuyothlfm.thodollrInlPorl~bw. , lrlln , rub.jou, blo,olllle.) ,.m ~II' .hortlournt~1
P'Ii" "IIIIC! If 01" '"~ 11 po"lill
Th.lnl.rvl.wII _ WIIICI' I .galnOn
Thank you very much for your help 0., _ D., .• IIm •• D., _ D., •• "m .•
I~
t

National Centre for Social Research
327
+
I"" a .............. .... • ",,0' ....... _.
How to f.11 In your travel record
1 Tu ttkvl
R_,,-
fc.. w i
r;,~
8.&,r;,
khrJ i
8.&,,,,,,
-~ '" B~
,m
3.30
cTn: 4.0C
cTm 6.00
r.:;: 9.00
6m 9.40
cJi';:
,m ,m
,~ -'" 9~ 3.50
a::: 4.10
Gm 6.4C
rTm 9.35 G-,m
9.45 ~ ,m
,m ,m
,-VlllogolT ...... l.oo:.1 A,..
'" !I
Kq.J..
!I
/(;"p...J
B.ot
t:wp ..
VM ,.'"._ to< '"1""'''11 . ... ,.,. w ... '" " U ".,
" 1/l.'-'1'<NmItoe., .......
'" Kq.J..
!I
~
B.ot
/(;"p...J
iI
, , , , , , , , , , , , , , , , , , , , ,
-~ ortr ....
'" B.
&.
c..
c.. r;.,.
r;.,. c.. c..
_., -'" 1.5
1.5
l.1
0.5 5
5 0.5
1.2
,,tIo. lnpOrt, _I~ -. Chi .. _(I)
1 10
1 10
1 1 5
1 2 5 2 18
2 18 1 2 5
1 1 5
&.1"" NIL 1
B. I"" NIL 1
MlJMI,j FP
Fr.wJ i RP Rw- £ 2.80 1 +
1 FwM l RP Ffibd i RP
"nor •• , 7 .hor ... 'po«!Of ... ,. Jou, • .,..

National Centre for Social Research
328
t
I"" a ................... ",,0' .... ...
Day 7 MON ' "' W'O THUR 'R' ' U N
nl .,. r'IC" • oale: r== ~ •• .. wall .. 0I1l!t iou'''' ", you do
On this day please record the lull address (including Ihe poslCOde) 01 where yoor jc>urney starlOO
and fi nished. You nHd only record ' H' for hom. , blit please elltef ell olher addresses In lull. For shoppinglrips. plaase " lOQrd the name of the first and last sllop),oo visited , as well as the address. If you do not know the full address and/Of poslcode. please r9CO!d as much information as possible. On this day only, plea .... also Includ e all walks (even tho .... IltSs than 1 mile ).
,
,
,
•
P\lrpooo • • .. ,~ ,., ,~
'"
- -,m ,m
- -~ ~
- -~ ~
- -,m ,m
•. fu" -_. "'wnlCK,
CoU"t1 ~it<:r
l. Full -_. r.""",,Hr Cou"" --~ f." A .......
TownlCij, Cou"'Y
~"'i , 1. full ....... To .... C~' = •• --, ,
,. v ... ~OwM. .... , .....
'" ~~"n d, ...
, ,
T_nK:~ , county j lOr , -,. A,id, ... ,
, T .... "",ny , ~"~ -- -:';'~ull
d, ... , ,
~~" , County r r TI T--n -::,,~ull d, ...
, ,
TownK:",. , ~"~ --111 ·
-.~. '"
" .... F ''9" iH::' "" !liH; • ... , pm I To: I
··'~ I To: I .,,'pm To: I om l pm I To: I
t

National C
entre for Social Research
329
APPEN
DIX H
M
EMO
RY J
OG
GER
r :::r I Area
Address
Household
Per. No.
o NatCen ~,- .. ",,~,-,.
'-Ia llonol Cent re for Soc l~1 Ruurch
100 Klnll " Roo d
Brontwood
E .. U CM14 4LX
01277 200600
WWW.notco".,c.uk
tll>.,"o nollr.~ . 1
Thank you very much
Department for
Transport
National
Travel
Survey
I n confidence
MEMORY JOGGER OFI '----------
START Day
FI NISH Day

National Centre for Social Research
330
• > • , 0 !
1 I • , t , IT If L
l '-' I
t} iI iI It " " It iI iI Il It " " >
< • l! ! 11 It It " " " " It Il " " " ,
'1 " >
0 I! • • • I , , >
z ! 0 I z 1
I , ! , I·
f 11 ,
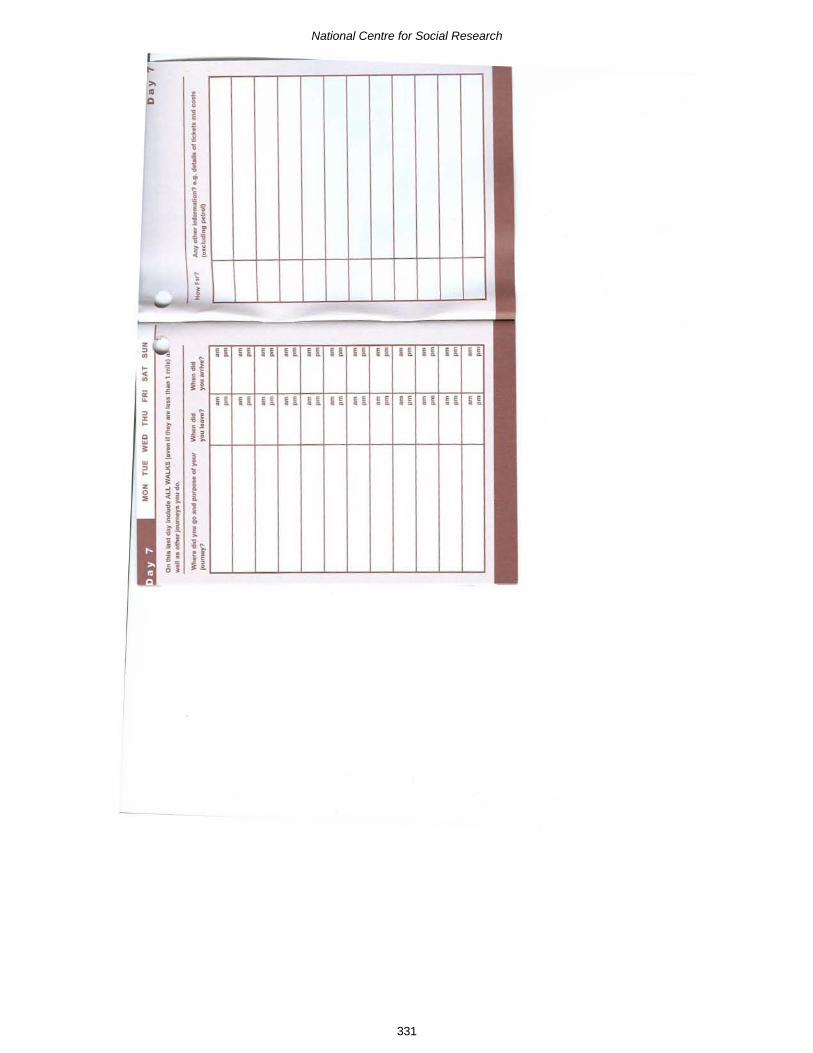
National Centre for Social Research
331
z , • • • • • • , z • • • • • ; • • < z ~; 0 '! •
it h " "
I 1 I , I , It If 'i~t-t-t-t-t-t-t-t-t-t-t-
I
11 Ii It It Ii It " It It Ii Ii H i
I ! !
It 11 " Ii " It 11 li Ii it It It • I !
I • ! i , I I , ! I
I I

National Centre for Social Research
332
APPENDIX I LONG DISTANCE JOURNEY RECORD
Long Distance Travel Record of
Between today’s date ( / / ) and the day before you begin your Travel Record ( / / ), please keep a note of any journeys youmake of 50 miles or longer. Our interviewer will be asking a few more questions on these long distance journeys when he/she returns tocollect your travel record. Thank you.
Long DistanceJourney 1
Long DistanceJourney 2
Long DistanceJourney 3
Date
Village/town where journey began
Purpose of journey (e.g. from home to work, from hometo visit relatives)
Village/town where journey ended
Distance travelled(miles or km)

National Centre for Social Research
333
Main method of travel (i.e. method used for the longestdistance)
If by car, motorcycle, van, lorry or other private vehicle,were you the driver or passenger? Driver
Passenger
Driver
Passenger
Driver
Passenger


National Centre for Social Research
335
Long DistanceJourney 4
Long DistanceJourney 5
Long DistanceJourney 6
Date
Village/town where journey began
Purpose of journey (e.g. from home to work, from hometo visit relatives)
Village/town where journey ended
Distance travelled(miles or km)
Main method of travel (i.e. method used for the longestdistance)
If by car, motorcycle, van, lorry or other private vehicle,were you the driver or passenger? Driver
Passenger
Driver
Passenger
Driver
Passenger

National Centre for Social Research
336
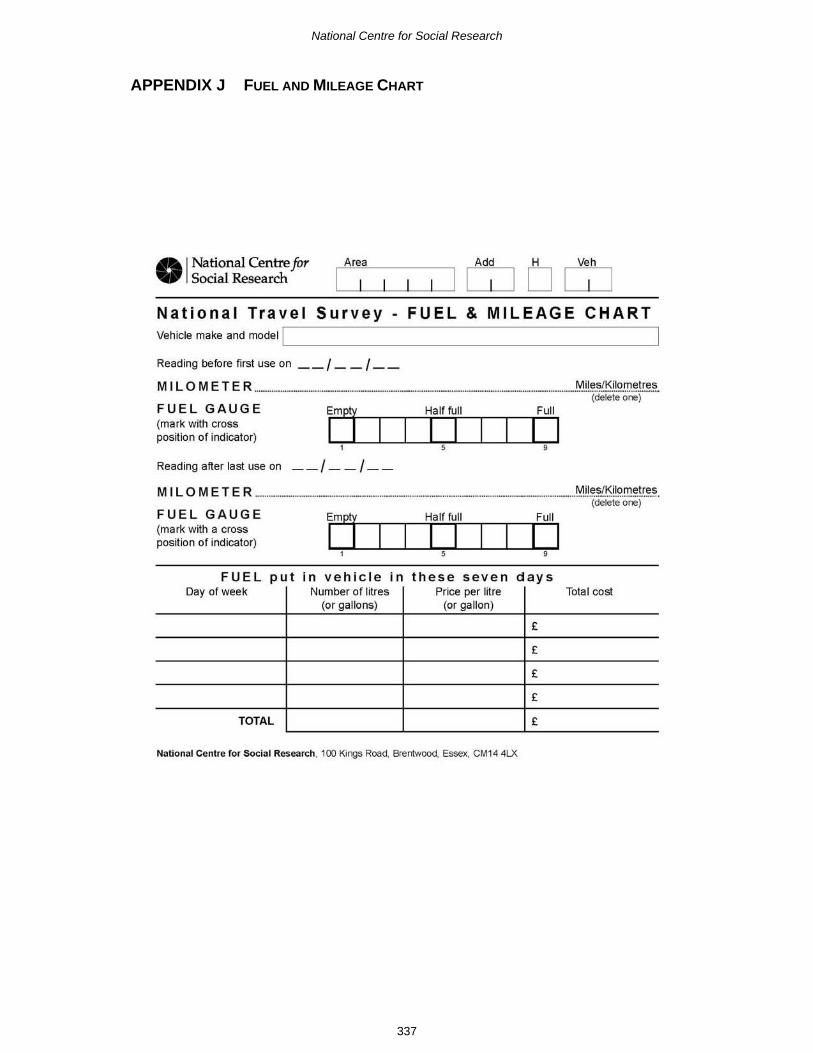
National Centre for Social Research
337
APPENDIX J FUEL AND MILEAGE CHART
O I National Centre for Social Research
Area Add H Veh
I LlJ D LlJ FUEL & MILEAGE CHART National Travel Survey
Vehicle make and model rl-------'---------------------,
Reading before first use on _ _ I _ -I--M Il 0 ME T E R ___ . ___ ... ______ . ___ . __ .. __ ... _ ... ____ ... __ ... _____ ... ___ . ____ . ____ . ____ .. _. ____ . ___ ... __ ~!L~~~~_I!.1~!!.~~
FU E L GA UG E (mark with cross position of indicator)
Reading after last use on _ _ I __ 1--
F U E L GA U G E (mark with a cross position of indicator)
Half full
I I
Half full
Full
I I
Full
I I FUEL p u t in ve hi c l e in th es e seve n days
Day of week Number of litres Price per litre (or gallons) (or gallon)
£
£
£
£
TOTAL £
National Centre for Socia l Research, 100 Kings Road, Brentwood, Esse~. CM14 4LX
(delete one)
(delete one)
Total cost
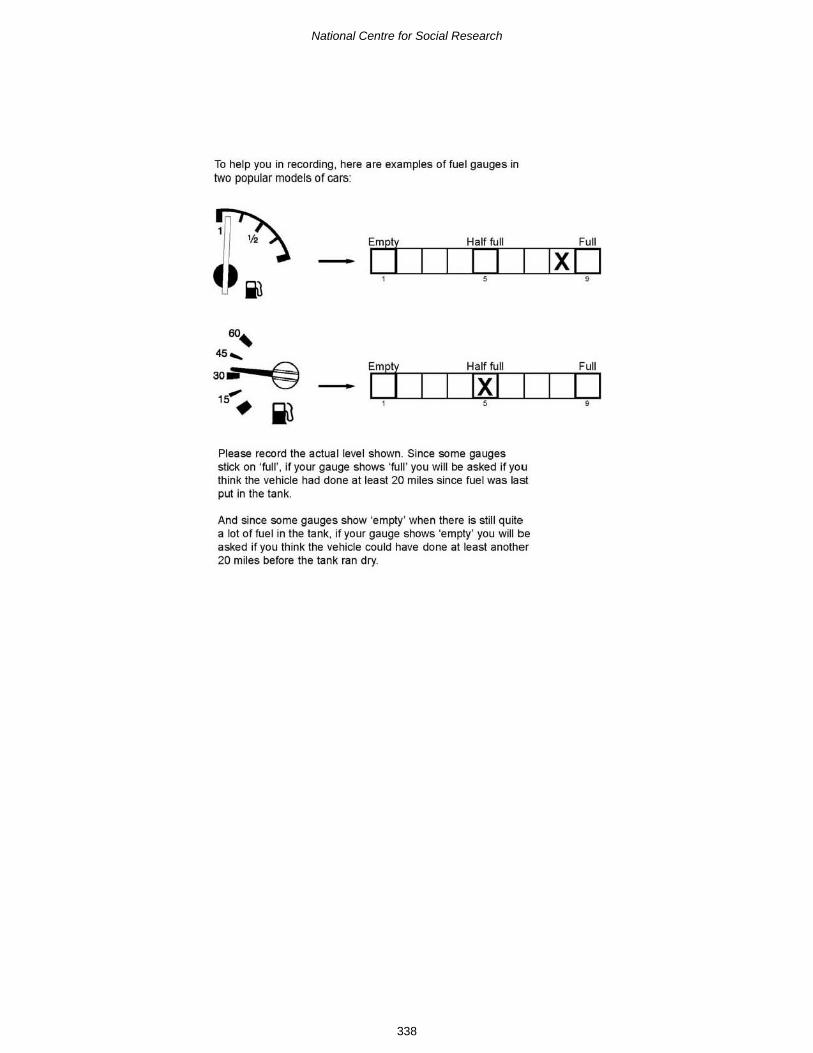
National Centre for Social Research
338
To help you in recording, here are e)(amples of fuel gauges in two popular models of cars:
~ Emj Half full - I ,
6O~ 45 ...
=@ Em, Half full "'. Ixl -15-- I • il , ,
Please record the actual level shown. Since some gauges stick on ·full' , if your gauge shows 'full' you will be asked if you think the vehicle had done at least 20 miles since fue l was last put in the tank.
And since some gauges show 'empty' when there is still quite a lot of fue l in the tank . if your gauge shows 'empty' you will be asked if you think the vehicle could have done at least another 20 miles before the tank ran dry.
Full
Ixl •
Full
•

356

National Centre for Social Research
357
APPENDIX K ADDRESS RECORD FORM

National Centre for Social Research
358
Travel Week Start Date: / /ASSIGNMENT/SLOTNAME:P.2320 NATIONAL TRAVEL SURVEY
ADDRESS RECORD FORM (ARF) TRIP/RETURN NO:AFINAL OUTCOME:
NAME & ADDRESS DETAILS HOUSEHOLD SELECTION LABELHHNo:
1
Title & SurnameHouseholder
name:Interviewer
name:
Telephonenumber:
Interviewer number:
No Tel: 2 No. refused / ex-directory 3 Total No.of calls:
Productives: Callsto Diary Placement
CallNo.
DateDD/MM
Dayof
week
Call StartTime24hr
Clock
CALLS RECORD(Note all calls, including telephone calls, even
if no reply)
*Call Status(Enter
codes only)
Call EndTime 24hr
Clock
Purpose**
1 / : :
2 / : :
3 / : :
4 / : :
5 / : :
6 / : :
7 / : :
8 / : :
9 / : :
10 / : :*Call Status Codes: 1=No Reply, 2=Contact Made, 3=Appointment made, 4=Interviewing done, 5=Any Other Outcome (describe incalls record)** Record whether the call was placement (PL), reminder (R), mid-week check tel (MT) or F2F (MF), or pick-up (PU).

National Centre for Social Research
359
RE-ALLOCATED ADDRESS/HOUSEHOLD : If this address/household is being reallocated to another interviewer beforeyou have completed it, code here 90 END *
DO NOT FORGET TO COMPLETE OBSERVATION & NON-RESPONSE FORMS
Establish whether to interview at address
1Yes A Go to Q6IS THIS ADDRESS TRACEABLE, RESIDENTIAL, and
OCCUPIED AS A MAIN RESIDENCE?Unsure B Go to Q2
No C Go to Q4Office
Refusal 41 END *
Unknown eligibility2. CODE OUTCOME :
OFFICE APPROVAL ONLY – Not attempted 61
OFFICE APPROVAL ONLY – Inaccessible 62 ENDOFFICE APPROVAL ONLY – Unable to locate address 63
Unknown whether address contains residential housing 64 Go to *Residential address – unknown whether occupied by eligible h'hold 65 Q3
Other unknown eligibility 67 Go to Q5
3. WAS THE INFORMATION ......REFUSED 1
or … DID YOU NOT MAKE CONTACT? 2Obs & END

National Centre for Social Research
360
Deadwood4. CODE OUTCOME :
OFFICE APPROVAL ONLY – Unable to locate / address doesn't exist 70
Not yet built/under construction 71
Demolished/derelict 72Vacant/empty 73
Non-residential address e.g. business, school, office, factory etc 74 END
Address occupied, no resident household e.g.holiday/weekend homes
75
Communal Establishment/Institution (no private dwellings) 76Residential, but no eligible respondent (no one aged 16+) 77
Address out of sample 78Other Ineligible 79 Go to Q5
*
5. RECORD REASONS FOR USING Code 67 or Code 79
END
Establish number of occupied households at address Select 3 if necessary6a. ESTABLISH NUMBER OF Households AT ADDRESS: WRITE IN HERE Go to b
OR CODE: NON-CONTACT or INFORMATION REFUSED A Go to Q10
b. INTERVIEWER SUMMARY : No. of Households
1 household only A Go to Q8
2-3 households B Enter details atQ7b
4-12 households C Go to Q7a
13+ households: select THREE using look-up chart on p. 5 D Enter details atQ7b
7a. IF 4-12 households, complete Q7a and Q7bList all households at address, in systematic order, e.g.• In flat/room number order• OR From bottom to top of building, left to right, front to back

National Centre for Social Research
361
Description SelectionCode
Description SelectionCode
01 07
02 08
03 09
04 10
05 11
06 12
• Refer to the Household Selection label on front of the ARF, and select three households.• Ring the three households selected, in the grid above, and repeat their details at 7b. below.
7b. ENTER DETAILS OF SELECTED HOUSEHOLDS:
SelectionCode
(from Q7a)
DETAILS/DESCRIPTION
Household
1
Is the address on the ARF label correct and complete for this household?If not, make necessary changes to the front of the ARF.
Continue on this ARF (HH no. = 1)
Household
2
Complete ‘Additional Household’ ARF (HH no. = 2)
Household
3
Complete ‘Additional Household’ ARF (HH no. = 3)

National Centre for Social Research
362
Seek contact with Householder and introduce surveyHouseholder is an adult legally responsible for the accommodation, or their spouse/partner
INTERVIEWER: Use grid on page 6 of ARF to keep track of information needed for pick-up:8.persons interviewed,diaries placed,
diaries returned,vehicle questionnaires,
driving licences,special tickets or passes .
SUMMARY: Any interview(s) achieved A Go to Q9No interview B Go to Q10
Productive outcome- record details9. PLEASE CIRCLE OUTCOME CODE COMPUTED IN ADMIN BLOCK
'Fully productive' cases MUST include a fully completed DIARY for EVERY household member, of all agesFully productive : ALL desired respondent(s) in person 11
Fully productive : partly by desired respondent(s), partly by proxy 12Fully productive : by proxy 13
Go to Q13a
Partial productive : desired respondent(s) 21Partial productive : partly by desired respondent(s), partly by proxy 22
Partial productive : by proxy 23END *
For all other outcomes, not computed in Admin Block, go to Q.10.

National Centre for Social Research
363
Eligible address – unproductive outcome: CODE ONE ONLY10. NON-CONTACT:
No contact with anyone at address 31Contact made at address, but not with member of selected h'hold (MULTI-HH
ONLY)32
Contact made at selected household, but not with any responsible member 33
Obs,NR (postal),
& END*
REFUSAL:Information refused before selection complete (ie. no. of h'holds) (MULTI-HH
ONLY)42 Obs & END
DISCUSS WITH TRAVEL MANAGER - Refusal at introduction/ before interview 43 Go to Q11Refusal during interview (unproductive partial) 44
Broken appointment – No recontact 45Obs, NR,& END
*
OTHER UNPRODUCTIVE:Illness at home during survey period 51
Absence from home / in hospital all survey period 52Physical or mental incapacity 53
Obs, NR,& END *
Language difficulties 54 Go to Q12OFFICE APPROVAL ONLY - Lost productive 55 END
OFFICE APPROVAL ONLY - Other Unproductive 56 Go to Q12
11. WAS THE REFUSAL BY ... CODE ONE ONLY... THE DESIRED PERSON (Householder or spouse/partner) ? 1
or BY PROXY (someone else) ? 2Go to Q12
12. RECORD REASON FOR REFUSAL (CODE 43) OR USING LANGUAGE SPOKEN (Code 54) OR OTHERUNPRODUCTIVE (Code 56):
Obs, NR& END

National Centre for Social Research
364
Look-Up Chart for 13+ Households
If there are: 13 Households Select 8, 11, 13
14 7, 6, 5
15 8, 9, 5
16 9, 16, 11
17 11, 9, 16
If there are: 18 Households Select 11, 6, 18
19 13, 18, 7
20 17, 1, 4
21 16, 10, 2
22 16, 4, 22
23 19, 3, 22
If there are: 24 Households Select 10, 19, 14
25 23, 15, 4
26 22, 20, 17
27 14, 24, 25
28 2, 17, 25
29 19, 18, 4
30 28, 7, 20
PROMISSORY NOTE
13a Did you complete and leave behind the promissory note for the incentive vouchers?
Yes A END
No B Go ToQ13b
13b Please explain why you did not leave the promissory note
END

National C
entre for Social Research
365
LONG DISTANCE JOURNEY DATES FOR PICK-UP:
DATE OF PLACEMENTINTERVIEW: DJ DJ CD DAY BEFORE TRAVEL WEEK START DATE: DJ DJ CD d Keep track of all persons eligible for interview in grid below.
You will need this information if you do the pick-up interview on paper. PERSON INTERVIEWED? DIARY? SPECIAL DRIVING LONGEST
TICKETS? LICENCE JOURNEY
PERSON NAME AGE SEX IN 1 BY 1 NO PLACED 1 COM- PARTIAL NONE FULL i PROVIS NO. PERSON 1 PROXY 1 1 PLETE i -IONAL
1 1 1 2 I 3 1 i 1 2 3 1 i 2 : i
2 i 1 3 : i 1 2 1 ! 1 2 3 1 I 2
3 ! :
! I
1 2 1 3 1 1 2 3 1 I 2
4 1 : 1 2 I 3 1 I 1 2 ! 3 1 I 2 I
I 3 i
1 I 5 1 ! 2 1 i 1 2 3 1 ! 2
6 1 ! 2 i 3 1 ! 1 2 1 3 1 i 2 I :
I 3 : I I 7 1 I 2 1 i 1 2 3 1 2
I I
I I I 8 1 I 2 i 3 1 1 2 3 1 2
9 1 :
2 I 3 1 i 1 2 I 3 1 I 2 i
10 1 I 2 i 3 1 1 1 2 i 3 1 I 2
Keep track of all eligible vehicles in grid below (continue on separate sheet if necessary)
VEHICLE DETAILS COLLECTED NOTES
VEHICLE DESCRIPTION AT PLACEMENT AT RECALL NO.
1 1 2
2 1 2
3 1 2
4 1 2
5 1 2
6 1 2

National Centre for Social Research
366
DO NOT RETURN THIS PAGE – ENTER IN ADMINTHEN DETACH BEFORE RETURNING ARF
Observation Form
1. What kind of accommodation is it? 2. Did you - at any visit - observe acar in the drive?
House or bungalow: Yes, car in driveway 1Detached 1 No car in driveway 2
Semi-detached 2 No driveway 3
Go toQ.3
Terraced/End of terrace 3
Go toQ.2
Flat or maisonette:In a purpose-built block 4
Part of a converted house/otherkind of building 5
END3. Does the house/bungalow have a
garage or car-port?Room or rooms 6 END Yes 1Other: No 2 END
A caravan or mobile home 7 Not sure 3Houseboat 8
Some other kind of accommodation 9
END
Non-Response Form for Refusals(if non-contact, leave postal version)

National Centre for Social Research
367
1. How many cars or vans are owned, or available for use, by one or moremembers of your household, including yourself?Include any company car or van if available for private use.
None 0
One 1
Two 2
Three or more 3
2. Did the main householder do any paid work in the 7 days ending yesterday,either as an employee or as self-employed?
Yes GOTO Q3
1
No GOTO Q4
2
3. How does the main householder usually travel to work?
This question applies to the job in which main householder usually works the mosthours.
Tick one box only for the longest part, by distance, of the main householder’s usualjourney to work.
Works mainly at or from home01
Underground, metro, light rail, tram02
Train03
Bus, minibus or coach04
Motor cycle, scooter or moped05
Car or van06
Taxi/Minicab07
Bicycle08
On foot09
Other10
Please turn over

National Centre for Social Research
368
1
DO NOT RETURN THIS PAGE – ENTER IN ADMINTHEN DETACH BEFORE RETURNING ARF
Non-Response Form (continued)
4. And now thinking about yourself, did you leave the house at all yesterday,including for any walks of more than 50 yards?
YesGO TO Q5
No GO TO Q6
5. How many times did you leave the house yesterday?Include all outings by any method of transport, including walks if they are more than50 yards.
NUMBER OF TIMES LEFT HOME
6. RECORD DAY OF THE WEEK FOR YESTERDAY.
Mon Tue Wed Thur Fri Sat Sun 1 2 3 4 5 6 7
7. Could you just tell me how many people there are altogether in yourhousehold – including any children or babies?
TOTAL NUMBER IN HOUSEHOLD
8. ASK OR RECORD: And how many of these people are aged 17 or over?
NUMBER OF ADULTS AGED 17+
9. ASK OR RECORD: And of those aged 17 or over, how many are men and howmany are women?
NUMBER OF MEN AGED 17+
NUMBER OF WOMEN AGED 17+
10. RECORD SEX OF RESPONDENTMale 1
Female 2
2

National Centre for Social Research
369
11. What is your relationship to the main householder?
Tick one box only.
I am main householder END
Husband, wife or partner 2
Son, daughter, step-child, or foster child 3
Brother or sister 4
Mother, father, step-mother or step-father 5
Other related 6
Unrelated 7
12. ASK OR RECORD: What is the main householder’s sex?
Male 1
Female 2
1
GO TO Q12
END

National Centre for Social Research
370
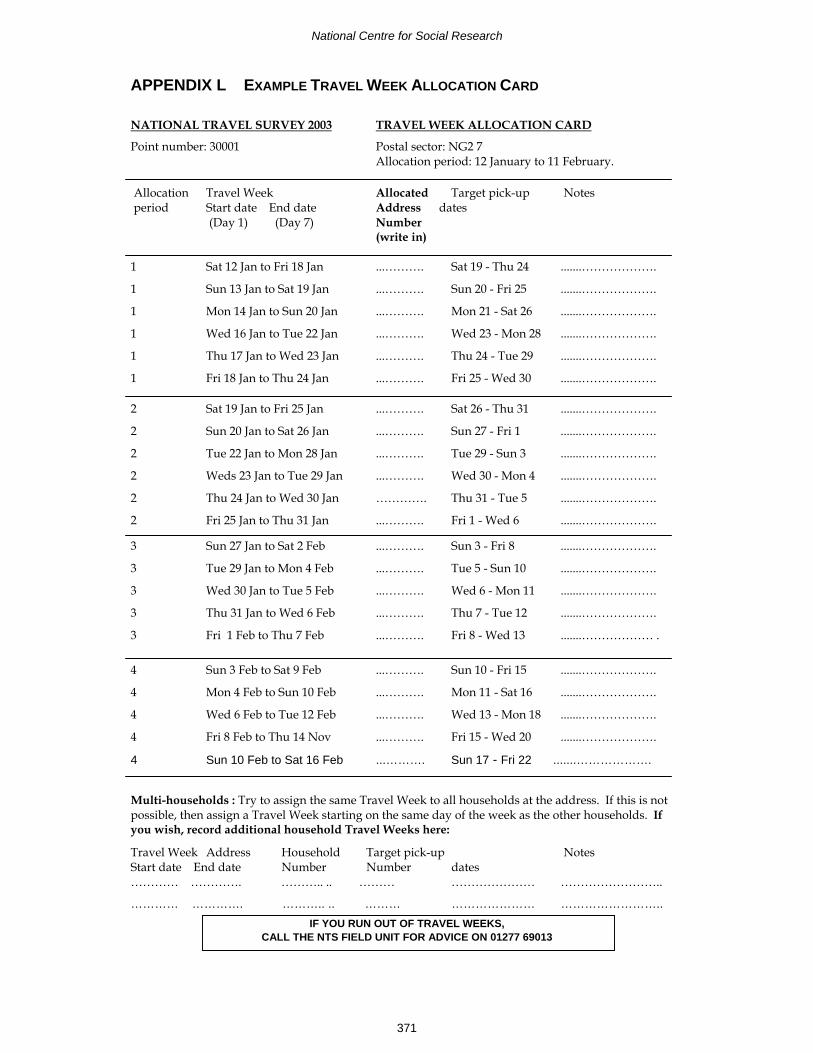
National Centre for Social Research
371
APPENDIX L EXAMPLE TRAVEL WEEK ALLOCATION CARD
NATIONAL TRAVEL SURVEY 2003 TRAVEL WEEK ALLOCATION CARD
Point number: 30001 Postal sector: NG2 7Allocation period: 12 January to 11 February.
Allocation Travel Week Allocated Target pick-up Notes period Start date End date Address dates (Day 1) (Day 7) Number
(write in)
1 Sat 12 Jan to Fri 18 Jan ...………. Sat 19 - Thu 24 .......……………….
1 Sun 13 Jan to Sat 19 Jan ...………. Sun 20 - Fri 25 .......……………….
1 Mon 14 Jan to Sun 20 Jan ...………. Mon 21 - Sat 26 .......……………….
1 Wed 16 Jan to Tue 22 Jan ...………. Wed 23 - Mon 28 .......……………….
1 Thu 17 Jan to Wed 23 Jan ...………. Thu 24 - Tue 29 .......……………….
1 Fri 18 Jan to Thu 24 Jan ...………. Fri 25 - Wed 30 .......……………….
2 Sat 19 Jan to Fri 25 Jan ...………. Sat 26 - Thu 31 .......……………….
2 Sun 20 Jan to Sat 26 Jan ...………. Sun 27 - Fri 1 .......……………….
2 Tue 22 Jan to Mon 28 Jan ...………. Tue 29 - Sun 3 .......……………….
2 Weds 23 Jan to Tue 29 Jan ...………. Wed 30 - Mon 4 .......……………….
2 Thu 24 Jan to Wed 30 Jan …………. Thu 31 - Tue 5 .......……………….
2 Fri 25 Jan to Thu 31 Jan ...………. Fri 1 - Wed 6 .......……………….
3 Sun 27 Jan to Sat 2 Feb ...………. Sun 3 - Fri 8 .......……………….
3 Tue 29 Jan to Mon 4 Feb ...………. Tue 5 - Sun 10 .......……………….
3 Wed 30 Jan to Tue 5 Feb ...………. Wed 6 - Mon 11 .......……………….
3 Thu 31 Jan to Wed 6 Feb ...………. Thu 7 - Tue 12 .......……………….
3 Fri 1 Feb to Thu 7 Feb ...………. Fri 8 - Wed 13 .......……………… .
4 Sun 3 Feb to Sat 9 Feb ...………. Sun 10 - Fri 15 .......……………….
4 Mon 4 Feb to Sun 10 Feb ...………. Mon 11 - Sat 16 .......……………….
4 Wed 6 Feb to Tue 12 Feb ...………. Wed 13 - Mon 18 .......……………….
4 Fri 8 Feb to Thu 14 Nov ...………. Fri 15 - Wed 20 .......……………….
4 Sun 10 Feb to Sat 16 Feb ...………. Sun 17 - Fri 22 .......……………….
Multi-households : Try to assign the same Travel Week to all households at the address. If this is notpossible, then assign a Travel Week starting on the same day of the week as the other households. Ifyou wish, record additional household Travel Weeks here:
Travel Week Address Household Target pick-up NotesStart date End date Number Number dates………… …………. ……….. .. ……… ………………… ……………………..
………… …………. ……….. .. ……… ………………… ……………………..IF YOU RUN OUT OF TRAVEL WEEKS,
CALL THE NTS FIELD UNIT FOR ADVICE ON 01277 69013

National Centre for Social Research
372

National Centre for Social Research
373
APPENDIX M PROMISSORY NOTE
National Travel Survey 2003
As a way of saying thank you to everyone in your household for completing theNational Travel Survey, NatCen promises to send you _____ £5 gift vouchers.
You do not have to do anything to claim your gift vouchers. They will be sent to youautomatically and you should receive them within 4 weeks. If you do not receive thevouchers, please contact Marian Bolden or Sue Hobbs at NatCen on 01277 690043.
Once again, thank you for taking part in the National Travel Survey 2003. Theinformation collected from you will be used to produce statistics on travelling in GreatBritain and will help with future transport plans and policies.
________________________________ (Interviewer) _ _ /_ _ /_ _(Date)
P2320