septa covid-19 travel survey
TRANSCRIPT

SEPTA COVID-19 Travel Survey
August 19, 2020

SEPTA COVID-19 Travel SurveySEPTA COVID-19 Travel Survey
SEPTA COVID-19 Travel SurveyMethodology
• Data collected from July 1 through July 28• 2,700 riders completed surveys• Riders were invited to participate in the
survey through: • SEPTA.org• SEPTA social media channels• Emails to previous survey
participants• Partner organization outreach (CCD,
UCD, UPENN, etc.)• The survey was available in English,
Spanish and Chinese• Data is weighted by mode ridership and
demographics to be more representative of the actual rider population
Mode Counts* Total
Broad Street Line 969
Market-Frankford Line 1,343
Bus 1,425
Trolley 633
Norristown High Speed Line 163
Regional Rail 1,225* Sum of modes is more than total completed survey count due to multi-modal riders
2

SEPTA COVID-19 Travel SurveySEPTA COVID-19 Travel Survey
SEPTA COVID-19 Travel SurveyKey Findings
• Overall, riders rated SEPTA’s performance during COVID-19 at 3.28 on average on a scale of 1 to 5 which is very slightly above average
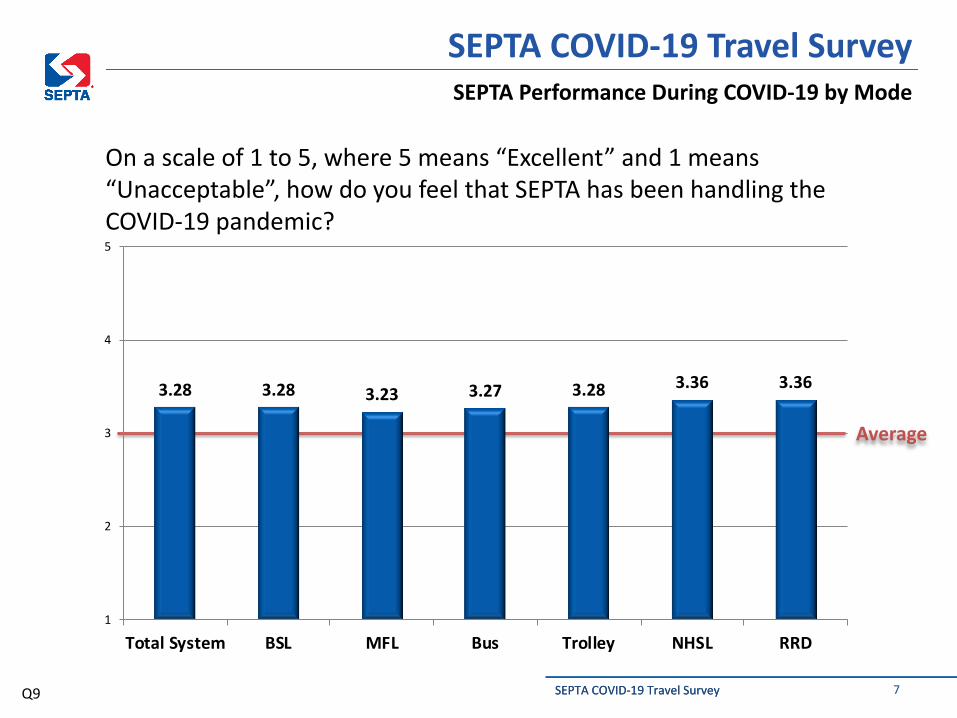
• Mode performance score averages range from 3.23 for MFL to 3.36 for RRD
• Mask policy enforcement and related communication should be an area of strategic focus
• This was identified as the most critical factor for SEPTA to improve
• Issues related to crowding- service frequency and social distancing policy- are also important areas riders identified
3

SEPTA COVID-19 Travel SurveySEPTA COVID-19 Travel Survey
SEPTA COVID-19 Travel SurveyKey Findings
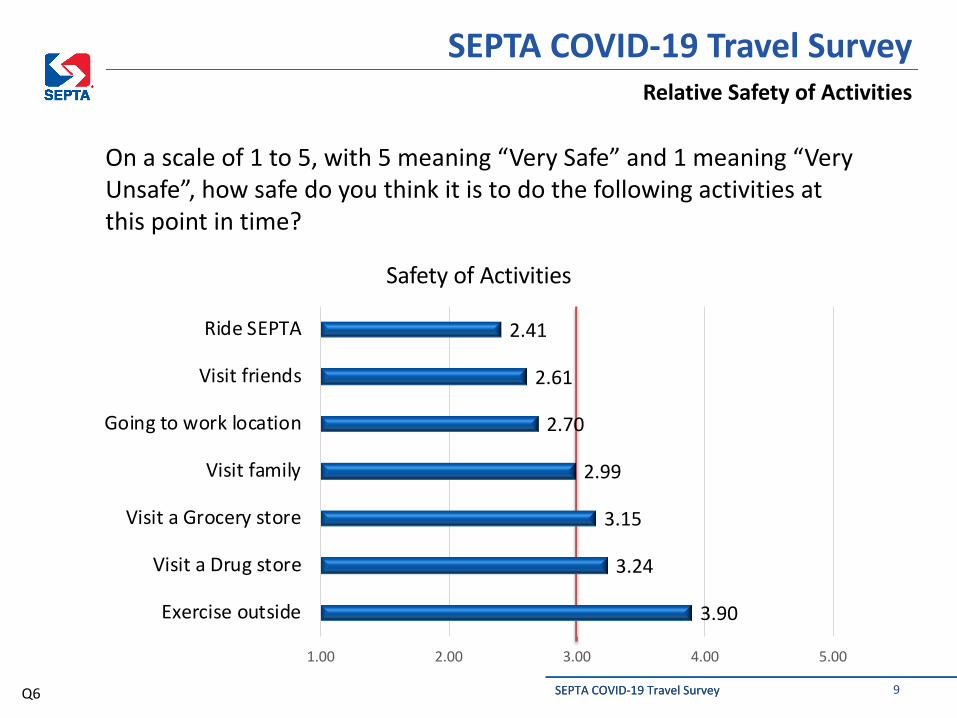
• Riders by and large do not consider riding transit to be a safe activity
• Customers rated riding SEPTA 2.41 on a safety scale of 1 – 5, the lowest rated activity we asked about
• That said, many practices that SEPTA has implemented or is considering implementing are well received by riders
• Asked about future events that may cause riders to return to public life, “an effective vaccine” and/or a “robust track & trace program” were the only events that makes the average rider feel comfortable
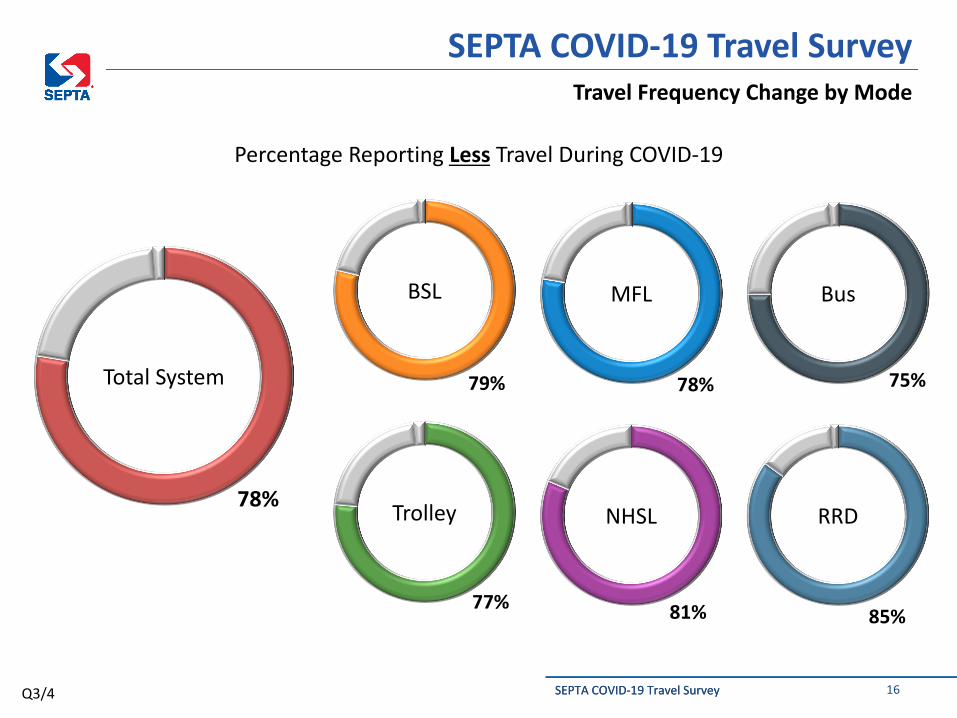
• Riders report sharp declines in travel frequency
• Overall, 78% of riders are traveling less during COVID-19• Suburban modes such as NHSL and RRD experienced the sharpest
reductions with 81% and 85%, respectively, reporting less travel
4
SEPTA COVID-19 Travel SurveySEPTA COVID-19 Travel Survey
SEPTA COVID-19 Travel SurveyKey Findings
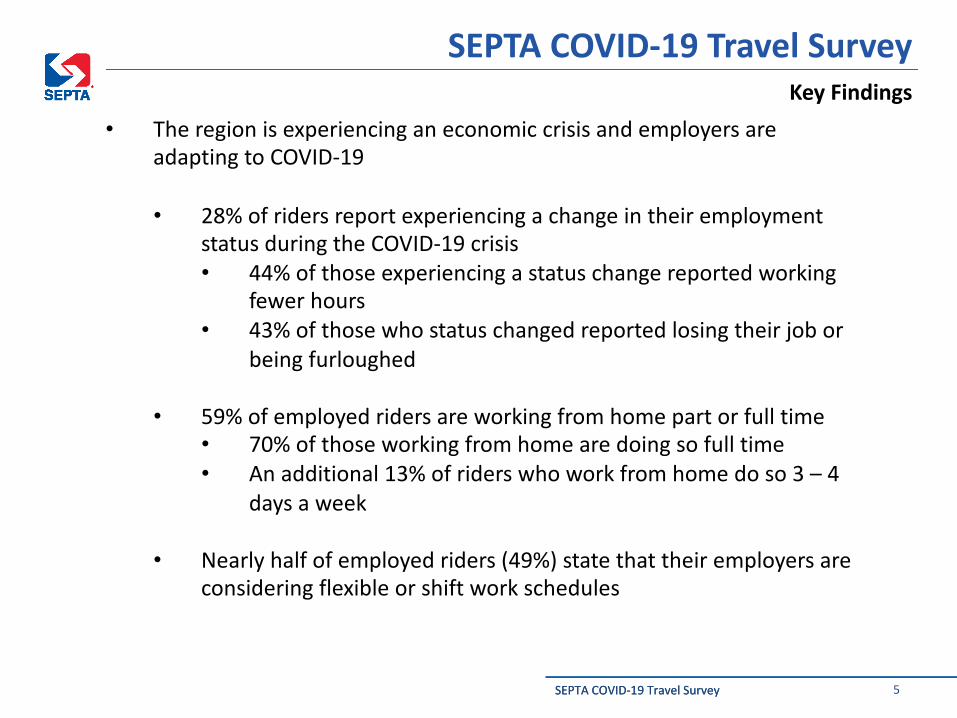
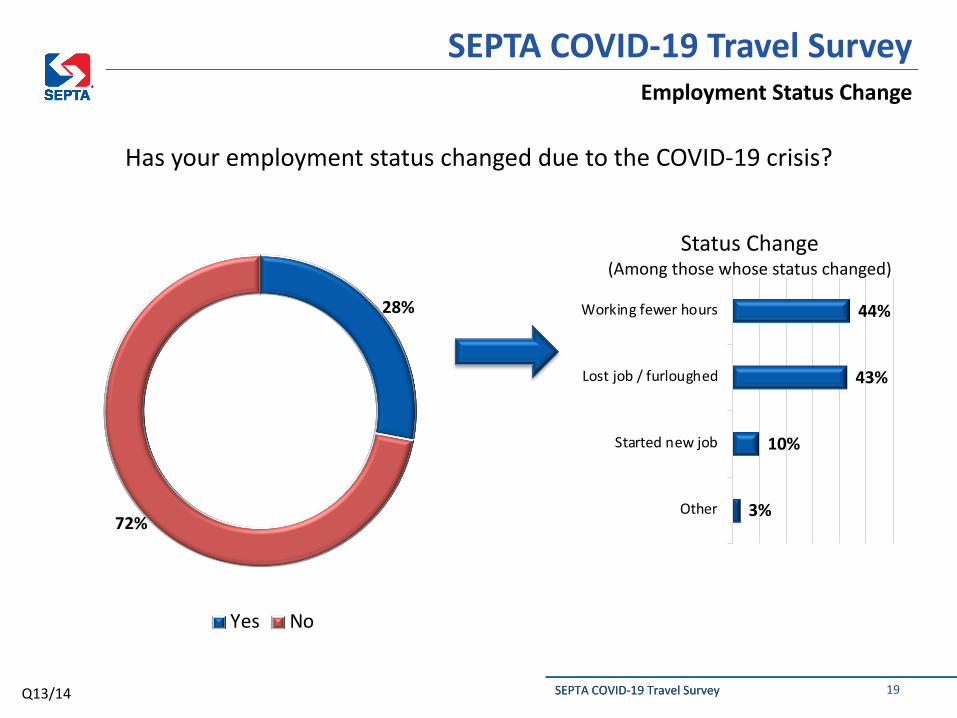
• The region is experiencing an economic crisis and employers are adapting to COVID-19
• 28% of riders report experiencing a change in their employment status during the COVID-19 crisis• 44% of those experiencing a status change reported working
fewer hours• 43% of those who status changed reported losing their job or
being furloughed
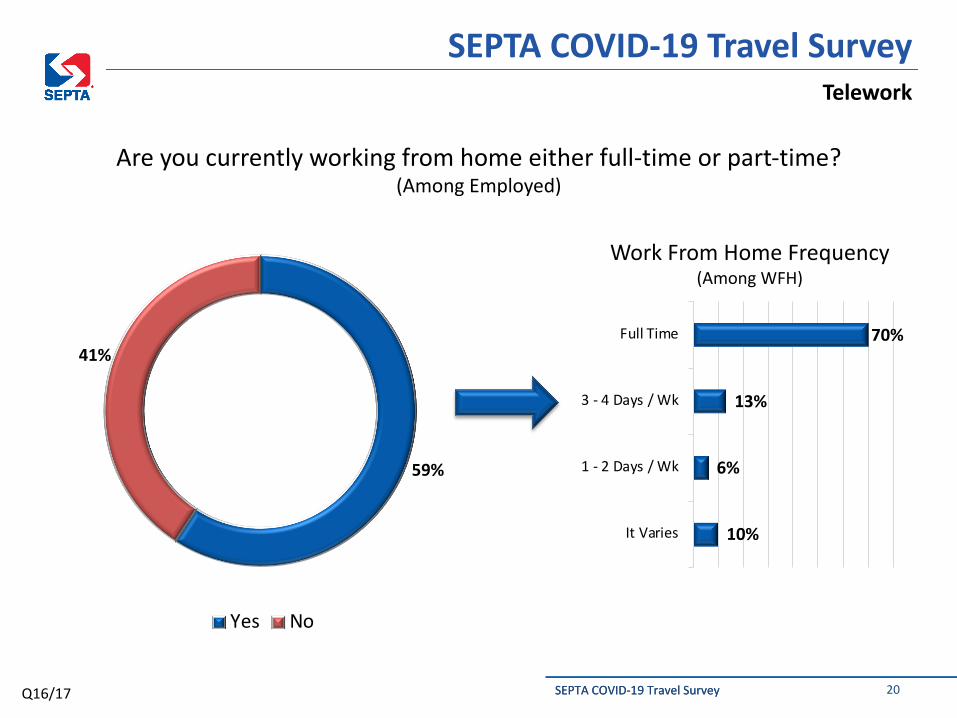
• 59% of employed riders are working from home part or full time• 70% of those working from home are doing so full time• An additional 13% of riders who work from home do so 3 – 4
days a week
• Nearly half of employed riders (49%) state that their employers are considering flexible or shift work schedules
5

SEPTA COVID-19 Travel SurveySEPTA COVID-19 Travel SurveyQ9
On a scale of 1 to 5, where 5 means “Excellent” and 1 means “Unacceptable”, how do you feel that SEPTA has been handling the COVID-19 pandemic?
5%
13%
40%
33%
9%
Unacceptable- 1
Poor- 2
Average- 3
Good- 4
Excellent- 5
SEPTA Performance Ratings
SEPTA COVID-19 Travel SurveySEPTA Performance During COVID-19
42%
18%
Mean3.28
6
SEPTA COVID-19 Travel Survey
Average
SEPTA COVID-19 Travel Survey
SEPTA COVID-19 Travel SurveySEPTA Performance During COVID-19 by Mode
On a scale of 1 to 5, where 5 means “Excellent” and 1 means “Unacceptable”, how do you feel that SEPTA has been handling the COVID-19 pandemic?
3.28 3.28 3.23 3.27 3.28 3.36 3.36
Total System BSL MFL Bus Trolley NHSL RRD1
2
3
4
5
Q9 7

SEPTA COVID-19 Travel SurveySEPTA COVID-19 Travel Survey
SEPTA COVID-19 Travel SurveyTop 10 Areas for Improvement
Q10
3%
3%
4%
4%
5%
7%
10%
12%
16%
34%
Vulnerable Population Issues
Thanks / Complimentary
Rider Behavior
Employee Safety
Communication
Policy Enforcement: Capacity Limits
Cleaning/Sanitizing
Policy Enforcement: Social Distancing
Service Frequency
Policy Enforcement: Masks
How do you feel SEPTA can improve in this regard?
8
SEPTA COVID-19 Travel SurveySEPTA COVID-19 Travel Survey
SEPTA COVID-19 Travel SurveyRelative Safety of Activities
On a scale of 1 to 5, with 5 meaning “Very Safe” and 1 meaning “Very Unsafe”, how safe do you think it is to do the following activities at this point in time?
3.90
3.24
3.15
2.99
2.70
2.61
2.41
1.00 2.00 3.00 4.00 5.00
Exercise outside
Visit a Drug store
Visit a Grocery store
Visit family
Going to work location
Visit friends
Ride SEPTA
Safety of Activities
Q6 9

SEPTA COVID-19 Travel SurveySEPTA COVID-19 Travel Survey
SEPTA COVID-19 Travel SurveyFactors Impacting Travel Decision- Rankings
Please rank the following factors in order of importance from 1 to 6, with 1 being the “most important” and 6 being the “least important” factor, in your decision whether or not to use SEPTA services?
34%
17%15% 15%
13%
6%
Masks worn byriders &
employees
Convenient orfrequent service
Cleanliness Safety andpersonal security
Ability to sociallydistance
Behavior of otherriders
0%
10%
20%
30%
40%
Percent Ranked #1
Q5 10
SEPTA COVID-19 Travel SurveySEPTA COVID-19 Travel Survey
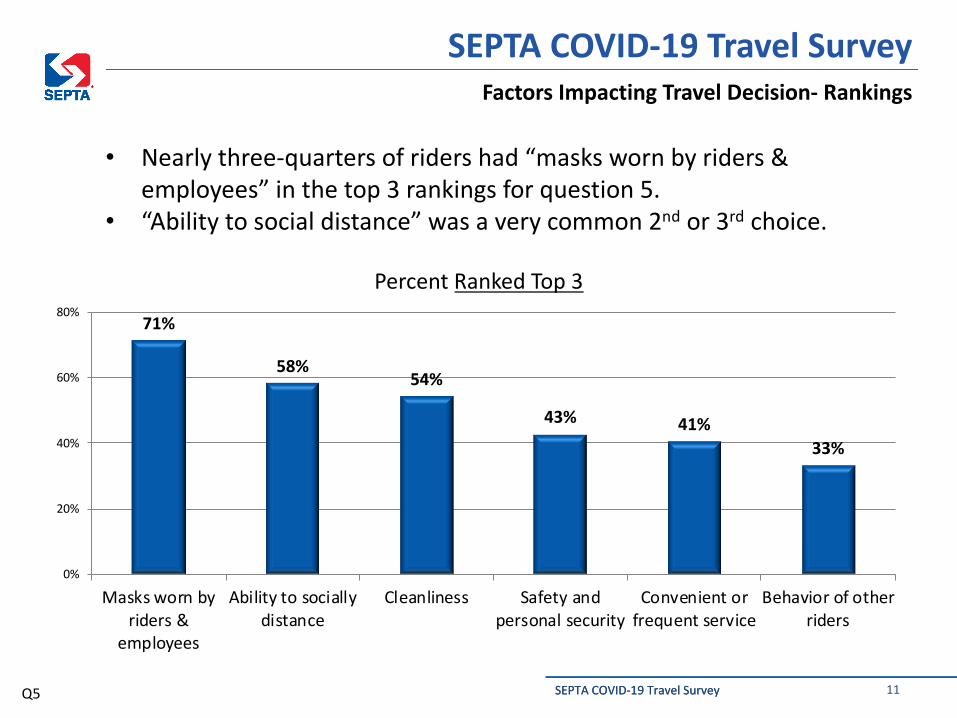
SEPTA COVID-19 Travel SurveyFactors Impacting Travel Decision- Rankings
• Nearly three-quarters of riders had “masks worn by riders & employees” in the top 3 rankings for question 5.
• “Ability to social distance” was a very common 2nd or 3rd choice.
71%
58%54%
43% 41%33%
Masks worn byriders &
employees
Ability to sociallydistance
Cleanliness Safety andpersonal security
Convenient orfrequent service
Behavior of otherriders
0%
20%
40%
60%
80%
Percent Ranked Top 3
Q5 11

SEPTA COVID-19 Travel SurveySEPTA COVID-19 Travel Survey
SEPTA COVID-19 Travel SurveyImpact of New SEPTA Practices- Top Ten Practices
If SEPTA adopted the below practices, how likely would you be to ride public transportation on a scale of 1 to 5, with 5 being “Definitely Would Ride SEPTA” and 1 being “Definitely Would Not Ride SEPTA”?
4.004.004.014.024.024.064.084.11
4.224.23
1.00 2.00 3.00 4.00 5.00
Hand sanitizer on vehicles
Block off seating to social distance
Ultraviolet (UV-C) light cleanings
COVID-19 testing for employees
Frequent changing of air filters on buses
Real-time passenger counts
Capacity limits- social distance
Sanitize high-touch surfaces
Masks requirement for all riders and employees
Provide more frequent service - prevent crowding
Average Likelihood to Travel- Top Ten Practices
Q8 12
SEPTA COVID-19 Travel SurveySEPTA COVID-19 Travel Survey
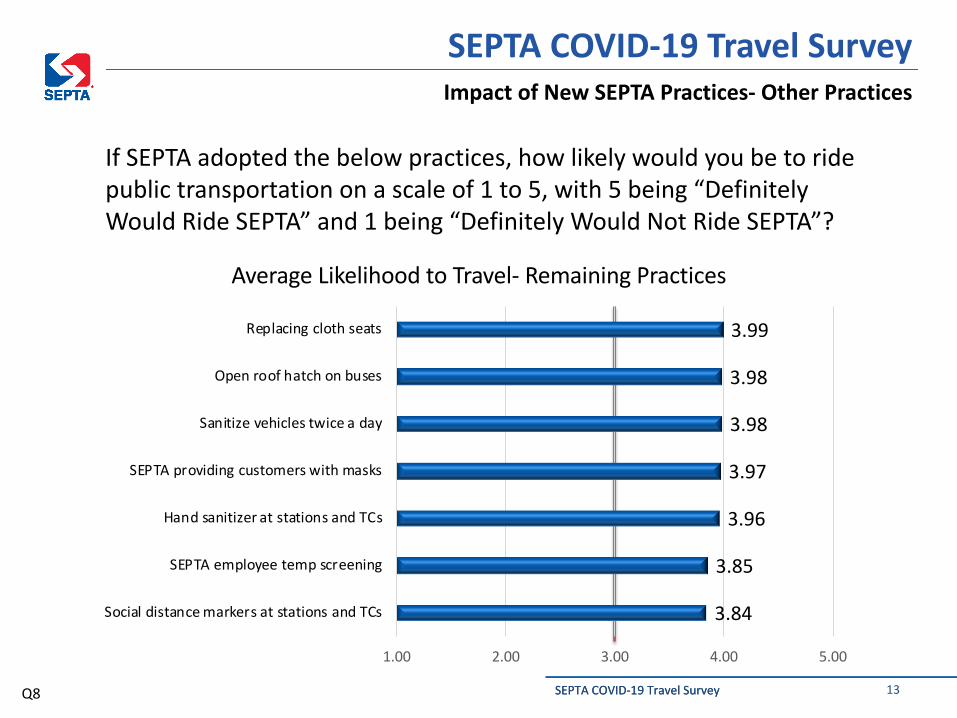
SEPTA COVID-19 Travel SurveyImpact of New SEPTA Practices- Other Practices
If SEPTA adopted the below practices, how likely would you be to ride public transportation on a scale of 1 to 5, with 5 being “Definitely Would Ride SEPTA” and 1 being “Definitely Would Not Ride SEPTA”?
3.84
3.85
3.96
3.97
3.98
3.98
3.99
1.00 2.00 3.00 4.00 5.00
Social distance markers at stations and TCs
SEPTA employee temp screening
Hand sanitizer at stations and TCs
SEPTA providing customers with masks
Sanitize vehicles twice a day
Open roof hatch on buses
Replacing cloth seats
Average Likelihood to Travel- Remaining Practices
Q8 13

SEPTA COVID-19 Travel SurveySEPTA COVID-19 Travel Survey
SEPTA COVID-19 Travel SurveyCurrent & Future Events Impact on Safety
On a scale of 1 to 5, with 5 meaning “Very Safe” and 1 meaning “Very Unsafe”, how would you rate each of the following events in terms of making you feel safe returning to work or being in public again?
2.12
2.56
2.72
2.96
3.42
3.73
1.00 2.00 3.00 4.00 5.00
Public schools re-open
Governor announces SE PA entered green phase
Your employer announces "safe to return"
CDC announces "safe to return" to work
Robust "track & trace" program implemented
An effective vaccine is available
Safety Returning to Work/Being in Public
Q7 14

SEPTA COVID-19 Travel SurveySEPTA COVID-19 Travel Survey
SEPTA COVID-19 Travel SurveyTravel Frequency Comparison
How frequently did/do you travel on SEPTA?
0%
1%
1%
4%
2%
10%
36%
46%
Do not Travel on SEPTA
Less than monthly
Once a month
A few times a month
One day a week
2 -3 days a week
4 -5 days a week
6 -7 days a week
39%
7%
2%
9%
4%
13%
14%
11%
78%
21%
1%
Pre-COVID-19 Change in Travel Frequency
Post-COVID-19
Traveling Less Traveling the Same
Traveling More
82% 25%
2% 48%
Q3/4 15
SEPTA COVID-19 Travel SurveySEPTA COVID-19 Travel Survey
SEPTA COVID-19 Travel SurveyTravel Frequency Change by Mode
78%
Total System 79% 78% 75%
BSL MFL Bus
77% 81% 85%
Trolley NHSL RRD
Percentage Reporting Less Travel During COVID-19
Q3/4 16

SEPTA COVID-19 Travel SurveySEPTA COVID-19 Travel Survey
SEPTA COVID-19 Travel SurveyTravel Frequency Change by Car Ownership
How frequently did/do you travel on SEPTA?
Traveling Less Traveling the Same
Traveling More
Q3/4 17
70%
29%
1%
Do Not Own/HaveAccess to Car
88%
10%1%
Own/Have Accessto Car

SEPTA COVID-19 Travel SurveySEPTA COVID-19 Travel Survey
SEPTA COVID-19 Travel SurveyEmployment Status
What is your current employment status?
61%
14%6% 6% 4% 3% 2% 2% 0.5% 4%
Employed fu
ll tim
e
Employed part
time
Unemployed & lo
oking
Retired
Student
Self-e
mployed
Unable to w
ork
Unemployed & not lo
oking
Homemaker
Other (please sp
ecify)
0%
20%
40%
60%
80%
Employment Status
Q5 18
SEPTA COVID-19 Travel SurveySEPTA COVID-19 Travel Survey
SEPTA COVID-19 Travel SurveyEmployment Status Change
Has your employment status changed due to the COVID-19 crisis?
28%
72%
Yes No
3%
10%
43%
44%
Other
Started new job
Lost job / furloughed
Working fewer hours
Status Change(Among those whose status changed)
Q13/14 19
SEPTA COVID-19 Travel SurveySEPTA COVID-19 Travel Survey
SEPTA COVID-19 Travel SurveyTelework
Are you currently working from home either full-time or part-time?(Among Employed)
59%
41%
Yes No
10%
6%
13%
70%
It Varies
1 - 2 Days / Wk
3 - 4 Days / Wk
Full Time
Work From Home Frequency(Among WFH)
Q16/17 20

SEPTA COVID-19 Travel SurveySEPTA COVID-19 Travel Survey
SEPTA COVID-19 Travel SurveyFlexible/Shift Work Schedules
Is your employer encouraging flexible or shift work schedules?(Among Employed)
49%
36%
15%
Yes No Not sure
Q18 21
SEPTA COVID-19 Travel Survey
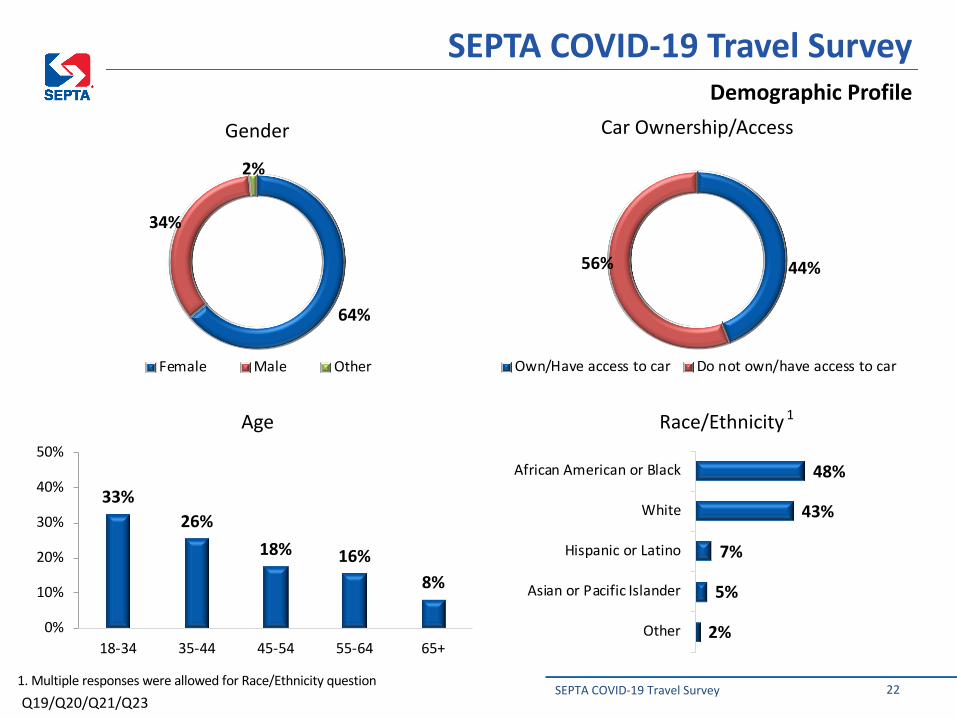
44%56%
Car Ownership/Access
Own/Have access to car Do not own/have access to car
2%
5%
7%
43%
48%
Other
Asian or Pacific Islander
Hispanic or Latino
White
African American or Black
Race/Ethnicity
33%26%
18% 16%8%
0%
10%
20%
30%
40%
50%
18-34 35-44 45-54 55-64 65+
Age
1. Multiple responses were allowed for Race/Ethnicity question
1
SEPTA COVID-19 Travel SurveyDemographic Profile
64%
34%
2%
Gender
Female Male Other
22Q19/Q20/Q21/Q23

SEPTA COVID-19 Travel Survey
Thank you!
23