native fish conservation program 2012-2014 …native fish conservation program 2012-2014 wyoming,...
TRANSCRIPT

Yellowstone National Park Native Fish Conservation Program 2012-2014 Wyoming Montana Idaho
Yellowstone Center for Resources National Park Service
Department of the Interior
YELLOWSTONE FISHERIES amp AQUATIC SCIENCES
Native FishCoNservatioN
Pro gram
2012-2014
Carrington Island in Yellowstone Lake is known as a significant lake trout spawning area because of the rock cobble substrate
ON THE COVER NPS Fisheries staff developing alternative methods to suppress lake trout fry and embryos in spawning areas around Snipe Point
Native Fish Conservation Program
YELLOWSTONE FISHERIES amp AQUATIC
SCIENCES 2012-2014
Todd M Koel Jeffrey L Arnold Patricia E Bigelow Colleen R Detjens Phillip D Doepke Brian D Ertel amp Michael E Ruhl
National Park Service Yellowstone Center for Resources
Yellowstone National Park Wyoming
YCR-2015-01
Suggested citation Koel TM JL Arnold PE Bigelow CR Detjens PD Doepke BD Ertel and ME Ruhl 2015Native Fish Conservation Program Yellowstone Fisheries amp Aquatic Sciences 2012-2014 Yellowstone National Park National Park Service Yellowstone Center for Resources Yellowstone National Park Wyoming USA YCR-2015-01
All photos are NPS unless noted otherwise
Lake trout captured by large live entrapment nets are sorted into bins for removal Cutthroat trout are returned to Yellowstone Lake - Photo copyScott Heppel
N a t i v e F i s h C o n s e r v a t i o n P r o g r a m | 5
ContentsBackground 6 Summary 7 Conservation Actions to Restore Yellowstone Lake 10Monitoring Performance Metrics on Yellowstone Lake 18 Restoration of Cutthroat Trout amp Arctic Grayling in Streams 26 Through a Biologistrsquos Eyes 34 Aquatic Ecological Monitoring amp Assessment 38 Public Involvement 47 Acknowledgments 50 Literature Cited 52 Appendix 54
NPS Patriot used for gillnetting operations in Yellowstone Lake
6 | Ye l l o w s t o n e F i s h e r i e s amp A q u a t i c S c i e n c e s 2 0 1 2 - 2 0 1 4
BackgroundSignificant threats to the long-term persistence of native fish in Yellowstone National Park have emerged over the past two decades Nonnative predatory lake trout and exshyotic whirling disease were introduced to the vast seemingshyly secure Yellowstone Lake ecosystem home to the largest remaining concentration of Yellowstone cutthroat trout In the early 2000s the impacts of an expanding lake trout population and an increasing prevalence in whirling disease coincided with drought resulting in a precipitous decrease in cutthroat trout Cascading effects throughout the ecoshysystem have been documented grizzly bears are now selshydom seen on cutthroat trout spawning tributaries and few ospreys prey on cutthroat trout near the lakersquos surface or nest in adjacent trees
Coinciding with the decrease in cutthroat trout numbers in Yellowstone Lake were changes in another previous stronghold for this species the Lamar River Rainbow trout which were introduced by park managers in the early1900s had historically remained in the Yellowstone River below the falls at Canyon and downstream of the Lamar River and Slough Creek cascades In the early 2000s howshyever anglers more frequently reported catches of rainbow trout upstream of these cascades Rainbow trout are a close relative that can hybridize with cutthroat trout As a result their increasing distribution raised concerns about the security of Yellowstone cutthroat trout in the upper Lashymar River system Since 2002 rainbow trout and rainbow troutndashcutthroat trout hybrids have been caught as far upshystream as the third meadow of Slough Creek (at the parkrsquos north boundary) and in upper Soda Butte Creek upstream of Ice Box Canyon
Yellowstonersquos native fish support natural food webs conshytribute significantly to the local economy provide unparshyalleled visitor experiences and define much of the parkrsquos 20th century historical context As a result the National Park Service (NPS) is taking actions to reverse decreasing trends in native fish populations and associated losses ofecosystem function A parkwide Native Fish Conservation Plan (Koel et al 2010b) was completed in 2011 over time
its implementation should restore the ecological role of nashytive species such as fluvial (ie river dwelling) Arctic grayling westslope cutthroat trout and Yellowstone cutthroat trout while ensuring sustainable angling and viewing opportunishyties for visitors
This report documents the conservation actions long-term monitoring and assessments made to conserve Yellowshystonersquos native fish by the NPS and its collaborators during 2012 through 2014 This and previous annual reports are available in electronic format at the Yellowstone National Park website (httpwwwnpsgovyellplanyourvisitfishreshyportshtm)
Hickey Brothers Research LLC and NPS staff conduct contract lake trout suppression with a large live-entrapshyment net
N a t i v e F i s h C o n s e r v a t i o n P r o g r a m | 7
SummaryEfforts to restore cutthroat trout and the ecology of the Yelshylowstone Lake ecosystem focused on the suppression ofnonnative lake trout via gillnetting Crews from the NPS and Hickey Brothers Research LLC increased gillnet effort from 46110 units in 2012 to 74640 units in 2014 One unit of effort is defined as 100 meters of gillnet fishing for one night Catch-per-unit-effort with gillnets decreased from 63 in 2012 to 48 in 2013 and 37 in 2014 Also 10 large live-entrapment nets were set in 2012 and 2013 for about 880 net-nights The combined total suppression effort reshymoved more than 300000 lake trout in 2012 and 2013 and another 277000 in 2014 About one-half of the 17 million lake trout killed since 1994 were captured in the past three years The catch of lake trout has not increased linearlywith increasing effort suggesting the number of lake trout is decreasing In turn predation of cutthroat trout by lake trout should have been substantially reduced by this intense netting effort
Progress toward cutthroat trout recovery and the achieveshyment of desired conditions for Yellowstone Lake were asshysessed through monitoring efforts A strong pulse of jushyvenile cutthroat trout was detected entering the system The average catch of cutthroat trout per 100-meter net inshycreased from 22 in 2012 to 26 in 2013 and 31 in 2014 These catches were among the highest since 1995 and substanshytial increases over the low catch of 13 cutthroat trout per 100-meter net in 2010 These catches suggest the cutthroat trout population is responding positively to improved conshyditions within the Yellowstone Lake system
Efforts to preserve Yellowstone cutthroat trout outside ofYellowstone Lake ecosystem were focused in the northeastshyern region of Yellowstone National Park A bedrock falls in Ice Box Canyon was modified in 2013 to prevent further invasion of upper Soda Butte Creek by nonnative rainbow trout The design and engineering of barriers for Slough Creek and upper Lamar River were also completed Efforts to remove nonnative brook trout and rainbow trout from Slough and Soda Butte creeks and the Lamar River continshyued using electrofishing and targeted angling Small tribushytaries of the Yellowstone River near its confluence with Lashy
mar River continue to harbor brook trout at high densities Thus the Elk Yanceys and Lost Creek stream complexes were treated with rotenone during 2012 through 2014 to remove existing nonnative fish These tributaries will be reshystocked with native Yellowstone cutthroat trout
Recovery efforts for westslope cutthroat trout focused on restoring this native species to East Fork Specimen Creek Grayling Creek and the Goose Lake chain of lakes Apshyproximately 3550 westslope cutthroat trout eggs were collected from Geode Creek in 2012 reared at the Sun Ranch Hatchery and then stocked in incubators in East Fork Specimen Creek where most eggs hatched fry into the stream Also an existing waterfall on lower Grayling Creek was modified during 2012 and 2013 to prevent upshystream movement of nonnative fish The Grayling Creek watershed was then treated with rotenone during 2013 and 2014 Restocking of the watershed with native fluvial Arctic grayling and westslope cutthroat trout will begin in 2015 In addition nonnative rainbow trout were removed from the Goose Lake chain of lakes and connecting streams in 2011 Westslope cutthroat trout fry were then stocked in Goose Lake to create an easily-accessible genetically-pure brood source for future restoration efforts Approximately 3400 fry were stocked in 2013 and 1900 in 2014
NATIVE FISH CONSERVATION PLAN To implement actions that will facilitate the recovery of nashytive fish and restoration of natural ecosystem functions a Native Fish Conservation PlanEnvironmental Assessment was completed in 2011 (httpparkplanningnpsgovpro-jectHomecfmprojectID=30504)
Goals of the plan include the bull reduction of long-term extinction risk for fluvial Arcshy
tic grayling westslope cutthroat trout and Yellowstone cutthroat trout
bull restoration and maintenance of important ecological roles for native fish and
bull creation of sustainable native fish angling and viewing opportunities for the public
8 | Ye l l o w s t o n e F i s h e r i e s amp A q u a t i c S c i e n c e s 2 0 1 2 - 2 0 1 4
The plan describes benchmarks for nonnative lake trout supshypression as well as an adaptive management strategy for fushyture actions on Yellowstone Lake and in streams and lakes elsewhere across the park In addition the plan describes the development and implementation of robust monitoring and scientific review through collaboration with partners
Adaptive management is an integral component of the Nashytive Fish Conservation Program The adaptive management approach includes statistically valid long-term monitoring to evaluate the effectiveness of conservation actions This apshyproach was chosen because of the varied environments and stressors impacting native fish across the park and the unshycertainty regarding possible responses by native fish to manshyagement actions For example initial science indicates that lake trout expansion in Yellowstone Lake could be curtailed by inflicting an annual total mortality of 60 (see Native Fish Conservation Plan httpgonpsgovYellowstone_Na-tive_Fish_Conservation_Plan) However it is uncertain how long this mortality level must be maintained to meet lake
trout suppression goals Also the rate of cutthroat trout reshycovery in Yellowstone Lake after the population is released from lake trout impacts is uncertain Therefore an adaptive management approach to fish conservation that takes into consideration performance metrics such as the abundance of spawning cutthroat trout in tributary streams and angler success is necessary to progress towards desired conditions
The parkrsquos surface waters are considered in two domains for the purposes of native fish conservation actions 1) the Yelshylowstone Lake river and tributaries upstream of the Upper Falls at Canyon and 2) all other streams rivers and lakes within park boundaries (figure 1) A hierarchical series ofdesired conditions was developed for each of these domains (see Native Fish Conservation Plan tables 5 and 6) Each deshysired condition represents a hypothesized outcome for native fish given the initial state of the system and applied conservashytion actions Monitoring is being conducted to determine ifperformance metrics are met and conservation actions influshyence native fish as predicted
Many of the young cutthroat trout returning to Yellowstone Lake are likely coming from this large remote watershyshed in the southeastern region of the park
N a t i v e F i s h C o n s e r v a t i o n P r o g r a m | 9
Figure 1 Major watersheds and surface waters of Yellowstone National Park with sites established for long-term water quality (WQ) monitoring on streams and Yellowstone Lake Areas sampled for aquatic invertebrates are also shown
1 0 | Ye l l o w s t o n e F i s h e r i e s amp A q u a t i c S c i e n c e s 2 0 1 2 - 2 0 1 4
Conservation Actions to Restore Yellowstone Lake
Suppression of lake trout eggs using an electroshocking grid
Lake trout were intentionally stocked in Lewis and Shoshone lakes in 1890 by the US Fish Commission and later introshyduced into Yellowstone Lake by an unknown source (Varleyand Schullery 1995a Varley and Schullery 1998 Munro et al 2005) They are a serious threat to the native Yellowstone cutthroat trout population as a result the NPS has worked to suppress lake trout since the species was detected in Yellowshystone Lake in 1994 (Koel et al 2005) Although over 17 milshylion lake trout have been netted from the lake catches have generally increased each year
Lake Trout Suppression Netting In 2012 and 2013 Yellowstone Lake became sufficiently ice-free to begin netting in mid-May and continued through mid-October In 2014 ice melted later than usual so netshyting began at the end of May Over the last three years the total effort of suppression netting has been substantiallyincreased The NPS and contract fishing crews completed 46112 units of gillnet effort in 2012 62090 units in 2013 and 74641 in 2014 This represents a 178 increase over gillnet effort in 2011 One unit of effort is defined as 100 meters ofgillnet fishing for one night This increase was possible due
to increased use of the contractor-owned fishing vessels (Kokanee Patriot Northwester) along with the NPS vessels (Freedom Hammerhead)
Approximately 40 of the total gillnetting effort and 43 ofthe total lake trout gillnet catch occurred in the West Thumb region of Yellowstone Lake in 2012 an area which comprisshyes less than 12 of the lakersquos surface area (figure 2) With increases in netting effort nets were more widely dispersed throughout the lake including into the southern arms of the lake As a result only 30 and 26 of the total gillnet effort occurred in West Thumb in 2013 and 2014 respectively (figshyure 2) However West Thumb netting still yielded a disproshyportionately higher catch compared to the rest of the lake 43 and 35 of the catch in 2013 and 2014 respectively In addition to gillnetting the contracted netters also used 10 large live-entrapment nets in 2012 and 2013 resulting in 879 and 872 net nights of effort respectively
The combined total suppression effort removed 302000 lake trout from Yellowstone Lake in 2012 301000 lake trout in 2013 and 277000 lake trout in 2014 (figure 3) Catch-pershy
0
50
N a t i v e F i s h C o n s e r v a t i o n P r o g r a m | 1 1
Gillnets
Figure 2 Area of Yellowstone Lake within (red) and outside (green) of proposed wilderness that is at water depths (lt 60 m) suitable for gillnetting lake trout Black lines indicate gillnet set locations 2012-2014
5350 9
Tot
alL
ake
Tro
ut
Net
ted
(x10
00
)
45 8300
Average C
atch per 10
0m
N
et each N
ight
47
Bio
mas
s N
ette
dK
gH
ecta
re 35 250
6 3200 5
25 4150 23
100 15 2 11
05 0 0
200
12
002
200
32
004
200
52
006
200
72
008
200
92
010
201
12
012
201
32
014
1995 2000 2005 2010 2015 Total netted Catch-per-unit-effort
Figure 3 Number of lake trout removed from 2001 to 2014 The red line represents total catch-per-unit-effort (100 meter netnight for gillnets)
unit-effort for suppression gillnetting which had been inshycreasing each year since 2002 decreased from 82 in 2011 to 37 in 2014 (figure 3) Similarly estimated total biomass oflake trout removed from the population had been increasing
Figure 4 Total estimated lake trout biomass netted from Yellowstone Lake by all gear types 1995-2014
exponentially since the programrsquos inception but decreased from 44 kilograms of lake trout per hectare in 2012 to 39 kilograms of lake trout per hectare in 2014 (table 1 figure 4) Recent estimates of more than 4 kilograms of lake trout per hectare removed from the lake are well above reported susshytainable yields of less than 10 kilogram per hectare observed
1 2 | Ye l l o w s t o n e F i s h e r i e s amp A q u a t i c S c i e n c e s 2 0 1 2 - 2 0 1 4
Table 1 Estimated biomass (kilograms) of lake trout killed by small and large mesh gillnetting and live-entrapment netting on Yellowstone Lake 2011-2014
Small MeshGillnetting
Large MeshGillnetting
Live-EntrapmentNetting
Total
Kg Kg Kg Kg lbs 2011 61700 57 29800 27 17400 16 109000 240300 2012 79200 53 52700 35 18900 13 150800 332500 2013 71400 51 60300 43 9300 7 140900 310600 2014 63000 49 65200 51 130100 286800
Live-entrapment netting was not used in 2014
in other large northern lakes (Martin and Oliver 1980) Thus numbers of lake trout should be decreasing in Yellowstone Lake
Lake Trout Gillnetting The majority of gillnetting during the past three years foshycused on smaller fish residing in deeper water (20-60 meters) where cutthroat trout by-catch was low Small-mesh gillnets with box sizes of 25 to 38 millimeters caught 245230 lake trout (79200 kilograms) in 2012 247120 lake trout (71400 kilograms) in 2013 and 217620 lake trout (63000 kilograms) in 2014 Catches by small-mesh gillnets represented approxshyimately 50 of the total biomass removed each year (table 1)
To increase the removal of larger lake trout which have high reproductive potential and are more likely to prey on Yelshylowstone cutthroat trout the use of large-mesh gillnets with mesh sizes of 44 to 64 millimeters was increased over the past three seasons These nets were typically set at depths ofless than 30 meters Large-mesh gillnets caught 43580 lake trout (52700 kilograms) in 2012 48810 lake trout (60300 kilograms) in 2013 and 58830 lake trout (65200 kilograms) in 2014 Catches by large-mesh gillnets represented 35 ofthe biomass removed in 2012 43 in 2013 and 51 in 2014 (table 1) The highest numbers of adult lake trout removed by large-mesh gillnets occurred near Carrington Island in the Breeze Channel and near the West Thumb Geyser Basin (figure 2) Areas near the mouth of Flat Mountain Arm and southsoutheast of Frank Island also yielded many mature fish
Lake Trout Live-Entrapment NettingDuring 2012 and 2013 contract netters used 10 large trap nets to remove lake trout from Yellowstone Lake Trap nets capture and hold fish alive thereby providing a means to tarshyget lake trout in shallow near-shore areas where both lake trout and cutthroat trout are found Trap nets consist of a mesh lead (or guide) line up to 275 meters long and funshynel-shaped tunnels which direct fish into a lsquoboxrsquo constructed of heavy mesh The boxes are 12 meters by 6 meters and up to 9 meters tall enabling the capture of many large lake trout Trap nets were lifted and checked 1-2 times per week Anycaptured cutthroat trout were sorted from lake trout and reshyleased Although the primary use of trap nets was to remove lake trout they also permitted live capture of lake trout for research use (eg sonic telemetry and population size estishymation via mark-recapture)
In 2012 trap nets were used from June 19 to September 27 for a total of 879 net nights Total catch using trap nets was 12711 lake trout (18900 kilograms) and yield was 13 of total lake trout biomass (table 1) The top three lake trout-yielding trap nets were located in West Thumb The average number caught each night by a trap net in the West Thumb was 24 lake trout whereas trap nets located elseshywhere caught an average of 9 lake trout per night Average biomass removed by trap nets was 32 kilograms of lake trout per net-night in the West Thumb area and 15 kilograms per net-night in other areas
N a t i v e F i s h C o n s e r v a t i o n P r o g r a m | 1 3
Lake trout egg nets set near Carrington Island in Yellowstone Lake - NPS Photo
1 4 | Ye l l o w s t o n e F i s h e r i e s amp A q u a t i c S c i e n c e s 2 0 1 2 - 2 0 1 4
In 2013 trap nets were used from May 26 to August 28 for a total of 880 net nights Total catch using trap nets was 6648 lake trout (9300 kilograms) and yield was 7 of the total lake trout biomass removed from the lake (table 1) Only one of the top lake trout-yielding trap nets in 2013 was located in the West Thumb area because catches were distributed more evenly throughout the lake than in previous years Average biomass removed by trap nets was 12 kilograms of lake trout per net-night in the West Thumb area and 10 kilograms per net-night in other areas This reduction is partially due to removal of the trap nets prior to lake trout spawning in order to focus more on gillnetting during the fall spawning period
Lake Trout Suppression Alternative Methods Embryo Suppression on Spawning Areas ndash To reduce costs and ensure program viability into the foreseeable future there is a critical need to develop new more efficient ways of lake trout suppression Experts agree that methods which target lake trout embryos andor larvae on spawning sites hold the greatest promise Carrington Island a tiny island located in the West Thumb of Yellowstone Lake was first documented as a major lake trout spawning area in the late-1990s (Ruzycki et al 2003 Ruzycki 2004)
To determine the spatial extent of spawning substrate (rock cobble) around the island NPS crews used high-resolution Global Positioning Systems and a hand-held depth finder to map the outer and inner extent of substrate Total area ofspawning habitat around the crescent-shaped island was 05 hectare Water depths at the outer-most margin of the subshystrate were relatively shallow at 04 to 26 meters
Electroshocking to Suppress Lake Trout Embryos ndash The NPS has been working with the Montana Cooperative Fishshyery Research Unit (US Geological Survey) to develop elecshytroshocking methods to kill lake trout embryos The project supplemented an ongoing Montana State University project to develop an electrode array for the same purpose in Swan Lake Montana The prototype array was used on Swan Lake in 2013 and nearly 100 of lake trout embryos were killed to a depth of 20 centimeters in the substrate (Brown et al 2014)
A similar electroshocking array was used in Yellowstone Lake during 2014 The array is mobile and several known spawn-
Fisheries crews removing lake trout from gillnets aboard the NPS Freedom
ing reefs (Carrington Island Snipe Point and Olson Reef) were shocked during five days in early October No quantifishyable method was incorporated to determine how many eggs were destroyed though many dead eggs were observed after electroshocking A graduate student from Montana State University is developing a plan to assess the effectiveness offuture electroshocking events
Suction-Dredging to Suppress Lake Trout Embryos ndash Folshylowing the lake trout spawning period in late September 2012 embryos were found in abundance within the subshystrate in shallow water around Carrington Island Biologists used high-pressure water pumps to disrupt the rockcobble substrate and remove lake trout embryos from the shallow spawning area around the island At least several thousand
N a t i v e F i s h C o n s e r v a t i o n P r o g r a m | 1 5
embryos were likely disrupted and blown outward into soft sand sediments where they were unlikely to survive
In addition a suction dredge was used on spawning grounds during four days in late October 2014 The dredge removed approximately 5075 viable eggs 4000 eggs from Carrington Island 75 eggs from Snipe Point and 1000 eggs at Olson Reef Many more eggs were suctioned but most were alshyready dead since the electroshocking array was first used at these sites The suction dredge was able to remove lake trout eggs from substrate in both shallow and deep water (17 meshyters)
Applied Research to Improve Suppression Efficiency Sonic Tracking to Locate Spawning Areas ndash In 2011 the NPS and US Geological Survey initiated a telemetry studywith support from Trout Unlimited the National Parks Conshyservation Association and the Greater Yellowstone Coalishytion The objectives of this research are to locate lake trout spawning areas and identify movement corridors of lake trout within Yellowstone Lake Transmitters were implanted in 159 lake trout and 40 stationary acoustic receivers were deployed in Yellowstone Lake Receivers were distributed lake-wide with higher concentrations in areas suspected to be frequently used by lake trout At key passage points reshyceivers were distributed to form an acoustic curtain so at least one receiver would record the passage of tagged fish moving through the area Over 90 of tagged lake trout were detectshyed moving through Breeze Channel into West Thumb during spawning migrations Over 50 of tagged lake trout were detected at least once near the Carrington Island spawning site
Since 2011 additional receivers and transmitters have been incorporated in the study each year During spawning seashyson fine-scale positioning arrays of receivers have been deployed at suspected and known spawning areas to track tagged fish in 3-dimensional space through time In 2012 an array was deployed at Carrington Island In 2013 three arrays were deployed near West Thumb Geyser Basin along the southeast section of West Thumb and near the mouth ofFlat Mountain Arm to Plover Point In 2014 the Flat Mounshy
tain ArmPlover Point array was redeployed and expanded More details are available at httpwwwnrmscusgsgovyelshylowstone_lake
Lake Trout Population Size Estimate In 2013 the NPS and Montana State University initiated a mark-recapture study to estimate the population size oflake trout in Yellowstone Lake During June and July 2398 lake trout were captured in live-entrapment nets measured marked with two uniquely-numbered plastic tags and reshyleased Trap nets used to capture these lake trout were loshycated throughout West Thumb and the main portions of Yelshylowstone Lake (figure 6) Many of these marked lake trout were recaptured in gillnets and trap nets during the remainshyder of the netting season Anglers were also encouraged to return tags from marked fish they caught Recaptured lake trout were killed location method of capture total length sex and maturity were recorded
A total of 1334 lake trout were recaptured in 2013 which was more than half (56) of the total marked and released Recapture of tagged fish occurred by gillnetting (922 69) trap netting (357 27) and angling (55 4) The distribushytion of recaptured lake trout indicated they moved considershyable distances throughout the lake For example lake trout marked near the mouth of Solution Creek along the southshyern shore of West Thumb were recaptured throughout West Thumb in Breeze Channel along the lakersquos east shore and as far away as the southern end of the Southeast Arm (figure 6) Modeling efforts estimated lake trout abundance for four different length classes Estimates of abundance and accomshypanying standard errors (in parentheses) were as follows 303484 (plusmn 22350) lake trout in the 210-451 millimeter length class 41288 (plusmn 4456) in the 451-541 millimeter class 17278 (plusmn 4456) in the 541-610 millimeter class and 5601 (plusmn 812) in the greater than 610 millimeter class (Rotella 2014) Estimatshyed exploitation rates which are the proportions of fish reshymoved from the population along with accompanying 95 confidence intervals were as follows 072 (063-084) for lake trout in the 210-451 millimeter class 056 (046-071) for the 451-541 millimeter class 048 (038-066) for the 541-610 millimeter class and 045 (035-063) for the greater than 610 millimeter class (Rotella 2014)
1 6 | Ye l l o w s t o n e F i s h e r i e s amp A q u a t i c S c i e n c e s 2 0 1 2 - 2 0 1 4
Number Marked at Trap Recapture Site of Lake Trout Marked in Main Lake Recapture Site of Lake Trout Marked in West Thumb
Figure 5 Number of lake trout marked and released at each trap net with recapture locations in Yellowstone Lake
Lake Trout Egg Density and Survival Little is known about the early survival of lake trout in Yelshylowstone Lake from spawning to age 2 As a result current population modeling relies on estimates derived from reshysearch conducted mainly in the Great Lakes However earlysurvival rates in Yellowstone Lake could potentially be much higher than those observed in the Great Lakes due to a lack of natural predators and other factors
In 2013 the NPS collaborated with the US Geological Survey US Fish and Wildlife Service and the Universityof Vermont to obtain an assessment of lake trout embryo deposition at Carrington Island A total of 108 ldquoegg bagsrdquo were deployed by scuba divers in suitable spawning substrate along seven transects to the south northwest and north sides of the island Fine-mesh bags were placed so that any
eggs spawned over this substrate would be collected within the bag Following placement a photo was taken of each bag to estimate substrate size and location About one-half of the egg bags were removed on October 15 to assess the abunshydance and distribution of eggs in the area
Egg densities were higher northwest and south of the island but varied widely among collection bags (1 to 282 eggs) No eggs were found in about one-half of the bags (53) The pattern of egg deposition and density matched predictions based on work in the Great Lakesmdashmost of the bags containshying eggs and all bags with high egg densities were located at the edge of a short drop-off in the substrate Developing emshybryos (alive and dead) and unfertilized eggs were preserved and will be analyzed to determine the approximate date ofdeposition Remaining bags were retrieved during spring
N a t i v e F i s h C o n s e r v a t i o n P r o g r a m | 1 7
2014 to determine overwinter survival rates and if spawning continued past the date the first set of bags were removed
In 2014 a remotely operated underwater vehicle was used to verify successful spawning at Carrington Island and Olsonrsquos Reef located between Eagle Bay and Flat Mountain Arm Also larval fish traps deployed at Carrington Island from earshyly through mid-June revealed the presence of lake trout fry These fry may be vulnerable to suppression with electrical equipment during that period
Lake Trout Maturation Cycle and Reproductive Potential in Yellowstone Lake In 2014 samples of gonads and body weights collected from lake trout killed in suppression nets were used to evaluate maturation from June through October Reproductive tisshysue samples were stored for later histological analysis in the laboratory These data will be used to determine frequencyand pattern of lake trout spawning in Yellowstone Lake In addition a precise estimate of fecundity (ie productivity) is being developed for egg masses removed from female lake trout The results will be compared to previous estimates colshylected when the lake trout population was rapidly expanding
Spawning lake trout in Shoshone Lake - Photo copyJay Fleming
1 8 | Ye l l o w s t o n e F i s h e r i e s amp A q u a t i c S c i e n c e s 2 0 1 2 - 2 0 1 4
Monitoring Performance Metrics on Yellowstone Lake
Figure 6 Sampling sites on Yellowstone Lake and associated creeks
Progress toward cutthroat trout recovery and desired condishytions for Yellowstone Lake was assessed annually through 1) lake-wide population assessments of cutthroat trout and lake trout conducted via distribution gillnetting at three depth strata in August 2) cutthroat trout spawning assessments using weirstraps or by making visual counts on tributarystreams from May through July and 3) cutthroat trout catch success reported by lake anglers during the fishing season
Lake-Wide Cutthroat Trout Population Assessment Each fall NPS biologists conduct distribution netting of cutshythroat trout and lake trout in Yellowstone Lake to estimate age and size class structure distribution recruitment and mortality from the lake trout suppression program Twenshyty-four sites are sampled within the motorized portions of the lake including West Thumb the main basin surrounding Dot and Frank islands the northern shore and area surrounding Stevenson Island and the east shore and two southern arms (figure 6) At each sampling site large-mesh and small-mesh
Figure 7 Length-frequency distribution of cutthroat trout collected from distribution netting on Yellowstone Lake with total number of trout (n) 2011-2014
N a t i v e F i s h C o n s e r v a t i o n P r o g r a m | 1 9
nets are set in shallow water at mid-depth and more than 40 meters deep Mesh sizes on the large-mesh nets range from 57 to 89 millimeters while sizes on small-mesh nets range from 19 to 51 millimeters
The distribution nets caught 1071 cutthroat trout in 2012 1259 cutthroat trout in 2013 and 1421 cutthroat trout in 2014 (figure 7) These catches are more than double those in 2011 The increase in catch each year was primarily due to an influx of young juvenile cutthroat trout within the system however increased catches of large older-age fish also ocshycurred Cutthroat trout had a mean total length of 358 milshylimeters in 2012 382 millimeters in 2013 and 405 millimeshyters in 2014 (figure 7) These mean lengths were much lower than those observed in earlier years In 2014 most (53) cutthroat trout were large adults between 430 and 620 milshylimeters in total length while juveniles and subadults (29) were less than 325 millimeters in total length
Using the two shallow nets from each of the distribution sites mean number of cutthroat trout caught per 100 meters of net per night was calculated (with 95 confidence intershyvals in parentheses) Catch per unit effort increased from an average of 118 (87-150) in 2010 to 284 (237-330) in 2014 (figure 8) The 2014 catch exceeds the secondary desired condition for the programrsquos adaptive management strategyof 26 cutthroat trout per net (figure 9a)
The large recruitment of young cutthroat trout detected through distribution netting during 2012 through 2014 is an indication the cutthroat trout population is beginning to recover Factors contributing to the increased number ofyoung fish may include the greatly increased effort to supshypress lake trout as well as improved winter snow conditions and stream runoff in recent years
Cutthroat Trout Tributary Spawning Assessshyment For over 50 years spawning cutthroat trout were counted as they ascended Clear Creek a large tributary on Yellowstone Lakersquos eastern shore In 2008 spring flood waters damaged the weir rendering it inoperable Since that time efforts have been made to restore the ability to count spawning cutthroat trout at the site In 2012 the NPS with help from the Monshytana Conservation Corps completely renovated the weir site including removing badly damaged components of the old
2 0 | Ye l l o w s t o n e F i s h e r i e s amp A q u a t i c S c i e n c e s 2 0 1 2 - 2 0 1 4
Clear Creek Cutthroat Counting Station reconstructed in 2012 Spawning cutthroat trout are counted in Clear Creek a large remote tributary on Yellowstone Lake using an acoustic monitoring system -NPS photo
weir reengineering and reconstructing the bulkhead on the southern stream bank constructing a new shed and bridge and rehabilitating stream bank erosion caused by the conshyfiguration of the old weir The project did not include reshyconstructing the weir itself because the NPS installed a sonar (acoustic) fish counting system (Sound Metrics Corporation model ARIS 3000) in 2013 During 2013 and 2014 fisheries staff learned to use system operating software identified loshycations where the sonar could effectively capture fish images and evaluated the solar energy supply
Since 1988 the abundance of spawning cutthroat trout has also been visually estimated by people walking along 9 to 11 tributaries on the west side of Yellowstone Lake (Reinshy
hart and Mattson 1990 Reinhart et al 1995 figure 6) These surveys indicated a significant decrease in spawning-age cutthroat trout in Yellowstone Lake (figure 9b) In the late 1980s more than 70 cutthroat trout were typically observed during a single visit to one of the streams compared to only1 or 2 cutthroat trout in recent years One exception is Litshytle Thumb Creek a tributary in the West Thumb near Grant where more than 70 cutthroat trout were seen during one week in 2012 more than 50 were seen in 2013 and more than 120 were seen in 2014 The desired conditions for Yellowshystone Lake are an average of at least 40 to 60 spawning cutshythroat trout observed per stream visit across all 11 tributaries (figure 9b)
c
N a t i v e F i s h C o n s e r v a t i o n P r o g r a m | 2 1
Figure 8 Mean number of cutthroat trout caught per 100 m net per night in distribution netting on Yellowstone Lake 2010-2014 Bars delineate 95 confidence intershyvals
a
b
Figure 9 Metrics monitored to assess the effects of conshyservation actions on Yellowstone Lake include the avershyage number of cutthroat trout that are (9a) caught per net during the fall netting assessment (9b) observed during visual surveys of spawning streams and (9c) caught per hour by lake anglers 1985-2013 Primary and secondary desired conditions are from the Native Fish Conservation Plan
Cutthroat Trout Angler Success Since 1979 park visitors who purchase a fishing permit have been given a survey card on which to report waters fished time spent fishing and species and sizes of fish caught About 5 of these anglers (approximately 2000 per year on average) have completed and returned the cards to the parkrsquos fisheries program Yellowstone Lake receives over 20 ofthe parkwide angling effort In Yellowstone Lake cutthroat trout catch rates were as high as 2 fish per hour in the 1990s but decreased substantially in the early 2000s to only 06 fish per hour in 2012 (figure 9c) However more recent angling reports from Yellowstone Lake are encouraging In 2014 anglers reported catching 12 cutthroat trout per hour This catch rate is still below the desired condition of 15 to 2 cutshythroat trout per hour but is higher than the previous 12 years (figure 9c) The average size of cutthroat trout being caught decreased to 438 millimeters (17 inches) due to an increase of smaller fish being caught rather than a decrease in larger fish
Lake-Wide Lake Trout Population Assessment A total of 394 lake trout were caught by distribution nets in 2012 347 were caught in 2013 and 575 were caught in 2014 (figure 10) The mean total length for lake trout was similar among years (309-330 millimeters) but the range in sizes deshycreased with fish less than 200 millimeters and greater than 500 millimeters being caught less frequently each year Most captured lake trout were immature fish less than 425 millimeshyters in total length
High cutthroat trout consumption by lake trout is prevshyalent in the arms of Yellowstone Lake
2 2 | Ye l l o w s t o n e F i s h e r i e s amp A q u a t i c S c i e n c e s 2 0 1 2 - 2 0 1 4
Figure 10 Length-frequency distribution of lake trout collected from distribution netting on Yellowstone Lake with total number of trout (n) 2011-2014
The mean number of lake trout captured per 100 meters of net varied from 29 (95 confidence intervals = 21-37) in 2013 to 49 (34-63) in 2014 (figure 11) but was not sigshynificantly different among years The highest catch per unit effort (63) occurred in West Thumb during 2012 along the east shore and in the southern arms during 2013 (36) and in the main basin during 2014 (66) (figure 12) Catch per unit effort for lake trout was lowest along the north shore
Population Modeling and Lake Trout Mortality The Montana Cooperative Fishery Research Unit has led efforts to analyze lake trout catch and monitoring data colshylected from Yellowstone Lake Analyses include the total anshynual mortality for lake trout (ages 3 and greater) for each year during 1997-2014 (Syslo et al 2011) Results indicate that mortality inflicted on lake trout due to suppression netting and other causes has increased from 024 (017-021) in 1997 to 053 (047-058) in 2013 (figure 13) This number slightlydecreased in 2014 to 048 (036-057) Statistical modeling methods have also been used to reconstruct the abundances of lake trout each year Results suggest that lake trout abunshydance (Syslo et al 2011) increased from 129382 (range = 111593 to 147171) in 1998 to 809858 (676672 to 942996)
Figure 11 Mean number of lake trout caught per 100 m net per night in distribution netting within four Yelshylowstone Lake regions 2010-2014 Bars delineate 95 confidence intervals
Yellowstone Cutthroat TroutLake Trout
15
10
5
0
2012
2014
Nu
mb
er o
f Fi
sh p
er 1
00 M
eter
s o
f N
et
0
5
10
15 2013
15
10
5
0 West Main North EastArms
Thumb Basin Shore
Lake Region Yellowstone Cutthroat Trout Lake Trout
Figure 12 Mean number of cutthroat trout and lake trout caught per 100 m net per night in distribution netting within four Yellowstone Lake regions 2012-2014
N a t i v e F i s h C o n s e r v a t i o n P r o g r a m | 2 3
in 2012 but then decreased to 485468 (359020 to 611916) in 2014
Whirling Disease Status Assessment The exotic parasite Myxobolus cerebralis which causes whirlshying disease was first detected in Yellowstone cutthroat trout from Yellowstone Lake in 1998 Monitoring and research were conducted from 1999 through 2005 on 13 tributaries to determine its effects on cutthroat trout and whether actions could be taken to mitigate for them (Murcia et al 2011 Murshycia et al 2015 Alexander et al 2011) Parasite prevalence and severity of infection were high in exposed sentinel fry in Pelican Creek and in the Yellowstone River downstream ofthe lake outlet The spawning cutthroat trout population ofPelican Creek which once numbered more than 30000 was essentially eliminated The prevalence of Myxobolus cereshybralis in juvenile and adult cutthroat trout from Yellowstone
Figure 13 Lake trout annual mortality estimated using catch curves (data from distribution netting) from 1997 to 2014 in Yellowstone Lake Horizontal line delineates the target of 056 stated in the Native Fish Conservation Plan
Lake varied annually between zero and 20 Prevalence was generally highest in the lakersquos northern region near infected tributaries
In 2012 research was initiated to determine if Myxobolus cerebralis had dispersed further across the ecosystem and whether it had the potential to limit cutthroat trout recovshyery in and near Yellowstone Lake Cutthroat trout fry were
2 4 | Ye l l o w s t o n e F i s h e r i e s amp A q u a t i c S c i e n c e s 2 0 1 2 - 2 0 1 4
placed in sentinel cages deployed in 22 downstream reaches of spawning tributaries for 12-day periods to assess whirling disease risk (figure 6) Ten fry from each location were asshysayed for the presence of Myxobolus cerebralis In addition some of the cutthroat trout caught at each of the 24 distribushytion netting sites were assayed for the presence of the parashysite Findings indicate that whirling disease risk remains high in Pelican Creek (figure 6) In addition one fry tested weakshyly positive for Myxobolus cerebralis in the Yellowstone River upstream of Yellowstone Lake All other streams tested negshyative Within Yellowstone Lake 14 of 139 (10) cutthroat trout were infected Overall it does not appear whirling disease has spread widely throughout spawning tributaries to Yellowstone Lake and the prevalence of infection in juveshyniles and adults within the lake remains low
Science Panel Reviews of the Yellowstone Lake Program The first scientific review panel evaluation of the Yellowstone Lake program occurred in 1995 soon after lake trout were discovered in the lake (Varley and Schullery 1995b) In 2008 the NPS again convened a panel of experts to evaluate the program and to make recommendations for improvement (Gresswell 2009) Science panel reviews have occurred anshynually since 2011 to inform the programrsquos adaptive manageshyment strategy
From 2012 to 2014 information reviewed by the scientific panel included suppression activities updated population modeling results from monitoring lake trout and cutthroat trout proposed actions for the forthcoming field seasons reshysults of lake trout sonic telemetry studies and summaries ofalternative suppression techniques In 2014 the panel noted substantial progress had been made and concluded the lake trout population should begin to collapse if effort was mainshytained at the 2013-level for at least five years The panel also recommended that effort be continued for a minimum of 10 years or until suppression goals outlined in the Native Fish Conservation Plan are met (Gresswell et al 2013a Gresswell et al 2013b)
Yellowstone Cutthroat fry - Photo copyJay Fleming
N a t i v e F i s h C o n s e r v a t i o n P r o g r a m | 2 5
Electroshocking Flint Cascade the upper extent of the cutthroat trout-rainbow trout hybridization in the Lamar River system - NPS photo
2 6 | Ye l l o w s t o n e F i s h e r i e s amp A q u a t i c S c i e n c e s 2 0 1 2 - 2 0 1 4
Restoration of Cutthroat Trout amp Arctic Grayling in Streams
Over the past decade Yellowstone National Park has taken actions to restore and preserve native fish in several streams and lakes These actions include suppression or complete removal of harmful nonnative species Since 2006 four streams comprising 511 linear miles and four lakes comshyprising 49 surface acres of habitat have been restored for native fish In addition 148 and 152 linear stream miles ofupper Soda Butte Creek and upper Slough Creek respecshytively have been electrofished annually to suppress nonshynative and hybrid trout These efforts are resulting in an increase in habitat occupied by native fish in Yellowstone National Park
Westslope Cutthroat Trout Restoration on East Fork Specimen Creek The East Fork Specimen Creek project began in 2006 Inishytially it included the removal of nonnative fish from High Lake and all but the lowest portion of East Fork Specimen Creek as well as the construction of a log fish barrier with a life expectancy of 10 years During 2007 through 2012 more than 15000 westslope cutthroat trout eggs and nearly3000 juveniles and adults were reintroduced to East Fork Specimen Creek to reestablish a viable naturally-reproducshying population within the watershed (figure 14 table 2)
Figure 14 East Fork Specimen Creek westslope cutthroat trout restoration area in the Specimen Creek watershed in northwestern Yellowstone National Park with locations of remote site incubators (RSI) for reintroduction of westshyslope cutthroat trout embryos
Table 2 Total number of westslope cutthroat trout reintroduced into the East Fork Specimen Creek watershed 2007-2012
Year Eggs Fish High Lake 2007 1377 1144
2008 3130 890 2009 838 930
East Fork Specimen Creek 2010 4503 2011 2246 2012 3550
Total at Project Completion 15664 2964
The future of the project will include monitoring westslope cutthroat trout abundance and genetic integrity as well as the condition and performance of the fish barrier To ensure the persistence of westslope cutthroat trout an engineered barrier will need to be constructed on the lower mainstem of Specimen Creek near Highway 191 (figure 14) If the barshyrier is completed the project could be integrated into a largshyer westslope cutthroat trout restoration to all of Specimen Creek drainage including the North Fork In fall 2011 an enshygineering and planning firm was retained to conduct detailed topographic mapping and design this fish barrier A concepshytual design and engineering plans have been created which could lead to efforts to construct the barrier and complete the watershed-scale westslope cutthroat trout recovery
Native Fish Community Restoration on Grayshyling Creek Fluvial (river-dwelling) Arctic grayling were once abundant in the Madison and Gallatin river drainages of Yellowstone National Park However the introduction of nonnative fish and the construction of Hebgen Reservoir on the Madison River just downstream of the park led to the speciesrsquo decline and eventual extirpation from park waters Fluvial Arctic grayling are currently the only native fish species extirpated from park waters Westslope cutthroat trout native to the same waters in Yellowstone as Arctic grayling have fared litshytle better over the last century In fact only one aboriginal population of westslope cutthroat trout remains in the park located in Last Chance Creek a tributary to Grayling Creek In order to return Arctic grayling to Yellowstone National Park and ensure the persistence of westslope cutthroat trout
N a t i v e F i s h C o n s e r v a t i o n P r o g r a m | 2 7
the park began surveying Grayling Creek in 2007 (Koel et al 2008) and identified Grayling Creek as a critical project within the Native Fish Conservation Plan (see ldquoThrough a Biologistrsquos Eyesrdquo page 34)
The first conservation action required on Grayling Creek was to isolate the restoration area by modifying an existing bedshyrock waterfall located in a canyon near Highway 191 (figure 15) An engineering and planning firm completed a barrier design and in fall 2012 the NPS partnered with technical blasters from the Gallatin National Forest to create the barshyrier Additional finish work was conducted in 2013 and 2014 by contractors with Intermountain Restoration The modifishycation elevated the barrier to a height gt 6 feet and filled deep pools to create a large concrete ldquosplash padrdquo at the barrier base The falls are now a complete barrier to upstream fish movement by rainbow and brown trout located downstream in Hebgen Reservoir (figure 15)
The Grayling Creek restoration area includes 95 kilometers (59 miles) of connected stream habitat with a typical sumshymer discharge of 40 cubic feet per second downstream near the fish barrier Actions to remove nonnative fish from the Grayling Creek restoration area upstream of the barrier beshygan in 2013 with assistance from the US Forest Service US Fish and Wildlife Service Montana Fish Wildlife amp Parks and Turner Enterprises Inc More than two dozen fish bishyologists and technicians worked for several weeks to remove nonnative and hybrid trout from the restoration area using rotenone A second rotenone treatment took place during 2014 The reintroduction of westslope cutthroat trout and fluvial Arctic grayling to the drainage began in 2015
Westslope Cutthroat Trout Brood Development at Goose Lake The restoration of native fish populations is contingent on having brood sources from which to reestablish native fish populations A brood source should be accessible secure from contamination self-sustaining genetically diverse abundant of traceable origin and pose no risk to existing wild populations The opportunity to create such a brood source for westslope cutthroat trout exists within the Goose Lake chain of lakes in the Firehole River drainage of Yellowshystone National Park These lakes are not connected to the
2 8 | Ye l l o w s t o n e F i s h e r i e s amp A q u a t i c S c i e n c e s 2 0 1 2 - 2 0 1 4
Figure 15 Locations of rotenone treatments and a modified waterfall barrier in the Grayling Creek drainage in 2014
river (figure 1) and are easily accessible due to their proximityto the Fountain Flat Drive Service Road These lakes were historically fishless but were stocked with nonnative rainshybow trout more than 100 years ago
In 2011 Goose Lake Gooseneck Lake and a small conshynected unnamed lake were treated with rotenone to remove rainbow trout In 2012 extensive monitoring including netshyting snorkeling and electrofishing confirmed that rainbow trout had been removed During 2013 and 2014 more than 5300 fry originating from multiple wild sources in the upper Missouri River drainage were stocked into Goose Lake The future of the project will include monitoring abundance and genetic integrity as well as stocking the upper two lakes ofthe complex
Yellowstone Cutthroat Trout Conservation in Northern Yellowstone Over the past decade considerable efforts have been investshyed in understanding the status and trends of Yellowstone cutthroat trout across the northern reaches of the park These efforts have identified several potential cutthroat trout conservation actions in small streams and lakes as well as
alarming trends and potential threats in three of the regionrsquos largest and most important cutthroat trout fisheries Nonshynative hybridizing rainbow trout are abundant in the lower Lamar River lower Slough Creek (downstream of the campshyground) and Yellowstone River between the Lower Falls at Canyon and Knowles Falls (figure 16)
Conservation of Yellowstone cutthroat trout of the Lamar River watershed is a top priority for the NPS Multiple tools are being used to mitigate for rainbow trout in the Lamar Rivshyer and its tributaries including 1) suppression via electroshyfishing by NPS crews 2) creation of barriers to prevent furshyther upstream movements and invasions by rainbow trout 3) suppression via a catch-and-kill regulation for visiting anshyglers and 4) suppression via removal by volunteer anglers
Nonnative brook trout which outcompete and displace cutshythroat trout exist in upper Soda Butte Creek Each year a week-long interagency electrofishing effort occurs to keep the population suppressed Brook trout are not known to live anywhere else in the Lamar River drainage but there are several populations in small tributaries of the Yellowshystone River near its confluence with the Lamar River These tributaries include the Elk-Yanceys-Lost Creek complex
N a t i v e F i s h C o n s e r v a t i o n P r o g r a m | 2 9
of streams Tower Creek and its large tributary Carnelian Creek and the many creeks of the Blacktail Deer Plateau drainage (figure 16) Beginning with Elk-Yanceys-Lost Creek complex the NPS is working to remove the threat ofbrook trout from these small tributaries with rotenone Folshylowing treatment the streams will be restocked with Yellowshystone cutthroat trout from nearest-neighbor sources such as Antelope Creek
Elk-Yanceys-Lost Creek Complex ndash Given the close proximity of Elk Yanceys and Lost creeks to the confluence of the Lamar and Yellowstone rivers (figure 17) a project was initiated in 2012 to remove the threat of brook trout and restore Yellowstone cutthroat trout to the drainage Historshyically it is unclear if the Elk Creek drainage was home to cutshy
throat trout but cutthroat trout were present in the stream when brook trout were introduced in 1942 (Varley and Schullery 1998) Since that time brook trout have completeshyly displaced all other fish species from the watershed
The presence of a large natural cascade on Elk Creek near the Yellowstone River that serves as a barrier to fish movements allowed the project to begin with nonnative fish removal (figshyure 17) In 2012 rotenone was applied to all of the fish-bearshying portions of the drainage leading to the removal of thoushysands of brook trout However post-treatment monitoring found some brook trout had survived the treatment due to complex dense woody debris habitat and slow water travel times through some stream reaches In 2013 all fish-bearshying waters in the complex were retreated but post-treatment
Figure 16 Fish species presence within tributary watersheds of the lower Lamar and Yellowstone river drainages Brook trout are being actively removed in this area to prevent invasion by this harmful nonnative species
Wil l
owC
reek
S l o u g hM e a d o w s
M i d d l e L a m a r
Canyon
Mammoth
Ya
ncey
Cr
E l k C r e e k
Yellowstone River
Dry Reach Yancey Cr
Fish Barrier
Lost Creek Falls
ElkC
reek
Elk Creek Falls
Los t Cr Lost Lake
Detox Station Fish Barrier Roads Streams Lost Creek Dry Reach
0 105 km
3 0 | Ye l l o w s t o n e F i s h e r i e s amp A q u a t i c S c i e n c e s 2 0 1 2 - 2 0 1 4
2014 Drip Station Locations
Figure 17 Location of Elk Creek removal of brook trout using rotenone in 2012-2014
0 105 mile
Figure 18 Middle Lamar River drainage including locashytions of electrofishing removals of rainbow trout and hyshybrid trout from Slough Creek (Meadows 1-3) and brook trout from Soda Butte Creek (reaches 1-9)
Sod aButte
Cr
C a c heCre
ek
S o u t h Cache Creek
Op
al C
reek
Twi n
Creek
Flint Falls Cascade
Slough Creek Barrier
Sl o
ugh
Creek Elk T o ngue
Cr
Ho rna day Cr
Pe
bb
le C
r
A m
phith
eate
r Cr
Jasp
er
Cr Rose Cr
Am
ethy
s tC
r
Chal
cedon
y Cr
Re
pu
bli
c C
r
Cooke City
Silver Gate
Road Bridge II (End Removal 2013)
Ice Box Canyon (End Removal 2012)
Warm Creek
BeginMine Tailings Removal
12345678
9 1st Meadows
2nd Meadows
3rd Meadows
0 2 41 Miles
0 2 41 Kilometers
End Removal Points
Proposed Barriers
Existing Barriers
Bridges
Cities
Roads
Major Streams
Other Streams
Ecological Zones
Yellowstone Boundary
surveys revealed brook trout were still present in two locashytions Therefore a third treatment was conducted in 2014 The efficacy of this treatment will be evaluated in 2015 and lead to either a fourth treatment with rotenone or the reinshytroduction of Yellowstone cutthroat trout
Soda Butte Creek ndash Interagency efforts to suppress brook trout in Soda Butte Creek have been ongoing for more than a decade From 2012 to 2014 biologists from the NPS US Forest Service Montana Fish Wildlife amp Parks and Wyoshyming Game and Fish Department sampled upper Soda Butte Creek from Highway 212 downstream to Ice Box Canyon usshying boat-mounted electrofishing equipment (figure 18) Also tributary streams were sampled using backpack electrofishshying units Electrofishing surveys resulted in 2018 cutthroat trout in 2012 2531 in 2013 and 1399 in 2014 Numbers ofcutthroat trout sampled have varied over the years with effort expended but in one stream section where effort has been constant cutthroat trout numbers have shown a steady deshycrease from 759 in 2009 to 135 in 2014
The number of brook trout removed from the mainstem ofSoda Butte Creek has remained relatively consistent over the past several years with 108 brook trout captured in 2012 111 in 2013 and 102 in 2014 (table 3) These catches are similar to the 5-year mean of 110 fish However in 2013 an addishytional 54 brook trout were captured from one unnamed tribshyutary just inside the boundary of Yellowstone National Park The presence of large numbers of young-of-year indicated brook trout are successfully spawning in this small creek The lack of young-of-year brook trout in Soda Butte Creek upstream of this tributary is evidence this stream is a major source of brook trout
N a t i v e F i s h C o n s e r v a t i o n P r o g r a m | 3 1
Table 3 Total (and young-of-year) brook trout mechanically removed from Soda Butte Creek within the Gallatin National Forest State of Montana and in Yellowstone National Park 2004ndash2014
Site Removal Reach 2004 2005 2006 2007 2008 2009 2010 2011 2012 2013 2014
1 Hwy 212 to McClaren MineTailings
19(1) 3(0) 0(0) 0(0) 0(0) NS NS NS 0(0) 0(0) 1(0)
2 McClaren Mine Tailings to WoodyCreek
15(0) 17(0) 3(0) 3(0) 2(0) NS NS NS NS NS 0(0)
3 Woody Creek to Sheep Creek 8(2) 43(0) 16(0) 0(0) 1(0) NS NS 2(0) 0(0) 0(0) 1(0)
4 Sheep Creek to Silver Gate 251(79) 932(51) 142(6) 45(8) 5(0) 6(0) NS 30(1) 5(0) 4(0) 2(0)
5 Silver Gate to Yellowstone Park Boundary
9(3) 80(9) 54(2) 48(19) 13(0) 30(2) 16(0) 22(2) 10(0) 2(0) 30(3)
6 Yellowstone Park Boundary to Warm Creek
7(0) 11(0) 0(0) 50(27) 23(2) 56(10) 43(2) 15(0) 29(9) 35(0) 8(0)
7 Warm Creek to Road Bridge 0(0) 1(0) 0(0) 0(0) 3(1) 51(12) 68(29) 35(6) 53(10) 54(23) 55(4)
8 Road Bridge I to Road Bridge II NS NS NS NS 0(0) 1(0) 7(0) 2(0) 11(2) 16(3) 3(0)
9 Road Bridge II to Ice Box Canyon NS NS NS NS 0(0) 0(0) NS 0(0) NS NS NS T Tributaries 0(0) 17(0) 15(0) 4(0) 1(0) 8(0) NS NS 0(0) 54(19) 2(0)
Total 309 1104 230 150 48(3) 152(24) 134(31) 106(10) 108(21) 165(45) 102(7)
In 2013 personnel from the NPS and Gallatin National Forest modified a natural falls in Ice Box Canyon to create a complete barrier to upstream fish migration (figure 18) Currently the plan is to continue with the electrofishing reshymoval of brook trout in the system while exploring other alshyternatives These removal efforts are preventing an increase in brook trout numbers but not eliminating them from the creek Also removal efforts are not preventing brook trout from moving downstream into tributary streams above Ice Box Canyon To date no brook trout have been found in Soda Butte Creek downstream of Ice Box Canyon
Slough Creek ndash Hybridization of cutthroat trout with nonnative rainbow trout poses a serious threat to the longshyterm persistence of cutthroat trout in Slough Creek During 2012 and 2014 electrofishing surveys were conducted to asshysess trout abundance collect tissue samples for genetic analshyysis and remove nonnative rainbow trout and hybrid trout (figure 18) Overall 36 rainbow trout and hybrids were reshymoved from the system The number of rainbow trout and hybrids appears to be increasing over the past decade only17 fish were removed in 2002 and 2003
Results from electrofishing surveys in the first meadow ofSlough Creek indicate the abundance of Yellowstone cutshythroat trout has significantly decreased from 308 plusmn 49 in 2002 to 173 plusmn 32 in 2012 The mean length of cutthroat trout was
346 millimeters in 2002 356 millimeters in 2012 and 254 milshylimeters in 2014 Almost all cutthroat trout sampled in 2012 were slightly hybridized with rainbow trout (999 cutthroat trout and 01 rainbow trout) Results of 11 fish specificallysampled because they visually appeared to be hybrid trout showed two were genetically pure cutthroat trout one was a genetically pure rainbow trout and eight were hybrids The presence of a genetically pure rainbow trout is evidence nonshynative fish are entering Slough Creek meadows from a downshystream source
In 2014 an engineering firm designed a barrier along Slough Creek to prevent upstream movements by rainbow trout further site visits will be necessary in 2015 to finalize the deshysign and cost estimates When constructed the barrier will prevent further immigration of rainbow and hybrid trout into the upper meadows of Slough Creek
Upper Lamar River ndash The NPS has been collecting geshynetic samples since 2010 from fish in the Lamar River (figshyure 19) to determine if rainbow trout have hybridized with cutthroat trout upstream of Cache Creek In 2012 NPS bishyologists investigated Flint Falls Cascade on the Lamar River which had been reported as a potential fish barrier to moveshyments upstream Due to the lack of vertical drop however the cascade is almost certainly not a barrier to upstream fish movement Thus 40 kilometers of the Lamar River and over
3 2 | Ye l l o w s t o n e F i s h e r i e s amp A q u a t i c S c i e n c e s 2 0 1 2 - 2 0 1 4
644 kilometers of its tributaries remain highly susceptible to invasion by rainbow trout and other nonnative fish located downstream The NPS has contracted an engineering surveyand design of a fish barrier at Flint Falls Cascade which mayinclude alternatives to vertical and velocity barriers such as electrical barriers that could be used to deter nonnative fish movement
In 2013 215 tissue samples were collected from trout in nine sample locations between Calfee and Soda Butte creeks (figshyure 19) Genetic analysis of these samples revealed slight hybridization with rainbow trout (999 purity) as far upshystream as Flint Falls Cascade approximately 13 kilometers upstream of Soda Butte Creek (figure 19) However all tisshysue samples collected 3 and 5 kilometers below the cascade
were from genetically unaltered Yellowstone cutthroat trout as were all samples collected upstream of the cascade
In 2014 145 tissue samples were collected from trout in six sample locations on Cache Creek a tributary of Lamar River (figure 19) These samples are still being processed
Joffe Lake ndash This artificial impoundment supplies drinkshying water to the headquarters area of Yellowstone National Park Historically the lake has supported a nonnative brook trout fishery for youth anglers In 2013 and 2014 the lake was stocked with 4000 Yellowstone cutthroat trout finger-lings Plans are to continue infusing the system with native cutthroat trout while suppressing the brook trout populashytion via electrofishing during the fall spawning period
Figure 19 Lamar River watershed with genetic status of cutthroat trout collected at sites based on tissue sample collections collected from 2010 to 2014 The cutthroat trout of Cache Creek and the Lamar River and tributaries upshystream of the Flint Creek Cascade remain genetically unaltered
N a t i v e F i s h C o n s e r v a t i o n P r o g r a m | 3 3
Caddis fly hatch near Lake Village - Photo copyDoug Hilborn
3 4 | Ye l l o w s t o n e F i s h e r i e s amp A q u a t i c S c i e n c e s 2 0 1 2 - 2 0 1 4
Through a Biologistrsquos EyesBy Colleen Detjens
By 1950 there were no truly fluvial (stream dwelling) popushylations of Arctic grayling left in Yellowstone National Park Historically fluvial grayling inhabited the Gallatin River Grayling Creek Madison River and the lower portions ofthe Firehole and Gibbon rivers The only remaining populashytions in the park exist in the form of lake dwelling grayling in several lakes outside of their native range This fact led park biologists to seek out a suitable site in which to restore a viashyble fluvial grayling population Grayling Creek on the west side of the park was chosen for several reasons In addition to previously being home to a population of fluvial grayling it also contained westslope cutthroat trout another species whose occupied range has dwindled over the years Grayling have disappeared from their native range for several reasons namely the introduction of nonnative brown and rainbow trout Nonnative fish compete with native populations for habitat and food rainbow trout also hybridize with the native cutthroat creating a less viable population In addition Grayshyling Creek is an extensive drainage with habitat that varies from small cascading tributaries to large meandering meadshyows and includes 18 miles (29 km) of main-stem stream An existing waterfall at the downstream end provided an ideal location to create a complete barrier to upstream movement of nonnative fish a key element to successfully restoring nashytive fish populations
The reintroduction of Arctic grayling into Grayling Creek has been a long process In 2007 NPS biologists along with grayshyling biologists from Montana Fish Wildlife amp Parks (MFWP) conducted a site visit to confirm that Grayling Creek did inshydeed have enough suitable habitat to support a robust popshyulation of fluvial grayling Reintroduction would also proshy
vide an opportunity to restore pure westslope cutthroat to the drainage In the following years NPS crews began to laythe groundwork needed to complete this large-scale project Fish surveys were conducted to find the upper extents of fish occupation in the forks and the extensive numbers of tribushytaries to Grayling Creek Genetic samples were collected to determine whether any pure westslope cutthroat remained unfortunately hybridization extended throughout the drainshyage Spatial Analysis Program personnel were asked to map as much of the system as they could to determine where all of the tributaries and springs were located a daunting task as it turns out because there are many small springs and tribushytaries on Grayling Creek and no trails The Native Fish Conshyservation Plan and Environmental Assessment which covers projects throughout the park including Grayling Creek was painstakingly written and reviewed And of course funding and support had to be secured for all phases of the project from barrier construction through the treatment to the reinshytroduction of native species
In 2011 engineers were brought to the Grayling Creek washyterfall to determine the feasibility of modifying the existing feature into a complete barrier to upstream fish movement Fish especially rainbow and brown trout are adept at taking advantage of small pockets and other irregularities to lsquosteprsquo their way up a waterfall They also make use of the deep pools that form at the base of waterfalls to gather enough velocityto jump over the falls In October 2012 a US Forest Service blasting crew began work to modify the falls Their efforts created a sheer face of rock all the way across the stream In 2013 work was continued by an independent contractor and a Montana Conservation Corp crew Concrete was added
-
-
Through a Biologistrsquos EyesN a t i v e F i s h C o n s e r v a t i o n P r o g r a m | 3 5
to the top of the falls to make it over 6 feet (18m) tall and a concrete splash pad was laid at the base to eliminate the forshymation of a deep pool
While the barrier was being worked on by the contractors the NPS crew was gearing up for the complex rotenone treatshyment that lay ahead Planning started over the previous winshyter with sizable lists of the equipment and personnel needed In addition to the extensive amount of equipment needed for rotenone treatments enough gear was needed to support upwards of 30 people in the backcountry for two weeks That meant bear spray radios toilet paper stoves pans batteries data sheets an endless number of pencils sunscreen first aid kits garbage bags tape extra laces for wading boots the list goes on Equally challenging was securing an advance comshymitment for support personnel from multiple other agencies Crews from the US Fish amp Wildlife Service MFWP US Forest Service and Turner Enterprises Inc all came out to assist the already twelve-person strong NPS crew The next step was getting everything into the backcountry and since there are no trails stock use was not an option Instead nushymerous helicopter flights were used Equipment was flown to each of two base camp locations as well as to the barrier site
Prior to the actual rotenone treatment an NPS crew spent time in the backcountry collecting data on flow times and discharge rates on all the major tributaries and forks as well as the main stem of Grayling Creek This information is vital to planning and executing a successful treatment as it allows for adequate and precise application of rotenone Although rotenone only affects gill breathing organisms invertebrate and amphibian sampling is also conducted prior to and post treatment
Once the majority of the pre-treatment work was done the crews from other agencies joined the NPS crew to carry out the actual treatment Coordinating the arrival of so manypeople hiking ten miles into the backcountry without a trail and through thick deadfall was a logistical feat Gear had to be dropped off with helitack personnel to be flown in trucks had to be shuttled bear spray handed out people checked in and radios had to be borrowed programmed and distribshyuted Arriving with the additional crew were the two most important people in the group the camp cooks Given the number of people involved and the amount of work to be
accomplished camp cooks were a necessity Thirty people cooking for themselves would have been chaotic to say the least and morale was certainly higher when a home cooked meal complete with dessert was waiting for everyone back at camp
The actual treatment portion of the project was conducted over a period of eight to ten days in August 2013 and again in 2014 Due to the size of the project area it was completed in sections Each day of treatment required careful planning as to how much rotenone to apply and where and how to divide the work amongst the available personnel Rotenone was applied via backpack sprayers a sand mixture and drip stations where the mixture of rotenone and water drips out at a controlled rate The amounts used for each of these apshyplications are carefully recorded Among the many challengshyes presented by a project of this magnitude was successfullycollecting data sheets from 30 people at the end of every day
Braving high temperatures and relentless sun one year conshystant cold and rain the next year and all around grueling days in the field the multi-agency effort was a success In April 2015 NPS crews stocked the lower portion of Grayling Creek with over 800 adult westslope cutthroat In the followshying month remote site incubators were set up in the south fork and stocked with 110000 grayling eggs The progress ofthese eggs was carefully monitored on-site by NPS staff for two weeks By the first week of June thousands of grayling fry were seen throughout the meadow Yet to come are more incubators in both the lower and upper portions of the creek where westslope cutthroat eggs will be stocked Stocking efforts will continue over the next several years With each returning grayling the creek will be a little closer to having a viable fluvial population something that hasnrsquot existed withshyin the park in many years
Colleen Detjens is a native fish conservation biologist for the Yel lowstone Native Fish Conservation program A Chicago native Colleen came to Yellowstone in 2011 and hasnrsquot looked back since Colleen works in cooperation with Montana State Universityrsquos Institute on Eco systems
3 6 | Ye l l o w s t o n e F i s h e r i e s amp A q u a t i c S c i e n c e s 2 0 1 2 - 2 0 1 4
Intermountain Restoration modified an existing waterfall to form a barrier during 2013
The multi-agency crew heads to the North Fork of Grayling Creek with drip stations in hand
Final modifications to the existing waterfall during 2014 creatshyed a barrier that prevents upstream migration of fish
NPS technician Nate Thomas and Fisheries biologist Mike Ruhl monitor a rotenone drip station
Flow time data is collected by putting biodegradable fluoresshycent green dye into the water and following it downstream
Rotenone treatments were applied to Grayling Creek in 2013 Morning briefings were needed to keep everyone informed of and 2014 the work ahead
N a t i v e F i s h C o n s e r v a t i o n P r o g r a m | 3 7
The meals provided by the camp cooks kept everyone in good spirits
NPS technicians and interns carefully placed eggs into the incushybator located in South Fork Grayling Creek May 2015
Equipment was moved in and out of the backcountry via helicopter
Grayling fry successfully made their way from the incubators into Grayling Creek
Removing eggs from a female grayling from Axolotl Lake near Artctic grayling (Thymallus arcticus)- Photo copyJay FlemingEnnis MT in May 2015
3 8 | Ye l l o w s t o n e F i s h e r i e s amp A q u a t i c S c i e n c e s 2 0 1 2 - 2 0 1 4
Aquatic Ecological Monitoring amp AssessmentWater Quality Monitoring Eighteen long-term monitoring sites were sampled in 2012 while 17 sites were sampled in 2013 (figure 1 appendix a) In 2012 and 2013 ten or eleven stream sites were sampled in January and again during April through October while seven sites on Yellowstone Lake were sampled during June through October In addition discharge was monitored weekly during May through September at two sites on Reese Creek Core water quality parameters collected during each site visit included water temperature dissolved oxygen pH specific conductivity and turbidity Water was also collected and processed for total suspended solids volatile suspended solids and fixed suspended solids Dissolved anions (chloshyride sulfate and total alkalinity) dissolved cations (calcium magnesium potassium and sodium) and nutrients (nitrate nitrite ammonia and total phosphorus) were analyzed using samples from three sites
All water quality data were entered into the NPSTORET (storage and retrieval) database which is part of the national STORET database a repository for water quality biological and physical data used by state environmental agencies the Environmental Protection Agency (EPA) and other federal agencies universities and private citizens The water qualishyty sampling effort in Yellowstone during 2012 involved a toshytal of 163 site visits 291 activities and 3406 results During 2013 effort included a total of 121 site visits 276 activities and 2721 results Results included field observations multi-probe measurements and laboratory analyses Water qualitytesting was not conducted in 2014
Core and Chemical Water Quality Parameters Physical and chemical characteristics of water quality in Yellowstone National Park are related to seasonal changes elevation precipitation events and the presence of thermal features During 2012 and 2013 spatial trends in core washyter quality parameters were similar to those observed during 2002-2011 (figures 20 and 21)
During 2006-2010 water samples for chemical analysis (ions and nutrients) were collected at 10 stream sites within the Yellowstone Snake and Madison river drainages In 2011 chemical analysis occurred at only five sites one in each ofthree major river drainages (Yellowstone Snake and Madishyson) near the park boundary one on the Yellowstone River at the Yellowstone Lake outlet and one on Lamar River near its confluence with the Yellowstone River (figure 1) In 2013 chemical analysis was further reduced to three sites With the exception of pH at three sites all monitored sites met or surpassed national and state water quality standards for core and chemical parameters (anions cations and nutrients) on all collection days The Environmental Protection Agencyfreshwater aquatic life standards for pH are 65-90 standard units The three sites which had pH value exceedances were as follows bull The upper Soda Butte Creek site near the park boundary
had a low pH value of 64 on May 22 June 5 and July 17 2012 It also had a low pH value of 57 on April 15 2013
bull The Yellowstone River near Canyon had low pH values on January 16 (55) April 17 (61) and May 16 (63) 2013
bull The Gibbon River had low pH values on January 17 (63) and May 15 (61) 2013
There are several thermal features upstream of the Yellowshystone River and Gibbon River sites that have acidic runoffand likely contributed to low pH values Soda Butte Creek near the park boundary is located approximately 8 kilomeshyters downstream of McLaren mine tailings These tailings were deposited in the stream channel and surrounding floodshyplain and could have contributed to low pH values observed during the collections
The calculation of relative concentrations of major anions and cations for each site revealed a pattern among the washyter quality sites and river drainages for both 2012 and 2013
15
N a t i v e F i s h C o n s e r v a t i o n P r o g r a m | 3 9
Water Temperature Specific Conductivity 30 800
70025
600 20 500
YFB YCN YCS USB LSB LM GN SN FH GB MD
Dissolved Oxygen
YFB YCN YCS USB LSB LM GN SN FH GB MD
NTU
microS
cm
400
300
degC
10 200
5 100
0 0
Turbidity 10016
90 14 80
12 70
10 60
50
Non
e
mg
l
8 40
6 30
4 20
2 10
00 YFB YCN YCS USB LSB LM GN SN FH GB MD
YFB YCN YCS USB LSB LM GN SN FH GB MD
Solids Total SuspendedpH 120
9
10
1008
7 80 6
regulatory limits (65-80)
YFB YCN YCS USB LSB LM GN SN FH GB MD
5
4 mg
l
60
403
2 20
1
0 0
Yellowstone River Basin YFB = at Fishing Bridge YCN = at Canyon YCS = at Corwin Springs USB and ISB = upper and lower Soda Butte Creek LM = Lamar River GN = Gardner River
Snake River Basin SN = Snake River
Madison River Basin FH = Firehole River GB = Gibbon River MD = Madison River
YFB YCN YCS USB LSB LM GN SN FH GB MD
Mean
Median
x Near Outliers
+ Far Outliers
Regulatory Limits
Figure 20 Box and whisker plots illustrating annual variation for selected parameters at each water quality location in 2012 Lower and upper portions of boxes represent the 25th and 75th percentile respectively lower and upper black horizontal bars represent 10th and 90th percentile respectively
15
4 0 | Ye l l o w s t o n e F i s h e r i e s amp A q u a t i c S c i e n c e s 2 0 1 2 - 2 0 1 4
Water Temperature Specific Conductivity 800
700
30
25 600
20 500
YFB YCN YCS USB LSB LM GN FH GB MDYFB YCN YCS USB LSB LM GN FH GB MD
microSc
m
400
300
degC
10 200
5 100
0 0
Turbidity Dissolved Oxygen 10014
90
12 80
7010 60
8
mg
l N
TU
50
40mg
l
6
30 4
20
2 10
00 YFB YCN YCS USB LSB LM GN FH GB MD
YFB YCN YCS USB LSB LM GN FH GB MD
pH Solids Total Suspended
regulatory limits (65-80)
120
9
10
1008
7 80
6
YFB YCN YCS USB LSB LM GN FH GB MD
Non
e 5 60 4
403
2 201
0 0YFB YCN YCS USB LSB LM GN FH GB MD
Mean Yellowstone River Basin YFB = at Fishing Bridge YCN = at Canyon YCS = at Corwin Springs USB and ISB = upper and lower Soda Butte Creek Median LM = Lamar River GN = Gardner River
x Near Outliers Snake River Basin SN = Snake River
+ Far Outliers Madison River Basin FH = Firehole River GB = Gibbon River MD = Madison River Regulatory Limits
Figure 21 Box and whisker plots illustrating annual variation for selected parameters at each water quality location in 2013 Lower and upper portions of boxes represent the 25th and 75th percentile respectively lower and upper black horizontal bars represent 10th and 90th percentile respectively Outlying values are represented by ldquoXrdquo means are indicated by an open circle
N a t i v e F i s h C o n s e r v a t i o n P r o g r a m | 4 1
While relative concentrations of bicarbonate (HCO32-) ions
were dominant at all water quality stations concentrations ofother major ions varied among watersheds Both sites on the Yellowstone River (Corwin Springs and Fishing Bridge) and the site on the Snake River had relatively equal proportions of sulfate sodium chloride and calcium compared to the other ions analyzed In contrast calcium was the dominant ion within the Lamar River and sodium and chloride ions were present in approximately equal proportions within the Madison River Across the park phosphorus and nitrogen concentrations were very low as were nitrate nitrite and ammonia with most sites below the detection limits
Monitoring of 303(d) Listed Streams Segments of Reese Creek Soda Butte Creek and the Yellowshystone River were monitored because they are listed as 303(d) impaired by the State of Montana which implies they onlypartially support aquatic life and coldwater fisheries (figure 1)
Reese Creek ndash The lowermost reach of Reese Creek (figure 1) is on Montanarsquos 303(d) list because historical irrigation practices often dewater the stream during mid-summer and fall making it unsuitable for sustaining trout Because Reese Creek supports resident and migratory (spawning) cutthroat trout from the Yellowstone River monitoring of discharge during summer is important to conserve these native fish populations and overall biological integrity To ensure an adequate amount of water remains in lower Reese Creek the NPS measures stream flows and estimates discharge each year during months when water is diverted from the stream by neighboring landowners for irrigation north of the park in the Gardiner Basin
In 2012 and 2013 discharge was estimated during 15 site visshyits at the Reese Creek mainstem immediately above the upshypermost diversion structure and at the channel of the uppershymost diversion ditch The difference in discharge between these two sites is the amount of water entering the main channel of Reese Creek below the uppermost diversion The adjudicated water rights stipulate Reese Creek is to have a minimum flow of 1306 cubic feet per second from April 15 to October 15 During 2012 early spring runoff resulted in high peak flows during June followed by a dry summer with
minimal flows through fall Discharge on Reese Creek ranged from 314 to 043 cubic feet per second from early July to the end of September (figure 22) In-stream flow decreased beshylow minimum flow requirements for the last eight samples collected during summer and fall During 2013 stream flows remained relatively stable throughout spring with discharges ranging from 505 to 255 cubic feet per second (figure 22) Beginning in mid-July in-stream flow again fell below minishymum flow requirements and remained below required levels until early September
Soda Butte Creek ndash In-stream metals contamination in Soda Butte Creek is a result of historical mining in the vicinshyity of Cooke City Montana upstream of the park boundshyary Mine tailings persist within the floodplain in this area contributing to its 303(d) listing Partner agencies initiated a 3-year effort to relocate mine tailings away from the floodshyplain in 2011 an activity that posed a risk of heavy metal conshytamination of the creek The NPS conducted intensive monshyitoring and sample collection from June through October in both 2012 and 2013 Metal concentrations for arsenic seleshynium and zinc were below EPA standards for drinking water and aquatic life However in 2012 high total copper conshycentrations (00182 milligrams per liter) exceeded acute and chronic aquatic standards during one sample event in May Dissolved iron concentrations also exceeded drinking water (five sample events) and aquatic life standards (two sample events) between May and July (figure 23) In 2013 total and dissolved concentrations for arsenic copper selenium and zinc were below standards for drinking water and aquatic life Dissolved iron concentrations exceeded drinking water (six sample events) and aquatic life standards (two sample events) between January and October 2013 (figure 23)
Yellowstone River Upstream of Corwin Springs ndash This reach was first listed on Montanarsquos 303(d) list in 2006 due to sedimentation and arsenic levels exceeding drinking water standards Data to support this initial listing were collected in 1999-2001 (Miller et al 2004) To detershymine the current level of arsenic in the river the NPS samshypled water in January and again from April through October in both 2012 and 2013 Drinking water standards for arsenic should not exceed 001 milligrams per liter During 2012 total arsenic concentrations ranged from 00078 to 00348
4 2 | Ye l l o w s t o n e F i s h e r i e s amp A q u a t i c S c i e n c e s 2 0 1 2 - 2 0 1 4
Figure 22 Reese Creek stream flow (blue) compared to a required minimum stream flow (red) for 2012-2013
Figure 23 Soda Butte Creek total iron concentrations (blue) compared to EPA drinking water standards (green) and aquatic life criteria (red) for 2012-2013
milligrams per liter and exceeded drinking water standards during six of eight site visits (figure 24) In 2013 total arsenic concentration ranged from 00056 to 0508 milligrams per lishyter and exceeded drinking water standards during four of six site visits (figure 24)
Yellowstone Lake Limnology Understanding basic limnology of Yellowstone Lake proshymotes cutthroat trout conservation by enhancing the effishyciency of the lake trout suppression program Monthly washyter temperature dissolved oxygen specific conductance and turbidity measurements were recorded at seven sites from
June to October in 2012 and 2013 (figure 1) Surface water chemical characteristics were consistent throughout the lake except for the Southeast Arm The upper Yellowstone Rivshyer enters the southern tip of the Southeast Arm and delivers sediments from the upper portions of the watershed during snowmelt As a result this area of the lake tends to exhibshyit higher turbidity and lower specific conductance during spring runoff
Water temperature affects the distribution and movement patterns of fish in Yellowstone Lake From 2012 to 2014 23 water temperature loggers were deployed in the West Thumb
N a t i v e F i s h C o n s e r v a t i o n P r o g r a m | 4 3
Figure 24 Yellowstone River at Corwin Springs total arsenic concentrations (blue) compared to drinking water stanshydards (red) for 2012-2013
portion of Yellowstone Lake to document change in water temperature throughout the summer The depth of these loggers ranged from the surface (0 meters) to the lake botshytom (90 meters) with most loggers being deployed at 1-meshyter intervals between 0 and 20 meters Surface water temshyperatures began to warm in early to mid-July each year The thermocline (area with greatest water temperature change) continued to increase in depth with highest average surface temperatures (17-18ordmC) occurring in August (figure 25) The maximum depth of the warmer surface water extendshyed down 10-12 meters for all three years In 2012 and 2014 surface water temperatures began to gradually cool in earlySeptember with average temperatures falling below 12oC by mid-September By comparison surface water temperatures in 2013 did not begin to cool until late September which was followed by an abrupt cooling of water temperatures in earlyOctober (figure 25)
Health Assessments via Macroinvertebrate Surveys Macroinvertebrates were sampled at 23 sites in three watershysheds during 2012 four in the Shoshone eight in the Yelshylowstone and eleven in the Missouri (figure 1) The four sites in the Shoshone River watershed are part of long-term monitoring on Middle Creek where runoff from road conshystruction on Sylvan Pass resulted in the deposit of sediments in Mammoth Crystal Springs a small tributary to Middle
0
5
10
15
20
25
30
0
5
10
15
20
25
30
0
5
10
15
20
25
30 Jul Aug Sep Jul Aug Sep Jul Aug Sep
2012 2013 2014
Sample Month and Year
4 6 8 10 12 14 16 Temperature (oC)
Figure 25 Yellowstone Lake isopleths showing seasonal and annual variation in water temperature throughout the water column 2012-2014 Only upper 30 meters are shown (y-axis) for better resolution of surface water temperatures
Creek Macroinvertebrate data will be used to monitor reshycovery of the tributary
During 2013 macroinvertebrates were sampled at 11 locashytions (figure 1) Four sites were sampled within the Yellowshystone River watershed and within the Elk Creek drainage An additional seven sites were sampled within the Missouri Rivshyer watershed and included one site in the Goose Lake area two sites on Cougar Creek and four sites on Grayling Creek
4 4 | Ye l l o w s t o n e F i s h e r i e s amp A q u a t i c S c i e n c e s 2 0 1 2 - 2 0 1 4
In 2014 macroinvertebrates were sampled at 24 sites in three watersheds four in the Shoshone fifteen in the Yellowstone and five in the Missouri (figure 1) As in 2012 the four sites in the Shoshone River watershed are being monitored on Midshydle Creek to evaluate past road construction activities in that portion of the park
Sampling sites in the Yellowstone and Missouri River watershysheds were within current or proposed native fish restoration areas To assess rotenonersquos impact on stream invertebrate communities aquatic invertebrate surveys were conducted before and after rotenone application was used to remove nonnative fish from Elk Creek within the Yellowstone River drainage during 2012-2014 and from Grayling Creek within the Madison River drainage during 2013-2014 All inverteshybrate samples were sent to an independent contractor for analyses (results pending)
Amphibians in Native Fish Restoration Areas Wetlands were surveyed for presence of amphibians from 2012 to 2014 in the Elk-Yanceys-Lost Creek complex as well as a small watershed that encompasses the Goose Lake chain of lakes
Elk-Yanceys-Lost Creek Complex ndash Since amphibishyan sampling in the lower Elk Creek drainage began in 2006 48 wetlands have been sampled Twenty of these wetlands (42) were occupied by amphibians with one or more life stages (eggs larvae andor adults) present The three speshycies known to breed in this drainage include 1) boreal choshyrus frog (Pseudacris maculata) 2) blotched tiger salamander (Ambystoma tigrinum melanostictum) and 3) Columbia spotshyted frog (Rana luteiventris) During 2012 20 sites were samshypled that had previous observations of amphibians (figure 26) Breeding populations of blotched tiger salamanders and Columbia spotted frogs were observed at 10 sites (50) and adults were found at two additional sites (10) No amphibshyians were detected at the remaining eight sites (40) which were dry or contained little water None of the wetlands used for breeding sites were directly connected to Elk Creek or its tributaries therefore they were not treated with piscicides during native fish restoration activities in 2012-2014
In 2013 fewer breeding populations of blotched tiger salashymanders and Columbia spotted frogs were observed at the same 20 sites sampled in 2012 Breeding populations ofblotched tiger salamanders were observed at seven of the sites (35) and Columbia spotted frogs were observed at two sites (10) Adults of these two species were found at two additional sites (10) Boreal chorus frogs were found at two sites (10) Ten sites (50) were dry and one site contained little surface water to maintain an environment adequate for amphibian larvae In 2014 breeding populashytions of amphibians occurred at 14 of the 20 sites Breedshying populations of blotched tiger salamanders were found at 11 sites (55) Columbia spotted frogs were found at four sites (20) and boreal chorus frogs were found at two sites (10) No amphibians were detected at the remaining six sites (30)
Goose Lake Chain of Lakes ndash In 2011 the Goose Lake chain of lakes was treated with rotenone to remove nonnative rainbow trout At the time of treatment Goose and Goose-neck lakes contained larval blotched tiger salamanders After treatment 157 larval salamanders were found dead along the shoreline In Yellowstone larval salamanders may overwinshyter two or more years before transforming into adults (Koch and Peterson 1995) Juvenile Columbia spotted frogs were found in the small headwater lake and Gooseneck Lake They all appeared healthy and not affected by the treatment In July 2012 three lakes were sampled for the presence ofamphibians Larval blotched tiger salamanders were found only in Goose Lake while Columbia spotted frog tadpoles were found in all three lakes Previous survey years never reshyvealed a breeding population of Columbia spotted frogs in Goose Lake Because rainbow trout are known to prey on amphibians removal of these fish from Goose Lake most likely contributed to the survival and increased abundance of Columbia spotted frogs
In July 2013 and 2014 the three lakes were sampled again for the presence of amphibians Larval blotched tiger salashymanders were only found in Gooseneck Lake and the small headwater lake while adult salamanders were only found in Gooseneck Lake (2013) In 2013 adult Columbia spotted frogs were found in Goose and Gooseneck lakes but were not observed in the small headwater lake In 2014 adult Coshylumbia spotted frogs were observed in all three lakes
Figure 26 Amphibian monitoring sites in the Elk Creek drainage
Ye llowston e R
i v e r
Elk Creek FallsE lk C r e e k
E l k C r e e k
Yancey Creek Yancey Cr
Fish Barrier
Lost Creek Falls
Tower Junction
Dry Reach
Mammoth
L o s t Cr
Breeding in 2014 Breeding in 2012 and 2014 Breeding in 2013 and 2014 Breeding in 2012-2014 Fish Barrier Detox Station Streams in Project Area Lost Creek Dry Reach Streams Roads Wetlands
0 105 km
0 105 mile
N a t i v e F i s h C o n s e r v a t i o n P r o g r a m | 4 5
Amphibians Not Observed Breeding in 2012
Breeding in 2013
Salmon fly over the Yellowstone River - NPS Photo
4 6 | Ye l l o w s t o n e F i s h e r i e s amp A q u a t i c S c i e n c e s 2 0 1 2 - 2 0 1 4
Yellowstone cutthroat trout ready for release - Photo copyMike Canetta
N a t i v e F i s h C o n s e r v a t i o n P r o g r a m | 4 7
Public InvolvementVolunteer Angler Report Card Trends Angling remains a popular pastime for those visiting living near or working in Yellowstone National Park There were 42870 fishing permits issued in 2012 (34 million visitors toshytal) 42259 permits issued in 2013 (32 million visitors total) and 42831 permits issued in 2014 (35 million visitors total) Fishing permits which are required for fishing in park washyters were accompanied by a volunteer angler report card to provide anglers an opportunity to share their fishing success and opinions with park managers
The general fishing season in Yellowstone National Park opens on Memorial Day weekend and lasts until early Noshyvember In 2014 an estimated 41435 anglers spent an estishymated 169739 days fishing caught 399808 fish and released 95 of captured fish The estimated total number of days anglers spent fishing has decreased in recent years There are similar numbers of anglers each year but on average each anshygler is fishing fewer days in the park
Native fish (cutthroat trout Arctic grayling and mountain whitefish) comprised 49 of all fish caught in 2012 54 ofthe catch in 2013 and 62 of the catch in 2014 Cutthroat trout have remained the most sought after and caught speshycies representing 44 of all fish caught in 2012 49 ofthe catch in 2013 and 59 of the catch in 2014 (figure 27) Rainbow trout were the second most frequently caught fish
Brook trout Rainbow trout 7
Arctic grayling 1
Lake trout 9
11 Brown trout
Mountain whitefish 11 2
Cutthroat trout 59
Figure 27 Native cutthroat trout remained the most sought after and caught fish species by anglers in 2013 comprising 59 of all fish caught in the park
(11-18 of angler catch) followed by brown trout (11-12) lake trout (8-11) and brook trout (7-10)
Anglers reported the lengths of 11864 fish 54 were lonshyger than 305 millimeters (12 inches) and 39 were longer than 356 millimeters (14 inches) Lake trout had the greatest average length of 416 millimeters (16 inches) and were the most likely fish to be kept (35) The release of native fish (cutthroat trout Arctic grayling and mountain whitefish) is
Raft eletroshocking along the Madison River - NPS photo
4 8 | Ye l l o w s t o n e F i s h e r i e s amp A q u a t i c S c i e n c e s 2 0 1 2 - 2 0 1 4
required by park regulations and 999 of them were reshyported released
Anglers reported being satisfied with their overall experience (80) the numbers of fish caught (65) and the sizes of fish caught (70) These satisfaction rates are all slightly higher than rates reported in previous recent years
Fly Fishing Volunteer Program Each year during 2012-2014 between 36 and 42 volunteers contributed between 1443 and 1785 hours to the parkrsquos fisheries program Volunteer anglers focused on collecting samples for cutthroat trout genetics including the distrishybution of pure and hybridized fish in Lamar River Slough Creek and Soda Butte Creek Volunteers also collected samshyples to evaluate possible genetic factors influencing rainbow trout thermal tolerance in the Firehole River as well as the concentration of mercury in fish in several lakes As in past years the volunteers indicated their experience was positive and they were happy to contribute to Yellowstone fisheries research
Projects by Graduate Students During reporting years 2012-2014 the following graduate students assisted the park Fisheries Program with research efforts
Graduate student Tonya Chamberlain(Master of Science candidate) Committee Chair Dr Amy Krist Department of Zoology amp Physiology University of Wyoming Title An investigation of life history shifts in zooplankton in Yellowstone Lake following the introduction of lake trout Status Graduated 2013
Graduate student Kole Stewart (Master of Science candidate) Committee Chair Dr Thomas McMahon Department ofEcology Montana State University Title Using otolith microchemistry to distinguish spawning locations of Yellowstone cutthroat trout and lake trout in Yellowstone Lake Wyoming Status Field studies analyses and writing ongoing
Graduate student John Syslo(Doctor of Philosophy) Committee chair Dr Christopher Guy US Geological Surshyvey Cooperative Fisheries Research Unit Department ofEcology Montana State UniversityTitle Response of Yellowstone cutthroat trout to nonnative predator removal in the Yellowstone Lake ecosystem Yelshylowstone National Park Status Graduated 2015
Interagency Workgroups Biologists from Yellowstone National Park participate in the Yellowstone Cutthroat Trout Interstate Workgroup the Montana Cutthroat Trout Steering Committee and the Fluvial Arctic Grayling Workgroup Shared goals and obshyjectives among partner agencies and non-governmental orshyganizations are defined in a memorandum of agreement for the conservation and management of Yellowstone cutthroat trout a memorandum of understanding and conservation agreement for westslope cutthroat trout and Yellowstone cutthroat trout in Montana and a memorandum of undershystanding concerning the recovery of fluvial Arctic grayling
Yellowstone Lake Workgroup The Yellowstone Lake Workgroup consists of Trout Unlimitshyed National (Idaho Montana and Wyoming Councils) Nashytional Parks Conservation Association Greater Yellowstone Coalition Yellowstone Park Foundation and Yellowstone National Park The groups entered into a memorandum ofunderstanding in 2012 to enhance the cooperative relationshyship among the participants and to ensure that the Greater Yellowstone Ecosystem is protected maintained and manshyaged to achieve the goals established for the park Among those goals is the conservation and protection of ecosystems that ensure native coldwater fisheries will persist for the enshyjoyment of present and future generations The cooperative activities of this workgroup are currently focused on lake trout sonic telemetry studies and the development of altershynative lake trout suppression methods such as the destrucshytion of lake trout embryos on spawning areas
N a t i v e F i s h C o n s e r v a t i o n P r o g r a m | 4 9
Implanting acoustic telemetry tags in lake trout to identify breeding areas - NPS photo
5 0 | Ye l l o w s t o n e F i s h e r i e s amp A q u a t i c S c i e n c e s 2 0 1 2 - 2 0 1 4
AcknowledgmentsThe Native Fish Conservation Program is supported through Yellowstone Center for Resources base funding and a porshytion of the fees collected from anglers who purchase fishing permits During 2012-2014 additional funding was received from the following sources
bull Yellowstone Park Foundation through the Fisheries Fund Initiative Fly Fishing Volunteer Program and Nashytive Fish Conservation Program
bull Recreational Fee Demonstration Program of the Federal Lands Recreation Enhancement Act
bull Natural Resource Preservation Program of the NPS bull National Fish and Wildlife Foundation bull Park Roads and Parkways Program of the Federal Highshy
way Administration bull Greater Yellowstone Network Vital Signs Monitoring
Program of the NPS bull Greater Yellowstone Coordinating Committee and bull Trout Unlimited Greater Yellowstone Coalition and the
National Parks Conservation Association
Special thanks are extended to these organizations and prishyvate individuals that have graciously supported native fish restoration in Yellowstone National Park Special thanks to the former chief of the Yellowstone Center for Resources Dave Hallac for his contributions to fisheries conservation in Yellowstone Park staff who work on the fisheries project are noted in appendix B amp C
Administrative support for the Native Fish Conservation Program was provided by Barbara Cline Alana Darr Monshytana Lindstrom and Melissa McAdam Diane Eagleson with the Montana Institute on Ecosystems provided support for stream restoration and coordination of the Fly Fishing Volshyunteer Program This report was finalized by the Science Communications Program in the Yellowstone Center for Reshysources Special thanks to Sarah Haas Charissa Reid Karin Bergum and Christie Hendrix for their efforts with editing and designing this report
Over several years Allison Klein of the Spatial Analysis Censhyter has provided a tremendous amount of support for field operations and publications Thanks to Wendy Hafer from the Fire Cache Ben Cunningham and Wally Wines from Corshyral Operations Michael Mustafaga Lynn Webb and Dave Whaley from Lake Maintenance Brad Ross and Kim West from the South District Rangers Brian Chan from Lamar District Rangers and Michael Keator and Tara Ross from the West District Rangers
The Student Conservation Association and Montana Conshyservation Corps provided many people for the day-to-dayactivities of the program Special thanks to Travis Horton and Pat Clancey with Montana Fish Wildlife amp Parks Bruce Roberts with the US Forest Service Jim Mogen with the US Fish and Wildlife Service and Carter Kruse with Turner Enterprises Inc
The crew in the field at Grayling Creek The group was comprised of staff from Yellowstone National Park Montana Fish Wildlife amp Parks the US Forest Service the US Fish amp Wildlife Service Turner Enterprises Inc and the amazshying camp cooks
N a t i v e F i s h C o n s e r v a t i o n P r o g r a m | 5 1
Fish crew - 2012 - NPS photo
Fish crew - 2013 - NPS photo
Fish crew - 2014 - NPS photo
5 2 | Ye l l o w s t o n e F i s h e r i e s amp A q u a t i c S c i e n c e s 2 0 1 2 - 2 0 1 4
Literature CitedAlexander JD BL Kerans TM Koel and C Rasmussen 2011 Context-specific parasitism in Tubifex tubifex in geoshythermally influenced stream reaches in Yellowstone National Park Journal of the North American Benthological Society30853-867
Brown PJ CS Guy and MH Meeuwig 2014 Use of moshybile electrofishing to induce mortality in lake trout embryos in Yellowstone Lake Final report 2014 Montana Cooperashytive Fishery Research Unit Montana State University Bozeshyman Montana USA
Gresswell RE 2009 Scientific review panel evaluation ofthe National Park Service lake trout suppression program in Yellowstone Lake August 25-29 2008 Final report US Geological Survey Northern Rocky Mountain Science Censhyter Bozeman Montana USA YCR-2009-05
Gresswell RE CS Guy MJ Hansen ML Jones and PJ Martinez 2013a Lake trout suppression in Yellowstone Lake Science review team annual scientific assessment May 24 2012 Final report US Geological Survey Northern Rocky Mountain Science Center Bozeman Montana USA
Gresswell RE CS Guy MJ Hansen ML Jones JE Marsden and PJ Martinez 2013b Lake trout suppression in Yellowstone Lake Science review team annual scientific assessment May 14-15 2013 Final Report US Geologishycal Survey Northern Rocky Mountain Science Center Bozeshyman Montana USA
Koch ED and CR Peterson 1995 Amphibian and repshytiles of Yellowstone and Grand Teton National Parks Unishyversity of Utah Press Salt Lake City Utah USA
Koel TM DL Mahony KL Kinnan C Rasmussen CJ Hudson S Murcia and BL Kerans 2006 Myxobolus cereshybralis in native cutthroat trout of the Yellowstone Lake ecoshysystem Journal of Aquatic Animal Health 18157-175
Koel TM and J York 2006 Restoration of westslope cutthroat trout in the East Fork Specimen Creek watershy
shed Environmental assessment May 5 2006 National Park Service US Department of the Interior Yellowstone National Park httpparkplanningnpsgovdocument cfmparkID=111ampprojectID=13064ampdocumentID=15130
Koel TM PE Bigelow PD Doepke BD Ertel and DL Mahony 2005 Nonnative lake trout result in Yellowstone cutthroat trout decline and impacts to bears and anglers Fisheries 3010-19
Koel TM JL Arnold PE Bigelow PD Doepke BD Er-tel and ME Ruhl 2008 Yellowstone Fisheries amp Aquatic Sciences Annual Report 2007 National Park Service Yelshylowstone Center for Resources Yellowstone National Park Wyoming USA YCR-2008-02
Koel TM BL Kerans SC Barras KC Hansen and J Wood 2010a Avian piscivores as vectors for Myxobolus ceshyrebralis in the Greater Yellowstone Ecosystem Transactions of the American Fisheries Society 139976-988
Koel TM JL Arnold PE Bigelow and ME Ruhl 2010b Native fish conservation plan Environmental asshysessment December 16 2010 National Park Service US Department of the Interior Yellowstone National Park Wyoming USA httpparkplanningnpsgovdocument cfmparkID=111ampprojectID=30504ampdocumentID=37967
Koel TM JL Arnold PE Bigelow PD Doepke BD Er-tel and ME Ruhl 2012 Yellowstone Fisheries amp Aquatic Sciences Annual report 2011 National Park Service Yelshylowstone Center for Resources Yellowstone National Park Wyoming USA YCR-2012-03
Martin NV and CH Olver 1980 The lake charr Salvelishynus namaycush Pages 205-277 in EK Balon editor Charrs Salmonid fishes of the genus Salvelinus Perspectives in vershytebrate science Kluwer Boston Hingham Massachusetts USA
Miller KM ML Clark and PR Wright 2004 Water qualshyity assessment of the Yellowstone River Basin Montana and
N a t i v e F i s h C o n s e r v a t i o n P r o g r a m | 5 3
Wyoming ndash water quality of fixed sites 1999-2001 US Geoshylogical Survey Scientific Investigations Report 2004-5113
Munro A R TE McMahon and JR Ruzycki 2005 Natushyral chemical markers identify source and date of introduction of an exotic species Lake trout (Salvelinus namaycush) in Yellowstone lake Canadian Journal of Fisheries and Aquatic Sciences 6279-87
Murcia S BL Kerans E MacConnell and TM Koel 2011Correlation of environmental attributes with histopathologyof native Yellowstone cutthroat trout naturally infected with Myxobolus cerebralis Diseases of Aquatic Organisms 93225shy234
Murcia S BL Kerans TM Koel and E MacConnell 2015 Myxobolus cerebralis (Hofer) infection risk in native cutshythroat trout Oncorhynchus clarkii (Richardson) and its relashytionships to tributary environments in the Yellowstone Lake Basin Journal of Fish Diseases 38637ndash652
Reinhart DP and DJ Mattson 1990 Bear use of cutthroat trout spawning streams in Yellowstone National Park Inshyternational Conference on Bear Research and Management 8343ndash350
Reinhart DP ST Olliff and KA Gunther 1995 Managshying bears and developments on cutthroat spawning streams in Yellowstone Park Pages 161-169 in AP Curlee AM Gillesberg and D Casey editors Greater Yellowstone predshyators ecology and conservation in a changing landscape Proceedings of the 3rd biennial conference on the Greater Yellowstone Ecosystem Northern Rockies Conservation Cooperative Jackson Wyoming USA
Rotella J 2014 Estimates of lake trout abundance in Yelshylowstone Lake for 2013 from mark-recapture data Montana State University Bozeman Montana USA Unpublished data
Ruzycki JR DA Beauchamp and DL Yule 2003 Effects of introduced lake trout on native cutthroat trout in Yellowshystone Lake Ecological Applications 1323-37
Ruzycki JR 2004 Impact of lake trout introductions on cutthroat trout of selected western lakes of the continental United States Dissertation Utah State University Logan Utah USA
Syslo JM CS Guy PE Bigelow PD Doepke BD Ertel and TM Koel 2011 Response of non-native lake trout (Salvelinus namaycush) to 15 years of harvest in Yellowstone Lake Yellowstone National Park Canadian Journal of Fishshyeries and Aquatic Sciences 682132-2145
Varley JD and P Schullery 1995a Executive summary Pages 2-3 in J D Varley and P Schullery editors The Yellowshystone Lake crisis confronting a lake trout invasion A Report to the Director of the National Park Service Yellowstone Center for Resources Yellowstone National Park Wyoming USA
Varley JD and P Schullery 1995b Socioeconomic values associated with the Yellowstone Lake cutthroat trout Pages 22-27 in J D Varley and P Schullery editors The Yellowshystone Lake crisis confronting a lake trout invasion A Report to the Director of the National Park Service Yellowstone Center for Resources Yellowstone National Park Wyoming USA
Varley J D and P Schullery 1998 Yellowstone fishes Ecolshyogy history and angling in the park Stackpole Books Meshychanicsburg Pennsylvania USA
Wendy Hafer helps deliver supplies into camp with the park helicopter - NPS photo
5 4 | Ye l l o w s t o n e F i s h e r i e s amp A q u a t i c S c i e n c e s 2 0 1 2 - 2 0 1 4
AppendixAppendix A Water quality stations sampled in 2012-2013
Yellowstone River Drainage
YELL_YS6164M Yellowstone River at Fishing Bridge YELL_YS6005M Yellowstone River at Canyon YELL_YS5497M Yellowstone River at Corwin Springs YELL_SB0157M Soda Butte Creek at park boundary YELL_SB0015M Soda Butte Creek near Lamar Ranger Station YELL_LM0005M Lamar River near Tower Ranger Station YELL_GN0029M Gardner River near Gardiner Montana YELL_RC0009A Reese Creek lower diversion YELL_RC0009B Reese Creek upper discharge mainstem
YELL_YL001OM-007OM Yellowstone Lake sites 1-7 YELL_FH0018C Firehole River near Madison Junction
Madison River Drainage YELL_GB0002M Gibbon River near Madison Junction YELL_MD1332T Madison River near park boundary
Snake River Drainage YELL_SN9999M Snake River at old Flagg Ranch stream sites that appear on Montanas 303(d) list
stream sampled in 2012 only
Yellowstone cutthroat trout sampling - NPS photo
N a t i v e F i s h C o n s e r v a t i o n P r o g r a m | 5 5
Appendix B Seasonal staff in 2012-2014
Seasonal Staff 2012 Seasonal Staff 2013 Seasonal Staff 2014 Christopher Daly Benjamin Brogie Benjamin Brogie Colleen Detjens Brent Trim Cristina Dressel
Earl Drescher Carla Rothenbuecher Josh Litvinoff Jaclyn Schultz Colleen Detjens Alex Poole Jay Fleming Cynthia Nau Nathan Roueche
Kole Stewart Jacob Williams Kristopher Shultz Kyle Mosel Kole Steward Nathan Thomas
Michael Consolo Michael Consolo William Voigt Nathan Thomas Michael Polchlopek Jacob Williams Tiffany Hutton Nathan Thomas William Holden Stephen Huffman William Voigt Theresa Campbell
William Voigt
Appendix C Student Conservation Association (SCA) Interns in 2012-2014
SCA Staff 2012 SCA Staff 2013 SCA Staff 2014 Alyssa Riggs Chay Leinweber Taher Ali
Amanda Guenther Chelsey Sherwood Carl Ausprung Carly Cavutt Donald Blenkendorf Trevor Beutel Cynthia Nau Eric Raslich Shannon Boyle
Haley Carlson Joshua Litvinoff Lauren Frisbie Heath Kessi Kody Kasper Hayley Glassic
Heather Paddock Larissa Lee Drew Mac Donald Jacob Williams Levi Garrett Lauren McGarvey
Nathan McWilliams Rick Inniello Andriana Puchany Regina Thill Thomas Short Rachel Voorhorst
Zebidiah Buck Justin Walley
FOR MORE INFORMATION wwwnpsgovycr

0
50
N a t i v e F i s h C o n s e r v a t i o n P r o g r a m | 1 1
Gillnets
Figure 2 Area of Yellowstone Lake within (red) and outside (green) of proposed wilderness that is at water depths (lt 60 m) suitable for gillnetting lake trout Black lines indicate gillnet set locations 2012-2014
5350 9
Tot
alL
ake
Tro
ut
Net
ted
(x10
00
)
45 8300
Average C
atch per 10
0m
N
et each N
ight
47
Bio
mas
s N
ette
dK
gH
ecta
re 35 250
6 3200 5
25 4150 23
100 15 2 11
05 0 0
200
12
002
200
32
004
200
52
006
200
72
008
200
92
010
201
12
012
201
32
014
1995 2000 2005 2010 2015 Total netted Catch-per-unit-effort
Figure 3 Number of lake trout removed from 2001 to 2014 The red line represents total catch-per-unit-effort (100 meter netnight for gillnets)
unit-effort for suppression gillnetting which had been inshycreasing each year since 2002 decreased from 82 in 2011 to 37 in 2014 (figure 3) Similarly estimated total biomass oflake trout removed from the population had been increasing
Figure 4 Total estimated lake trout biomass netted from Yellowstone Lake by all gear types 1995-2014
exponentially since the programrsquos inception but decreased from 44 kilograms of lake trout per hectare in 2012 to 39 kilograms of lake trout per hectare in 2014 (table 1 figure 4) Recent estimates of more than 4 kilograms of lake trout per hectare removed from the lake are well above reported susshytainable yields of less than 10 kilogram per hectare observed
1 2 | Ye l l o w s t o n e F i s h e r i e s amp A q u a t i c S c i e n c e s 2 0 1 2 - 2 0 1 4
Table 1 Estimated biomass (kilograms) of lake trout killed by small and large mesh gillnetting and live-entrapment netting on Yellowstone Lake 2011-2014
Small MeshGillnetting
Large MeshGillnetting
Live-EntrapmentNetting
Total
Kg Kg Kg Kg lbs 2011 61700 57 29800 27 17400 16 109000 240300 2012 79200 53 52700 35 18900 13 150800 332500 2013 71400 51 60300 43 9300 7 140900 310600 2014 63000 49 65200 51 130100 286800
Live-entrapment netting was not used in 2014
in other large northern lakes (Martin and Oliver 1980) Thus numbers of lake trout should be decreasing in Yellowstone Lake
Lake Trout Gillnetting The majority of gillnetting during the past three years foshycused on smaller fish residing in deeper water (20-60 meters) where cutthroat trout by-catch was low Small-mesh gillnets with box sizes of 25 to 38 millimeters caught 245230 lake trout (79200 kilograms) in 2012 247120 lake trout (71400 kilograms) in 2013 and 217620 lake trout (63000 kilograms) in 2014 Catches by small-mesh gillnets represented approxshyimately 50 of the total biomass removed each year (table 1)
To increase the removal of larger lake trout which have high reproductive potential and are more likely to prey on Yelshylowstone cutthroat trout the use of large-mesh gillnets with mesh sizes of 44 to 64 millimeters was increased over the past three seasons These nets were typically set at depths ofless than 30 meters Large-mesh gillnets caught 43580 lake trout (52700 kilograms) in 2012 48810 lake trout (60300 kilograms) in 2013 and 58830 lake trout (65200 kilograms) in 2014 Catches by large-mesh gillnets represented 35 ofthe biomass removed in 2012 43 in 2013 and 51 in 2014 (table 1) The highest numbers of adult lake trout removed by large-mesh gillnets occurred near Carrington Island in the Breeze Channel and near the West Thumb Geyser Basin (figure 2) Areas near the mouth of Flat Mountain Arm and southsoutheast of Frank Island also yielded many mature fish
Lake Trout Live-Entrapment NettingDuring 2012 and 2013 contract netters used 10 large trap nets to remove lake trout from Yellowstone Lake Trap nets capture and hold fish alive thereby providing a means to tarshyget lake trout in shallow near-shore areas where both lake trout and cutthroat trout are found Trap nets consist of a mesh lead (or guide) line up to 275 meters long and funshynel-shaped tunnels which direct fish into a lsquoboxrsquo constructed of heavy mesh The boxes are 12 meters by 6 meters and up to 9 meters tall enabling the capture of many large lake trout Trap nets were lifted and checked 1-2 times per week Anycaptured cutthroat trout were sorted from lake trout and reshyleased Although the primary use of trap nets was to remove lake trout they also permitted live capture of lake trout for research use (eg sonic telemetry and population size estishymation via mark-recapture)
In 2012 trap nets were used from June 19 to September 27 for a total of 879 net nights Total catch using trap nets was 12711 lake trout (18900 kilograms) and yield was 13 of total lake trout biomass (table 1) The top three lake trout-yielding trap nets were located in West Thumb The average number caught each night by a trap net in the West Thumb was 24 lake trout whereas trap nets located elseshywhere caught an average of 9 lake trout per night Average biomass removed by trap nets was 32 kilograms of lake trout per net-night in the West Thumb area and 15 kilograms per net-night in other areas
N a t i v e F i s h C o n s e r v a t i o n P r o g r a m | 1 3
Lake trout egg nets set near Carrington Island in Yellowstone Lake - NPS Photo
1 4 | Ye l l o w s t o n e F i s h e r i e s amp A q u a t i c S c i e n c e s 2 0 1 2 - 2 0 1 4
In 2013 trap nets were used from May 26 to August 28 for a total of 880 net nights Total catch using trap nets was 6648 lake trout (9300 kilograms) and yield was 7 of the total lake trout biomass removed from the lake (table 1) Only one of the top lake trout-yielding trap nets in 2013 was located in the West Thumb area because catches were distributed more evenly throughout the lake than in previous years Average biomass removed by trap nets was 12 kilograms of lake trout per net-night in the West Thumb area and 10 kilograms per net-night in other areas This reduction is partially due to removal of the trap nets prior to lake trout spawning in order to focus more on gillnetting during the fall spawning period
Lake Trout Suppression Alternative Methods Embryo Suppression on Spawning Areas ndash To reduce costs and ensure program viability into the foreseeable future there is a critical need to develop new more efficient ways of lake trout suppression Experts agree that methods which target lake trout embryos andor larvae on spawning sites hold the greatest promise Carrington Island a tiny island located in the West Thumb of Yellowstone Lake was first documented as a major lake trout spawning area in the late-1990s (Ruzycki et al 2003 Ruzycki 2004)
To determine the spatial extent of spawning substrate (rock cobble) around the island NPS crews used high-resolution Global Positioning Systems and a hand-held depth finder to map the outer and inner extent of substrate Total area ofspawning habitat around the crescent-shaped island was 05 hectare Water depths at the outer-most margin of the subshystrate were relatively shallow at 04 to 26 meters
Electroshocking to Suppress Lake Trout Embryos ndash The NPS has been working with the Montana Cooperative Fishshyery Research Unit (US Geological Survey) to develop elecshytroshocking methods to kill lake trout embryos The project supplemented an ongoing Montana State University project to develop an electrode array for the same purpose in Swan Lake Montana The prototype array was used on Swan Lake in 2013 and nearly 100 of lake trout embryos were killed to a depth of 20 centimeters in the substrate (Brown et al 2014)
A similar electroshocking array was used in Yellowstone Lake during 2014 The array is mobile and several known spawn-
Fisheries crews removing lake trout from gillnets aboard the NPS Freedom
ing reefs (Carrington Island Snipe Point and Olson Reef) were shocked during five days in early October No quantifishyable method was incorporated to determine how many eggs were destroyed though many dead eggs were observed after electroshocking A graduate student from Montana State University is developing a plan to assess the effectiveness offuture electroshocking events
Suction-Dredging to Suppress Lake Trout Embryos ndash Folshylowing the lake trout spawning period in late September 2012 embryos were found in abundance within the subshystrate in shallow water around Carrington Island Biologists used high-pressure water pumps to disrupt the rockcobble substrate and remove lake trout embryos from the shallow spawning area around the island At least several thousand
N a t i v e F i s h C o n s e r v a t i o n P r o g r a m | 1 5
embryos were likely disrupted and blown outward into soft sand sediments where they were unlikely to survive
In addition a suction dredge was used on spawning grounds during four days in late October 2014 The dredge removed approximately 5075 viable eggs 4000 eggs from Carrington Island 75 eggs from Snipe Point and 1000 eggs at Olson Reef Many more eggs were suctioned but most were alshyready dead since the electroshocking array was first used at these sites The suction dredge was able to remove lake trout eggs from substrate in both shallow and deep water (17 meshyters)
Applied Research to Improve Suppression Efficiency Sonic Tracking to Locate Spawning Areas ndash In 2011 the NPS and US Geological Survey initiated a telemetry studywith support from Trout Unlimited the National Parks Conshyservation Association and the Greater Yellowstone Coalishytion The objectives of this research are to locate lake trout spawning areas and identify movement corridors of lake trout within Yellowstone Lake Transmitters were implanted in 159 lake trout and 40 stationary acoustic receivers were deployed in Yellowstone Lake Receivers were distributed lake-wide with higher concentrations in areas suspected to be frequently used by lake trout At key passage points reshyceivers were distributed to form an acoustic curtain so at least one receiver would record the passage of tagged fish moving through the area Over 90 of tagged lake trout were detectshyed moving through Breeze Channel into West Thumb during spawning migrations Over 50 of tagged lake trout were detected at least once near the Carrington Island spawning site
Since 2011 additional receivers and transmitters have been incorporated in the study each year During spawning seashyson fine-scale positioning arrays of receivers have been deployed at suspected and known spawning areas to track tagged fish in 3-dimensional space through time In 2012 an array was deployed at Carrington Island In 2013 three arrays were deployed near West Thumb Geyser Basin along the southeast section of West Thumb and near the mouth ofFlat Mountain Arm to Plover Point In 2014 the Flat Mounshy
tain ArmPlover Point array was redeployed and expanded More details are available at httpwwwnrmscusgsgovyelshylowstone_lake
Lake Trout Population Size Estimate In 2013 the NPS and Montana State University initiated a mark-recapture study to estimate the population size oflake trout in Yellowstone Lake During June and July 2398 lake trout were captured in live-entrapment nets measured marked with two uniquely-numbered plastic tags and reshyleased Trap nets used to capture these lake trout were loshycated throughout West Thumb and the main portions of Yelshylowstone Lake (figure 6) Many of these marked lake trout were recaptured in gillnets and trap nets during the remainshyder of the netting season Anglers were also encouraged to return tags from marked fish they caught Recaptured lake trout were killed location method of capture total length sex and maturity were recorded
A total of 1334 lake trout were recaptured in 2013 which was more than half (56) of the total marked and released Recapture of tagged fish occurred by gillnetting (922 69) trap netting (357 27) and angling (55 4) The distribushytion of recaptured lake trout indicated they moved considershyable distances throughout the lake For example lake trout marked near the mouth of Solution Creek along the southshyern shore of West Thumb were recaptured throughout West Thumb in Breeze Channel along the lakersquos east shore and as far away as the southern end of the Southeast Arm (figure 6) Modeling efforts estimated lake trout abundance for four different length classes Estimates of abundance and accomshypanying standard errors (in parentheses) were as follows 303484 (plusmn 22350) lake trout in the 210-451 millimeter length class 41288 (plusmn 4456) in the 451-541 millimeter class 17278 (plusmn 4456) in the 541-610 millimeter class and 5601 (plusmn 812) in the greater than 610 millimeter class (Rotella 2014) Estimatshyed exploitation rates which are the proportions of fish reshymoved from the population along with accompanying 95 confidence intervals were as follows 072 (063-084) for lake trout in the 210-451 millimeter class 056 (046-071) for the 451-541 millimeter class 048 (038-066) for the 541-610 millimeter class and 045 (035-063) for the greater than 610 millimeter class (Rotella 2014)
1 6 | Ye l l o w s t o n e F i s h e r i e s amp A q u a t i c S c i e n c e s 2 0 1 2 - 2 0 1 4
Number Marked at Trap Recapture Site of Lake Trout Marked in Main Lake Recapture Site of Lake Trout Marked in West Thumb
Figure 5 Number of lake trout marked and released at each trap net with recapture locations in Yellowstone Lake
Lake Trout Egg Density and Survival Little is known about the early survival of lake trout in Yelshylowstone Lake from spawning to age 2 As a result current population modeling relies on estimates derived from reshysearch conducted mainly in the Great Lakes However earlysurvival rates in Yellowstone Lake could potentially be much higher than those observed in the Great Lakes due to a lack of natural predators and other factors
In 2013 the NPS collaborated with the US Geological Survey US Fish and Wildlife Service and the Universityof Vermont to obtain an assessment of lake trout embryo deposition at Carrington Island A total of 108 ldquoegg bagsrdquo were deployed by scuba divers in suitable spawning substrate along seven transects to the south northwest and north sides of the island Fine-mesh bags were placed so that any
eggs spawned over this substrate would be collected within the bag Following placement a photo was taken of each bag to estimate substrate size and location About one-half of the egg bags were removed on October 15 to assess the abunshydance and distribution of eggs in the area
Egg densities were higher northwest and south of the island but varied widely among collection bags (1 to 282 eggs) No eggs were found in about one-half of the bags (53) The pattern of egg deposition and density matched predictions based on work in the Great Lakesmdashmost of the bags containshying eggs and all bags with high egg densities were located at the edge of a short drop-off in the substrate Developing emshybryos (alive and dead) and unfertilized eggs were preserved and will be analyzed to determine the approximate date ofdeposition Remaining bags were retrieved during spring
N a t i v e F i s h C o n s e r v a t i o n P r o g r a m | 1 7
2014 to determine overwinter survival rates and if spawning continued past the date the first set of bags were removed
In 2014 a remotely operated underwater vehicle was used to verify successful spawning at Carrington Island and Olsonrsquos Reef located between Eagle Bay and Flat Mountain Arm Also larval fish traps deployed at Carrington Island from earshyly through mid-June revealed the presence of lake trout fry These fry may be vulnerable to suppression with electrical equipment during that period
Lake Trout Maturation Cycle and Reproductive Potential in Yellowstone Lake In 2014 samples of gonads and body weights collected from lake trout killed in suppression nets were used to evaluate maturation from June through October Reproductive tisshysue samples were stored for later histological analysis in the laboratory These data will be used to determine frequencyand pattern of lake trout spawning in Yellowstone Lake In addition a precise estimate of fecundity (ie productivity) is being developed for egg masses removed from female lake trout The results will be compared to previous estimates colshylected when the lake trout population was rapidly expanding
Spawning lake trout in Shoshone Lake - Photo copyJay Fleming
1 8 | Ye l l o w s t o n e F i s h e r i e s amp A q u a t i c S c i e n c e s 2 0 1 2 - 2 0 1 4
Monitoring Performance Metrics on Yellowstone Lake
Figure 6 Sampling sites on Yellowstone Lake and associated creeks
Progress toward cutthroat trout recovery and desired condishytions for Yellowstone Lake was assessed annually through 1) lake-wide population assessments of cutthroat trout and lake trout conducted via distribution gillnetting at three depth strata in August 2) cutthroat trout spawning assessments using weirstraps or by making visual counts on tributarystreams from May through July and 3) cutthroat trout catch success reported by lake anglers during the fishing season
Lake-Wide Cutthroat Trout Population Assessment Each fall NPS biologists conduct distribution netting of cutshythroat trout and lake trout in Yellowstone Lake to estimate age and size class structure distribution recruitment and mortality from the lake trout suppression program Twenshyty-four sites are sampled within the motorized portions of the lake including West Thumb the main basin surrounding Dot and Frank islands the northern shore and area surrounding Stevenson Island and the east shore and two southern arms (figure 6) At each sampling site large-mesh and small-mesh
Figure 7 Length-frequency distribution of cutthroat trout collected from distribution netting on Yellowstone Lake with total number of trout (n) 2011-2014
N a t i v e F i s h C o n s e r v a t i o n P r o g r a m | 1 9
nets are set in shallow water at mid-depth and more than 40 meters deep Mesh sizes on the large-mesh nets range from 57 to 89 millimeters while sizes on small-mesh nets range from 19 to 51 millimeters
The distribution nets caught 1071 cutthroat trout in 2012 1259 cutthroat trout in 2013 and 1421 cutthroat trout in 2014 (figure 7) These catches are more than double those in 2011 The increase in catch each year was primarily due to an influx of young juvenile cutthroat trout within the system however increased catches of large older-age fish also ocshycurred Cutthroat trout had a mean total length of 358 milshylimeters in 2012 382 millimeters in 2013 and 405 millimeshyters in 2014 (figure 7) These mean lengths were much lower than those observed in earlier years In 2014 most (53) cutthroat trout were large adults between 430 and 620 milshylimeters in total length while juveniles and subadults (29) were less than 325 millimeters in total length
Using the two shallow nets from each of the distribution sites mean number of cutthroat trout caught per 100 meters of net per night was calculated (with 95 confidence intershyvals in parentheses) Catch per unit effort increased from an average of 118 (87-150) in 2010 to 284 (237-330) in 2014 (figure 8) The 2014 catch exceeds the secondary desired condition for the programrsquos adaptive management strategyof 26 cutthroat trout per net (figure 9a)
The large recruitment of young cutthroat trout detected through distribution netting during 2012 through 2014 is an indication the cutthroat trout population is beginning to recover Factors contributing to the increased number ofyoung fish may include the greatly increased effort to supshypress lake trout as well as improved winter snow conditions and stream runoff in recent years
Cutthroat Trout Tributary Spawning Assessshyment For over 50 years spawning cutthroat trout were counted as they ascended Clear Creek a large tributary on Yellowstone Lakersquos eastern shore In 2008 spring flood waters damaged the weir rendering it inoperable Since that time efforts have been made to restore the ability to count spawning cutthroat trout at the site In 2012 the NPS with help from the Monshytana Conservation Corps completely renovated the weir site including removing badly damaged components of the old
2 0 | Ye l l o w s t o n e F i s h e r i e s amp A q u a t i c S c i e n c e s 2 0 1 2 - 2 0 1 4
Clear Creek Cutthroat Counting Station reconstructed in 2012 Spawning cutthroat trout are counted in Clear Creek a large remote tributary on Yellowstone Lake using an acoustic monitoring system -NPS photo
weir reengineering and reconstructing the bulkhead on the southern stream bank constructing a new shed and bridge and rehabilitating stream bank erosion caused by the conshyfiguration of the old weir The project did not include reshyconstructing the weir itself because the NPS installed a sonar (acoustic) fish counting system (Sound Metrics Corporation model ARIS 3000) in 2013 During 2013 and 2014 fisheries staff learned to use system operating software identified loshycations where the sonar could effectively capture fish images and evaluated the solar energy supply
Since 1988 the abundance of spawning cutthroat trout has also been visually estimated by people walking along 9 to 11 tributaries on the west side of Yellowstone Lake (Reinshy
hart and Mattson 1990 Reinhart et al 1995 figure 6) These surveys indicated a significant decrease in spawning-age cutthroat trout in Yellowstone Lake (figure 9b) In the late 1980s more than 70 cutthroat trout were typically observed during a single visit to one of the streams compared to only1 or 2 cutthroat trout in recent years One exception is Litshytle Thumb Creek a tributary in the West Thumb near Grant where more than 70 cutthroat trout were seen during one week in 2012 more than 50 were seen in 2013 and more than 120 were seen in 2014 The desired conditions for Yellowshystone Lake are an average of at least 40 to 60 spawning cutshythroat trout observed per stream visit across all 11 tributaries (figure 9b)
c
N a t i v e F i s h C o n s e r v a t i o n P r o g r a m | 2 1
Figure 8 Mean number of cutthroat trout caught per 100 m net per night in distribution netting on Yellowstone Lake 2010-2014 Bars delineate 95 confidence intershyvals
a
b
Figure 9 Metrics monitored to assess the effects of conshyservation actions on Yellowstone Lake include the avershyage number of cutthroat trout that are (9a) caught per net during the fall netting assessment (9b) observed during visual surveys of spawning streams and (9c) caught per hour by lake anglers 1985-2013 Primary and secondary desired conditions are from the Native Fish Conservation Plan
Cutthroat Trout Angler Success Since 1979 park visitors who purchase a fishing permit have been given a survey card on which to report waters fished time spent fishing and species and sizes of fish caught About 5 of these anglers (approximately 2000 per year on average) have completed and returned the cards to the parkrsquos fisheries program Yellowstone Lake receives over 20 ofthe parkwide angling effort In Yellowstone Lake cutthroat trout catch rates were as high as 2 fish per hour in the 1990s but decreased substantially in the early 2000s to only 06 fish per hour in 2012 (figure 9c) However more recent angling reports from Yellowstone Lake are encouraging In 2014 anglers reported catching 12 cutthroat trout per hour This catch rate is still below the desired condition of 15 to 2 cutshythroat trout per hour but is higher than the previous 12 years (figure 9c) The average size of cutthroat trout being caught decreased to 438 millimeters (17 inches) due to an increase of smaller fish being caught rather than a decrease in larger fish
Lake-Wide Lake Trout Population Assessment A total of 394 lake trout were caught by distribution nets in 2012 347 were caught in 2013 and 575 were caught in 2014 (figure 10) The mean total length for lake trout was similar among years (309-330 millimeters) but the range in sizes deshycreased with fish less than 200 millimeters and greater than 500 millimeters being caught less frequently each year Most captured lake trout were immature fish less than 425 millimeshyters in total length
High cutthroat trout consumption by lake trout is prevshyalent in the arms of Yellowstone Lake
2 2 | Ye l l o w s t o n e F i s h e r i e s amp A q u a t i c S c i e n c e s 2 0 1 2 - 2 0 1 4
Figure 10 Length-frequency distribution of lake trout collected from distribution netting on Yellowstone Lake with total number of trout (n) 2011-2014
The mean number of lake trout captured per 100 meters of net varied from 29 (95 confidence intervals = 21-37) in 2013 to 49 (34-63) in 2014 (figure 11) but was not sigshynificantly different among years The highest catch per unit effort (63) occurred in West Thumb during 2012 along the east shore and in the southern arms during 2013 (36) and in the main basin during 2014 (66) (figure 12) Catch per unit effort for lake trout was lowest along the north shore
Population Modeling and Lake Trout Mortality The Montana Cooperative Fishery Research Unit has led efforts to analyze lake trout catch and monitoring data colshylected from Yellowstone Lake Analyses include the total anshynual mortality for lake trout (ages 3 and greater) for each year during 1997-2014 (Syslo et al 2011) Results indicate that mortality inflicted on lake trout due to suppression netting and other causes has increased from 024 (017-021) in 1997 to 053 (047-058) in 2013 (figure 13) This number slightlydecreased in 2014 to 048 (036-057) Statistical modeling methods have also been used to reconstruct the abundances of lake trout each year Results suggest that lake trout abunshydance (Syslo et al 2011) increased from 129382 (range = 111593 to 147171) in 1998 to 809858 (676672 to 942996)
Figure 11 Mean number of lake trout caught per 100 m net per night in distribution netting within four Yelshylowstone Lake regions 2010-2014 Bars delineate 95 confidence intervals
Yellowstone Cutthroat TroutLake Trout
15
10
5
0
2012
2014
Nu
mb
er o
f Fi
sh p
er 1
00 M
eter
s o
f N
et
0
5
10
15 2013
15
10
5
0 West Main North EastArms
Thumb Basin Shore
Lake Region Yellowstone Cutthroat Trout Lake Trout
Figure 12 Mean number of cutthroat trout and lake trout caught per 100 m net per night in distribution netting within four Yellowstone Lake regions 2012-2014
N a t i v e F i s h C o n s e r v a t i o n P r o g r a m | 2 3
in 2012 but then decreased to 485468 (359020 to 611916) in 2014
Whirling Disease Status Assessment The exotic parasite Myxobolus cerebralis which causes whirlshying disease was first detected in Yellowstone cutthroat trout from Yellowstone Lake in 1998 Monitoring and research were conducted from 1999 through 2005 on 13 tributaries to determine its effects on cutthroat trout and whether actions could be taken to mitigate for them (Murcia et al 2011 Murshycia et al 2015 Alexander et al 2011) Parasite prevalence and severity of infection were high in exposed sentinel fry in Pelican Creek and in the Yellowstone River downstream ofthe lake outlet The spawning cutthroat trout population ofPelican Creek which once numbered more than 30000 was essentially eliminated The prevalence of Myxobolus cereshybralis in juvenile and adult cutthroat trout from Yellowstone
Figure 13 Lake trout annual mortality estimated using catch curves (data from distribution netting) from 1997 to 2014 in Yellowstone Lake Horizontal line delineates the target of 056 stated in the Native Fish Conservation Plan
Lake varied annually between zero and 20 Prevalence was generally highest in the lakersquos northern region near infected tributaries
In 2012 research was initiated to determine if Myxobolus cerebralis had dispersed further across the ecosystem and whether it had the potential to limit cutthroat trout recovshyery in and near Yellowstone Lake Cutthroat trout fry were
2 4 | Ye l l o w s t o n e F i s h e r i e s amp A q u a t i c S c i e n c e s 2 0 1 2 - 2 0 1 4
placed in sentinel cages deployed in 22 downstream reaches of spawning tributaries for 12-day periods to assess whirling disease risk (figure 6) Ten fry from each location were asshysayed for the presence of Myxobolus cerebralis In addition some of the cutthroat trout caught at each of the 24 distribushytion netting sites were assayed for the presence of the parashysite Findings indicate that whirling disease risk remains high in Pelican Creek (figure 6) In addition one fry tested weakshyly positive for Myxobolus cerebralis in the Yellowstone River upstream of Yellowstone Lake All other streams tested negshyative Within Yellowstone Lake 14 of 139 (10) cutthroat trout were infected Overall it does not appear whirling disease has spread widely throughout spawning tributaries to Yellowstone Lake and the prevalence of infection in juveshyniles and adults within the lake remains low
Science Panel Reviews of the Yellowstone Lake Program The first scientific review panel evaluation of the Yellowstone Lake program occurred in 1995 soon after lake trout were discovered in the lake (Varley and Schullery 1995b) In 2008 the NPS again convened a panel of experts to evaluate the program and to make recommendations for improvement (Gresswell 2009) Science panel reviews have occurred anshynually since 2011 to inform the programrsquos adaptive manageshyment strategy
From 2012 to 2014 information reviewed by the scientific panel included suppression activities updated population modeling results from monitoring lake trout and cutthroat trout proposed actions for the forthcoming field seasons reshysults of lake trout sonic telemetry studies and summaries ofalternative suppression techniques In 2014 the panel noted substantial progress had been made and concluded the lake trout population should begin to collapse if effort was mainshytained at the 2013-level for at least five years The panel also recommended that effort be continued for a minimum of 10 years or until suppression goals outlined in the Native Fish Conservation Plan are met (Gresswell et al 2013a Gresswell et al 2013b)
Yellowstone Cutthroat fry - Photo copyJay Fleming
N a t i v e F i s h C o n s e r v a t i o n P r o g r a m | 2 5
Electroshocking Flint Cascade the upper extent of the cutthroat trout-rainbow trout hybridization in the Lamar River system - NPS photo
2 6 | Ye l l o w s t o n e F i s h e r i e s amp A q u a t i c S c i e n c e s 2 0 1 2 - 2 0 1 4
Restoration of Cutthroat Trout amp Arctic Grayling in Streams
Over the past decade Yellowstone National Park has taken actions to restore and preserve native fish in several streams and lakes These actions include suppression or complete removal of harmful nonnative species Since 2006 four streams comprising 511 linear miles and four lakes comshyprising 49 surface acres of habitat have been restored for native fish In addition 148 and 152 linear stream miles ofupper Soda Butte Creek and upper Slough Creek respecshytively have been electrofished annually to suppress nonshynative and hybrid trout These efforts are resulting in an increase in habitat occupied by native fish in Yellowstone National Park
Westslope Cutthroat Trout Restoration on East Fork Specimen Creek The East Fork Specimen Creek project began in 2006 Inishytially it included the removal of nonnative fish from High Lake and all but the lowest portion of East Fork Specimen Creek as well as the construction of a log fish barrier with a life expectancy of 10 years During 2007 through 2012 more than 15000 westslope cutthroat trout eggs and nearly3000 juveniles and adults were reintroduced to East Fork Specimen Creek to reestablish a viable naturally-reproducshying population within the watershed (figure 14 table 2)
Figure 14 East Fork Specimen Creek westslope cutthroat trout restoration area in the Specimen Creek watershed in northwestern Yellowstone National Park with locations of remote site incubators (RSI) for reintroduction of westshyslope cutthroat trout embryos
Table 2 Total number of westslope cutthroat trout reintroduced into the East Fork Specimen Creek watershed 2007-2012
Year Eggs Fish High Lake 2007 1377 1144
2008 3130 890 2009 838 930
East Fork Specimen Creek 2010 4503 2011 2246 2012 3550
Total at Project Completion 15664 2964
The future of the project will include monitoring westslope cutthroat trout abundance and genetic integrity as well as the condition and performance of the fish barrier To ensure the persistence of westslope cutthroat trout an engineered barrier will need to be constructed on the lower mainstem of Specimen Creek near Highway 191 (figure 14) If the barshyrier is completed the project could be integrated into a largshyer westslope cutthroat trout restoration to all of Specimen Creek drainage including the North Fork In fall 2011 an enshygineering and planning firm was retained to conduct detailed topographic mapping and design this fish barrier A concepshytual design and engineering plans have been created which could lead to efforts to construct the barrier and complete the watershed-scale westslope cutthroat trout recovery
Native Fish Community Restoration on Grayshyling Creek Fluvial (river-dwelling) Arctic grayling were once abundant in the Madison and Gallatin river drainages of Yellowstone National Park However the introduction of nonnative fish and the construction of Hebgen Reservoir on the Madison River just downstream of the park led to the speciesrsquo decline and eventual extirpation from park waters Fluvial Arctic grayling are currently the only native fish species extirpated from park waters Westslope cutthroat trout native to the same waters in Yellowstone as Arctic grayling have fared litshytle better over the last century In fact only one aboriginal population of westslope cutthroat trout remains in the park located in Last Chance Creek a tributary to Grayling Creek In order to return Arctic grayling to Yellowstone National Park and ensure the persistence of westslope cutthroat trout
N a t i v e F i s h C o n s e r v a t i o n P r o g r a m | 2 7
the park began surveying Grayling Creek in 2007 (Koel et al 2008) and identified Grayling Creek as a critical project within the Native Fish Conservation Plan (see ldquoThrough a Biologistrsquos Eyesrdquo page 34)
The first conservation action required on Grayling Creek was to isolate the restoration area by modifying an existing bedshyrock waterfall located in a canyon near Highway 191 (figure 15) An engineering and planning firm completed a barrier design and in fall 2012 the NPS partnered with technical blasters from the Gallatin National Forest to create the barshyrier Additional finish work was conducted in 2013 and 2014 by contractors with Intermountain Restoration The modifishycation elevated the barrier to a height gt 6 feet and filled deep pools to create a large concrete ldquosplash padrdquo at the barrier base The falls are now a complete barrier to upstream fish movement by rainbow and brown trout located downstream in Hebgen Reservoir (figure 15)
The Grayling Creek restoration area includes 95 kilometers (59 miles) of connected stream habitat with a typical sumshymer discharge of 40 cubic feet per second downstream near the fish barrier Actions to remove nonnative fish from the Grayling Creek restoration area upstream of the barrier beshygan in 2013 with assistance from the US Forest Service US Fish and Wildlife Service Montana Fish Wildlife amp Parks and Turner Enterprises Inc More than two dozen fish bishyologists and technicians worked for several weeks to remove nonnative and hybrid trout from the restoration area using rotenone A second rotenone treatment took place during 2014 The reintroduction of westslope cutthroat trout and fluvial Arctic grayling to the drainage began in 2015
Westslope Cutthroat Trout Brood Development at Goose Lake The restoration of native fish populations is contingent on having brood sources from which to reestablish native fish populations A brood source should be accessible secure from contamination self-sustaining genetically diverse abundant of traceable origin and pose no risk to existing wild populations The opportunity to create such a brood source for westslope cutthroat trout exists within the Goose Lake chain of lakes in the Firehole River drainage of Yellowshystone National Park These lakes are not connected to the
2 8 | Ye l l o w s t o n e F i s h e r i e s amp A q u a t i c S c i e n c e s 2 0 1 2 - 2 0 1 4
Figure 15 Locations of rotenone treatments and a modified waterfall barrier in the Grayling Creek drainage in 2014
river (figure 1) and are easily accessible due to their proximityto the Fountain Flat Drive Service Road These lakes were historically fishless but were stocked with nonnative rainshybow trout more than 100 years ago
In 2011 Goose Lake Gooseneck Lake and a small conshynected unnamed lake were treated with rotenone to remove rainbow trout In 2012 extensive monitoring including netshyting snorkeling and electrofishing confirmed that rainbow trout had been removed During 2013 and 2014 more than 5300 fry originating from multiple wild sources in the upper Missouri River drainage were stocked into Goose Lake The future of the project will include monitoring abundance and genetic integrity as well as stocking the upper two lakes ofthe complex
Yellowstone Cutthroat Trout Conservation in Northern Yellowstone Over the past decade considerable efforts have been investshyed in understanding the status and trends of Yellowstone cutthroat trout across the northern reaches of the park These efforts have identified several potential cutthroat trout conservation actions in small streams and lakes as well as
alarming trends and potential threats in three of the regionrsquos largest and most important cutthroat trout fisheries Nonshynative hybridizing rainbow trout are abundant in the lower Lamar River lower Slough Creek (downstream of the campshyground) and Yellowstone River between the Lower Falls at Canyon and Knowles Falls (figure 16)
Conservation of Yellowstone cutthroat trout of the Lamar River watershed is a top priority for the NPS Multiple tools are being used to mitigate for rainbow trout in the Lamar Rivshyer and its tributaries including 1) suppression via electroshyfishing by NPS crews 2) creation of barriers to prevent furshyther upstream movements and invasions by rainbow trout 3) suppression via a catch-and-kill regulation for visiting anshyglers and 4) suppression via removal by volunteer anglers
Nonnative brook trout which outcompete and displace cutshythroat trout exist in upper Soda Butte Creek Each year a week-long interagency electrofishing effort occurs to keep the population suppressed Brook trout are not known to live anywhere else in the Lamar River drainage but there are several populations in small tributaries of the Yellowshystone River near its confluence with the Lamar River These tributaries include the Elk-Yanceys-Lost Creek complex
N a t i v e F i s h C o n s e r v a t i o n P r o g r a m | 2 9
of streams Tower Creek and its large tributary Carnelian Creek and the many creeks of the Blacktail Deer Plateau drainage (figure 16) Beginning with Elk-Yanceys-Lost Creek complex the NPS is working to remove the threat ofbrook trout from these small tributaries with rotenone Folshylowing treatment the streams will be restocked with Yellowshystone cutthroat trout from nearest-neighbor sources such as Antelope Creek
Elk-Yanceys-Lost Creek Complex ndash Given the close proximity of Elk Yanceys and Lost creeks to the confluence of the Lamar and Yellowstone rivers (figure 17) a project was initiated in 2012 to remove the threat of brook trout and restore Yellowstone cutthroat trout to the drainage Historshyically it is unclear if the Elk Creek drainage was home to cutshy
throat trout but cutthroat trout were present in the stream when brook trout were introduced in 1942 (Varley and Schullery 1998) Since that time brook trout have completeshyly displaced all other fish species from the watershed
The presence of a large natural cascade on Elk Creek near the Yellowstone River that serves as a barrier to fish movements allowed the project to begin with nonnative fish removal (figshyure 17) In 2012 rotenone was applied to all of the fish-bearshying portions of the drainage leading to the removal of thoushysands of brook trout However post-treatment monitoring found some brook trout had survived the treatment due to complex dense woody debris habitat and slow water travel times through some stream reaches In 2013 all fish-bearshying waters in the complex were retreated but post-treatment
Figure 16 Fish species presence within tributary watersheds of the lower Lamar and Yellowstone river drainages Brook trout are being actively removed in this area to prevent invasion by this harmful nonnative species
Wil l
owC
reek
S l o u g hM e a d o w s
M i d d l e L a m a r
Canyon
Mammoth
Ya
ncey
Cr
E l k C r e e k
Yellowstone River
Dry Reach Yancey Cr
Fish Barrier
Lost Creek Falls
ElkC
reek
Elk Creek Falls
Los t Cr Lost Lake
Detox Station Fish Barrier Roads Streams Lost Creek Dry Reach
0 105 km
3 0 | Ye l l o w s t o n e F i s h e r i e s amp A q u a t i c S c i e n c e s 2 0 1 2 - 2 0 1 4
2014 Drip Station Locations
Figure 17 Location of Elk Creek removal of brook trout using rotenone in 2012-2014
0 105 mile
Figure 18 Middle Lamar River drainage including locashytions of electrofishing removals of rainbow trout and hyshybrid trout from Slough Creek (Meadows 1-3) and brook trout from Soda Butte Creek (reaches 1-9)
Sod aButte
Cr
C a c heCre
ek
S o u t h Cache Creek
Op
al C
reek
Twi n
Creek
Flint Falls Cascade
Slough Creek Barrier
Sl o
ugh
Creek Elk T o ngue
Cr
Ho rna day Cr
Pe
bb
le C
r
A m
phith
eate
r Cr
Jasp
er
Cr Rose Cr
Am
ethy
s tC
r
Chal
cedon
y Cr
Re
pu
bli
c C
r
Cooke City
Silver Gate
Road Bridge II (End Removal 2013)
Ice Box Canyon (End Removal 2012)
Warm Creek
BeginMine Tailings Removal
12345678
9 1st Meadows
2nd Meadows
3rd Meadows
0 2 41 Miles
0 2 41 Kilometers
End Removal Points
Proposed Barriers
Existing Barriers
Bridges
Cities
Roads
Major Streams
Other Streams
Ecological Zones
Yellowstone Boundary
surveys revealed brook trout were still present in two locashytions Therefore a third treatment was conducted in 2014 The efficacy of this treatment will be evaluated in 2015 and lead to either a fourth treatment with rotenone or the reinshytroduction of Yellowstone cutthroat trout
Soda Butte Creek ndash Interagency efforts to suppress brook trout in Soda Butte Creek have been ongoing for more than a decade From 2012 to 2014 biologists from the NPS US Forest Service Montana Fish Wildlife amp Parks and Wyoshyming Game and Fish Department sampled upper Soda Butte Creek from Highway 212 downstream to Ice Box Canyon usshying boat-mounted electrofishing equipment (figure 18) Also tributary streams were sampled using backpack electrofishshying units Electrofishing surveys resulted in 2018 cutthroat trout in 2012 2531 in 2013 and 1399 in 2014 Numbers ofcutthroat trout sampled have varied over the years with effort expended but in one stream section where effort has been constant cutthroat trout numbers have shown a steady deshycrease from 759 in 2009 to 135 in 2014
The number of brook trout removed from the mainstem ofSoda Butte Creek has remained relatively consistent over the past several years with 108 brook trout captured in 2012 111 in 2013 and 102 in 2014 (table 3) These catches are similar to the 5-year mean of 110 fish However in 2013 an addishytional 54 brook trout were captured from one unnamed tribshyutary just inside the boundary of Yellowstone National Park The presence of large numbers of young-of-year indicated brook trout are successfully spawning in this small creek The lack of young-of-year brook trout in Soda Butte Creek upstream of this tributary is evidence this stream is a major source of brook trout
N a t i v e F i s h C o n s e r v a t i o n P r o g r a m | 3 1
Table 3 Total (and young-of-year) brook trout mechanically removed from Soda Butte Creek within the Gallatin National Forest State of Montana and in Yellowstone National Park 2004ndash2014
Site Removal Reach 2004 2005 2006 2007 2008 2009 2010 2011 2012 2013 2014
1 Hwy 212 to McClaren MineTailings
19(1) 3(0) 0(0) 0(0) 0(0) NS NS NS 0(0) 0(0) 1(0)
2 McClaren Mine Tailings to WoodyCreek
15(0) 17(0) 3(0) 3(0) 2(0) NS NS NS NS NS 0(0)
3 Woody Creek to Sheep Creek 8(2) 43(0) 16(0) 0(0) 1(0) NS NS 2(0) 0(0) 0(0) 1(0)
4 Sheep Creek to Silver Gate 251(79) 932(51) 142(6) 45(8) 5(0) 6(0) NS 30(1) 5(0) 4(0) 2(0)
5 Silver Gate to Yellowstone Park Boundary
9(3) 80(9) 54(2) 48(19) 13(0) 30(2) 16(0) 22(2) 10(0) 2(0) 30(3)
6 Yellowstone Park Boundary to Warm Creek
7(0) 11(0) 0(0) 50(27) 23(2) 56(10) 43(2) 15(0) 29(9) 35(0) 8(0)
7 Warm Creek to Road Bridge 0(0) 1(0) 0(0) 0(0) 3(1) 51(12) 68(29) 35(6) 53(10) 54(23) 55(4)
8 Road Bridge I to Road Bridge II NS NS NS NS 0(0) 1(0) 7(0) 2(0) 11(2) 16(3) 3(0)
9 Road Bridge II to Ice Box Canyon NS NS NS NS 0(0) 0(0) NS 0(0) NS NS NS T Tributaries 0(0) 17(0) 15(0) 4(0) 1(0) 8(0) NS NS 0(0) 54(19) 2(0)
Total 309 1104 230 150 48(3) 152(24) 134(31) 106(10) 108(21) 165(45) 102(7)
In 2013 personnel from the NPS and Gallatin National Forest modified a natural falls in Ice Box Canyon to create a complete barrier to upstream fish migration (figure 18) Currently the plan is to continue with the electrofishing reshymoval of brook trout in the system while exploring other alshyternatives These removal efforts are preventing an increase in brook trout numbers but not eliminating them from the creek Also removal efforts are not preventing brook trout from moving downstream into tributary streams above Ice Box Canyon To date no brook trout have been found in Soda Butte Creek downstream of Ice Box Canyon
Slough Creek ndash Hybridization of cutthroat trout with nonnative rainbow trout poses a serious threat to the longshyterm persistence of cutthroat trout in Slough Creek During 2012 and 2014 electrofishing surveys were conducted to asshysess trout abundance collect tissue samples for genetic analshyysis and remove nonnative rainbow trout and hybrid trout (figure 18) Overall 36 rainbow trout and hybrids were reshymoved from the system The number of rainbow trout and hybrids appears to be increasing over the past decade only17 fish were removed in 2002 and 2003
Results from electrofishing surveys in the first meadow ofSlough Creek indicate the abundance of Yellowstone cutshythroat trout has significantly decreased from 308 plusmn 49 in 2002 to 173 plusmn 32 in 2012 The mean length of cutthroat trout was
346 millimeters in 2002 356 millimeters in 2012 and 254 milshylimeters in 2014 Almost all cutthroat trout sampled in 2012 were slightly hybridized with rainbow trout (999 cutthroat trout and 01 rainbow trout) Results of 11 fish specificallysampled because they visually appeared to be hybrid trout showed two were genetically pure cutthroat trout one was a genetically pure rainbow trout and eight were hybrids The presence of a genetically pure rainbow trout is evidence nonshynative fish are entering Slough Creek meadows from a downshystream source
In 2014 an engineering firm designed a barrier along Slough Creek to prevent upstream movements by rainbow trout further site visits will be necessary in 2015 to finalize the deshysign and cost estimates When constructed the barrier will prevent further immigration of rainbow and hybrid trout into the upper meadows of Slough Creek
Upper Lamar River ndash The NPS has been collecting geshynetic samples since 2010 from fish in the Lamar River (figshyure 19) to determine if rainbow trout have hybridized with cutthroat trout upstream of Cache Creek In 2012 NPS bishyologists investigated Flint Falls Cascade on the Lamar River which had been reported as a potential fish barrier to moveshyments upstream Due to the lack of vertical drop however the cascade is almost certainly not a barrier to upstream fish movement Thus 40 kilometers of the Lamar River and over
3 2 | Ye l l o w s t o n e F i s h e r i e s amp A q u a t i c S c i e n c e s 2 0 1 2 - 2 0 1 4
644 kilometers of its tributaries remain highly susceptible to invasion by rainbow trout and other nonnative fish located downstream The NPS has contracted an engineering surveyand design of a fish barrier at Flint Falls Cascade which mayinclude alternatives to vertical and velocity barriers such as electrical barriers that could be used to deter nonnative fish movement
In 2013 215 tissue samples were collected from trout in nine sample locations between Calfee and Soda Butte creeks (figshyure 19) Genetic analysis of these samples revealed slight hybridization with rainbow trout (999 purity) as far upshystream as Flint Falls Cascade approximately 13 kilometers upstream of Soda Butte Creek (figure 19) However all tisshysue samples collected 3 and 5 kilometers below the cascade
were from genetically unaltered Yellowstone cutthroat trout as were all samples collected upstream of the cascade
In 2014 145 tissue samples were collected from trout in six sample locations on Cache Creek a tributary of Lamar River (figure 19) These samples are still being processed
Joffe Lake ndash This artificial impoundment supplies drinkshying water to the headquarters area of Yellowstone National Park Historically the lake has supported a nonnative brook trout fishery for youth anglers In 2013 and 2014 the lake was stocked with 4000 Yellowstone cutthroat trout finger-lings Plans are to continue infusing the system with native cutthroat trout while suppressing the brook trout populashytion via electrofishing during the fall spawning period
Figure 19 Lamar River watershed with genetic status of cutthroat trout collected at sites based on tissue sample collections collected from 2010 to 2014 The cutthroat trout of Cache Creek and the Lamar River and tributaries upshystream of the Flint Creek Cascade remain genetically unaltered
N a t i v e F i s h C o n s e r v a t i o n P r o g r a m | 3 3
Caddis fly hatch near Lake Village - Photo copyDoug Hilborn
3 4 | Ye l l o w s t o n e F i s h e r i e s amp A q u a t i c S c i e n c e s 2 0 1 2 - 2 0 1 4
Through a Biologistrsquos EyesBy Colleen Detjens
By 1950 there were no truly fluvial (stream dwelling) popushylations of Arctic grayling left in Yellowstone National Park Historically fluvial grayling inhabited the Gallatin River Grayling Creek Madison River and the lower portions ofthe Firehole and Gibbon rivers The only remaining populashytions in the park exist in the form of lake dwelling grayling in several lakes outside of their native range This fact led park biologists to seek out a suitable site in which to restore a viashyble fluvial grayling population Grayling Creek on the west side of the park was chosen for several reasons In addition to previously being home to a population of fluvial grayling it also contained westslope cutthroat trout another species whose occupied range has dwindled over the years Grayling have disappeared from their native range for several reasons namely the introduction of nonnative brown and rainbow trout Nonnative fish compete with native populations for habitat and food rainbow trout also hybridize with the native cutthroat creating a less viable population In addition Grayshyling Creek is an extensive drainage with habitat that varies from small cascading tributaries to large meandering meadshyows and includes 18 miles (29 km) of main-stem stream An existing waterfall at the downstream end provided an ideal location to create a complete barrier to upstream movement of nonnative fish a key element to successfully restoring nashytive fish populations
The reintroduction of Arctic grayling into Grayling Creek has been a long process In 2007 NPS biologists along with grayshyling biologists from Montana Fish Wildlife amp Parks (MFWP) conducted a site visit to confirm that Grayling Creek did inshydeed have enough suitable habitat to support a robust popshyulation of fluvial grayling Reintroduction would also proshy
vide an opportunity to restore pure westslope cutthroat to the drainage In the following years NPS crews began to laythe groundwork needed to complete this large-scale project Fish surveys were conducted to find the upper extents of fish occupation in the forks and the extensive numbers of tribushytaries to Grayling Creek Genetic samples were collected to determine whether any pure westslope cutthroat remained unfortunately hybridization extended throughout the drainshyage Spatial Analysis Program personnel were asked to map as much of the system as they could to determine where all of the tributaries and springs were located a daunting task as it turns out because there are many small springs and tribushytaries on Grayling Creek and no trails The Native Fish Conshyservation Plan and Environmental Assessment which covers projects throughout the park including Grayling Creek was painstakingly written and reviewed And of course funding and support had to be secured for all phases of the project from barrier construction through the treatment to the reinshytroduction of native species
In 2011 engineers were brought to the Grayling Creek washyterfall to determine the feasibility of modifying the existing feature into a complete barrier to upstream fish movement Fish especially rainbow and brown trout are adept at taking advantage of small pockets and other irregularities to lsquosteprsquo their way up a waterfall They also make use of the deep pools that form at the base of waterfalls to gather enough velocityto jump over the falls In October 2012 a US Forest Service blasting crew began work to modify the falls Their efforts created a sheer face of rock all the way across the stream In 2013 work was continued by an independent contractor and a Montana Conservation Corp crew Concrete was added
-
-
Through a Biologistrsquos EyesN a t i v e F i s h C o n s e r v a t i o n P r o g r a m | 3 5
to the top of the falls to make it over 6 feet (18m) tall and a concrete splash pad was laid at the base to eliminate the forshymation of a deep pool
While the barrier was being worked on by the contractors the NPS crew was gearing up for the complex rotenone treatshyment that lay ahead Planning started over the previous winshyter with sizable lists of the equipment and personnel needed In addition to the extensive amount of equipment needed for rotenone treatments enough gear was needed to support upwards of 30 people in the backcountry for two weeks That meant bear spray radios toilet paper stoves pans batteries data sheets an endless number of pencils sunscreen first aid kits garbage bags tape extra laces for wading boots the list goes on Equally challenging was securing an advance comshymitment for support personnel from multiple other agencies Crews from the US Fish amp Wildlife Service MFWP US Forest Service and Turner Enterprises Inc all came out to assist the already twelve-person strong NPS crew The next step was getting everything into the backcountry and since there are no trails stock use was not an option Instead nushymerous helicopter flights were used Equipment was flown to each of two base camp locations as well as to the barrier site
Prior to the actual rotenone treatment an NPS crew spent time in the backcountry collecting data on flow times and discharge rates on all the major tributaries and forks as well as the main stem of Grayling Creek This information is vital to planning and executing a successful treatment as it allows for adequate and precise application of rotenone Although rotenone only affects gill breathing organisms invertebrate and amphibian sampling is also conducted prior to and post treatment
Once the majority of the pre-treatment work was done the crews from other agencies joined the NPS crew to carry out the actual treatment Coordinating the arrival of so manypeople hiking ten miles into the backcountry without a trail and through thick deadfall was a logistical feat Gear had to be dropped off with helitack personnel to be flown in trucks had to be shuttled bear spray handed out people checked in and radios had to be borrowed programmed and distribshyuted Arriving with the additional crew were the two most important people in the group the camp cooks Given the number of people involved and the amount of work to be
accomplished camp cooks were a necessity Thirty people cooking for themselves would have been chaotic to say the least and morale was certainly higher when a home cooked meal complete with dessert was waiting for everyone back at camp
The actual treatment portion of the project was conducted over a period of eight to ten days in August 2013 and again in 2014 Due to the size of the project area it was completed in sections Each day of treatment required careful planning as to how much rotenone to apply and where and how to divide the work amongst the available personnel Rotenone was applied via backpack sprayers a sand mixture and drip stations where the mixture of rotenone and water drips out at a controlled rate The amounts used for each of these apshyplications are carefully recorded Among the many challengshyes presented by a project of this magnitude was successfullycollecting data sheets from 30 people at the end of every day
Braving high temperatures and relentless sun one year conshystant cold and rain the next year and all around grueling days in the field the multi-agency effort was a success In April 2015 NPS crews stocked the lower portion of Grayling Creek with over 800 adult westslope cutthroat In the followshying month remote site incubators were set up in the south fork and stocked with 110000 grayling eggs The progress ofthese eggs was carefully monitored on-site by NPS staff for two weeks By the first week of June thousands of grayling fry were seen throughout the meadow Yet to come are more incubators in both the lower and upper portions of the creek where westslope cutthroat eggs will be stocked Stocking efforts will continue over the next several years With each returning grayling the creek will be a little closer to having a viable fluvial population something that hasnrsquot existed withshyin the park in many years
Colleen Detjens is a native fish conservation biologist for the Yel lowstone Native Fish Conservation program A Chicago native Colleen came to Yellowstone in 2011 and hasnrsquot looked back since Colleen works in cooperation with Montana State Universityrsquos Institute on Eco systems
3 6 | Ye l l o w s t o n e F i s h e r i e s amp A q u a t i c S c i e n c e s 2 0 1 2 - 2 0 1 4
Intermountain Restoration modified an existing waterfall to form a barrier during 2013
The multi-agency crew heads to the North Fork of Grayling Creek with drip stations in hand
Final modifications to the existing waterfall during 2014 creatshyed a barrier that prevents upstream migration of fish
NPS technician Nate Thomas and Fisheries biologist Mike Ruhl monitor a rotenone drip station
Flow time data is collected by putting biodegradable fluoresshycent green dye into the water and following it downstream
Rotenone treatments were applied to Grayling Creek in 2013 Morning briefings were needed to keep everyone informed of and 2014 the work ahead
N a t i v e F i s h C o n s e r v a t i o n P r o g r a m | 3 7
The meals provided by the camp cooks kept everyone in good spirits
NPS technicians and interns carefully placed eggs into the incushybator located in South Fork Grayling Creek May 2015
Equipment was moved in and out of the backcountry via helicopter
Grayling fry successfully made their way from the incubators into Grayling Creek
Removing eggs from a female grayling from Axolotl Lake near Artctic grayling (Thymallus arcticus)- Photo copyJay FlemingEnnis MT in May 2015
3 8 | Ye l l o w s t o n e F i s h e r i e s amp A q u a t i c S c i e n c e s 2 0 1 2 - 2 0 1 4
Aquatic Ecological Monitoring amp AssessmentWater Quality Monitoring Eighteen long-term monitoring sites were sampled in 2012 while 17 sites were sampled in 2013 (figure 1 appendix a) In 2012 and 2013 ten or eleven stream sites were sampled in January and again during April through October while seven sites on Yellowstone Lake were sampled during June through October In addition discharge was monitored weekly during May through September at two sites on Reese Creek Core water quality parameters collected during each site visit included water temperature dissolved oxygen pH specific conductivity and turbidity Water was also collected and processed for total suspended solids volatile suspended solids and fixed suspended solids Dissolved anions (chloshyride sulfate and total alkalinity) dissolved cations (calcium magnesium potassium and sodium) and nutrients (nitrate nitrite ammonia and total phosphorus) were analyzed using samples from three sites
All water quality data were entered into the NPSTORET (storage and retrieval) database which is part of the national STORET database a repository for water quality biological and physical data used by state environmental agencies the Environmental Protection Agency (EPA) and other federal agencies universities and private citizens The water qualishyty sampling effort in Yellowstone during 2012 involved a toshytal of 163 site visits 291 activities and 3406 results During 2013 effort included a total of 121 site visits 276 activities and 2721 results Results included field observations multi-probe measurements and laboratory analyses Water qualitytesting was not conducted in 2014
Core and Chemical Water Quality Parameters Physical and chemical characteristics of water quality in Yellowstone National Park are related to seasonal changes elevation precipitation events and the presence of thermal features During 2012 and 2013 spatial trends in core washyter quality parameters were similar to those observed during 2002-2011 (figures 20 and 21)
During 2006-2010 water samples for chemical analysis (ions and nutrients) were collected at 10 stream sites within the Yellowstone Snake and Madison river drainages In 2011 chemical analysis occurred at only five sites one in each ofthree major river drainages (Yellowstone Snake and Madishyson) near the park boundary one on the Yellowstone River at the Yellowstone Lake outlet and one on Lamar River near its confluence with the Yellowstone River (figure 1) In 2013 chemical analysis was further reduced to three sites With the exception of pH at three sites all monitored sites met or surpassed national and state water quality standards for core and chemical parameters (anions cations and nutrients) on all collection days The Environmental Protection Agencyfreshwater aquatic life standards for pH are 65-90 standard units The three sites which had pH value exceedances were as follows bull The upper Soda Butte Creek site near the park boundary
had a low pH value of 64 on May 22 June 5 and July 17 2012 It also had a low pH value of 57 on April 15 2013
bull The Yellowstone River near Canyon had low pH values on January 16 (55) April 17 (61) and May 16 (63) 2013
bull The Gibbon River had low pH values on January 17 (63) and May 15 (61) 2013
There are several thermal features upstream of the Yellowshystone River and Gibbon River sites that have acidic runoffand likely contributed to low pH values Soda Butte Creek near the park boundary is located approximately 8 kilomeshyters downstream of McLaren mine tailings These tailings were deposited in the stream channel and surrounding floodshyplain and could have contributed to low pH values observed during the collections
The calculation of relative concentrations of major anions and cations for each site revealed a pattern among the washyter quality sites and river drainages for both 2012 and 2013
15
N a t i v e F i s h C o n s e r v a t i o n P r o g r a m | 3 9
Water Temperature Specific Conductivity 30 800
70025
600 20 500
YFB YCN YCS USB LSB LM GN SN FH GB MD
Dissolved Oxygen
YFB YCN YCS USB LSB LM GN SN FH GB MD
NTU
microS
cm
400
300
degC
10 200
5 100
0 0
Turbidity 10016
90 14 80
12 70
10 60
50
Non
e
mg
l
8 40
6 30
4 20
2 10
00 YFB YCN YCS USB LSB LM GN SN FH GB MD
YFB YCN YCS USB LSB LM GN SN FH GB MD
Solids Total SuspendedpH 120
9
10
1008
7 80 6
regulatory limits (65-80)
YFB YCN YCS USB LSB LM GN SN FH GB MD
5
4 mg
l
60
403
2 20
1
0 0
Yellowstone River Basin YFB = at Fishing Bridge YCN = at Canyon YCS = at Corwin Springs USB and ISB = upper and lower Soda Butte Creek LM = Lamar River GN = Gardner River
Snake River Basin SN = Snake River
Madison River Basin FH = Firehole River GB = Gibbon River MD = Madison River
YFB YCN YCS USB LSB LM GN SN FH GB MD
Mean
Median
x Near Outliers
+ Far Outliers
Regulatory Limits
Figure 20 Box and whisker plots illustrating annual variation for selected parameters at each water quality location in 2012 Lower and upper portions of boxes represent the 25th and 75th percentile respectively lower and upper black horizontal bars represent 10th and 90th percentile respectively
15
4 0 | Ye l l o w s t o n e F i s h e r i e s amp A q u a t i c S c i e n c e s 2 0 1 2 - 2 0 1 4
Water Temperature Specific Conductivity 800
700
30
25 600
20 500
YFB YCN YCS USB LSB LM GN FH GB MDYFB YCN YCS USB LSB LM GN FH GB MD
microSc
m
400
300
degC
10 200
5 100
0 0
Turbidity Dissolved Oxygen 10014
90
12 80
7010 60
8
mg
l N
TU
50
40mg
l
6
30 4
20
2 10
00 YFB YCN YCS USB LSB LM GN FH GB MD
YFB YCN YCS USB LSB LM GN FH GB MD
pH Solids Total Suspended
regulatory limits (65-80)
120
9
10
1008
7 80
6
YFB YCN YCS USB LSB LM GN FH GB MD
Non
e 5 60 4
403
2 201
0 0YFB YCN YCS USB LSB LM GN FH GB MD
Mean Yellowstone River Basin YFB = at Fishing Bridge YCN = at Canyon YCS = at Corwin Springs USB and ISB = upper and lower Soda Butte Creek Median LM = Lamar River GN = Gardner River
x Near Outliers Snake River Basin SN = Snake River
+ Far Outliers Madison River Basin FH = Firehole River GB = Gibbon River MD = Madison River Regulatory Limits
Figure 21 Box and whisker plots illustrating annual variation for selected parameters at each water quality location in 2013 Lower and upper portions of boxes represent the 25th and 75th percentile respectively lower and upper black horizontal bars represent 10th and 90th percentile respectively Outlying values are represented by ldquoXrdquo means are indicated by an open circle
N a t i v e F i s h C o n s e r v a t i o n P r o g r a m | 4 1
While relative concentrations of bicarbonate (HCO32-) ions
were dominant at all water quality stations concentrations ofother major ions varied among watersheds Both sites on the Yellowstone River (Corwin Springs and Fishing Bridge) and the site on the Snake River had relatively equal proportions of sulfate sodium chloride and calcium compared to the other ions analyzed In contrast calcium was the dominant ion within the Lamar River and sodium and chloride ions were present in approximately equal proportions within the Madison River Across the park phosphorus and nitrogen concentrations were very low as were nitrate nitrite and ammonia with most sites below the detection limits
Monitoring of 303(d) Listed Streams Segments of Reese Creek Soda Butte Creek and the Yellowshystone River were monitored because they are listed as 303(d) impaired by the State of Montana which implies they onlypartially support aquatic life and coldwater fisheries (figure 1)
Reese Creek ndash The lowermost reach of Reese Creek (figure 1) is on Montanarsquos 303(d) list because historical irrigation practices often dewater the stream during mid-summer and fall making it unsuitable for sustaining trout Because Reese Creek supports resident and migratory (spawning) cutthroat trout from the Yellowstone River monitoring of discharge during summer is important to conserve these native fish populations and overall biological integrity To ensure an adequate amount of water remains in lower Reese Creek the NPS measures stream flows and estimates discharge each year during months when water is diverted from the stream by neighboring landowners for irrigation north of the park in the Gardiner Basin
In 2012 and 2013 discharge was estimated during 15 site visshyits at the Reese Creek mainstem immediately above the upshypermost diversion structure and at the channel of the uppershymost diversion ditch The difference in discharge between these two sites is the amount of water entering the main channel of Reese Creek below the uppermost diversion The adjudicated water rights stipulate Reese Creek is to have a minimum flow of 1306 cubic feet per second from April 15 to October 15 During 2012 early spring runoff resulted in high peak flows during June followed by a dry summer with
minimal flows through fall Discharge on Reese Creek ranged from 314 to 043 cubic feet per second from early July to the end of September (figure 22) In-stream flow decreased beshylow minimum flow requirements for the last eight samples collected during summer and fall During 2013 stream flows remained relatively stable throughout spring with discharges ranging from 505 to 255 cubic feet per second (figure 22) Beginning in mid-July in-stream flow again fell below minishymum flow requirements and remained below required levels until early September
Soda Butte Creek ndash In-stream metals contamination in Soda Butte Creek is a result of historical mining in the vicinshyity of Cooke City Montana upstream of the park boundshyary Mine tailings persist within the floodplain in this area contributing to its 303(d) listing Partner agencies initiated a 3-year effort to relocate mine tailings away from the floodshyplain in 2011 an activity that posed a risk of heavy metal conshytamination of the creek The NPS conducted intensive monshyitoring and sample collection from June through October in both 2012 and 2013 Metal concentrations for arsenic seleshynium and zinc were below EPA standards for drinking water and aquatic life However in 2012 high total copper conshycentrations (00182 milligrams per liter) exceeded acute and chronic aquatic standards during one sample event in May Dissolved iron concentrations also exceeded drinking water (five sample events) and aquatic life standards (two sample events) between May and July (figure 23) In 2013 total and dissolved concentrations for arsenic copper selenium and zinc were below standards for drinking water and aquatic life Dissolved iron concentrations exceeded drinking water (six sample events) and aquatic life standards (two sample events) between January and October 2013 (figure 23)
Yellowstone River Upstream of Corwin Springs ndash This reach was first listed on Montanarsquos 303(d) list in 2006 due to sedimentation and arsenic levels exceeding drinking water standards Data to support this initial listing were collected in 1999-2001 (Miller et al 2004) To detershymine the current level of arsenic in the river the NPS samshypled water in January and again from April through October in both 2012 and 2013 Drinking water standards for arsenic should not exceed 001 milligrams per liter During 2012 total arsenic concentrations ranged from 00078 to 00348
4 2 | Ye l l o w s t o n e F i s h e r i e s amp A q u a t i c S c i e n c e s 2 0 1 2 - 2 0 1 4
Figure 22 Reese Creek stream flow (blue) compared to a required minimum stream flow (red) for 2012-2013
Figure 23 Soda Butte Creek total iron concentrations (blue) compared to EPA drinking water standards (green) and aquatic life criteria (red) for 2012-2013
milligrams per liter and exceeded drinking water standards during six of eight site visits (figure 24) In 2013 total arsenic concentration ranged from 00056 to 0508 milligrams per lishyter and exceeded drinking water standards during four of six site visits (figure 24)
Yellowstone Lake Limnology Understanding basic limnology of Yellowstone Lake proshymotes cutthroat trout conservation by enhancing the effishyciency of the lake trout suppression program Monthly washyter temperature dissolved oxygen specific conductance and turbidity measurements were recorded at seven sites from
June to October in 2012 and 2013 (figure 1) Surface water chemical characteristics were consistent throughout the lake except for the Southeast Arm The upper Yellowstone Rivshyer enters the southern tip of the Southeast Arm and delivers sediments from the upper portions of the watershed during snowmelt As a result this area of the lake tends to exhibshyit higher turbidity and lower specific conductance during spring runoff
Water temperature affects the distribution and movement patterns of fish in Yellowstone Lake From 2012 to 2014 23 water temperature loggers were deployed in the West Thumb
N a t i v e F i s h C o n s e r v a t i o n P r o g r a m | 4 3
Figure 24 Yellowstone River at Corwin Springs total arsenic concentrations (blue) compared to drinking water stanshydards (red) for 2012-2013
portion of Yellowstone Lake to document change in water temperature throughout the summer The depth of these loggers ranged from the surface (0 meters) to the lake botshytom (90 meters) with most loggers being deployed at 1-meshyter intervals between 0 and 20 meters Surface water temshyperatures began to warm in early to mid-July each year The thermocline (area with greatest water temperature change) continued to increase in depth with highest average surface temperatures (17-18ordmC) occurring in August (figure 25) The maximum depth of the warmer surface water extendshyed down 10-12 meters for all three years In 2012 and 2014 surface water temperatures began to gradually cool in earlySeptember with average temperatures falling below 12oC by mid-September By comparison surface water temperatures in 2013 did not begin to cool until late September which was followed by an abrupt cooling of water temperatures in earlyOctober (figure 25)
Health Assessments via Macroinvertebrate Surveys Macroinvertebrates were sampled at 23 sites in three watershysheds during 2012 four in the Shoshone eight in the Yelshylowstone and eleven in the Missouri (figure 1) The four sites in the Shoshone River watershed are part of long-term monitoring on Middle Creek where runoff from road conshystruction on Sylvan Pass resulted in the deposit of sediments in Mammoth Crystal Springs a small tributary to Middle
0
5
10
15
20
25
30
0
5
10
15
20
25
30
0
5
10
15
20
25
30 Jul Aug Sep Jul Aug Sep Jul Aug Sep
2012 2013 2014
Sample Month and Year
4 6 8 10 12 14 16 Temperature (oC)
Figure 25 Yellowstone Lake isopleths showing seasonal and annual variation in water temperature throughout the water column 2012-2014 Only upper 30 meters are shown (y-axis) for better resolution of surface water temperatures
Creek Macroinvertebrate data will be used to monitor reshycovery of the tributary
During 2013 macroinvertebrates were sampled at 11 locashytions (figure 1) Four sites were sampled within the Yellowshystone River watershed and within the Elk Creek drainage An additional seven sites were sampled within the Missouri Rivshyer watershed and included one site in the Goose Lake area two sites on Cougar Creek and four sites on Grayling Creek
4 4 | Ye l l o w s t o n e F i s h e r i e s amp A q u a t i c S c i e n c e s 2 0 1 2 - 2 0 1 4
In 2014 macroinvertebrates were sampled at 24 sites in three watersheds four in the Shoshone fifteen in the Yellowstone and five in the Missouri (figure 1) As in 2012 the four sites in the Shoshone River watershed are being monitored on Midshydle Creek to evaluate past road construction activities in that portion of the park
Sampling sites in the Yellowstone and Missouri River watershysheds were within current or proposed native fish restoration areas To assess rotenonersquos impact on stream invertebrate communities aquatic invertebrate surveys were conducted before and after rotenone application was used to remove nonnative fish from Elk Creek within the Yellowstone River drainage during 2012-2014 and from Grayling Creek within the Madison River drainage during 2013-2014 All inverteshybrate samples were sent to an independent contractor for analyses (results pending)
Amphibians in Native Fish Restoration Areas Wetlands were surveyed for presence of amphibians from 2012 to 2014 in the Elk-Yanceys-Lost Creek complex as well as a small watershed that encompasses the Goose Lake chain of lakes
Elk-Yanceys-Lost Creek Complex ndash Since amphibishyan sampling in the lower Elk Creek drainage began in 2006 48 wetlands have been sampled Twenty of these wetlands (42) were occupied by amphibians with one or more life stages (eggs larvae andor adults) present The three speshycies known to breed in this drainage include 1) boreal choshyrus frog (Pseudacris maculata) 2) blotched tiger salamander (Ambystoma tigrinum melanostictum) and 3) Columbia spotshyted frog (Rana luteiventris) During 2012 20 sites were samshypled that had previous observations of amphibians (figure 26) Breeding populations of blotched tiger salamanders and Columbia spotted frogs were observed at 10 sites (50) and adults were found at two additional sites (10) No amphibshyians were detected at the remaining eight sites (40) which were dry or contained little water None of the wetlands used for breeding sites were directly connected to Elk Creek or its tributaries therefore they were not treated with piscicides during native fish restoration activities in 2012-2014
In 2013 fewer breeding populations of blotched tiger salashymanders and Columbia spotted frogs were observed at the same 20 sites sampled in 2012 Breeding populations ofblotched tiger salamanders were observed at seven of the sites (35) and Columbia spotted frogs were observed at two sites (10) Adults of these two species were found at two additional sites (10) Boreal chorus frogs were found at two sites (10) Ten sites (50) were dry and one site contained little surface water to maintain an environment adequate for amphibian larvae In 2014 breeding populashytions of amphibians occurred at 14 of the 20 sites Breedshying populations of blotched tiger salamanders were found at 11 sites (55) Columbia spotted frogs were found at four sites (20) and boreal chorus frogs were found at two sites (10) No amphibians were detected at the remaining six sites (30)
Goose Lake Chain of Lakes ndash In 2011 the Goose Lake chain of lakes was treated with rotenone to remove nonnative rainbow trout At the time of treatment Goose and Goose-neck lakes contained larval blotched tiger salamanders After treatment 157 larval salamanders were found dead along the shoreline In Yellowstone larval salamanders may overwinshyter two or more years before transforming into adults (Koch and Peterson 1995) Juvenile Columbia spotted frogs were found in the small headwater lake and Gooseneck Lake They all appeared healthy and not affected by the treatment In July 2012 three lakes were sampled for the presence ofamphibians Larval blotched tiger salamanders were found only in Goose Lake while Columbia spotted frog tadpoles were found in all three lakes Previous survey years never reshyvealed a breeding population of Columbia spotted frogs in Goose Lake Because rainbow trout are known to prey on amphibians removal of these fish from Goose Lake most likely contributed to the survival and increased abundance of Columbia spotted frogs
In July 2013 and 2014 the three lakes were sampled again for the presence of amphibians Larval blotched tiger salashymanders were only found in Gooseneck Lake and the small headwater lake while adult salamanders were only found in Gooseneck Lake (2013) In 2013 adult Columbia spotted frogs were found in Goose and Gooseneck lakes but were not observed in the small headwater lake In 2014 adult Coshylumbia spotted frogs were observed in all three lakes
Figure 26 Amphibian monitoring sites in the Elk Creek drainage
Ye llowston e R
i v e r
Elk Creek FallsE lk C r e e k
E l k C r e e k
Yancey Creek Yancey Cr
Fish Barrier
Lost Creek Falls
Tower Junction
Dry Reach
Mammoth
L o s t Cr
Breeding in 2014 Breeding in 2012 and 2014 Breeding in 2013 and 2014 Breeding in 2012-2014 Fish Barrier Detox Station Streams in Project Area Lost Creek Dry Reach Streams Roads Wetlands
0 105 km
0 105 mile
N a t i v e F i s h C o n s e r v a t i o n P r o g r a m | 4 5
Amphibians Not Observed Breeding in 2012
Breeding in 2013
Salmon fly over the Yellowstone River - NPS Photo
4 6 | Ye l l o w s t o n e F i s h e r i e s amp A q u a t i c S c i e n c e s 2 0 1 2 - 2 0 1 4
Yellowstone cutthroat trout ready for release - Photo copyMike Canetta
N a t i v e F i s h C o n s e r v a t i o n P r o g r a m | 4 7
Public InvolvementVolunteer Angler Report Card Trends Angling remains a popular pastime for those visiting living near or working in Yellowstone National Park There were 42870 fishing permits issued in 2012 (34 million visitors toshytal) 42259 permits issued in 2013 (32 million visitors total) and 42831 permits issued in 2014 (35 million visitors total) Fishing permits which are required for fishing in park washyters were accompanied by a volunteer angler report card to provide anglers an opportunity to share their fishing success and opinions with park managers
The general fishing season in Yellowstone National Park opens on Memorial Day weekend and lasts until early Noshyvember In 2014 an estimated 41435 anglers spent an estishymated 169739 days fishing caught 399808 fish and released 95 of captured fish The estimated total number of days anglers spent fishing has decreased in recent years There are similar numbers of anglers each year but on average each anshygler is fishing fewer days in the park
Native fish (cutthroat trout Arctic grayling and mountain whitefish) comprised 49 of all fish caught in 2012 54 ofthe catch in 2013 and 62 of the catch in 2014 Cutthroat trout have remained the most sought after and caught speshycies representing 44 of all fish caught in 2012 49 ofthe catch in 2013 and 59 of the catch in 2014 (figure 27) Rainbow trout were the second most frequently caught fish
Brook trout Rainbow trout 7
Arctic grayling 1
Lake trout 9
11 Brown trout
Mountain whitefish 11 2
Cutthroat trout 59
Figure 27 Native cutthroat trout remained the most sought after and caught fish species by anglers in 2013 comprising 59 of all fish caught in the park
(11-18 of angler catch) followed by brown trout (11-12) lake trout (8-11) and brook trout (7-10)
Anglers reported the lengths of 11864 fish 54 were lonshyger than 305 millimeters (12 inches) and 39 were longer than 356 millimeters (14 inches) Lake trout had the greatest average length of 416 millimeters (16 inches) and were the most likely fish to be kept (35) The release of native fish (cutthroat trout Arctic grayling and mountain whitefish) is
Raft eletroshocking along the Madison River - NPS photo
4 8 | Ye l l o w s t o n e F i s h e r i e s amp A q u a t i c S c i e n c e s 2 0 1 2 - 2 0 1 4
required by park regulations and 999 of them were reshyported released
Anglers reported being satisfied with their overall experience (80) the numbers of fish caught (65) and the sizes of fish caught (70) These satisfaction rates are all slightly higher than rates reported in previous recent years
Fly Fishing Volunteer Program Each year during 2012-2014 between 36 and 42 volunteers contributed between 1443 and 1785 hours to the parkrsquos fisheries program Volunteer anglers focused on collecting samples for cutthroat trout genetics including the distrishybution of pure and hybridized fish in Lamar River Slough Creek and Soda Butte Creek Volunteers also collected samshyples to evaluate possible genetic factors influencing rainbow trout thermal tolerance in the Firehole River as well as the concentration of mercury in fish in several lakes As in past years the volunteers indicated their experience was positive and they were happy to contribute to Yellowstone fisheries research
Projects by Graduate Students During reporting years 2012-2014 the following graduate students assisted the park Fisheries Program with research efforts
Graduate student Tonya Chamberlain(Master of Science candidate) Committee Chair Dr Amy Krist Department of Zoology amp Physiology University of Wyoming Title An investigation of life history shifts in zooplankton in Yellowstone Lake following the introduction of lake trout Status Graduated 2013
Graduate student Kole Stewart (Master of Science candidate) Committee Chair Dr Thomas McMahon Department ofEcology Montana State University Title Using otolith microchemistry to distinguish spawning locations of Yellowstone cutthroat trout and lake trout in Yellowstone Lake Wyoming Status Field studies analyses and writing ongoing
Graduate student John Syslo(Doctor of Philosophy) Committee chair Dr Christopher Guy US Geological Surshyvey Cooperative Fisheries Research Unit Department ofEcology Montana State UniversityTitle Response of Yellowstone cutthroat trout to nonnative predator removal in the Yellowstone Lake ecosystem Yelshylowstone National Park Status Graduated 2015
Interagency Workgroups Biologists from Yellowstone National Park participate in the Yellowstone Cutthroat Trout Interstate Workgroup the Montana Cutthroat Trout Steering Committee and the Fluvial Arctic Grayling Workgroup Shared goals and obshyjectives among partner agencies and non-governmental orshyganizations are defined in a memorandum of agreement for the conservation and management of Yellowstone cutthroat trout a memorandum of understanding and conservation agreement for westslope cutthroat trout and Yellowstone cutthroat trout in Montana and a memorandum of undershystanding concerning the recovery of fluvial Arctic grayling
Yellowstone Lake Workgroup The Yellowstone Lake Workgroup consists of Trout Unlimitshyed National (Idaho Montana and Wyoming Councils) Nashytional Parks Conservation Association Greater Yellowstone Coalition Yellowstone Park Foundation and Yellowstone National Park The groups entered into a memorandum ofunderstanding in 2012 to enhance the cooperative relationshyship among the participants and to ensure that the Greater Yellowstone Ecosystem is protected maintained and manshyaged to achieve the goals established for the park Among those goals is the conservation and protection of ecosystems that ensure native coldwater fisheries will persist for the enshyjoyment of present and future generations The cooperative activities of this workgroup are currently focused on lake trout sonic telemetry studies and the development of altershynative lake trout suppression methods such as the destrucshytion of lake trout embryos on spawning areas
N a t i v e F i s h C o n s e r v a t i o n P r o g r a m | 4 9
Implanting acoustic telemetry tags in lake trout to identify breeding areas - NPS photo
5 0 | Ye l l o w s t o n e F i s h e r i e s amp A q u a t i c S c i e n c e s 2 0 1 2 - 2 0 1 4
AcknowledgmentsThe Native Fish Conservation Program is supported through Yellowstone Center for Resources base funding and a porshytion of the fees collected from anglers who purchase fishing permits During 2012-2014 additional funding was received from the following sources
bull Yellowstone Park Foundation through the Fisheries Fund Initiative Fly Fishing Volunteer Program and Nashytive Fish Conservation Program
bull Recreational Fee Demonstration Program of the Federal Lands Recreation Enhancement Act
bull Natural Resource Preservation Program of the NPS bull National Fish and Wildlife Foundation bull Park Roads and Parkways Program of the Federal Highshy
way Administration bull Greater Yellowstone Network Vital Signs Monitoring
Program of the NPS bull Greater Yellowstone Coordinating Committee and bull Trout Unlimited Greater Yellowstone Coalition and the
National Parks Conservation Association
Special thanks are extended to these organizations and prishyvate individuals that have graciously supported native fish restoration in Yellowstone National Park Special thanks to the former chief of the Yellowstone Center for Resources Dave Hallac for his contributions to fisheries conservation in Yellowstone Park staff who work on the fisheries project are noted in appendix B amp C
Administrative support for the Native Fish Conservation Program was provided by Barbara Cline Alana Darr Monshytana Lindstrom and Melissa McAdam Diane Eagleson with the Montana Institute on Ecosystems provided support for stream restoration and coordination of the Fly Fishing Volshyunteer Program This report was finalized by the Science Communications Program in the Yellowstone Center for Reshysources Special thanks to Sarah Haas Charissa Reid Karin Bergum and Christie Hendrix for their efforts with editing and designing this report
Over several years Allison Klein of the Spatial Analysis Censhyter has provided a tremendous amount of support for field operations and publications Thanks to Wendy Hafer from the Fire Cache Ben Cunningham and Wally Wines from Corshyral Operations Michael Mustafaga Lynn Webb and Dave Whaley from Lake Maintenance Brad Ross and Kim West from the South District Rangers Brian Chan from Lamar District Rangers and Michael Keator and Tara Ross from the West District Rangers
The Student Conservation Association and Montana Conshyservation Corps provided many people for the day-to-dayactivities of the program Special thanks to Travis Horton and Pat Clancey with Montana Fish Wildlife amp Parks Bruce Roberts with the US Forest Service Jim Mogen with the US Fish and Wildlife Service and Carter Kruse with Turner Enterprises Inc
The crew in the field at Grayling Creek The group was comprised of staff from Yellowstone National Park Montana Fish Wildlife amp Parks the US Forest Service the US Fish amp Wildlife Service Turner Enterprises Inc and the amazshying camp cooks
N a t i v e F i s h C o n s e r v a t i o n P r o g r a m | 5 1
Fish crew - 2012 - NPS photo
Fish crew - 2013 - NPS photo
Fish crew - 2014 - NPS photo
5 2 | Ye l l o w s t o n e F i s h e r i e s amp A q u a t i c S c i e n c e s 2 0 1 2 - 2 0 1 4
Literature CitedAlexander JD BL Kerans TM Koel and C Rasmussen 2011 Context-specific parasitism in Tubifex tubifex in geoshythermally influenced stream reaches in Yellowstone National Park Journal of the North American Benthological Society30853-867
Brown PJ CS Guy and MH Meeuwig 2014 Use of moshybile electrofishing to induce mortality in lake trout embryos in Yellowstone Lake Final report 2014 Montana Cooperashytive Fishery Research Unit Montana State University Bozeshyman Montana USA
Gresswell RE 2009 Scientific review panel evaluation ofthe National Park Service lake trout suppression program in Yellowstone Lake August 25-29 2008 Final report US Geological Survey Northern Rocky Mountain Science Censhyter Bozeman Montana USA YCR-2009-05
Gresswell RE CS Guy MJ Hansen ML Jones and PJ Martinez 2013a Lake trout suppression in Yellowstone Lake Science review team annual scientific assessment May 24 2012 Final report US Geological Survey Northern Rocky Mountain Science Center Bozeman Montana USA
Gresswell RE CS Guy MJ Hansen ML Jones JE Marsden and PJ Martinez 2013b Lake trout suppression in Yellowstone Lake Science review team annual scientific assessment May 14-15 2013 Final Report US Geologishycal Survey Northern Rocky Mountain Science Center Bozeshyman Montana USA
Koch ED and CR Peterson 1995 Amphibian and repshytiles of Yellowstone and Grand Teton National Parks Unishyversity of Utah Press Salt Lake City Utah USA
Koel TM DL Mahony KL Kinnan C Rasmussen CJ Hudson S Murcia and BL Kerans 2006 Myxobolus cereshybralis in native cutthroat trout of the Yellowstone Lake ecoshysystem Journal of Aquatic Animal Health 18157-175
Koel TM and J York 2006 Restoration of westslope cutthroat trout in the East Fork Specimen Creek watershy
shed Environmental assessment May 5 2006 National Park Service US Department of the Interior Yellowstone National Park httpparkplanningnpsgovdocument cfmparkID=111ampprojectID=13064ampdocumentID=15130
Koel TM PE Bigelow PD Doepke BD Ertel and DL Mahony 2005 Nonnative lake trout result in Yellowstone cutthroat trout decline and impacts to bears and anglers Fisheries 3010-19
Koel TM JL Arnold PE Bigelow PD Doepke BD Er-tel and ME Ruhl 2008 Yellowstone Fisheries amp Aquatic Sciences Annual Report 2007 National Park Service Yelshylowstone Center for Resources Yellowstone National Park Wyoming USA YCR-2008-02
Koel TM BL Kerans SC Barras KC Hansen and J Wood 2010a Avian piscivores as vectors for Myxobolus ceshyrebralis in the Greater Yellowstone Ecosystem Transactions of the American Fisheries Society 139976-988
Koel TM JL Arnold PE Bigelow and ME Ruhl 2010b Native fish conservation plan Environmental asshysessment December 16 2010 National Park Service US Department of the Interior Yellowstone National Park Wyoming USA httpparkplanningnpsgovdocument cfmparkID=111ampprojectID=30504ampdocumentID=37967
Koel TM JL Arnold PE Bigelow PD Doepke BD Er-tel and ME Ruhl 2012 Yellowstone Fisheries amp Aquatic Sciences Annual report 2011 National Park Service Yelshylowstone Center for Resources Yellowstone National Park Wyoming USA YCR-2012-03
Martin NV and CH Olver 1980 The lake charr Salvelishynus namaycush Pages 205-277 in EK Balon editor Charrs Salmonid fishes of the genus Salvelinus Perspectives in vershytebrate science Kluwer Boston Hingham Massachusetts USA
Miller KM ML Clark and PR Wright 2004 Water qualshyity assessment of the Yellowstone River Basin Montana and
N a t i v e F i s h C o n s e r v a t i o n P r o g r a m | 5 3
Wyoming ndash water quality of fixed sites 1999-2001 US Geoshylogical Survey Scientific Investigations Report 2004-5113
Munro A R TE McMahon and JR Ruzycki 2005 Natushyral chemical markers identify source and date of introduction of an exotic species Lake trout (Salvelinus namaycush) in Yellowstone lake Canadian Journal of Fisheries and Aquatic Sciences 6279-87
Murcia S BL Kerans E MacConnell and TM Koel 2011Correlation of environmental attributes with histopathologyof native Yellowstone cutthroat trout naturally infected with Myxobolus cerebralis Diseases of Aquatic Organisms 93225shy234
Murcia S BL Kerans TM Koel and E MacConnell 2015 Myxobolus cerebralis (Hofer) infection risk in native cutshythroat trout Oncorhynchus clarkii (Richardson) and its relashytionships to tributary environments in the Yellowstone Lake Basin Journal of Fish Diseases 38637ndash652
Reinhart DP and DJ Mattson 1990 Bear use of cutthroat trout spawning streams in Yellowstone National Park Inshyternational Conference on Bear Research and Management 8343ndash350
Reinhart DP ST Olliff and KA Gunther 1995 Managshying bears and developments on cutthroat spawning streams in Yellowstone Park Pages 161-169 in AP Curlee AM Gillesberg and D Casey editors Greater Yellowstone predshyators ecology and conservation in a changing landscape Proceedings of the 3rd biennial conference on the Greater Yellowstone Ecosystem Northern Rockies Conservation Cooperative Jackson Wyoming USA
Rotella J 2014 Estimates of lake trout abundance in Yelshylowstone Lake for 2013 from mark-recapture data Montana State University Bozeman Montana USA Unpublished data
Ruzycki JR DA Beauchamp and DL Yule 2003 Effects of introduced lake trout on native cutthroat trout in Yellowshystone Lake Ecological Applications 1323-37
Ruzycki JR 2004 Impact of lake trout introductions on cutthroat trout of selected western lakes of the continental United States Dissertation Utah State University Logan Utah USA
Syslo JM CS Guy PE Bigelow PD Doepke BD Ertel and TM Koel 2011 Response of non-native lake trout (Salvelinus namaycush) to 15 years of harvest in Yellowstone Lake Yellowstone National Park Canadian Journal of Fishshyeries and Aquatic Sciences 682132-2145
Varley JD and P Schullery 1995a Executive summary Pages 2-3 in J D Varley and P Schullery editors The Yellowshystone Lake crisis confronting a lake trout invasion A Report to the Director of the National Park Service Yellowstone Center for Resources Yellowstone National Park Wyoming USA
Varley JD and P Schullery 1995b Socioeconomic values associated with the Yellowstone Lake cutthroat trout Pages 22-27 in J D Varley and P Schullery editors The Yellowshystone Lake crisis confronting a lake trout invasion A Report to the Director of the National Park Service Yellowstone Center for Resources Yellowstone National Park Wyoming USA
Varley J D and P Schullery 1998 Yellowstone fishes Ecolshyogy history and angling in the park Stackpole Books Meshychanicsburg Pennsylvania USA
Wendy Hafer helps deliver supplies into camp with the park helicopter - NPS photo
5 4 | Ye l l o w s t o n e F i s h e r i e s amp A q u a t i c S c i e n c e s 2 0 1 2 - 2 0 1 4
AppendixAppendix A Water quality stations sampled in 2012-2013
Yellowstone River Drainage
YELL_YS6164M Yellowstone River at Fishing Bridge YELL_YS6005M Yellowstone River at Canyon YELL_YS5497M Yellowstone River at Corwin Springs YELL_SB0157M Soda Butte Creek at park boundary YELL_SB0015M Soda Butte Creek near Lamar Ranger Station YELL_LM0005M Lamar River near Tower Ranger Station YELL_GN0029M Gardner River near Gardiner Montana YELL_RC0009A Reese Creek lower diversion YELL_RC0009B Reese Creek upper discharge mainstem
YELL_YL001OM-007OM Yellowstone Lake sites 1-7 YELL_FH0018C Firehole River near Madison Junction
Madison River Drainage YELL_GB0002M Gibbon River near Madison Junction YELL_MD1332T Madison River near park boundary
Snake River Drainage YELL_SN9999M Snake River at old Flagg Ranch stream sites that appear on Montanas 303(d) list
stream sampled in 2012 only
Yellowstone cutthroat trout sampling - NPS photo
N a t i v e F i s h C o n s e r v a t i o n P r o g r a m | 5 5
Appendix B Seasonal staff in 2012-2014
Seasonal Staff 2012 Seasonal Staff 2013 Seasonal Staff 2014 Christopher Daly Benjamin Brogie Benjamin Brogie Colleen Detjens Brent Trim Cristina Dressel
Earl Drescher Carla Rothenbuecher Josh Litvinoff Jaclyn Schultz Colleen Detjens Alex Poole Jay Fleming Cynthia Nau Nathan Roueche
Kole Stewart Jacob Williams Kristopher Shultz Kyle Mosel Kole Steward Nathan Thomas
Michael Consolo Michael Consolo William Voigt Nathan Thomas Michael Polchlopek Jacob Williams Tiffany Hutton Nathan Thomas William Holden Stephen Huffman William Voigt Theresa Campbell
William Voigt
Appendix C Student Conservation Association (SCA) Interns in 2012-2014
SCA Staff 2012 SCA Staff 2013 SCA Staff 2014 Alyssa Riggs Chay Leinweber Taher Ali
Amanda Guenther Chelsey Sherwood Carl Ausprung Carly Cavutt Donald Blenkendorf Trevor Beutel Cynthia Nau Eric Raslich Shannon Boyle
Haley Carlson Joshua Litvinoff Lauren Frisbie Heath Kessi Kody Kasper Hayley Glassic
Heather Paddock Larissa Lee Drew Mac Donald Jacob Williams Levi Garrett Lauren McGarvey
Nathan McWilliams Rick Inniello Andriana Puchany Regina Thill Thomas Short Rachel Voorhorst
Zebidiah Buck Justin Walley
FOR MORE INFORMATION wwwnpsgovycr
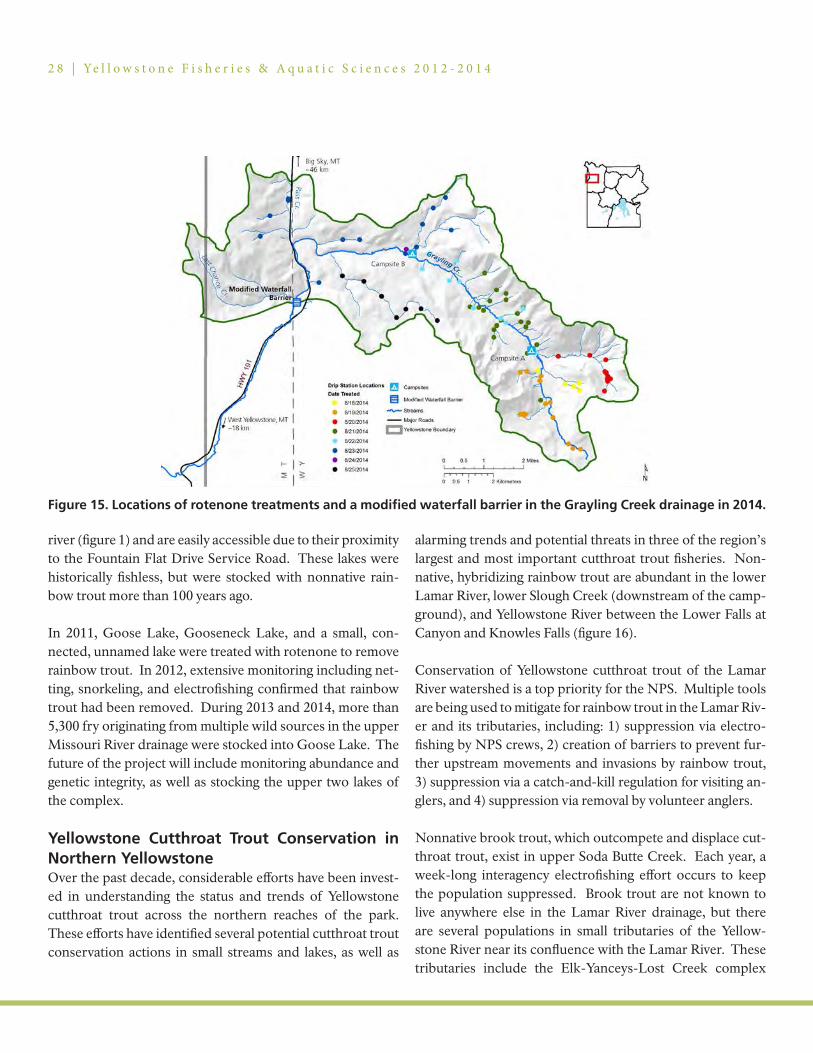
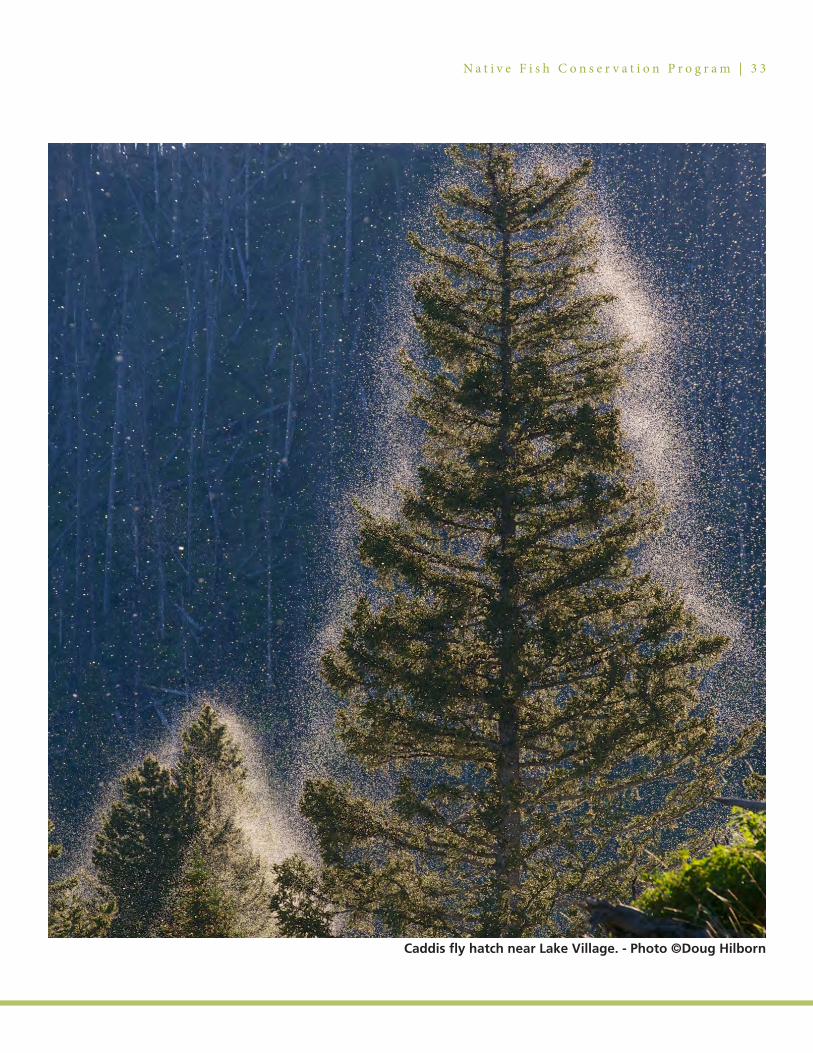

-
-
Through a Biologistrsquos EyesN a t i v e F i s h C o n s e r v a t i o n P r o g r a m | 3 5
to the top of the falls to make it over 6 feet (18m) tall and a concrete splash pad was laid at the base to eliminate the forshymation of a deep pool
While the barrier was being worked on by the contractors the NPS crew was gearing up for the complex rotenone treatshyment that lay ahead Planning started over the previous winshyter with sizable lists of the equipment and personnel needed In addition to the extensive amount of equipment needed for rotenone treatments enough gear was needed to support upwards of 30 people in the backcountry for two weeks That meant bear spray radios toilet paper stoves pans batteries data sheets an endless number of pencils sunscreen first aid kits garbage bags tape extra laces for wading boots the list goes on Equally challenging was securing an advance comshymitment for support personnel from multiple other agencies Crews from the US Fish amp Wildlife Service MFWP US Forest Service and Turner Enterprises Inc all came out to assist the already twelve-person strong NPS crew The next step was getting everything into the backcountry and since there are no trails stock use was not an option Instead nushymerous helicopter flights were used Equipment was flown to each of two base camp locations as well as to the barrier site
Prior to the actual rotenone treatment an NPS crew spent time in the backcountry collecting data on flow times and discharge rates on all the major tributaries and forks as well as the main stem of Grayling Creek This information is vital to planning and executing a successful treatment as it allows for adequate and precise application of rotenone Although rotenone only affects gill breathing organisms invertebrate and amphibian sampling is also conducted prior to and post treatment
Once the majority of the pre-treatment work was done the crews from other agencies joined the NPS crew to carry out the actual treatment Coordinating the arrival of so manypeople hiking ten miles into the backcountry without a trail and through thick deadfall was a logistical feat Gear had to be dropped off with helitack personnel to be flown in trucks had to be shuttled bear spray handed out people checked in and radios had to be borrowed programmed and distribshyuted Arriving with the additional crew were the two most important people in the group the camp cooks Given the number of people involved and the amount of work to be
accomplished camp cooks were a necessity Thirty people cooking for themselves would have been chaotic to say the least and morale was certainly higher when a home cooked meal complete with dessert was waiting for everyone back at camp
The actual treatment portion of the project was conducted over a period of eight to ten days in August 2013 and again in 2014 Due to the size of the project area it was completed in sections Each day of treatment required careful planning as to how much rotenone to apply and where and how to divide the work amongst the available personnel Rotenone was applied via backpack sprayers a sand mixture and drip stations where the mixture of rotenone and water drips out at a controlled rate The amounts used for each of these apshyplications are carefully recorded Among the many challengshyes presented by a project of this magnitude was successfullycollecting data sheets from 30 people at the end of every day
Braving high temperatures and relentless sun one year conshystant cold and rain the next year and all around grueling days in the field the multi-agency effort was a success In April 2015 NPS crews stocked the lower portion of Grayling Creek with over 800 adult westslope cutthroat In the followshying month remote site incubators were set up in the south fork and stocked with 110000 grayling eggs The progress ofthese eggs was carefully monitored on-site by NPS staff for two weeks By the first week of June thousands of grayling fry were seen throughout the meadow Yet to come are more incubators in both the lower and upper portions of the creek where westslope cutthroat eggs will be stocked Stocking efforts will continue over the next several years With each returning grayling the creek will be a little closer to having a viable fluvial population something that hasnrsquot existed withshyin the park in many years
Colleen Detjens is a native fish conservation biologist for the Yel lowstone Native Fish Conservation program A Chicago native Colleen came to Yellowstone in 2011 and hasnrsquot looked back since Colleen works in cooperation with Montana State Universityrsquos Institute on Eco systems
3 6 | Ye l l o w s t o n e F i s h e r i e s amp A q u a t i c S c i e n c e s 2 0 1 2 - 2 0 1 4
Intermountain Restoration modified an existing waterfall to form a barrier during 2013
The multi-agency crew heads to the North Fork of Grayling Creek with drip stations in hand
Final modifications to the existing waterfall during 2014 creatshyed a barrier that prevents upstream migration of fish
NPS technician Nate Thomas and Fisheries biologist Mike Ruhl monitor a rotenone drip station
Flow time data is collected by putting biodegradable fluoresshycent green dye into the water and following it downstream
Rotenone treatments were applied to Grayling Creek in 2013 Morning briefings were needed to keep everyone informed of and 2014 the work ahead
N a t i v e F i s h C o n s e r v a t i o n P r o g r a m | 3 7
The meals provided by the camp cooks kept everyone in good spirits
NPS technicians and interns carefully placed eggs into the incushybator located in South Fork Grayling Creek May 2015
Equipment was moved in and out of the backcountry via helicopter
Grayling fry successfully made their way from the incubators into Grayling Creek
Removing eggs from a female grayling from Axolotl Lake near Artctic grayling (Thymallus arcticus)- Photo copyJay FlemingEnnis MT in May 2015
3 8 | Ye l l o w s t o n e F i s h e r i e s amp A q u a t i c S c i e n c e s 2 0 1 2 - 2 0 1 4
Aquatic Ecological Monitoring amp AssessmentWater Quality Monitoring Eighteen long-term monitoring sites were sampled in 2012 while 17 sites were sampled in 2013 (figure 1 appendix a) In 2012 and 2013 ten or eleven stream sites were sampled in January and again during April through October while seven sites on Yellowstone Lake were sampled during June through October In addition discharge was monitored weekly during May through September at two sites on Reese Creek Core water quality parameters collected during each site visit included water temperature dissolved oxygen pH specific conductivity and turbidity Water was also collected and processed for total suspended solids volatile suspended solids and fixed suspended solids Dissolved anions (chloshyride sulfate and total alkalinity) dissolved cations (calcium magnesium potassium and sodium) and nutrients (nitrate nitrite ammonia and total phosphorus) were analyzed using samples from three sites
All water quality data were entered into the NPSTORET (storage and retrieval) database which is part of the national STORET database a repository for water quality biological and physical data used by state environmental agencies the Environmental Protection Agency (EPA) and other federal agencies universities and private citizens The water qualishyty sampling effort in Yellowstone during 2012 involved a toshytal of 163 site visits 291 activities and 3406 results During 2013 effort included a total of 121 site visits 276 activities and 2721 results Results included field observations multi-probe measurements and laboratory analyses Water qualitytesting was not conducted in 2014
Core and Chemical Water Quality Parameters Physical and chemical characteristics of water quality in Yellowstone National Park are related to seasonal changes elevation precipitation events and the presence of thermal features During 2012 and 2013 spatial trends in core washyter quality parameters were similar to those observed during 2002-2011 (figures 20 and 21)
During 2006-2010 water samples for chemical analysis (ions and nutrients) were collected at 10 stream sites within the Yellowstone Snake and Madison river drainages In 2011 chemical analysis occurred at only five sites one in each ofthree major river drainages (Yellowstone Snake and Madishyson) near the park boundary one on the Yellowstone River at the Yellowstone Lake outlet and one on Lamar River near its confluence with the Yellowstone River (figure 1) In 2013 chemical analysis was further reduced to three sites With the exception of pH at three sites all monitored sites met or surpassed national and state water quality standards for core and chemical parameters (anions cations and nutrients) on all collection days The Environmental Protection Agencyfreshwater aquatic life standards for pH are 65-90 standard units The three sites which had pH value exceedances were as follows bull The upper Soda Butte Creek site near the park boundary
had a low pH value of 64 on May 22 June 5 and July 17 2012 It also had a low pH value of 57 on April 15 2013
bull The Yellowstone River near Canyon had low pH values on January 16 (55) April 17 (61) and May 16 (63) 2013
bull The Gibbon River had low pH values on January 17 (63) and May 15 (61) 2013
There are several thermal features upstream of the Yellowshystone River and Gibbon River sites that have acidic runoffand likely contributed to low pH values Soda Butte Creek near the park boundary is located approximately 8 kilomeshyters downstream of McLaren mine tailings These tailings were deposited in the stream channel and surrounding floodshyplain and could have contributed to low pH values observed during the collections
The calculation of relative concentrations of major anions and cations for each site revealed a pattern among the washyter quality sites and river drainages for both 2012 and 2013
15
N a t i v e F i s h C o n s e r v a t i o n P r o g r a m | 3 9
Water Temperature Specific Conductivity 30 800
70025
600 20 500
YFB YCN YCS USB LSB LM GN SN FH GB MD
Dissolved Oxygen
YFB YCN YCS USB LSB LM GN SN FH GB MD
NTU
microS
cm
400
300
degC
10 200
5 100
0 0
Turbidity 10016
90 14 80
12 70
10 60
50
Non
e
mg
l
8 40
6 30
4 20
2 10
00 YFB YCN YCS USB LSB LM GN SN FH GB MD
YFB YCN YCS USB LSB LM GN SN FH GB MD
Solids Total SuspendedpH 120
9
10
1008
7 80 6
regulatory limits (65-80)
YFB YCN YCS USB LSB LM GN SN FH GB MD
5
4 mg
l
60
403
2 20
1
0 0
Yellowstone River Basin YFB = at Fishing Bridge YCN = at Canyon YCS = at Corwin Springs USB and ISB = upper and lower Soda Butte Creek LM = Lamar River GN = Gardner River
Snake River Basin SN = Snake River
Madison River Basin FH = Firehole River GB = Gibbon River MD = Madison River
YFB YCN YCS USB LSB LM GN SN FH GB MD
Mean
Median
x Near Outliers
+ Far Outliers
Regulatory Limits
Figure 20 Box and whisker plots illustrating annual variation for selected parameters at each water quality location in 2012 Lower and upper portions of boxes represent the 25th and 75th percentile respectively lower and upper black horizontal bars represent 10th and 90th percentile respectively
15
4 0 | Ye l l o w s t o n e F i s h e r i e s amp A q u a t i c S c i e n c e s 2 0 1 2 - 2 0 1 4
Water Temperature Specific Conductivity 800
700
30
25 600
20 500
YFB YCN YCS USB LSB LM GN FH GB MDYFB YCN YCS USB LSB LM GN FH GB MD
microSc
m
400
300
degC
10 200
5 100
0 0
Turbidity Dissolved Oxygen 10014
90
12 80
7010 60
8
mg
l N
TU
50
40mg
l
6
30 4
20
2 10
00 YFB YCN YCS USB LSB LM GN FH GB MD
YFB YCN YCS USB LSB LM GN FH GB MD
pH Solids Total Suspended
regulatory limits (65-80)
120
9
10
1008
7 80
6
YFB YCN YCS USB LSB LM GN FH GB MD
Non
e 5 60 4
403
2 201
0 0YFB YCN YCS USB LSB LM GN FH GB MD
Mean Yellowstone River Basin YFB = at Fishing Bridge YCN = at Canyon YCS = at Corwin Springs USB and ISB = upper and lower Soda Butte Creek Median LM = Lamar River GN = Gardner River
x Near Outliers Snake River Basin SN = Snake River
+ Far Outliers Madison River Basin FH = Firehole River GB = Gibbon River MD = Madison River Regulatory Limits
Figure 21 Box and whisker plots illustrating annual variation for selected parameters at each water quality location in 2013 Lower and upper portions of boxes represent the 25th and 75th percentile respectively lower and upper black horizontal bars represent 10th and 90th percentile respectively Outlying values are represented by ldquoXrdquo means are indicated by an open circle
N a t i v e F i s h C o n s e r v a t i o n P r o g r a m | 4 1
While relative concentrations of bicarbonate (HCO32-) ions
were dominant at all water quality stations concentrations ofother major ions varied among watersheds Both sites on the Yellowstone River (Corwin Springs and Fishing Bridge) and the site on the Snake River had relatively equal proportions of sulfate sodium chloride and calcium compared to the other ions analyzed In contrast calcium was the dominant ion within the Lamar River and sodium and chloride ions were present in approximately equal proportions within the Madison River Across the park phosphorus and nitrogen concentrations were very low as were nitrate nitrite and ammonia with most sites below the detection limits
Monitoring of 303(d) Listed Streams Segments of Reese Creek Soda Butte Creek and the Yellowshystone River were monitored because they are listed as 303(d) impaired by the State of Montana which implies they onlypartially support aquatic life and coldwater fisheries (figure 1)
Reese Creek ndash The lowermost reach of Reese Creek (figure 1) is on Montanarsquos 303(d) list because historical irrigation practices often dewater the stream during mid-summer and fall making it unsuitable for sustaining trout Because Reese Creek supports resident and migratory (spawning) cutthroat trout from the Yellowstone River monitoring of discharge during summer is important to conserve these native fish populations and overall biological integrity To ensure an adequate amount of water remains in lower Reese Creek the NPS measures stream flows and estimates discharge each year during months when water is diverted from the stream by neighboring landowners for irrigation north of the park in the Gardiner Basin
In 2012 and 2013 discharge was estimated during 15 site visshyits at the Reese Creek mainstem immediately above the upshypermost diversion structure and at the channel of the uppershymost diversion ditch The difference in discharge between these two sites is the amount of water entering the main channel of Reese Creek below the uppermost diversion The adjudicated water rights stipulate Reese Creek is to have a minimum flow of 1306 cubic feet per second from April 15 to October 15 During 2012 early spring runoff resulted in high peak flows during June followed by a dry summer with
minimal flows through fall Discharge on Reese Creek ranged from 314 to 043 cubic feet per second from early July to the end of September (figure 22) In-stream flow decreased beshylow minimum flow requirements for the last eight samples collected during summer and fall During 2013 stream flows remained relatively stable throughout spring with discharges ranging from 505 to 255 cubic feet per second (figure 22) Beginning in mid-July in-stream flow again fell below minishymum flow requirements and remained below required levels until early September
Soda Butte Creek ndash In-stream metals contamination in Soda Butte Creek is a result of historical mining in the vicinshyity of Cooke City Montana upstream of the park boundshyary Mine tailings persist within the floodplain in this area contributing to its 303(d) listing Partner agencies initiated a 3-year effort to relocate mine tailings away from the floodshyplain in 2011 an activity that posed a risk of heavy metal conshytamination of the creek The NPS conducted intensive monshyitoring and sample collection from June through October in both 2012 and 2013 Metal concentrations for arsenic seleshynium and zinc were below EPA standards for drinking water and aquatic life However in 2012 high total copper conshycentrations (00182 milligrams per liter) exceeded acute and chronic aquatic standards during one sample event in May Dissolved iron concentrations also exceeded drinking water (five sample events) and aquatic life standards (two sample events) between May and July (figure 23) In 2013 total and dissolved concentrations for arsenic copper selenium and zinc were below standards for drinking water and aquatic life Dissolved iron concentrations exceeded drinking water (six sample events) and aquatic life standards (two sample events) between January and October 2013 (figure 23)
Yellowstone River Upstream of Corwin Springs ndash This reach was first listed on Montanarsquos 303(d) list in 2006 due to sedimentation and arsenic levels exceeding drinking water standards Data to support this initial listing were collected in 1999-2001 (Miller et al 2004) To detershymine the current level of arsenic in the river the NPS samshypled water in January and again from April through October in both 2012 and 2013 Drinking water standards for arsenic should not exceed 001 milligrams per liter During 2012 total arsenic concentrations ranged from 00078 to 00348
4 2 | Ye l l o w s t o n e F i s h e r i e s amp A q u a t i c S c i e n c e s 2 0 1 2 - 2 0 1 4
Figure 22 Reese Creek stream flow (blue) compared to a required minimum stream flow (red) for 2012-2013
Figure 23 Soda Butte Creek total iron concentrations (blue) compared to EPA drinking water standards (green) and aquatic life criteria (red) for 2012-2013
milligrams per liter and exceeded drinking water standards during six of eight site visits (figure 24) In 2013 total arsenic concentration ranged from 00056 to 0508 milligrams per lishyter and exceeded drinking water standards during four of six site visits (figure 24)
Yellowstone Lake Limnology Understanding basic limnology of Yellowstone Lake proshymotes cutthroat trout conservation by enhancing the effishyciency of the lake trout suppression program Monthly washyter temperature dissolved oxygen specific conductance and turbidity measurements were recorded at seven sites from
June to October in 2012 and 2013 (figure 1) Surface water chemical characteristics were consistent throughout the lake except for the Southeast Arm The upper Yellowstone Rivshyer enters the southern tip of the Southeast Arm and delivers sediments from the upper portions of the watershed during snowmelt As a result this area of the lake tends to exhibshyit higher turbidity and lower specific conductance during spring runoff
Water temperature affects the distribution and movement patterns of fish in Yellowstone Lake From 2012 to 2014 23 water temperature loggers were deployed in the West Thumb
N a t i v e F i s h C o n s e r v a t i o n P r o g r a m | 4 3
Figure 24 Yellowstone River at Corwin Springs total arsenic concentrations (blue) compared to drinking water stanshydards (red) for 2012-2013
portion of Yellowstone Lake to document change in water temperature throughout the summer The depth of these loggers ranged from the surface (0 meters) to the lake botshytom (90 meters) with most loggers being deployed at 1-meshyter intervals between 0 and 20 meters Surface water temshyperatures began to warm in early to mid-July each year The thermocline (area with greatest water temperature change) continued to increase in depth with highest average surface temperatures (17-18ordmC) occurring in August (figure 25) The maximum depth of the warmer surface water extendshyed down 10-12 meters for all three years In 2012 and 2014 surface water temperatures began to gradually cool in earlySeptember with average temperatures falling below 12oC by mid-September By comparison surface water temperatures in 2013 did not begin to cool until late September which was followed by an abrupt cooling of water temperatures in earlyOctober (figure 25)
Health Assessments via Macroinvertebrate Surveys Macroinvertebrates were sampled at 23 sites in three watershysheds during 2012 four in the Shoshone eight in the Yelshylowstone and eleven in the Missouri (figure 1) The four sites in the Shoshone River watershed are part of long-term monitoring on Middle Creek where runoff from road conshystruction on Sylvan Pass resulted in the deposit of sediments in Mammoth Crystal Springs a small tributary to Middle
0
5
10
15
20
25
30
0
5
10
15
20
25
30
0
5
10
15
20
25
30 Jul Aug Sep Jul Aug Sep Jul Aug Sep
2012 2013 2014
Sample Month and Year
4 6 8 10 12 14 16 Temperature (oC)
Figure 25 Yellowstone Lake isopleths showing seasonal and annual variation in water temperature throughout the water column 2012-2014 Only upper 30 meters are shown (y-axis) for better resolution of surface water temperatures
Creek Macroinvertebrate data will be used to monitor reshycovery of the tributary
During 2013 macroinvertebrates were sampled at 11 locashytions (figure 1) Four sites were sampled within the Yellowshystone River watershed and within the Elk Creek drainage An additional seven sites were sampled within the Missouri Rivshyer watershed and included one site in the Goose Lake area two sites on Cougar Creek and four sites on Grayling Creek
4 4 | Ye l l o w s t o n e F i s h e r i e s amp A q u a t i c S c i e n c e s 2 0 1 2 - 2 0 1 4
In 2014 macroinvertebrates were sampled at 24 sites in three watersheds four in the Shoshone fifteen in the Yellowstone and five in the Missouri (figure 1) As in 2012 the four sites in the Shoshone River watershed are being monitored on Midshydle Creek to evaluate past road construction activities in that portion of the park
Sampling sites in the Yellowstone and Missouri River watershysheds were within current or proposed native fish restoration areas To assess rotenonersquos impact on stream invertebrate communities aquatic invertebrate surveys were conducted before and after rotenone application was used to remove nonnative fish from Elk Creek within the Yellowstone River drainage during 2012-2014 and from Grayling Creek within the Madison River drainage during 2013-2014 All inverteshybrate samples were sent to an independent contractor for analyses (results pending)
Amphibians in Native Fish Restoration Areas Wetlands were surveyed for presence of amphibians from 2012 to 2014 in the Elk-Yanceys-Lost Creek complex as well as a small watershed that encompasses the Goose Lake chain of lakes
Elk-Yanceys-Lost Creek Complex ndash Since amphibishyan sampling in the lower Elk Creek drainage began in 2006 48 wetlands have been sampled Twenty of these wetlands (42) were occupied by amphibians with one or more life stages (eggs larvae andor adults) present The three speshycies known to breed in this drainage include 1) boreal choshyrus frog (Pseudacris maculata) 2) blotched tiger salamander (Ambystoma tigrinum melanostictum) and 3) Columbia spotshyted frog (Rana luteiventris) During 2012 20 sites were samshypled that had previous observations of amphibians (figure 26) Breeding populations of blotched tiger salamanders and Columbia spotted frogs were observed at 10 sites (50) and adults were found at two additional sites (10) No amphibshyians were detected at the remaining eight sites (40) which were dry or contained little water None of the wetlands used for breeding sites were directly connected to Elk Creek or its tributaries therefore they were not treated with piscicides during native fish restoration activities in 2012-2014
In 2013 fewer breeding populations of blotched tiger salashymanders and Columbia spotted frogs were observed at the same 20 sites sampled in 2012 Breeding populations ofblotched tiger salamanders were observed at seven of the sites (35) and Columbia spotted frogs were observed at two sites (10) Adults of these two species were found at two additional sites (10) Boreal chorus frogs were found at two sites (10) Ten sites (50) were dry and one site contained little surface water to maintain an environment adequate for amphibian larvae In 2014 breeding populashytions of amphibians occurred at 14 of the 20 sites Breedshying populations of blotched tiger salamanders were found at 11 sites (55) Columbia spotted frogs were found at four sites (20) and boreal chorus frogs were found at two sites (10) No amphibians were detected at the remaining six sites (30)
Goose Lake Chain of Lakes ndash In 2011 the Goose Lake chain of lakes was treated with rotenone to remove nonnative rainbow trout At the time of treatment Goose and Goose-neck lakes contained larval blotched tiger salamanders After treatment 157 larval salamanders were found dead along the shoreline In Yellowstone larval salamanders may overwinshyter two or more years before transforming into adults (Koch and Peterson 1995) Juvenile Columbia spotted frogs were found in the small headwater lake and Gooseneck Lake They all appeared healthy and not affected by the treatment In July 2012 three lakes were sampled for the presence ofamphibians Larval blotched tiger salamanders were found only in Goose Lake while Columbia spotted frog tadpoles were found in all three lakes Previous survey years never reshyvealed a breeding population of Columbia spotted frogs in Goose Lake Because rainbow trout are known to prey on amphibians removal of these fish from Goose Lake most likely contributed to the survival and increased abundance of Columbia spotted frogs
In July 2013 and 2014 the three lakes were sampled again for the presence of amphibians Larval blotched tiger salashymanders were only found in Gooseneck Lake and the small headwater lake while adult salamanders were only found in Gooseneck Lake (2013) In 2013 adult Columbia spotted frogs were found in Goose and Gooseneck lakes but were not observed in the small headwater lake In 2014 adult Coshylumbia spotted frogs were observed in all three lakes
Figure 26 Amphibian monitoring sites in the Elk Creek drainage
Ye llowston e R
i v e r
Elk Creek FallsE lk C r e e k
E l k C r e e k
Yancey Creek Yancey Cr
Fish Barrier
Lost Creek Falls
Tower Junction
Dry Reach
Mammoth
L o s t Cr
Breeding in 2014 Breeding in 2012 and 2014 Breeding in 2013 and 2014 Breeding in 2012-2014 Fish Barrier Detox Station Streams in Project Area Lost Creek Dry Reach Streams Roads Wetlands
0 105 km
0 105 mile
N a t i v e F i s h C o n s e r v a t i o n P r o g r a m | 4 5
Amphibians Not Observed Breeding in 2012
Breeding in 2013
Salmon fly over the Yellowstone River - NPS Photo
4 6 | Ye l l o w s t o n e F i s h e r i e s amp A q u a t i c S c i e n c e s 2 0 1 2 - 2 0 1 4
Yellowstone cutthroat trout ready for release - Photo copyMike Canetta
N a t i v e F i s h C o n s e r v a t i o n P r o g r a m | 4 7
Public InvolvementVolunteer Angler Report Card Trends Angling remains a popular pastime for those visiting living near or working in Yellowstone National Park There were 42870 fishing permits issued in 2012 (34 million visitors toshytal) 42259 permits issued in 2013 (32 million visitors total) and 42831 permits issued in 2014 (35 million visitors total) Fishing permits which are required for fishing in park washyters were accompanied by a volunteer angler report card to provide anglers an opportunity to share their fishing success and opinions with park managers
The general fishing season in Yellowstone National Park opens on Memorial Day weekend and lasts until early Noshyvember In 2014 an estimated 41435 anglers spent an estishymated 169739 days fishing caught 399808 fish and released 95 of captured fish The estimated total number of days anglers spent fishing has decreased in recent years There are similar numbers of anglers each year but on average each anshygler is fishing fewer days in the park
Native fish (cutthroat trout Arctic grayling and mountain whitefish) comprised 49 of all fish caught in 2012 54 ofthe catch in 2013 and 62 of the catch in 2014 Cutthroat trout have remained the most sought after and caught speshycies representing 44 of all fish caught in 2012 49 ofthe catch in 2013 and 59 of the catch in 2014 (figure 27) Rainbow trout were the second most frequently caught fish
Brook trout Rainbow trout 7
Arctic grayling 1
Lake trout 9
11 Brown trout
Mountain whitefish 11 2
Cutthroat trout 59
Figure 27 Native cutthroat trout remained the most sought after and caught fish species by anglers in 2013 comprising 59 of all fish caught in the park
(11-18 of angler catch) followed by brown trout (11-12) lake trout (8-11) and brook trout (7-10)
Anglers reported the lengths of 11864 fish 54 were lonshyger than 305 millimeters (12 inches) and 39 were longer than 356 millimeters (14 inches) Lake trout had the greatest average length of 416 millimeters (16 inches) and were the most likely fish to be kept (35) The release of native fish (cutthroat trout Arctic grayling and mountain whitefish) is
Raft eletroshocking along the Madison River - NPS photo
4 8 | Ye l l o w s t o n e F i s h e r i e s amp A q u a t i c S c i e n c e s 2 0 1 2 - 2 0 1 4
required by park regulations and 999 of them were reshyported released
Anglers reported being satisfied with their overall experience (80) the numbers of fish caught (65) and the sizes of fish caught (70) These satisfaction rates are all slightly higher than rates reported in previous recent years
Fly Fishing Volunteer Program Each year during 2012-2014 between 36 and 42 volunteers contributed between 1443 and 1785 hours to the parkrsquos fisheries program Volunteer anglers focused on collecting samples for cutthroat trout genetics including the distrishybution of pure and hybridized fish in Lamar River Slough Creek and Soda Butte Creek Volunteers also collected samshyples to evaluate possible genetic factors influencing rainbow trout thermal tolerance in the Firehole River as well as the concentration of mercury in fish in several lakes As in past years the volunteers indicated their experience was positive and they were happy to contribute to Yellowstone fisheries research
Projects by Graduate Students During reporting years 2012-2014 the following graduate students assisted the park Fisheries Program with research efforts
Graduate student Tonya Chamberlain(Master of Science candidate) Committee Chair Dr Amy Krist Department of Zoology amp Physiology University of Wyoming Title An investigation of life history shifts in zooplankton in Yellowstone Lake following the introduction of lake trout Status Graduated 2013
Graduate student Kole Stewart (Master of Science candidate) Committee Chair Dr Thomas McMahon Department ofEcology Montana State University Title Using otolith microchemistry to distinguish spawning locations of Yellowstone cutthroat trout and lake trout in Yellowstone Lake Wyoming Status Field studies analyses and writing ongoing
Graduate student John Syslo(Doctor of Philosophy) Committee chair Dr Christopher Guy US Geological Surshyvey Cooperative Fisheries Research Unit Department ofEcology Montana State UniversityTitle Response of Yellowstone cutthroat trout to nonnative predator removal in the Yellowstone Lake ecosystem Yelshylowstone National Park Status Graduated 2015
Interagency Workgroups Biologists from Yellowstone National Park participate in the Yellowstone Cutthroat Trout Interstate Workgroup the Montana Cutthroat Trout Steering Committee and the Fluvial Arctic Grayling Workgroup Shared goals and obshyjectives among partner agencies and non-governmental orshyganizations are defined in a memorandum of agreement for the conservation and management of Yellowstone cutthroat trout a memorandum of understanding and conservation agreement for westslope cutthroat trout and Yellowstone cutthroat trout in Montana and a memorandum of undershystanding concerning the recovery of fluvial Arctic grayling
Yellowstone Lake Workgroup The Yellowstone Lake Workgroup consists of Trout Unlimitshyed National (Idaho Montana and Wyoming Councils) Nashytional Parks Conservation Association Greater Yellowstone Coalition Yellowstone Park Foundation and Yellowstone National Park The groups entered into a memorandum ofunderstanding in 2012 to enhance the cooperative relationshyship among the participants and to ensure that the Greater Yellowstone Ecosystem is protected maintained and manshyaged to achieve the goals established for the park Among those goals is the conservation and protection of ecosystems that ensure native coldwater fisheries will persist for the enshyjoyment of present and future generations The cooperative activities of this workgroup are currently focused on lake trout sonic telemetry studies and the development of altershynative lake trout suppression methods such as the destrucshytion of lake trout embryos on spawning areas
N a t i v e F i s h C o n s e r v a t i o n P r o g r a m | 4 9
Implanting acoustic telemetry tags in lake trout to identify breeding areas - NPS photo
5 0 | Ye l l o w s t o n e F i s h e r i e s amp A q u a t i c S c i e n c e s 2 0 1 2 - 2 0 1 4
AcknowledgmentsThe Native Fish Conservation Program is supported through Yellowstone Center for Resources base funding and a porshytion of the fees collected from anglers who purchase fishing permits During 2012-2014 additional funding was received from the following sources
bull Yellowstone Park Foundation through the Fisheries Fund Initiative Fly Fishing Volunteer Program and Nashytive Fish Conservation Program
bull Recreational Fee Demonstration Program of the Federal Lands Recreation Enhancement Act
bull Natural Resource Preservation Program of the NPS bull National Fish and Wildlife Foundation bull Park Roads and Parkways Program of the Federal Highshy
way Administration bull Greater Yellowstone Network Vital Signs Monitoring
Program of the NPS bull Greater Yellowstone Coordinating Committee and bull Trout Unlimited Greater Yellowstone Coalition and the
National Parks Conservation Association
Special thanks are extended to these organizations and prishyvate individuals that have graciously supported native fish restoration in Yellowstone National Park Special thanks to the former chief of the Yellowstone Center for Resources Dave Hallac for his contributions to fisheries conservation in Yellowstone Park staff who work on the fisheries project are noted in appendix B amp C
Administrative support for the Native Fish Conservation Program was provided by Barbara Cline Alana Darr Monshytana Lindstrom and Melissa McAdam Diane Eagleson with the Montana Institute on Ecosystems provided support for stream restoration and coordination of the Fly Fishing Volshyunteer Program This report was finalized by the Science Communications Program in the Yellowstone Center for Reshysources Special thanks to Sarah Haas Charissa Reid Karin Bergum and Christie Hendrix for their efforts with editing and designing this report
Over several years Allison Klein of the Spatial Analysis Censhyter has provided a tremendous amount of support for field operations and publications Thanks to Wendy Hafer from the Fire Cache Ben Cunningham and Wally Wines from Corshyral Operations Michael Mustafaga Lynn Webb and Dave Whaley from Lake Maintenance Brad Ross and Kim West from the South District Rangers Brian Chan from Lamar District Rangers and Michael Keator and Tara Ross from the West District Rangers
The Student Conservation Association and Montana Conshyservation Corps provided many people for the day-to-dayactivities of the program Special thanks to Travis Horton and Pat Clancey with Montana Fish Wildlife amp Parks Bruce Roberts with the US Forest Service Jim Mogen with the US Fish and Wildlife Service and Carter Kruse with Turner Enterprises Inc
The crew in the field at Grayling Creek The group was comprised of staff from Yellowstone National Park Montana Fish Wildlife amp Parks the US Forest Service the US Fish amp Wildlife Service Turner Enterprises Inc and the amazshying camp cooks
N a t i v e F i s h C o n s e r v a t i o n P r o g r a m | 5 1
Fish crew - 2012 - NPS photo
Fish crew - 2013 - NPS photo
Fish crew - 2014 - NPS photo
5 2 | Ye l l o w s t o n e F i s h e r i e s amp A q u a t i c S c i e n c e s 2 0 1 2 - 2 0 1 4
Literature CitedAlexander JD BL Kerans TM Koel and C Rasmussen 2011 Context-specific parasitism in Tubifex tubifex in geoshythermally influenced stream reaches in Yellowstone National Park Journal of the North American Benthological Society30853-867
Brown PJ CS Guy and MH Meeuwig 2014 Use of moshybile electrofishing to induce mortality in lake trout embryos in Yellowstone Lake Final report 2014 Montana Cooperashytive Fishery Research Unit Montana State University Bozeshyman Montana USA
Gresswell RE 2009 Scientific review panel evaluation ofthe National Park Service lake trout suppression program in Yellowstone Lake August 25-29 2008 Final report US Geological Survey Northern Rocky Mountain Science Censhyter Bozeman Montana USA YCR-2009-05
Gresswell RE CS Guy MJ Hansen ML Jones and PJ Martinez 2013a Lake trout suppression in Yellowstone Lake Science review team annual scientific assessment May 24 2012 Final report US Geological Survey Northern Rocky Mountain Science Center Bozeman Montana USA
Gresswell RE CS Guy MJ Hansen ML Jones JE Marsden and PJ Martinez 2013b Lake trout suppression in Yellowstone Lake Science review team annual scientific assessment May 14-15 2013 Final Report US Geologishycal Survey Northern Rocky Mountain Science Center Bozeshyman Montana USA
Koch ED and CR Peterson 1995 Amphibian and repshytiles of Yellowstone and Grand Teton National Parks Unishyversity of Utah Press Salt Lake City Utah USA
Koel TM DL Mahony KL Kinnan C Rasmussen CJ Hudson S Murcia and BL Kerans 2006 Myxobolus cereshybralis in native cutthroat trout of the Yellowstone Lake ecoshysystem Journal of Aquatic Animal Health 18157-175
Koel TM and J York 2006 Restoration of westslope cutthroat trout in the East Fork Specimen Creek watershy
shed Environmental assessment May 5 2006 National Park Service US Department of the Interior Yellowstone National Park httpparkplanningnpsgovdocument cfmparkID=111ampprojectID=13064ampdocumentID=15130
Koel TM PE Bigelow PD Doepke BD Ertel and DL Mahony 2005 Nonnative lake trout result in Yellowstone cutthroat trout decline and impacts to bears and anglers Fisheries 3010-19
Koel TM JL Arnold PE Bigelow PD Doepke BD Er-tel and ME Ruhl 2008 Yellowstone Fisheries amp Aquatic Sciences Annual Report 2007 National Park Service Yelshylowstone Center for Resources Yellowstone National Park Wyoming USA YCR-2008-02
Koel TM BL Kerans SC Barras KC Hansen and J Wood 2010a Avian piscivores as vectors for Myxobolus ceshyrebralis in the Greater Yellowstone Ecosystem Transactions of the American Fisheries Society 139976-988
Koel TM JL Arnold PE Bigelow and ME Ruhl 2010b Native fish conservation plan Environmental asshysessment December 16 2010 National Park Service US Department of the Interior Yellowstone National Park Wyoming USA httpparkplanningnpsgovdocument cfmparkID=111ampprojectID=30504ampdocumentID=37967
Koel TM JL Arnold PE Bigelow PD Doepke BD Er-tel and ME Ruhl 2012 Yellowstone Fisheries amp Aquatic Sciences Annual report 2011 National Park Service Yelshylowstone Center for Resources Yellowstone National Park Wyoming USA YCR-2012-03
Martin NV and CH Olver 1980 The lake charr Salvelishynus namaycush Pages 205-277 in EK Balon editor Charrs Salmonid fishes of the genus Salvelinus Perspectives in vershytebrate science Kluwer Boston Hingham Massachusetts USA
Miller KM ML Clark and PR Wright 2004 Water qualshyity assessment of the Yellowstone River Basin Montana and
N a t i v e F i s h C o n s e r v a t i o n P r o g r a m | 5 3
Wyoming ndash water quality of fixed sites 1999-2001 US Geoshylogical Survey Scientific Investigations Report 2004-5113
Munro A R TE McMahon and JR Ruzycki 2005 Natushyral chemical markers identify source and date of introduction of an exotic species Lake trout (Salvelinus namaycush) in Yellowstone lake Canadian Journal of Fisheries and Aquatic Sciences 6279-87
Murcia S BL Kerans E MacConnell and TM Koel 2011Correlation of environmental attributes with histopathologyof native Yellowstone cutthroat trout naturally infected with Myxobolus cerebralis Diseases of Aquatic Organisms 93225shy234
Murcia S BL Kerans TM Koel and E MacConnell 2015 Myxobolus cerebralis (Hofer) infection risk in native cutshythroat trout Oncorhynchus clarkii (Richardson) and its relashytionships to tributary environments in the Yellowstone Lake Basin Journal of Fish Diseases 38637ndash652
Reinhart DP and DJ Mattson 1990 Bear use of cutthroat trout spawning streams in Yellowstone National Park Inshyternational Conference on Bear Research and Management 8343ndash350
Reinhart DP ST Olliff and KA Gunther 1995 Managshying bears and developments on cutthroat spawning streams in Yellowstone Park Pages 161-169 in AP Curlee AM Gillesberg and D Casey editors Greater Yellowstone predshyators ecology and conservation in a changing landscape Proceedings of the 3rd biennial conference on the Greater Yellowstone Ecosystem Northern Rockies Conservation Cooperative Jackson Wyoming USA
Rotella J 2014 Estimates of lake trout abundance in Yelshylowstone Lake for 2013 from mark-recapture data Montana State University Bozeman Montana USA Unpublished data
Ruzycki JR DA Beauchamp and DL Yule 2003 Effects of introduced lake trout on native cutthroat trout in Yellowshystone Lake Ecological Applications 1323-37
Ruzycki JR 2004 Impact of lake trout introductions on cutthroat trout of selected western lakes of the continental United States Dissertation Utah State University Logan Utah USA
Syslo JM CS Guy PE Bigelow PD Doepke BD Ertel and TM Koel 2011 Response of non-native lake trout (Salvelinus namaycush) to 15 years of harvest in Yellowstone Lake Yellowstone National Park Canadian Journal of Fishshyeries and Aquatic Sciences 682132-2145
Varley JD and P Schullery 1995a Executive summary Pages 2-3 in J D Varley and P Schullery editors The Yellowshystone Lake crisis confronting a lake trout invasion A Report to the Director of the National Park Service Yellowstone Center for Resources Yellowstone National Park Wyoming USA
Varley JD and P Schullery 1995b Socioeconomic values associated with the Yellowstone Lake cutthroat trout Pages 22-27 in J D Varley and P Schullery editors The Yellowshystone Lake crisis confronting a lake trout invasion A Report to the Director of the National Park Service Yellowstone Center for Resources Yellowstone National Park Wyoming USA
Varley J D and P Schullery 1998 Yellowstone fishes Ecolshyogy history and angling in the park Stackpole Books Meshychanicsburg Pennsylvania USA
Wendy Hafer helps deliver supplies into camp with the park helicopter - NPS photo
5 4 | Ye l l o w s t o n e F i s h e r i e s amp A q u a t i c S c i e n c e s 2 0 1 2 - 2 0 1 4
AppendixAppendix A Water quality stations sampled in 2012-2013
Yellowstone River Drainage
YELL_YS6164M Yellowstone River at Fishing Bridge YELL_YS6005M Yellowstone River at Canyon YELL_YS5497M Yellowstone River at Corwin Springs YELL_SB0157M Soda Butte Creek at park boundary YELL_SB0015M Soda Butte Creek near Lamar Ranger Station YELL_LM0005M Lamar River near Tower Ranger Station YELL_GN0029M Gardner River near Gardiner Montana YELL_RC0009A Reese Creek lower diversion YELL_RC0009B Reese Creek upper discharge mainstem
YELL_YL001OM-007OM Yellowstone Lake sites 1-7 YELL_FH0018C Firehole River near Madison Junction
Madison River Drainage YELL_GB0002M Gibbon River near Madison Junction YELL_MD1332T Madison River near park boundary
Snake River Drainage YELL_SN9999M Snake River at old Flagg Ranch stream sites that appear on Montanas 303(d) list
stream sampled in 2012 only
Yellowstone cutthroat trout sampling - NPS photo
N a t i v e F i s h C o n s e r v a t i o n P r o g r a m | 5 5
Appendix B Seasonal staff in 2012-2014
Seasonal Staff 2012 Seasonal Staff 2013 Seasonal Staff 2014 Christopher Daly Benjamin Brogie Benjamin Brogie Colleen Detjens Brent Trim Cristina Dressel
Earl Drescher Carla Rothenbuecher Josh Litvinoff Jaclyn Schultz Colleen Detjens Alex Poole Jay Fleming Cynthia Nau Nathan Roueche
Kole Stewart Jacob Williams Kristopher Shultz Kyle Mosel Kole Steward Nathan Thomas
Michael Consolo Michael Consolo William Voigt Nathan Thomas Michael Polchlopek Jacob Williams Tiffany Hutton Nathan Thomas William Holden Stephen Huffman William Voigt Theresa Campbell
William Voigt
Appendix C Student Conservation Association (SCA) Interns in 2012-2014
SCA Staff 2012 SCA Staff 2013 SCA Staff 2014 Alyssa Riggs Chay Leinweber Taher Ali
Amanda Guenther Chelsey Sherwood Carl Ausprung Carly Cavutt Donald Blenkendorf Trevor Beutel Cynthia Nau Eric Raslich Shannon Boyle
Haley Carlson Joshua Litvinoff Lauren Frisbie Heath Kessi Kody Kasper Hayley Glassic
Heather Paddock Larissa Lee Drew Mac Donald Jacob Williams Levi Garrett Lauren McGarvey
Nathan McWilliams Rick Inniello Andriana Puchany Regina Thill Thomas Short Rachel Voorhorst
Zebidiah Buck Justin Walley
FOR MORE INFORMATION wwwnpsgovycr

15
4 0 | Ye l l o w s t o n e F i s h e r i e s amp A q u a t i c S c i e n c e s 2 0 1 2 - 2 0 1 4
Water Temperature Specific Conductivity 800
700
30
25 600
20 500
YFB YCN YCS USB LSB LM GN FH GB MDYFB YCN YCS USB LSB LM GN FH GB MD
microSc
m
400
300
degC
10 200
5 100
0 0
Turbidity Dissolved Oxygen 10014
90
12 80
7010 60
8
mg
l N
TU
50
40mg
l
6
30 4
20
2 10
00 YFB YCN YCS USB LSB LM GN FH GB MD
YFB YCN YCS USB LSB LM GN FH GB MD
pH Solids Total Suspended
regulatory limits (65-80)
120
9
10
1008
7 80
6
YFB YCN YCS USB LSB LM GN FH GB MD
Non
e 5 60 4
403
2 201
0 0YFB YCN YCS USB LSB LM GN FH GB MD
Mean Yellowstone River Basin YFB = at Fishing Bridge YCN = at Canyon YCS = at Corwin Springs USB and ISB = upper and lower Soda Butte Creek Median LM = Lamar River GN = Gardner River
x Near Outliers Snake River Basin SN = Snake River
+ Far Outliers Madison River Basin FH = Firehole River GB = Gibbon River MD = Madison River Regulatory Limits
Figure 21 Box and whisker plots illustrating annual variation for selected parameters at each water quality location in 2013 Lower and upper portions of boxes represent the 25th and 75th percentile respectively lower and upper black horizontal bars represent 10th and 90th percentile respectively Outlying values are represented by ldquoXrdquo means are indicated by an open circle
N a t i v e F i s h C o n s e r v a t i o n P r o g r a m | 4 1
While relative concentrations of bicarbonate (HCO32-) ions
were dominant at all water quality stations concentrations ofother major ions varied among watersheds Both sites on the Yellowstone River (Corwin Springs and Fishing Bridge) and the site on the Snake River had relatively equal proportions of sulfate sodium chloride and calcium compared to the other ions analyzed In contrast calcium was the dominant ion within the Lamar River and sodium and chloride ions were present in approximately equal proportions within the Madison River Across the park phosphorus and nitrogen concentrations were very low as were nitrate nitrite and ammonia with most sites below the detection limits
Monitoring of 303(d) Listed Streams Segments of Reese Creek Soda Butte Creek and the Yellowshystone River were monitored because they are listed as 303(d) impaired by the State of Montana which implies they onlypartially support aquatic life and coldwater fisheries (figure 1)
Reese Creek ndash The lowermost reach of Reese Creek (figure 1) is on Montanarsquos 303(d) list because historical irrigation practices often dewater the stream during mid-summer and fall making it unsuitable for sustaining trout Because Reese Creek supports resident and migratory (spawning) cutthroat trout from the Yellowstone River monitoring of discharge during summer is important to conserve these native fish populations and overall biological integrity To ensure an adequate amount of water remains in lower Reese Creek the NPS measures stream flows and estimates discharge each year during months when water is diverted from the stream by neighboring landowners for irrigation north of the park in the Gardiner Basin
In 2012 and 2013 discharge was estimated during 15 site visshyits at the Reese Creek mainstem immediately above the upshypermost diversion structure and at the channel of the uppershymost diversion ditch The difference in discharge between these two sites is the amount of water entering the main channel of Reese Creek below the uppermost diversion The adjudicated water rights stipulate Reese Creek is to have a minimum flow of 1306 cubic feet per second from April 15 to October 15 During 2012 early spring runoff resulted in high peak flows during June followed by a dry summer with
minimal flows through fall Discharge on Reese Creek ranged from 314 to 043 cubic feet per second from early July to the end of September (figure 22) In-stream flow decreased beshylow minimum flow requirements for the last eight samples collected during summer and fall During 2013 stream flows remained relatively stable throughout spring with discharges ranging from 505 to 255 cubic feet per second (figure 22) Beginning in mid-July in-stream flow again fell below minishymum flow requirements and remained below required levels until early September
Soda Butte Creek ndash In-stream metals contamination in Soda Butte Creek is a result of historical mining in the vicinshyity of Cooke City Montana upstream of the park boundshyary Mine tailings persist within the floodplain in this area contributing to its 303(d) listing Partner agencies initiated a 3-year effort to relocate mine tailings away from the floodshyplain in 2011 an activity that posed a risk of heavy metal conshytamination of the creek The NPS conducted intensive monshyitoring and sample collection from June through October in both 2012 and 2013 Metal concentrations for arsenic seleshynium and zinc were below EPA standards for drinking water and aquatic life However in 2012 high total copper conshycentrations (00182 milligrams per liter) exceeded acute and chronic aquatic standards during one sample event in May Dissolved iron concentrations also exceeded drinking water (five sample events) and aquatic life standards (two sample events) between May and July (figure 23) In 2013 total and dissolved concentrations for arsenic copper selenium and zinc were below standards for drinking water and aquatic life Dissolved iron concentrations exceeded drinking water (six sample events) and aquatic life standards (two sample events) between January and October 2013 (figure 23)
Yellowstone River Upstream of Corwin Springs ndash This reach was first listed on Montanarsquos 303(d) list in 2006 due to sedimentation and arsenic levels exceeding drinking water standards Data to support this initial listing were collected in 1999-2001 (Miller et al 2004) To detershymine the current level of arsenic in the river the NPS samshypled water in January and again from April through October in both 2012 and 2013 Drinking water standards for arsenic should not exceed 001 milligrams per liter During 2012 total arsenic concentrations ranged from 00078 to 00348
4 2 | Ye l l o w s t o n e F i s h e r i e s amp A q u a t i c S c i e n c e s 2 0 1 2 - 2 0 1 4
Figure 22 Reese Creek stream flow (blue) compared to a required minimum stream flow (red) for 2012-2013
Figure 23 Soda Butte Creek total iron concentrations (blue) compared to EPA drinking water standards (green) and aquatic life criteria (red) for 2012-2013
milligrams per liter and exceeded drinking water standards during six of eight site visits (figure 24) In 2013 total arsenic concentration ranged from 00056 to 0508 milligrams per lishyter and exceeded drinking water standards during four of six site visits (figure 24)
Yellowstone Lake Limnology Understanding basic limnology of Yellowstone Lake proshymotes cutthroat trout conservation by enhancing the effishyciency of the lake trout suppression program Monthly washyter temperature dissolved oxygen specific conductance and turbidity measurements were recorded at seven sites from
June to October in 2012 and 2013 (figure 1) Surface water chemical characteristics were consistent throughout the lake except for the Southeast Arm The upper Yellowstone Rivshyer enters the southern tip of the Southeast Arm and delivers sediments from the upper portions of the watershed during snowmelt As a result this area of the lake tends to exhibshyit higher turbidity and lower specific conductance during spring runoff
Water temperature affects the distribution and movement patterns of fish in Yellowstone Lake From 2012 to 2014 23 water temperature loggers were deployed in the West Thumb
N a t i v e F i s h C o n s e r v a t i o n P r o g r a m | 4 3
Figure 24 Yellowstone River at Corwin Springs total arsenic concentrations (blue) compared to drinking water stanshydards (red) for 2012-2013
portion of Yellowstone Lake to document change in water temperature throughout the summer The depth of these loggers ranged from the surface (0 meters) to the lake botshytom (90 meters) with most loggers being deployed at 1-meshyter intervals between 0 and 20 meters Surface water temshyperatures began to warm in early to mid-July each year The thermocline (area with greatest water temperature change) continued to increase in depth with highest average surface temperatures (17-18ordmC) occurring in August (figure 25) The maximum depth of the warmer surface water extendshyed down 10-12 meters for all three years In 2012 and 2014 surface water temperatures began to gradually cool in earlySeptember with average temperatures falling below 12oC by mid-September By comparison surface water temperatures in 2013 did not begin to cool until late September which was followed by an abrupt cooling of water temperatures in earlyOctober (figure 25)
Health Assessments via Macroinvertebrate Surveys Macroinvertebrates were sampled at 23 sites in three watershysheds during 2012 four in the Shoshone eight in the Yelshylowstone and eleven in the Missouri (figure 1) The four sites in the Shoshone River watershed are part of long-term monitoring on Middle Creek where runoff from road conshystruction on Sylvan Pass resulted in the deposit of sediments in Mammoth Crystal Springs a small tributary to Middle
0
5
10
15
20
25
30
0
5
10
15
20
25
30
0
5
10
15
20
25
30 Jul Aug Sep Jul Aug Sep Jul Aug Sep
2012 2013 2014
Sample Month and Year
4 6 8 10 12 14 16 Temperature (oC)
Figure 25 Yellowstone Lake isopleths showing seasonal and annual variation in water temperature throughout the water column 2012-2014 Only upper 30 meters are shown (y-axis) for better resolution of surface water temperatures
Creek Macroinvertebrate data will be used to monitor reshycovery of the tributary
During 2013 macroinvertebrates were sampled at 11 locashytions (figure 1) Four sites were sampled within the Yellowshystone River watershed and within the Elk Creek drainage An additional seven sites were sampled within the Missouri Rivshyer watershed and included one site in the Goose Lake area two sites on Cougar Creek and four sites on Grayling Creek
4 4 | Ye l l o w s t o n e F i s h e r i e s amp A q u a t i c S c i e n c e s 2 0 1 2 - 2 0 1 4
In 2014 macroinvertebrates were sampled at 24 sites in three watersheds four in the Shoshone fifteen in the Yellowstone and five in the Missouri (figure 1) As in 2012 the four sites in the Shoshone River watershed are being monitored on Midshydle Creek to evaluate past road construction activities in that portion of the park
Sampling sites in the Yellowstone and Missouri River watershysheds were within current or proposed native fish restoration areas To assess rotenonersquos impact on stream invertebrate communities aquatic invertebrate surveys were conducted before and after rotenone application was used to remove nonnative fish from Elk Creek within the Yellowstone River drainage during 2012-2014 and from Grayling Creek within the Madison River drainage during 2013-2014 All inverteshybrate samples were sent to an independent contractor for analyses (results pending)
Amphibians in Native Fish Restoration Areas Wetlands were surveyed for presence of amphibians from 2012 to 2014 in the Elk-Yanceys-Lost Creek complex as well as a small watershed that encompasses the Goose Lake chain of lakes
Elk-Yanceys-Lost Creek Complex ndash Since amphibishyan sampling in the lower Elk Creek drainage began in 2006 48 wetlands have been sampled Twenty of these wetlands (42) were occupied by amphibians with one or more life stages (eggs larvae andor adults) present The three speshycies known to breed in this drainage include 1) boreal choshyrus frog (Pseudacris maculata) 2) blotched tiger salamander (Ambystoma tigrinum melanostictum) and 3) Columbia spotshyted frog (Rana luteiventris) During 2012 20 sites were samshypled that had previous observations of amphibians (figure 26) Breeding populations of blotched tiger salamanders and Columbia spotted frogs were observed at 10 sites (50) and adults were found at two additional sites (10) No amphibshyians were detected at the remaining eight sites (40) which were dry or contained little water None of the wetlands used for breeding sites were directly connected to Elk Creek or its tributaries therefore they were not treated with piscicides during native fish restoration activities in 2012-2014
In 2013 fewer breeding populations of blotched tiger salashymanders and Columbia spotted frogs were observed at the same 20 sites sampled in 2012 Breeding populations ofblotched tiger salamanders were observed at seven of the sites (35) and Columbia spotted frogs were observed at two sites (10) Adults of these two species were found at two additional sites (10) Boreal chorus frogs were found at two sites (10) Ten sites (50) were dry and one site contained little surface water to maintain an environment adequate for amphibian larvae In 2014 breeding populashytions of amphibians occurred at 14 of the 20 sites Breedshying populations of blotched tiger salamanders were found at 11 sites (55) Columbia spotted frogs were found at four sites (20) and boreal chorus frogs were found at two sites (10) No amphibians were detected at the remaining six sites (30)
Goose Lake Chain of Lakes ndash In 2011 the Goose Lake chain of lakes was treated with rotenone to remove nonnative rainbow trout At the time of treatment Goose and Goose-neck lakes contained larval blotched tiger salamanders After treatment 157 larval salamanders were found dead along the shoreline In Yellowstone larval salamanders may overwinshyter two or more years before transforming into adults (Koch and Peterson 1995) Juvenile Columbia spotted frogs were found in the small headwater lake and Gooseneck Lake They all appeared healthy and not affected by the treatment In July 2012 three lakes were sampled for the presence ofamphibians Larval blotched tiger salamanders were found only in Goose Lake while Columbia spotted frog tadpoles were found in all three lakes Previous survey years never reshyvealed a breeding population of Columbia spotted frogs in Goose Lake Because rainbow trout are known to prey on amphibians removal of these fish from Goose Lake most likely contributed to the survival and increased abundance of Columbia spotted frogs
In July 2013 and 2014 the three lakes were sampled again for the presence of amphibians Larval blotched tiger salashymanders were only found in Gooseneck Lake and the small headwater lake while adult salamanders were only found in Gooseneck Lake (2013) In 2013 adult Columbia spotted frogs were found in Goose and Gooseneck lakes but were not observed in the small headwater lake In 2014 adult Coshylumbia spotted frogs were observed in all three lakes
Figure 26 Amphibian monitoring sites in the Elk Creek drainage
Ye llowston e R
i v e r
Elk Creek FallsE lk C r e e k
E l k C r e e k
Yancey Creek Yancey Cr
Fish Barrier
Lost Creek Falls
Tower Junction
Dry Reach
Mammoth
L o s t Cr
Breeding in 2014 Breeding in 2012 and 2014 Breeding in 2013 and 2014 Breeding in 2012-2014 Fish Barrier Detox Station Streams in Project Area Lost Creek Dry Reach Streams Roads Wetlands
0 105 km
0 105 mile
N a t i v e F i s h C o n s e r v a t i o n P r o g r a m | 4 5
Amphibians Not Observed Breeding in 2012
Breeding in 2013
Salmon fly over the Yellowstone River - NPS Photo
4 6 | Ye l l o w s t o n e F i s h e r i e s amp A q u a t i c S c i e n c e s 2 0 1 2 - 2 0 1 4
Yellowstone cutthroat trout ready for release - Photo copyMike Canetta
N a t i v e F i s h C o n s e r v a t i o n P r o g r a m | 4 7
Public InvolvementVolunteer Angler Report Card Trends Angling remains a popular pastime for those visiting living near or working in Yellowstone National Park There were 42870 fishing permits issued in 2012 (34 million visitors toshytal) 42259 permits issued in 2013 (32 million visitors total) and 42831 permits issued in 2014 (35 million visitors total) Fishing permits which are required for fishing in park washyters were accompanied by a volunteer angler report card to provide anglers an opportunity to share their fishing success and opinions with park managers
The general fishing season in Yellowstone National Park opens on Memorial Day weekend and lasts until early Noshyvember In 2014 an estimated 41435 anglers spent an estishymated 169739 days fishing caught 399808 fish and released 95 of captured fish The estimated total number of days anglers spent fishing has decreased in recent years There are similar numbers of anglers each year but on average each anshygler is fishing fewer days in the park
Native fish (cutthroat trout Arctic grayling and mountain whitefish) comprised 49 of all fish caught in 2012 54 ofthe catch in 2013 and 62 of the catch in 2014 Cutthroat trout have remained the most sought after and caught speshycies representing 44 of all fish caught in 2012 49 ofthe catch in 2013 and 59 of the catch in 2014 (figure 27) Rainbow trout were the second most frequently caught fish
Brook trout Rainbow trout 7
Arctic grayling 1
Lake trout 9
11 Brown trout
Mountain whitefish 11 2
Cutthroat trout 59
Figure 27 Native cutthroat trout remained the most sought after and caught fish species by anglers in 2013 comprising 59 of all fish caught in the park
(11-18 of angler catch) followed by brown trout (11-12) lake trout (8-11) and brook trout (7-10)
Anglers reported the lengths of 11864 fish 54 were lonshyger than 305 millimeters (12 inches) and 39 were longer than 356 millimeters (14 inches) Lake trout had the greatest average length of 416 millimeters (16 inches) and were the most likely fish to be kept (35) The release of native fish (cutthroat trout Arctic grayling and mountain whitefish) is
Raft eletroshocking along the Madison River - NPS photo
4 8 | Ye l l o w s t o n e F i s h e r i e s amp A q u a t i c S c i e n c e s 2 0 1 2 - 2 0 1 4
required by park regulations and 999 of them were reshyported released
Anglers reported being satisfied with their overall experience (80) the numbers of fish caught (65) and the sizes of fish caught (70) These satisfaction rates are all slightly higher than rates reported in previous recent years
Fly Fishing Volunteer Program Each year during 2012-2014 between 36 and 42 volunteers contributed between 1443 and 1785 hours to the parkrsquos fisheries program Volunteer anglers focused on collecting samples for cutthroat trout genetics including the distrishybution of pure and hybridized fish in Lamar River Slough Creek and Soda Butte Creek Volunteers also collected samshyples to evaluate possible genetic factors influencing rainbow trout thermal tolerance in the Firehole River as well as the concentration of mercury in fish in several lakes As in past years the volunteers indicated their experience was positive and they were happy to contribute to Yellowstone fisheries research
Projects by Graduate Students During reporting years 2012-2014 the following graduate students assisted the park Fisheries Program with research efforts
Graduate student Tonya Chamberlain(Master of Science candidate) Committee Chair Dr Amy Krist Department of Zoology amp Physiology University of Wyoming Title An investigation of life history shifts in zooplankton in Yellowstone Lake following the introduction of lake trout Status Graduated 2013
Graduate student Kole Stewart (Master of Science candidate) Committee Chair Dr Thomas McMahon Department ofEcology Montana State University Title Using otolith microchemistry to distinguish spawning locations of Yellowstone cutthroat trout and lake trout in Yellowstone Lake Wyoming Status Field studies analyses and writing ongoing
Graduate student John Syslo(Doctor of Philosophy) Committee chair Dr Christopher Guy US Geological Surshyvey Cooperative Fisheries Research Unit Department ofEcology Montana State UniversityTitle Response of Yellowstone cutthroat trout to nonnative predator removal in the Yellowstone Lake ecosystem Yelshylowstone National Park Status Graduated 2015
Interagency Workgroups Biologists from Yellowstone National Park participate in the Yellowstone Cutthroat Trout Interstate Workgroup the Montana Cutthroat Trout Steering Committee and the Fluvial Arctic Grayling Workgroup Shared goals and obshyjectives among partner agencies and non-governmental orshyganizations are defined in a memorandum of agreement for the conservation and management of Yellowstone cutthroat trout a memorandum of understanding and conservation agreement for westslope cutthroat trout and Yellowstone cutthroat trout in Montana and a memorandum of undershystanding concerning the recovery of fluvial Arctic grayling
Yellowstone Lake Workgroup The Yellowstone Lake Workgroup consists of Trout Unlimitshyed National (Idaho Montana and Wyoming Councils) Nashytional Parks Conservation Association Greater Yellowstone Coalition Yellowstone Park Foundation and Yellowstone National Park The groups entered into a memorandum ofunderstanding in 2012 to enhance the cooperative relationshyship among the participants and to ensure that the Greater Yellowstone Ecosystem is protected maintained and manshyaged to achieve the goals established for the park Among those goals is the conservation and protection of ecosystems that ensure native coldwater fisheries will persist for the enshyjoyment of present and future generations The cooperative activities of this workgroup are currently focused on lake trout sonic telemetry studies and the development of altershynative lake trout suppression methods such as the destrucshytion of lake trout embryos on spawning areas
N a t i v e F i s h C o n s e r v a t i o n P r o g r a m | 4 9
Implanting acoustic telemetry tags in lake trout to identify breeding areas - NPS photo
5 0 | Ye l l o w s t o n e F i s h e r i e s amp A q u a t i c S c i e n c e s 2 0 1 2 - 2 0 1 4
AcknowledgmentsThe Native Fish Conservation Program is supported through Yellowstone Center for Resources base funding and a porshytion of the fees collected from anglers who purchase fishing permits During 2012-2014 additional funding was received from the following sources
bull Yellowstone Park Foundation through the Fisheries Fund Initiative Fly Fishing Volunteer Program and Nashytive Fish Conservation Program
bull Recreational Fee Demonstration Program of the Federal Lands Recreation Enhancement Act
bull Natural Resource Preservation Program of the NPS bull National Fish and Wildlife Foundation bull Park Roads and Parkways Program of the Federal Highshy
way Administration bull Greater Yellowstone Network Vital Signs Monitoring
Program of the NPS bull Greater Yellowstone Coordinating Committee and bull Trout Unlimited Greater Yellowstone Coalition and the
National Parks Conservation Association
Special thanks are extended to these organizations and prishyvate individuals that have graciously supported native fish restoration in Yellowstone National Park Special thanks to the former chief of the Yellowstone Center for Resources Dave Hallac for his contributions to fisheries conservation in Yellowstone Park staff who work on the fisheries project are noted in appendix B amp C
Administrative support for the Native Fish Conservation Program was provided by Barbara Cline Alana Darr Monshytana Lindstrom and Melissa McAdam Diane Eagleson with the Montana Institute on Ecosystems provided support for stream restoration and coordination of the Fly Fishing Volshyunteer Program This report was finalized by the Science Communications Program in the Yellowstone Center for Reshysources Special thanks to Sarah Haas Charissa Reid Karin Bergum and Christie Hendrix for their efforts with editing and designing this report
Over several years Allison Klein of the Spatial Analysis Censhyter has provided a tremendous amount of support for field operations and publications Thanks to Wendy Hafer from the Fire Cache Ben Cunningham and Wally Wines from Corshyral Operations Michael Mustafaga Lynn Webb and Dave Whaley from Lake Maintenance Brad Ross and Kim West from the South District Rangers Brian Chan from Lamar District Rangers and Michael Keator and Tara Ross from the West District Rangers
The Student Conservation Association and Montana Conshyservation Corps provided many people for the day-to-dayactivities of the program Special thanks to Travis Horton and Pat Clancey with Montana Fish Wildlife amp Parks Bruce Roberts with the US Forest Service Jim Mogen with the US Fish and Wildlife Service and Carter Kruse with Turner Enterprises Inc
The crew in the field at Grayling Creek The group was comprised of staff from Yellowstone National Park Montana Fish Wildlife amp Parks the US Forest Service the US Fish amp Wildlife Service Turner Enterprises Inc and the amazshying camp cooks
N a t i v e F i s h C o n s e r v a t i o n P r o g r a m | 5 1
Fish crew - 2012 - NPS photo
Fish crew - 2013 - NPS photo
Fish crew - 2014 - NPS photo
5 2 | Ye l l o w s t o n e F i s h e r i e s amp A q u a t i c S c i e n c e s 2 0 1 2 - 2 0 1 4
Literature CitedAlexander JD BL Kerans TM Koel and C Rasmussen 2011 Context-specific parasitism in Tubifex tubifex in geoshythermally influenced stream reaches in Yellowstone National Park Journal of the North American Benthological Society30853-867
Brown PJ CS Guy and MH Meeuwig 2014 Use of moshybile electrofishing to induce mortality in lake trout embryos in Yellowstone Lake Final report 2014 Montana Cooperashytive Fishery Research Unit Montana State University Bozeshyman Montana USA
Gresswell RE 2009 Scientific review panel evaluation ofthe National Park Service lake trout suppression program in Yellowstone Lake August 25-29 2008 Final report US Geological Survey Northern Rocky Mountain Science Censhyter Bozeman Montana USA YCR-2009-05
Gresswell RE CS Guy MJ Hansen ML Jones and PJ Martinez 2013a Lake trout suppression in Yellowstone Lake Science review team annual scientific assessment May 24 2012 Final report US Geological Survey Northern Rocky Mountain Science Center Bozeman Montana USA
Gresswell RE CS Guy MJ Hansen ML Jones JE Marsden and PJ Martinez 2013b Lake trout suppression in Yellowstone Lake Science review team annual scientific assessment May 14-15 2013 Final Report US Geologishycal Survey Northern Rocky Mountain Science Center Bozeshyman Montana USA
Koch ED and CR Peterson 1995 Amphibian and repshytiles of Yellowstone and Grand Teton National Parks Unishyversity of Utah Press Salt Lake City Utah USA
Koel TM DL Mahony KL Kinnan C Rasmussen CJ Hudson S Murcia and BL Kerans 2006 Myxobolus cereshybralis in native cutthroat trout of the Yellowstone Lake ecoshysystem Journal of Aquatic Animal Health 18157-175
Koel TM and J York 2006 Restoration of westslope cutthroat trout in the East Fork Specimen Creek watershy
shed Environmental assessment May 5 2006 National Park Service US Department of the Interior Yellowstone National Park httpparkplanningnpsgovdocument cfmparkID=111ampprojectID=13064ampdocumentID=15130
Koel TM PE Bigelow PD Doepke BD Ertel and DL Mahony 2005 Nonnative lake trout result in Yellowstone cutthroat trout decline and impacts to bears and anglers Fisheries 3010-19
Koel TM JL Arnold PE Bigelow PD Doepke BD Er-tel and ME Ruhl 2008 Yellowstone Fisheries amp Aquatic Sciences Annual Report 2007 National Park Service Yelshylowstone Center for Resources Yellowstone National Park Wyoming USA YCR-2008-02
Koel TM BL Kerans SC Barras KC Hansen and J Wood 2010a Avian piscivores as vectors for Myxobolus ceshyrebralis in the Greater Yellowstone Ecosystem Transactions of the American Fisheries Society 139976-988
Koel TM JL Arnold PE Bigelow and ME Ruhl 2010b Native fish conservation plan Environmental asshysessment December 16 2010 National Park Service US Department of the Interior Yellowstone National Park Wyoming USA httpparkplanningnpsgovdocument cfmparkID=111ampprojectID=30504ampdocumentID=37967
Koel TM JL Arnold PE Bigelow PD Doepke BD Er-tel and ME Ruhl 2012 Yellowstone Fisheries amp Aquatic Sciences Annual report 2011 National Park Service Yelshylowstone Center for Resources Yellowstone National Park Wyoming USA YCR-2012-03
Martin NV and CH Olver 1980 The lake charr Salvelishynus namaycush Pages 205-277 in EK Balon editor Charrs Salmonid fishes of the genus Salvelinus Perspectives in vershytebrate science Kluwer Boston Hingham Massachusetts USA
Miller KM ML Clark and PR Wright 2004 Water qualshyity assessment of the Yellowstone River Basin Montana and
N a t i v e F i s h C o n s e r v a t i o n P r o g r a m | 5 3
Wyoming ndash water quality of fixed sites 1999-2001 US Geoshylogical Survey Scientific Investigations Report 2004-5113
Munro A R TE McMahon and JR Ruzycki 2005 Natushyral chemical markers identify source and date of introduction of an exotic species Lake trout (Salvelinus namaycush) in Yellowstone lake Canadian Journal of Fisheries and Aquatic Sciences 6279-87
Murcia S BL Kerans E MacConnell and TM Koel 2011Correlation of environmental attributes with histopathologyof native Yellowstone cutthroat trout naturally infected with Myxobolus cerebralis Diseases of Aquatic Organisms 93225shy234
Murcia S BL Kerans TM Koel and E MacConnell 2015 Myxobolus cerebralis (Hofer) infection risk in native cutshythroat trout Oncorhynchus clarkii (Richardson) and its relashytionships to tributary environments in the Yellowstone Lake Basin Journal of Fish Diseases 38637ndash652
Reinhart DP and DJ Mattson 1990 Bear use of cutthroat trout spawning streams in Yellowstone National Park Inshyternational Conference on Bear Research and Management 8343ndash350
Reinhart DP ST Olliff and KA Gunther 1995 Managshying bears and developments on cutthroat spawning streams in Yellowstone Park Pages 161-169 in AP Curlee AM Gillesberg and D Casey editors Greater Yellowstone predshyators ecology and conservation in a changing landscape Proceedings of the 3rd biennial conference on the Greater Yellowstone Ecosystem Northern Rockies Conservation Cooperative Jackson Wyoming USA
Rotella J 2014 Estimates of lake trout abundance in Yelshylowstone Lake for 2013 from mark-recapture data Montana State University Bozeman Montana USA Unpublished data
Ruzycki JR DA Beauchamp and DL Yule 2003 Effects of introduced lake trout on native cutthroat trout in Yellowshystone Lake Ecological Applications 1323-37
Ruzycki JR 2004 Impact of lake trout introductions on cutthroat trout of selected western lakes of the continental United States Dissertation Utah State University Logan Utah USA
Syslo JM CS Guy PE Bigelow PD Doepke BD Ertel and TM Koel 2011 Response of non-native lake trout (Salvelinus namaycush) to 15 years of harvest in Yellowstone Lake Yellowstone National Park Canadian Journal of Fishshyeries and Aquatic Sciences 682132-2145
Varley JD and P Schullery 1995a Executive summary Pages 2-3 in J D Varley and P Schullery editors The Yellowshystone Lake crisis confronting a lake trout invasion A Report to the Director of the National Park Service Yellowstone Center for Resources Yellowstone National Park Wyoming USA
Varley JD and P Schullery 1995b Socioeconomic values associated with the Yellowstone Lake cutthroat trout Pages 22-27 in J D Varley and P Schullery editors The Yellowshystone Lake crisis confronting a lake trout invasion A Report to the Director of the National Park Service Yellowstone Center for Resources Yellowstone National Park Wyoming USA
Varley J D and P Schullery 1998 Yellowstone fishes Ecolshyogy history and angling in the park Stackpole Books Meshychanicsburg Pennsylvania USA
Wendy Hafer helps deliver supplies into camp with the park helicopter - NPS photo
5 4 | Ye l l o w s t o n e F i s h e r i e s amp A q u a t i c S c i e n c e s 2 0 1 2 - 2 0 1 4
AppendixAppendix A Water quality stations sampled in 2012-2013
Yellowstone River Drainage
YELL_YS6164M Yellowstone River at Fishing Bridge YELL_YS6005M Yellowstone River at Canyon YELL_YS5497M Yellowstone River at Corwin Springs YELL_SB0157M Soda Butte Creek at park boundary YELL_SB0015M Soda Butte Creek near Lamar Ranger Station YELL_LM0005M Lamar River near Tower Ranger Station YELL_GN0029M Gardner River near Gardiner Montana YELL_RC0009A Reese Creek lower diversion YELL_RC0009B Reese Creek upper discharge mainstem
YELL_YL001OM-007OM Yellowstone Lake sites 1-7 YELL_FH0018C Firehole River near Madison Junction
Madison River Drainage YELL_GB0002M Gibbon River near Madison Junction YELL_MD1332T Madison River near park boundary
Snake River Drainage YELL_SN9999M Snake River at old Flagg Ranch stream sites that appear on Montanas 303(d) list
stream sampled in 2012 only
Yellowstone cutthroat trout sampling - NPS photo
N a t i v e F i s h C o n s e r v a t i o n P r o g r a m | 5 5
Appendix B Seasonal staff in 2012-2014
Seasonal Staff 2012 Seasonal Staff 2013 Seasonal Staff 2014 Christopher Daly Benjamin Brogie Benjamin Brogie Colleen Detjens Brent Trim Cristina Dressel
Earl Drescher Carla Rothenbuecher Josh Litvinoff Jaclyn Schultz Colleen Detjens Alex Poole Jay Fleming Cynthia Nau Nathan Roueche
Kole Stewart Jacob Williams Kristopher Shultz Kyle Mosel Kole Steward Nathan Thomas
Michael Consolo Michael Consolo William Voigt Nathan Thomas Michael Polchlopek Jacob Williams Tiffany Hutton Nathan Thomas William Holden Stephen Huffman William Voigt Theresa Campbell
William Voigt
Appendix C Student Conservation Association (SCA) Interns in 2012-2014
SCA Staff 2012 SCA Staff 2013 SCA Staff 2014 Alyssa Riggs Chay Leinweber Taher Ali
Amanda Guenther Chelsey Sherwood Carl Ausprung Carly Cavutt Donald Blenkendorf Trevor Beutel Cynthia Nau Eric Raslich Shannon Boyle
Haley Carlson Joshua Litvinoff Lauren Frisbie Heath Kessi Kody Kasper Hayley Glassic
Heather Paddock Larissa Lee Drew Mac Donald Jacob Williams Levi Garrett Lauren McGarvey
Nathan McWilliams Rick Inniello Andriana Puchany Regina Thill Thomas Short Rachel Voorhorst
Zebidiah Buck Justin Walley
FOR MORE INFORMATION wwwnpsgovycr

FOR MORE INFORMATION wwwnpsgovycr