nato independent cost estimating & capability portfolio
TRANSCRIPT

1
Naval Center for Cost AnalysisBrian Flynn
DoDCAS 2008
NATO Independent Cost Estimating &
Capability Portfolio Analysis
2
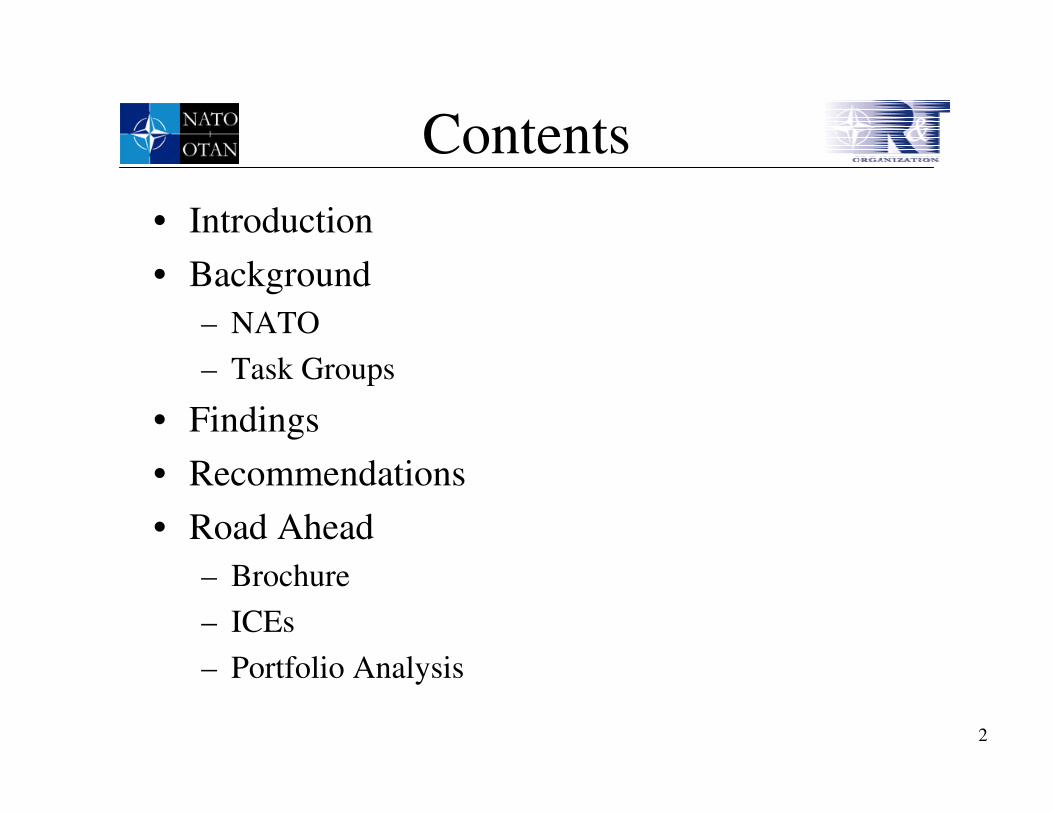
Contents
• Introduction
• Background
– NATO
– Task Groups
• Findings
• Recommendations
• Road Ahead
– Brochure
– ICEs
– Portfolio Analysis

3
Introduction
• OSD CAIG vision
– Improve cost estimating in the international
defense community
• 2004 start
• Follow-on to previous efforts
– Generic Life Cycle Cost Breakdown Structure
(GCBS)

4
NATO/OTAN
“The Parties of NATO agree that an armed attack against one or more of them … shall be considered an attack against them all.”
Organisation du Traite de l’Atlantique Nord
NATO
Members

5
NATO Membership

6
NATO Expansion
Military Highlights
• 1954 … Soviet Union tries
to join
• 1994 … first military
action; Bosnia
• 1999 … Kosovo War;
Yugoslavian leader
Slobodan Milosevic
captured
• 2003 … NATO takes
command of the
International Security
Assistance Force (ISAF) in
Afghanistan

7
NATO Research
• Task group on cost analysis created and approved
by NATO’s Research and Technology Organization
• Mission of RTO
“To support the development
and effective use of national
defence R&T and thus to
maintain a technological lead
within the Alliance;
To meet the military
needs of the Alliance;To provide advice to NATO
and national decision makers.

8
RTO Role
Ma
in A
rma
me
nt G
rou
ps
North Atlantic Council
NC3ANATO
Consultation, Command and Control Agency
MCMilitary
Committee
ACTAllied Command Transformation
ACOAllied Command
Operations
RTO
CNADConference of
National Armament Directors
ScienceCommittee
NIAG NATO Industrial Advisory Group
NAAG
NNAG
NAFAG
NURCNATO Underwater Research Center
Research and Technology Board (57)
Panel Members (373)
Scientists and Engineers (3,500)
RTA Headquarters (61)
9
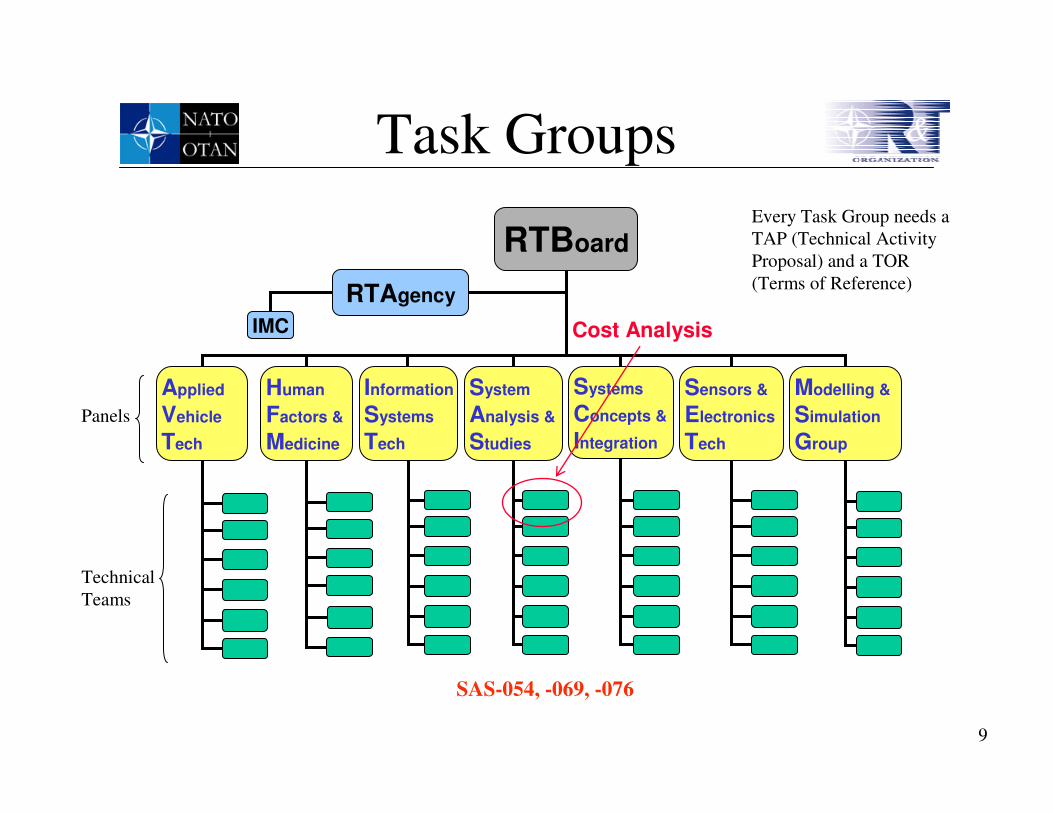
Task Groups
RTBoard
Applied
Vehicle
Tech
Human
Factors &
Medicine
Information
Systems
Tech
System
Analysis &
Studies
Systems
Concepts &
Integration
Sensors &
Electronics
Tech
Modelling &
Simulation
Group
RTAgency
IMC Cost Analysis
SAS-054, -069, -076
Panels
Technical
Teams
Every Task Group needs a
TAP (Technical Activity
Proposal) and a TOR
(Terms of Reference)

10
Cost Analysis
SAS-069; Brochure of
best practices.
Lead: Mr. Marcel Smit
Risk-Reward Bubble Diagram
Circle size = average yearly cost over the FYDP
is $0.5B/yr
Reward: Expected Military Value (EMV) (without risk)
Ris
k
BZs
Bilge Water
Watch Standing
Oysters
Low High
Low
High
SAS-076; ICEs and
Portfolio Analysis
Lead: Brian Flynn
SAS-028; Cost Breakdown
Structure for NATO
SAS-054; Methods and
Models for Life Cycle
Costing.
Lead: Mr. Marcel Smit
Overview of Process for Estimating Risk and Uncertainty
(CARD, checklists, engineering judgment, analogies, brainstorming)
Deterministic model inputs from CARD
Stochastic model inputs from CARD, data analysis, &
expert opinion
Data Collection & Analysis
For each WBS element, choose or estimate: 1. Type of probability distribution 2. Parameters of the distribution (e.g., µ, σ²) 3. Correlation with other WBS elements
µ2 - µ1 = Risk$
Baseline Cost Estimate
µ1
µ2
Risk-Adjusted Cost Estimate
Fixed Xs
Stochastic error terms
Monte Carlo Simulation
Stochastic Xs
Discreet risk events
Current
Future
2003
2004 to 2006
NATO
Cost Analysis
Improvement
AC/327 Working Group
on Life-Cycle Costs

11
SAS-054
OCCAR
• Membership
– NATO and Partnership for Peace (PfP) nations invited
– Participants
• Denmark, Germany, Norway, Switzerland (PfP), United
Kingdom, France, The Netherlands, Sweden (PfP), Turkey,
United States, OCCAR
– Observers
• Belgium, Italy, Greece, Georgia (PfP)
Organisation conjointe de coopération en matière d'armement
Manages seven
European
armaments
programs

12
SAS-054• Partnership for Peace alliance aims to create trust between NATO
and other European states and the former Soviet Union– Created in 1994
– 23 members
██ Current members of PfP
██ members that have left PfP
██ PfP members that joined NATO in 1999
██ PfP members that joined NATO in 2004

13
SAS-054
• Objectives– Understand NATO and PfP
nations’ methods and
models for cost analysis
– Promulgate best practices
within NATO’s Phased
Armaments Programming
System (PAPS)
Lead: Mr. Marcel Smit, The
Netherlands
Executive Secretary (Chief of Staff):
Mr. Arthur Griffiths, United
Kingdom

14
SAS-054• Method
– Each nation asked to map its acquisition process into PAPS
– Then, best practices in cost analysis identified for each phase
– U.S. mapping:
1 2 3 4 5 6 7 8
Mission need
evaluation phase
Pre-feasibility
phase
Feasibility
phase
Project definition
phase
Design and
Development phase
Production
phase
In-service
phase
Disposal
phase
System Develop. &
Demonstration
Production &
Deployment
Operations
& Support
Included in
O&S
PAPS PHASES in LIFE CYCLE
Concept Refinement Technology Development
Pre System Acquisition System Acquisition Sustainment

15
Findings• Data Collection
– Critical but difficult for all nations
– Availability of data often defines what
methods and models can be applied
• Methods and Models
– Standard estimation tools like OLS are
common
SECURITY CLASSIFICATION
FUNCTIONAL COST-HOUR AND PROGRESS CURVE REPORTForm Approved OMB No. 0704-0188
2. REPORT AS OF (MM/DD/YY) 3. FY FUNDED
4a. CONTRACTOR TYPE 5. DOLLARS IN 6. HOURS IN
PRIME/ASSOCIATE SUBCONTRACTOR SUBCONTRACT (Estimate by Reporting Contractor)X
4 b. NAME/ADDRESS (I nclude ZIP Code)
7a. CUSTOMER (Subcontractors Use Only) 7b. SUBCONTRACTOR (Estimated by Reporting Contractor) 8. SUBCONTRACT NO.
9. NUMBER OF REPORTING SUBCONTRACTORS 10. TYPE ACTION
CONTRACT NO. LATEST AMENDMENTX11. MULTI-YEAR CONTRACT RFP NO.
YES NO PROGRAM ESTIMATE
12. WBS ELEMENT CODE
14. COST TYPE 15. QUANTITY 16. APPROPRIATION
RECURRING TO DATE RDT&E
NONRECURRING AT COMPLETION PROCUREMENT
TOTAL
DATA ELEMENTS TO DATE AT COMPLETION TO DATE AT COMPLETION TO DATE AT COMPLETION
A B C D E F
ENGINEERING
1. DIRECT LABOR HOURS2. DIRECT LABOR DOLLARS3. OVERHEAD
4. MATERIAL5. OTHER DIRECT CHARGES (Specify)6. TOTAL ENGINEERING DOLLARS
TOOLING
7. DIRECT LABOR HOURS
8. DIRECT LABOR DOLLARS9. OVERHEAD10. MATERIAL AND PURCHASED TOOLS11. OTHER DIRECT CHARGES (Specify)
12. TOTAL TOOLING DOLLARS
QUALITY CONTROL
13. DIRECT LABOR HOURS14. DIRECT LABOR DOLLARS15. OVERHEAD16. OTHER DIRECT CHARGES (Specify)
17. TOTAL QUALITY CONTROL DOLLARS
MANUFACTURING
18. DIRECT LABOR HOURS19. DIRECT LABOR DOLLARS
20. OVERHEAD21. MATERIALS AND PURCHASED PARTS22. OTHER DIRECT CHARGES (Specify)23. TOTAL MANUFACTURING DOLLARS
OTHER COSTS
24. PURCHASED EQUIPMENT25. MATERIAL OVERHEAD26. OTHER COSTS NOT SHOWN ELSEWHERE (Specify)
SUMMARY
27. TOTAL COST (Direct and Overhead)
28. REMARKS
29a. NAME (Last, First, Middle Initial) 29b. DEPARTMENT
29e. FAX NO. (Include Area Code) 29f. SIGNATURE 29g. DATE SIGNED (MM/DD/YY)
DD FORM 1921-1, (FRONT), OCT 2003
SECURITY CLASSIFICATION
TOTALREPORTING CONTRACTORSUBCONTRACT OR OUTSIDE PRODUCTION AND SERVICES
1a. PROGRAM
13. REPORTING ELEMENT
1b. APPROVED PLAN NUMBER
POINT OF CONTACT (POC) INFORMATION
29c. TELEPHONE NO. ( Include Area Code)
29d. E-MAIL ADDRESS
The public reporting burden for this collection of informa tion is estimated to average 45 hours per response, including the time for reviewing instructions, searching existing data sources, gathering and maintaining the data needed, and completing and
reviewing the collection of information. Send comments regarding this burden estimate or any other aspect of this collection of informat ion, including suggestions reducing the burden to Department of Defense, Washington Headquarters Service, Directorate
for Information Operat ions and Reports (0704-0188), 1251 Jeffereson Davis Highway, Suite 1204, Arlington, VA 22202-4302. Respondents should be aware that notwithstanding any other provision of law, no person shall be subject to any penalty fo r failing
to comply with a collection of information if it does not display a currently valid OMB control number.
PLEASE DO NOT RETURN YOUR FORM TO THIS ADDRESS
PART I. FUNCTIONAL COST-HOUR REPORT
Models Mission Pre- Feasibility Project Design & Production In-service Disengage-need feasibility Definition Developm. ment
In-house
Commercial
In-house
Commercial
In-house
Commercial
In-house
Commercial
Decision
Support
Simulation
Calculation /
Estimating
Optimization
Legend blank No nation
1 nation
2-3 nations
>3 nations
16
Findings
• Risk and Uncertainty– Life cycle cost estimates
are widely regarded as probability distributions
• Point estimate merely one observation
– Sensitivity analysis and use of SMEs common
Cumulative Probability Distribution for Estimate
0.0
0.2
0.4
0.6
0.8
1.0
$0 $5 $10 $15 $20 $25 $30
Estimated Yearly Cost (FY08$M)
Cu
m P
rob
ab
ilit
y
M ean (@ 54% cum probability)
M ode (@ 31% cum probability)
Mission Pre- Feasibility Project Design & Production In-service Disengage-Risk need feasibility Definition Developm. ment
Expert opinion
Monte Carlo simulation
Sensitivity analysis
In-house
Commercial
In-house
Commercial
Legend blank No nation
1 nation
2-3 nations
>3 nations
Models for risk
analysis
Models for
uncertainty analysis
Methods

17
Findings
• Presentation of Results– Little standardization within
or between nations
– Essential to convey the “right” information cogently
• Exchange of Information– Significant barriers
– Difficulty in accessing each others’ websites and databases
“the basic problem,” from PARC

18
Recommendations• Life cycle cost estimates should:
– Be fully documented
– Be prepared by experienced personnel
– Include an affordability analysis
– Use cross-checks
• Life cycle cost models should:– Be validated by a recognized
testing process
• Data collection efforts should:– Focus on cost, programmatic,
technical, and performance information
• Within the entire NATO/PfP community
• To improve the accuracy, visibility, and availability of data useful to all
Cost (e.g., software development)
XCost Driver (e.g., SLOC)
Y
Expected Cost = αXβCost Modeling
Uncertainty
Historical datum
Median
Range o
f
Estim
ate
s
Input value from CARD
Y = αXβeε
Breakdown barriers on information access

19
Recommendations• Risk and uncertainty analysis
should be based on one or more
generally accepted techniques
such as
• Sensitivity analysis
• Monte Carlo simulation
• Garvey’s scenario-based
analysis
• U.K.’s risk registers
• Risk and uncertainty analysis
should start early
• With analytical justification
of values
• Don’t leave to the 11th hour
Probability Distribution for Fuel Cost Estimate
$0 $5 $10 $15 $20 $25 $30
Estimated Yearly Cost (FY08$M)
Pro
bab
ilit
y
$17.7M M ean
M ode
M edian
Parameter
Fuel Price Per gallon
OPTEMPO
Fuel Consumption Gallons per day
State 1
State 2State 3
Low Baseline (Mode) High
Develop early, with each point estimate

20
Recommendations• Conduct Monte Carlo
simulation along these
lines
– Generate a baseline
estimate that reflects
uncertainty
• “Noise” or variance
in estimating
relationships
– Then include risk
– Delta between the
means is cost risk
µ2 – µ1 = Cost Risk
For each stochastic CBS element, choose: � Type of probability distribution � Parameters of the distribution (e.g., µ, σ²) � Correlation with other CBS elements
Baseline Probability Distribution
Costs in Millions
Lik
eli
ho
od
µ1
Modeling Uncertainty
Monte Carlo Simulation
Risk-Adjusted Probability Distribution
Costs in Millions
Lik
eli
ho
od
Modeling Uncertainty
Technical Uncertainty & Risk
Monte Carlo Simulation
µ2
See work of Mr. Tim Anderson and
AFCAA’s CRUH for more details

21
Recommendations• Convey to decision makers the
essential fact that cost estimates are stochastic– List assumptions or describe
scenarios
Display a range of estimates
Low High
Estimate Estimate
585M 895M
Underlying Assumptions or Scenarios
Baseline Estimate
715M
Risk and Uncertainty Analysis Using Monte Carlo Simulation
Cost Growth Factor, Sensitivity Analysis, or Risk Register from the UK
500M 600M 700M 800M 900M
> Z month schedule
> 90% learning curve
> 20% commonality with predecesor
> Business base weak
> Accelerating inflation rate
> Y month schedule
> 85% learning curve
> 60% commonality with predecesor
> Business base solid
> Moderate inflation
> X month schedule
> 80% learning curve
> 65% commonality with predecesor
> Business base strong
> No inflation
> 40th percentile estimate using Monte
Carlo simulation
> Mean estimate using Monte Carlo
simulation
> 80th percentile estimate using Monte
Carlo simulation
> Baseline estimate > Historical cost growth factor of 25%> Low-end historical cost growth factor
of -18%

22
SAS-069
• Code of Practice for Life
Cycle Costing
– Describes best practices for
all phases of the life cycle
• Examples
• Handy booklet
– End date: Sep 2008
Lead: Mr. Marcel Smit, The
Netherlands
Executive Secretary (Chief of Staff):
Mr. Arthur Griffiths, United
Kingdom
Acquisition Cost
(R & D, Production)
TrainingCost Test & Support
EquipmentCost
Customer Service
(Personnel)Cost
Supply Support(Inventory & Distribution)
Cost
Transportation &Handling Cost
FacilitiesCost
TechnicalData Cost
Retirem
ent &
Disposa
l Cost

23
SAS-076
• NATO Independent Cost Estimating and Capability Portfolio Analysis– New effort
• Start: June 2008
• End: June 2011
– ICEs• Proof of concept for
SAS-054 guideline
– Role of cost estimating in capability portfolio analysis
Lead: The United States

24
SAS-076
• Candidate ICEs– Ex-post testing
• One or more systems where a CARD/MDAL is available
– Test against actuals
– New systems• To support decision making
A400M

25
SAS-076
• Capability portfolio analysis
– Best practices
– Two or three international
conferences
• Subject matter experts from each
nation
– E.g., Joint Staff, USD(AT&L),
SOCOM HQ in the U.S.
– Emphasis on role played by life
cycle cost analysis
“In defense planning, capability is defined as the enduring ability
to generate a desired operational outcome or effect, and is relative
to the threat, physical environment, and contributions of coalition
partners.” [Through Life Capability Management Conference,
London, 2007]
Decision Support Center, Naval War College

26
NATO Forces
• Long-term goal of NATO cost-analysis
activities
– Engender more informed resource decision
making within the Alliance to support coalition
warfighters
NATO forces in Afghanistan

27
Backup

28
SAS-076
• Examples of initial efforts in
executing capability portfolio
analysis
– NCCA’s pilot in mine warfare
– Joint staff example

29
Strategic Assets
National Reconnaissance Office - Satellites
National Geospatial-Intelligence Agency - Digital maps Defense Intelligence Agency - Human intelligence
Air Force B-52s and strike aircraft Navy P-3s
Dedicated Navy Assets Organic Navy Assets
Surface Surface
Two classes Littoral Combat Ship MCM-1 Class -- Unmanned Surface Vehicle (USV)
MHC-51 Class with influence sweep Command ship (High Speed Vessel Swift ) -- Vertical Take-off Unmanned
Systems such as SQQ-32, -32 (HFWB), Aerial Vehicle with COBRA SLQ-37, and SLQ-38 -- MH-60S (see below)
-- Remote Minehunting SystemAirborne -- NSCT-1 with SCULPIN
20 MH-53E Sea Dragons (multi-purpose) -- Systems such as
AQS-14, AQS-20, AQS-20A, AQS-24
Mk-103 to Mk-106
Undersea Airborne Explosive Ordance Disposal (EOD) MH-60S Knighthawk with
Divers -- Underwater towed array (AQS-20A) Marine mammals -- Airborne Laser Mine Detection System
-- Airborne Mine Neutralization System -- Rapid Airborne Mine Clearance System -- Organic Airborne & Surface Influence Sweep
Research and Development Program
DARPA Undersea ONR - Future Naval Capability Basic & applied research; -- UUVs; MRUUV
Naval Surface Weapons Center - Carderock and Panama City technology demonstrationCommand & Control
-- Systems such as SYQ-13 & MEDAL
Assault -- Systems such as ABV & JDAM
Very-shallow water Surf zone
Craft
Landing
ZoneShallow waterDeep water
Depth regimes
Threat Types
Rising
Mines
Bottom, moored,
and rising mines
Bottom, moored,
controlled, and buried
mines
Anit-invasion,
controlled, and
buried mines
Same as
surf zone
plus land
mines
300 feet
40 feet
10 feet
MCM Portfolio

30
Design of Scoring
• Strategy-to-systems model for MCM assets
Operational to Strategic Tasks
Tactical to Operational Tasks
Systems to Tactical Tasks
Weightings
Weightings
Weightings
Tied to National Defense Strategy and
Presidential Directives
Identification
and Ranking
of Strategic
Tasks
-- Effectiveness
-- Risk

31
Value of Systems
1.8 In S&T
In Acquisition
Operational
1.6
1.4
1.2
1
0.8
0.6
0.4
0.2
0.2 0.4 0.6 0.8 1 1.2 1.4 1.6 1.8
Ris
k
Estimated Military Value Low High
Low
High
Reference
= $100M
418
9
11
2
2
18 60
80
9
49
Numbers shown are
sample ROIs
ROI = Military Value/Cost
Each bubble captures
development and
procurement costs over the
FYDP + ten years’ O&S
cost (in FY06$)
Note: ROI is shown only for
systems with complete cost data
Detection, Localization, Classification, and Identification of Sea Mines
Expected Military Value

32
Concept Decision: (To-Be)
Portfolio Analysis
Strategic Choiceof Portfolio Options with
Requirements, Acquisition, &Programming Stakeholders
Represented

33
Notional Example
• Next two slides were briefed to DEPSECDEF, Vice
Chairman JCS, and other members of the DAWG
• Based on required capabilities to support a notional MCO
or stability operation
Unclassified, hypothetical scoring

34
Notional ExampleExample Capabilities: Operational Plan Assessment (What & How Much)
X
X
X
Sufficiency
Gap
Overage

35
Notional Example
Example Implementation / Execution: Who and
How (Tasks & Activities) Solution Trades
� Exploring the solution space:
� Evaluate On-Hand Capability
� Evaluate alternatives to fill gap:
o Increase current capability-buy more airframes
o Substitute alternatives
o Change DOT_LPF
o Accept Risk
� Present decision makers with options in terms of risk and resources
� Execute a decision Air Force
Air Force
Air Force
Air Force
Navy
Capability Provider
InventoryTactical Aircraft
414F-16
38F-22A
138F-15E
197F-15A/B/C/D
558F/A-18E/F
Air Force
Air Force
Air Force
Air Force
Navy
Capability Provider
InventoryTactical Aircraft
414F-16
38F-22A
138F-15E
197F-15A/B/C/D
558F/A-18E/F
(Notional Example addressing a Joint Air Operations, Tactical Air Gap )