natural england research report nerr034
TRANSCRIPT

Natural England Research Report NERR034
An evidence base for setting nutrient targets to protect river habitat
www.naturalengland.org.uk


Natural England Research Report NERR034
An evidence base for setting nutrient targets to protect
river habitat
C P Mainstone
Natural England
Published on 11 November 2010
You may reproduce as many individual copies of this report as you like, provided such copies stipulate that copyright remains with Natural England, 1 East Parade,
Sheffield, S1 2ET
ISSN 1754-1956
© Natural England 2010


i An evidence base for setting nutrient targets to protect river habitat
Project details
A summary of the findings covered by this report, as well as Natural England's views on this research, can be found within Natural England Research Information Note RIN034 – An evidence base for setting nutrient targets to protect river habitat.
This report should be cited as:
MAINSTONE, C.P. 2010. An evidence base for setting nutrient targets to protect river habitat. Natural England Research Reports, Number 034. Natural England, Sheffield.
Project manager
Chris Mainstone
Evidence Team
Natural England
Northminster House
Peterborough
PE1 1UA
Acknowledgements
Thanks are due to Geoff Phillips of the Environment Agency for various discussions on the subject of nutrient targets, to Benoit Demars and Martyn Kelly for their detailed comments on early drafts and useful additional references, and to David Harper, Steve Ormerod and Mike Bowes for their views on a late draft. Thanks also to Barry Gray of Natural England Information Services for assistance with obtaining scientific papers.
I am grateful to the following publishers for their permission to use tables and figures from their journals free of charge:
NRC Research Press (Figures 12, 15, 16 and 17), Canadian Journal of Fisheries and Aquatic Science);
North American Benthological Society (Figures 13 and 14), Journal of the Society of the North American Benthological Society;
John Wiley and Sons (Figures 1 and 19), Ecology Letters and Freshwater Biology;
Elsevier (Figure 4 and 18), Science of the Total Environment and Water Research; and
Ecological Society of America (Figure 3), Ecology.

ii Natural England Research Report NERR034
Contents 1 Background 1
2 Eutrophication impacts in rivers 2
3 Ecological factors in rivers relevant to eutrophication 3
Introduction 3
Current velocity/scour 3
Light intensity 4
Temperature 4
Nutrient availability 5
Grazing pressure 8
Closing remarks 10
4 Characterising ecological change along the nutrient pressure gradient 11
Conceptual models 11
Confounding effects of other anthropogenic stressors 12
5 Characterising the influence of climate change 13
6 Key quantitative evidence for nutrient thresholds in the literature 14
Preamble 14
Evidence description 14
7 Analysis of UK datasets under the Water Framework Directive 28
Background 28
Benthic diatoms and phosphorus availability 29
Defining reference conditions 29
Characterising community change as a function of TDI score 29
Characterising relationships between biological classification metrics and the SRP gradient 32
Submerged macrophytes and phosphorus availability 33
Defining reference conditions 33
Characterising community change as a function of RMNI 33
Characterising relationships between RMNI metrics and the SRP gradient 33
Site-specific predictions using multiple regression models 35
8 Consideration of reference/background nutrient status 37
9 Consideration of river-related habitats 40
10 Key messages from the evidence 41
From the general literature 41
From data analyses for the Water Framework Directive 43
Data synthesis 44
11 Comments on the state of the evidence base 45
12 References 46

iii An evidence base for setting nutrient targets to protect river habitat
List of tables Table 1 River typology used in WFD analyses related to the setting of river phosphorus standards for HES and GES 28
Table 2 Estimated mean Total Phosphorus concentrations (ugl-1) that would occur in selected UK rivers at a range of possible background phosphorus export rates from the catchment 37

iv Natural England Research Report NERR034
List of figures Figure 1 Relative responses (RRx) of autotrophs to single enrichment of N or P or to combined N and P enrichment in various sub-habitats in terrestrial, freshwater and marine ecosystems 7
Figure 2 Relationship between median nitrogen:phosphorus ratios and median SRP concentration in all routinely monitored river sites across England and Wales 8
Figure 3 Periphyton biomass levels (measured as Chlorophyll a) in response to grazing pressure and nutrient enrichment in controlled experiments on a wooded stream in Tennessee 9
Figure 4 The relationship between the concentration of a limiting nutrient in a river with short-retention time and the effect on the biomass of different plant types 11
Figure 5 Relationships between Trophic Diatom Index (TDI) and associated percentage Pollution Tolerant Valves (%PTV) against SRP (mean concentration in water samples collected 2 weeks prior to biological sample), spring and autumn 2005 in English lowland study streams 15
Figure 6 Percentage of diatom cells in total periphyton cells against mean SRP for the 2005 season in English lowland study streams 15
Figure 7 Chlorophyll a biomass (with standard deviation) against mean SRP concentration for 1 month before measurement in English lowland study streams 16
Figure 8 Macroinvertebrate community stress (V-statistic) at study sites plotted against median SRP concentration in English lowland study streams 16
Figure 9 Dry weight of macroinvertebrates (2005) at study sites plotted against median SRP concentration in English lowland study streams 17
Figure 10 Margalef diversity index of benthic diatom samples against SRP in laboratory dosing experiment 18
Figure 11 Periphyton abundance (as indicated by Chlorophyll a) against against SRP concentration in laboratory dosing experiment 18
Figure 12 Effect of phosphorus availability on periphyton biomass accrual in in situ mesocosms on the River Frome, Dorset 19
Figure 13 Linear response surface of maximum benthic chlorophyll a concentration as a function of soluble reactive phosphorus (SRP) concentration and days of algal biomass accrual (dt) 20
Figure 14 Effect of hydraulic scour frequency and nutrient concentrations on periphyton biomass accrual in New Zealand streams and rivers 21
Figure 15 Growth curves fitted for stream sites classified as high-, moderate- and low- nutrient status following a catastrophic flood in autumn 1986 22
Figure 16 Regression of periphyton chlorophyll a as a function of Total Phosphorus in study rivers in eastern Canada 22
Figure 17 Regression of Cladophora biomass as a function of Total Phosphorus concentration in study rivers in eastern Canada 23
Figure 18 Mean summer (June-September) benthic chlorophyll a for the Clark Fork River and seasonal mean data for other sites throughout the world as a function of a) Dissolved Inorganic Nitrogen (DIN), b) Soluble Reactive Phosphorus (SRP), c) Total Nitrogen and d) Total Phosphorus 24
Figure 19 Relationships between macroinvertebrate-based classification of Ecological Status and indicators of organic and nutrient enrichment (in mgl-1) in Irish rivers and streams 27
Figure 20 Relationships between the relative abundance of nutrient-sensitive (open circles) and nutrient-tolerant (closed circles) benthic diatom taxa and Trophic Diatom Index EQR at all stream sites in the DARES database 30

v An evidence base for setting nutrient targets to protect river habitat
Figure 21 Relationships between the relative abundance of nutrient-sensitive (open circles) and nutrient-tolerant (closed circles) benthic diatom taxa and Trophic Diatom Index EQI at stream sites in different WFD river types 31
Figure 22 Relationship between Trophic Diatom Index EQI and annual mean SRP concentrations at stream sites in different WFD river types 32
Figure 23 Conceptual framework used by the environmental agencies to evaluate effects on the macrophyte community associated with changes in RMNI score 34
Figure 24 Global relationship between RMNI score and (a) annual mean log SRP and b) log TON concentrations at sites in the LEAFPACS database 35
Figure 25 Historical trends in Total Oxidised Nitrogen (TON) and Orthophosphate (Soluble Reactive Phosphorus) in the lower Hampshire Avon 39
Figure 26 Synthesis of reported biological changes in streams along a quantified gradient of nutrient availability 44


1 An evidence base for setting nutrient targets to protect river habitat
1 Background
1.1 This document has been produced to underpin decisions about defining appropriate environmental targets to control adverse effects of enrichment by the major plant nutrients (phosphorus and nitrogen) on the characteristic flora and fauna of UK rivers. Whilst its primary aim is to underpin the review of UK Common Standards guidance on setting conservation objectives for rivers with special wildlife designations for their river habitat, the evidence contained within it is also relevant to the control of river eutrophication under the Water Framework Directive, Urban Waste Water Treatment Directive and the UK Biodiversity Action Plan. A supplementary paper is being finalised with proposals for how this evidence base should be used to refine existing environmental targets in UK Common Standards guidance.
1.2 This paper focuses on the effects of enrichment on in-channel habitats and their flora and fauna. Nutrient enrichment of rivers affects a range of other water and wetland habitats that are hydrologically connected to the river, including riparian areas, on-line and off-line lakes, ditch systems, and stillwaters and wetlands on the floodplain. Enrichment of these habitats are separate research areas that are not possible to cover in this paper, but notes on these other habitats are made at the end of the paper. It is important to note that SSSI designations for river habitat include riparian habitats and adjacent floodplain wetlands that are hydrologically dependent on the river, so these considerations are directly relevant to Common Standards guidance on SSSI river habitat.
1.3 This is an evidence base specifically designed to characterise the effects of nutrient enrichment on the integrity of river habitats. This focus does not imply that nutrients are the only significant anthropogenic problem for riverine wildlife. A range of stresses have to be tackled to secure the ecological integrity of river habitats (Mainstone and Clarke 2008), and this evidence base should be seen as a contribution to this wider work.

2 Natural England Research Report NERR034
2 Eutrophication impacts in rivers
2.1 The key biodiversity concerns associated with nutrient enrichment in rivers are listed below:
Changes in the composition and increased abundance/biomass of the algal community, both attached (periphyton) and planktonic.
Changes in the composition and increased abundance/biomass of the rooted macrophyte community, with a reduction in extent of species adapted to conditions of lower nutrient availability.
A choking of river channels with submerged higher plants and algae, with high nocturnal respiration rates and diurnal sags in dissolved oxygen in the water column.
Loss of macrophyte abundance associated with algal smothering of riverbed substrates, attracting enhanced siltation and causing poor substrate conditions for benthic invertebrates and fish species with a requirement for coarse open sediments with high interstitial dissolved oxygen concentrations.
Changes in macroinvertebrate and fish community abundance and composition associated with changes in the plant community.
2.2 The most direct (primary) effects of nutrient enrichment relate to the plant community, through which a range of indirect (secondary) impacts on fauna occur. Impacts on the plant community can be seen as a mixture of direct and indirect impacts: direct effects of nutrient availability on growth rates; and indirect effects of increased competition from plant species favoured by enrichment.
2.3 An important complication is that some eutrophication symptoms (particularly high algal biomass) can arise out of certain environmental conditions without apparent obvious nutrient enrichment. Separating out the role of nutrient enrichment from natural environmental factors, and indeed other anthropogenic factors, is a major challenge for this evidence review.
2.4 In addition to the impacts on biodiversity, eutrophication generates a range of major socioeconomic impacts, relating to drinking water quality and associated treatment costs, flood risk management, recreation and amenity (Pretty et al. 2003). These concerns are not dealt with in this paper.

3 An evidence base for setting nutrient targets to protect river habitat
3 Ecological factors in rivers relevant to eutrophication
Introduction
3.1 The processes by which anthropogenic nutrient enrichment results in adverse effects on the biological communities of rivers are highly complex, with effects on the competitive balance between plant species, consequent effects on the fauna dependent on the plant community for food, shelter and reproduction, and the influence of biological feedback mechanisms and a range of environmental factors (some themselves anthropogenically influenced) on the manifestation of key eutrophication symptoms.
3.2 The plant community is fundamentally shaped by the natural characteristics of the river, which is driven by factors such as catchment and site geology. Key factors are the nature of the flow regime (flashy, stable etc,), substrate types, alkalinity and pH, all of which are highly inter-related. Demars and Thiebaut (2008) have recently re-emphasised the primacy of these fundamental characteristics in shaping the composition of the submerged macrophyte community in rivers, with factors such as anthropogenic nutrient enrichment playing a modifying role on top of this basic framework.
3.3 In swifter-flowing rivers, the algal community is dominated by attached algae (periphyton, including epilithic and epiphytic components), whilst in lowland, sluggish river sections the phytoplankton community can play a more important role due to longer hydraulic residence times. Biggs (1996) developed a conceptual model for longitudinal succession in riverine plant communities: those with the highest hydraulic energies and lowest bed stabilities tend to be dominated by periphyton, growing opportunistically between scouring events; at lower hydraulic energies, bryophytes and liverworts are able to establish and dominate; at lower energies still, rooted macrophytes can colonise and dominate.
3.4 Hilton et al. (2006) suggest that transit times (i.e. the time for water to travel down from upstream reaches to a given river section) of the order of more than around 4-6 days are likely to support algal communities dominated by planktonic forms of algae, since the maximum doubling time of algae is of the order of two days (thus allowing for 2 or 3 doublings in abundance). Whilst major inputs of phytoplankton inocula from linked standing waters can alter the picture on a river (Neal et al. 2006), river sections with transit times above this cut-off are likely to be amenable to modelling by lake eutrophication models. Algal communities of river sections receiving water of less than this cut-off are likely to be dominated by periphytic algal forms and require a different conceptual model of eutrophication processes. Within the short-retention time category, rivers may be characterised by high or low hydraulic energy regimes.
3.5 The state of the plant community (rooted plants and algae) in a river at any one point in time is dictated not only by the basic environmental character of the river but by the recent history of environmental conditions, key determinants being current velocity/scour, light intensity, temperature, nutrient availability and grazing pressure. Rivers are highly dynamic environments, so the state of the plant community can vary on short timescales, particularly driven by the rapid response of the algal community to changing environmental conditions.
Current velocity/scour
3.6 The severity of hydraulic scouring forces is a major determinant of plant community composition. Scouring events wash out periphyton biomass (Biggs and Close 1989, Lohman et al. 1992), as well as bryophytes and rooted plants if sufficiently strong (Riis and Biggs 2003), and act to ‘reset’ the plant community. The status of the plant community can thus be very different depending on

4 Natural England Research Report NERR034
whether it is observed before or after such an event, and the ‘typical’ condition of the community is heavily dictated by the magnitude and frequency of such events. This led Biggs and Close to conclude that periphyton data in gravel-bed rivers should not be interpreted without reference to the recent flow history of the site. This conclusion appears to hold even for gravel-bed rivers with relatively low hydraulic energy such as chalkstreams (Wade et al. 2002).
3.7 At lower current velocities, plant growth rates can increase with increasing velocity due to the enhancement of nutrient uptake (Borchardt 1996), as long as nutrient concentrations are at a level that limits growth and current velocities are not so high as to induce mechanical stress on the plant (Madsen 1993). This effect has led to a popular belief that nutrient concentrations are unimportant in flowing waters, since nutrient supply is continually refreshed from upstream. An important distinction can be drawn between the rate of biomass production (growth rate) and the amount of biomass produced (yield); growth rate is driven by the supply rate of the limiting nutrient, but yield is driven by the total amount of nutrients available (Borchardt ibid.). In streams, flowing water provides a never-ending supply of nutrients and therefore potentially limitless yield, but nutrient concentration dictates the rate of growth and therefore the speed of biomass accumulation. In reality, yield in streams is constrained not by nutrient supply but by other factors, such as high flow events scouring out accumulated biomass. The enhancement of plant growth rates with increasing water velocity appears to be related to a reduction in the extent of nutrient depletion at the plant cell surface.
Light intensity
3.8 Species composition shifts under different light regimes as a consequence of species-specific adaptations to different light levels (see McIntyre and Phinney 1965 for periphyton adaptation). Light intensity can be affected by both external shading (tree cover and herbaceous marginal vegetation) and internal shading (epiphytic growth). The more important role of light intensity than nutrient availability in algal growth rates found by Schiller (2007) led to the suggestion that increasing external shading through riparian management should be seen as an important mitigation against eutrophication. This is particularly pertinent as increased riparian shading is seen more widely as a climate change adaptation measure for counteracting rising water temperatures. However, such measures need to be viewed in the biodiversity context of needing to conserve both light and shade-adapted components of the plant community and their associated fauna.
3.9 Other findings suggest that increasing shading may not be particularly effective as an indirect method of controlling eutrophication symptoms. Some species adapted to take advantage of high nutrient levels are also shade-tolerant (for example, Liess et al. 2009), as a competitive response to increased growth of other species. Some algal species can even take advantage of organic forms of carbon in the water column and switch to heterotrophic production, avoiding the need for light as long as sufficient organic carbon is present (DeNicola 1996). Rosemond et al. (2000) observed seasonality in the importance of light intensity as a growth-limiting factor, with light limitation in summer and autumn but not in spring, when deciduous riparian trees are leafless. This suggests that tree-shading would not in any case be operating as a mitigation measure at some critical times of the year. Lastly, relying on external shading as a eutrophication control measure would do nothing for enriched downstream or floodplain habitats fed by the river, such as ponds, lakes, ditch systems and wet grasslands.
Temperature
3.10 The effects of temperature on plant growth rates do not follow a simple pattern. Seasonal increases in temperature increase rates of photosynthesis, but the net effect on growth rate is strongly dependent on light intensities (Welch et al. 2004). Under low light intensities, increased photosynthesis from higher temperatures is offset by higher respiration rates and the net effect can be a drop in growth rates (DeNicola 1996).
5 An evidence base for setting nutrient targets to protect river habitat
Nutrient availability
3.11 Plants require a wide range of macro- and micro-nutrients for growth. Of these, the greatest demand is for nitrogen, phosphorus and carbon (macro-nutrients) as the primary building blocks of plant tissue. Carbon is naturally sourced, via photosynthesis, from dissolved carbon dioxide and (in calcareous waters) bicarbonate, derived from the atmosphere, soil (rock-weathering and soil respiration) and local (in-river) biological respiration. Carbon influences on aquatic plant growth tend to be seen as being driven by natural variation in carbon availability, and have not therefore been a focus of research into anthropogenically induced freshwater eutrophication. The research focus has been on nitrogen and phosphorus, although a range of other nutrients (such as silicon, potassium and trace elements) can also play a role.
3.12 Nutrient availability is typically seen as a secondary ‘modifier’ of plant community composition and biomass in rivers, with its effects constrained by the primary driving forces of hydraulic energy, light intensity and temperature. The response of plant species to increased nutrient availability is dictated by the form of nutrients available and the species-specific growth response to the nutrient gradient. Some plant species are adapted to very low nutrient concentrations, with highly efficient mechanisms of nutrient uptake allowing rapid cycling; other species are inefficient in their utilisation of nutrients and do not attain maximum growth rates until very high nutrient concentrations. Community composition changes as nutrient availability increases, as a result of competitive interactions between species. Depending on which species are dominant, community growth rates and standing biomass change along the nutrient gradient, subject to constraints (either permanent or temporary) imposed by other environmental factors.
3.13 The form and timing of available nutrients is highly influential. Rooted plants derive the majority of their supply from the sediment, although some species are able to make use of both sediment and water column sources (Barko and Smart 1986, Rattray et al. 1991). Algal species secure most of their supply from the water column, although some epiphytes are able to exploit nutrients in exudates released by their host plants, and benthic algae will be influenced by interstitial concentrations in surficial sediment layers. The organic biofilms that coat rocks, sediments and rooted plants in river channels, and within which benthic and epiphytic algae reside, contains a polysaccharide matrix that can uptake and retain nutrients (Freeman and Lock 1995, Battin et al. 2003), In mature biofilms, this can maintain high algal growth rates even when water column nutrient concentrations are low.
3.14 Some algal species can tap into chemical nutrient forms not accessible to other species: for instance, some algal species adapted to oligotrophic conditions can assimilate organic phosphorus forms (Gibson and Whittle 1987), which are not detectable by standard chemical monitoring of soluble phosphorus. Some diatom species are even able to tap into organic pools of carbon without the need for photosynthesis (heterotrophic, as opposed to autotrophic, production), as an adaptation to situations with low light intensity where capture of carbon through photosynthesis is difficult (Tuchman 1996).
3.15 In terms of the timing of nutrient delivery, plants cannot generally make use of highly episodic nutrient pulses, unless they are retained in the river system in some way (for example, via the sediment). However, many plant species are able to hoard nutrients during times of ample supply, through’ luxury uptake’. This process can generate intracellular phosphorus concentrations of between 5 and 50 times higher than needed to support maximum growth (Cembella 1984), which is then available to support cell divisions if and when external concentrations become limiting. Overall, average water column concentrations, particularly in the main growing season (or more specifically the few weeks prior to observation), tend to drive the response of the algal community. The ‘growing season’ can be very variable, with different authors taking different views that are sometimes driven by climatic differences between study areas but also by arbitrary judgements.
3.16 Published studies have come to different conclusions about whether soluble nutrients are better determinants of biological responses that total nutrients. Whilst many studies find better

6 Natural England Research Report NERR034
relationships between soluble phosphorus and biological response (for example, Harper 2009), others have found better relationships with total nutrient concentrations (for example, Dodds et al. 1997, Chetalat et al. 1999). This is partly a function of river type – in sluggish rivers with relatively long residence times, SRP concentrations can greatly under-estimate P flux into the plant community due to high uptake rates. At least in sluggish rivers, it is important to consider total nutrients. Edwards et al. (2000) suggest that the relative importance of nutrient concentrations and nutrient load is highly site-specific and likely to vary with season and the nutrient in question.
3.17 The relative influence of phosphorus and nitrogen in freshwater eutrophication processes is a continuing topic of scientific debate (Smith and Schindler 2009). Many regression models of field survey data seem to suggest a subordinate role for nitrogen relative to phosphorus in rivers (for example, Chetalat et al. 1999, Demars and Thiebaut 2008, Harper 2009), although others suggest the reverse (for example, Dodds et al. 1997) – strong intercorrelations between phosphorus and nitrogen availability confound the picture. The two nutrients may also be important in different ways: for instance, in studies of a Canadian river subject to reduced nutrient loadings from sewage effluents, Sosiak (2002) attributed reductions in periphytic biomass to reduced phosphorus availability but reductions in macrophyte biomass to reduced nitrogen availability. Francoeur (2001) points out that each plant species has different nutrient requirements, and in real plant communities different species may be limited by different nutrients.
3.18 Experimental studies that manipulate the availability of both nutrients, preferably in real systems, offer greatest potential to clarify the respective roles of nitrogen and phosphorus. Rosemond et al. (1993) found that enrichment with either nutrient had less effect on algal biomass accrual than enrichment with both in a nutrient-poor woodland stream, suggesting co-limitation of plant growth in this instance. Dodds et al. (1997) undertook experimental nitrogen and phosphorus additions in Montana streams and rivers, together with analysis of intracellular nutrient concentrations, and concluded that there was considerable nitrogen limitation at many sites, particularly in headwaters. A gradual shift in limitation from nitrogen to phosphorus with increasing distance from source seems plausible, but even in these headwaters Dodds et al. found co-limitation at certain times.
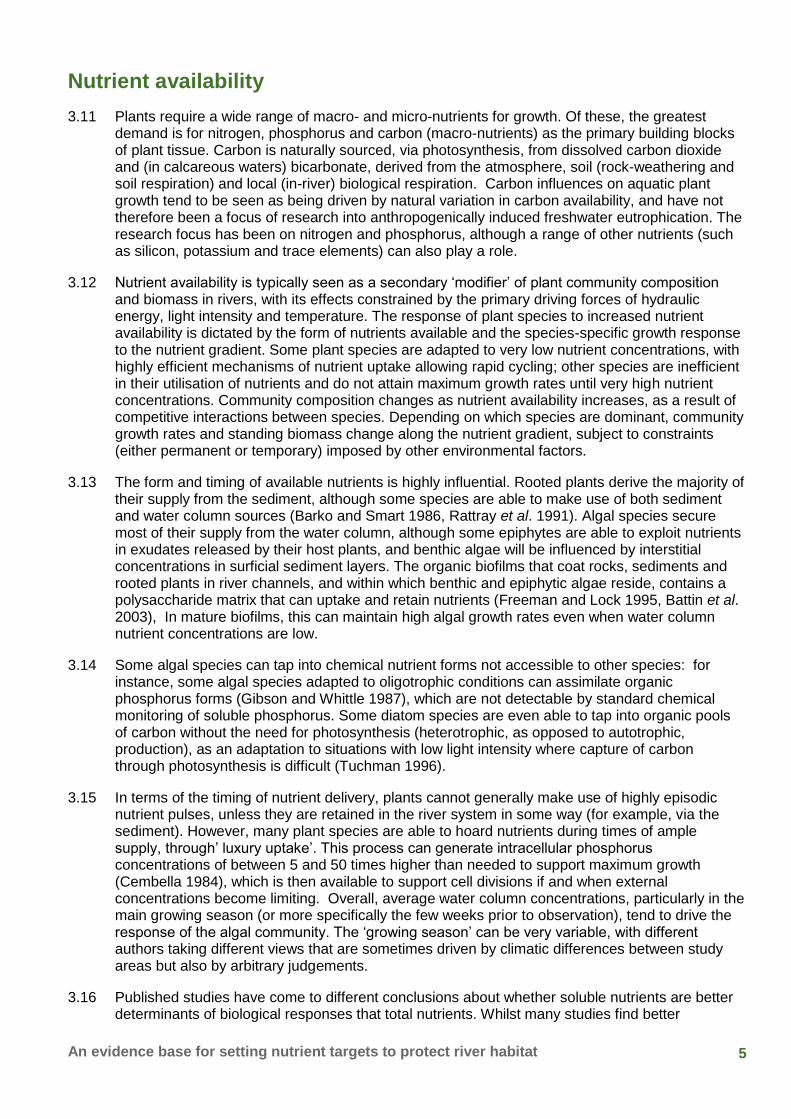
3.19 The findings of Rosemond et al. (ibid.) are reflected in a large metadata analysis of experimental studies of nutrient limitation across freshwater, marine and terrestrial environments by Elser et al. (2007), who found that plant community biomass responses to enrichment by N and P separately were similar across key types of freshwater habitat (including streams), but that the response to combined enrichment was much greater (Figure 1). This general pattern was also consistent across marine and terrestrial ecosystems. In another meta-analysis, this time only of experiments on rivers, Francoeur (2001) found that addition of a single nutrient (either N or P) typically doubled algal biomass, and addition of both simultaneously increased biomass appreciably further (approximately 1.25 fold).
7 An evidence base for setting nutrient targets to protect river habitat
From Elser et al. 2007
Figure 1 Relative responses (RRx) of autotrophs to single enrichment of N or P or to combined N and P enrichment in various sub-habitats in terrestrial, freshwater and marine ecosystems
3.20 Whether either nutrient is limiting in any one situation is dependent on absolute concentrations (the lower the concentration, the higher the likelihood of growth limitation), and the relative roles of nitrogen and phosphorus is governed by their relative availability (N:P ratios - higher ratios make P limitation more likely, lower ratios make N limitation more likely). The N:P ratio of an enriched river is not particularly relevant – the natural or reference N:P ratio characterises the intrinsic nutrient limitation of the river, whilst the predicted N:P ratio under different possible control scenarios characterises possible operationally induced nutrient limitation.
3.21 Figure 2 plots median water column N:P ratios for hundreds of sites in England and Wales, spanning a wide range of nutrient concentrations and river types. Although this is a coarse analysis and cannot reflect the real complexities of nutrient availability (for example, Edwards et al. 2000), it does suggests that, under conditions of low nutrient enrichment, it is phosphorus that is most likely to be limiting plant growth, and that the focus on phosphorus in controlling river eutrophication makes pragmatic sense. There are layers of mechanistic complexity that lay beneath this (for example, seasonal periods of limitation), and it seems likely that the role of nitrogen also differs substantially between river types in ways that are currently not clearly understood. The work of Elser et al. (2007) suggests that the worst effects of river eutrophication might be avoided by controlling phosphorus alone, but full control of adverse effects may require control of both nutrients, at least in some situations. A more detailed evaluation of the respective roles of these nutrients is required to shed further light on this issue.

8 Natural England Research Report NERR034
0
1
10
100
1000
10000
0.00 0.01 0.10 1.00 10.00 100.00
Median SRP concentration (mgl-1)
Med
ian
N:P
rat
io
Below limit of detection
N:P ratio = 8
SRP = 0.05 mgl-1
SRP = 0.3 mgl-1
TIN = 0.4 mgl-1
TIN = 2.4 mgl-1
1 2
3
54
Zone 1 - P likely to be limiting
Zone 2 - P may be limiting for part of the growing season
Zone 3 - Neither N or P likely to be limiting
Zone 4 - N likely to be limiting
Zone 5 - N may be limiting for part of the growing season
From Mainstone and Parr (2002)
Figure 2 Relationship between median nitrogen:phosphorus ratios and median SRP concentration in all routinely monitored river sites across England and Wales
3.22 Some authors have argued that many of the effects on freshwater plant communities that have been attributed to phosphorus and nitrogen enrichment are actually due to variations in carbon availability (for example, Demars and Thiebaut 2008). Natural carbon availability is lower in freshwaters than in terrestrial systems, and enhanced growth of rooted aquatic plants has been observed through experimental increases in dissolved carbon dioxide in a range of species (for example, Vadstrup and Madsen 1995, Karaha and Vermatt 2003). Species that dominate the higher plant communities of calcareous (high alkalinity) waters have an adaptation that allows them to utilise bicarbonate as well as carbon dioxide, which gives them a strong competitive advantage. This means that macrophyte community composition is strongly influenced by alkalinity – since alkalinity tends to be strongly correlated with nitrogen and phosphorus in analyses of data involving many sites with wide-ranging environmental conditions, there is considerable potential for misinterpretation of the results of such studies (Demars and Edwards 2009).
3.23 Recent research has attempted to disentangle the effects of alkalinity and phosphorus/nitrogen enrichment on macrophyte standing crop in lowland rivers in England and southern Scotland (O’Hare et al. In Press). This work has identified positive and independent effects of both alkalinity and phosphorus enrichment, with biomass reaching higher levels at higher phosphorus concentrations for any given alkalinity.
Grazing pressure
3.24 Field studies show that the effect of grazing, chiefly by invertebrates, on algal standing biomass in rivers can be considerable. Studies reviewed by Welch et al. (2004) demonstrate grazers holding periphyton to between 5 and 50% of ungrazed biomass. This activity can exert a heavy top-down control on plant biomass and mask enhanced plant growth rates resulting from nutrient enrichment or other environmental changes. Recent studies by Dang et al. (2009) demonstrated

9 An evidence base for setting nutrient targets to protect river habitat
this in Irish lowland streams, where increased algal biomass (measured by Chlorophyll-a) resulting from seasonal increases in phosphorus was rapidly reduced by increased abundance of specific grazers such as Baetidae. This resulted in a poor relationship between water column phosphorus concentrations and algal biomass, with the observable eutrophication effect transferring from algal standing crop to the abundance and composition of the grazer community.
3.25 In factorial experiments on stream mesocosms, Rosemond et al. (2000) observed considerable periphyton biomass and productivity responses to elevated nutrients and light in all seasons in the absence of grazers (in this case gastropods), but low periphyton standing biomass was maintained with grazers present. Grazer abundance, however, increased in the autumn in response to enhanced algal biomass arising from nutrient additions, as found later by Dang. Rosemond et al. (1993) reported increased periphyton biomass in response to combined nitrogen and phosphorus additions to a wooded stream even with grazer pressure, but considerably greater biomass accrual without grazers present (Figure 3).
From Rosemond et al. 1993
Figure 3 Periphyton biomass levels (measured as Chlorophyll a) in response to grazing pressure and nutrient enrichment in controlled experiments on a wooded stream in Tennessee
3.26 Grazers exert a differential effect on different parts of the algal community. In experimental manipulations, Rosemond et al. (1993) found that that algal species grazed most intensively by herbivores were the ones that showed the greatest response to nutrient enrichment, suggesting a trade-off for at least some species between resistance to herbivory and nutrient-based saturation of growth rates.
3.27 This biological feedback mechanism controlling algal biomass can be disrupted by impacts on the grazing community. Biggs et al. (2000) observed that the influence of the invertebrate grazing population on algal biomass was strongly related to the nature and status of the fish community, which can predate grazers to an extent that greatly suppresses grazing pressure. Impacts may be a result of natural factors or unrelated anthropogenic impacts such as toxic pollution, low flows, siltation or heavy stocking with invertebrate-feeding fish species. Welch et al. (2004) suggest that protection and enhancement of the grazing population should be a major mitigation measure against eutrophication in rivers, similar to biomanipulation concepts in lake eutrophication management.

10 Natural England Research Report NERR034
3.28 One way of conceptualising the role of grazers is to see them as an increasingly important mechanism for controlling gross eutrophication effects on the plant community (particularly high standing biomass of algae) as nutrient availability increases, but to see the system becoming increasingly vulnerable to effects on their well-being. The river might be seen as being ‘sensitised’ to eutrophication impacts and less resilient in the face of other environmental changes. There are parallels here with the mechanisms conferring stability to macrophyte-based domination in lake systems (Scheffer et al. 1992).
Closing remarks
3.29 The composition and standing biomass of the plant community is a result of the site-specific combination of a range of complex environmental influences, and it is therefore not surprising that the published literature is full of studies that come to different conclusions about the importance of different factors, depending on the factors considered, the river types and sites selected, the temporal resolution of observations, the level of experimental control, and the analytical resolution of the biological response.
3.30 The above discussion views river eutrophication processes in a typically plant-centric way. Beyond the effects on the plant community, changes occur in the faunal community that may be just as, or even more, fundamental. Herbivory can act to suppress the effect of increased plant growth rates on plant biomass, but the invertebrate and fish communities are altered as a result of increased productivity in ways that are damaging to characteristic biodiversity. As nutrient levels increase, grazers dominate at the expense of shredders, and detritivores (such as chironomids) that feed on easily accessible algal detritus can also be favoured (Harper 2009). Concomitant shifts in the fish community can occur as certain types of feeding opportunity increase, associated with increased plant and invertebrate biomass (Connor 2009).

11 An evidence base for setting nutrient targets to protect river habitat
4 Characterising ecological change along the nutrient pressure gradient
Conceptual models
4.1 Hilton et al. (2006) have proposed a broad conceptual model of biological change along a nutrient gradient in rivers with short retention times (Figure 4). It charts putative changes in macrophyte species composition, from slow-growing, nutrient efficient species to fast-growing, nutrient inefficient species and increased overall biomass as (sediment) nutrient availability increases. Epiphytes increase in abundance as macrophyte biomass and water column nutrient concentrations increase, and at some point along the gradient the epiphytic community, often led by Cladophora, overwhelms the macrophyte community through internal shading, leading to a loss of macrophyte biomass and eventual dominance by benthic algae (again featuring Cladophora heavily).
From Hilton et al. 2006
Figure 4 The relationship between the concentration of a limiting nutrient in a river with short-retention time and the effect on the biomass of different plant types

12 Natural England Research Report NERR034
4.2 The model only considers the nutrient gradient and clearly the specifics of the biological succession will be dictated by spatial and temporal variations in nutrient availability and other key environmental influences, differing between different river types, between site-specific conditions, and also in the observed biological state at any one point in time. For instance, scour events will help to remove algal material and re-establish macrophyte dominance, and the greater the number and intensity of scour events (up to the point at which macrophytes are washed out), the greater the resilience of macrophyte domination is likely to be and the likelihood of observing a healthy macrophyte community. Higher levels of shading may reduce the likelihood of heavy algal growths, but will also constrain the expression of the macrophyte community as well. The relationship between macrophyte and epiphyte dominance will be partly determined by characteristic timelags between macrophyte and epiphyte growing seasons (Shamsudin and Sleigh 1994, 1995).
4.3 On the basis of findings described in Section 5, Harper (2009) summarises the river eutrophication process in terms of effects on algal and macroinvertebrate communities in (lowland) headwater streams. The periphyton community becomes increasingly dominated by non-diatom species (filamentous green and blue-green algae) and algal biomass increases. The macroinvertebrate community increases in total biomass and becomes increasingly dominated by fine-particle collectors at the expense of shredders that are highly characteristic of headwater streams, and this is associated with a lower rate of organic matter (leaf) decay processes as autotrophic processes increase in importance. In taxonomic terms, species from groups such as the stone-flies (the lowland examples of which are shredders) are lost, whilst groups such as chironomids benefit. The character of these changes is towards the biota characteristic of river reaches further downstream, which are more nutrient-rich and more depositional, Eutrophication can therefore be seen as inducing a shift towards more downstream biological character.
Confounding effects of other anthropogenic stressors
4.4 Eutrophication often occurs in combination with other anthropogenic stresses in rivers in a way that can be difficult to disentangle, further disrupting simple relationships between nutrient availability and biological response.
4.5 Townsend et al. (2008) attempted to characterise the combined effect of riverine eutrophication and siltation on the benthic macroinvertebrate community, looking systematically at responses to individual and in-combination stresses. Siltation effects seemed to be more pronounced in their experiments, with the response of the community being complex and related to individual species traits. Examples of both synergistic and antagonistic effects of combined stress were found.
4.6 The level of organic pollution associated with the delivery of nutrients also has a major bearing on the eutrophication response. At high levels of organic pollution, the invertebrate grazing community is impacted by low dissolved oxygen levels and high ammonia toxicity, which allows greater accrual of algal biomass. However, the microbial community also benefits from enhanced carbon availability and becomes dominant in the biofilm (Kelly et al. submitted), leading to lower algal growth rates even though phosphorus concentrations are high. Depending on intensity, organic pollution can therefore both induce eutrophication-like symptoms and suppress true eutrophication effects, with true eutrophication becoming more and more apparent as the intensity of organic pollution declines.
4.7 This relationship between organic pollution and eutrophication leads to a classic longitudinal pattern of sewage impact on rivers, with gross organic pollution effects immediately downstream of the outfall eventually giving way to eutrophication effects further downstream as the level of organic pollution declines. This is mirrored by the temporal shift from organic pollution to eutrophication symptoms in a river as organic pollution is progressively addressed through improved effluent treatment.

13 An evidence base for setting nutrient targets to protect river habitat
5 Characterising the influence of climate change
5.1 Climate change is predicted to alter environmental regimes in UK rivers considerably (for example, Walsh and Kilsby 2007, Johnson et al. 2009), with higher winter flows and lower summer flows across much of the UK, milder winters and higher summer temperatures. These changes may make winter scouring events more frequent in rivers with sufficient hydraulic energy, potentially removing algal accumulations more frequently, but will generally favour high algal growth rates and are therefore likely to increase the likelihood of eutrophication symptoms. Restoring nutrient status to growth-limiting levels is therefore a means of mitigating the adverse effects of climate change.
5.2 Climate change will also affect nutrient availability to riverine plant communities, which will have an effect on the expression of eutrophication symptoms. Nutrient loads from the catchment can be expected to be enhanced due to higher intensity rainfall events generating greater run-off energies and higher soil erosion rates. Lower summer river flows means lower levels of dilution available for effluents, meaning higher riverine nutrient concentrations even if effluent nutrient loads remain stable. These changes do not affect the ecological sensitivity of riverine communities to enhanced nutrient availability, but they do affect the degree of difficulty in achieving a given level of control over nutrient availability.

14 Natural England Research Report NERR034
6 Key quantitative evidence for nutrient thresholds in the literature
Preamble
6.1 This section attempts to outline some of the key evidence in the literature that positions eutrophication impacts in rivers along a quantified gradient of nutrient availability. Some of these studies relate to certain river types, others to multiple river types, and where possible this is made clear in the description of the findings. Most relate to heavy algal (mainly periphyton) proliferation and water column nutrient concentrations, whilst some look at secondary effects on different components of the fauna, sometimes without characterising the direct effects on the plant community. Robust evidence relating compositional changes in the rooted macrophyte community unequivocally to the nutrient pressure gradient is sparse, partly because of the added layers of complexity involved in this relationship and the failure of many studies to adequately factor out the strong infuence of other environmental factors (Demars and Harper 2005, Demars and Thiebaut 2008, Demars and Edwards 2009, Demars and Tremoliere 2009).
6.2 This is not an exhaustive review, but rather seeks to capture some of the more important findings that should be considered in making judgements about nutrient targets to protect the integrity of riverine habitats.
Evidence description
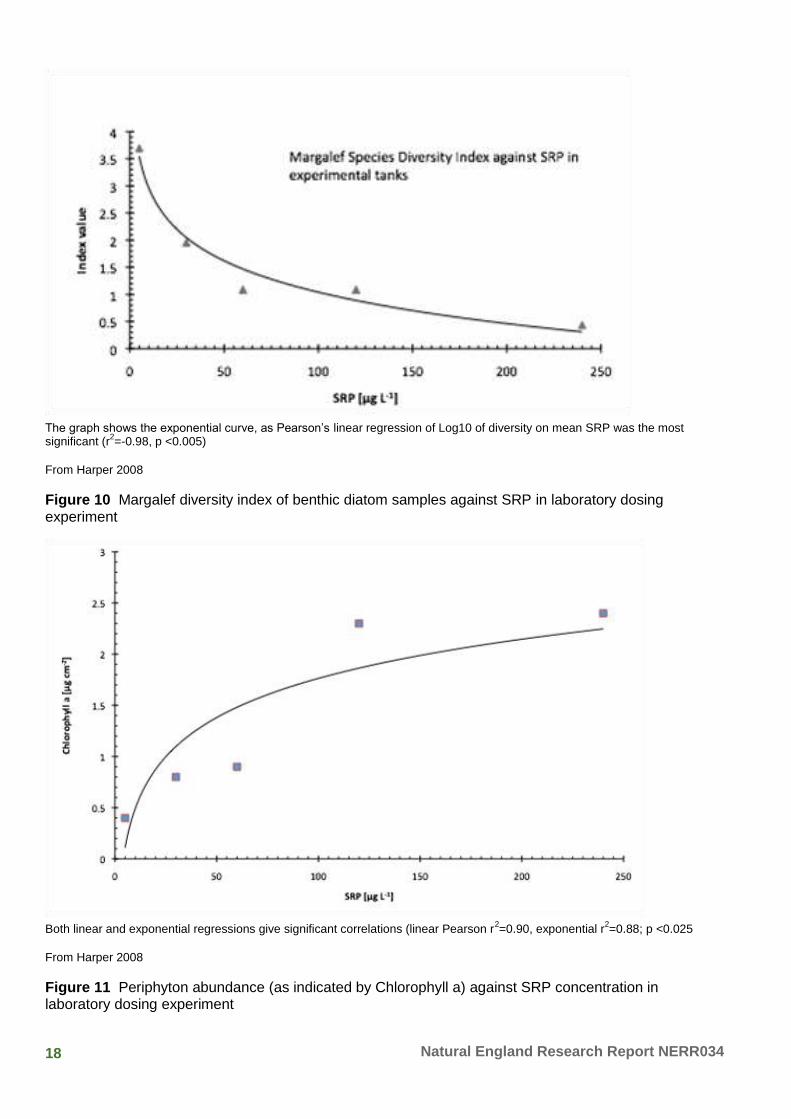
6.3 One of the most recent major studies of river eutrophication is the Defra-funded PARIS project (Adas 2009). It looked at sources, pathways and impacts, and included detailed studies and ecological experiments in headwater streams in the Herefordshire Wye, Welland and Wiltshire Avon systems (all on sites with catchments running off clayey soils). Analysis of data from sites providing a wide spectrum of water column phosphorus concentrations showed strong relationships between taxonomic diversity and biomass of periphyton and macroinvertebrate communities and indicators of phosphorus availability, with diversity declining and biomass increasing along the gradient of increasing phosphorus concentrations (Figures 5 to 9).

15 An evidence base for setting nutrient targets to protect river habitat
(TDI r
2=+0.61, p <0.005, %PTV r
2=+0.59, p <0.005)
From Harper (2008)
Figure 5 Relationships between Trophic Diatom Index (TDI) and associated percentage Pollution Tolerant Valves (%PTV) against SRP (mean concentration in water samples collected 2 weeks prior to biological sample), spring and autumn 2005 in English lowland study streams
Strongest correlation is the exponential (Pearson r
2 = -0.81, p <0.005)
From Harper (2008)
Figure 6 Percentage of diatom cells in total periphyton cells against mean SRP for the 2005 season in English lowland study streams

16 Natural England Research Report NERR034
(r2 = +0.73, p <0.005)
From Harper (2008)
Figure 7 Chlorophyll a biomass (with standard deviation) against mean SRP concentration for 1 month before measurement in English lowland study streams
Stress is evaluated by Caswell’s V statistic, which compares observed diversity against expected diversity
From Harper (2008)
Figure 8 Macroinvertebrate community stress (V-statistic) at study sites plotted against median SRP concentration in English lowland study streams

17 An evidence base for setting nutrient targets to protect river habitat
Pearson Correlation Coefficient significant at p< 0.05
From Harper (2008)
Figure 9 Dry weight of macroinvertebrates (2005) at study sites plotted against median SRP concentration in English lowland study streams
6.4 Effects on other key ecological process were also studied in the PARIS project. Community respiration rates on stones, silted leaf litter and gravels were found to increase with increasing phosphorus availability. Leaf litter decomposition, a primary mechanism for accessing nutrients in pristine and near-pristine headwaters streams, was found to decline as phosphorus availability at sites increased. This is contrary to the findings of most other studies of leaf decomposition (see later), but possibly due to pre-existing low-levels of enrichment at ‘control’ sites. A shift in functional macroinvertebrate feeding groups was observed, with shredders (mainly Gammaridae) declining largely in favour of fine particle collectors (such as Chironomidae). The lack of obvious shift in favour of scrapers that feed off algal and microbial biofilms perhaps suggests that siltation is also playing an important role.
6.5 The mechanistic role of phosphorus in these relationships was confirmed by laboratory dosing of treatments to generate a gradient of phosphorus availability whilst keeping all other variables constant (Figures 10 and 11) and field analysis of phosphatase activity in the periphyton (which indicates when algae have insufficient access to inorganic phosphorus and are forced to try and access phosphorus locked up in organic complexes). This showed reducing levels of phosphatase activity as phosphorus concentrations at study sites rose, with an indication of no inorganic phosphorus limitation at around 90ugl-1 SRP. Above these concentrations, little biological response was noted in the algal and macroinvertebrate communities, indicating no significant ecological role of phosphorus above these levels.
18 Natural England Research Report NERR034
The graph shows the exponential curve, as Pearson’s linear regression of Log10 of diversity on mean SRP was the most significant (r
2=-0.98, p <0.005)
From Harper 2008
Figure 10 Margalef diversity index of benthic diatom samples against SRP in laboratory dosing experiment
Both linear and exponential regressions give significant correlations (linear Pearson r
2=0.90, exponential r
2=0.88; p <0.025
From Harper 2008
Figure 11 Periphyton abundance (as indicated by Chlorophyll a) against SRP concentration in laboratory dosing experiment
19 An evidence base for setting nutrient targets to protect river habitat
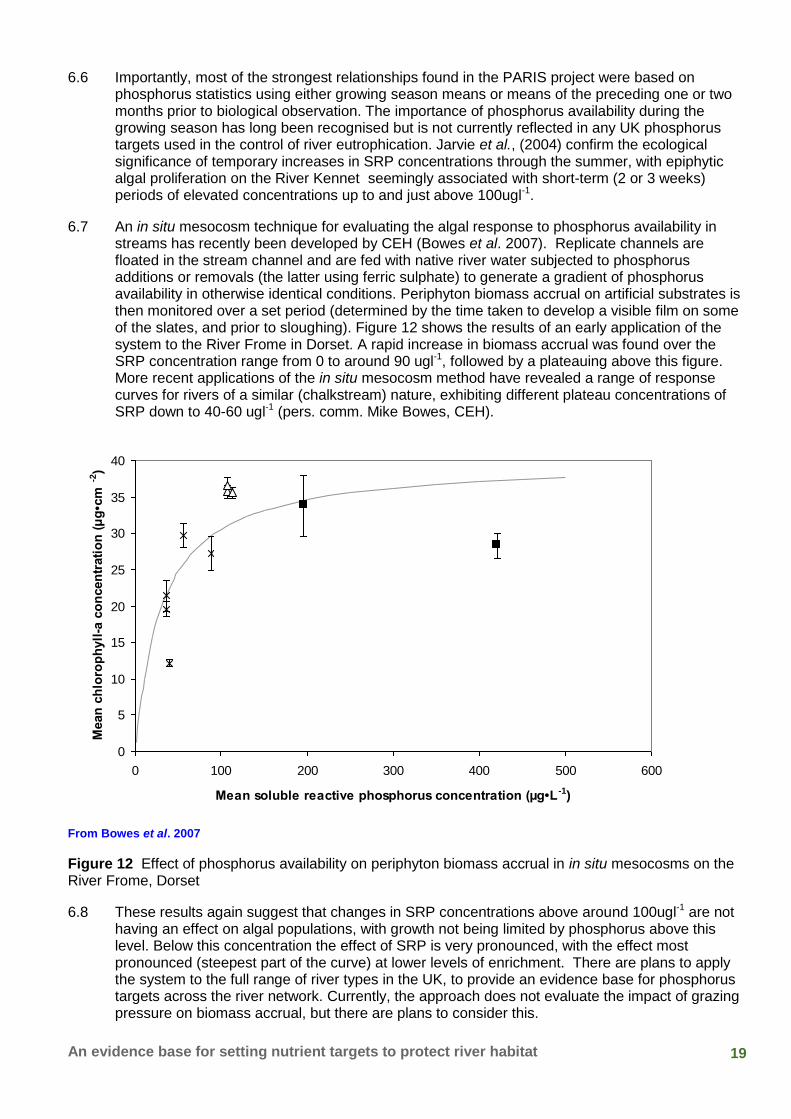
6.6 Importantly, most of the strongest relationships found in the PARIS project were based on phosphorus statistics using either growing season means or means of the preceding one or two months prior to biological observation. The importance of phosphorus availability during the growing season has long been recognised but is not currently reflected in any UK phosphorus targets used in the control of river eutrophication. Jarvie et al., (2004) confirm the ecological significance of temporary increases in SRP concentrations through the summer, with epiphytic algal proliferation on the River Kennet seemingly associated with short-term (2 or 3 weeks) periods of elevated concentrations up to and just above 100ugl-1.
6.7 An in situ mesocosm technique for evaluating the algal response to phosphorus availability in streams has recently been developed by CEH (Bowes et al. 2007). Replicate channels are floated in the stream channel and are fed with native river water subjected to phosphorus additions or removals (the latter using ferric sulphate) to generate a gradient of phosphorus availability in otherwise identical conditions. Periphyton biomass accrual on artificial substrates is then monitored over a set period (determined by the time taken to develop a visible film on some of the slates, and prior to sloughing). Figure 12 shows the results of an early application of the system to the River Frome in Dorset. A rapid increase in biomass accrual was found over the SRP concentration range from 0 to around 90 ugl-1, followed by a plateauing above this figure. More recent applications of the in situ mesocosm method have revealed a range of response curves for rivers of a similar (chalkstream) nature, exhibiting different plateau concentrations of SRP down to 40-60 ugl-1 (pers. comm. Mike Bowes, CEH).
0
5
10
15
20
25
30
35
40
0 100 200 300 400 500 600
Mean soluble reactive phosphorus concentration (µg•L-1)
Mean
ch
loro
ph
yll
-a c
on
cen
trati
on
(µ
g•c
m-2
)
From Bowes et al. 2007
Figure 12 Effect of phosphorus availability on periphyton biomass accrual in in situ mesocosms on the River Frome, Dorset
6.8 These results again suggest that changes in SRP concentrations above around 100ugl-1 are not having an effect on algal populations, with growth not being limited by phosphorus above this level. Below this concentration the effect of SRP is very pronounced, with the effect most pronounced (steepest part of the curve) at lower levels of enrichment. There are plans to apply the system to the full range of river types in the UK, to provide an evidence base for phosphorus targets across the river network. Currently, the approach does not evaluate the impact of grazing pressure on biomass accrual, but there are plans to consider this.

20 Natural England Research Report NERR034
6.9 Biggs (2000) evaluated the interaction between the frequency of significant hydraulic scouring events and nutrient enrichment on periphyton biomass accrual in New Zealand streams. He found that the periphyton could exploit ‘windows’ of opportunity between scouring events more effectively at higher nutrient concentrations, taking less time to reach a given standing biomass. Multiple regression models combining dissolved nutrient data and days of biomass accrual (i.e. the number of days since the last scour event) explained 72.1 to 74.1% of the variation in maximum Chlorophyll a levels (i.e. maximum algal biomass). Figure 13 plots the data as a linear response surface, whilst Figure 14 uses these regression models to characterise the effect of nutrient concentrations and accrual time on fixed algal biomass levels suggested by Biggs as thresholds between oligotrophy, mesotrophy and eutrophy. This work suggests that managing nutrient supply can reduce not only maximum algal biomass but also, and just as importantly, the frequency and duration of benthic algal proliferations.
From Biggs 2000
Figure 13 Linear response surface of maximum benthic chlorophyll a concentration as a function of soluble reactive phosphorus (SRP) concentration and days of algal biomass accrual (dt)

21 An evidence base for setting nutrient targets to protect river habitat
Days of accrual
Solu
ble
Inorg
anic
nitro
gen
(ugl-
1) S
olu
ble
reactiv
e p
hosphoru
s (u
gl-1
)
Algal biomass equivalent
to 200mg m-2 chlorophyll a
Algal biomass equivalent
to 100mg m-2 chlorophyll a
Days of accrual
Solu
ble
Inorg
anic
nitro
gen
(ugl-
1) S
olu
ble
reactiv
e p
hosphoru
s (u
gl-1
)
Algal biomass equivalent
to 200mg m-2 chlorophyll a
Algal biomass equivalent
to 100mg m-2 chlorophyll a
From Biggs 2000
Figure 14 Effect of hydraulic scour frequency and nutrient concentrations on periphyton biomass accrual in New Zealand streams and rivers
6.10 Similar observations have also been reported by Lohman et al. (1992), who looked at periphyton recovery following flood events in Canadian streams of different nutrient status (Figure 15). Chetalat et al. (1999) found a strong relationship between algal biomass and synoptic Total Phosphorus (Figure 16) in a dataset of sites (bedrock, unshaded sites) on rivers in eastern Canada covering a very large range of river sizes, but found no relationship with synoptic current velocity. This is perhaps not surprising, as recent flow history was not evaluated. Chetalat et al. also found similar changes in algal community composition as Harper (2009), with green algae increasingly dominating as nutrient levels increased. Within the green algae and the algal community more widely, Cladophora became the dominant species as nutrient status increased (Figure 17) with biomass showing no real sign of plateauing off at the higher end of the phosphorus concentration range studied (around 100ugl-1 SRP). Given the findings of Biggs (2000) and Lohman et al. (1992), it is likely that the relationships of Chetalat et al. could have been improved considerably by accounting for antecedent flow (and also nutrient) conditions.

22 Natural England Research Report NERR034
Points are means and standard errors
From Lohman et al. 1992
Figure 15 Growth curves fitted for stream sites classified as high-, moderate- and low- nutrient status following a catastrophic flood in autumn 1986
(r
2 = 0.56)
From Chetelat et al. 1999)
Figure 16 Regression of periphyton chlorophyll a as a function of Total Phosphorus in study rivers in eastern Canada

23 An evidence base for setting nutrient targets to protect river habitat
(r
2 = 0.53)
From Chetelat et al. 1999)
Figure 17 Regression of Cladophora biomass as a function of Total Phosphorus concentration in study rivers in eastern Canada
6.11 Dodds et al. (1997) generated regressions of periphyton biomass (as measured by Chlorophyll a) and summer mean nutrient concentrations in a large range of river and stream sites across Montana, US. Figure 18 shows relatively poor relationships between chlorophyll and soluble nutrients, but much better relationships between chlorophyll and total phosphorus or nitrogen. No account was taken of the effects of antecedent flow conditions.
24 Natural England Research Report NERR034
Filled squares are data from the Clark Fork River
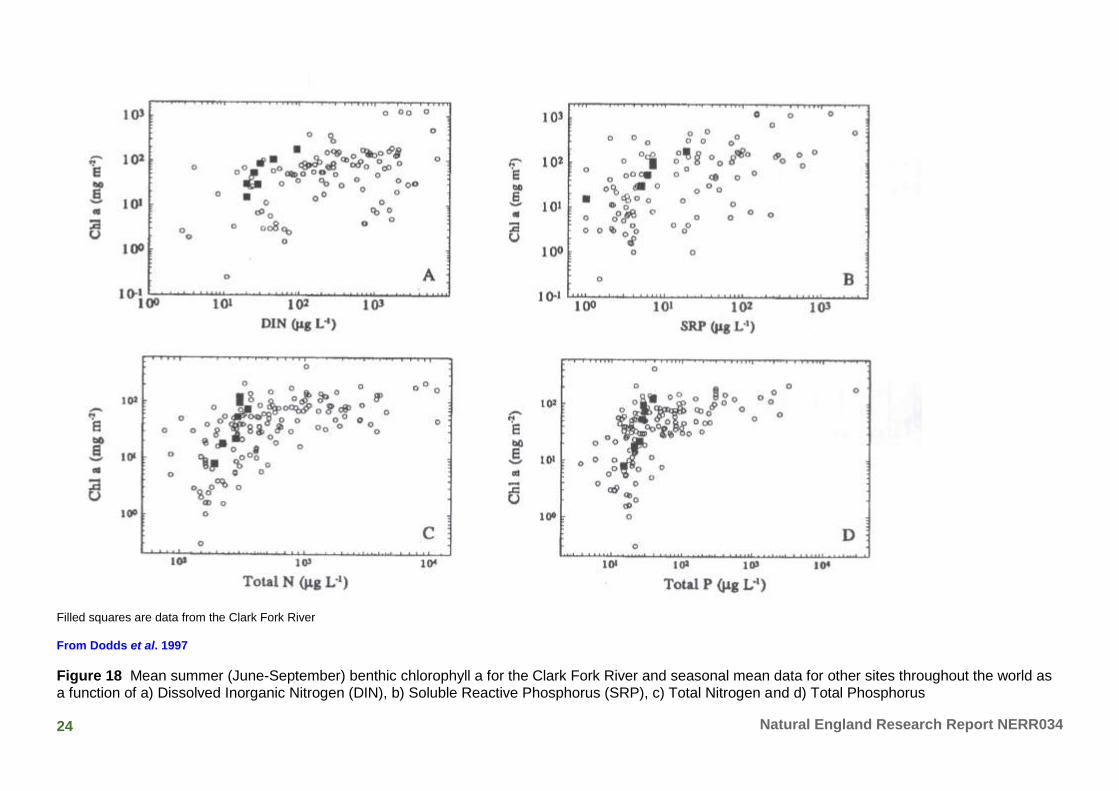
From Dodds et al. 1997
Figure 18 Mean summer (June-September) benthic chlorophyll a for the Clark Fork River and seasonal mean data for other sites throughout the world as a function of a) Dissolved Inorganic Nitrogen (DIN), b) Soluble Reactive Phosphorus (SRP), c) Total Nitrogen and d) Total Phosphorus
25 An evidence base for setting nutrient targets to protect river habitat
6.12 The similarities between the relationships found by Biggs (2000, Figure 14), Bowes et al. (2007, Figure 12), Harper (2009, Figure 7) and Dodds et al. (1997, Figure 18) are striking: in all cases, nutrient enrichment corresponds to a considerable effect on the rate of biomass accrual and the standing biomass, with the rate of change most pronounced at low levels of enrichment and plateauing off towards 100ugl-1 SRP. The work of Biggs was based on 25 natural New Zealand streams and rivers of varying size, nutrient status, and flow regime (frequency of flood events), using unshaded monitoring sites of ‘run’ type habitat. The work of Bowes was based on replicate in situ mesocosms in a chalk river, whilst the work of Harper was in a range of lowland streams in agricultural landscapes. The work of Lohman et al. also suggests a plateauing effect of biomass accrual with increasing enrichment, but at higher levels of SRP (although there was sparse coverage of the SRP gradient in this study).
6.13 There is however a reasonably strong body of experimental evidence from North America and elsewhere (Welch et al. 2004), based on semi-controlled artificial stream experiments, that indicates growth-rate saturation of resident benthic diatom floras and filamentous algae in streams at much lower SRP concentrations than 100ugl-1, down to only a few ugl-1 SRP. A number of issues may be relevant:
These artificial experiments may have simulated only a subset of river types, perhaps focusing on more naturally oligotrophic types and associated algal communities.
The experiments may have allowed true reference conditions and communities to be simulated, allowing biological changes to be detected at lower phosphorus concentrations.
The growth rate of a reference algal community is essentially saturated before significant changes in species composition occur – artificial experiments may have been too short to look at algal succession and subsequent changes in growth rate and biomass accrual.
Algal biomass accrual in a stream is a function of not only growth rate but factors associated with environmental stability and grazing pressure – these factors may have exerted a greater and more differential effect on field sites than on experimental sites in the literature.
Artificial stream experiments may be failing to simulate some other key limiting factors in real systems - differential levels of activity of heterotrophic activity, generating higher levels of competition for phosphorus in field sites than experimental sites, has been suggested as a possible factor (Welch et al. 2004).
6.14 One key factor to consider in the different results obtained is the specific growth rate response of different algal species to external phosphorus concentrations. Once increasing nutrient levels trigger shifts in species dominance, the response of the algal community to further increases becomes determined by the growth response of those newly dominant species. The half-saturation coefficient, or Ks value (the nutrient concentration at which a species achieves half its maximum growth rate) for Cladophora has been measured by experimentation as 125 ugl-1 SRP (Higgins 2005). Once dominant in the community, it can therefore potentially continue to increase its growth rate and standing biomass at very high phosphorus levels. If it has better strategies for constraining grazing than species dominant at lower phosphorus levels, it will accrue standing biomass even faster.
6.15 A range of studies have looked at the effect of nutrient enrichment on leaf litter decomposition (Gessner 2009). In pristine stream systems, the trophic structure of the biological community is strongly driven by externally derived (allochthonous) nutrients, particularly leaf litter from riparian trees, which are broken down by the fungal and microbial communities in conjunction with specialised shredders such as Gammarids and certain stonefly species. Anthropogenic enrichment tends to greatly increase leaf decomposition rates (Grattan and Suberkropp 2001, Gulis and Suberkropp 2003), with rates plateauing off at low levels of enrichment (around 20-30ugl-1 SRP and 200ugl-1 N), reducing the role of shredders and facilitating a shift towards autrotrophic processes involving primary production by algae and macrophytes.
6.16 All of the above studes are focused on the effects of nutrient enrichment on the growth of riverine algal communites. Some studies have found a biomass response of the higher plant community
26 Natural England Research Report NERR034
in rivers, although others have not. In a recent study of sites on lowland rivers in England and southern Scotland, O’Hare et al. (In Press) observed substantial increases in Ranunculus biomass over a concentration range from less than 10ugl-1 up to around 100ugl-1 watercolumn SRP. This effect was still present after the effects of alkalinity had been accounted for. The authors stress the significance of this result for flood risk management, suggesting that plant biomass and hence weed management problems should reduce as nutrient concentrations in UK rivers are progressively brought under control.
6.17 Studies of rooted macrophyte responses to nutrient enrichment are complicated by the way in which rooted plants can potentially make use of both water column and sediment nutrient pools, which is one of the reasons why different riverine studies have come to different conclusions about the importance of enrichment. Studies that control or account for confounding environmental factors (as far as possible), and look at relevant concentration ranges of nutrients in appropriate forms, are inevitably more successful. Carr and Chambers (1998) found relationships between rooted plant biomass and sediment phosphorus concentrations in sites along a nutrient gradient (40 – 350ug g-1 exchangeable phosphorus) in a Canadian stream, with biomass levels plateauing off in the range 100-200ug g-1. The role of sediment phosphorus was supported by experimental stream experiments, revealing a response in the growth of Potamogeton pectinatus over the range 40 to 950 ug g-1 exchangeable phosphorus. The difference in phosphorus concentrations corresponding to maximum growth/biomass in real and experimental situations is likely to be due to the effect of other environmental factors in limiting plant growth. Note the units used in this and many other sediment nutrient studies are not easily relatable to water column P concentrations.
6.18 Some eutrophication studies have looked directly at relationships between enrichment and secondary effects on parts of the fauna, omitting the difficulties in characterising changes in the plant community. Both invertebrate and fish populations can be affected by river eutrophication through a range of mechanisms, including oxygen starvation during nocturnal oxygen sags, changes to habitat architecture and food resources through shifts in plant community composition and abundance, and more general increases in productivity that have implications for the feeding strategies adopted by different species.
McGarrigle (2009) has looked at relationships between water quality stress gradients and biotic scores derived from routine macroinvertebrate monitoring in Irish streams and rivers (Figure 19). Highest classes of ecological status are strongly associated with lowest phosphorus and nitrate concentrations, and also lowest concentrations of organic pollution indicators (ammonia and BOD). This strong covariance confuses the picture, and the ecological mechanisms operating may be eutrophication, mild organic pollution, or a combination of both. It is not possible to determine whether other environmental factors (natural or anthropogenic) are also covariant.
Graham et al., (2009) looked at competition between Atlantic salmon and brown trout in similar natural Irish streams selected to exhibit a gradient of phosphorus concentrations. They found that salmon dominated at lower nutrient levels, with trout becoming increasingly dominant above around 30ugl-1 SRP (40ugl-1 Total P). The effect seemed to be caused by increased primary production leading to an increase in primary consumption through invertebrate grazers, which in turn reduced energy expenditure by fish on foraging. The efficient foraging strategy of salmon at lower nutrient levels is made obsolete as food resources increase with increasing nutrient status, resulting in the socially dominant brown trout out-competing salmon for territory at higher nutrient concentrations.

27 An evidence base for setting nutrient targets to protect river habitat
±1.96*Std. Err.
±1.00*Std. Err.
Mean
WFD Status (Macroinvertebrates) v ortho-Phosphate
WFD Status (Macroinvertebrates)
Mean P
hosphate
(mg/l P
)
0.00
0.05
0.10
0.15
Bad Poor Moderate Good High
±1.96*Std. Err.
±1.00*Std. Err.
Mean
WFD Status (Macroinvertebrates) v Nitrate
WFD Status (Macroinvertebrates)
Mean N
itrate
(mg/l N
) 0.0
0.5
1.0
1.5
2.0
2.5
3.0
3.5
Bad Poor Moderate Good High
±1.96*Std. Err.
±1.00*Std. Err.
Mean
WFD Status (Macroinvertebrates) v total Ammonia
WFD Status (Macroinvertebrates)
Mean to
tal A
mm
onia
(mg/l N
)
0.00
0.05
0.10
0.15
0.20
0.25
0.30
Bad Poor Moderate Good High
±1.96*Std. Err.
±1.00*Std. Err.
Mean
WFD Status (Macroinvertebrates) v BOD
WFD Status (Macroinvertebrates)
Mean B
OD
(mg/l O
2) 1.0
1.5
2.0
2.5
3.0
3.5
4.0
4.5
1 2 3 4 5
(McGarrigle 2009)
Figure 19 Relationships between macroinvertebrate-based classification of Ecological Status and indicators of organic and nutrient enrichment (in mgl-1) in Irish rivers and streams

28 Natural England Research Report NERR034
7 Analysis of UK datasets under the Water Framework Directive
Background
7.1 Biological data from rivers are collected routinely by the UK environmental agencies. Methodologies are based on selected biological groups, with metrics designed mainly to indicate taxonomic richness but also (to varying degrees) taxonomic diversity. Those used as tools to indicate river eutrophication relate to benthic diatoms (part of the periphyton) and macrophytes (including more obvious filamentous algal growths). Whilst the metrics used and the temporal and spatial resolution of observation are limited relative to some of the research datasets described in Section 5, the resulting datasets are of great potential value due to their sheer size and hence statistical power, and their ability to characterise effects on different river types in a consistent way. It is always important, however, to bear in mind their limitations in terms of detecting certain types of impact and unravelling sources of variability that can be better characterised through research-level datasets.
7.2 Analyses have been undertaken under the WFD of the datasets on the diatom and macrophyte communities and available environmental parameters in order to identify quantitative biological descriptors of Good and High Ecological Status and environmental standards that protect these. The basic data analyses are presented here, with some brief references to the policy decisions made by the UK environmental agencies relating to Good and High Ecological Status.
7.3 The WFD analysis of both the benthic diatom community and the macrophyte community follow a common series of stages, each of which is critical in the development of biological and environmental targets relating to eutrophication:
Consideration of what should be taken as the reference community (the community expected in minimally impacted conditions).
Characterisation of key changes in the biological community (relative to reference conditions) as a function of the biological metrics used for classifying ecological status.
Characterisation of the relationship between biological metrics and annual mean SRP concentrations.
7.4 The analyses have been refined over time, having evolved from the initial (diatom-based) work undertaken to derive phosphorus standards to protect HES and GES (Kelly et al. 2005, 2006). Initial analyses adopted a river typology consisting of 4 classes (Table 1). Subsequent WFD analyses and tools for deriving phosphorus standards from both diatom and macrophyte data have moved to an approach based on site-specific consideration of data. Type-based presentation of data is however still useful in presenting the information in an accessible way.
Table 1 River typology used in WFD analyses related to the setting of river phosphorus standards for HES and GES
Type 1 Site altitude <80m, alkalinity <50 mgl-1 CaCO3
Type 2 Site altitude >80m, alkalinity <50 mgl-1 CaCO3
Type 3 Site altitude <80m, alkalinity >50 mgl-1 CaCO3
Type 4 Site altitude >80m, alkalinity >50 mgl-1 CaCO3

29 An evidence base for setting nutrient targets to protect river habitat
Benthic diatoms and phosphorus availability
7.5 Analyses were based on a UK dataset of 1051 diatom samples with matching SRP data, covering a wide range of enrichment conditions in different river types. Values of the Trophic Diatom Index (TDI - Kelly et al. 2008), generated by the DARES methodology developed for the WFD, were derived for all samples. This method assigns scores to individual diatom taxa based on their sensitivity to nutrient enrichment, and the TDI is a relative abundance-weighted aggregate score for taxa occurring within a sample. TDI scores were then normalised for natural variations in environmental conditions by generating a ratio of observed score to ‘expected’ score under reference (unimpacted) conditions. Early attempts to do this were significantly affected by a lack of reference sites (see below), and were termed Environment Quality Index (EQIs) values. Later attempts included better estimation of reference conditions, and were termed Environmental Quality Ratios EQRs as defined by the WFD.
Defining reference conditions
7.6 The WFD analysis was constrained by the availability of monitoring sites in reference condition, particularly in river type 3 (low altitude, high alkalinity). Sites chosen as putative reference sites included some with moderate levels of P enrichment, whilst N enrichment was not considered. The most recent analyses (Kelly et al. 2008) have used a regression model based on putative reference sites across all river types to generate expected reference TDI values. Only alkalinity and season of sampling were found to be important in determining expected TDI. The validity of the selection of reference sites has been supported by recent analyses of historical herbarium samples (Yallop et al. In Press) from a range of sites with contemporary data. This work suggests that the predicted TDI from the regression model match those of historical (pre-World War II) diatom communities reasonably well.
7.7 The regression model was used to generate EQRs at all reference sites, and the 25th percentile of the resulting frequency distribution was taken as a pragmatic location for the biological boundary between HES and GES (on a judgement that some of the lower scoring ‘reference’ sites showed signs of enrichment and were therefore not consistent with HES).
Characterising community change as a function of TDI score
7.8 Figure 20 shows how the relative abundance of diatom taxa judged to be a) sensitive to and b) tolerant of enrichment varies at sites according to TDI EQR. For this analysis, data from different river types were pooled to produce one figure – in the original analysis, a figure was produced for each of the four river types (Figure 21, using the earlier EQI scale). In all figures, as EQR/EQI increases (indicating less deviation from the putative reference community), the relative proportion of nutrient-tolerant taxa declines and the proportion of nutrient-sensitive taxa increases.
7.9 The point on the EQR/EQI scale where reductions in the proportion of nutrient-sensitive taxa start to become noticeable in these graphs varies between river types but is in the region of values of 1.0 to 1.1. These values are well above the EQR defined in the analysis for the boundary between HES and GES. The cross-over point at which nutrient-tolerant taxa exceed nutrient-sensitive taxa, which has been used more generally in UK analyses for the WFD to set the boundary between Good and Moderate Ecological Status, again varies between river types but lies in the region of 0.7 to 0.8 – for the pooled data on EQRs, it lies at an EQR of 0.78.
7.10 Kelly et al. (2008) have attempted to characterise the changes taking place in the diatom community and wider biofilm as TDI EQRs decline. Diatom species that are fixed directly to the substrate tend to dominate at reference conditions. As EQRs decline, the depth of the biofilm increases and these directly fixed species get smothered by loosely attached species along with motile species that are able to move through the biofilm and epiphytic species that can take advantage of the increase in abundance of non-diatom filamentous algae.

30 Natural England Research Report NERR034
7.11 Unfortunately, the TDI only evaluates change in the diatom component of the algal community and wider biofilm - associated changes in the biofilm currently have to be inferred but are amenable to further research. No evaluation has been possible of absolute algal biomass, which is considered too variable in the context of operational monitoring and evaluation regimes.
Kelly et al. 2008
Figure 20 Relationships between the relative abundance of nutrient-sensitive (open circles) and nutrient-tolerant (closed circles) benthic diatom taxa and Trophic Diatom Index EQR at all stream sites in the DARES database

31 An evidence base for setting nutrient targets to protect river habitat
0.2 0.4 0.6 0.8 1.0 1.2 1.4
0
20
40
60
80
100
EQI
Type 4Type 4
0.2 0.4 0.6 0.8 1.0 1.2 1.4
0
20
40
60
80
100
EQI
Type 1Type 1
0.2 0.4 0.6 0.8 1.0 1.2 1.4
0
20
40
60
80
100
EQI
Type 2Type 2
0.2 0.4 0.6 0.8 1.0 1.2 1.4
0
20
40
60
80
100
EQI
Type 3Type 3
Kelly et al. 2006
Figure 21 Relationships between the relative abundance of nutrient-sensitive (open circles) and nutrient-tolerant (closed circles) benthic diatom taxa and Trophic Diatom Index EQI at stream sites in different WFD river types

32 Natural England Research Report NERR034
Characterising relationships between biological classification metrics and the SRP gradient
7.12 Figure 22 presents scatter plots of site data on DARES EQI and annual mean SRP concentrations in the four different river types. As might be expected from Section 4, a relatively high degree of scatter is present in the plots for all river types. Best-fit regression lines are unfortunately not available on these graphs, but using the EQI ranges highlighted in (b) above, values of 1.0 to 1.1 read across to SRP concentrations in the general range 20-50 ugl-1 depending on river type. EQI values of 0.7 to 0.8 read across to concentrations in the range 50-70 ugl-1 depending on type. Consideration of confidence limits around best-fit regression lines would increase the possible range of SRP values. There is on-going debate about the extent of influence of variations in alkalinity between sites in the relationships obtained (pers. comm. Benoit Demars).
Judgements of locations of boundaries between High/Good and Good/Moderate Ecological Status are shown as vertical lines
Kelly et al. 2005
Figure 22 Relationship between Trophic Diatom Index EQI and annual mean SRP concentrations at stream sites in different WFD river types
0.2 0.4 0.6 0.8 1.0 1.2 1.4
51
02
05
01
00
20
05
00
10
00
EQI
PO
4-P
(u
g/l)
Type 4
0.2 0.4 0.6 0.8 1.0 1.2
51
05
01
00
50
05
00
0
EQI
PO
4-P
(u
g/l)
Type 3
0.4 0.6 0.8 1.0 1.2
25
10
20
50
10
02
00
EQI
PO
4-P
(u
g/l)
Type 2
0.6 0.8 1.0 1.2 1.4
51
02
05
01
00
20
05
00
EQI
PO
4-P
(u
g/l)
Type 1

33 An evidence base for setting nutrient targets to protect river habitat
Submerged macrophytes and phosphorus availability
7.13 LEAFPACS is the UK macrophyte classification tool developed for the Water Framework Directive. It generates an index, the River Macrophyte Nutrient Index (RMNI) that is geared towards the detection of nutrient enrichment. The index is calculated by the assignment of a nutrient affinity score to a range of macrophyte taxa. A weighted average is generated for a sample, based on the occurrence and cover value of taxa founded. LEAFPACS generates a predicted reference value for the RMNI based on the RMNI scores of putative reference sites within a large database. The database (consisting of around 4000 sites) also contains data on a large number of sites at different levels of nutrient enrichment, which has been analysed to generate the nutrient affinities of each taxa. Willby and Pitt (2008) provide further information.
Defining reference conditions
7.14 As with the diatom analysis, LEAFPACS is constrained by the availability of sites in reference condition, particularly in lowland areas. This has an unknown level of impact on the predictions of reference communities.
Characterising community change as a function of RMNI
7.15 A similar exercise to that undertaken on TDI data was conducted, involving the evaluation of changes in the relative proportions of eutrophication-sensitive and eutrophication-tolerant taxa along the RMNI scale. Unfortunately, difficulties have been encountered in obtaining useful information on this analysis directly from the environmental agencies. Only a conceptual representation of the analysis (Figure 23) is available due to difficulties in identifying suitable graphs in published material. Judgements were made by the environmental agencies on the location of boundaries between High and Good, and Good and Moderate, Ecological Status on the basis of defined percentage changes in the relative proportions of the different taxon groups.
Characterising relationships between RMNI metrics and the SRP gradient
7.16 Figure 24 shows the global relationship between RMNI and both log SRP and log Total Oxidised Nitrogen (as annual means), across all sites in the database. The relationships are strong but are heavily dependent on covariance between nutrient concentrations and alkalinity (the latter essentially a product of natural catchment geology). Taken at face value, RMNI scores plateau off as SRP concentrations increase, with the rate of change in RMNI score becoming less and less significant as SRP concentrations rise above 100ugl-1. With TON, RMNI values continue to increase at the same rate as TON concentrations rise.

34 Natural England Research Report NERR034
Undisturbed Very minor distortion
Limit of slight change No undesirable disturbance
Limit of Moderate change Significantly more distorted
0
0.2
0.4
0.6
0.8
1
1.2
4 5 6 7 8 9 10
River Macrophyte Nutrient Index
rela
tiv
e c
ov
er
HT HS all T all S
pred HT pred HS all T all S
HIGH POOR BAD GOOD MOD
Key to macrophyte groups used in the analysis - HT = highly tolerant, HS = highly sensitive, T = tolerant, S = sensitive
The graph indicates the locations at which judgements have been made about boundaries between classes of WFD Ecological Status
Willby and Pitt 2008
Figure 23 Conceptual framework used by the environmental agencies to evaluate effects on the macrophyte community associated with changes in RMNI score

35 An evidence base for setting nutrient targets to protect river habitat
log TON (ug/L)
R2 = 0.648
0
1
2
3
4
5
6
7
8
9
10
1 1.5 2 2.5 3 3.5 4 4.5
log SRP (lug/L+1)
R2 = 0.5386
0
1
2
3
4
5
6
7
8
9
10
0 0.5 1 1.5 2 2.5 3 3.5 4 4.5
RM
NI
sco
re
Annual mean log SRP (ugl-1)
a)
RM
NI
sco
re
Annual mean log SRP (ugl-1)
b)
log TON (ug/L)
R2 = 0.648
0
1
2
3
4
5
6
7
8
9
10
1 1.5 2 2.5 3 3.5 4 4.5
log SRP (lug/L+1)
R2 = 0.5386
0
1
2
3
4
5
6
7
8
9
10
0 0.5 1 1.5 2 2.5 3 3.5 4 4.5
RM
NI
sco
re
Annual mean log SRP (ugl-1)
a)
RM
NI
sco
re
Annual mean log SRP (ugl-1)
b)
Willby and Pitt 2008
Figure 24 Global relationship between RMNI score and (a) annual mean log SRP and b) log TON concentrations at sites in the LEAFPACS database
Site-specific predictions using multiple regression models
7.17 Most recent analyses of these datasets under the Water Framework Directive have involved the development of multiple regression models that seek to account for the site-specific effect of altitude and alkalinity. Problems are still apparent with covariance between alkalinity and phosphorus concentrations in both the diatom and macrophyte-based analyses, arising from the naturally higher nutrient status of high alkalinity catchments but also (and probably more importantly) the higher intensity of human pressures in these catchments. Although the covariance between alkalinity and phosphorus is still evident in these regression models, they do show a residual effect of phosphorus on both diatom and macrophyte metrics that is being used

36 Natural England Research Report NERR034
to help derive refined proposals for phosphorus thresholds to support HES and GES. The regression model of environmental variables (including alkalinity) on RMNI is used to derive a frequency distribution of possible annual mean nutrient concentrations for a given site, from which judgements about appropriate nutrient targets can be made with different levels of statistical certainty.
7.18 It was hoped that, on the basis of this new work, look-up tables for phosphorus concentrations associated with different levels of RMNI and TDI EQRs at different levels of statistical confidence would be available from the environmental agencies for use in this evidence paper. However, these new analyses have not yet been reported to the Water Framework Directive UK Technical Advisory Group (WFD UK TAG) and so the data could not be released.

37 An evidence base for setting nutrient targets to protect river habitat
8 Consideration of reference/background nutrient status
8.1 Characterising how nutrient levels vary naturally between different types of river provides a useful frame of reference for setting nutrient targets to protect against adverse ecological effects. Mainstone and Parr (2002) provide indications of what (total) phosphorus concentrations might be indicative of natural and semi-pristine conditions in UK rivers of different types (Table 2).
Table 2 Estimated mean Total Phosphorus concentrations (ugl-1) that would occur in selected UK rivers at a range of possible background phosphorus export rates from the catchment
Afon Glaslyn at Beddgelert
River Tees at Middleton
River Otter at Dotton
River Nadder at Wilton
NGR SH 592478 NY 950250 SY 087885 SU 098308
Mean annual rainfall
3067 mm 1553 mm 985 mm 906 mm
Mean annual runoff
2670 mm 1167 mm 483 mm 406 mm
Catchment area 68.6 km2 242.1 km2 202.5 km2 220.6 km2
Catchment geology
Igneous Sandstone/limestone/millstone grit
Sandstone Chalk/greensand
Rate = 0.07 kg TP ha-1 yr-1
2.6 6.0 14.5 17.2
Rate = 0.1 kg TP ha-1 yr-1
3.7 8.6 20.7 24.6
Rate = 0.2 kg TP ha-1 yr-1
7.5 17.1 41.4 49.3
Adapted from Mainstone and Parr (2002)
Note: Natural export rates are generally considered to be <0.1 kg TP ha-1
yr-1 but will vary depending on the natural productivity
of the catchment. In upland catchments and lowland catchments with poor soils, lower figures are likely to apply; in lowland catchments with base-rich soils, higher figures are likely to apply. 0.2kg ha
-1 yr
-1 is likely to be higher than natural background
levels in all instances.
8.2 In upland systems, there are many examples of rivers at near-natural nutrient status with which to verify these estimates. In the published literature, Edwards et al. (2000) recorded mean soluble P concentrations of 4 to 13 ugl-1 in the Dee catchment in Scotland, with the higher values occurring in the lowest reaches of the main river (which is subject to significant enrichment). Mean values of 1ugl-1 SRP are commonly observed in upland, low alkalinity streams (pers comm. Benoit Demars) when using sensitive chemical analysis. Routine monitoring data from Sepa generate long-term annual average SRP concentrations at sites along the Findhorn, Spey, upper Don and Dee of between 3 and 15 ugl-1, with the higher values being downstream of significant effluents (pers comm. Benoit Demars). Analytical limits of detection of 20 ugl-1 assigned to routine Environment Agency analytical methods make it impossible to detect such low concentrations in England and Wales.
8.3 In lowland systems this type of verification is more difficult, since lowland rivers are widely enriched by human activity. This said, there are still some lowland headwater streams approximating to reference conditions. Moss et al. (1998) found SRP concentrations of 4 ugl-1 in a

38 Natural England Research Report NERR034
wooded lowland headwater in England, suggesting natural levels in lowland systems that are not too different in absolute terms from their upland counterparts.
8.4 Historical water quality records stretching sufficiently far back to provide a direct evaluation of the past nutrient status of enriched rivers are rare. Figure 25 shows phosphorus (as Soluble Reactive Phosphorus, commonly referred to as Orthophosphate) and nitrogen (Total Oxidised Nitrogen) data for the lower Hampshire Avon, which verify that even half a century ago phosphorus levels were far closer to the background concentrations suggested in Table 2 for a reasonably comparable lowland river (the Nadder). Note that these phosphorus figures are not directly comparable with Table 2 - the proportion of Total Phosphorus consisting of SRP varies between rivers and through the year, with higher SRP:TP ratios occurring in sewage-enriched rivers and lower ratios occurring in more natural and agriculturally-affected rivers. The Total P concentrations in Table 2 might be expected to consist of perhaps 25% SRP, whilst the historical SRP concentrations on the River Avon are more likely to represent perhaps 50% of Total P concentrations.
8.5 Considerable amounts of ‘hind-casting have been undertaken on lake systems to determine past nutrient conditions, using sediment cores and known nutrient preferences of diatom species. Such data can potentially be used to determine loads in rivers and, from river flow estimates, nutrient concentrations. Such an approach would help greatly in clarifying historical riverine nutrient concentrations.

39 An evidence base for setting nutrient targets to protect river habitat
BDWC (Bournemouth and District Water Company) archive data – monthly mean values at the water abstraction point at Knapp Mill (1955–1982); EA data (sampling frequency 1–2 times monthly) for the EA sampling point at Knapp Mill (1974–1999).
Figure 25 Historical trends in Total Oxidised Nitrogen (TON) and Orthophosphate (Soluble Reactive Phosphorus) in the lower Hampshire Avon

40 Natural England Research Report NERR034
9 Consideration of river-related habitats
9.1 Other habitats not covered by this review, including riparian areas, backwater channels, on-line and off-line lakes, inundation wetlands and open waters in the floodplain (ditches, ox-bow lakes,ponds) are dependent on river flows with ecologically acceptable nutrient levels.
9.2 Lake habitats are recognised as being highly susceptible to low-level nutrient enrichment and requiring near natural nutrient status to avoid damage to characteristic biological communities. Natural England currently sets targets for SSSI and SAC lakes at between 10 and 50 ugl-1 Total Phosphorus (annual average), dedending on lake type (Mainstone et al. 2008). Given the effect of lake residence times and SRP/TP ratios, riverine SRP concentrations of 10 – 50 ugl-1 might be needed to deliver these in-lake concentrations. Similar sensitivities apply to other types of standing water including ponds and ditches, Inundation grasslands of high floristic diversity are also susceptible to low-level enrichment (see Gowing et al. 2002 for information on the nutrient requirements of inundation grasslands).
9.3 The exact nature of the sensitivity of these floodplain aquatic and wetland habitats to nutrient delivery from the river will depend on the nature of the hydrological connectivity. Inundation grasslands only receive nutrients from the river during flood flows, with the rest of the nutrient regime of the river being of little importance. Ditch systems may receive inputs from the river during floodplain inundation but also via trickle-feeding of ditches in the summer to maintain water levels. Nutrient-flow concentration relationships can help to better characterise the significance of riverine nutrient loads/concentrations to these habitats. Nutrient targets sensitive to the whole of the natural riverine nutrient regime (Poole et al. 2004), including its seasonality and relationships with flow, are likely to be best suited to the protection not only of river habitats but also of all freshwater habitats within a catchment.

41 An evidence base for setting nutrient targets to protect river habitat
10 Key messages from the evidence
From the general literature
1) The composition of the plant community is largely determined by natural environmental characteristics, with anthropogenic nutrient enrichment being a second-order effect.
2) A large proportion of the available evidence of the effects of nutrient enrichment is based on correlative analysis, in which covariance between different stressors confounds identification of causal mechanisms.
3) Algae can proliferate to high levels under natural circumstances if conditions are conducive, but nutrient enrichment (up to a certain level) increases the ability of algal populations to exploit prevailing conditions, reaching higher biomasses more quickly.
4) Increases in the rate of algal biomass accrual appear to be most pronounced at low levels of nutrient enrichment, with rate-increases plateauing off at higher nutrient levels.
5) Both phosphorus and nitrogen play a role in river eutrophication processes, with simultaneous enrichment by both nutrients seemingly generating the greatest impact on algal production. The worst effects of river eutrophication might be avoided by controlling phosphorus alone, but full control of adverse effects may require control of both nutrients, at least in some situations.
6) The evidence for biological responses to phosphorus enrichment above concentrations of the order of 100ugl-1 SRP is limited. The reason for this seems to be associated with saturation of phosphorus uptake mechanisms in most (but not all) algae.
7) It seems likely that algal proliferation associated with enrichment above 100ugl-1 SRP is often related to an impairment of grazing intensity, due to other mechanisms of impact (for example, organic pollution, siltation) on grazer populations or issues of palatability of algal masses, and/or to the specific presence of Cladophora which has a growth response to phosphorus concentrations that allows it to take advantage of SRP levels in excess of 100 ugl-1.
8) In upland systems, organic forms of phosphorus arising from the release of dissolved organic matter from upland peat bodies are likely to be driving eutrophication effects. These forms are not amenable to detection by monitoring of Reactive Phosphorus, the standard determinand used for assessing levels of available phosphorus, and this has implications for the evaluation of phosphorus/algal response relationships involving existing routine monitoring data.
9) There seem to be far fewer studies of the effects of nutrient enrichment on the biomass of the rooted macrophyte community. This may be because research into river eutrophication has tended to focus on studies of periphyton-dominated streams (for the sake of simplicity). However, biomass responses are documented, and recent studies suggest a biomass response from Ranunculus at concentrations ranging from near-natural levels up to around 100ugl-1 in lowland systems, with the response most marked at lower concentrations and plateauing off at higher concentrations.
10) The species composition of macrophyte communities in many streams and rivers seems resilient to changes resulting from nutrient-induced enhanced epiphytic algal growth. This appears to be due to some level of seasonal separation (succession) of macrophyte and epiphyte dominance, regular sloughing of mature epiphytic layers, and scouring forces during high flow events. It follows that macrophyte communities in rivers with more frequent and

42 Natural England Research Report NERR034
stronger scouring events will be more resilient (up to the point at which macrophytes cannot survive the hydraulic regime), and reductions in the frequency of significant scouring events in a given river are likely to reduce resilience.
11) The literature suggests that nutrient enrichment brings about changes in the macroinvertebrate community associated with feeding traits.Shredders that exploit allochthonous organic material lose out to grazers and scrapers that feed off the periphyton and fine particle collectors (such as chironomids) that make use of the higher resulting levels of autochthonous organic detritus and perhaps enhanced levels of fine sediment deposition.
12) The river system becomes increasingly dependent on high levels of grazing activity to avoid algal proliferation as nutrient concentrations increase, highlighting the importance of avoiding anthropogenic impacts on grazer populations. The ecosystem can be thought of as being sensitised or destabilised by enrichment.
13) As nutrient levels increase, fish species adapted to efficient exploitation of sparse food resources seem to lose out to less well-adapted species (e.g. Atlantic Salmon loses out to Brown Trout).
14) Interactions between different trophic levels in the biological community mean that simple plant-based metrics such as standing algal biomass can show a poor relationship with phosphorus concentrations even though eutrophication effects on the community as a whole are evident (for example, through increased invertebrate grazing and associated shifts in diversity, and shifts in dominance in the fish community).
15) Short-term variations in local environmental conditions, particularly hydraulic scour, fundamentally affect the observability of key eutrophication symptoms such as increased algal biomass at any one point in time and space, and consequently weaken simple relationships between nutrient concentrations and biological responses. This argues for a probabilistic approach to evaluating and predicting eutrophication effects based on our generic understanding of eutrophication mechanisms, and against an approach based on a cursory evaluation of the condition of a site.
16) In systems that are not enriched to the point where plant growth rates are saturated, nutrient availability during the main growing season is particularly important to the response of the algal community and hence to algal-mediated secondary effects. More specifically, availability in the preceding weeks prior to algal observation is critical.
17) The published literature is patchy with respect to the specific responses to phosphorus enrichment of different river types, although further structured literature review may well reveal useful information.
18) Overall, the published literature suggests that:
phosphorus availability should be maintained as close to natural conditions as possible to avoid adverse eutrophication effects on characteristic biological communities of the river type; and
most forms of biological response are unlikely to be observed at changes in antecedent phosphorus concentrations (increases or reductions) taking place above around 100 ugl-1, and for naturally oligotrophic river types at considerably lower concentrations.
19) River typologies are limited in the extent to which they can adequately characterise natural/reference nutrient conditions. An approach to identyfing natural nutrient levels based on site-specific environmental characteristics is preferable.

43 An evidence base for setting nutrient targets to protect river habitat
20) Growth rate/biomass accrual of the algal community is more responsive to water column nutrient availability, whilst that of the higher plant community is probably most responsive to sediment nutrient availability. As water column nutrient levels decline as a result of controlling pollution sources, the differences between water column and sediment nutrient availability should decline.
21) Riverine eutrophication often occurs in combination with other anthropogenic stresses (such as siltation). These stresses can be important in the manifestation of eutrophication effects and can also confound observation of simple relationships with nutrient enrichment.
22) The response of slow-flowing lowland rivers to nutrient enrichment should be amenable to evaluation using shallow lake eutrophication models, using time-of-travel instead of lake residence time and taking account of the spatial location of phytoplankton inocula within the river network. Total Phosphorus rather than Reactive Phosphorus is likely to be more appropriate as an indicator of enrichment. Note that few rivers designated as SSSI for their river habitat fall into this category of river.
23) The predicted effects of climate change make the control of riverine nutrient levels even more critical, and the achievement of ecologically appropriate concentrations even more difficult.
From data analyses for the Water Framework Directive
1) Full characterisation of the algal community has been a problem in WFD classification tools, with filamentous algae being a major gap in the coverage of the tools. The development of an algal metric in the macrophyte tool has helped greatly in filling this gap but more holistic consideration of the algal community would be desirable as part of the future refinement of tools.
2) There are concerns about the influence of natural variations in alkalinity levels in observed relationships between diatom/macrophyte metrics and SRP. More recent analyses by the environmental agencies are addressing this.
3) Taking the results in this paper at face value, the diatom tool provides an earlier trigger of eutrophication symptoms than the macrophyte tool, as might be expected from the published literature. The range of SRP concentrations over which most changes in diatom metrics are observed is similar to the range over which most eutrophication responses from algal communities are reported in the literature, i.e. natural levels up to around 100 ugl-1 depending on river type.
4) Unsurprisingly, the statistical uncertainty associated with relationships between key biological metrics and SRP concentrations spans much of the concentration range over which most biological responses have been reported in the published literature, i.e. natural levels to around 100ugl-1. At least some of this uncertainty may be explicable with research-level datasets.
5) The statistical uncertainty in these relationships provides a useful basis for adopting different positions on the definition and application of phosphorus thresholds under different policy drivers, including special designations for wildlife, GES and HES under the Water Framework Directive, the Urban Waste Water Treatment Directive and the UK BAP. It should be possible to generate an integrated framework of thresholds covering all these purposes, based on the specific requirements of each policy driver in relation to environmental precaution and socioeconomic considerations.
6) The phosphorus values used in the WFD analyses are for annual means of SRP. How these relate to growing season means, to Total Phosphorus (in long-retention time rivers) and to

44 Natural England Research Report NERR034
organic phosphorus availability in upland rivers influenced by peatland catchments is not clear and would require further analysis.
7) Covariance between nutrient availability and alkalinity is a major hindrance to the use of large multi-site datasets in the characterisation of river eutrophication impacts. Controlled experimentation and highly selective passive survey of site networks are likely to be important in helping to separate these effects.
Data synthesis
1) Figure 26 attempts to broadly summarise the nature of biological changes along a quantified nutrient pressure gradient, using the research outlined in previous sections. It does not attempt to characterise variations in biological response between river types, which clearly need to be addressed in the setting of phosphorus targets.
Ks value = Half-saturation coefficient for growth rate.
Figure 26 Synthesis of reported biological changes in streams along a quantified gradient of nutrient availability

45 An evidence base for setting nutrient targets to protect river habitat
11 Comments on the state of the evidence base
11.1 The state of the evidence base has improved significantly in recent years, stimulated by increasing statutory requirements to control eutrophication in different parts of the world. Much of the new research has been on periphyton-dominated streams, probably due to their relative simplicity compared to macrophyte-dominated rivers. Studies of the secondary effects of eutrophication on riverine fauna are rare but there is a trend towards such research. Stream eutrophication research over the past 15 years has been dominated by other countries, particularly the US and New Zealand. The low level of research activity in this area in the UK is of great concern, particularly considering the need for quantitative information and decision support tools to direct the major drive for eutrophication control in this country.
11.2 There remains a critical need for a more strategic approach to stream eutrophication research to help rationalise the conflicting messages in the literature, and to build a more substantial evidence base for macrophyte/epiphyte-dominated systems. This needs to involve the refinement of conceptual models, rationalisation of existing quantitative data, more manipulative experimentation using stream mesocosms (preferably in situ), and the building of improved models of biological responses (in different river types and time-varying environmental conditions) for scenario testing and refining our views on nutrient targets. Some progress has been made in the area of modelling(Wade et al. 2001, 2002a, 2002b), but existing models are limited in their functionality and the extent to which they are underpinned by robust research-level datasets. As part of any future research programme, quantitative clarification of the role of nitrogen in eutrophication processes in different UK river types is needed. Experimental manipulation of both nitrogen and phosphorus levels, alone and in-combination, in real-world UK conditions would provide this.
11.3 Others have highlighted the cost of this type of research programme (Biggs 2000), and the consequent difficulties that management authorities face in supporting any initiative. Collaborative funding across Government, the research councils and industry seems the only viable solution, and the concept of a UK Cooperative Research Partnership (URL: www.fba.org.uk/index/CRP.html) is the mechanism most likely to bring this about (Battarbee et al. 2006, Freshwater LCN 2009).

46 Natural England Research Report NERR034
12 References
ADAS. 2009. Linking agricultural land use and practices with a high risk of phosphorus loss to chemical and ecological impacts in rivers (the PARIS project). Research Project Final Report (SID5) to Defra. Defra, London.
Barko, J.W., Smart, R.M. 1986. Sediment-related mechanisms of growth limitation in submersed macrophytes. Ecology, 67, 5,1328–1340.
Battarbee, R., Hildrew, A., Jenkins, A., Jones, J.I., Maberly, S., Ormerod, S., Raven, P. and Willby, N. (2006). A Review of Freshwater Ecology in the UK. Report coordinated by the FBA and CEH. FBA, Windermere. URL: www.fba.org.uk/docroot/samples/docs/Battarbee2005.pdf [Accessed November 2010].
Battin, T.J., Kaplan, L.A., Newbold, J.D., & Hansen, C.M.E. 2003. Contributions of microbial biofilms to ecosystem processes in stream mesocosms. Nature, 426, 439-442.
Biggs, B.J.F. 2000. Eutrophication of streams and rivers: dissolved nutrient –chlorophyll relationships for benthic algae. Journal of the North American Benthological Society, 19, 17-31.
Biggs B.J.F. 1996. Hydraulic habitat of plants in streams. Regulated Rivers: Research and Management, 12, 131-141.
Biggs, B.J.F. and Close, M.E. 1989. Periphyton biomass dynamics in gravel bed rivers: the relative effects of flows and nutrients. Freshwater Biology, 22, 209-231.
Biggs, B.J.F., Francoeur, S.N., Huryr, A.D., Young, R., Arbuckle, C.J. and Townsend, C.R. 2000. Trophic cascades in streams: effects of nutrient enrichment on autotrophic and consumer benthic communities under two different fish predation regimes. Canadian Journal of Fisheries and Aquatic Science, 57, 1380-94.
Borchardt. 1996. Nutrients. In: Algal ecology: freshwater benthic ecosystems. Eds. R.J. Stevenson, M.L. Bothwell, and R.L. Lowe. Academic Press, San Diego.
Bowes, M.J., Smith, J.T., Hilton, J., Sturt, M.M., Armitage, P.D. 2007. Periphyton biomass response to changing phosphorus concentrations in a nutrient-impacted river: a new methodology for phosphorus target setting. Canadian Journal of Fisheries and Aquatic Science, 64, 227–238.
Carr, G.M. and Chambers, P.A. 1998. Macrophyte growth and sediment phosphorus and nitrogen in a Canadian prairie river. Freshwater Biology, 39, 525–536.
Cembella, A.D., Antia, N.J. and Harrison P.J. 1984. The utilisation of inorganic and organic phosphorus compounds as nutrients by eukaryotic microalgae: a multidisciplinary perspective. Critical Reviews in Microbiology, 10, 317-391.
Chetelat, J., Pick, F.R., Morin, A. and Hamilton, P.B. 1999. Peripyton biomass and community composition in rivers of different nutrient status. Canadian Journal of Fisheries and Aquatic Science, 56, 560-9.
Dang, C.K., Sturt, M.M., Jansen, M.A.K. and Harrison, S. 2009. Accumulation of periphytic biomass is not directly correlated with nutrient levels in Irish streams. Paper presented at an international workshop on ‘Ecological responses of streams to nutrient enrichment’, University College Cork, February 2009. (Abstract only available).
Demars, B.O.L. and Edwards, A.C. 2009. Distribution of aquatic macrophytes in contrasting river systems: a critique of compositional-based assessment of water quality. Science of the Total Environment, 407,375-390.
Demars, B.O.L. and Tremoliere, M. 2009. Aquatic macrophytes as bioindicators of carbon dioxide in groundwater fed rivers. Science of the Total Environment, 407, 4752-4763.

47 An evidence base for setting nutrient targets to protect river habitat
Demars, B.O.L. and Thiebaut, G. 2008. Distribution of aquatic plants in the Northern Vosges rivers: implications for biomonitoring and conservation. Aquatic Conservation: Marine and Freshwater Ecosystems, 18, 619-632.
Demars, B.O.L. and Harper, D.M. 2005. Distribution of aquatic vascular plants in lowland rivers: separating the effects of local environmental conditions, longitudinal connectivity and river basin isolation. Freshwater Biology, 50, 418-437.
DeNicola, D.M. 1996. Periphyton responses to temperature at different ecological levels. In: Algal ecology: freshwater benthic ecosystems. Eds. R.J. Stevenson, M.L. Bothwell, and R.L. Lowe. Academic Press, San Diego.
Dodds, W.K., Jones, J.R., Welch, E.B. 1998. Suggested classifications of stream trophic state: distributions of temperate stream types by chlorophyll, total nitrogen and phosphorus. Water Research, 32, 1455-62.
Dodds, W.K., Smith, V.H. and Zander, B. 1997. Developing nutrient targets to control benthic chlorophyll levels in streams: a case study of the Clark Fork River. Water Research, 31, 1738-50.
Elser, J.J., Bracken, M.E.S., Cleland, E.E., Gruner, D.S., Harpole, W.S., Hillebrand, H., Ngai, J.T., Seabloom, E.W., Shurin, J.B. and Smith, J.E. 2007. Global analysis of nitrogen and phosphorus limitation of primary producers in freshwater, marine and terrestrial ecosystems. Ecology Letters,10, 1135-1142.
Francoeur, S.N. 2001. Meta-analysis of lotic nutrient amendment experiments: detecting and quantifying subtle responses. Journal of the North American Benthological Society, 20, 358-368.
Freeman, C. & Lock, M.A. 1995. The biofilm polysaccharide matrix: a buffer against changing organic substrate supply? Limnology & Oceanography, 40, 273-278.
Freshwater LCN (2009). Establishing a UK Research Framework for Freshwater Conservation. Freshwater Lead Coordination Network. Available at: URL: www.jncc.gov.uk [Accessed November 2010].
Gessner, M.O. 2009. Effects of dissolved nutrients on plant litter and decomposition: an appraisal of new and published data. Paper presented at an international workshop on ‘Ecological responses of streams to nutrient enrichment’, University College Cork, February 2009. (Abstract only available).
Gibson, M.T. and Whitton, B.A. 1987. Hairs, phosphopatatse activity and environmental chemistry in Stigeoclonium, Chaetophora and Draparnaldia (Chaetophorales). British Phycological Journal, 22, 11-22.
Gowing, D.J.G., Lawson, C.S., Youngs, E.G., Barber K.R., Rodwell, J.S., Prosser, M.V., Wallace, H.L., Mountford, J.O. and Spoor G. 2002. The water regime requirements and the response to hydrological change of grassland plant communities. Project BD1310 Report to Defra. Defra, London.
Graham, C., Harrison, S. and Giller, P. 2009. The effects of nutrient enrichment on sympatric Atlantic salmon (Salmo salar) and brown trout (Salmo trutta) in cold and wet Ireland. Paper presented at an international workshop on ‘Ecological responses of streams to nutrient enrichment’, University College Cork, February 2009. (Abstract only available).
Grattan, R.M. & Suberkropp, K. 2001. Effects of nutrient enrichment on yellow poplar leaf decomposition and fungal activity in streams. Journal of the North American Benthological Society, 20, 33-43.
Gulis, V. & Suberkropp, K. 2003. Leaf litter decomposition and microbial activity in nutrient- enriched and unaltered reaches of a headwater stream. Freshwater Biology, 48, 123-134.
Harper, D.M., Wasiak P. & Wasiak, K. 2009. Effects of phosphorus upon freshwater lotic ecosystems. Appendix 4 In: ADAS (2009) Linking agricultural land use and practices with a high risk of phosphorus loss to chemical and ecological impacts in rivers (the PARIS project). Research Project Final Report (SID5) to Defra. Defra, London.
Higgins, S.N. 2005. Modelling the growth dynamics of Cladophora in Eastern Lake Eyrie. PhD thesis, University of Waterloo, Ontario, Canada.

48 Natural England Research Report NERR034
Hilton, J., O’Hare, M., Bowes, M.J. and Jones, J.I. 2006. How green is my river? A new paradigm of eutrophication in rivers. Science of the Total Environment, 365, 66-83.
Jarvie, H.P., Neal, C and Williams, R.J. 2004. Assessing changes in phosphorus concentrations in relation to in-stream plant ecology in lowland permeable catchments: bringing ecosystem functioning into water quality monitoring. Water, Air and Soil Pollution: Focus. 00, 1-5.
Johnson, A.C., Acreman, M.C., Dunbar, M.J., Feist, S.W., Giacomello, A.M., Gozlan, R.E., Hinsley, S.A., Ibbotson, A.T., Jarvie, H.P. and Jones, J.I., Longshaw, M., Maberly, S.C., Marsh, T.J., Neal, C., Newman, J.R., Nunn, M.A., Pickup, R.W., Reynard, N.S., Sullivan, C.A., Sumpter, J.P. and Williams R.J. 2009. The British river of the future: How climate change and human activity might affect two contrasting river ecosystems in England. Science of the Total Environment, 407, 4787-4798.
Kahara, S.N. and Vermaat, J.E. 2003. The effect of alkalinity on photosynthesis-light curves and inorganic carbon extraction capacity of freshwater macrophytes. Aquatic Botany, 75 (3), 217–228.
Kelly, M., King, L. and Chathain, B.N. Submitted. The conceptual basis of ecological status assessments using diatoms. Submitted to the Proceedings of the Royal Irish Academy: Biology and Environment.
Kelly, M, Juggins, S., Guthrie, R., Pritchard, S., Jamieson, J., Rippey, B., Hirst, H. and Yallop, M. 2008. Assessment of ecological status in UK rivers using diatoms. Freshwater Biology, 53, 403-422.
Kelly, M., Juggins, S., Guthrie, R., Yallop, M., Hirst, H., Pritchard, S., Rippey, B. and Jamieson, J. 2006. Nutrient conditions required to support good ecological status in benthic diatom assemblages in rivers. Supporting paper to the WFD UK TAG consultation on environmental standards.
Kelly, M., Juggins, S., Guthrie, R., Yallop, M., Hirst, H., Pritchard, S., Rippey, B. and Jamieson, J. 2005. Nutrient and acid conditions required to support good ecological status in benthic diatom assemblages in rivers. UK TAG Rivers Task Team Paper 56.
Liess, A., Lange, K., Schulz, F., Piggott, J.L., Matthaei, C.D. and Townsend, C.R. 2009. Light, nutrients and grazing interact to determine diatom species richness via changes to productivity, nutrient state and grazer activity. Journal of Ecology, 97, 326-336.
Lohman, K, Jones, J R and Perkins B D 1992. Effects of nutrient enrichment and flood frequency on periphyton biomass in northern Ozark streams. Canadian Journal of Fisheries and Aquatic Science, 49, 1198-205.
Madsen, T.V., Enevoldsen, H.O., & Jorgensen, T.B. 1993. Effects of Water Velocity on Photosynthesis and Dark Respiration in Submerged Stream Macrophytes. Plant Cell and Environment, 16, 317-322.
Mainstone, C.P. and Clarke, S.J. 2008. Managing multiple stressors on sites with special protection for freshwater wildlife – the concept of Limits of Liability. Freshwater Reviews, 1, 175-187.
Mainstone, C.P., Dils, R.M. and Withers, P.J.A. 2008. Controlling sediment and phosphorus transfer to receiving waters – a strategic management perspective for England and Wales. Journal of Hydrology, 350, 131-143.
Mainstone, C.P. and Parr, W. 2002. Phosphorus in rivers – ecology and management. The Science of the Total Environment, 282-283, 25-47.
McGarrigle, M. 2009. Comparison of biology and chemistry – Irish rivers. Paper presented at an international workshop on ‘Ecological responses of streams to nutrient enrichment’, University College Cork, February 2009. (Abstract only available).
McIntyre, C.A. and Phinney, H.K. 1965. Laboratory experiments of periphyton production and community metabolism in lotic environments. Ecological Monographs, 35, 237-258.
Moss, B., Balls, H., Booker, I., Manson, K., & Timms, M. 1988. Problems in the construction of a nutrient budget for the River Bure and its Broads (Norfolk) prior to its restoration from eutrophication. In Algae and the aquatic environment (ed F.E. Round), pp. 327-353. Biopress, Bristol.
Neal, C., Hilton, J., Wade, A.J., Neal, M. and Wickham, H. 2006. Chlorophyll-a in the rivers of eastern England. Science of the Total Environment, 365, 84-104.

49 An evidence base for setting nutrient targets to protect river habitat
O’Hare, M.T., Clarke, R.T., Bowes, M.J., Cailes, C., Henville, P., Bissett, N, McGahey, C. And Neal, M. In Press. Eutrophication impacts on a river macrophyte. Aquatic Botany (2009), doi:10.1016/j.aquabot.2009.11.001.
Poole, G.C., Dunham, J.B., Keenan, D.W., Sauter, S.T., McCullough, D.A., Mebane, C., Lockwood, J.C., Essig, D.A., Hicks, M.P., Sturdevant, D.J., Materna, E.J., Spalding, S.A., Risley, J. And Deppman, M. 2004. The case for regime-based water quality standards. BioScience, 54, 2, 155-161.
Rattray, M.R., Howard-Williams, C. and Brown, J.M.A. 1991. Sediment and water as sources of nitrogen and phosphorus for submerged rooted aquatic macrophytes. Aquatic Botany, 40, 225-237.
Rosemond, A.D., Mulholland, P.J. and Brawley, S.H. 2000. Seasonally shifting limitation of stream periphyton: response of algal populations and assemblage biomass and productivity to variation in light, nutrients and herbivores. Canadian Journal of Fisheries and Aquatic Sciences, 57, 66-75.
Rosemond, A.D., Mulholland, P.J. and Elwood, J.W. 1993. Top-down and bottom-up control of stream periphyton: effects on nutrients and herbivores. Ecology, 74, 4, 1264-1280.
Shamsudin, L. & Sleigh, M.A. 1995. Seasonal changes in composition and biomass of epiphytic algae on the macrophyte Ranunculus penicillatus in a chalk stream, with estimates of production, and observations on the epiphytes of Cladophora glomerata. Hydrobiologia, 306, 85-95.
Shamsudin, L. & Sleigh, M.A. 1994. Seasonal-changes in composition and biomass of epilithic algal floras of a chalk stream and a soft-water stream with estimates of production. Hydrobiologia, 273, 131-146.
Scheffer, M., Redelijkheid, M.R. and Noppert, F. 1992. Distribution and dynamics of submerged vegetation in a chain of shallow eutrophic lakes. Aquatic Botany, 42, 199-216.
Schiller, D.V., Mart, E., Rirera, J.L. and Sabater, F. 2007. Effects of nutrients and light on periphyton biomass and nitrogen uptake in Mediterranean streams with contrasting land uses. Freshwater Biology, 52, 891-906.
Smith, V.H. and Schindler, D.W. 2009. Eutrophication science: where do we go from here? Trends in Ecology and Evolution, 24, 4, 201-207.
Sosiak, A.J. 2002. Long-term response of periphyton and macrophytes to reduced municipal nutrient loading to the Bow River (Alberta, Canada). Canadian Journal of Fisheries and Aquatic Science, 59, 987-1001.
Sterner, R.W. and Else, J.J. 2002. Ecological stoichiometry. Princeton University Press, Princeton.
Townsend, C.R., Uhlmann, S.S. and Matthaei, C.D. 2008. Individual and combined responses of stream ecosystems to multiple stressors. Journal of Applied Ecology, 45, 6, 1810-1819.
Tuchman, N.C. 1996. The role of heterotrophy in algae. In: Algal ecology: freshwater benthic ecosystems. Eds. R.J. Stevenson, M.L. Bothwell, and R.L. Lowe. Academic Press, San Diego.
Vadstrup, M. and Madsen, T.V. 1995. Growth limitation of submerged aquatic macrophytes by inorganic carbon. Freshwater Biology, 34, 3, Pages 411 – 419.
Wade, A.J., Whitehead, P.G. and Butterfield, D. 2002a. The Integrated Catchments model of Phosphorus dynamics (INCA-P), a new approach for multiple source assessment in heterogeneous river systems: model structure and equations. Hydrology and Earth System Sciences, 6, 3, 583-606.
Wade, A.J., Whitehead, P.G., Hornberger, G.M. and Snook, D.L. 2002b. On modelling the flow controls on macrophyte and epiphyte dynamics in a lowland permeable catchment: the River Kennet, southern England. The Science of the Total Environment, 282-283, 375-393.
Wade, A.J., Hornberger, G.M., Whitehead, P.G., Jarvie, H.P. and Flynn, N. 2001. On modelling the mechanisms that control in-stream phosporus, macrophyte, and epiphyte dynamics: an assessment of a new model using general sensitivity analysis. Water Resources Research, 37, 11, 2777-2792.
Walsh, C.L. and Kilsby, C.G. 2007. Implications of climate change on flow regime affecting Atlantic Salmon. Hydrology and Earth System Sciences, 11, 3, 1127-1143.

50 Natural England Research Report NERR034
Welch, E.B., Jacoby, J.M. and Lindell, T. 2004. Pollutant effects in freshwater: applied limnology. Third Edition. Spon Press, London.
Willby, N.J. and Pitt, J. 2008. Description of LEAFPACS. Pro forma for UK Classification Tool sign-off. Water Framework Directive UK Technical Advisory Group.
Yallop, M., Hirst, H., Kelly, M., Juggins, S., Jamieson, J. and Guthrie, R. In Press. Validation of ecological status concepts in UK rivers using historic diatom samples. Aquatic Botany (2009).


Natural England works for people, places and nature to conserve and enhance biodiversity, landscapes and wildlife in rural, urban, coastal and marine areas.
www.naturalengland.org.uk
© Natural England 2010