natural gas facts & figures - igu | welcome to the … source: ngva europe, worldwide shares in...
TRANSCRIPT

Natural Gas Facts & Figures
Section 6:
Utilization
September 2014

6. Utilisation
Source : WOC5, SG5,3
Industrial uses
Domestic and commercial uses
Natural gas vehicles
LNG vehicles

Evolution of consumption by region (Bcf)
2000 - 2011
3 10/22/2014
0
5000
10000
15000
20000
25000
30000
35000
2000 2001 2002 2003 2004 2005 2006 2007 2008 2009 2010 2011
North America
Central & South America
Europe
Eurasia
Middle East
Africa
Asia & Oceania
Source: DOE Energy Information Agency

Demand Evolution of Asian Countries (Bcf)
2000-2011
4 10/22/2014
Source: DOE Energy Information Agency
0
500
1000
1500
2000
2500
3000
3500
4000
4500
5000
2000 2001 2002 2003 2004 2005 2006 2007 2008 2009 2010 2011
China
Japan
India
Thailand
Korea, South
Pakistan
Indonesia
Australia
Malaysia
5
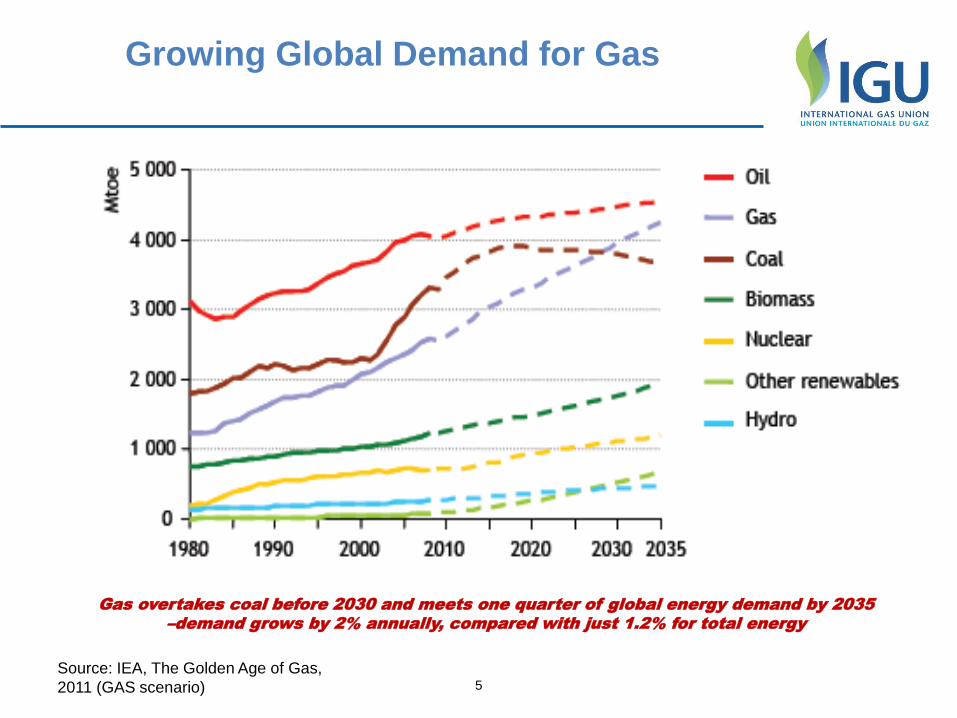
Growing Global Demand for Gas
Source: IEA, The Golden Age of Gas,
2011 (GAS scenario)
Gas overtakes coal before 2030 and meets one quarter of global energy demand by 2035
–demand grows by 2% annually, compared with just 1.2% for total energy

6
Gas: Convenient & Efficient Source of Energy
Economic and Clean
Easy handling, lower installation and maintenance
cost
Good controllability of processes and high efficiency
Direct heating or drying of products or materials
Clean and environment-friendly
Less CO2 emission rights needed (where applicable)

7
Gas: The Efficient Source of Energy
(examples)
Green houses – use
Boiler house in green house. Gas use temperature dependent.
Assimilation illumination
+ Use of CO2 from exhaust gases
as fertiliser

Natural Gas Vehicles

9
Natural gas for road transport
Source: Gasunie ‘Natural gas, part of an efficient sutainable energy future, The Dutch case’, Feb 2010

Data source: NGVA Europe, Worldwide shares in vehicle market , june 2013
Transportation fuel growth in 2004 – 2013 Average retail price at pump in Europe
-
5,000
10,000
15,000
20,000
25,000
30,000
35,000
2004 2005 2006 2007 2008 2009 2010 2011 2012 2013
NGVs * 1000 NG Demand, Mcmpa Filling Stations
Average Growth Rates NGV population : 18% per annum Natural Gas demand: 17% per annum Number of NGV : 13% per annum

Data source: NGVA Europe, Worldwide shares in vehicle market , june 2013
World NGV Recognition Level

Light vehicles = 16 310 105
Medium and Heavy Duty
Buses = 781 396
Medium and Heavy Duty
Trucks = 368 000
Others = 270 932
Total NGV population = 17 730 433
Data source: NGVA Europe, NGVs and fuel consumption worldwide, june 2013
Worldwide Natural GasVehicle (NGV) population other than ships, trains and aircraft

Data source: NGVA Europe, Worldwide shares in vehicle market , june 2013
Regional NGV Markets
Region (UN definition) Population of NGVs, thousands, 2013
NG Demand, MCM/2012
Number of Filling Stations, 2013
South Asia 7 810,0 11 766,1 6 299
South America 4 949,8 5 518,1 4 955
East Asia 1 578,5 3 305
South Europe 751,9 939,3 997
East Europe 551,1 1 249,3 882
South East Asia 492,0 3 612,0 732
Central Asia 332,6 56,8 254
North America 264,2 930,2 1 521
West Asia 250,9 410
West Africa 180,5 458,9 175
South Europe 133,2 531,2 1 627
North Europe 48,4 377,5 282
Central America & Caribbean 17,0 29
Oceania 3,7 65
TOTAL 17363,7 26937,1 21 533,0

Population of Natural gas vehicles in Europe
Italy
Hungary
Bulgaria
Switzerland
Spain
United Kingdom
Sweden
Finlandia
Norway
Germany
Total NGVs in Europe: 1 104 038
Data source: NGVA Europe, Worldwide shares in vehicle market , june 2013

Data source: NGVA Europe, Worldwide shares in vehicle market , june 2013
Population of NGVs in North and South America
Argentina
Chile
Brazil
Columbia
USA
Bolivia
Peru
Dominican
Rep
Canada
Total NGVs in America: 5 141 109

Data source: NGVA Europe, Worldwide shares in vehicle market , june 2013
Number of natural gas vehicles in Russia
and Asia
Total NGVs in Asia: 7 738 863
Pakistan
Chine
Inde
Thailand
Uzbekistan
Russia
Bangladesh

Environmental efficiency
Well-to-wheel greenhouse gas emissions in g CO2 eq./km for different fuels
Source: Dena, German Energy Agency, The role of natural gas and biomethane in the fuel mix of the
future in Germany, June 2010

Monthly theoritical consumption (M Nm3)
Data source: NGVA Europe, NGVs and fuel consumption worldwide, june 2013

Data source: NGVA Europe, Worldwide shares in vehicle market , june 2013
Transportation fuel growth in 2004 – 2013 Average retail price at pump in Europe

Applications of Natural gas as a fuel
Natural gas occupies more volume than traditional liquid
fuels thus it must be compressed or liquefied to make it
practical for transport applications.
Compressed Natural Gas (CNG) is the most common
application for NGVs. It can be installed wherever there is
a natural gas pipe in the ground.
Liquefied Natural Gas (LNG) use is becoming
increasingly common. It needs a local supply of fuel
Liquefied Compressed Natural Gas (LCNG) combines
LNG and CNG in one station. A typical LCNG station is
supplied with LNG and has dispensers for both LNG and
CNG vehicles.

CNG stations = 22 162
L-CNG staions = 441
LNG stations = 1433
Total = 24 036
Data source: NGVA Europe, NGVs and fuel consumption worldwide, june 2013
Focus on CNG filling stations types
NGV station population

Data source: NGVA Europe, more examples on http://www.ngvaeurope.eu/cars
Examples of OEMs Natural gas light vehicle
Major NGV OEMs for
Light vehicles /light duty vehicles: FIAT, Volkswagen, Skoda, Seat,Mercedes, Lancia, Iveco
Buses: IVECO, MAN, Solaris, TEDOM, Van Hool, Volvo
Truckes: SCANIA, DAIMLER, Volvo
Examples below

Data source: NGVA Europe, more examples on http://www.ngvaeurope.eu/cars
Examples of OEMs Natural gas light vehicle
Aviat Husky CNG (Airplane manufacturer Aviat Aircraft, inc) , the first
irst dual fuel, piston powered aircraft to operate on both compressed
natural gas (CNG) and aviation gasoline
Sanmar constructed the world’s first Liquid Natural Gas (LNG)
powered escort tugs. The vessels have been ordered by Buksér og
Berging AS of Norway and entered the service in 2014
SUGAR Freeze is one of several notional concepts that a Boeing-led
team is studying for NASA as part of the Subsonic Ultra-Green
Aircraft Research (SUGAR) project

24
Residential: Efficient and environmentally
friendly fuel for heating, hot water and cooking
High efficiency heating system (hot water boiler) with storage vessel
High efficiency heating system
Clean and easy handling once infrastructure is present
Low installation cost vs. other fuels
High efficiency heating equipment available
High comfort factor
Individual heating systems in apartment blocks

25
LNG as automotive fuel for heavy vehicles
LNG is used in increasingly many places for road transport fleets: Buses, Dust
Carts, Chilled Container Transporters – it gives good engine performance and a vehicle
range comparable with other fuels
LNG is suitable to fuel high-consumption transport where space for the LNG storage
is readily available: e.g. trains and sea ferries
LNG is less-suitable for small privately-owned vehicles because of more complex
procedures and more expensive fuelling stations with special requirements regarding their
location.
Heavy vehicles do not lend themselves to be run on electric power.