natural products discovery and characterization via
TRANSCRIPT

NATURAL PRODUCTS DISCOVERY AND CHARACTERIZATION VIA SYNTHETIC BIOLOGY
BY
YUNZI LUO
DISSERTATION
Submitted in partial fulfillment of the requirements for the degree of Doctor of Philosophy in Chemical Engineering
in the Graduate College of the University of Illinois at Urbana-Champaign, 2014
Urbana, Illinois
Doctoral Committee: Professor Huimin Zhao, Chair Professor Yi Lu Assistant Professor Mary L. Kraft Assistant Professor Brendan A. Harley
ii
Abstract
Microorganisms and plants have evolved to produce a myriad array of natural
products that are of biomedical importance. Recent advances in synthetic biology
have revolutionized our ability to discover and manipulate natural products
biosynthetic pathways. This thesis describes in depth our efforts to enable natural
products discovery and characterization via synthetic biology approaches.
Type III polyketide synthases (PKSs) produce a wide array of aromatic structures
in spite of their structural simplicity. An efficient strategy for cloning and
characterizing Type III PKSs that are likely responsible for the synthesis of novel
natural products from Eucalyptus species were developed. Five unique putative Type
III PKSs genes were identified using this approach and two full-length genes were
cloned and the biochemically characterized.
With recent development in genome sequencing projects, cryptic pathways serve
as a potential source for novel natural products discovery. A synthetic biology
approach for cryptic pathway activation and characterization was developed. One
cryptic pathway from Streptomyces griseus, containing a PKS/NRPS hybrid gene,
was chosen as a model system. To decipher this cluster, we have developed a plug-
and-play platform based on the “DNA assembler” method. In this platform, one
constitutive promoter was inserted in front of each gene involved in the pathway.
qPCR data confirmed the increased transcription levels and HPLC data showed the
formation of new polycyclic tetramate macrolactams (PTMs). However, for PTM
biosynthesis, no clear mechanism has been reported. Therefore, Chapter 4 describes

iii
the characterization of this PTM biosynthetic pathway by applying the same synthetic
biology approach. We identified the boundary of this gene cluster by assembling a
seven-gene construct and proposed a biosynthesis mechanism by studying a series of
single-gene deletion and multiple-gene deletion constructs. Noticing that this one
single gene cluster may have the potential to produce multiple products with closely
related chemical structures, we biochemically characterized the modification enzymes
in vitro and studied this phenomenon with a phylogenetically related pathway as well.
Finally, after achieving the success in pathway activation and characterization
with our newly developed synthetic biology platform, we decided to make it more
generally applicable for natural products discovery in actinomycetes. Additional
strong constitutive promoters were identified via RNA-seq technique. The selected
strong promoters were characterized based on both qPCR data and XylE enzyme
specific activity assay. In total, 10 relatively strong promoters were identified
comparing with ermE*p, a widely used strong promoter reported in literature. These
promoters will be used in our genomics-driven, synthetic biology platform for high
throughput discovery of novel natural products in actinomycetes.

iv
To my family

v
Acknowledgments
First of all, I would like to thank my advisor, Professor Huimin Zhao for offering
me the opportunity to develop myself into an independent researcher in the University
of Illinois at Urbana and Champaign. I really appreciate his guidance, patience and
encouragement to me throughout my graduate studies. Also, I want to thank my other
committee members, Professor Yi Lu, Professor Mary Kraft, and Professor Brendan
Harley for serving on my candidacy committee and for their valued criticism and
insightful comments. I would also like to thank Professor Charles Schroeder for
serving on my committee for my preliminary examination.
Meanwhile, I am very thankful for all the members in the Zhao research group for
their valuable discussions and encouragements. In particular, I would like to thank Dr.
Sheryl Rubin Pitel and Dr. Zengyi Shao as they were my mentors when I first joined
the lab. They helped me to truly understand and master all the experimental
techniques and skills. I am also indebted several people who worked with me and
helped me on several projects, including Dr. Jing Liang, Dr. Hua Huang, Dr. Meng
Wang, Lu Zhang, and the undergraduate students: Lu Lu, Braden Christine and Kate
Barton. I would also like to thank Lucas Li of the Roy J. Carver Metabolomics Center
at the University of Illinois, Urbana, Furong Sun of the Mass Spectrometry
Laboratory at the University of Illinois, Urbana, and Lingyang Zhu and Xudong Guan
of the NMR Lab of the School of Chemical Sciences at the University of Illinois,
Urbana, Alvaro Hernandez, Radhika Khetani and Jenny Zadeh of the Roy J. Carver

vi
Biotechnology Center at the University of Illinois, Urbana, for their assistance with
sample analysis by HPLC, LC-MS/MS, NMR and RNA-seq, respectively.
I would also like to thank all my friends for helping me out during all the hard
times and making all the impossible into possible. I truly appreciate them for their
companies and all the happiness they bring to me.
Finally, and most important of all, I would like to thank my family, especially my
mom and dad for their unconditional love and supports. Even though they do not
understand what I am doing, they always believe in me and bless me. My fiancé Jie
Yang deserves specially honors for his immense support during all these years,
particular for tolerating my kvetching on the gloomy days and encouraging me
throughout the long process of my education.

vii
Table of Contents
Chapter 1 Overview of Natural Products Discovery ..................................................... 1
1.1 Importance of natural product biosynthesis ................................................. 1
1.1.1 Significant source for medicinal compounds ..................................... 1
1.2 Common sources of natural products .......................................................... 2
1.2.1 Plants as a source of natural products ................................................ 2
1.2.2 Fungi as a source of natural products ................................................ 3
1.2.3 Bacteria as a source of natural products ............................................ 4
1.2.4 Cryptic pathways as a source of natural products .............................. 5
1.3 Technologies for natural product discovery and identification ................... 6
1.3.1 Genome mining .................................................................................. 6
1.3.2 Metabolic engineering and pathway engineering .............................. 7
1.3.3 Heterologous expression .................................................................... 8
1.3.4 Techniques used to activate cryptic pathways ................................. 10
1.3.5 Synthetic biology approaches .......................................................... 11
1.4 Polyketides as natural products ................................................................. 13
1.4.1 Polyketides ....................................................................................... 13
1.4.2 Polyketide synthases ........................................................................ 14
1.5 Project overview ......................................................................................... 16
1.6 References .................................................................................................. 20
1.7 Figures ........................................................................................................ 26
Chapter 2 Discovery of New Type III PKS from Bioactive Plants ............................. 30
2.1 Introduction ................................................................................................ 30
2.2 Results and discussion ................................................................................ 32
2.2.1 Design of the degenerate primers .................................................... 32
2.2.2 Validation of degenerate primers ..................................................... 33
2.2.3 Identification of target plants ........................................................... 35
2.2.4 Screening of PKS genes in target plants .......................................... 36
2.2.5 Cloning of full length PKS genes using RACE-PCR ...................... 38
2.2.6 Enzyme characterization and product identification ........................ 39
2.3 Conclusion .................................................................................................. 40

viii
2.4 Materials and methods ............................................................................... 40
2.4.1 Strains and reagents ......................................................................... 40
2.4.2 Degenerate primer design ................................................................ 41
2.4.3 Seed sterilization and germination ................................................... 42
2.4.4 Collection of plant tissue ................................................................. 43
2.4.5 Total RNA isolation and concentration and cDNA synthesis ......... 43
2.4.6 Screen validation using Hypericum perforatum var. Topas ............ 44
2.4.7 Screening Eucalyptus species .......................................................... 46
2.4.8 RACE PCR ...................................................................................... 46
2.4.9 Protein purification .......................................................................... 47
2.4.10 SDS-Polyacrylamide Gel Electrophoresis (SDS-PAGE) ................ 48
2.4.11 Determination of activity ................................................................. 48
2.4.12 Product HPLC analysis method ....................................................... 49
2.5 References .................................................................................................. 49
2.6 Figures and tables ...................................................................................... 51
Chapter 3 Activation of a Cryptic Biosynthetic Pathway from Streptomyces griseus via a Synthetic Biology Approach ............................................................................... 68
3.1 Introduction ................................................................................................ 68
3.2 Results and discussion ................................................................................ 72
3.2.1 Selection of a target gene cluster ..................................................... 72
3.2.2 Construction of the original pathway via DNA assembler .............. 75
3.2.3 Product detection for the original cluster in a heterologous host ..... 77
3.2.4 Quantitative real-time PCR (qPCR)................................................. 77
3.2.5 Construction of the ermE*p-construct ............................................. 79
3.2.6 Promoter identification and characterization ................................... 80
3.2.7 Development of a plug-and-play platform ....................................... 81
3.2.8 Identification of final products ......................................................... 82
3.2.9 Isolation and characterization of novel PTMs ................................. 82
3.3 Conclusions ................................................................................................ 83
3.4 Materials and methods ............................................................................... 86
3.4.1 Strains and reagents ......................................................................... 86
3.4.2 DNA manipulation ........................................................................... 87
ix
3.4.3 Yeast transformation ........................................................................ 89
3.4.4 Verification of the assembled gene clusters ..................................... 89
3.4.5 Streptomycete cultivation, RNA extraction and qPCR analysis ...... 90
3.4.6 Heterologous expression in S. lividans ............................................ 91
3.4.7 HPLC-MS analysis .......................................................................... 92
3.4.8 Structure elucidation of compounds a-b .......................................... 92
3.5 References .................................................................................................. 93
3.6 Figures and tables ...................................................................................... 98
Chapter 4 Further Characterization of the Cryptic PTM Biosynthetic Pathway from Streptomyces griseus .................................................................................................. 123
4.1 Introduction .............................................................................................. 123
4.2 Results and discussion .............................................................................. 127
4.2.1 Determination of the boundary of the cluster ................................ 127
4.2.2 Construction of single-gene deletion constructs ............................ 127
4.2.3 Analysis of the single-gene deletion constructs ............................. 128
4.2.4 Construction of the multiple-gene deletion constructs .................. 130
4.2.5 Analysis of the multiple-gene deletion constructs ......................... 131
4.2.6 Reconstitution of the oxidoreductases in vitro ............................... 132
4.2.7 Investigation of the HSAF pathway ............................................... 133
4.3 Conclusions .............................................................................................. 134
4.4 Materials and methods ............................................................................. 136
4.4.1 Strains and reagents ....................................................................... 136
4.4.2 DNA manipulation ......................................................................... 137
4.4.3 Yeast transformation ...................................................................... 138
4.4.4 Verification of the assembled gene clusters ................................... 139
4.4.5 Streptomycete cultivation, RNA extraction and qPCR analysis .... 140
4.4.6 Heterologous expression in S. lividans .......................................... 140
4.4.7 HPLC-MS analysis ........................................................................ 141
4.4.8 Structure elucidation of compounds c-e ........................................ 142
4.4.9 Cloning, expression and purification of the oxidoreductases ........ 142
4.4.10 Polyacrylamide gel electrophoresis (SDS-PAGE) ......................... 144
4.4.11 Western blot analysis of proteins ................................................... 144

x
4.5 References ................................................................................................ 145
4.6 Figures and tables .................................................................................... 147
Chapter 5 Discovery and Characterization of Strong Promoters from Actinomycetes.................................................................................................................................... 175
5.1 Introduction .............................................................................................. 175
5.2 Results and discussion .............................................................................. 178
5.2.1 Host selection ................................................................................. 178
5.2.2 Screening for strong promoters via RNA-seq ................................ 180
5.2.3 Cloning of the constitutive promoters............................................ 181
5.2.4 Trouble-shooting experiments ....................................................... 183
5.2.5 Characterization of the selected promoters .................................... 184
5.2.6 Analysis of the strong promoters characterized ............................. 185
5.3 Conclusions .............................................................................................. 186
5.4 Materials and methods ............................................................................. 188
5.4.1 Strains and reagents ....................................................................... 188
5.4.2 Streptomycete cultivation and RNA extraction ............................. 189
5.4.3 RNA-seq analysis........................................................................... 190
5.4.4 Promoter cloning ............................................................................ 190
5.4.5 Yeast transformation ...................................................................... 191
5.4.6 Verification of the assembled gene clusters ................................... 192
5.4.7 Heterologous expression in S. albus .............................................. 192
5.4.8 Promoter characterization via the XylE assay ............................... 193
5.4.9 Promoter characterization via qPCR analysis ................................ 194
5.5 References ................................................................................................ 195
5.6 Figures and tables .................................................................................... 199

1
Chapter 1 Overview of Natural Products Discovery
1.1 Importance of natural product biosynthesis
1.1.1 Significant source for medicinal compounds
The human pharmaceutical development is significantly indebted to Nature, and
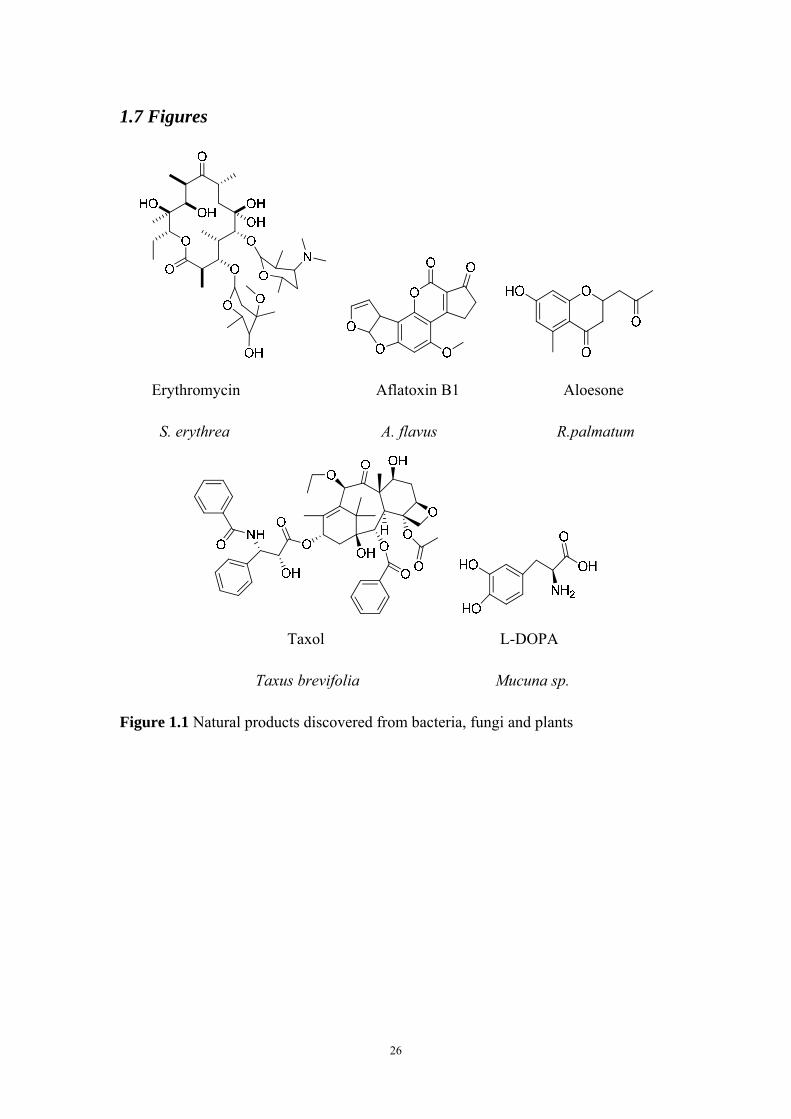
especially to the natural products of bacteria, fungi, and plants (Figure 1.1). Natural
products are the most significant source for modern medicine discovery (1). To date,
77% of antibacterial drugs, 61% of anticancer compounds and 49% of anti-infectives
approved in the past 30 years are natural products or their derivatives (2,3). The data
shown in Annual Reports of Medicinal Chemistry highlight the invaluable role that
natural products have played in the drug discovery process related to all disease types
(4). Although many effective drugs have been discovered, the need for new
therapeutic agents remains, due to the increasing antibiotic resistance to existing drugs
and the recent threat of bioterrorism. However, major pharmaceutical companies have
largely turned their efforts away from natural product discovery since the 1990s,
because of the difficulties in supply, screening, and characterization of natural
products, and in particular the increasing rediscovery rate of known compounds (5).
With the advent of fast and inexpensive next generation genome sequencing
technologies, the presence of multiple natural product biosynthetic gene clusters for
which the cognate products have never been observed has revised our vision of the
biosynthetic potential and metabolic capabilities of microorganisms, sparking a
renaissance in natural product discovery. According to analysis of the genome

2
databases, only a small portion of the natural products has been discovered and
characterized. For example, the Streptomyces species alone is predicted to produce as
many as 150,000 natural products, while only 3% have been characterized (6). With
the development of novel biotechnologies and expanding understanding of the
biology world, the field of natural product discovery has been revisited.
Many bioactive natural products are synthesized by non-ribosomal peptide
synthetases (NRPSs) and polyketide synthases (PKSs) (7,8). 20 out of 7000
polyketides known to exist have been commercialized as medicines, which has a “hit
rate” that is already two orders of magnitude higher than other classes of chemicals
(9). Therefore, investigations into the unknown compounds synthesized by these two
classes of enzymes may lead to the discovery of a variety of novel chemotherapeutic
agents. The genome sequence data reveals that these two classes of enzymes are
widely distributed in all sources for natural product discovery, such as bacteria, fungi
and plants. Coupling the sequence data with the highly-developed biotechnologies,
such as metabolic engineering and synthetic biology, we could foresee the flourish of
natural product discovery for future drug candidates.
1.2 Common sources of natural products
1.2.1 Plants as a source of natural products
Medicinal plants have been used for thousands of years in the treatment of
numerous ailments (10). Modern analytical techniques identified the bioactive
compounds in plant extracts and approximately 25% of today’s medicines are derived

3
from plant natural products (11), including many highly successful drugs such as the
best breast cancer therapy Taxol (paclitaxel) (12) and anti-Parkinson’s treatment L-
DOPA (13). Plant-derived polyketides such as curcuminoids (curcumin) and
flavonoids (genistein, quercetin, resveratrol) are well-known complementary therapies,
with a growing body of evidence vis-à-vis their usefulness as anti-inflammatory and
anti-cancer agents (14,15).
Particularly, Eucalypt polyketide natural products are known to be antiviral,
antibacterial, anticancer, and cariostatic (inhibiting the growth of bacteria that cause
tooth decay), and Eucalypts have been used by the Aboriginal people of Australia for
the treatment of colds, influenza, toothache, snakebites, fevers, and other ailments
(16).
1.2.2 Fungi as a source of natural products
Fungi have existed on earth for at least one thousand million years, and they have
exploited and evolved secondary metabolism for the production of bioactive
compounds (17). These compounds include toxins such as α-amanitin, the toxic
principal component of Amanita phalloides (death cap), vomitoxin (deoxynivalenol)
produced by the Fusaria family of plant pathogens and aflatoxin B1 produced by
Aspergillus species. Fungi also produce potent psychoactive compounds such as
muscimol, psilocybin and xenovulene A, pharmaceuticals such as the β-lactams and
the statin lovastatin. These compounds illustrate the utility and diversity of chemical
structures produced by fungi, and the diverse biosynthetic potential of these
organisms. Among all the compounds produced by fungi, a wide variety of
4
polyketides with diverse structures, such as orsellinic acid, lovastatin, and aflatoxin
can be found as well (17). Most of these compounds are bioactive and usually
pharmacologically useful. For example, lovastatin produced by Aspergillus terreus,
can lower the cholesterol level by inhibiting the rate-limiting enzyme in cholesterol
biosynthesis. Fungi can inhabit almost all known environments on earth-from
temperate soils and forests to deserts and from oceans to tropical rain forests. Thus, it
is not surprising that they can produce numerous medicinal important natural products
(18).
1.2.3 Bacteria as a source of natural products
Bacteria represent a rich source of natural products as well. Type II PKS are
found in bacteria exclusively, which can synthesize a variety of polyketides, such as
oxytetracycline from Streptomyces rimosus, and daunorubicin from Streptomyces
peucetius (19). Bacteria produce many different tetracyclines, one of the most
important classes of antibiotics, and anthracyclines, a potent class of anticancer
compounds which includes daunorubicin. Actinomycetes are a group of bacteria
capable of producing numerous natural products. The Streptomyces species alone is
predicted to produce as many as 150,000 natural products. Most of them are
secondary metabolites. For example, around 20 secondary metabolite biosynthesis
pathways have been revealed from actinomycete Streptomyces coelicolor A3(2) (20)
and the industrial actinomycete Streptomyces avermitilis (21), respectively. Another
example is Streptomyces griseus, from which genomic sequence, 34 secondary
5
metabolite biosynthesis pathways have been found (22). These gene clusters reveal
the high possibility of discovering new natural products.
1.2.4 Cryptic pathways as a source of natural products
The recent increase and availability of whole genome sequences have revised our
view of the metabolic capabilities of microorganisms. A large number of cryptic
biosynthesis pathways have been identified by bio-informatics study of these genome
sequence data. Cryptic biosynthetic pathways are gene clusters for which the encoded
natural products are unknown or the pathways are silent and the products cannot be
detected under normal growth conditions. It is worthy to note that the number of
cryptic pathways coding for putative natural products far outnumbers the number of
currently known metabolites for a given organism. Thus, cryptic pathways serve as an
enormous source for natural product discovery.
Since the genome sequencing projects are mostly focused on the genomes of
bacteria and fungi, the cryptic pathways related to valuable secondary metabolites are
often revealed from the bacteria and fungi genome databases. For example,
Streptomyces coelicolor was known to produce only 4 secondary metabolites (20),
while genome analysis revealed 18 additional cryptic biosynthetic pathways. It is
intriguing to note that this is not a particular case because analysis of other microbial
genomes originating from Mycobacteria, Cyanobacteria and filamentous fungi
showed the presence of a comparable or even larger number of cryptic pathways
(23,24). The few natural products that have been correlated with their cryptic
pathways are merely the tip of the iceberg, whilst plenty of metabolites await

6
discovery (25). The discovery of these numerous pathways represents a treasure trove,
which is likely to grow exponentially in the future, uncovering many novel and
possibly bio-active compounds.
1.3 Technologies for natural product discovery and identification
1.3.1 Genome mining
Genome mining has been used in various fields to describe the exploitation of
genomic information for the discovery of new processes, targets, and products.
Genome sequencing projects have resulted in the deposition of a huge quantity of
DNA sequence data from a wide variety of organisms in publicly accessible databases.
This information can be exploited to generate new knowledge in several areas
relevant to medicinal chemistry including the identification and validation of new
drug targets in human pathogens, and the discovery of new chemical entities (23). The
concept of exploiting genomic sequence data for the discovery of new natural
products has emerged from the rapid expansion in knowledge of the genetic and
biochemical basis for secondary metabolite biosynthesis, particularly in
microorganisms, in the 1980s and 1990s (7).
Large quantities of genomic sequence data have accumulated in public databases.
Those of plants and microorganisms, containing numerous genes encoding proteins
are likely to participate in the assembly of structurally complex bioactive natural
products but not associated with the production of known metabolites. Therefore, they
become invaluable as they shed light on the discovery of novel drugs.

7
Analysis of the complete genome sequence of the model actinomycete S.
coelicolor A3(2) (20) and the industrial actinomycete S. avermitilis (21) have
facilitated the prediction of unknown natural products. For example, the genome
mining of these two bacteria revealed around 20 secondary metabolite biosynthetic
gene clusters respectively, many of which have not been characterized yet. Another
example is the genome sequence of S. griseus, which revealed 34 secondary
metabolites pathways, but only six of them have been characterized (22).
1.3.2 Metabolic engineering and pathway engineering
The term metabolic engineering was first coined in the late 1980s and early 1990s
with the goal to either increase the production of value-added molecules or degrade
harmful compounds in a simple, effective and advantageous process via genetic
manipulations (26). It is broadly defined as using recombinant DNA technology to
improve cellular activities. Specifically, it involves the identification of metabolic
pathways, modification and manipulation of biosynthetic pathways by blocking side
reactions, over-production of desired products or introducing new reactions. This area
is particularly important to natural product biosynthesis because it offers ways to
improve current bioprocesses, such as optimization of the native biosynthetic pathway
for increased production, enabling the heterologous expression of a pathway in
industrial strains, and balancing metabolic flux for maximal production of desired
compound, as well as providing access to novel chemicals and pharmaceuticals
through the development of new bioprocesses.

8
Serious considerations are required when making the designs to direct carbon
flow to a desired product at a high yield via metabolic engineering approaches. Four
key elements are normally included: (i) identify and optimize the primary carbon flow
to the target product, including addressing rate limiting steps, transcriptional and
allosteric regulations; (ii) block competing pathways and side reactions; (iii) modify
secondary metabolic pathways to enhance energy metabolism and availability of
required substrates and enzymatic cofactors; and (iv) direct carbon flow to the target
pathway from central metabolism (27). For example, hydrocortisone, an important
starting material for steroidal drug synthesis, can be synthesized from glucose in yeast
by engineering a recombinant Saccharomyces cerevisiae to express 13 assembled
genes (28). Another example is to enhance the production of 6-deoxyerythronolide B
(the polyketide precursor of erythromycin) in the heterologous host Escherichia coli
to the level of the native producer through metabolic engineering (27). As for
polyketides, the availability of acyl-CoA is a major obstacle in heterologous host such
as E. coli or S. cerevisiae. Pathways that can use propionate and methylmalonate to
produce these CoAs were introduced into the heterologous host, which resulted in an
increase in the production of the final products (29,30).
1.3.3 Heterologous expression
Natural products show great promise as medicinal agents. Obviously, the most
desirable approach for natural product discovery and production would be direct
extraction and isolation of the target products from their native producers. However,
only 1% of bacteria and 5% of fungi could be cultured under standard laboratory
9
conditions (31-34). Even if the native producer is cultivable in the laboratory,
considerable amounts of time and efforts are required to optimize the growth
condition for the production of a desired compound, not to mention the development
of genetic manipulation tools in the native producer. As a result, over the past decade,
the study of bioactive natural product biosynthesis has benefited significantly from
the incorporation of heterologous expression tools.
A heterologous host often refers to a well-characterized microorganism that can
serve as a platform for natural product biosynthesis. Compared to native producers,
heterologous hosts have several advantages such as ease to operate, simple growth
conditions, excellent fermentation protocols, and abundant genetic manipulation tools
(26).
Polyketides are a major class of natural products that are synthesized by an
evolutionarily related but architecturally diverse family of multifunctional enzymes
called polyketide synthases. Heterologous expression of these megasynthases is
particularly important as many of their products are produced in actinomycetes or
plants that often suffer from slow growth rates. Another principal limitation for
fundamental biochemical studies of these modular megasynthases and for their
applications in biotechnology is the challenge associated with manipulating the native
microorganism that produces a polyketide of interest. For example, they may have
strict environmental requirements for growth or cannot be cultured readily (26). Host
organisms may also have a complicated or multi-stage growth profile, which may
result in little production of a target compound. To ameliorate this limitation, several

10
genetically tractable microorganisms such as E. coli, S. cerevisiae, and Streptomyces
lividans have emerged as choice hosts due to their simplicity of use, excellent growth
characteristics, and a plethora of readily accessible genetic tools (35).
There are several requirements for reconstitution of polyketide biosynthesis in
heterologous hosts: 1) the large multienzyme assemblies can be functionally
expressed, 2) their posttranslational modification can be adequately met, 3) the
availability of their potential substrates in vivo is in reasonable quantities, and 4) the
producer cell is protected against the toxicity of the biosynthetic products. Already,
heterologous expression of Type I and Type II PKSs has been achieved in E. coli to
produce the antibiotic erythromycin (36) and plant flavonoids (37). In addition,
unnatural substrates have been fed into a heterologous host for Type III PKS, which
resulted in combinatorial biosynthesis of new medicinal natural products (38).
1.3.4 Techniques used to activate cryptic pathways
Analyses of more than 500 microbial genome sequences currently in the publicly-
accessible databases have revealed numerous examples of gene clusters encoding
enzymes similar to those known to be involved in the biosynthesis of many important
natural products (39). Examples of such enzymes include nonribosomal peptide
synthetases (NRPSs), polyketide synthases (PKSs) and terpene synthases (TSs), as
well as enzymes belonging to less thoroughly investigated families. Many of these
gene clusters are hypothesized to assemble novel natural products. Numerous novel
metabolites have been discovered as the products of so-called ‘‘cryptic’’ or ‘‘orphan’’
biosynthetic gene clusters and several recent reviews have described these discoveries

11
(23,25). The various approaches for discovery of the metabolic products of cryptic
biosynthetic gene clusters are summarized in Figure 1.3.
At the beginning of every discovery of an orphan pathway, in order to predict the
chemical structure of the corresponding natural product, significant progress needs to
be made in the understanding of biosynthetic pathways (25). With this accumulated
knowledge, combined with advances in bioinformatics, it is nowadays possible to
reasonably predict the product of an orphan biosynthetic pathway. Techniques usually
used to activate the cryptic pathways include: i) prediction of physicochemical
properties (40); ii) a genomisotopic approach (41); iii) an in vitro reconstitution
approach (42); iv) a biosynthetic gene inactivation/comparative metabolic profiling
approach (43); v) a heterologous gene expression/comparative metabolic profiling
approach (44); vi) activation of silent clusters by manipulation of regulatory genes
(24).
1.3.5 Synthetic biology approaches
The term synthetic biology was first introduced in the late 1970s to describe the
application of recombinant DNA technology in engineered bacteria (45,46).
However, it did not gain much attention until early 2000s, while the term of synthetic
biology was again introduced, with emphasis on engineering principles and
methodologies in designing, constructing and characterizing existing or novel
biological systems from traditional genetic engineering research (47-50). The field
of synthetic biology lies at the interface of many different biological research areas,
such as functional genomics, protein engineering, chemical biology, metabolic
12
engineering, systems biology, and bioinformatics. Not surprisingly, synthetic biology
means different things to different people, even to leading practitioners in the field
(51). The fundamental idea behind synthetic biology is that any biological system
can be broken down into individual functional building blocks (52). The key feature
that distinguishes synthetic biology from traditional molecular biology and cellular
biology is the focus on the design, construction and optimization of these building-
blocks in novel configurations, thus to modify existing properties or to create new
ones (53).
Synthetic biology has been applied in a variety of fields, from the incorporation
of unnatural amino acids into proteins (54-58) to the integration of one genome into
another (59-61), or even to the reconstruction of entirely new organisms with
modified genomes (62-64). The successful applications of synthetic biology have
made it an invaluable tool for natural product discovery via redesign and engineering
of biosynthetic pathways and reconstruction of synthetic gene clusters.
Nowadays, de novo synthesis of a biochemical pathway is possible using the
DNA synthesis tools (65). Still, more efforts have been focused on construction and
optimization of an existing biochemical pathway either in a native or a heterologous
host. Pathway engineering can be designed rationally by mixing and matching well-
known, modular parts and modulating gene expression through various control
mechanisms. However, the design at the pathway level is concerned with not only
inclusion of the necessary biological parts such as promoters, genes, and proteins, but
also optimization of the expressed functionality of those parts. Failure to balance the

13
flux in the synthetic pathway will result in a bottleneck and the accumulation of
intermediates (66). One way to balance the flux is through transcription optimization
of the various genes in the pathway. By fusing a library of promoters to the various
enzymes in the isoprenoid production pathway, Pitera and coworkers have managed
to engineer a flux-balanced pathway with improved yield and reduced metabolic
burden (66). These well-characterized families of transcription regulators have
emerged as powerful tools in metabolic engineering as they allow rational
coordination and control of multi-gene expression, thereby decoupling pathway
design from construction (67).
The concept of synthetic biology is still in its infancy. With the enhancement in
the availability and amount of well-characterized individual components, the field
will increasingly provide valuable information for applications in drug discovery,
biotechnology industry and basic biological research. In particular, with the
availability of over 2000 whole genome sequences and advanced biotechnology tools,
a rapid growth in the capabilities of synthetic biology for natural product discovery
will be seen in the near future.
1.4 Polyketides as natural products
1.4.1 Polyketides
Polyketides are a diverse group of natural products with important applications in
medicine and industry. It can be found in a variety of organisms including plants,
fungi, and bacteria, in which they are produced by polyketides synthases (PKSs).
14
Usually, they are not strictly required for the growth, development, or reproduction of
their host organisms, but they perform an important role in both industrial chemical
synthesis and drug discovery. Polyketides are structurally varied and in turn have a
broad range of different biological activities. The diversity of natural polyketides
comes both from the priming acyl-CoAs and elongating acyl-CoAs used, and the
chemical transformations occurring after polyketide synthesis. Polyketide natural
products are known to have antiviral (68), antibacterial (69), and anticancer (70)
activities. Therefore, they are widely used in clinical trials and industry (9). For
example, oxytetracycline serves as a broad-spectrum antibiotic, and it is active against
a wide variety of bacteria. Another antibiotics erythromycin produced by
Saccharopolyspora erythraea, has an antimicrobial spectrum similar to or slightly
wider than that of penicillin, and thus is often prescribed for people who have an
allergy to penicillins. The anticancer drug daunorubicin initially isolated from
Streptomyces peucetius is synthesized by a PKS as well.
1.4.2 Polyketide synthases
Polyketides have diverse structures, which are introduced by different types of
polyketide synthases. Generally, polyketides are derived from acetate and other short
carboxylic acids by sequential decarboxylative condensations in a fashion similar to
fatty acid biosynthesis. There are three types of PKSs known to date. Type I and
type II PKSs are microbial enzymes, whereas type III PKSs are mainly found in
plants (71).

15
Type I PKSs, a group which is further sub-divided into iterative (Figure 1.4A)
and modular type I PKSs (Figure 1.4B), are responsible for the biosynthesis of
complex, largely reduced polyketides, such as macrolides (erythromycin and
avermectin), polyethers (monensin and tetronasin), polyenes (candicidin and nystatin),
and hybrid peptide-polyketide natural products, such as bleomycin, epothilone and
rapamycin. Type I PKSs are made up of a single, very large multi-domain protein that
is structurally organized into modules. Type II PKSs are multi-enzyme systems as
well, but each domain contained in Type II PKSs acts as a free-standing enzyme
(Figure 1.4C). Type III PKSs are small, homodimeric enzymes and represent a single
domain (Figure 1.4D). One to six functional modules can be assembled into one
individual PKS, each consisting of several distinct active sites, for each enzymatic
step. A module is in charge of one cycle of polyketide elongation and the associated
modifications. The order of modules in the PKS enzyme indicates the sequence of
biosynthetic events. Variations of domains within the modules afford the structural
diversity observed in the resultant polyketide products. The growing polyketide
intermediates are tethered to the PKSs via a thioester linkage to the 4'-
phosphopantetheine prosthetic group of the acyl carrier protein (ACP) domain during
the entire elongation process. Thus, the three core domains: β-ketoacyl synthase (KS),
acyltransferase (AT), and ACP, catalyze the C-C elongation, and the accessory
domains, such as ketoreductase, dehydratase, enoyl reductase and methyltransferase,
control the modifications of the growing polyketide intermediates. Once the growing

16
polyketides chain reaches its full length, it is released from the PKS enzyme by a
thioesterase (TE) domain or a discrete amidase to yield the final products (72).
1.5 Project overview
Microorganisms and plants have evolved to produce a myriad array of natural
products that are of biomedical importance (3). This thesis focuses on discovery and
characterization of novel natural products. Throughout my work, I have applied the
above-mentioned tools to natural product biosynthesis and discovery, including: i) use
of genome-mining to identify a target cryptic gene cluster, SGR810-815, from the
sequenced genome of S. griseus; ii) use of synthetic biology to activate the cryptic
SGR810-815 gene cluster from S. griseus in a heterologous host S. lividans, iii)
discovery of novel Type III PKS enzymes by mining biodiversity of medicinal plants;
iv) discovery and characterization of strong actinomycetes promoters.
Chapter 2 describes the characterization of the Type III PKS enzyme EC2 from
Eucalyptus camaldulensis. The overall goal is to identify new Type III PKS enzymes
from bioactive plants. A PCR-based screening method for Type III PKS genes
discovery was created and validated. Two Eucalyptus species were chosen as initial
targets for Type III PKS discovery, including Eucalyptus robusta (16) and Eucalyptus
camaldulensis. Nested degenerate primers were designed based on 14 different plant
Type III PKS and were validated by amplifying PKSs from Hypericum perforatum.
A total of 94 clones and 27 clones were isolated and sequenced from the cDNA
libraries created from the leaves of E. camaldulensis and E. robusta, respectively.
Five unique putative Type III PKSs genes were identified based on the screening

17
method. To further validate the cloned putative Type III PKS fragments, RACE-PCR
(rapid amplification of cDNA ends-polymerase chain reaction) was used to clone the
full-length gene. One full-length gene was successfully cloned. The biochemical
characterization of this enzyme led to the identification of one Type III PKS, which
shares a high sequence identity (75%) with chaclone synthase (CHS) from Medicago
sativa. The generation of naringenin from 4-coumaroyl-CoA and malonyl-CoA was
confirmed. Also, different CoAs as start units were tested but no new reaction was
detected.
Chapter 3 reports the development of a synthetic biology approach for cryptic
pathway activation. As many bioactive natural products are synthesized by non-
ribosomal peptide synthetases (NRPS) and polyketide synthases (PKS) (7,8),
investigation into the unknown compounds synthesized by these two classes of
enzymes may lead to the discovery of novel chemotherapeutic agents. Our motivation
is to develop an efficient approach to decipher the cryptic natural product biosynthetic
pathways. As proof of concept, one cryptic pathway from S. griseus (22), SGR810-
815, containing a PKS/NRPS hybrid gene, was chosen as a model system. BLAST
search indicates that the PKS/NRPS gene shares high sequence identity (63%) with
the one from the heat-stable antifungal factor (HSAF) biosynthetic gene cluster (73)
and 70-80% sequence homology with the recently characterized frontalamide gene
cluster (74). However, the nature of the natural product encoded by the target pathway
is still not clear. To decipher this cluster, we have developed a plug-and-play platform
based on our recently developed “DNA assembler” method (75). In this platform, one

18
constitutive promoter was inserted in front of each gene involved in the pathway.
Then all the resulting DNA products were co-transformed into S. cerevisiae for
assembly into a single DNA molecule in one step based on the yeast homologous
recombination mechanism. Verified constructs were integrated into the genome of S.
lividans for heterologous expression. qPCR data confirmed the increased transcription
levels and HPLC data showed the formation of new compounds. The new compounds
were isolated and purified, and then identified to be polycyclic tetra macrolactams
(PTMs) by mass spectrometric and NMR analysis. The successful activation of the
cryptic pathway proved the power of the synthetic biology approach we developed.
However, for PTM biosynthesis, no clear mechanism has been reported. With the
pathway construction platform we developed, further investigation into the
biosynthesis steps for PTMs was carried out.
Chapter 4 describes the characterization of this PTM biosynthesis pathway by
applying the same synthetic biology approach. In Chapter 3, we used a simple
synthetic biology strategy to activate the cryptic PTM biosynthetic gene cluster
SGR810-815 from S. griseus and identified two putative PTMs. To shed more light
on the biosynthetic logic leading to PTMs, we sought to further exploit the plug-and-
play platform in our synthetic biology strategy to perform genetic manipulations on
this gene cluster. We first identified the boundary of this gene cluster by assembling a
seven-gene construct. Then, we created a series of single-gene deletion and multiple-
gene deletion constructs and characterized a number of intermediates. Noticing that
this one single gene cluster may have the potential to produce multiple products with

19
closely related chemical structures, we biochemically characterized the modification
enzymes in vitro. At the same time, a phylogenetically related pathway has also been
reconstructed to confirm the function of the shared modification enzymes.
Finally, after achieving the success in the applications of our newly developed
natural product discovery platform, we decided to make it more generally applicable
for natural product discovery in actinomycetes. However, because there are only a
few characterized strong constitutive promoters in actinomycetes, we decided to
identify additional strong constitutive promoters needed by our platform. Chapter 5
provides the results on the screening and creation of a strong constitutive promoter
library that could be used in actinomycetes via RNA-seq technique. The Streptomyces
albus J1074 strain is one of the most widely used chassis for the heterologous
production of bioactive natural products (76). S. albus J1074 carries the smallest
genome among the completely sequenced species of the genus Streptomyces and the
fast growth and an efficient genetic system make this strain an attractive model for
expressing cryptic biosynthetic pathways to aid drug discovery (77). The whole
transcriptome of this strain was sequenced at different time points to identify highly
expressed genes in S. albus J1074 under two laboratory culture conditions. The
potential promoter regions from these highly expressed genes were cloned and
integrated to a XylE expression cassette. The strength of the promoters were
characterized based on both the qPCR data and XylE enzyme specific activity assay.
In total, 10 constitutive promoters were identified to be stronger than ermE*p, a
widely used strong promoter reported in literature. These promoters will be used in
20
our genomics-driven, synthetic biology platform for high throughput discovery of
novel natural products in actinomycetes.
1.6 References
1. Corre, C. and Challis, G.L. (2009) New natural product biosynthetic chemistry discovered by genome mining. Nat Prod Rep, 26, 977-986.
2. Newman, D.J. and Cragg, G.M. (2012) Natural products as sources of new drugs over the 30 years from 1981 to 2010. J Nat Prod, 75, 311-335.
3. Newman, D.J. and Cragg, G.M. (2007) Natural products as sources of new drugs over the last 25 years. J Nat Prod, 70, 461-477.
4. Cragg, G.M., Newman, D.J. and Snader, K.M. (1997) Natural products in drug discovery and development. J Nat Prod, 60, 52-60.
5. Li, J.W. and Vederas, J.C. (2009) Drug discovery and natural products: end of an era or an endless frontier? Science, 325, 161-165.
6. Watve, M.G., Tickoo, R., Jog, M.M. and Bhole, B.D. (2001) How many antibiotics are produced by the genus Streptomyces? Arch Microbiol, 176, 386-390.
7. Fischbach, M.A. and Walsh, C.T. (2006) Assembly-line enzymology for polyketide and nonribosomal peptide antibiotics: logic, machinery, and mechanisms. Chem Rev, 106, 3468-3496.
8. McConnell, O.J., Longley, R.E. and Koehn, F.E. (1994) The discovery of marine natural products with therapeutic potential. Biotechnology, 26, 109-174.
9. Weissman, K.J. and Leadlay, P.F. (2005) Combinatorial biosynthesis of reduced polyketides. Nat Rev Microbiol, 3, 925-936.
10. Halberstein, R.A. (2005) Medicinal plants: historical and cross-cultural usage patterns. Ann Epidemiol, 15, 686-699.
11. Zhou, L.G. and Wu, J.Y. (2006) Development and application of medicinal plant tissue cultures for production of drugs and herbal medicinals in China. Nat Prod Rep, 23, 789-810.
12. Wall, M.E. and Wani, M.C. (1995) Camptothecin and taxol: discovery to clinic--thirteenth Bruce F. Cain Memorial Award Lecture. Cancer Res, 55, 753-760.
13. Burns, R.S., Chiueh, C.C., Markey, S.P., Ebert, M.H., Jacobowitz, D.M. and Kopin, I.J. (1983) A primate model of parkinsonism: selective destruction of dopaminergic neurons in the pars compacta of the substantia nigra by N-methyl-4-phenyl-1,2,3,6-tetrahydropyridine. Proc Natl Acad Sci U S A, 80, 4546-4550.
14. Bisht, K., Wagner, K.H. and Bulmer, A.C. (2009) Curcumin, resveratrol and flavonoids as anti-inflammatory, cyto- and DNA-protective dietary compounds. Toxicology.

21
15. Khan, N., Afaq, F. and Mukhtar, H. (2008) Cancer chemoprevention through dietary antioxidants: progress and promise. Antioxid Redox Signal, 10, 475-510.
16. Ghisalberti, E.L. (1996) Bioactive acylphloroglucinol derivatives from Eucalyptus species. Phytochemistry, 41, 7-22.
17. Cox, R.J. (2007) Polyketides, proteins and genes in fungi: programmed nano-machines begin to reveal their secrets. Org Biomol Chem, 5, 2010-2026.
18. Cutler, J.E., Deepe, G.S. and Klein, B.S. (2007) Advances in combating fungal diseases: vaccines on the threshold. Nat Rev Microbiol, 5, 13-28.
19. Hertweck, C., Luzhetskyy, A., Rebets, Y. and Bechthold, A. (2007) Type II polyketide synthases: gaining a deeper insight into enzymatic teamwork. Nat Prod Rep, 24, 162-190.
20. Bentley, S.D., Chater, K.F., Cerdeno-Tarraga, A.M., Challis, G.L., Thomson, N.R., James, K.D., Harris, D.E., Quail, M.A., Kieser, H., Harper, D. et al. (2002) Complete genome sequence of the model actinomycete Streptomyces coelicolor A3(2). Nature, 417, 141-147.
21. Ikeda, H., Ishikawa, J., Hanamoto, A., Shinose, M., Kikuchi, H., Shiba, T., Sakaki, Y., Hattori, M. and Omura, S. (2003) Complete genome sequence and comparative analysis of the industrial microorganism Streptomyces avermitilis. Nat Biotechnol, 21, 526-531.
22. Ohnishi, Y., Ishikawa, J., Hara, H., Suzuki, H., Ikenoya, M., Ikeda, H., Yamashita, A., Hattori, M. and Horinouchi, S. (2008) Genome sequence of the streptomycin-producing microorganism Streptomyces griseus IFO 13350. J Bacteriol, 190, 4050-4060.
23. Challis, G.L. (2008) Genome mining for novel natural product discovery. J Med Chem, 51, 2618-2628.
24. Bergmann, S., Schumann, J., Scherlach, K., Lange, C., Brakhage, A.A. and Hertweck, C. (2007) Genomics-driven discovery of PKS-NRPS hybrid metabolites from Aspergillus nidulans. Nat Chem Biol, 3, 213-217.
25. Gross, H. (2007) Strategies to unravel the function of orphan biosynthesis pathways: recent examples and future prospects. Appl Microbiol Biotechnol, 75, 267-277.
26. Boghigian, B.A. and Pfeifer, B.A. (2008) Current status, strategies, and potential for the metabolic engineering of heterologous polyketides in Escherichia coli. Biotechnol Lett, 30, 1323-1330.
27. Chotani, G., Dodge, T., Hsu, A., Kumar, M., LaDuca, R., Trimbur, D., Weyler, W. and Sanford, K. (2000) The commercial production of chemicals using pathway engineering. Biochim Biophys Acta Protein Struct Mol Enzymol, 1543, 434-455.
28. Dumas, B., Brocard-Masson, C., Assemat-Lebrun, K. and Achstetter, T. (2006) Hydrocortisone made in yeast: metabolic engineering turns a unicellular microorganism into a drug-synthesizing factory. Biotechnol J, 1, 299-307.

22
29. Mutka, S.C., Bondi, S.M., Carney, J.R., Da Silva, N.A. and Kealey, J.T. (2006) Metabolic pathway engineering for complex polyketide biosynthesis in Saccharomyces cerevisiae. FEMS Yeast Res, 6, 40-47.
30. Pfeifer, B.A., Admiraal, S.J., Gramajo, H., Cane, D.E. and Khosla, C. (2001) Biosynthesis of complex polyketides in a metabolically engineered strain of E. coli. Science, 291, 1790-1792.
31. Bull, A.T., Goodfellow, M. and Slater, J.H. (1992) Biodiversity as a source of innovation in biotechnology. Annu Rev Microbiol, 46, 219-252.
32. Davies, J. (1999) Millennium bugs. Trends Biochem Sci, 24, M2-M5. 33. Dernain, A.L. (2006) From natural products discovery to commercialization: a
success story. J Ind Microbiol Biotechnol, 33, 486-495. 34. Leadbetter, J.R. (2003) Cultivation of recalcitrant microbes: cells are alive,
well and revealing their secrets in the 21st century laboratory. Curr Opin Microbiol, 6, 274-281.
35. Pfeifer, B.A. and Khosla, C. (2001) Biosynthesis of polyketides in heterologous hosts. Microbiol Mol Biol Rev, 65, 106-118.
36. Fujii, I. (2009) Heterologous expression systems for polyketide synthases. Nat Prod Rep, 26, 155-169.
37. Katsuyama, Y., Matsuzawa, M., Funa, N. and Horinouchi, S. (2008) Production of curcuminoids by Escherichia coli carrying an artificial biosynthesis pathway. Microbiology, 154, 2620-2628.
38. Horinouchi, S. (2009) Combinatorial biosynthesis of plant medicinal polyketides by microorganisms. Curr Opin Chem Biol, 13, 197-204.
39. Donadio, S., Monciardini, P. and Sosio, M. (2007) Polyketide synthases and nonribosomal peptide synthetases: the emerging view from bacterial genomics. Nat Prod Rep, 24, 1073-1109.
40. Udwary, D.W., Zeigler, L., Asolkar, R.N., Singan, V., Lapidus, A., Fenical, W., Jensen, P.R. and Moore, B.S. (2007) Genome sequencing reveals complex secondary metabolome in the marine actinomycete Salinispora tropica. Proc Natl Acad Sci USA, 104, 10376-10381.
41. Gross, H., Stockwell, V.O., Henkels, M.D., Nowak-Thompson, B., Loper, J.E. and Gerwick, W.H. (2007) The genomisotopic approach: a systematic method to isolate products of orphan biosynthetic gene clusters. Chem Biol, 14, 53-63.
42. Lin, X., Hopson, R. and Cane, D.E. (2006) Genome mining in Streptomyces coelicolor: molecular cloning and characterization of a new sesquiterpene synthase. J Am Chem Soc, 128, 6022-6023.
43. Song, L., Barona-Gomez, F., Corre, C., Xiang, L., Udwary, D.W., Austin, M.B., Noel, J.P., Moore, B.S. and Challis, G.L. (2006) Type III polyketide synthase beta-ketoacyl-ACP starter unit and ethylmalonyl-CoA extender unit selectivity discovered by Streptomyces coelicolor genome mining. J Am Chem Soc, 128, 14754-14755.
44. Hornung, A., Bertazzo, M., Dziarnowski, A., Schneider, K., Welzel, K., Wohlert, S.E., Holzenkampfer, M., Nicholson, G.J., Bechthold, A., Sussmuth, R.D. et al. (2007) A genomic screening approach to the structure-guided

23
identification of drug candidates from natural sources. Chembiochem, 8, 757-766.
45. Hobom, B. (1980) Surgery of genes - at the doorstep of synthetic biology. Med Klin, 75, 14-21.
46. Szybalski, W. and Skalka, A. (1978) Nobel-prizes and restriction enzymes. Gene, 4, 181-182.
47. Alper, H., Cirino, P., Nevoigt, E. and Sriram, G. (2010) Applications of synthetic biology in microbial biotechnology. J Biomed Biotechnol, -.
48. Fagot-Largeault, A., Galperin, C., Gros, F. and Livage, J. (2011) From synthetic chemistry to synthetic biology. Comptes Rendus Chimie, 14, 343-347.
49. Keasling, J.D. (2008) Synthetic biology for synthetic chemistry. ACS Chem Biol, 3, 64-76.
50. Church, G.M., Elowitz, M.B., Smolke, C.D., Voigt, C.A. and Weiss, R. (2014) Realizing the potential of synthetic biology. Nat Rev Mol Cell Biol.
51. Moran, K. and Burson, R. (2009) What's in a name? Nat Biotechnol, 27, 1071-1073.
52. de Lorenzo, V. and Danchin, A. (2008) Synthetic biology: discovering new worlds and new words - the new and not so new aspects of this emerging research field. Embo Reports, 9, 822-827.
53. Leonard, E., Nielsen, D., Solomon, K. and Prather, K.J. (2008) Engineering microbes with synthetic biology frameworks. Trends Biotechnol, 26, 674-681.
54. Anderson, J.C., Wu, N., Santoro, S.W., Lakshman, V., King, D.S. and Schultz, P.G. (2004) An expanded genetic code with a functional quadruplet codon. Proc Natl Acad Sci USA, 101, 7566-7571.
55. Chin, J.W., Cropp, T.A., Anderson, J.C., Mukherji, M., Zhang, Z.W. and Schultz, P.G. (2003) An expanded eukaryotic genetic code. Science, 301, 964-967.
56. Xiao, H., Chatterjee, A., Choi, S.H., Bajjuri, K.M., Sinha, S.C. and Schultz, P.G. (2013) Genetic incorporation of multiple unnatural amino acids into proteins in mammalian cells. Angew Chem Int Ed, 52, 14080-14083.
57. Hancock, S.M., Uprety, R., Deiters, A. and Chin, J.W. (2010) Expanding the genetic code of yeast for incorporation of diverse unnatural amino acids via a pyrrolysyl-tRNA synthetase/tRNA pair. J Am Chem Soc, 132, 14819-14824.
58. Liu, W.S., Brock, A., Chen, S., Chen, S.B. and Schultz, P.G. (2007) Genetic incorporation of unnatural amino acids into proteins in mammalian cells. Nat Methods, 4, 239-244.
59. Itaya, M. (1995) Toward a bacterial genome technology - integration of the Escherichia coli prophage lambda-genome into the Bacillus subtilis 168 Chromosome. Mol Gen Genet, 248, 9-16.
60. Itaya, M., Tsuge, K., Koizumi, M. and Fujita, K. (2005) Combining two genomes in one cell: stable cloning of the Synechocystis PCC6803 genome in the Bacillus subtilis 168 genome. Proc Nat Acad Sci USA, 102, 15971-15976.

24
61. Yonemura, I., Nakada, K., Sato, A., Hayashi, J.I., Fujita, K., Kaneko, S. and Itaya, M. (2007) Direct cloning of full-length mouse mitochondrial DNA using a Bacillus subtilis genome vector. Gene, 391, 171-177.
62. Itaya, M., Fujita, K., Kuroki, A. and Tsuge, K. (2008) Bottom-up genome assembly using the Bacillus subtilis genome vector. Nat Methods, 5, 41-43.
63. Gibson, D.G., Benders, G.A., Andrews-Pfannkoch, C., Denisova, E.A., Baden-Tillson, H., Zaveri, J., Stockwell, T.B., Brownley, A., Thomas, D.W., Algire, M.A. et al. (2008) Complete chemical synthesis, assembly, and cloning of a Mycoplasma genitalium genome. Science, 319, 1215-1220.
64. Gibson, D.G., Benders, G.A., Axelrod, K.C., Zaveri, J., Algire, M.A., Moodie, M., Montague, M.G., Venter, J.C., Smith, H.O. and Hutchison, C.A. (2008) One-step assembly in yeast of 25 overlapping DNA fragments to form a complete synthetic Mycoplasma genitalium genome. Proc Nat Acad Sci USA, 105, 20404-20409.
65. Weeks, A.M. and Chang, M.C.Y. (2011) Constructing de novo biosynthetic pathways for chemical synthesis inside living cells. Biochemistry, 50, 5404-5418.
66. Pitera, D.J., Paddon, C.J., Newman, J.D. and Keasling, J.D. (2007) Balancing a heterologous mevalonate pathway for improved isoprenoid production in Escherichia coli. Metab Eng, 9, 193-207.
67. Bennett, M.R. and Hasty, J. (2009) Overpowering the component problem. Nat Biotechnol, 27, 450-451.
68. Takasaki, M., Konoshima, T., Shingu, T., Tokuda, H., Nishino, H., Iwashima, A. and Kozuka, M. (1990) Structures of euglobal-G1, -G2, and -G3 from Eucalyptus grandis, three new inhibitors of Epstein-Barr virus activation. Chem Pharm Bull (Tokyo), 38, 1444-1446.
69. Yamakoshi, Y., Murata, M., Shimizu, A. and Homma, S. (1992) Isolation and characterization of macrocarpals B--G antibacterial compounds from Eucalyptus macrocarpa. Biosci Biotechnol Biochem, 56, 1570-1576.
70. Yin, S., Xue, J.J., Fan, C.Q., Miao, Z.H., Ding, J. and Yue, J.M. (2007) Eucalyptals A-C with a new skeleton isolated from Eucalyptus globulus. Org Lett, 9, 5549-5552.
71. Hopwood, D.A. (1997) Genetic contributions to understanding polyketide synthases. Chem Rev, 97, 2465-2498.
72. Du, L. and Shen, B. (2001) Biosynthesis of hybrid peptide-polyketide natural products. Curr Opin Drug Discov Devel, 4, 215-228.
73. Yu, F., Zaleta-Rivera, K., Zhu, X., Huffman, J., Millet, J.C., Harris, S.D., Yuen, G., Li, X.C. and Du, L. (2007) Structure and biosynthesis of heat-stable antifungal factor (HSAF), a broad-spectrum antimycotic with a novel mode of action. Antimicrob Agents Chemother, 51, 64-72.
74. Blodgett, J.A., Oh, D.C., Cao, S., Currie, C.R., Kolter, R. and Clardy, J. (2010) Common biosynthetic origins for polycyclic tetramate macrolactams from phylogenetically diverse bacteria. Proc Natl Acad Sci USA, 107, 11692-11697.
25
75. Shao, Z. and Zhao, H. (2009) DNA assembler, an in vivo genetic method for rapid construction of biochemical pathways. Nucleic Acids Res, 37, e16.
76. Baltz, R.H. (2010) Streptomyces and Saccharopolyspora hosts for heterologous expression of secondary metabolite gene clusters. J Ind Microbiol Biotechnol, 37, 759-772.
77. Zaburannyi, N., Rabyk, M., Ostash, B., Fedorenko, V. and Luzhetskyy, A. (2014) Insights into naturally minimised Streptomyces albus J1074 genome. BMC Genomics, 15, 97.
26
1.7 Figures
Erythromycin Aflatoxin B1 Aloesone
S. erythrea A. flavus R.palmatum
Taxol L-DOPA
Taxus brevifolia Mucuna sp.
Figure 1.1 Natural products discovered from bacteria, fungi and plants

27
Figure 1.2 Polyketides and polyketide-terpene adducts from E. robusta.

28
Figure 1.3 Techniques used to activate cryptic pathways.

29
Figure 1.4 Representative structures of PKS enzymes. (a) Iterative Type I PKS, (b) Non-iterative, modular Type I PKS, (c) minimal Type II PKS, and (d) Type III PKS. Domain abbreviations: KS, ketosynthase; AT, acyltransferase; ACP, acyl-carrier protein; KR, ketoreductase; DH, dehydratase; TE, termination

30
Chapter 2 Discovery of New Type III PKS from Bioactive
Plants
2.1 Introduction
Polyketides found in plants include chalcones and stilbenes. The enzymes responsible
for the biosynthesis of these polyketides are classified as polyketide synthases (PKSs). In
most cases, the production of polyketide metabolites in plant species has been traced to
the activity of Type III PKSs. There are three types of PKSs. Type I PKSs are made up of
a single, very large multi-domain protein that is structurally organized into modules.
Type II PKSs are multi-enzyme systems as well, but each domain contained in Type II
PKSs acts as a free-standing enzyme. Type III PKSs are the smallest PKSs and
essentially represent a single domain of the multi-domain Type I or Type II PKS enzymes,
mostly the KS domain. They usually form homodimers and the two independent active
sites of the homodimer act iteratively, catalyzing the sequential condensation of two-
carbon acetate units derived from a malonate thioester into a growing polyketide chain
(1). Although they are simple in structure, they can produce a variety of bioactive
aromatic compounds with single or multi-ring structures.
Medicinal plants have been used for thousands of years in the treatment of numerous
diseases (2). Approximately 25% of today’s medicines are derived from plant natural
products, such as the Taxol used in cancer therapy (3) (Figure 2.1). Overall, natural
products from plants include terpenes, alkaloids, lignans, and polyketides. Many well-
known complementary therapies, such as curcuminoids (curcumin) and flavonoids
(genistein, quercetin, resveratrol) occupied a large portion of the natural products

31
discovered from bioactive plants. They were usually extracted from plant extracts using
newly developed analytical techniques (4,5). For example, the phloroglucinol
components of bioactive plants were generally discovered by analyzing organic solvent
fractions of plant materials (6). Phloroglucinol itself and its derivatives are smooth
muscle relaxants and serve as antispasmodic in clinical use. It is sold in Europe under the
names Spasfon and Spasfon Lyoc. The one used in industry and medicine is synthesized
chemically; however, it has received little attention for bio-production. Searching
databases of scientific literature uncovered a number of target plants across a wide range
of species, we found phloroglucinol and its derivatives were isolated from Acacia
arabica and Euclyptus kino and others (6). In nearly all cases, chemical characterization
of the phloroglucinol natural products was not followed by subsequent characterization of
the producing enzymes. So far, only two acylpholoroglucinol-producing enzymes from
plants have been studied, isovalerophenone synthase from Humulus lupulus (7) and PKS1
from Hypericum perforatum (8). Thus, the genetic materials of plants producing known
phloroglucinol or its derivatives provide rich sources of uncharacterized phloroglucinol
synthase enzymes.
The well-studied plant Type III PKSs are the chalcone synthases (CHSs), which are
involved in the synthesis of precursors of certain pigments. A large number of CHS
family enzymes have been discovered and characterized (9). Based on these CHSs, it
may be possible to isolate new Type III PKS from bioactive plants, such as enzymes that
are capable of synthesizing phloroglucinol or acylphloroglucinol.
The goal of this project is to create a PCR-based screening method using degenerate
primers to identify new Type III PKSs, especially phloroglucinol synthases, from

32
bioactive plants. If no new enzymes are discovered, an enzyme with previously
uncharacterized substrate specificity or new products will also be a valuable discovery. In
this method, degenerate primers are used as probes to mine the plant genetic materials.
Therefore, a validation of the degeneracy of the primers needs to be first carried out to
confirm the efficiency of our degenerate primers. Once this method is validated, future
discovery of new Type III PKSs can be processed and characterization of interesting
enzymes can be performed to determine their substrate and product profiles.
2.2 Results and discussion
2.2.1 Design of the degenerate primers
Detection of genes of interest by PCR is a commonly used strategies in molecular
biology (10). Degenerate primers are used for amplifying a family of unknown genes by
incorporating deoxyinosines in the primer sequence to create the genetic diversity.
Inosine is a natural nucleoside commonly present in transfer RNAs and is able to base
pair with thymidine, cytosine, and, to a less extent, adenine. This strategy has already
been employed for discovery of Type III PKSs, such as the acridone synthase from
Huperzia serrate (11), and the octaketide synthase from Aloe arborescens (12).
Fourteen different enzymes from the plant Type III PKS family were chosen as the
template for design of the degenerate primers. The phylogenetic relationship of these
fourteen enzymes and their main polyketide products are shown in Figure 2.2. The
mRNA sequences coding these enzymes were aligned using ClustalW. From the
sequence alignment, regions sharing high homologies were found and six of them were
chosen to create the degenerate primers. The locations of the three sets of conserved

33
regions, F1, F2, F3, R1, R2 and R3, mapped on the Medicago sativa chalcone synthase 2
(CHS2) gene and protein sequences are shown in Figure 2.3. Three primer sets annealing
at these regions (shown in yellow, green, and pink) amplify three gradually shorter
fragments to perform a nest PCR, with fragment lengths of approximately 800 bp (yellow,
region F1 and R3), 770 bp (green, region F2 and R2), and 400 bp (pink, region F3 and
R1). Nest PCR would help to eliminate the false positives and also enrich the genetic
materials of interest. The core fragments that were ~ 400 bp in length were specially
designed in the region that contained the important residues, such as Thr-197 and Gly-
256. Those residues play an important role in substrate recognition and elongation of a
Type III PKS. In this case, alignment of the resultant core fragments would give insights
into the potential classification of the Type III PKSs. This would help avoiding cloning
and characterizing less desirable enzymes.
2.2.2 Validation of degenerate primers
As the degenerate primers are the first key elements to insure successful
amplification of the desired Type III PKS, Type III PKSs from Hypericum perforatum
are used to validate the degenerate primers. Hypericum perforatum, known as St. John’s
Worts, is a medical plant and its extracts are commonly used for the treatment of mild to
moderate depression (13). Four polyketides, hyperforin, adhyperforin, hyperfricin, and
pseudohypericin are found in this plant and believed to be bioactive (14). Thus,
Hypericum perforatum is ideal to be used as the model system to test the degenerate
primers as it is a medical plant and has a number of PKSs whose sequences are known.
Four Type III PKSs have been cloned from H. perforatum: chalcone synthase,
benzophenone synthase, PKS1, a hyperforin synthase and PKS2, which synthesizes the

34
octaketide precursor to hyperforin, emodin anthrone (15). The primary sequences of these
four enzymes are divergent, so the ~400 bp fragment may be enough to differentiate the
four genes. The validation experiment design is shown in Figure 2.4.
In this study, the genetic materials were collected from the improved strain
Hypericum perforatum var. Topas. Seeds were germinated on Murashige-Skoog media
and grow for four weeks. Total RNA was extracted from immature tissue, purified and
concentrated, and then used to create the cDNA library. One positive control gene, which
synthesizes the RuBisCo (Ribulose-1,5-bisphosphate carboxylase oxygenase), was used
to ensure the successful preparation of mRNA and cDNA library. RuBisco is the most
abundant enzyme in green plants, so it was chosen as the positive control. Specific
primers based on the published mRNA sequence of the four known PKSs (BPS, CHS,
PKS1 and PKS2) were used to amplify the corresponding genes from the cDNA library
(Figure 2.4). The amplified fragments were cloned into pET 26 vectors and confirmed by
sequencing. The identities were greater than 90% versus the templates (BPS, 797/855 nt,
93%; CHS, 1004/1067 nt, 94%; PKS1, 960/981 nt, 97%; PKS2, 1057/1078 nt, 98%).
Then, degenerate primers were used to amplify the Type III PKSs based on a nest PCR
protocol. Basically, PKS-F1/PKS-R3 were used to amplify the ~800 bp fragment and the
resulting product was then used as template for the second round of amplification using
PKS-F2/PKS-R2. The product of the second round of amplification served as the
template for the last round of amplification by PKS-F3/PKS-R1. Product from the third
round of nest PCR can be visible on agarose gel as shown on Figure 2.5.
The fragments were cloned into a vector and 26 colonies were sequenced. The
results showed that out of the 26, some belonged to the CHS and BPS from H.

35
perforatum, and an additional PKS was found. The sequence identity of various clones to
CHS, BPS, PKS1 and PKS2 was shown in Table 2.1.
A BLAST search based on the ~400 nt sequence of the unknown gene fragments
(clones #5 and #8) indicates that it has significant homology to plant CHS and maybe
root specific. Our inability to identify PKS1 and PKS2 may be due to the low expression
level of these two genes, or may be due to the unavailability of these two genes in the
immature plant tissue.
Nonetheless, the validation data confirmed that the degenerate primers were able to
amplify Type III PKS genes from a plant cDNA library. During the degenerate primer
design process, no Type III PKS from H. perforatum was found, which proved that the
degenerate primers designed were able to amplify Type III PKS from general plant
tissues.
2.2.3 Identification of target plants
The target plants were selected based on two criteria: firstly, the plant needs to be
bioactive, evidenced by use in traditional medicine and/or findings of high-valued
compounds reported by scientific journals; secondly, the plant has been reported to
produce phloroglucinol or its derivatives. By searching scientific database, several target
plants have been selected over a wide range of species. Trees of Eucalyptus and ferns of
Dryopteris are two groups of plants in which acylphloroglucinols are particularly
abundant and no relevant genes have been cloned.
Eucalypts produce a wide variety of acylphloroglucinol compounds which may be
formylated or acylphloroglucinol-terpene adducts (e.g. euglobals and macrocarpals) (16).
For example, the compound grandinol, produced by Eucalyptus grandis, is the most-

36
studied acylphloroglucinols. Gradinol serves as a growth regulator in the plants and can
inhibit germination (6). Eucalypt polyketide natural products are also known to be
antiviral, antibacterial, anticancer, and cariostatic (inhibit the growth of bacteria that
cause tooth decay), and Eucalypts have been used by the Aboriginal people of Australia
for the treatment of colds, influenza, toothache, snakebites, fevers, and other ailments
(16). The plant E. camaldulensis, from which the compound phloroglucinol has been
isolated in the past, is an important species to study.
2.2.4 Screening of PKS genes in target plants
Based on the above-mentioned two criteria and literature search, two plants,
Eucalyptus robusta and Eucalyptus camadulensis var. Silverton Province were chosen for
study. E. robusta produces the dimeric and monomeric acylphloroglucinols Robustaol A
and B, respectively, as well as the acylphloroglucinol-terpene adducts Robustadial A and
B. The leaves of E. robusta are used to produce an anti-malarial medicine, “Da Ye An,”
in China, and also to treat bacterial illnesses and dysentery. E. camaldulensis, or red gum,
was chosen as the second target species. It is an abundant tree also known to produce
acylphloroglucinol-terpene adducts.
Specimens of the target plants E. camaldulensis var. Silverton Province and E.
robusta were used for DNA cloning. Briefly, the collected leaf tissue was flash-frozen in
liquid nitrogen and crushed, and total RNA was extracted from the plant tissue and used
to create a cDNA library. This cDNA library was used as the template for nested PCR. At
each stage, PCR products were analyzed by agarose gel electrophoresis, and in the initial
step, an amplification of a fragment of the abundant mRNA for RuBisCo (Ribulose-1,5-
bisphosphate carboxylase oxygenase) was also used as a control. The first and second
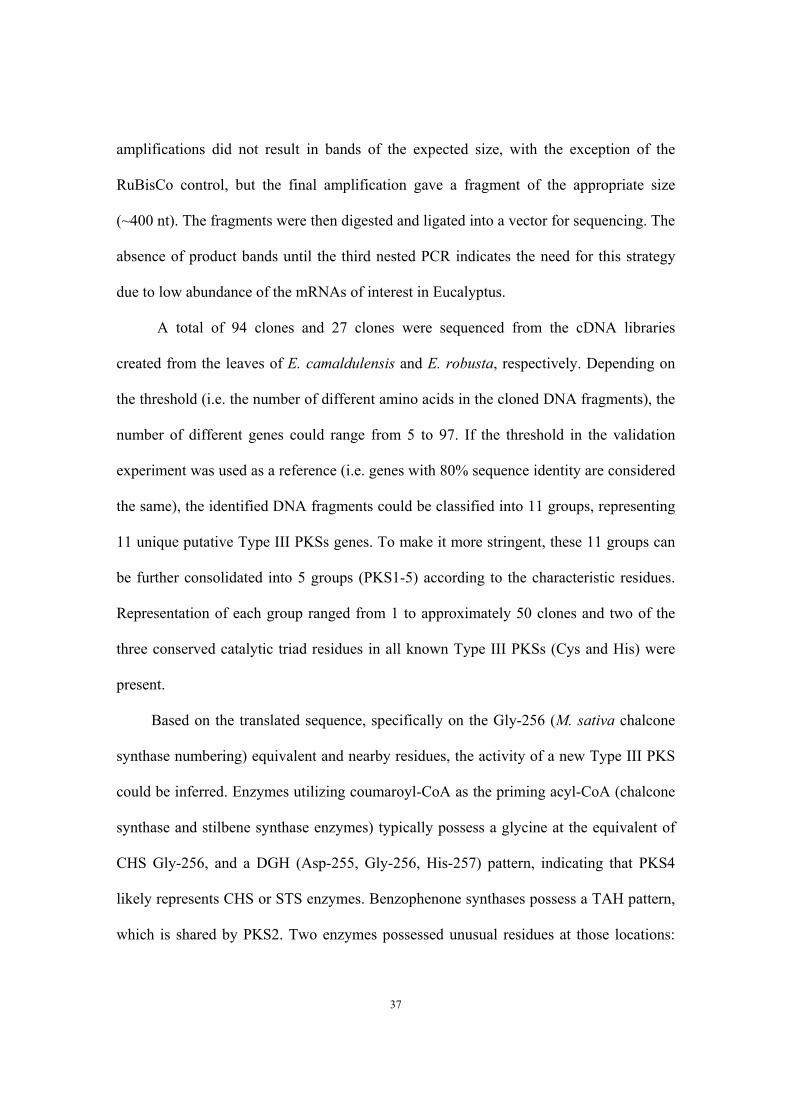
37
amplifications did not result in bands of the expected size, with the exception of the
RuBisCo control, but the final amplification gave a fragment of the appropriate size
(~400 nt). The fragments were then digested and ligated into a vector for sequencing. The
absence of product bands until the third nested PCR indicates the need for this strategy
due to low abundance of the mRNAs of interest in Eucalyptus.
A total of 94 clones and 27 clones were sequenced from the cDNA libraries
created from the leaves of E. camaldulensis and E. robusta, respectively. Depending on
the threshold (i.e. the number of different amino acids in the cloned DNA fragments), the
number of different genes could range from 5 to 97. If the threshold in the validation
experiment was used as a reference (i.e. genes with 80% sequence identity are considered
the same), the identified DNA fragments could be classified into 11 groups, representing
11 unique putative Type III PKSs genes. To make it more stringent, these 11 groups can
be further consolidated into 5 groups (PKS1-5) according to the characteristic residues.
Representation of each group ranged from 1 to approximately 50 clones and two of the
three conserved catalytic triad residues in all known Type III PKSs (Cys and His) were
present.
Based on the translated sequence, specifically on the Gly-256 (M. sativa chalcone
synthase numbering) equivalent and nearby residues, the activity of a new Type III PKS
could be inferred. Enzymes utilizing coumaroyl-CoA as the priming acyl-CoA (chalcone
synthase and stilbene synthase enzymes) typically possess a glycine at the equivalent of
CHS Gly-256, and a DGH (Asp-255, Gly-256, His-257) pattern, indicating that PKS4
likely represents CHS or STS enzymes. Benzophenone synthases possess a TAH pattern,
which is shared by PKS2. Two enzymes possessed unusual residues at those locations:

38
AGH was seen in PKS1, and AAH for PKS5. The translated sequence of PKS3 shows
that it possesses the residues EGQ at the CHS Asp-255, Gly-256, His-257 equivalent
positions. ClustalW alignment of representative translated sequences from each group is
shown in Figure 2.6, and highlights the diversity present among these five putative Type
III PKS enzymes.
2.2.5 Cloning of full length PKS genes using RACE-PCR
To further investigate these putative Type III PKS fragments, RACE-PCR (rapid
amplification of cDNA ends-polymerase chain reaction) was used to clone the full-length
genes encoding the three Eucalyptus Type III PKSs. However, for Pks5, as the amount of
this gene in the cDNA library was so low, the RACE-PCR failed to obtain the 3’- and 5’-
end of this gene. Thus we decided to focus on Pks1 and Pks3. The 3’- and 5’-ends of
these two genes were obtained from RACE-PCR, and specific primers were designed to
obtain the full-length gene. Full-length genes were successfully amplified from the cDNA
library (Figure 2.7). The resulting full-length gene encoding Pks1 consists of 1170
nucleotides, which corresponds to 389 amino acid residues, and the full-length gene
encoding Pks 3 consists of 1182 nucleotides, which corresponds to 408 amino acid
residues. The two full-length genes were sequenced. BLAST search indicates both Pks1
and Pks3 share 75% sequence identity with M. sativa chalcone synthase. Bioinformatic
analysis indicates that the catalytic triad residues (Cys, His, Asn) of Type III PKSs are all
present in this protein. By comparing all the conserved residues in CHSs, including the
catalytic triad: Cys164, His303, Asn336; the active sites: Thr197, Ile254, Gly256, Ser338;
the catalytic site: Met137, Gly211, Gly216, Pro375, and the gate keepers: Phe215,

39
Phe265, it was found that all these residues are conserved in Pks3, while Pks1 has Ile265
instead of Phe265. Therefore, we selected Pks1 for further characterization.
2.2.6 Enzyme characterization and product identification
In order to produce the large quantities of enzymes required for characterization
studies, a heterologous host was needed for over-expression. Escherichia coli was chosen
as the heterologous host. It is widely used for heterologous expression due to its fast
growth, ease of transformation and mature and numerous availability of DNA cloning
tools (17). The pks1 gene with C-terminal His6 was cloned into the IPTG-inducible
pET26b(+) vector, which possesses a PT7 promoter, and expressed as a soluble protein in
E. coli. A PKS1 protein band is clearly visible by SDS-PAGE analysis of purified soluble
lysate from E. coli PKS1 expression. However, the purity was poor, so gel filtration was
used to enhance the purity (Figure 2.8).
At the same time, M. sativa chalcone synthase was cloned and purified to serve as
the positive control. Enzymatic activity assay was carried out as described elsewhere (18).
14 different CoAs were tested as the starter unit whereas malonyl CoA was used as the
extension unit. Several HPLC programs were tested as listed in Table 2.3 and 2.4, and the
highlighted one was chosen for CoA separation and product discovery.
As for M. sativa chalcone synthase, 4-coumaroyl CoA was used as the starter unit
and malonyl CoA as the extension unit. 4-coumaroyl-NAC was chemically synthesized
and used as the starter unit. The chemical structure of 4-coumaroyl-NAC was
confirmed by both LC-MS and NMR (data not shown). Both CHS and Pks1 were
incubated with these two substrates and the expected product peak for naringenin was
detected (Figure 2.9), which indicated that the enzymes were active. However, after

40
testing all possible starter CoAs, no novel product was identified, which indicates that
Pks1 is a member of the CHS family of Type III PKSs and shares the same function as M.
sativa chalcone synthase.
2.3 Conclusion
In this study we developed a PCR-based screening method capable of identifying new
Type III PKSs in medicinal plants. The screening system was successfully validated by
identifying two known Type III PKSs and one unknown Type III PKS from Hypericum
perforatum. Initial results from screening Eucalyptus species have been promising, and
led to the identification of gene fragments from at least five putative Type III PKS
enzymes between E. robusta and E. camaldulensis, including two enzymes which appear
to be conserved in both species. Bioinformatic studies allowed us to identify one putative
benzophenone synthase and three putative chalcone or stilbene synthases. RACE-PCR
was used to obtain the full-length genes encoding two Eucalyptus Type III PKSs,
however, further biochemical characterization showed that Pks1 belongs to the CHS
family and has a same function as M. sativa chalcone synthase.
2.4 Materials and methods
2.4.1 Strains and reagents
E. coli DH5α was obtained from the University of Illinois at Urbana-Champaign
Biochemistry Department's Media Preparation Facility (Urbana, IL). Hypericum
perforatum var. Topas seeds were purchased from Sand Mountain Herbs (Fyffe, AL).
Eucalyptus robusta and Eucalyptus camaldulensis var. Silverton Province plants were
obtained from Windmill Outback Nursery (Louisa, VA). Plasmid pET26b(+) and

41
pET28a(+) were obtained from Novagen (Madison, WI). All restriction endonucleases, as
well as T4 DNA ligase and antarctic phosphatase, were purchased from New England
Biolabs (Beverly, MA). The QIAprep Spin Plasmid Mini-prep Kit, QIAquick PCR
Purification Kit, QIAquick Gel Extraction Kit, and RNeasy MinElute Cleanup Kit were
purchased from Qiagen (Valencia, CA). The Total RNA Isolation Mini Kit was obtained
from Agilent Technologies (Santa Clara, CA). All primers were synthesized by
Integrated DNA Technologies (Coralville, IA). 5 PRIME MasterMix was purchased from
5 PRIME Inc. (Gaithersburg, MD). Unless otherwise noted, all other reagents were
purchased from Sigma-Aldrich (St. Louis, MO).
2.4.2 Degenerate primer design
The mRNA sequences of fourteen enzymes in the plant Type III PKS family were
used as the templates to design degenerate primers: Hypericum androsoemum
benzophenone synthase (BPS), Hordeum vulgare homoeriodictyol/eriodictyol synthase
(HEDS), Medicago sativa chalcone synthase 2 (CHS2), Arachis hypogea stilbene
synthase (STS), Pinus sylvestris stilbene synthase (STS), Gerbera hybrida 2-pyrone
synthase (2-PS), Aloe arborescens octaketide synthase (OKS), Aloe arborescens
pentaketide chromone synthase (PCS), Rheum palmatum aloesone synthase (ALS),
Rheum palmatum benzalacetone synthase (BAS), Humulus lupulus isovalerophenone
synthase (VPS), Hydrangea macrophylla stilbenecarboxylate synthase 1 (STCS1),
Hydrangea macrophylla coumaroyl triacetic acid lactone synthase (CTAS), and Huperzia
serrata acridone synthase (ACS).
The mRNA sequences of the fourteen above enzymes were aligned using the
ClustalW tool in the Biology Workbench suite (http://workbench.sdsc.edu) (19). Highly
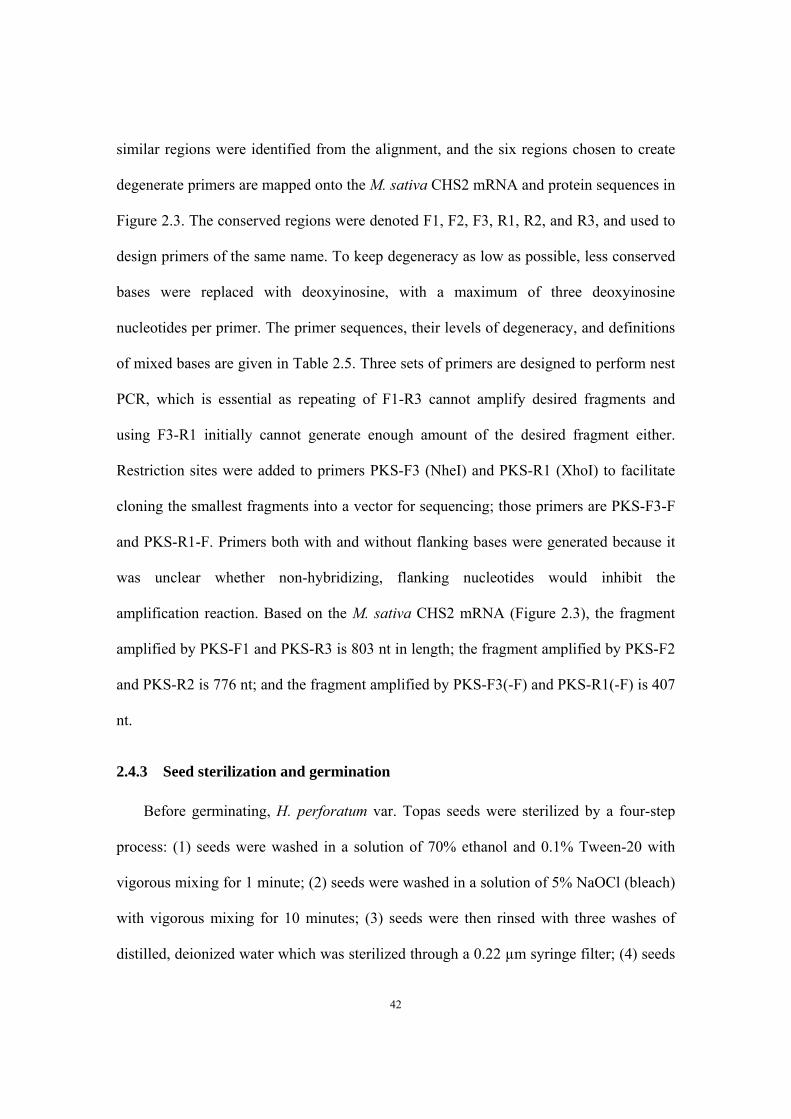
42
similar regions were identified from the alignment, and the six regions chosen to create
degenerate primers are mapped onto the M. sativa CHS2 mRNA and protein sequences in
Figure 2.3. The conserved regions were denoted F1, F2, F3, R1, R2, and R3, and used to
design primers of the same name. To keep degeneracy as low as possible, less conserved
bases were replaced with deoxyinosine, with a maximum of three deoxyinosine
nucleotides per primer. The primer sequences, their levels of degeneracy, and definitions
of mixed bases are given in Table 2.5. Three sets of primers are designed to perform nest
PCR, which is essential as repeating of F1-R3 cannot amplify desired fragments and
using F3-R1 initially cannot generate enough amount of the desired fragment either.
Restriction sites were added to primers PKS-F3 (NheI) and PKS-R1 (XhoI) to facilitate
cloning the smallest fragments into a vector for sequencing; those primers are PKS-F3-F
and PKS-R1-F. Primers both with and without flanking bases were generated because it
was unclear whether non-hybridizing, flanking nucleotides would inhibit the
amplification reaction. Based on the M. sativa CHS2 mRNA (Figure 2.3), the fragment
amplified by PKS-F1 and PKS-R3 is 803 nt in length; the fragment amplified by PKS-F2
and PKS-R2 is 776 nt; and the fragment amplified by PKS-F3(-F) and PKS-R1(-F) is 407
nt.
2.4.3 Seed sterilization and germination
Before germinating, H. perforatum var. Topas seeds were sterilized by a four-step
process: (1) seeds were washed in a solution of 70% ethanol and 0.1% Tween-20 with
vigorous mixing for 1 minute; (2) seeds were washed in a solution of 5% NaOCl (bleach)
with vigorous mixing for 10 minutes; (3) seeds were then rinsed with three washes of
distilled, deionized water which was sterilized through a 0.22 µm syringe filter; (4) seeds

43
were soaked in a solution of Agribrom antifungal dissolved in sterile distilled, deionized
water and incubated in the dark at 4 °C for 48 hours. Subsequently the sterilized seeds
were rinsed in sterile distilled, deionized water, plated on Murashige-Skoog (no sucrose)
plates (Murashige-Skoog basal salts, MES, 0.7% agar, pH 5.7) sealed with gas-permeable
tape (3M, St. Paul, MN) and incubated in a lighted room to induce germination. After
approximately four weeks, seedlings were removed from agar plates and plant tissue was
collected and cDNA prepared as described below.
2.4.4 Collection of plant tissue
Plant tissue (leaf) was cut from live plants and immediately frozen on liquid nitrogen
to prevent degradation of RNA. Frozen tissue was crushed to fine powder using a mortar
and pestle cooled to freezing using liquid nitrogen. Crushed plant tissue was stored at -
80 °C until RNA extraction.
2.4.5 Total RNA isolation and concentration and cDNA synthesis
Total RNA was purified from crushed plant tissue using the Agilent Total RNA
Isolation Mini Kit according to the manufacturer’s instructions. Approximately 100 mg
of plant tissue was used in each RNA purification. To purify and concentrate RNA, the
Qiagen RNeasy MinElute Cleanup Kit was used according to the manufacturer’s
instructions. Total RNA was visualized by agarose gel electrophoresis and concentration
and purity were determined using a NanoDrop (Thermo Fisher Scientific, Waltham, MA).
Purified, concentrated total RNA was used as the template for cDNA synthesis using
Transcriptor II reverse transcriptase enzyme (Invitrogen, Carlsbad, CA) and anchored

44
Oligo-dT20 primer (Invitrogen, Carlsbad, CA) according to the manufacturer’s
instructions.
2.4.6 Screen validation using Hypericum perforatum var. Topas
To verify their expression, full-length genes for H. perforatum CHS, BPS, PKS1, and
PKS2 were amplified from H. perforatum cDNA using the specific primers shown in
Table 2.6 and 5 PRIME MasterMix according to the manufacturer’s instructions (PCR
program: 95 °C, 3 min; [94 °C, 1 min; 50 °C 1 min; 68 °C 1 min 30 sec] x 50; 68 °C, 7
min). PCR products were analyzed by agarose gel electrophoresis and then bands of the
appropriate size were purified by gel purification and extraction. DNA sequencing
reactions were performed using the same primers initially used to amplify the genes
(Table 2.6) and the BigDye Terminator v3.1 Cycle Sequencing Kit (Applied Biosystems,
Foster City, CA) according to the manufacturer’s instructions. DNA was sequenced by
the Biotechnology Core DNA Sequencing Laboratory at the University of Illinois at
Urbana-Champaign (Urbana, IL). Comparing the sequencing results versus published
sequences confirmed that all four PKSs were expressed in the H. perforatum seedlings.
Amplifications with the degenerate primers were performed using the following
PCR program: 95 °C, 3 min; [94 °C, 1 min; 50 °C 1 min; 68 °C 1 min 30 sec] x 50; 68 °C,
7 min. DNA fragments were amplified from cDNA using the primers shown in Table 2.5
and 5 PRIME MasterMix according to the manufacturer’s instructions. Amplification of
the RuBisCo fragment was performed using specific primers for the RuBisCo gene in
conjunction with the first amplification using PKS-F1 and PKS-R3 primers, to verify the
amplification was successful and cDNA was present. For amplifications using cDNA as
the template, 1 µl of cDNA was used; alternatively, 5 µl of PCR product was used as the

45
template for subsequent nested PCR amplifications using primers PKS-F2 and PKS-R2
or PKS-F3-F and PKS-R1-F.
PCR-amplified ~400 nt DNA fragments were cloned into the pET26b(+) vector to
facilitate DNA sequencing. The ~400 nt fragment was digested with NheI and XhoI (10
units enzyme per µg DNA), and the vector was digested with XbaI and XhoI (10 units
enzyme per µg DNA). Note that NheI and XbaI have compatible cohesive ends. After
ligation using T4 DNA ligase, the plasmid was transformed into E. coli DH5α and single
colonies were picked. Presence of an insert of the correct size was verified by colony
PCR. Briefly, cells were collected from 200 µl overnight culture and resuspended in 200
µl sterile distilled, deionized water. The samples were boiled for ten minutes, cooled to
room temperature, and then spun at max speed in a bench top microcentrifuge for three
minutes to pellet cell debris. A PCR amplification using Taq DNA polymerase
(Invitrogen, Carlsbad, CA) was set up according to the manufacturer’s instructions with 5
µl of the soluble cell lysate as template and using primers specific to the T7 promoter and
the T7 terminator. The PCR product was analyzed by agarose gel electrophoresis. A
plasmid with resulting PCR product of size ~500 nt was purified and submitted for DNA
sequencing. Sequencing reactions were performed using primers specific to the T7
terminator and the BigDye Terminator v3.1 Cycle Sequencing Kit. DNA was sequenced
by the Biotechnology Core DNA Sequencing Laboratory at the University of Illinois at
Urbana-Champaign (Urbana, IL).
DNA sequencing of 26 fragments in pET26b(+) identified the ~400 bp fragments as
belonging to the genes for H. perforatum CHS, H. perforatum BPS, and an additional,
previously unknown gene, based on sequence homology (Table 2.1). The other two

46
enzymes, PKS1 and PKS2, were not identified, probably due to lower relative expression
(and thus abundance of mRNA) in the young plants.
2.4.7 Screening Eucalyptus species
Leaf tissue was taken from E. robusta and E. camaldulensis var. Silverton Province
trees (~1.5 m height) for RNA isolation. Collection of plant tissue, RNA isolation, and
cDNA synthesis were completed as described in the sections above. Degenerate primer
nested PCR, cloning of ~400 nt fragments, and DNA sequencing were performed as
described above for H. perforatum. A total of 27 individual clones were submitted for
sequencing from E. robusta and 94 from E. camaldulensis. ClustalW and BLAST
analysis using the Biology Workbench Suite (19) were used to analyze the resulting DNA
and translated protein sequences. Depending on the cut-off (i.e. the number of different
amino acids in the cloned DNA fragments), the number of different Type III PKS genes
ranges from 5 to 97 (Table 2.2). Phylogenetic analysis of all the Type III PKS fragments
is given in Figure 2.10.
2.4.8 RACE PCR
The core fragment of EC2 was subjected to RACE PCR using gene specific primers
(Figure 2.7) and the protocol of 3’/5’ RACE system for Rapid Amplification of cDNA
Ends Kits Version 2.0 (Invitrogen, Carlsbad, CA). The PCR program consists of 94 °C (2
min), 35 cycles at 94 °C (1 min), 55 °C (30s) and 72 °C (2 min), and a final 10 min
extension at 72 °C. A plasmid with resulting PCR product of size ~1000 nt was purified
and submitted for DNA sequencing. Sequencing reactions were performed using primers
specific to the T7 terminator and the BigDye® Terminator v3.1 Cycle Sequencing Kit.

47
2.4.9 Protein purification
Plasmids pET26b(+)-EC2, pET26(+)-ER4 and pET26(+)-CHS were transformed into
E.coli BL21 (DE3) and single colonies were picked and inoculated 5 mL LB containing
50 μg kanamycin mL-1 . Following overnight growth at 37 °C, and this culture was used
to inoculate 500 mL TB containing the appropriate antibiotic, and grown at 37 °C until
the optical density at 600 nm reached 0.8. Protein expression was induced with the
addition of 0.25mM isopropyl-β-D-thiogalactopyranoside (IPTG), and growth was
continued for an additional 18 hours at 20 °C. The flasks were chilled for 30 minutes, and
then the cells were harvested by centrifugation (6000 g, 4 °C, 10 minutes). The resulting
pellet was resuspended in 2 mL lysis buffer (10 mM imidazole, 50 mM sodium
phosphate buffer, 300 mM NaCl, 10 mM imidazole, 15% glycerol, pH 8.0, 1 mg/mL
lysozyme) per gram cell weight and frozen at -80 °C. Subsequently, cells were lysed
using sonication and cellular debris was removed by centrifugation (40,000 g, 4 °C, 10
minutes). Recombinant proteins were purified by chromatography on Ni-NTA resin by
amino-terminal hexahistidine affinity tag. Captured proteins was washed with wash
buffer (20 and 50 mM imidazole, 50 mM sodium phosphate buffer, 300 mM NaCl, 20 or
50 mM imidazole, 15% glycerol, pH 8.0) and finally eluted in elution buffer (200 mM
imidazole, 50 mM sodium phosphate buffer, 300 mM NaCl, 200 mM imidazole, 15%
glycerol, pH 8.0). The protein content of individual elution fractions was estimated using
Quick Start Bradford Protein Assay (Bio-Rad, Hercules, CA) and the appropriate
fractions were pooled and buffer exchanged into 10 mM phosphate buffer pH 7.5
containing 15% glycerol at 4 °C. The protein was concentrated using an Amicon Ultra

48
centrifugal filter device (Millipore, Billerca, MA). Representative SDS-PAGE analysis of
recombinant proteins was shown in Figure 2.8.
2.4.10 SDS-Polyacrylamide Gel Electrophoresis (SDS-PAGE)
Protein standards, Powerpac 300 power supply, Mini-PROTEAN 3 assembly, and
precast acrylamide gels were purchased from Bio-Rad (Hercules, CA). Varying amounts
of sample, dependent upon protein concentration, were mixed with 2 μl SDS-PAGE
loading buffer (30% glycerol, 1% SDS, 0.3% bromophenol blue, 0.5 M Tris-HCl, pH 6.8)
and water to a final volume of 20 μl, Samples were denatured at 98 °C for 10 minutes,
cooled to 4 °C, and then loaded onto a gel in a Bio-Rad Mini-PROTEAN 3 assembly.
Voltage was supplied by a Powerpac 300 power supply at a voltage of 100 V for 100
minutes. Gels were stained with SimplyBlueTM Safestain from Invitrogen (Carlsbad, CA)
followed by destaining overnight in distilled water. Destained SDS-PAGE gels were
scanned subsequently discarded.
2.4.11 Determination of activity
Experiments were conducted according to the method of Mckhann, et al. (18) with
some modifications. The experiments were carried out in triplicates using a range of
different starting CoAs. For each reaction, substrate was incubated with EC2 enzyme (0.5
mg/ml) in PBS buffer (pH 7.5) at 37°C for 15 minutes. Usually, 0.5 μM enzyme is
used and 100 μM malonyl CoA in a total reaction volume of 400 μl. The concentration of
priming acyl-CoA was 10 μl. The reaction mixture was incubated at 37 °C for 5 minutes
before addition of malonyl-CoA. The reaction was quenched by the addition of 20 μl 20%
HCl and kept room temperature until HPLC analysis. The reactions were analyzed using

49
an Agilent 1100 Series HPLC and ZORBAX SB-C18 reverse-phase column (3.0 x 150
mm, 3.5 μm) (Aglient Technologies, Palo Alto, CA) monitoring at 254 nm.
2.4.12 Product HPLC analysis method
Product analysis method was conducted by comparing a series of different HPLC
programs. An Agilent 1100 Series HPLC and ZORBAX SB-C18 reverse-phase column
(3.0 x 150 mm, 3.5 μm) (Aglient Technologies, Palo Alto, CA) were used to monitor at
280 nm and at a flow rate of 0.5 mL/min at 25 °C. Solvent A is water with 1% acetic acid
and solvent B is methanol.
2.5 References
1. Watanabe, K., Praseuth, A.P. and Wang, C.C. (2007) A comprehensive and engaging overview of the type III family of polyketide synthases. Curr Opin Chem Biol, 11, 279-286.
2. Halberstein, R.A. (2005) Medicinal plants: historical and cross-cultural usage patterns. Ann Epidemiol, 15, 686-699.
3. Zhou, L.G. and Wu, J.Y. (2006) Development and application of medicinal plant tissue cultures for production of drugs and herbal medicinals in China. Nat Prod Rep, 23, 789-810.
4. Bisht, K., Wagner, K.H. and Bulmer, A.C. (2009) Curcumin, resveratrol and flavonoids as anti-inflammatory, cyto- and DNA-protective dietary compounds. Toxicology.
5. Khan, N., Afaq, F. and Mukhtar, H. (2008) Cancer chemoprevention through dietary antioxidants: progress and promise. Antioxid Redox Signal, 10, 475-510.
6. Pal Singh, I. and Bharate, S.B. (2006) Phloroglucinol compounds of natural origin. Nat Prod Rep, 23, 558-591.
7. Okada, Y. and Ito, K. (2001) Cloning and analysis of valerophenone synthase gene expressed specifically in lupulin gland of hop (Humulus lupulus L.). Biosci Biotechnol Biochem, 65, 150-155.
8. Bais, H.P., Vepachedu, R., Lawrence, C.B., Stermitz, F.R. and Vivanco, J.M. (2003) Molecular and biochemical characterization of an enzyme responsible for the formation of hypericin in St. John's wort (Hypericum perforatum L.). J Biol Chem, 278, 32413-32422.
9. Austin, M.B. and Noel, J.P. (2003) The chalcone synthase superfamily of type III polyketide synthases. Nat Prod Rep, 20, 79-110.
10. Jabado, O.J., Palacios, G., Kapoor, V., Hui, J., Renwick, N., Zhai, J., Briese, T. and Lipkin, W.I. (2006) Greene SCPrimer: a rapid comprehensive tool for

50
designing degenerate primers from multiple sequence alignments. Nucleic Acids Res, 34, 6605-6611.
11. Wanibuchi, K., Zhang, P., Abe, T., Morita, H., Kohno, T., Chen, G., Noguchi, H. and Abe, I. (2007) An acridone-producing novel multifunctional type III polyketide synthase from Huperzia serrata. FEBS J, 274, 1073-1082.
12. Abe, I., Oguro, S., Utsumi, Y., Sano, Y. and Noguchi, H. (2005) Engineered biosynthesis of plant polyketides: chain length control in an octaketide-producing plant type III polyketide synthase. J Am Chem Soc, 127, 12709-12716.
13. Klingauf, P., Beuerle, T., Mellenthin, A., El-Moghazy, S.A., Boubakir, Z. and Beerhues, L. (2005) Biosynthesis of the hyperforin skeleton in Hypericum calycinum cell cultures. Phytochemistry, 66, 139-145.
14. Butterweck, V. and Schmidt, M. (2007) St. John's wort: role of active compounds for its mechanism of action and efficacy. Wien Med Wochenschr, 157, 356-361.
15. Karppinen, K., Hokkanen, J., Mattila, S., Neubauer, P. and Hohtola, A. (2008) Octaketide-producing type III polyketide synthase from Hypericum perforatum is expressed in dark glands accumulating hypericins. FEBS J, 275, 4329-4342.
16. Ghisalberti, E.L. (1996) Bioactive acylphloroglucinol derivatives from Eucalyptus species. Phytochemistry, 41, 7-22.
17. Makrides, S.C. (1996) Strategies for achieving high-level expression of genes in Escherichia coli. Microbiol Rev, 60, 512-538.
18. McKhann, H.I. and Hirsch, A.M. (1994) Isolation of chalcone synthase and chalcone isomerase cDNAs from alfalfa (Medicago sativa L.): highest transcript levels occur in young roots and root tips. Plant Mol Biol, 24, 767-777.
19. Subramaniam, S. (1998) The Biology Workbench--a seamless database and analysis environment for the biologist. Proteins, 32, 1-2.

51
2.6 Figures and tables
Figure 2.1 Examples of natural products derived from plants.
Artemisinin Quinine Taxol
Grandinol 13
Kosotoxin 14
Dryopteroside
Euglobal III
OHO
OH O
Aspidinol B
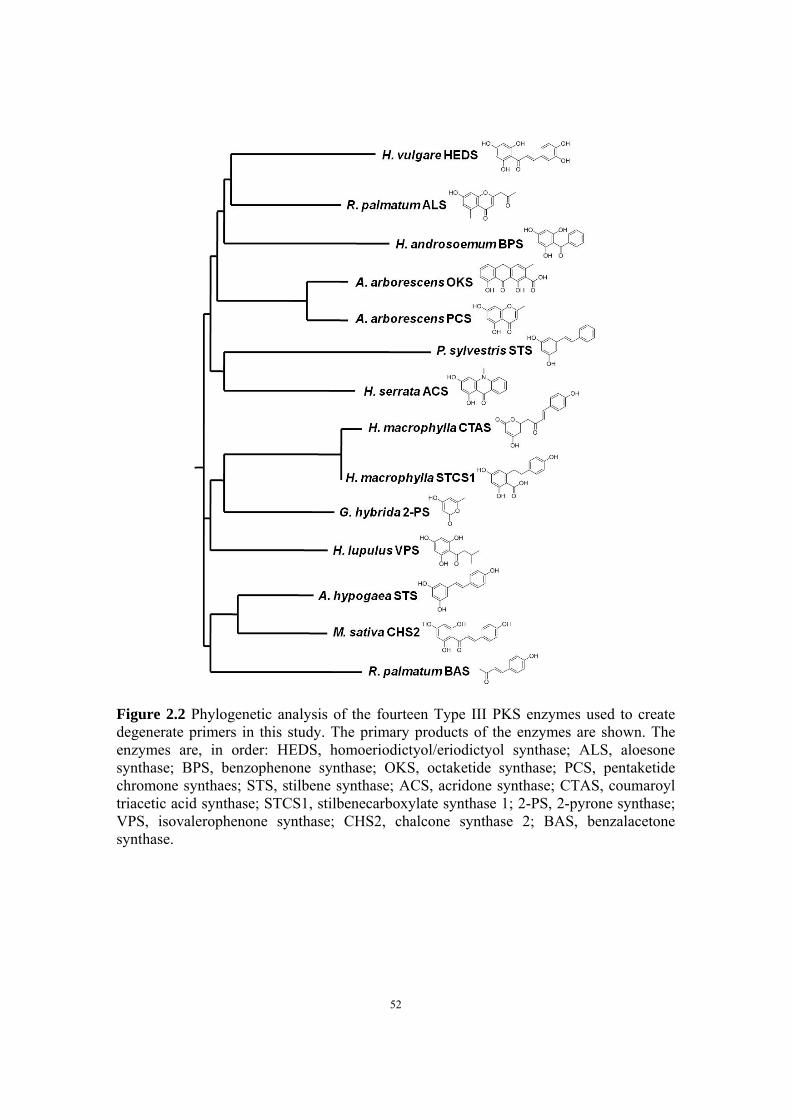
52
Figure 2.2 Phylogenetic analysis of the fourteen Type III PKS enzymes used to create degenerate primers in this study. The primary products of the enzymes are shown. The enzymes are, in order: HEDS, homoeriodictyol/eriodictyol synthase; ALS, aloesone synthase; BPS, benzophenone synthase; OKS, octaketide synthase; PCS, pentaketide chromone synthaes; STS, stilbene synthase; ACS, acridone synthase; CTAS, coumaroyl triacetic acid synthase; STCS1, stilbenecarboxylate synthase 1; 2-PS, 2-pyrone synthase; VPS, isovalerophenone synthase; CHS2, chalcone synthase 2; BAS, benzalacetone synthase.

53
Figure 2.3 Locations of the three sets of conserved regions used to create degenerate primers, mapped onto the M. sativa CHS2 gene and protein, are shown in yellow, green, and pink, corresponding to F1, F2, F3, R1, R2, and R3, respectively. Active site residues Cys-152, His-305, and Asn-338 are shown in red and marked with asterisks. Residues which are known to affect substrate preference and elongation number, Thr-197, Gly-256, and Ser-338, are shown in blue and marked with a triangle.
M V S V S E I R K A Q R A E G P A T I L 1 atggtgagtgtgtctgaaattcgtaaagctcaaagggcagaaggccctgcaactatcttg 60 A I G T A N P A N C V E Q S T Y P D F Y 61 gccattggcactgcaaatccagcaaattgtgttgaacaaagcacttatcctgatttttac 120 F K I T N S E H K T E L K E K F Q R M C 121 tttaaaattacaaatagtgagcacaaaactgaacttaaagagaaatttcagcgcatgtgt 180 D K S M I K R R Y M Y L T E E I L K E N 181 gataaatctatgatcaagaggagatacatgtatctaacagaggagattttgaaagaaaat 240 P N V C E Y M A P S L D A R Q D M V V V 241 ccaaatgtttgtgaatacatggcaccttcattggatgcaaggcaagacatggtggtggta 300 E V P R L G K E A A V K A I K E W G Q P 301 gaggtacctagactagggaaggaggctgcagtgaaggctataaaagaatggggtcaacca 360 K S K I T H L I V C T T S G V D M P G A 361 aagtcaaagattactcacttaatcgtttgcaccacaagtggtgtcgacatgcctggagcc 420 D Y Q L T K L L G L R P Y V K R Y M M Y 421 gattatcaactcaccaaactcttaggtcttcgcccatatgtgaaaaggtacatgatgtac 480 * Q Q G C F A G G T V L R L A K D L A E N 481 caacaagggtgttttgcaggtggcacggtgcttcgtttggctaaagatttggctgagaac 540 ▼ N K G A R V L V V C S E V T A V T F R G 541 aacaaaggtgctcgtgtgttggttgtttgttctgaggtcaccgctgtcacatttcgtggg 600 P S D T H L D S L V G Q A L F G D G A A 601 cctagtgatactcacttggacagccttgttggacaagcactatttggagatggagctgct 660 A L I V G S D P V P E I E K P I F E M V 661 gcactcattgttggttctgatccagtaccagaaattgagaaacctatatttgagatggtt 720 ▼ W T A Q T I A P D S E G A I D G H L R E 721 tggactgcacaaacaattgctcctgatagtgaaggagccattgatggtcaccttcgtgaa 780 A G L T F H L L K D V P G I V S K N I T 781 gctggactaacatttcaccttcttaaagatgttcctgggattgtttcaaagaacatcact 840 K A L V E A F E P L G I S D Y N S I F W 841 aaagcattggttgaggctttcgagccattgggaatttctgattacaactcaatcttttgg 900 * I A H P G G P A I L D Q V E Q K L A L K 901 attgcacatcctggtggacctgcaattctagatcaagtagagcaaaagttagccttaaag 960 * ▼ P E K M N A T R E V L S E Y G N M S S A 961 cctgaaaagatgaatgcaactagagaagtgctaagtgaatatggaaatatgtcaagtgca 1020 C V L F I L D E M R K K S T Q N G L K T 1021 tgtgttttgtttatcttagatgaaatgagaaagaagtcaactcaaaacggattgaagaca 1080 T G E G L E W G V L F G F G P G L T I E 1081 acgggagaaggacttgaatggggtgtattgtttggttttggaccaggacttaccattgaa 1140 T V V L R S V A I * 1141 acagttgttttgcgtagcgtggctatatga 1170

54
Figure 2.4 Overview of the PCR-based method for discovering new Type III PKS genes.

55
a: L Rub CHS PKS1 PKS2 BPS b: L D
Figure 2.5 (a) Gene fragments (~1000 nt) for H. perforatum RuBisCo (Rub), CHS, PKS1, PKS2 and Benzophenone synthase (BPS), amplified by specific primers and analyzed by agarose gel electrophoresis. (b) The nest PCR product from the third round of PCR (~400 nt) from H. perforatum.

56
Figure 2.6 Alignment of Type III PKS fragments from five distinct enzymes discovered in this work. Catalytic histidine residue is marked in red. The CHS Thr-197 and CHS Gly-256 equivalent residues are marked in blue.
PKS1 AKDVAENNKGARVLVVCAEITVCTFRGPTETYLDNLVGQALFGDGASSVIVGSDPVPGV-ERPLYEIVS PKS2 AKDVAENNANARVLVVCAENTAMTFHAPNESHLDVIVGQAMFSDGAAALIIGANPDTAAGERAVFNILS PKS3 AKDVAENNAGARVLVVCSEITVTTFRGPSAENLANLVGQAIFGDGAAALIIGSDPEIPA-ERPIFQLVW PKS4 -KDVAENNKGARVLVVCSEITAVTFRGPSDTHLDSLVGQALFGDGAAALIVGSDPIPEI-ERPLFEMVW PKS5 ----AENNKGARVLVVCSEITAVTFRGPSDTRLDNLVGQALFGDGAAALIVGSDPIPEI-EKPSFEMVW PKS1 TSQTLLP-NSEGAIAGHVREIGLTIHLLKDVPGLISKNVEKNMTEAFHPLGITDWNSLFFIVHPGGTGI PKS2 ASQTIVP-GSDGAITAHFYGMGMSYFLKEDVIPLFRDNIADVMKEAFSPLDVSDWNSLFYSIHPGGPAI PKS3 TAETVLP-NSEGAIEGQLRDVGLTFGLSDGVPHLIANHIEKRLKEAFDSLGISDWNSIFWVPHPGGPAI PKS4 TAQTILP-DSEGAIDGHLREVGLTFHLLKDVPGLISKNIEKALVEAFQPLGISDYNSIFWIAHPGGTAI PKS5 TAQTIFPHDGEDIIAAHFREIGLTIHLHRDIPRLVSKNIEKAMIEAFQPLGISDYNSIFWIAHPGGRGI

57
Figure 2.7 Amplification of the full length gene. The first two lanes used Taq for PCR, and the first one had the stop codon while the second one contained the His-tag. The third and fourth lane used phusion for PCR and same order as the first two.

58
L Pks3 Pks3 after gel filtration
Figure 2.8 Pks3 protein before and after gel filtration.
50kD 30kD

59
Figure 2.9 Detection of naringenin. The peak appeared at 29.786 min showed the production of naringenin.

60
Figure 2.10 Phylogenetic analysis of all the cloned Type III PKS fragments.

61
Table 2.1 Sequence identity (%) of ~400 nt fragments to known H. perforatum PKSs.
# BPS CHS PKS1 PKS2 # BPS CHS PKS1 PKS2
1 94 50 41 38 14 95 48 37 38
2 93 50 43 34 15 54 87 45 43
3 95 52 42 39 16 54 88 46 44
4 55 88 47 43 17 55 87 45 43
5* 55 54 35 30 18 58 80 46 46
6 53 84 44 41 19 70 48 34 43
7 55 81 46 45 20 53 84 45 42
8* 58 49 36 43 21 54 88 46 44
9 54 88 45 44 22 93 52 42 40
10 90 49 35 40 23 94 48 36 38
11 94 51 40 42 24 93 48 32 33
12** - - - - 25 93 49 38 40
13 90 47 32 37 26** 69 45 37 41
*Previously uncharacterized Type III PKS
**Low quality sequencing data.
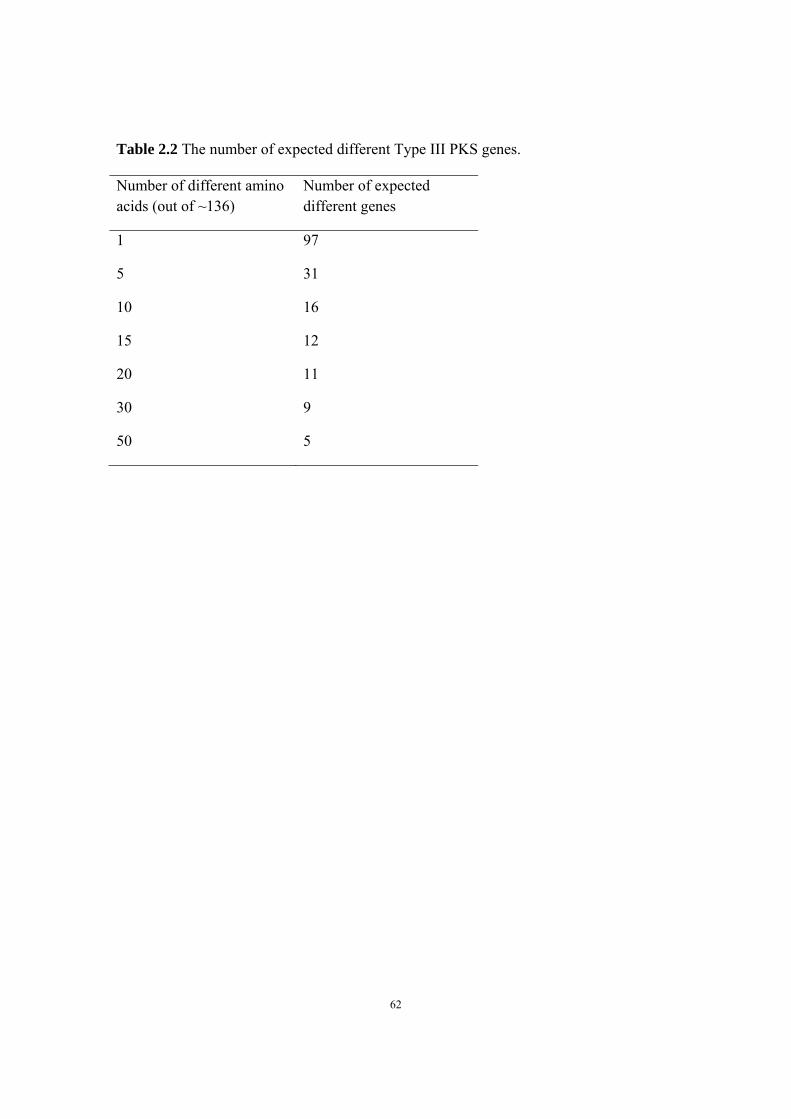
62
Table 2.2 The number of expected different Type III PKS genes. Number of different amino acids (out of ~136)
Number of expected different genes
1 97
5 31
10 16
15 12
20 11
30 9
50 5

63
Table 2.3 HPLC programs tested for CoA separation.

64
Table 2.4 HPLC programs for product discovery.
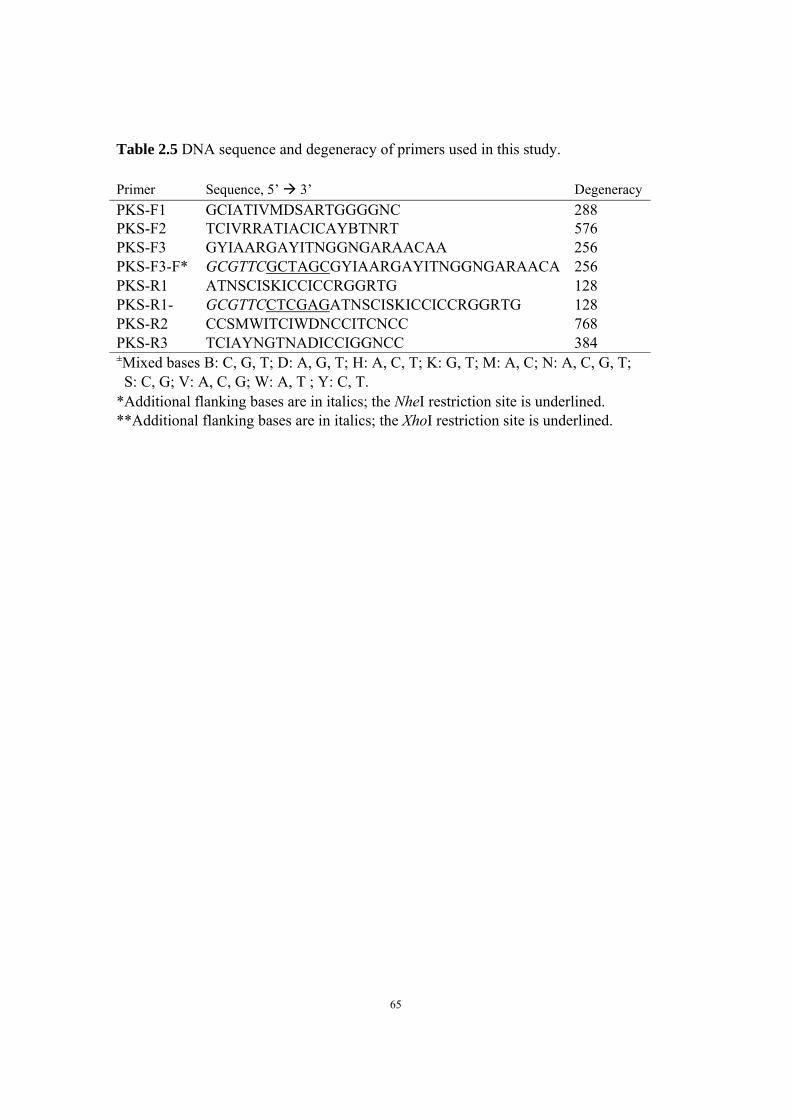
65
Table 2.5 DNA sequence and degeneracy of primers used in this study. Primer Sequence, 5’ 3’ Degeneracy
PKS-F1 GCIATIVMDSARTGGGGNC 288 PKS-F2 TCIVRRATIACICAYBTNRT 576 PKS-F3 GYIAARGAYITNGGNGARAACAA 256 PKS-F3-F* GCGTTCGCTAGCGYIAARGAYITNGGNGARAACA 256 PKS-R1 ATNSCISKICCICCRGGRTG 128 PKS-R1- GCGTTCCTCGAGATNSCISKICCICCRGGRTG 128 PKS-R2 CCSMWITCIWDNCCITCNCC 768 PKS-R3 TCIAYNGTNADICCIGGNCC 384 ±Mixed bases B: C, G, T; D: A, G, T; H: A, C, T; K: G, T; M: A, C; N: A, C, G, T; S: C, G; V: A, C, G; W: A, T ; Y: C, T. *Additional flanking bases are in italics; the NheI restriction site is underlined. **Additional flanking bases are in italics; the XhoI restriction site is underlined.
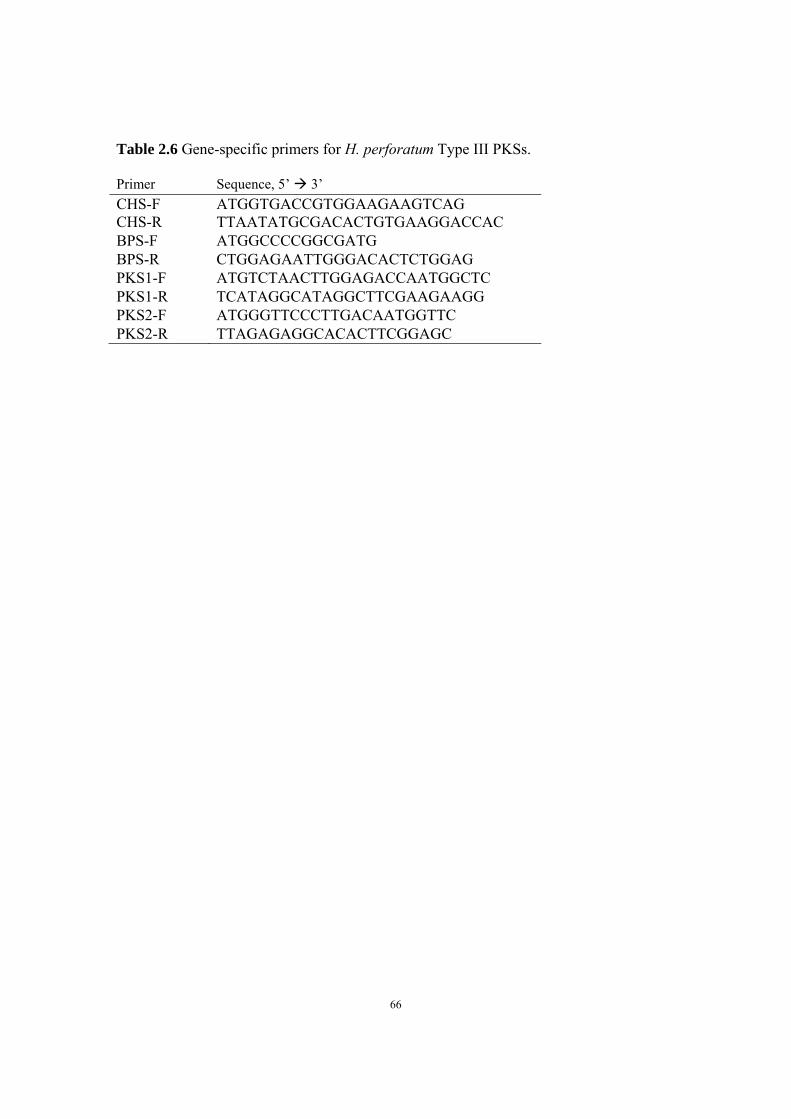
66
Table 2.6 Gene-specific primers for H. perforatum Type III PKSs. Primer Sequence, 5’ 3’
CHS-F ATGGTGACCGTGGAAGAAGTCAG CHS-R TTAATATGCGACACTGTGAAGGACCAC BPS-F ATGGCCCCGGCGATG BPS-R CTGGAGAATTGGGACACTCTGGAG PKS1-F ATGTCTAACTTGGAGACCAATGGCTC PKS1-R TCATAGGCATAGGCTTCGAAGAAGG PKS2-F ATGGGTTCCCTTGACAATGGTTC PKS2-R TTAGAGAGGCACACTTCGGAGC

67
Table 2.7 Gene-specific primers for RACE PCR. Primer Sequence, 5’ 3’
EC2-F1 CGACACCGAGACCTACCTGGACAACC EC2-F2 CGAGTGGGCCAGGCTCTGTTCG EC2-F3 CGATTCGCTAGCGATGGCGCCTCCTCCACC EC2-R1 TTCGCTAGCTGTCCAGGTAGGTCTCG EC2-R2 ACAGAGCCTGGCCCAC EC2-R3 GGTGGAGGAGGCGCCATC
68
Chapter 3 Activation of a Cryptic Biosynthetic Pathway
from Streptomyces griseus via a Synthetic Biology Approach
3.1 Introduction
Microorganisms have evolved to produce a myriad array of natural products of
medical importance. For example, Actinobacteria, especially Streptomycetes, are
prolific sources of bioactive natural products, many of which exhibit important
medical properties (1). It has been estimated that 77% of antibacterial drugs and 78%
of anticancer drugs are natural products or have been derived from natural products
(2). However, since the 1990s the number of newly discovered natural products has
been decreasing. Known compounds are constantly rediscovered, and the discovery of
novel products is hampered due to the lack of screening methods or efficient genetic
manipulation tools. Recent advances in genome sequencing have uncovered numerous
novel natural product gene clusters, the number of which far exceeds the
characterized ones. Such discoveries sparked a renaissance in the field of natural
product discovery, which highlights the untapped biosynthetic potential and metabolic
capabilities of microorganisms.
Genomics-based bottom-up approaches have been developed to unveil new
natural products that were undetected under standard fermentation conditions.
Computational analysis of sequenced genomes and metagenomes has revealed
numerous gene clusters that are potentially involved in the biosynthesis of natural
products. Until now, the genome sequences of ~3000 organisms have been fully

69
determined with many more soon to be completed
(http://www.genomesonline.org/cgi-bin/GOLD/bin/gold.cgi). However, only a small
fraction of this rich genome sequencing data has been exploited. Recently revealed
genome sequencing data clearly showed that the number of pathways coding for
putative valuable natural products largely outnumbers the number of currently known
secondary metabolites for a given organism (3-6). A total of 18 additional gene
clusters involved in secondary metabolite production were discovered from the
complete genome sequence of Streptomyces coelicolor, while the strain was
previously known to produce only four compounds before the S. coelicolor genome
sequencing project (7). In addition, even a larger number of such pathways were
present in the genome mining results of myxobacteria (8,9) and filamentous fungi
(10-12). These gene clusters, for which the corresponding natural metabolites are
unknown, are named as “cryptic pathways” or “orphan pathways” (3,4). Among the
cryptic pathways, non-ribosomal peptide synthetases (NRPS) and polyketide
synthases (PKS) occurred frequently, which were found in the biosynthesis of
numerous bioactive natural products (13,14). Investigation into the unknown
compounds synthesized by these two classes of enzymes may lead to the discovery of
novel chemotherapeutic agents. However, since the widely used DNA cloning
methods for studying biosynthetic pathways are time-consuming and labor-intensive,
our motivation is to develop an efficient approach to decipher the cryptic natural
product biosynthetic pathways.

70
Up to date, two major approaches have been applied to biochemical pathway
characterization and analysis. The first approach mainly focuses on activating native
host genes while the second one takes the advantages of heterologous gene expression
in a well-characterized host (15). The first approach involves screening of different
culture conditions, which somehow helps to activate the cryptic pathway by
introducing activators, environmental factors or remove repressors (4). However, this
approach is usually time-consuming and labor-intensive. Another main drawback is
that even if a pathway is turned on, sometimes, it is still unclear which factor triggers
the activation. Also, most of native producers grow slowly and are not commonly
cultivable in the laboratory. It has been reported that only 1% of bacteria and 5% of
fungi have been cultivated in the laboratory (16-18). On the other hand, the second
approach can avoid these drawbacks since a well-characterized organism typically
grows fast in the laboratory and has abundant genetic tools for engineering. This
approach offers the possibility for metabolic engineering that could enhance the
production of target compounds and for combinatorial biosynthesis that may generate
new derivatives of a target compound. Most important of all, when using a well-
characterized heterologous host with a clear background profile, it will be much easier
for product identification. There are many examples of heterologous expression of
natural products, such as polyketides (19,20), methylenomycin furans (21), and
phosphonic acids (22,23). However, there are limitations for this method as well. It is
difficult to transfer large biosynthetic pathways and it is also not easy to introduce
single/multiple mutations or perform gene deletions. Other problems exist as well,

71
such as low efficiency of promoter recognition, poor gene expression, or low yield (4).
Therefore, the need for novel methods that are suitable for efficient transfer,
expression and modification of target biosynthetic pathways is obvious.
Synthetic biology has emerged as a versatile tool for manipulating genes,
pathways, networks, and whole cells (24). The fundamental idea behind synthetic
biology is that any biological system can be regarded as a combination of individual
functional elements, a limited number of which can be recombined in novel
configurations to modify existing properties or to create new ones (25). As a broad
field, the successful applications of synthetic biology such as synthesis of proteins
that do not exist in nature, design and engineering of signaling and metabolic
pathways, and rebuilding of new organisms make it an invaluable tool for natural
product discovery.
Previously, our laboratory developed a highly efficient method, “DNA assembler”
to rapidly assemble a multiple-gene biochemical pathway in a single-step fashion by
use of the in vivo homologous recombination mechanism in Saccharomyces
cerevisiae (26-32). In this chapter, we further exploited the DNA assembler method to
activate the cryptic PTM biosynthetic gene cluster SGR810-815 from Streptomyces
griseus (33) via a simple synthetic biology strategy and identified four putative PTMs.
We demonstrated that a plug-and-play platform can be very useful for rapid cloning
of a gene cluster and its heterologous expression in a desired organism. This would
solve the problem of introducing large gene clusters into a heterologous host. On the
other hand, as it is easy to perform genetic manipulations by using this method, we

72
can add different strong constitutive promoters in front of each gene in the gene
cluster to control the gene expression. This would eliminate the problem of promoter
recognitions and gene expression compared to heterologous expression alone. Future
work will be focused on study of the biosynthetic mechanisms by performing targeted
gene deletions.
3.2 Results and discussion
3.2.1 Selection of a target gene cluster
As we have mentioned above, the recent increasing availability of whole genome
sequences have revised our view of the metabolic capabilities of microorganisms. A
few cryptic biosynthesis pathways have been identified by bioinformatics study
(4,6,14). These numerous pathways represent a treasure trove, which is likely to grow
exponentially in the future. This will lead to the uncovering of many novel and
possibly bioactive compounds. The few natural products that have been correlated
with their orphan pathways are merely the tip of the iceberg, whilst plenty of natural
products await discovery (4).
The complete genome sequence of Streptomyces griseus IFO 13350 was
determined in 2008 (33). Streptomyces griseus is a soil bacterium producing an
antituberculosis agent, streptomycin, which was discovered more than 60 years ago
and was the first aminoglycoside antibiotic. There are 8,545,929 base pairs (bp) in the
linear chromosome and the average G+C content is 72.2%. It was predicted that there
are 7,138 open reading frames, six rRNA operons (16S-23S-5S), and 66 tRNA genes.

73
It contains extremely long terminal inverted repeats (TIRs) of 132,910 bp each. After
comparisons with the genomes of two related species, Streptomyces coelicolor A3(2)
and Streptomyces avermitilis, not only the characteristics of the S. griseus genome but
also the existence of 24 Streptomyces-specific proteins was clarified. 34 gene clusters
or genes for the biosynthesis of known or unknown secondary metabolites were found
in the S. griseus genome.
As proof of concept, one cryptic biosynthetic pathway from S. griseus, SGR810-
815, containing a PKS/NRPS hybrid gene, was chosen as a model system. BLAST
search indicates that the PKS/NRPS gene shares high homology (63%) with the one
from the heat-stable antifungal factor (HSAF) biosynthetic gene cluster (34,35) and
70-80% sequence homology with the one from the recently characterized
frontalamide gene cluster (36), respectively. Those clusters with high sequence
homology seem to produce structurally similar compounds, called polycyclic
tetramate macrolactams (PTMs) (Figure 3.1).
PTMs contain one tetramic acid and a polycyclic system (usually two to three
rings) fused to macrolactams and exhibit diverse biological activities such as
antifungal, antibiotic and antioxidant properties (34-40). PTMs were previously
isolated from symbionts of marine sponges, such as discodermide, alteramide A and
cylindramide (40). Recently, PTMs have been found in bacteria, such as maltophilin
from Stenotrophomonas maltophilia (41), heat-stable antifungal factor (HSAF) from
Lysobacter enzymogenes (34), as well as ikarugamycin (42), dihydromaltophilin (37)
and frontalamides (36), all from medicinally important Streptomyces species. Most

74
interestingly, Clardy and coworkers found that the PTM biosynthetic gene cluster
from streptomycetes was a common origin for PTM biosynthesis in phylogenetically
diverse bacteria and was conserved in more than 50% of the sequenced Streptomyces
species (43).
One reason why the discovery and characterization of PTM biosynthetic gene
clusters are challenging is because most of the PTM gene clusters remain silent under
typical fermentation conditions either in the native or heterologous host. For example,
after many trials, the frontalamide biosynthetic gene cluster was shown to become
functional only under one specific culture condition (36). Another obstacle is that
most of the native producers are genetically intractable. As a matter of fact, these
challenges are not unique to the PTM biosynthetic gene clusters. Numerous natural
product biosynthetic gene clusters are considered as silent or cryptic. A number of
approaches has been developed to activate silent or cryptic biosynthetic gene clusters,
such as manipulating cell culture parameters (44), expressing the putative pathway-
specific regulator under a well-characterized promoter (45), testing a variety of
heterologous hosts (46) or silencing other major secondary metabolite biosynthetic
gene clusters (47). However, these approaches can only be applied on a case-by-case
basis. To discover and characterize novel PTM biosynthetic gene clusters, a generally
applicable approach capable of activating cryptic gene clusters without specific
tailoring to the gene cluster of interest is highly desirable.
Therefore, we sought to study the uncharacterized PTM gene cluster SGR810-
815 from the sequenced S. griseus (48). This gene cluster contains an evolutionarily

75
conserved hybrid PKS-NRPS gene (SGR814) with a size of approximately 9.5-
kilobases (kb). This PKS-NRPS gene contains DNA sequences encoding nine
domains (KS-AT-DH-KR-ACP-C-A-PCP-TE) and is flanked upstream by a gene
encoding a putative sterol desaturase and downstream by several putative
oxidoreductase genes. We chose this cryptic biosynthesis pathway as a model system
to develop a generally applicable approach for cryptic pathway activation.
3.2.2 Construction of the original pathway via DNA assembler
In principle, DNA assembler can be used to assemble custom-designed DNA
fragments in any desired order by designing PCR primers to generate appropriate
overlaps between the adjacent ones. Usually, a S. cerevisiae helper fragment carrying
a centromere sequence (CEN), an automatic replication sequence (ARS) and a Ura+
selection marker, an E. coli helper fragment carrying a pBR322 ori and a Apr+
selection marker, and a helper fragment carrying an ori and a selection marker
required by the desired organism, are individually prepared. These helper fragments
are mixed with the pathway fragments, and subsequently co-transformed into S.
cerevisiae to be assembled into a single molecule. The transformants are selected on
SC-Ura plates and the assembled circular DNAs are subsequently purified from S.
cerevisiae. The isolated yeast plasmids need to be transformed to E. coli for
enrichment and further verification. Finally, the verified plasmids can be transformed
to the desired heterologous host for expression of the target pathway.
First, we sought to reconstruct the original SGR810-815 biosynthetic pathway
from S. griseus in Streptomyces lividans. To construct a shuttle system carrying the

76
complete SGR810-815 gene cluster and particularly in order to minimize the possible
mutations introduced by PCR, the biosynthetic gene cluster was split into seven
segments with the size of ~4-5 kb each (Table 3.1). 7 pairs of primers were designed
to cover the whole cluster according to the reported genomic sequence of S griseus
and three pairs of primers were designed for amplification of the three helper
fragments and generating overlap regions with the beginning and ending of the target
cluster. The S. cerevisiae helper fragment carrying CEN6, ARS H4 and Ura3
sequences was amplified from a yeast vector. The E. coli helper fragment carrying
oriR6K and accIV sequences was amplified from an E. coli vector, and accIV encodes
for an AprR gene. The S. lividans helper fragment carrying oriT, int, ϕ31 attP and tL3
sequences was amplified from the vector used for recombination with the possible
cluster-containing fosmids in the traditional top-down approach as reported in
literature (22). OriT is the origin of conjugal transfer; int encodes for an integrase; tL3
encodes for a terminator and ϕC31 attP is the junction site for integration into the
ϕC31 site of the chromosome. The construct is shown in Figure 3.2a.
Each of the fragments was individually amplified, gel purified and mixed with
others at the end. After precipitation in ethanol, the mixture was re-dissolved in
ddH2O and co-transformed into S. cerevisiae through electroporation and spread onto
SC-Ura plates. Typically, 30-50 colonies appeared after 2-3 days of incubation at
30 °C, which were then randomly picked for plasmid isolation. 20 colonies were
inoculated in SC-Ura liquid culture and the purified yeast plasmids were individually
transformed to E. coli WM1788 and selected on LB-Apr+ plates. E. coli plasmids

77
were subsequently purified and checked by gel electrophoresis. As a result, 18 out of
the 20 plasmids have a relatively large size (the size of the correctly assembled
plasmid is approximately 36 kb) while the other two are too small to be the desired
plasmid. The 18 plasmids were subjected to restriction digestion by NcoI, ApaLI and
XmnI. 13 of them exhibited an expected digestion pattern, indicating an assembly
efficiency of 65% (Figure 3.3).
The first three verified clones were named as pYL-#1, pYL-#7, and pYL-#18,
respectively, and subsequently introduced into S. lividans via conjugal transfer and
integrated into the ϕC31 site of the genome. The exconjugant integrants were verified
by PCR and checked for potential production of novel natural products.
3.2.3 Product detection for the original cluster in a heterologous host
Traditional extraction methods were applied for product detection according to
the workflow shown in Figure 3.4. However, no product was detected from HPLC.
Later, ammonium sulfate precipitation was performed based on the previously
reported HSAF extraction method (34), as well as the SPE process and YMS plates
extraction from the frontalamide extraction method (36), but still no product was
identified.
3.2.4 Quantitative real-time PCR (qPCR)
As we have confirmed that the whole cluster was correctly reconstituted in the
heterologous host, the first concern was the gene expression issue. Thus, revers-
Transcription PCR was performed to track the gene expression levels. Total RNA was
78
isolated based on the protocol of Total RNA Isolation Mini Kit and cDNA was
synthesized afterwards. In parallel, to eliminate genomic DNA contamination, cDNA
synthesis reaction without reverse transcriptase was carried out to serve as the
negative control. Primers were designed to amplify a ~300 bp fragment for each gene
from the cDNA library. As shown in Figure 3.5, all genes are expressed under the
growth condition.
In order to quantify the gene expression level, quantitative real-time PCR (qPCR)
was employed to track the gene expression level. The hrdB gene (49), an essential
gene of Streptomyces coelicolor A3(2), which indicates the presence of an open
reading frame encoding a putative polypeptide of 442 amino acid (aa) residues with a
molecular weight (Mr) of 48,412, was chosen as the internal control for all following
qPCR experiments and its transcription signal remained comparable in all samples.
The principal sigma-like transcriptional factor of S. coelicolor (HrdB) protein showed
an extensive aa sequence homology with the known principal sigma factors of
Escherichia coli, Bacillus subtilis, Pseudomonas aeruginosa and Myxococcus xanthus
(49). The HrdB protein is the house-keeping protein in Streptomyces strains. The hrdB
gene in S. griseus shows high sequence similarity to the hrdB gene of Streptomyces
coelicolor A3(2) (89.9%) and Streptomyces aureofaciens (88.1%) (50). Due to its
stable and consistent expression level in Streptomyces strains, we chose this gene to
serve as the internal control. Primers for genes in the target cluster were designed by
Real-Time PCR tools on the website of Integrated DNA Technologies (Coralville, IA)
(https://www.idtdna.com/scitools/Applications/RealTimePCR/). Samples were run on

79
the ABI Prism 7900 HT Real-Time Quantitative PCR machine and the results were
analyzed by SDS software. A standard curve was made first for all pair of primers
using genomic DNA of pYL-#18 as the template. One representative example was
shown in Figure 3.6. Real-Time PCR was performed according to a protocol
described elsewhere (51).
In order to obtain stable and consistent data, cells were grown for 4 days and
samples for RNA isolation were collected at different time points, 48 h, 72 h, 96 h and
120 h. The gene expression levels from different time points were compared (Figure
3.7). Overall, all genes were expressed after 72 h and the expression level reaches its
plateau. Therefore, 72 h was chosen as the best time point for collecting cells for total
RNA isolation. However, we found that in the pYL-#18 construct, the expression
levels for all genes were low and not comparable to those of the native producer- S
griseus (SG) (Figure 3.8).
3.2.5 Construction of the ermE*p-construct
After observing the poor gene expression levels from the qPCR results, several
additional constructs were assembled in a similar fashion as mentioned above to
facilitate the natural product discovery. Five different constructs were made for
different purposes. The first one was called ermE-1 (E1 or Ep), which contains an
ermE* promoter in front of the whole gene cluster (Figure 3.2B).
While in the ermE* promoter construct (Ep), all genes were confirmed to be
expressed and the first gene immediately downstream of the ermE* promoter showed
a great increase in the gene expression level, which demonstrated that by adding

80
constitutive promoters, gene expression level can be enhanced (Figure 3.8). It is
obvious to see that after adding constitutive promoter, the expression levels of all
genes have been improved by different extent.
3.2.6 Promoter identification and characterization
Based on the above results, we decided to add different constitutive promoters in
front of each gene in the target cluster. Because the DNA assembler method used for
natural product gene cluster refactor relies on homologous recombination (52,53),
different promoters with low sequence similarity are needed for different genes in
order to increase the gene cluster assembly efficiency. However, few constitutive or
inducible promoters have been characterized in Streptomycetes despite decades of
research, and the reported commonly used promoter is ermE*p (54-56). Therefore,
promoter candidates upstream of 23 housekeeping genes originating from species in
the Actinobacteria class were cloned and analyzed, such as RNA polymerase subunit
α and β, DNA gyrase, elongation factors, RNA polymerase sigma factors, amino-acyl
tRNA synthetase and enzymes in the essential metabolic pathways. From EGFP
confocal microscope analysis, two promoters showed strong activities, gapdhp and
rpsLp (Figure 3.9). Based on this observation, we started to search similar promoters
from other Actinobacteria species. As shown on Figure 3.10, 10 promoters were
highly active in Streptomyces lividans, and six of them were used in the following
work. The sequences of the 6 promoters used in the following work are listed in Table
3.3.

81
3.2.7 Development of a plug-and-play platform
As we have already confirmed that by adding constitutive promoters in front of
a target gene would highly increase the gene expression level, we decided to develop
a simple synthetic biology strategy in which a plug-and-play scaffold is used to
decouple gene cluster expression from native sophisticated regulation cascades
(Scheme 3.1). The key step in this strategy is to use a set of well-characterized
promoters and the DNA assembler method (52,53) to refactor the target cryptic
biosynthetic gene cluster in a genetically tractable heterologous host. The product(s)
will be detected and characterized using analytical chemistry methods such as LC-MS
and NMR or biological activity assays.
We sought to reconstruct the entire gene cluster SGR810-815 by inserting six
constitutive promoters upstream of the SGR genes (reconstructed cluster: RC, Figure
3.2C and D). Two controls, one carrying the intact regulatory elements (original
cluster: OC) and the other containing the ermE*p promoter added upstream of the
whole cluster (Ep), were constructed previously. The gene fragments and the
promoter fragments were PCR amplified and assembled using the DNA assembler
method (53) and the correct constructs were verified by restriction digestions. All
these constructs were integrated into S. lividans for heterologous expression. As
shown in Figure 3.8, all the genes in the reconstructed gene cluster were substantially
transcribed, and the first gene under the rpsLp (Cellulomonas flavigena) promoter
showed an approximately 150-fold higher expression level compared to the internal
control hrdB (57-59). In contrast, the expression levels for most SGR genes in either

82
the native producer (SG) or two control strains were very low. These data confirmed
the silencing of the gene cluster under the typical cultivation conditions, and
suggested that via gene cluster reconstruction, the transcription of each gene in a
cryptic gene cluster could be significantly increased.
3.2.8 Identification of final products
We followed the product extraction method described in literature (36) to isolate
the potential product from the target cluster. By comparing the HPLC profiles of the
negative control (S. lividans without the target gene cluster) and the sample, a
potential product was observed at around 24.1 min and the corresponding mass was
(M+H): 511 (Figure 3.11 and 3.12).
3.2.9 Isolation and characterization of novel PTMs
To determine the chemical structures of these compounds, large-scale cultivation
(equivalent to ~4L liquid culture) of the heterologous host harboring the target
reconstructed gene cluster was carried out to obtain sufficient amounts of these
compounds. High-resolution electrospray ionization mass spectrometry in positive
mode showed an m/z of 511.2807 for compound a [M(C29H38O6N2)+H]+
(calculated: 511.2808) and 511.2781 for compound b [M(C29H38O6N2)+H]+
(calculated: 511.2808). Their corresponding chemical structures (Figure 3.13) were
elucidated by extensive one- and two-dimensional NMR spectroscopy (1H, 13C,
DQCOSY, TOCSY, gHSQC, gHMBC, and NOESY) and MS experiments (Figure
3.14, 3.15, 3.12 and Table 3.4). Key COSY and HMBC correlations were summarized

83
in Figure 3.16. For compound a, the Double-Quantum Filtered COSY (Phase-
sensitive) (DQCOSY) spectrum revealed the spin system, and the heteronuclear
multiple bond correlation (HMBC) supported the coupling of H2 and H3 to C1, as
well as H23 to C19. For compound b, the characteristic C-H coupling constants (C14,
JC-H = 172 Hz and C15, JC-H = 181 Hz, measured using a high resolution coupled
gHSQC) suggested the presence of an epoxide ring (60). All compounds belong to the
group of tetramic acid-containing macrolactam natural products, compound a shares
the same structure as previously reported alteramide A (61) while compound b has
never been reported in literature. The NOESY correlations to confirm the
stereochemistry of compound b were summarized in Figure 3.17. The production of
these novel tetramic acid-containing macrolactams in a heterologous host clearly
confirms the iterative use of the single PKS-NRPS module, which is rare in bacteria.
Moreover, we have cultivated the above-mentioned control strains and the native
producer S. griseus under several different cultivation conditions (MYG liquid or
solid media and YMS liquid or solid media), and the fermentation broths were
extracted and analyzed by HPLC. For the control strains, no distinct difference was
observed compared with the wild type S. lividans. For the native producer, neither
compound a nor compound b could be detected.
3.3 Conclusions
We have successfully activated a silent PTM gene cluster and discovered novel
PTM compounds by fully reconstructing the target gene cluster in a heterologous host.
The production of these novel tetramic acid-containing macrolactams in a

84
heterologous host directly confirms the iterative use of the single PKS-NRPS module,
which is an intriguing feature of this type of enzymes in bacteria. Although this
cluster shares sequence homology with other characterized PTM gene clusters and the
PTMs characterized from these gene clusters all share similar backbones, there are
notable differences in their chemical structures.
It should be noted that the strategy we employed in this study is simple, generally
applicable, and potentially scalable in studying other cryptic natural product gene
clusters. The key innovative aspect of this strategy is the use of the DNA assembler
method to achieve full gene cluster reconstruction for cryptic gene clusters in a single-
step manner. This strategy is distinct from other related strategies such as (1) using
promoter replacement to activate cryptic single genes which focused on single genes
rather than the entire gene cluster, (2) gene-by-gene reassembly in a heterologous host
which used multiple plasmids to reconstruct known gene clusters or performed the
assembly in multiple steps, or (3) use of recombination based systems for gene cluster
activation which directly cloned an entire gene cluster without any reconstruction.
Using the same experimental set-up, this strategy can in principle enable the
activation of many cryptic PTM biosynthetic gene clusters of interest in
Streptomycetes and other Actinomycetes. Moreover, this strategy may be further
modified for activation of cryptic gene clusters from other organisms such as
myxobacteria, cyanobacteria, and fungi as long as appropriate heterologous hosts and
functional promoters can be obtained. For the promoters, strong constitutive
promoters used to drive the expression of each gene in a target gene cluster can be
85
readily identified from the heterologous host by real-time PCR or RNA-seq. It is
noteworthy that due to the plug-and-play nature of the system, a cryptic gene cluster
of interest can be readily reconstructed and the entire process may be fully automated.
With the continually decreasing cost of DNA synthesis, the entire gene cluster may be
reconstructed by using synthetic genes and/or promoters. Finally, this strategy is
much more flexible and versatile for generating gene deletions or additions for
mechanistic studies or creation of novel compounds than traditional combinatorial
biosynthesis approaches. Overall, the synthetic biology approach we developed
represents a new technology platform for discovery and characterization of novel
natural products from sequenced genomes and metagenomes for pharmaceutical and
biotechnological applications.
In order to further demonstrate the versatility of this approach and address the
remaining questions, we plan to carry out the following experiments for mechanistic
studies. New constructs with deletion of genes encoding tailoring enzymes will be
constructed to illustrate the cluster biosynthetic mechanism. If the predictions
regarding the SGR814 activity are correct, then this enzyme would have a unique
ability to catalyze a second round of iterative polyketide synthesis before
condensation with the δ-amino group originating from ornithine. A Dieckmann
cyclization would render the backbone complete, with concomitant product release.
However it remains unclear how the 5,5,6 polycycle of the final compound is formed.
This biosynthetic feature will be solved once we obtain the polyketide intermediates
formed by SGR814. Therefore, we sought to assemble constructs without the tailoring

86
enzymes in order to elucidate the biosynthetic mechanisms more clearly, which will
be the focus of Chapter 4.
3.4 Materials and methods
3.4.1 Strains and reagents
S. cerevisiae YSG50 (MATα, ade2-1, ade3Δ22, ura3-1, his3-11, 15, trp1-1, leu2-
3, 112 and can1-100) was used as the host for DNA assembly and integration. S.
lividans 66 and S. griseus were obtained from the Agricultural Research Service
Culture Collection (Peoria, IL) and E. coli BL21 (DE3) was obtained from Novagen
(Madison, WI). Plasmids pAE4, E. coli strains WM6026 and WM1788 were
developed by the Metcalf group (University of Illinois, Urbana-Champaign). The
pRS426 and pRS416 plasmid (New England Biolabs, Beverly, MA) were modified by
incorporating the hisG and partial δ sequence (δ2) that flank the multiple cloning site
and serve as the vectors for assembly of various pathways. Nalidixic acid and IPTG
were obtained from Sigma-Aldrich (St. Louis, MO). ISP2, agar, beef extract, yeast
extract, malt extract, and other reagents required for cell culture were obtained from
Difco (Franklin Lakes, NJ). All restriction endonucleases, as well as T4 DNA ligase
and antarctic phosphatase, were purchased from New England Biolabs (Beverly, MA).
Phusion DNA polymerase was from Finnzymes (Espoo, Finland). FailsafeTM 2x
premix buffer G was purchased from EPICENTRE Biotechnologies (Madison, WI).
SYBR Green PCR master mix was purchased from Applied Biosystems (San
Francisco, CA). The QIAprep Spin Plasmid Mini-prep Kit, QIAquick PCR

87
Purification Kit, QIAquick Gel Extraction Kit, and RNeasy MinElute Cleanup Kit
were purchased from Qiagen (Valencia, CA). The total RNA was extracted using the
RNeasy Mini Kit (QIAGEN, Valencia, CA). All primers were synthesized by the
Integrated DNA Technologies (Coralville, IA). Yeast YPAD medium-containing 1%
yeast extract, 2% peptone and 2% dextrose supplied with 0.01% adenine
hemisulphate was used to grow S. cerevisiae YSG50 strain. Synthetic complete drop-
out medium lacking uracil (SC-Ura) was used to select transformants containing the
assembled biochemical pathways of interest.
3.4.2 DNA manipulation
S. griseus was grown in liquid MYG medium (4 g/L yeast extract, 10 g/L malt
extract and 4 g/L glucose) at 30 °C with constant shaking (250 rpm) for 2 days. The
genomic DNA was isolated from S. griseus using the Wizard Genomic DNA isolation
kit from Promega (Madison, WI). Pairs of primers were designed with the sequences
shown in Table 3.2. Pathway fragments 1-SG, 2-SG, 3-SG, 4-SG, 5-SG, 6-SG, and 7-
SG were amplified from the genomic DNA of S. griseus. Generally, the PCRs were
carried out in 100 µL reaction mixture consisting of 50 µL FailSafeTM PCR 2xPreMix
G from Epicentre Biotechnologies (Madison, WI), 2.5 pmol of each primer, 1 µL
yeast plasmid or genomic DNA and 2.0 unit Phusion DNA polymerase for 35 cycles
on a PTC-200 Thermal Cycler (MJ Research, Watertown, MA). Each cycle consisted
of 10 s at 98 °C, 30 s at 58 °C and 3 min at 72 °C, with a final extension of 10 min.
The S. cerevisaie helper fragment was amplified from the commercial vector pRS416,
while the E. coli helper fragment and the S. lividans helper fragment were amplified
88
from the Streptomyces-E. coli shuttle vector pAE4. In order to obtain good assembly
efficiency, the overlaps between the pathway fragments were designed to be 400 bp.
We encountered some difficulties in amplifying the S. cerevisaie helper fragment, and
in the end, a sufficient amount of amplification product was only obtained by using a
short pair of primers (Table 3.2). As a result, the S. cerevisaie helper fragment only
overlaps with 7-SG and the E. coli helper fragment with 40 bp. The S. lividans helper
fragment has overlaps of 80 bp with the adjacent E. coli helper fragment and 1-SG.
Following electrophoresis, the PCR products were individually gel-purified from 1.0%
agarose gels using Qiagen Gel Purification kit. For gapdhp(SG) and rpsLp(SG), the
genomic DNA of S. griseus was isolated using the Wizard® Genomic DNA
Purification Kit (Promega, Madison, WI) and then used as the template for PCR
amplification of the two target promoters. Promoters from other hosts were obtained
through primer splicing in which 6-10 overlapping oligonucleotides designed based
on the sequence of each promoter are joined together by overlap extension PCR.
Genes with corresponding promoters were also ligated together by overlap extension
PCR. To ensure high efficiency of yeast homologous recombination, the “promoter
upstream-gene-promoter downstream” cassette was built to generate a ~200 bp
overlap region with adjacent fragments. 100 ng of each individual fragments was
mixed and precipitated with ethanol. The resulting DNA pellet was air-dried and
resuspended in 4 µL Milli-Q double deionized water and subsequently electroporated
into S. cerevisiae using the protocol reported elsewhere (26).

89
3.4.3 Yeast transformation
Yeast transformation was performed by electroporation. YPAD medium (50 mL)
was inoculated with a 0.5 mL overnight S. cerevisiae YSG50 culture and shaken at
30 °C and 250 rpm for 4-5 h until OD600 reached 0.8-1.0. Yeast cells were harvested
by centrifugation at 4 °C and 4000 rpm for 5 min. The supernatant was discarded
and the cell pellet was washed with 50 mL ice-cold Milli-Q double-deionized water,
followed by another wash with cold 1 M sorbitol and finally resuspended in 250 µL
cold sorbitol. An aliquot of 50 µL of yeast cells together with 4 µL DNA mixture was
electroporated in a 0.2 cm cuvette at 1.5 kV. The transformed cells were immediately
mixed with 1 mL room temperature YPAD medium and shaken at 30 °C for 1 h.
Following that, the cells were harvested by centrifugation, washed with room
temperature 1 M sorbitol several times to remove the remaining medium and finally
resuspended in 1 mL sorbitol. Aliquots of 30-50 mL were spread on SC-Ura plates for
the selection of the transformants, and the plates were incubated at 30 °C for 2-4 days
until colonies appeared. Colonies were randomly picked to SC-Ura liquid medium
and grown for 1 day, after which yeast plasmid was isolated using Zymoprep II Yeast
plasmid Miniprep kit (Zymo Research, CA), and genomic DNA was prepared using
Wizard Genomic DNA isolation kit from Promega (Madison, WI).
3.4.4 Verification of the assembled gene clusters
Colonies were randomly picked to SC-Ura liquid media and grown for 2 days,
after which yeast plasmid was isolated using Zymoprep II Yeast plasmid Miniprep kit
(Zymo Research, CA). Yeast plasmids were transformed to E. coli strain WM1788

90
and selected on Luria Broth (LB) agar plates supplemented with 50 µg/ml apramycin.
Colonies were inoculated into 5 mL of LB media supplemented with 50 µg/mL
apramycin, and plasmids were isolated from the liquid culture using the plasmid
miniprep kit from Qiagen. Plasmids isolated from E. coli were then subjected to
restriction digestion by different enzymes, after which the reaction mixtures were
loaded to 0.7% agarose gels to check for the correct restriction digestion pattern by
DNA electrophoresis.
3.4.5 Streptomycete cultivation, RNA extraction and qPCR analysis
A seed culture was grown in MYG medium (10 g/L malt extract, 4 g/L yeast
extract, and 4 g/L glucose) at 30 °C with constant shaking (250 rpm) until saturation,
and inoculated into fresh MYG with a ratio of 1:100. The total RNA was extracted
using the RNeasy Mini Kit (QIAGEN, Valencia, CA). Reverse transcription was
carried out using the First-strand cDNA Synthesis Kit (Roche Applied Science,
Indianapolis, IN). Real-time PCR was performed with SYBR® Green PCR Master
Mix on the 7900HT Fast Real-Time PCR System (Applied Biosystems, Carlsbad,
CA). Primers were designed by the online tool provided by Integrated DNA
Technologies (https://www.idtdna.com/scitools/Applications/RealTimePCR/). 10 μL
of 2× SYBR Green Mix, 1 μL of cDNA, 1 μL of each primer at a concentration of 10
pmol/μL and 7 μl of ddH2O were mixed gently in each well of the Applied
Biosystems® MicroAmp® Optical 96-Well Reaction Plate. Reactions were performed
using the following program: 2 min at 50 °C, 10 min at 95 °C for one cycle followed
by 15 s at 95 °C, 30 s at 60 °C and 30 s at 72 °C for 40 cycles with a final cycle of 10

91
min at 72 °C. The endogenous gene hrdB, encoding the RNA polymerase sigma
factor, was used as the internal control for promoter screening. The expression levels
of other candidate genes were normalized by the expression of the control. Data was
analyzed using SDS2.4 software (Applied Biosystems).
3.4.6 Heterologous expression in S. lividans
The verified clones were transformed to E. coli WM6026 (22) and selected on LB
agar plates supplemented with 19 µg/mL 2,6-diaminopimelic acid and 50 µg/mL
apramycin. These transformants were then used as the donors for conjugative transfer
of the assembled plasmids to S. lividans 66 following the protocol described
elsewhere (22). S. lividans exconjugants were picked and re-streaked on ISP2 plates
supplemented with 50 µg/mL apramycin and grown for 2 days. For the reconstructed
gene cluster SGR810-815, a single colony was inoculated into 20 mL of ATCC172
liquid medium (5 g/L yeast extract, 20 g/L soluble starch, 5 g/L N-Z Amine Type A, 1
g/L CaCO3, and 10 g/L glucose) supplemented with 50 µg/mL apramycin in a 125 mL
shake-flask (3 mm glass beads added to improve liquid mixing and aeration). Aliquots
of this seed culture with a volume of 250 μL were spread for confluence over Petri
dish plates containing approximately 25-30 mL of YMS solid agar medium (4 g/L
yeast extract, 10 g/L malt extract, 4 g/L soluble starch, and 20 g/L Bacto agar) and the
plates were incubated for 7 days at 30 °C.

92
3.4.7 HPLC-MS analysis
To isolate potential compounds, agar and the adherent cells were stored at -80 °C
for 24 h, after which the frozen cultures were thawed completely and the released
liquids were collected. The liquids were extracted by ethyl acetate with a ratio of 1:1
twice, concentrated 1000-fold, and subjected to HPLC analysis. HPLC was performed
on the Agilent 1100 series LC/MSD XCT plus ion trap mass spectrometer with a
Phenomenex Luna C18 reverse-phase column (3.0 x 150 mm, 3.5 μm). HPLC
parameters were as follows: solvent A, 0.1% formic acid in water; solvent B, 0.1%
formic acid in acetonitrile; gradient, 10% B for 5 min, to 100% B in 25 min, maintain
at 100% B for 10 min, return to 10% B in 1 min and finally maintain at 10% B for 9
min; flow rate 0.3 mL/min; detection by UV spectroscopy at 260 nm. Under such
conditions, products are eluted at 26.8 min (compound a), 27.8 min (compound b).
The MS system was operated using a drying temperature of 350 ○C, a nebulizer
pressure of 35 psi, a drying gas flow of 8.5 L/min, and a capillary voltage of 4500 V.
3.4.8 Structure elucidation of compounds a-b
Compounds a and b were isolated by reverse-phase HPLC using a Phenomenex
Luna 10u C18 column (10 mm × 250 mm) on the Agilent 1100 series LC/MSD XCT
with an isocratic solvent of 60% acetonitrile in water with 0.1% formic acid (with a
flow rate of 3 mL/min and a wavelength of 260 nm). The high resolution MS was
performed on a Waters Q-Tof Ultima system (Walters, Milford, MA). All NMR
experiments were carried out on a Varian UNITY INOVA 600 MHz spectrometer,
except for the 13C NMR spectra, which were recorded on a Bruker Avance III 500i
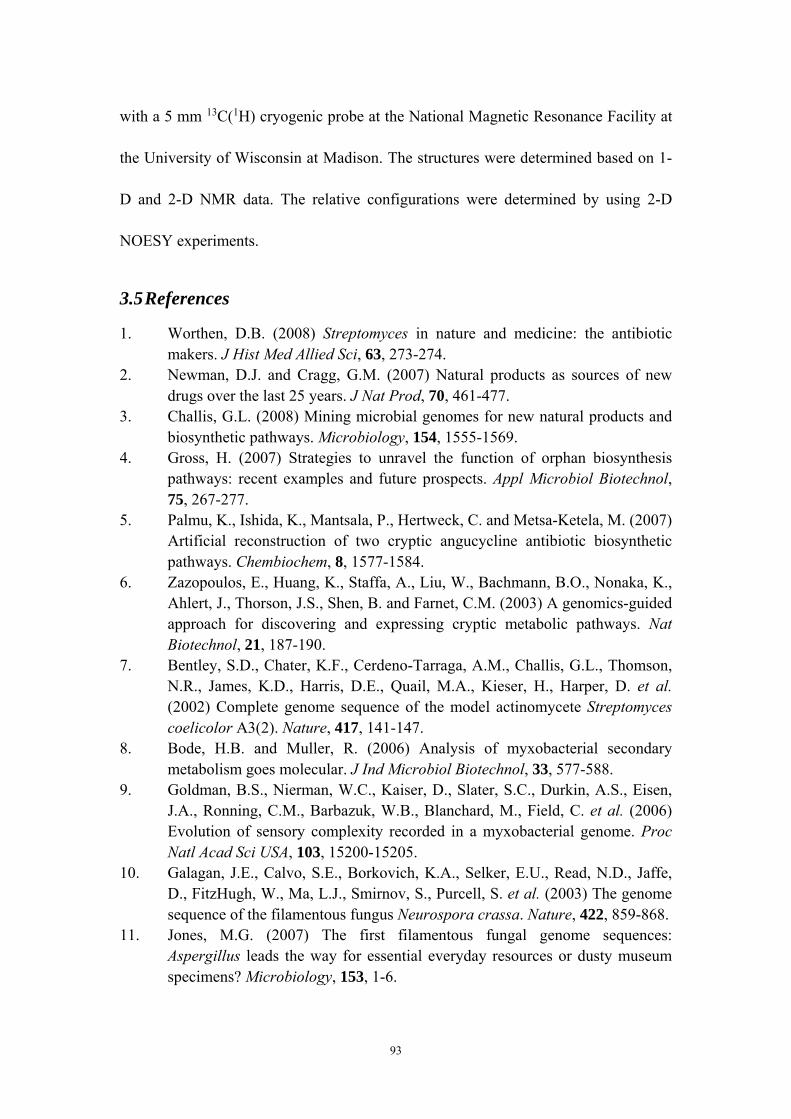
93
with a 5 mm 13C(1H) cryogenic probe at the National Magnetic Resonance Facility at
the University of Wisconsin at Madison. The structures were determined based on 1-
D and 2-D NMR data. The relative configurations were determined by using 2-D
NOESY experiments.
3.5 References
1. Worthen, D.B. (2008) Streptomyces in nature and medicine: the antibiotic makers. J Hist Med Allied Sci, 63, 273-274.
2. Newman, D.J. and Cragg, G.M. (2007) Natural products as sources of new drugs over the last 25 years. J Nat Prod, 70, 461-477.
3. Challis, G.L. (2008) Mining microbial genomes for new natural products and biosynthetic pathways. Microbiology, 154, 1555-1569.
4. Gross, H. (2007) Strategies to unravel the function of orphan biosynthesis pathways: recent examples and future prospects. Appl Microbiol Biotechnol, 75, 267-277.
5. Palmu, K., Ishida, K., Mantsala, P., Hertweck, C. and Metsa-Ketela, M. (2007) Artificial reconstruction of two cryptic angucycline antibiotic biosynthetic pathways. Chembiochem, 8, 1577-1584.
6. Zazopoulos, E., Huang, K., Staffa, A., Liu, W., Bachmann, B.O., Nonaka, K., Ahlert, J., Thorson, J.S., Shen, B. and Farnet, C.M. (2003) A genomics-guided approach for discovering and expressing cryptic metabolic pathways. Nat Biotechnol, 21, 187-190.
7. Bentley, S.D., Chater, K.F., Cerdeno-Tarraga, A.M., Challis, G.L., Thomson, N.R., James, K.D., Harris, D.E., Quail, M.A., Kieser, H., Harper, D. et al. (2002) Complete genome sequence of the model actinomycete Streptomyces coelicolor A3(2). Nature, 417, 141-147.
8. Bode, H.B. and Muller, R. (2006) Analysis of myxobacterial secondary metabolism goes molecular. J Ind Microbiol Biotechnol, 33, 577-588.
9. Goldman, B.S., Nierman, W.C., Kaiser, D., Slater, S.C., Durkin, A.S., Eisen, J.A., Ronning, C.M., Barbazuk, W.B., Blanchard, M., Field, C. et al. (2006) Evolution of sensory complexity recorded in a myxobacterial genome. Proc Natl Acad Sci USA, 103, 15200-15205.
10. Galagan, J.E., Calvo, S.E., Borkovich, K.A., Selker, E.U., Read, N.D., Jaffe, D., FitzHugh, W., Ma, L.J., Smirnov, S., Purcell, S. et al. (2003) The genome sequence of the filamentous fungus Neurospora crassa. Nature, 422, 859-868.
11. Jones, M.G. (2007) The first filamentous fungal genome sequences: Aspergillus leads the way for essential everyday resources or dusty museum specimens? Microbiology, 153, 1-6.

94
12. Pel, H.J., de Winde, J.H., Archer, D.B., Dyer, P.S., Hofmann, G., Schaap, P.J., Turner, G., de Vries, R.P., Albang, R., Albermann, K. et al. (2007) Genome sequencing and analysis of the versatile cell factory Aspergillus niger CBS 513.88. Nat Biotechnol, 25, 221-231.
13. Fischbach, M.A. and Walsh, C.T. (2006) Assembly-line enzymology for polyketide and nonribosomal peptide antibiotics: logic, machinery, and mechanisms. Chem Rev, 106, 3468-3496.
14. McConnell, O.J., Longley, R.E. and Koehn, F.E. (1994) The discovery of marine natural products with therapeutic potential. Biotechnology, 26, 109-174.
15. Baltz, R.H. (2010) Streptomyces and Saccharopolyspora hosts for heterologous expression of secondary metabolite gene clusters. J Ind Microbiol Biotechnol, 37, 759-772.
16. Bull, A.T., Goodfellow, M. and Slater, J.H. (1992) Biodiversity as a source of innovation in biotechnology. Annu Rev Microbiol, 46, 219-252.
17. Dernain, A.L. (2006) From natural products discovery to commercialization: a success story. J Ind Microbiol Biotechnol, 33, 486-495.
18. Leadbetter, J.R. (2003) Cultivation of recalcitrant microbes: cells are alive, well and revealing their secrets in the 21st century laboratory. Curr Opin Microbiol, 6, 274-281.
19. Li, C., Roege, K.E. and Kelly, W.L. (2009) Analysis of the indanomycin biosynthetic gene cluster from Streptomyces antibioticus NRRL 8167. Chembiochem, 10, 1064-1072.
20. Wenzel, S.C., Bode, H.B., Kochems, I. and Muller, R. (2008) A type I/type III polyketide synthase hybrid biosynthetic pathway for the structurally unique ansa compound kendomycin. Chembiochem, 9, 2711-2721.
21. Corre, C., Song, L., O'Rourke, S., Chater, K.F. and Challis, G.L. (2008) 2-Alkyl-4-hydroxymethylfuran-3-carboxylic acids, antibiotic production inducers discovered by Streptomyces coelicolor genome mining. Proc Natl Acad Sci USA, 105, 17510-17515.
22. Woodyer, R.D., Shao, Z., Thomas, P.M., Kelleher, N.L., Blodgett, J.A., Metcalf, W.W., van der Donk, W.A. and Zhao, H. (2006) Heterologous production of fosfomycin and identification of the minimal biosynthetic gene cluster. Chem Biol, 13, 1171-1182.
23. Eliot, A.C., Griffin, B.M., Thomas, P.M., Johannes, T.W., Kelleher, N.L., Zhao, H. and Metcalf, W.W. (2008) Cloning, expression, and biochemical characterization of Streptomyces rubellomurinus genes required for biosynthesis of antimalarial compound FR900098. Chem Biol, 15, 765-770.
24. French, C.E. (2009) Synthetic biology and biomass conversion: a match made in heaven? J R Soc Interface, 6, -.
25. Keasling, J.D. (2008) Synthetic biology for synthetic chemistry. ACS Chem Biol, 3, 64-76.
26. Shao, Z. and Zhao, H. (2009) DNA assembler, an in vivo genetic method for rapid construction of biochemical pathways. Nucleic Acids Res, 37, e16.

95
27. Gunyuzlu, P.L., Hollis, G.F. and Toyn, J.H. (2001) Plasmid construction by linker-assisted homologous recombination in yeast. Biotechniques, 31, 1246, 1248, 1250.
28. Ma, H., Kunes, S., Schatz, P.J. and Botstein, D. (1987) Plasmid construction by homologous recombination in yeast. Gene, 58, 201-216.
29. Oldenburg, K.R., Vo, K.T., Michaelis, S. and Paddon, C. (1997) Recombination-mediated PCR-directed plasmid construction in vivo in yeast. Nucleic Acids Res, 25, 451-452.
30. Raymond, C.K., Pownder, T.A. and Sexson, S.L. (1999) General method for plasmid construction using homologous recombination. Biotechniques, 26, 134-+.
31. Raymond, C.K., Sims, E.H. and Olson, M.V. (2002) Linker-mediated recombinational subcloning of large DNA fragments using yeast. Genome Res, 12, 190-197.
32. Schaerer-Brodbeck, C. and Barberis, A. (2004) Coupling homologous recombination with growth selection in yeast: a tool for construction of random DNA sequence libraries. Biotechniques, 37, 202-+.
33. Ohnishi, Y., Ishikawa, J., Hara, H., Suzuki, H., Ikenoya, M., Ikeda, H., Yamashita, A., Hattori, M. and Horinouchi, S. (2008) Genome sequence of the streptomycin-producing microorganism Streptomyces griseus IFO 13350. J Bacteriol, 190, 4050-4060.
34. Yu, F.G., Zaleta-Rivera, K., Zhu, X.C., Huffman, J., Millet, J.C., Harris, S.D., Yuen, G., Li, X.C. and Du, L.C. (2007) Structure and biosynthesis of heat-stable antifungal factor (HSAF), a broad-spectrum antimycotic with a novel mode of action. Antimicrob Agents Chemother, 51, 64-72.
35. Lou, L., Qian, G., Xie, Y., Hang, J., Chen, H., Zaleta-Rivera, K., Li, Y., Shen, Y., Dussault, P.H., Liu, F. et al. (2011) Biosynthesis of HSAF, a tetramic acid-containing macrolactam from Lysobacter enzymogenes. J Am Chem Soc, 133, 643-645.
36. Blodgett, J.A., Oh, D.C., Cao, S., Currie, C.R., Kolter, R. and Clardy, J. (2010) Common biosynthetic origins for polycyclic tetramate macrolactams from phylogenetically diverse bacteria. Proc Natl Acad Sci USA, 107, 11692-11697.
37. Graupner, P.R., Thornburgh, S., Mathieson, J.T., Chapin, E.L., Kemmitt, G.M., Brown, J.M. and Snipes, C.E. (1997) Dihydromaltophilin; a novel fungicidal tetramic acid containing metabolite from Streptomyces sp. J Antibiot (Tokyo), 50, 1014-1019.
38. Jakobi, M., Winkelmann, G., Kaiser, D., Kempler, C., Jung, G., Berg, G. and Bahl, H. (1996) Maltophilin: a new antifungal compound produced by Stenotrophomonas maltophilia R3089. J Antibiot (Tokyo), 49, 1101-1104.
39. Schobert, R. and Schlenk, A. (2008) Tetramic and tetronic acids: an update on new derivatives and biological aspects. Bioorg Med Chem, 16, 4203-4221.
40. Royles, B.J.L. (1995) Naturally-occurring tetramic acids - structure, isolation, and synthesis. Chem Rev, 95, 1981-2001.

96
41. Jakobi, M., Winkelmann, G., Kaiser, D., Kempter, C., Jung, G., Berg, G. and Bahl, H. (1996) Maltophilin: A new antifungal compound produced by Stenotrophomonas maltophilia R3089. J Antibiot (Tokyo), 49, 1101-1104.
42. Jomon, K., Kuroda, Y., Ajisaka, M. and Sakai, H. (1972) A new antibiotic, ikarugamycin. J Antibiot (Tokyo), 25, 271-280.
43. Blodgett, J.A.V., Oh, D.C., Cao, S.G., Currie, C.R., Kolter, R. and Clardy, J. (2010) Common biosynthetic origins for polycyclic tetramate macrolactams from phylogenetically diverse bacteria. Proc Natl Acad Sci USA, 107, 11692-11697.
44. Brakhage, A.A., Schuemann, J., Bergmann, S., Scherlach, K., Schroeckh, V. and Hertweck, C. (2008) Activation of fungal silent gene clusters: a new avenue to drug discovery. Prog Drug Res, 66, 1, 3-12.
45. Bergmann, S., Schumann, J., Scherlach, K., Lange, C., Brakhage, A.A. and Hertweck, C. (2007) Genomics-driven discovery of PKS-NRPS hybrid metabolites from Aspergillus nidulans. Nat Chem Biol, 3, 213-217.
46. Baltz, R.H. (2010) Streptomyces and Saccharopolyspora hosts for heterologous expression of secondary metabolite gene clusters. Journal of Industrial Microbiology & Biotechnology, 37, 759-772.
47. Komatsu, M., Uchiyama, T., Omura, S., Cane, D.E. and Ikeda, H. (2010) Genome-minimized Streptomyces host for the heterologous expression of secondary metabolism. Proc Natl Acad Sci USA, 107, 2646-2651.
48. Ohnishi, Y., Ishikawa, J., Hara, H., Suzuki, H., Ikenoya, M., Ikeda, H., Yamashita, A., Hattori, M. and Horinouchi, S. (2008) Genome sequence of the streptomycin-producing microorganism Streptomyces griseus IFO 13350. Journal of Bacteriology, 190, 4050-4060.
49. Shiina, T., Tanaka, K. and Takahashi, H. (1991) Sequence of hrdB, an essential gene encoding sigma-like transcription factor of Streptomyces coelicolor A3(2): homology to principal sigma factors. Gene, 107, 145-148.
50. Shinkawa, H., Hatada, Y., Okada, M., Kinashi, H. and Nimi, O. (1995) Nucleotide sequence of a principal sigma factor gene (hrdB) of Streptomyces griseus. J Biochem, 118, 494-499.
51. Wang, X. and Seed, B. (2003) A PCR primer bank for quantitative gene expression analysis. Nucleic Acids Res, 31, e154.
52. Shao, Z., Luo, Y. and Zhao, H. (2011) Rapid characterization and engineering of natural product biosynthetic pathways via DNA assembler. Mol Biosyst, 7, 1056-1059.
53. Shao, Z. and Zhao, H. (2009) DNA assembler, an in vivo genetic method for rapid construction of biochemical pathways. Nucleic Acids Research, 37, e16.
54. Wagner, N., Osswald, C., Biener, R. and Schwartz, D. (2009) Comparative analysis of transcriptional activities of heterologous promoters in the rare actinomycete Actinoplanes friuliensis. J Biotechnol, 142, 200-204.
55. Schmitt-John, T. and Engels, J.W. (1992) Promoter constructions for efficient secretion expression in Streptomyces lividans. Appl Microbiol Biotechnol, 36, 493-498.

97
56. Bibb, M.J., Janssen, G.R. and Ward, J.M. (1985) Cloning and analysis of the promoter region of the erythromycin resistance gene (ermE) of Streptomyces erythraeus. Gene, 38, 215-226.
57. Kim, S.H., Lee, H.N., Kim, H.J. and Kim, E.S. (2011) Transcriptome analysis of an antibiotic downregulator mutant and synergistic Actinorhodin stimulation via disruption of a precursor flux regulator in Streptomyces coelicolor. Appl Environ Microbiol, 77, 1872-1877.
58. Gomez, C., Horna, D.H., Olano, C., Palomino-Schatzlein, M., Pineda-Lucena, A., Carbajo, R.J., Brana, A.F., Mendez, C. and Salas, J.A. (2011) Amino acid precursor supply in the biosynthesis of the RNA polymerase inhibitor streptolydigin by Streptomyces lydicus. J Bacteriol, 193, 4214-4223.
59. Nieselt, K., Battke, F., Herbig, A., Bruheim, P., Wentzel, A., Jakobsen, O.M., Sletta, H., Alam, M.T., Merlo, M.E., Moore, J. et al. (2010) The dynamic architecture of the metabolic switch in Streptomyces coelicolor. BMC Genomics, 11, 10.
60. Kalinowski, H., Berger, S. and Braun, S. (1988) Carbon-13 NMR spectroscopy. John Wiley and Sons, New York.
61. Shigemori, H., Bae, M.A., Yazawa, K., Sasaki, T. and Kobayashi, J. (1992) Alteramide-a, a new tetracyclic alkaloid from a bacterium-Alteromonas Sp associated with the marine sponge Halichondria-Okadai. J Org Chem, 57, 4317-4320.

98
3.6 Figures and tables
Figure 3.1 Chemical structures of known PTMs.
discodermide alteramide A
cylindramide
maltophilin HSAF ikarugamycin
frontalamide A frontalamide B

99
Figure 3.2 Different constructs assembled by DNA assembler. (a) The cryptic biosynthetic cluster from S. griseus including the upstream and downstream genes and the vector map of the original construct (OC: the native gene cluster with native promoters). The predicted function of each gene is listed in the table. (b) Vector maps of the ermE* construct (Ep: the native gene cluster with an ermE* promoter in front of the whole gene cluster). (c) Gene cluster contains six different promoters in front of each gene. (d) The reconstructed cryptic SGR810-815 gene cluster from S. griseus. P1: gapdh(Kocuria rhizophila), P2: gapdh(Streptomyces griseus), P3: ermE*, P4: rpsL(Tsukamurella paurometabola), P5: rpsL(Streptomyces griseus), P6: rpsL(Cellulomonas flavigena).
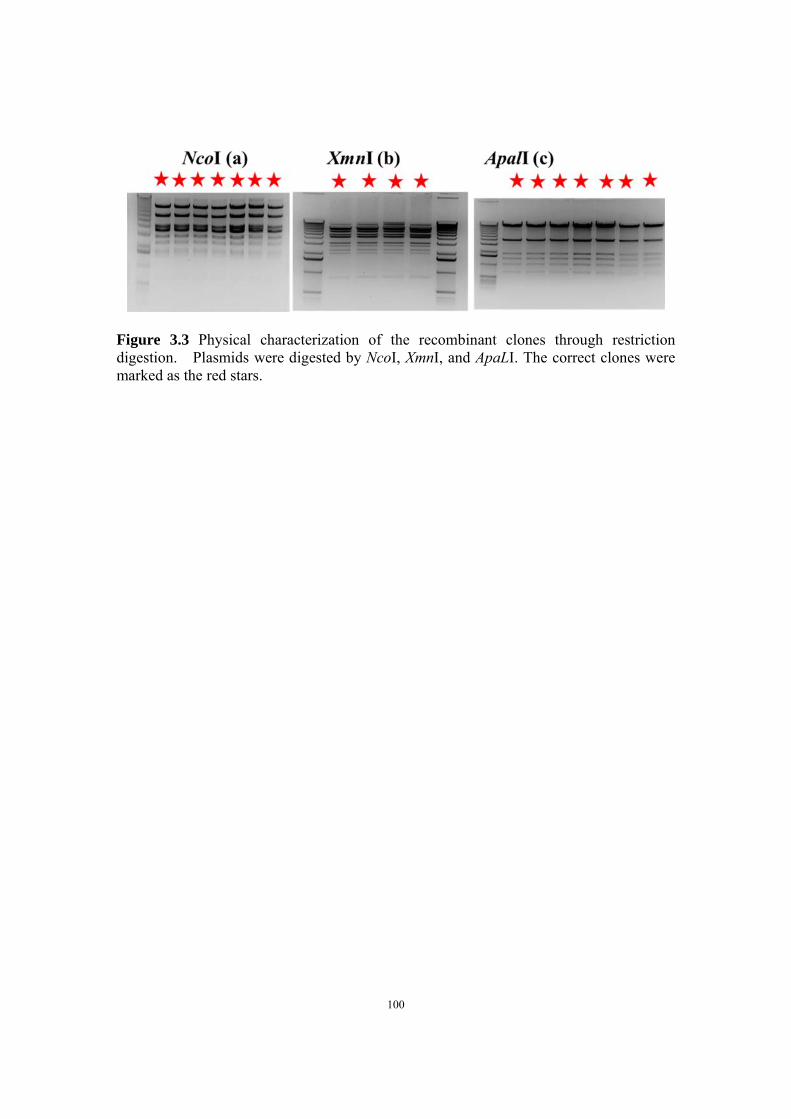
100
Figure 3.3 Physical characterization of the recombinant clones through restriction digestion. Plasmids were digested by NcoI, XmnI, and ApaLI. The correct clones were marked as the red stars.

101
Figure 3.4 Sample preparation workflow.
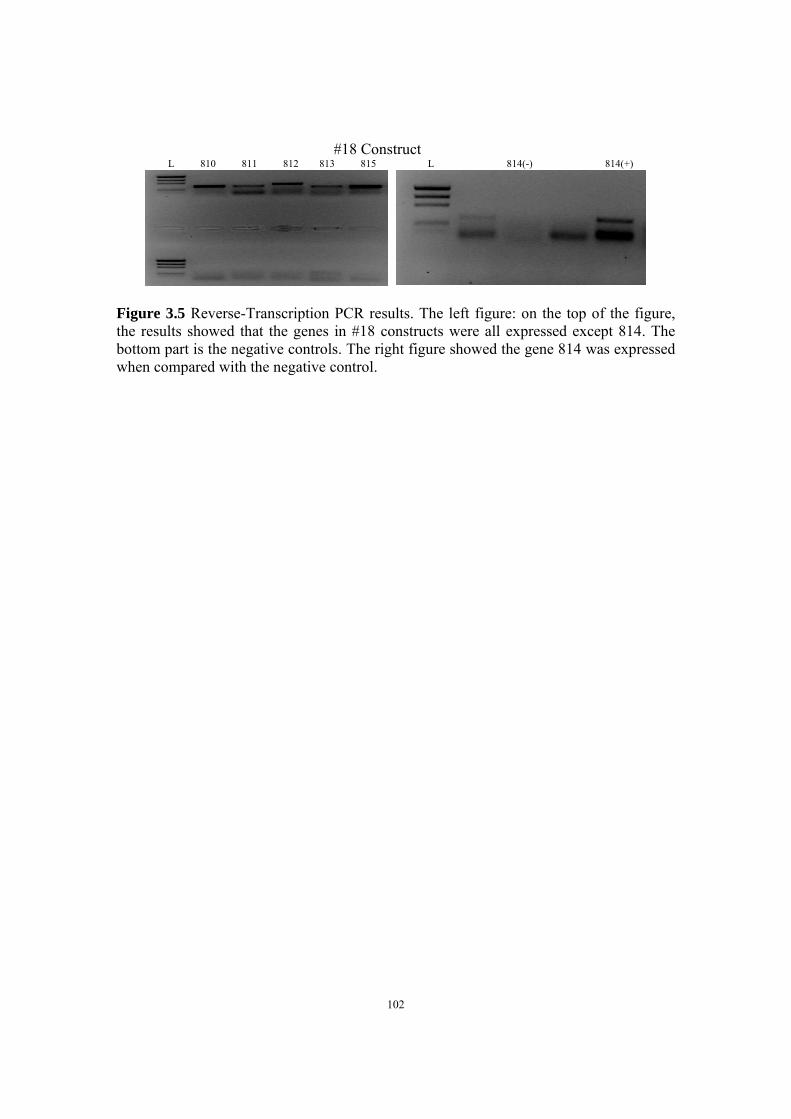
102
#18 Construct L 810 811 812 813 815 L 814(-) 814(+)
Figure 3.5 Reverse-Transcription PCR results. The left figure: on the top of the figure, the results showed that the genes in #18 constructs were all expressed except 814. The bottom part is the negative controls. The right figure showed the gene 814 was expressed when compared with the negative control.

103
Figure 3.6 One example of the standard curve made for Real-Time-PCR. pYL-#18 genomic DNA was used as the PCR template, which was diluted to 100,1000, 10000 and 100000 times.
y = ‐3.7985x + 30.828R² = 0.9961
0
5
10
15
20
25
30
0 1 2 3 4 5
Cycle Threshold (CT)
Log Starting Quantity

104
Figure 3.7 Real-time PCR data at different time points. 1: #18 120h, 2: #18 72h, 3:#18 96h, 4:E1 120h, 5: E1 72h, 6: E1 96h, 7: SG: 120h, 8:SG 48h, 9:SG 72h, 10: SG 96h.
0
2
4
6
8
10
12
1 2 3 4 5 6 7 8 9 10
Relative
Expression Level

105
Figure 3.8 Comparison of the gene expression level of different constructs. HrdB was used as internal control, whose expression level was set as 1. OC: original construct; SG: S. griseus (native producer); Ep: ErmE promoter added in front of the whole gene cluster; FC: Expression cassette (different promoters in front of each gene in the cluster).
OC SG Ep RC0
5
10
15
20
25
120
160R
ela
tive
Exp
ress
ion
Leve
l 810 811 812 813 814 815

106
Figure 3.9 EGFP confocal microscope results identified two strong promoters: gapDHp and rpsLp from S. griseus.

107
Figure 3.10 EGFP confocal microscope results for promoters: gapDHp and rpsLp from other species.

108
Figure 3.11 HPLC analysis of the extract from the S. lividans strain carrying the reconstructed gene cluster SGR810-815. *: major products, #: minor products. UV chromatographs were recorded at 280 nm.
0 5 10 15 20 25 30 35
Time (min)
RC(6-gene) Negative Control*
*
#
#
#
109
a
b
Figure 3.12 MS1 and MS2 data of the identified new potential product peak. (a) MS1 and MS2 data of compound a. (b) MS1 and MS2 data of compound b.
295.3
402.3
420.4
438.3
458.4
475.4
493.3
+MS2(511.7), 26.8min #2237
0.0
0.5
1.0
1.5
2.0
2.5
3.0
7x10Intens.
100 200 300 400 500 600 700 m/z
188.1205.1 234.1
251.2
277.2291.2 319.2 337.3 394.4412.4 429.4
447.4
457.4
475.3
493.3
+MS2(511.6), 27.9min #2339
0
1
2
3
4
7x10Intens.
100 150 200 250 300 350 400 450 500 m/z
102.3 415.3
467.3493.4
511.4
529.5
568.3 612.3
511.4
493.4
+MS, 26.8min #2242
0.0
0.5
1.0
1.5
2.0
8x10Intens.
100 200 300 400 500 600 700 m/z
Compound a C29H39N2O6 510.2808
102.3463.3
495.4
511.3
529.5612.3
511.3
495.4
+MS, 28.0min #2350
0
1
2
3
4
8x10Intens.
100 200 300 400 500 600 700 m/z
Compound b C29H39N2O6 510.2808

110
Figure 3.13 Chemical structures of the products of the SGR810-815 gene cluster from S. griseus.

111
Figure 3.14 NMR analysis of compound a from the reconstructed cryptic gene cluster SGR810-815. (a) 1H NMR spectrum. (b) DQ-COSY NMR spectrum. (c) gHSQC NMR spectrum. (d) gHMBC NMR spectrum.
b
a

112
Figure 3.14 (Cont.)
c
d

113
Figure 3.15 NMR analysis of compound b from the reconstructed cryptic gene cluster SGR810-815. (a) 1H NMR spectrum. (b) DQ-COSY NMR spectrum. (c) gHSQC NMR spectrum. (d) gHMBC NMR spectrum.
a
b
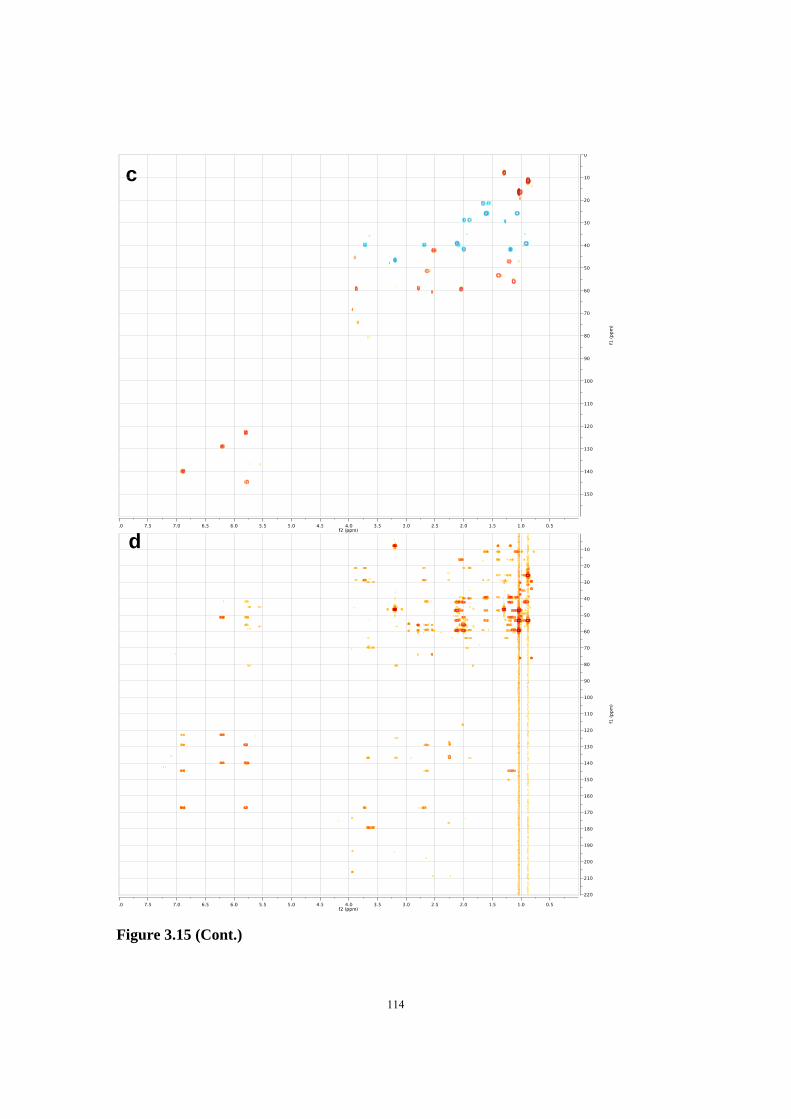
114
Figure 3.15 (Cont.)
c
d

115
Figure 3.16 Key COSY and HMBC correlations for compounds a and b.

116
Figure 3.17 Key NOESY correlations for compound b.
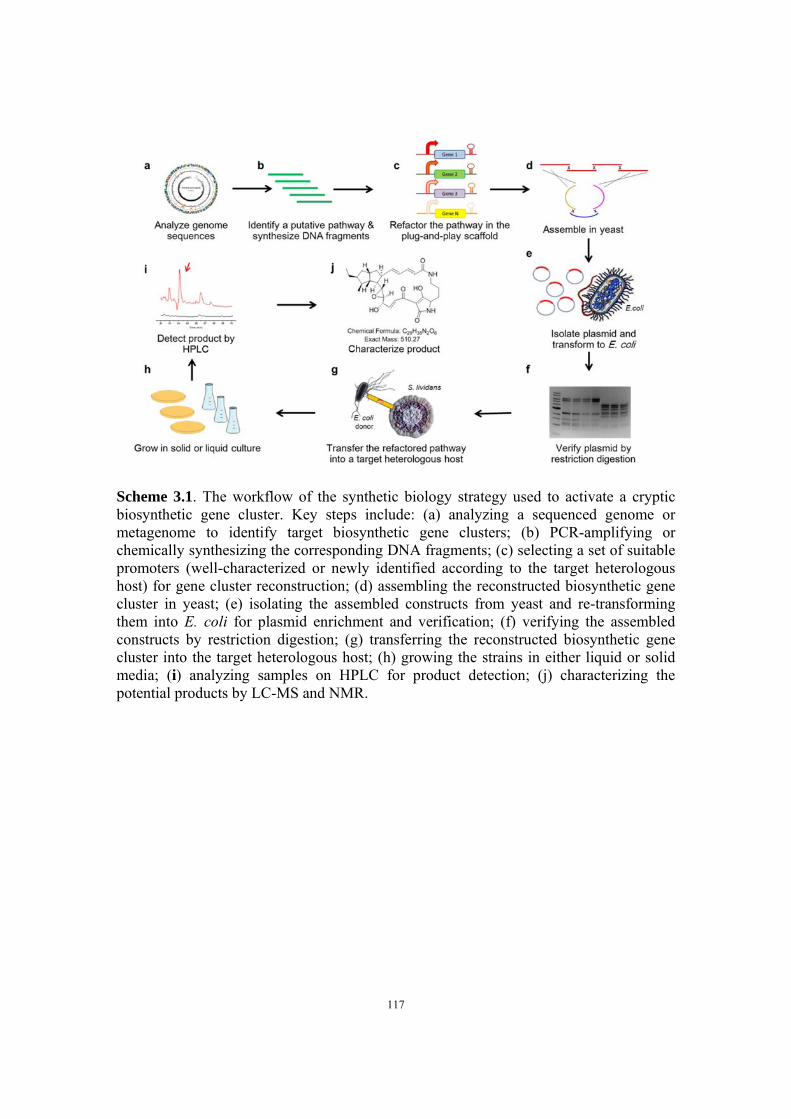
117
Scheme 3.1. The workflow of the synthetic biology strategy used to activate a cryptic biosynthetic gene cluster. Key steps include: (a) analyzing a sequenced genome or metagenome to identify target biosynthetic gene clusters; (b) PCR-amplifying or chemically synthesizing the corresponding DNA fragments; (c) selecting a set of suitable promoters (well-characterized or newly identified according to the target heterologous host) for gene cluster reconstruction; (d) assembling the reconstructed biosynthetic gene cluster in yeast; (e) isolating the assembled constructs from yeast and re-transforming them into E. coli for plasmid enrichment and verification; (f) verifying the assembled constructs by restriction digestion; (g) transferring the reconstructed biosynthetic gene cluster into the target heterologous host; (h) growing the strains in either liquid or solid media; (i) analyzing samples on HPLC for product detection; (j) characterizing the potential products by LC-MS and NMR.

118
Table 3.1 Fragments size and region located on the genomic DNA of S griseus.
Fragments Primers Size Region 1 1-for 5635 2501-8135 1-rev
2 2-for 4479 7716-12194 2-rev
3 3-for 5226 11775-17000 3-rev
4 4-for 5220 16581-21800 4-rev
5 5-for 4810 21381-26190 5-rev
6 6-for 3048 25771-28818 6-rev
7 7-for 4141 28381-32521 7-rev
Yeast fragment Yeast-for 1859 32522-34380 Yeast-rev
E. coli fragment E.coli-for 1430 34381-35810 E. coli-rev
Streptomyces fragment Strep-for 3353 35811-2500 Strep-rev

119
Table 3.2 Primers designed to amplify each gene from the genomic DNA of S griseus.
Construct Primer name Primer sequence (5’-3’) pYL-805-822 1-for gtagaaacagacgaagaagctagctttgcactggattgcggtgggtcctttcgggtcgac
1-rev tcaccagtcgtggacggttc 2-for ttcaacacggtgtacgacta 2-rev gtgagcggcgacaggacagg 3-for cttccgtacgaggcgggcgt 3-rev gcgtactacctcctgctgca 4-for gaagcggccctcggcctcgt 4a-rev gcaaactcatcgacctcgac 4b-for cgtcctcgtcggtgatgtcg 4-rev gtcgcctacacctcgcgcgc 5-for gatctcaccggtgctgtggc 5-rev tcacccctgtcgcagccagt 6-for gggacccgcgccgcggtgga 6a-rev cgatcgtcatgttcagcgtg 6b-for gatccatcacgggatccatc 6-rev gaacagcacagcgatggagg 7-for ggactgctggtccgacgatc 7-rev ttatagcacgtgatgaaaaggacccaggtggcacttttcgcttcgtcatctgggccctgg yeast-for cgaaaagtgccacctgggtc yeast-rev gtgagtttagtatacatgca E.coli-for aaaactgtattataagtaaatgcatgtatactaaactcatgtcatcacgatactgtgat E.coli-rev aatattgtgagtttagtatacatgca Streptomyces-for acccattcaaaggccggcattttcagcgtgacatcattctgtgggccgtacgctggtact Streptomyces-rev ccgcgatactgcgacgagccgtcgacccgaaaggacccaccgcaatccagtgcaaagcta
pYL-805-822-ermE*p 1-for acgcccgtctcctccccggggcggacgcgaatcgggcccagtgggtcctttcgggtcgac 1-rev tcaccagtcgtggacggttc 2-for ttcaacacggtgtacgacta 2-rev gtgagcggcgacaggacagg 3-for cttccgtacgaggcgggcgt 3-rev gcgtactacctcctgctgca 4-for gaagcggccctcggcctcgt 4a-rev gcaaactcatcgacctcgac 4b-for cgtcctcgtcggtgatgtcg 4-rev gtcgcctacacctcgcgcgc 5-for gatctcaccggtgctgtggc 5-rev atgctgttggctggacaatcgtgccggttggtaggatcccctccccctcatcgccacttg ermEp-for cgtccatccgtgaccctccacaagtggcgatgagggggagggatcctaccaaccggcacg ermEp-rev tatgtcctgacctgccctgacgtgatgcggcggtctctctggtaccagcccgacccgagc 6b-for gaccaggcgtgccggcgcgtgctcgggtcgggctggtaccagagagaccgccgcatcacg 6-rev gaacagcacagcgatggagg 7-for ggactgctggtccgacgatc 7-rev ttatagcacgtgatgaaaaggacccaggtggcacttttcgcttcgtcatctgggccctgg yeast-for cgaaaagtgccacctgggtc yeast-rev gtgagtttagtatacatgca Streptomyces-for aaaactgtattataagtaaatgcatgtatactaaactcacaattcttgaagacgaaaggg S1-rev cagcccgagggagtacaggg S2-for gggcgcatgctcttgacctg S2-rev cgtgcgaaggcccccggcgg S3-for cctggctccggaggagatcg Streptomyces-rev ccgcgatactgcgacgagccgtcgacccgaaacgacccactgggcccgattcgcgtccgc
pYL-FC-SGR810-815 810-for ccggtgcggggcccggtgagcgccgggccccgcaccggtcctaccacctgacgccgagcc 810-rev gccggagtgcaccgcacacccactcgcagaggagattgcaatgcaccggctgttcttcga gapdhp(KR)-for gacggggcggccccggttcctcgaagaacagccggtgcattgcaatctcctctgcgagtg gapdhp(KR)-rev Gttgaccacgaccgaccccacgcgtccggccccggtgccgcacgggccggtgaaccccgc

120
Table 3.2 (Cont.)
Construct Primer name Primer sequence pYL-FC-SGR810-815 811-for ccacatgaaccaacattcatgcggggttcaccggcccgtgcggcaccggggccggacgcg 811-rev ggcgtcgaaaaccggcgtacctaacgaggagatcggttcatgaagatcgcgaaatgggtg
gapdhp(SG)-for cttcgacgtgttcgcggaccacccatttcgcgatcttcatgaaccgatctcctcgttagg gapdhp(SG)-rev gcccgttcgtcccgccgcaccgacggagaggaagtcatgactcggcggcgagcgggggac 812-for gctggaccacgcgggcgcgccgacgacgggcgccccggtgtcatgacttcctctccgtcg 812-rev tgccggttggtaggacaccactcgcgagagaggcgtatccgtgagcggcgacaggacagg ermEp-for gggcgcccccgggccgggtccctgtcctgtcgccgctcacggatacgcctctctcgcgag ermEp-rev gctcgaccggtggtccgcacgggagagcgaggaagcgtgaggtaccagcccgacccgagc 813-for gaccaggcgtgccggcgcgtgctcgggtcgggctggtacctcacgcttcctcgctctccc 813-rev gccgatggcagccgaaacgaagtaaggaacctgcgcttctatggcggatgacgatgacgaccccac rpsLp(TP)-for gttccctgctggtccagtcggtggggtcgtcatccgccatagaagcgcaggttccttact rpsLp(TP)-rev gcgctccgtcctggggggagacgcggcccatggcggatgaaccgggtccgcgatcggcgg 814-for gtggtcaaaagtgttcgcctccgccgatcgcggacccggttcatccgccatgggccgcgt 814-1-rev ggcaaactcatcgacctcga 814-2-for ctcgtcggtgatgtcgaggg 814-rev aggttagtttcacgaacggcacacagaaaccggagaagtaatggccgacgcgaacaaccg rpsLp(SG)-for ccaccttgttccgtaacgcccggttgttcgcgtcggccattacttctccggtttctgtgt rpsLp(SG)-rev tgcaccacggcttgctccaccacgacttgaggagttcggcaggggcgcgcggccccggcc 815-for ccccggacgggacggccggcggccggggccgcgcgcccctgccgaactcctcaagtcgtg 815-rev gtgccggtcagaccagagaacaccgacagacggagacgtaatggacgagcgcgagcactc rpsLp(CF)-for aatatattccgccatcggcggagtgctcgcgctcgtccattacgtctccgtctgtcggtg rpsLp(CF)-rev tctctctctccccctcatcgccacttgtggagggtcacggcccgccgcgggcgctggagg 8-for cggcccggggcccgcccgagcctccagcgcccgcggcgggcgtgaccctccacaagtggc 8-rev ttatagcacgtgatgaaaaggacccaggtggcacttttcggggggctcctcgattcgtt yeast-for cgaaaagtgccacctgggtc yeast-rev gtgagtttagtatacatgca E.coli-for aaaactgtattataagtaaatgcatgtatactaaactcatgtcatcacgatactgtgat E.coli-rev aatattgtgagtttagtatacatgca Streptomyces-for acccattcaaaggccggcattttcagcgtgacatcattctgtgggccgtacgctggtact Streptomyces-rev gtgcggggcccggcgctcaccgggccccgcaccgggggttcgcaatccagtgcaaagcta

121
Table 3.3 The sequences of the heterologous promoters which are active in S. lividans used in this study.
Promoter Origin Length (nt) Sequence ermE*p Saccharopolyspora
erythraea 282 ggtaccagcccgacccgagcacgcgccggcacgcctggtcgatgtcggac
cggagttcgaggtacgcggcttgcaggtccaggaaggggacgtccatgcgagtgtccgttcgagtggcggcttgcgcccgatgctagtcgcggttgatcggcgatcgcaggtgcacgcggtcgatcttgacggctggcgagaggtgcggggaggatctgaccgacgcggtccacacgtggcaccgcgatgctgttgtgggctggacaatcgtgccggttggtaggacaccac
gadphp(Streptomyces griseus)
Streptomyces griseus
239 ctcggcggcgagcgggggacgttggtcccgcacccgccgggacccgggtcccggcgggcgaaacggaggtccgtgctcctactggcgagtacggatctccggccgtatccggtggcgtgcggtggccctctcgatgtcacccccggggcctcggagaggtagggtcggaagcggtcggggacatccctatacaactcgccggcgtcgaaaaccggcgtacctaacgaggagatcggttc
rpsLp(Streptomyces griseus)
Streptomyces griseus
311 aggggcgcgcggccccggccgccggccgtcccgtccgggggcccgtggccggggcggtcccggcgtgtcgcggcggacagcatttgttttgacccagctccgtgaggtaggtacgctcaagccttgtgcctggggtgtgcctgggctcgggtgcgtgtcctcaaccgcatcgcgagtccgtcagtagccaccgcaatctgcgcccttcctgccttcggggcgggagtccgcagtattcgacacacccgaccgcgtgggtcggcgatgttccaggttagtttcacgaacggcacacagaaaccggagaagta
rpsLp(Tsukamurella paurometabola)
Tsukamurella paurometabola
363 accgggtccgcgatcggcggaggcgaacacttttgaccactatgagttcatccaggtaagcttggtcgccgtgcctggtgaatgccaggacgatcgctcgtgcccatactgcaggccggacctccgggaccacgtacggacacgcgacacgcccgacctcggggtacgtgcgaggcgggtagctacttcccggaaacgggactgaccagcagagacggcgaaagccggaactgccggtggggccgcgctgcggaagtcgcaccctcgatgagggacggcttgcccggagctacaaccgcagcagtagagccaccggccggacggccgatggcagccgaaacgaagtaaggaacctgcgcttct
gapdhp(Kocuria rhizophila)
Kocuria rhizophila
235 cacgggccggtgaaccccgcatgaatgttggttcatgtggggtttgcgccagctgtgtcgcagttgccccccgccactgttcccggggcatgaatcccgctagaatgaacacggaagagcaggtggaccccgggtcgtcaccgcacttcgggtgtgggatttatgccgattggttttgatcccacatccggacgggccggagtgcaccgcacacccactcgcagaggagattgca
rpsLp(Xylanimonas cellulosilytica)
Xylanimonas cellulosilytica
302 gccctgcaggcggaagtcaggtagacacgacttccgctagtccttgcaaggtctgctgacgtgaggcggggcggtcgtttttgaccgccccgccttcgtcatgtaggctcgctcgctgtgcctggcgtgtcttcagacgcccaggtcccggtgccgtgaggcccgggccatcgagccggtggtacgtggctgcggtccccttgtgagggctgcgcgccgtgtgctgtccggcgcgcacagccttgaatccacccgcgggggccggccggtctccgtgagctcgagaagacgacggagacgta
rpsLp(Cellulomonas flavigena)
Cellulomonas flavigena
419 cccgccgcgggcgctggaggctcgggcgggccccgggccggaggcggccgcgaccacgacgcccgcgggacgtgacgagcggcacgactcgacgactccgggctcctttgacgctgtccgtcgcgccgggtagcgtaggacaccgtgcccgcgccgtcgggccctcgcgcgtgcactcggtcgaccgctccctgccggagtgggtgcgggtgcacggggtggctccccacctcctctcggatcggtcctcgcggactgccgccgtgcggaggaccggggcgacacgcccgggcgcgggggtcggtgcgggactccagacctccggggtagtcgtgcgacgggcgacgatccgggccgagccggccgtcctgggtgacgggtgccggtcagaccagagaacaccgacagacggagacgta

122
Table 3.4 1Ha and 13Cb NMR data (in CD3OD) of compounds a and b.
Number Compound a Compound b 1H (ppm) 13C (ppm) 1H (ppm) 13C (ppm) 1 167.5 167.2 2 5.74 (m) 136.7 5.80 (m) 123.0 3 6.92 (dd, 15.1,10.9) 140.7 6.90 (dd, 15.0, 11.2) 140.1 4 6.04 (dd, 15.1,11.1) 128.4 6.21 (dd, 15.0, 11.0) 129.1 5 5.65 (m) 124.7 5.78 (m) 144.8 6 2.51 (m) 52.7 2.65 (m) 51.4 7a 1.22 (m) 42.9
1.20 (m) 41.8
7b 1.91 (m) 2.00 (m) 8 2.43 (m) 41.4 2.52 (m) 42.2 9a 0.92 (m) 35.0
0.91 (m) 39.2
9b 1.94 (m) 2.12 (m) 10 1.58 (m) 56.3 1.40 (m) 53.3 11 1.34 (m) 53.4 1.20 (m) 47.2 12 2.10 (m) 57.4 2.05 (m) 59.4 13 1.58 (m) 56.3 1.13 (m) 55.9 14 3.88 (m) 77.2 2.79 (dd, 8.6,2.3) 59.0 15 5.92 (dd, 15.4,18.4) 130.3 2.55 (dd, 7.1,2.2) 60.7 16 6.17 (dd, 15.5,10.8) 131.2 3.84 (m) 74.1 17 7.29 (dd, 15.2,10.6) 140.5 7.01 (dd, 15.7,3.5) 144.9 18 7.02 (d, 15.4) 121.7 7.54 (d, 15.6) 121.9 19 179.3 179.4 20 101.1 103.4 21 173.4 167.5 22 23 3.94 (m) 68.5 3.88 (dd, 8.2, 2.9) 59.2 24 194.5 193.6 25a 3.99 (m) 71.1
2.00 (m) 28.8
25b 1.91 (m) 26a 1.38 (m) 31.6
1.58 (m) 21.4
26b 1.25 (m) 1.66 (m) 27a 3.66 (m) 36.8
3.72 (m) 39.8
27b 2.79 (m) 2.69 (m) 28 29a 1.61 (m) 25.9
1.61 (m) 25.8
29b 1.08 (m) 1.07 (m) 30 0.89 (m) 11.5 0.88 (m) 11.4 31 1.03 (m) 16.7 1.04 (m) 16.3
aδ (ppm) 600 MHz; multiplicities; J values (Hz) in parentheses. bδ (ppm) 145MHz, acquired with gHSQC, gHMBC and 13C
O
NH
NH
HO
O
1
12
14
1620
21
23
2425
26
27
287
138
9
1029
30
31
17
O11
5
4
3
2
15
1819
22
O
HO
Compound b
H
H H
H
H
H
6O
NH
NH
HO
O
16
12
14
1620
21
23
24 25
2627
287
13
89
1029
30
3117HO
O
11
5
4
3
2
15
1819
22
Compound a
OH

123
Chapter 4 Further Characterization of the Cryptic PTM
Biosynthetic Pathway from Streptomyces griseus
4.1 Introduction
PTMs contain one tetramic acid and a polycyclic system (usually 2-3 rings) fused
to macrolactams and exhibit diverse biological activities such as antifungal, antibiotic,
and antioxidant properties (1-7). They are a family of biomedically promising natural
products with challenging molecular frameworks. In 1985, two isomers, isolated from
Lysobacter gummosus ATCC 39472, named catacandins A and B, had good activity
against Candida species (MIC 3–12 µg/ml), but no activity against Gram-negative or
Gram-positive bacteria (8) were reported as the first potential PTM compounds.
However, full elucidated structures of PTMs did not come out until the early 1990s
from the compounds isolated from marine sponges and/or their associated microbiota
(9,10). Recently, PTMs have been found in bacteria, such as maltophilin from
Stenotrophomonas maltophilia (3), heat-stable antifungal factor (HSAF) from
Lysobacter enzymogenes (4,7), as well as ikarugamycin (11), dihydromaltophilin (2),
and frontalamides (1), all from medicinally important Streptomyces specie.
Catacandins A and B, maltophilin and dihydromaltophilin were found to exhibit
potent antifungal activity, but no investigations were done on their biosynthetic gene
clusters or mechanisms. The molecular weight of maltophilin is identical to those of
the catacandins, and it contains the same acyltetramic moieties which were reported in
the catacandins’ partial structures. It seems likely that they all belong to the PTM
family, which indicates that the origin of PTM biosynthetic pathways are widespread

124
in phylogenetically diverse bacteria. Later, the chemical structures of HSAF (4),
frontalamides (12) and ikarugamycin (13) have been linked to their biosynthetic
origins, and the structural determination showed that HSAF is identical to
dihydromaltophilin. Most interestingly, Clardy and co-workers found that the PTM
biosynthetic gene cluster from Streptomycetes was a common origin for PTM
biosynthesis in phylogenetically diverse bacteria and was conserved in more than 50%
of the sequenced Streptomyces species (1). Taken together, these PTM biosynthesis
gene clusters are likewise highly similar, consisting of a hybrid polyketide
synthase/nonribosomal peptide synthetase (PKS/NRPS) equipped with a series of
red/ox-tailoring enzymes.
The mode of action of HSAF was studied using Aspergillus nidulans as the test
organism (14). The results indicated that HSAF disrupts polarized growth by the
depletion of a group of sphingolipids and leads to loss of membrane organization and
formin localization at hyphal tips. Further studies revealed that HSAF could induce
the accumulation of sphingolipid intermediates, which causes thickening of the cell
wall and thus leads to increased chitin deposition and irreversibly blocking elongation
of the hyphal tips (15). Because fungal sphingolipids are structurally distinct from
mammalian sphingolipids, they have become an attractive new target for the
development of novel antifungal drugs (16). This novel mode of action of HSAF,
together with the unusual chemical structure that is distinct from any existing
antifungal drug on the market, makes PTMs potentially promising drug leads.

125
Despite the emerging significance of PTMs in basic and applied biology, the
mechanisms for the key steps in PTM biosynthesis, such as installation of two
polyketide chains and subsequent formation of the polycyclic ring system, remain
elusive (1,4,17). Most intriguingly, the PKS only consists of a single module.
Considering the structures of the products that have been characterized, it was
believed that the sole PKS involved in these clusters acts as an iterative PKS (4,12,13).
Although this is a common situation in fungal PKSs, it is very rare in bacterial
polyketide synthases. HSAF biosynthesis was the first biosynthetic gene cluster
reported for PTM biosynthesis. To understand the mechanism, Lou et al.
heterologously expressed the NRPS domains of the HSAF biosynthesis pathway (4).
The formation of the tetramic acid moiety demonstrated that this NRPS is responsible
for forming both α- and δ- amide bonds as well as the carbon–carbon bond between
ornithine’s carbonyl carbon and one hexaketide’s α-carbon. These results support the
hypothesis that HSAF biosynthesis involves an iterative PKS-NRPS. In my previous
chapter, the heterologous expression of the entire gene cluster and the detection of the
potential PTM products once again confirm the presence of the unrecognized
mechanism for bacterial polyketide-peptides.
Except for the formation of the tetramic acid moiety catalyzed by the NRPS-
derived thioesterase domain, the only PTM biosynthetic steps that have so far been
investigated in more detail is the origin of the hydroxyl moiety attached to the
ornithine building blocks, which is introduced by a post-PKS/NRPS-hydroxylation
(18). Therefore, many questions in the formation of PTMs still need to be answered.

126
For example, for the most intriguing aspect, how the single PKS module determines
the chain length and structure of the two separate polyketide chains is not very clear.
Another very interesting aspect is how the cascade of redox enzymes lead the two
polyketide chains to form the polycyclic system. Further biochemical characterization
of each of these enzymes should eventually unveil the secrets of PTM biosynthesis.
One of the possible reasons why the discovery and characterization of PTM
biosynthetic gene clusters are challenging is because most of the PTM gene clusters
remain silent under typical fermentation conditions either in the native or
heterologous host. Previously, we used a simple synthetic biology strategy to activate
the cryptic PTM biosynthetic gene cluster SGR810-815 from Streptomyces griseus
and identified two putative PTMs. To shed more light on the biosynthetic logic
leading to PTMs, in this chapter, we further exploited the plug-and-play platform to
perform genetic manipulations on this gene cluster and biochemically characterized
the oxidoreductases involved. We elucidated their biosynthetic steps by creating and
characterizing a series of gene deletion constructs and the in vitro activity assay of the
key enzymes. We not only provide new insights to the subsequent formation of the
polycyclic system, but also reveal a new paradigm of clustered biosynthetic genes.
Instead of following a sequential order for the genes involved in one pathway, we
found that they may diverge into parallel branches, as a result, generate homologous
products. To confirm this, gene deletion constructs of the HSAF pathway are also
assembled and characterized.

127
4.2 Results and discussion
4.2.1 Determination of the boundary of the cluster
As we have characterized two PTM products from the cryptic pathway by
applying the plug-and-play scaffold, we attempted to elucidate the biosynthetic steps
of this new gene cluster using the same synthetic biology strategy. We first
determined the exact boundary of the gene cluster by extensive bioinformatics
analysis of upstream and downstream regions of this gene cluster and then constructed
another seven-gene gene cluster with an upstream putative aminotransferase gene
(Figure 4.1 and Table 4.1). The expression of this putative aminotransferase gene was
confirmed by qPCR and the products were identified to be the same as the ones from
the six-gene gene cluster (Figure 4.1), indicating that the putative aminotransferase
gene was not essential.
4.2.2 Construction of single-gene deletion constructs
In principle, DNA assembler can be used to assemble custom-designed DNA
fragments in any desired order by designing PCR primers to generate appropriate
overlaps between the adjacent ones. Usually, a S. cerevisiae helper fragment carrying
a centromere sequence (CEN), an automatic replication sequence (ARS) and a Ura+
selection marker, an E. coli helper fragment carrying a pBR322 ori and a Apr+
selection marker, and a helper fragment carrying an ori and a selection marker
required by the desired organism, are individually prepared. These helper fragments

128
are mixed with the pathway fragments, and subsequently co-transformed into S.
cerevisaie to be assembled into a single molecule.
Next, to decipher the biosynthetic steps, a series of mutant gene clusters
consisting of single gene deletions were constructed via the DNA assembly method
(Figure 4.2 and Table 4.2). Each of the gene and promoter fragments was individually
PCR amplified, gel purified. Genes with corresponding promoters were also ligated
together by overlap extension PCR. To ensure high efficiency of yeast homologous
recombination, the “promoter upstream-gene-promoter downstream” cassette was
built to generate a ~200 bp overlap region with adjacent fragments. The fragments
were co-transformed into S. cerevisiae through electroporation and spread onto SC-
Ura plates. Typically, 30-50 colonies appeared after 2-3 days of incubation at 30 °C,
which were then randomly picked for plasmid isolation. 10 colonies were inoculated
in SC-Ura liquid culture and the purified yeast plasmids were individually
transformed to E. coli WM1788 and selected on LB-Apr+ plates. E. coli plasmids
were subsequently purified and checked by gel electrophoresis. The plasmids with
relatively large size were subjected to restriction digestion by three different
restriction enzymes. As a result, for all the single deletion constructs, usually 6-10 of
them exhibited an expected digestion pattern, indicating an assembly efficiency of 60-
100%.
4.2.3 Analysis of the single-gene deletion constructs
The verified clones were transformed to E. coli WM6026 (19) and these
transformants were then used as the donors for conjugative transfer of the assembled

129
plasmids to S. lividans 66 following the protocol described elsewhere (19). For the
single deletion constructs, a single colony of each construct was inoculated into 20
mL of ATCC172 liquid medium. Aliquots of this seed culture with a volume of 250
μL were spread for confluence over Petri plates containing approximately 25-30 mL
of YMS solid agar medium and the plates were incubated for 7 days at 30 °C.
We followed the product extraction method described in literature (12) to isolate
the potential product from these single deletion clusters. As expected, the SGR814
single deletion construct lost the ability to produce any target compounds, indicating
the essential role of the PKS-NRPS hybrid gene (Figure 4.3). The SGR815 single
deletion construct (Figure 4.3) abolished the production of compound a and instead
produced compound c [M(C29H38O5N2)+H]+ with an m/z of 495.2864 (Figure 4.4)
(calculated: 495.2859) as a major product. Compound c was characterized via LC/MS
and NMR (Figure 4.5, Figure 4.6 and Table 4.3). By comparing the structures of
compound a and compound c, we noticed that the difference is the lack of a hydroxyl
group proximal to the tetramic-acid moiety of the compounds. Therefore, it was clear
that SGR815 serves as a hydroxylase, similar to its homologous enzyme characterized
in the HSAF (18) and frontalamides (1) gene clusters. This 3-hydroxyl group on the
ornithine residue seems to be a feature common to nearly all PTM natural products
found in phylogenetically diverse organisms.
Both the SGR812 single deletion construct and the SGR814 single gene construct
(the construct only contains the SGR814 gene and a strong constitutive promoter)
failed to produce any related compounds, indicating that SGR812 may be involved in

130
the first step of the formation of the polycyclic system (Figure 4.3). The SGR813
single deletion construct (Figure 4.3) revealed one major peak at ~34 min with a
corresponding m/z of 477.2757 for compound d [M(C29H36O4N2)+H]+ (calculated:
477.2753) and the chemical structure of compound d was subsequently determined
(Figure 4.4, Figure 4.5, Figure 4.7 and Table 4.3). The interesting 4-membered ring in
compound d is the first observation of such structure in known PTMs. The structure
of compound d suggests that it may be a shunt product after SGR813 deletion. These
results suggest that both SGR812 and SGR813 are involved in the formation of the
polycyclic system.
4.2.4 Construction of the multiple-gene deletion constructs
To further confirm the results obtained from single-deletion constructs, multiple-
deletion gene constructs were constructed via the same approach (Figure 4.8 and
Table 4.4). Each of the gene and promoter fragments was individually PCR amplified,
gel purified. Then genes with corresponding promoters were ligated together by
overlap extension PCR. To ensure high efficiency of yeast homologous recombination,
the “promoter upstream-gene-promoter downstream” cassette was built to generate a
~200 bp overlap region with adjacent fragments. All the fragments were co-
transformed into S. cerevisiae through electroporation and spread onto SC-Ura plates.
Typically, 30-50 colonies appeared after 2-3 days of incubation at 30 °C, which were
then randomly picked for plasmid isolation. 10 colonies were inoculated in SC-Ura
liquid culture and the purified yeast plasmids were individually transformed to E. coli
WM1788 and selected on LB-Apr+ plates. E. coli plasmids were subsequently

131
purified and checked by gel electrophoresis. The plasmids with relatively large size
were subjected to restriction digestion by at least three different restriction enzymes.
As a result, for all the multiple-deletion constructs, usually 8-10 of them exhibited an
expected digestion pattern, indicating an assembly efficiency of 80-100%.
4.2.5 Analysis of the multiple-gene deletion constructs
We followed the methods we described in section 4.2.3 to heterologously express
the assembled constructs and isolate the potential products from these multiple-
deletion clusters. First, the 3-gene gene cluster consisting of SGR812, SGR813, and
SGR814 was evaluated (Figure 4.8 and Table 4.4). Compound c was found to be the
major product (Figure 4.9), indicating that this compound is a key biosynthetic
intermediate.
To further elucidate the function of the other redox enzymes, several 4-gene gene
clusters were built. First, a 4-gene gene cluster consisting of SGR812, SGR813,
SGR814, and SGR815 was constructed (Figure 4.8 and Table 4.4) and its main
product was compound a (Figure 4.9), which again confirmed the functional role of
SGR815 as a hydroxylase. Although the SGR810 and SGR811 single gene deletion
constructs both maintained the production of compound a and compound b, the loss
of compound b in these 3-gene and 4-gene constructs indicates that SGR810 and
SGR811 are involved in the formation of the epoxide ring and their functions might
be redundant (Figure 4.3). To further exploit the functions of these two genes, two
additional 4-gene gene clusters were made consisting of SGR812, SGR813, SGR814,
and SGR810 or SGR811 respectively (Figure 4.8 and Table 4.4). The 4-gene gene

132
cluster consisting of SGR810, SGR812, SGR813, and SGR814 produced compound b
as a major product, which indicated that SGR810 might be involved in the formation
of the epoxide ring. While the 4-gene gene cluster consisting of SGR811, SGR812,
SGR813, and SGR814 revealed one new peak at ~28 min with a corresponding m/z of
495.3 for compound e [M(C29H38O5N2)+H]+ (calculated: 495.2859) (Figure 4.9)
and the chemical structure of compound e was subsequently determined (Figure 4.10,
Figure 4.11, Figure 4.12 and Table 4.5). Based on the structures of these newly
characterized intermediates, we proposed a biosynthetic route for this group of PTMs
(Figure 4.13).
4.2.6 Reconstitution of the oxidoreductases in vitro
To confirm the functional roles of SGR810, SGR811 and SGR815, we decided to
biochemically characterize them in vitro. In order to produce the large quantities of
enzymes required for in vitro assay, we chose E. coli as a heterologous expression
host. The full-length genes were cloned from the genomic DNA of S. griseus into
pET28a(+), creating both N-terminal and C-terminal His6-tags. E. coli BL21 (DE3)
cells were transformed with this constructs and lysates of IPTG-induced (0.1 mM)
cultures were analyzed by SDS-PAGE to check for presence of soluble proteins (20).
Clear overexpression bands for SGR810 and SGR815 were detected and confirmed
by Western blot analysis (Figure 4.14). While for SGR811, most of the target protein
was detected in the insoluble fraction. To maximize soluble expression of SGR811,
different IPTG induction concentrations and culturing temperatures were tested.
133
Finally, with a 0.01mM IPTG-induced culture growing at 16 for 18 hrs, we would
be able to obtain the soluble SGR811 protein.
A two-step purification of these three enzymes were developed. First, an ion
exchange column was used to remove some of the protein impurities. Then, the His6-
tag allowed the purification of the enzymes using immobilized affinity
chromatography with Ni2+-NTA resin coupled with fast performance liquid
chromatography (FPLC). The purities of all these three enzymes were analyzed by the
SDS-PAGE (Figure 4.14) and were greater than 80%. The concentrations of final
enzyme stocks were determined by the Bradford method (21).
4.2.7 Investigation of the HSAF pathway
The proposed biosynthetic route for this group of PTMs (Figure 4.12) showed
that the formation of the PTM compounds may follow several parallel pathways
instead of a sequential order of all the genes involved. To discover whether this is true
or not in other PTM biosynthetic pathways, we refactored the HSAF pathway and
designed four intermediate constructs with multiple-gene deletions of this pathway
(Figure 4.15).
Those multiple-gene deletion constructs were constructed using the same
approach as described before. Each of the gene fragments was individually PCR
amplified from the genomic DNA of Lysobacter enzymogenes, and then gel purified.
The genes fragments with the corresponding promoters were ligated together by
overlap extension PCR. To ensure high efficiency of yeast homologous recombination,
the “promoter upstream-gene-promoter downstream” cassette was built to generate a

134
~200 bp overlap region with adjacent fragments. All the fragments were co-
transformed into S. cerevisiae through electroporation and spread onto SC-Ura plates.
Typically, 30-50 colonies appeared after 2-3 days of incubation at 30 °C, which were
then randomly picked for plasmid isolation. 10 colonies were inoculated in SC-Ura
liquid culture and the purified yeast plasmids were individually transformed to E. coli
WM1788 and selected on LB-Apr+ plates. E. coli plasmids were subsequently
purified and checked by gel electrophoresis. The plasmids with relatively large size
were subjected to restriction digestion by at least three different restriction enzymes.
As a result, for all the multiple-gene deletion constructs, usually 8-10 of them
exhibited an expected digestion pattern, indicating an assembly efficiency of 80-100%.
We followed the methods we described in section 4.2.3 to heterologously express
the assembled constructs and isolate the potential products from these multiple-gene
deletion clusters. Initial HPLC-MS analysis indicated that the 3-gene cluster of the
HSAF pathway produced an intermediate with a molecular weight of [M+H]+ 477.3
(Figure 4.16). Comparing the MS2 data with previously characterized compounds,
this one shares an identical MS2 pattern with compound c except for the loss of one
additional –OH group. This supports our hypothesis that compound c serves as the
scaffold for further parallel modifications by other oxidoreductases involved in these
pathways.
4.3 Conclusions
We have successfully used a synthetic biology strategy to investigate the
biosynthetic route for PTMs, especially for the formation of the polycyclic system.

135
SGR815 was confirmed to be a hydroxylase, which is conserved in all known PTM
gene clusters. SGR812 and SGR813 were annotated as oxidoreductases and can be
found in most of the known PTM gene clusters. Based on phylogenetic analysis, these
two enzymes are distinct and may catalyze different reactions even though they
belong to the same family of oxidoreductases. Indeed, our results from the gene
deletion constructs suggest that SGR812 is involved in the formation of the first
cyclic ring while the SGR813 is responsible for the closure of the second ring.
Interestingly, we noticed that two related PTM gene clusters from Saccharophagus
degradans and Salinospora arenicola only contain homologs of SGR812, which
supports the proposed role of SGR812 in ring formation. That is because the reaction
catalyzed by SGR812 takes place before the ones catalyzed by other oxidoreductases.
The last two enzymes, SGR811 and SGR810, are also conserved in most of the
related PTM gene clusters, but with greater sequence diversity. Our results suggest
that they are likely to perform oxidative reactions on the backbone. For SGR810, it is
most likely involved in the formation of the epoxide ring, while for SGR811, with the
structure of compound e in hand, we would argue that it catalyzes the formation of the
third ring in the polycyclic system and may spontaneously activate the closure of
additional rings with the rearrangement of the double bonds.
It should be noted that based on our results, the three different oxidoreductases
lead to three different PTM products respectively, which indicates that the
biosynthetic steps may not follow a sequential linear order, but act in parallel
reactions. To confirm this, we will further carry out the in vitro assay with the

136
purified oxidoreductases individually and tests the different HSAF deletion constructs
we designed.
4.4 Materials and methods
4.4.1 Strains and reagents
S. cerevisiae YSG50 (MATα, ade2-1, ade3Δ22, ura3-1, his3-11, 15, trp1-1,
leu2-3, 112 and can1-100) was used as the host for DNA assembly and integration.
S. lividans 66 and S. griseus were obtained from the Agricultural Research Service
Culture Collection (Peoria, IL) and E. coli BL21 (DE3) was obtained from Novagen
(Madison, WI). Plasmids pAE4, E. coli strains WM6026 and WM1788 were
developed by the Metcalf group (University of Illinois, Urbana-Champaign). The
pRS426 and pRS416 plasmid (New England Biolabs, Beverly, MA) were modified by
incorporating the hisG and partial δ sequence (δ2) that flank the multiple cloning site
and serve as the vectors for assembly of various pathways. Nalidixic acid and IPTG
were obtained from Sigma-Aldrich (St. Louis, MO). ISP2, agar, beef extract, yeast
extract, malt extract, and other reagents required for cell culture were obtained from
Difco (Franklin Lakes, NJ). All restriction endonucleases, as well as T4 DNA ligase
and antarctic phosphatase, were purchased from New England Biolabs (Beverly, MA).
Phusion DNA polymerase was from Finnzymes (Espoo, Finland). FailsafeTM 2x
premix buffer G was purchased from EPICENTRE Biotechnologies (Madison, WI).
SYBR Green PCR master mix was purchased from Applied Biosystems (San
Francisco, CA). The QIAprep Spin Plasmid Mini-prep Kit, QIAquick PCR

137
Purification Kit, QIAquick Gel Extraction Kit, and RNeasy MinElute Cleanup Kit
were purchased from Qiagen (Valencia, CA). The total RNA was extracted using the
RNeasy Mini Kit (QIAGEN, Valencia, CA). All primers were synthesized by the
Integrated DNA Technologies (Coralville, IA). Yeast YPAD medium-containing 1%
yeast extract, 2% peptone and 2% dextrose supplied with 0.01% adenine
hemisulphate was used to grow S. cerevisiae YSG50 strain. Synthetic complete drop-
out medium lacking uracil (SC-Ura) was used to select transformants containing the
assembled biochemical pathways of interest.
4.4.2 DNA manipulation
S. griseus was grown in liquid MYG medium (4 g/L yeast extract, 10 g/L malt
extract and 4 g/L glucose) at 30 °C with constant shaking (250 rpm) for 2 days. The
genomic DNA was isolated from S. griseus using the Wizard Genomic DNA isolation
kit from Promega (Madison, WI). Pairs of primers were designed with the sequences
shown in Table 4.1, 4.2 and 4.4. Pathway fragments were amplified from the genomic
DNA of S. griseus. Generally, the PCRs were carried out in 100 µL reaction mixture
consisting of 50 µL FailSafeTM PCR 2xPreMix G from Epicentre Biotechnologies
(Madison, WI), 2.5 pmol of each primer, 1 µL yeast plasmid or genomic DNA and
2.0 unit Phusion DNA polymerase for 35 cycles on a PTC-200 Thermal Cycler (MJ
Research, Watertown, MA). Each cycle consisted of 10 s at 98 °C, 30 s at 58 °C and 3
min at 72 °C, with a final extension of 10 min. The S. cerevisaie helper fragment was
amplified from the commercial vector pRS416, while the E. coli helper fragment and
the S. lividans helper fragment were amplified from the Streptomyces-E. coli shuttle
138
vector pAE4. Following electrophoresis, the PCR products were individually gel-
purified from 1.0% agarose gels using Qiagen Gel Purification kit. For gapdhp(SG)
and rpsLp(SG), the genomic DNA of S. griseus was isolated using the Wizard®
Genomic DNA Purification Kit (Promega, Madison, WI) and then used as the
template for PCR amplification of the two target promoters. Promoters from other
hosts were obtained through primer splicing in which 6-10 overlapping
oligonucleotides designed based on the sequence of each promoter are joined together
by overlap extension PCR. Genes with corresponding promoters were also ligated
together by overlap extension PCR. To ensure high efficiency of yeast homologous
recombination, the “promoter upstream-gene-promoter downstream” cassette was
built to generate a ~200 bp overlap region with adjacent fragments. 100 ng of each
individual fragments was mixed and precipitated with ethanol. The resulting DNA
pellet was air-dried and resuspended in 4 µL Milli-Q double deionized water and
subsequently electroporated into S. cerevisiae using the protocol reported elsewhere
(22).
4.4.3 Yeast transformation
Yeast transformation was performed by electroporation. YPAD medium (50 mL)
was inoculated with a 0.5 mL overnight S. cerevisiae YSG50 culture and shaken at
30 °C and 250 rpm for 4-5 h until OD600 reached 0.8-1.0. Yeast cells were harvested
by centrifugation at 4 °C and 4000 rpm for 5 min. The supernatant was discarded and
the cell pellet was washed with 50 mL ice-cold Milli-Q double-deionized water,
followed by another wash with cold 1 M sorbitol and finally resuspended in 250 µL

139
cold sorbitol. An aliquot of 50 µL of yeast cells together with 4 µL DNA mixture was
electroporated in a 0.2 cm cuvette at 1.5 kV. The transformed cells were immediately
mixed with 1 mL room temperature YPAD medium and shaken at 30 °C for 1 h.
Following that, the cells were harvested by centrifugation, washed with room
temperature 1 M sorbitol several times to remove the remaining medium and finally
resuspended in 1 mL sorbitol. Aliquots of 30-50 mL were spread on SC-Ura plates for
the selection of the transformants, and the plates were incubated at 30 °C for 2-4 days
until colonies appeared. Colonies were randomly picked to SC-Ura liquid medium
and grown for 1 day, after which yeast plasmid was isolated using Zymoprep II Yeast
plasmid Miniprep kit (Zymo Research, CA), and genomic DNA was prepared using
Wizard Genomic DNA isolation kit from Promega (Madison, WI).
4.4.4 Verification of the assembled gene clusters
Colonies were randomly picked to SC-Ura liquid media and grown for 2 days,
after which yeast plasmid was isolated using Zymoprep II Yeast plasmid Miniprep kit
(Zymo Research, CA). Yeast plasmids were transformed to E. coli strain WM1788
and selected on Luria Broth (LB) agar plates supplemented with 50 µg/ml apramycin.
Colonies were inoculated into 5 mL of LB media supplemented with 50 µg/mL
apramycin, and plasmids were isolated from the liquid culture using the plasmid
miniprep kit from Qiagen. Plasmids isolated from E. coli were then subjected to
restriction digestion by different enzymes, after which the reaction mixtures were
loaded to 0.7% agarose gels to check for the correct restriction digestion pattern by
DNA electrophoresis.
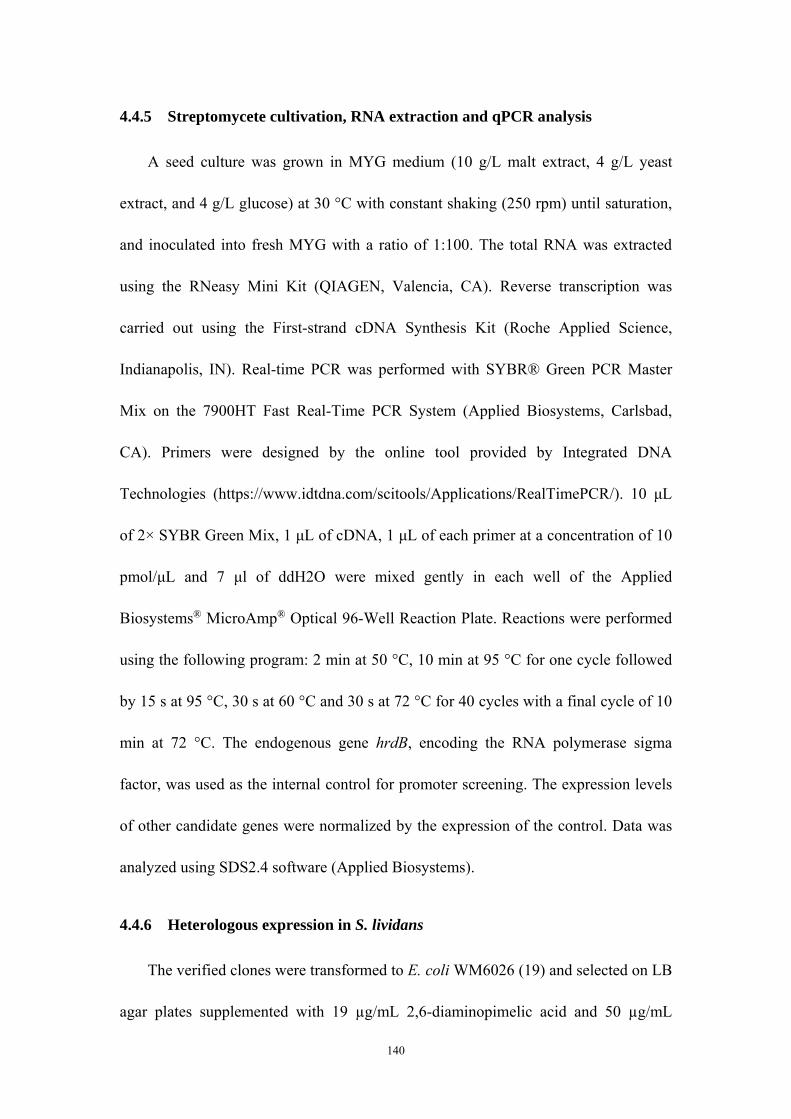
140
4.4.5 Streptomycete cultivation, RNA extraction and qPCR analysis
A seed culture was grown in MYG medium (10 g/L malt extract, 4 g/L yeast
extract, and 4 g/L glucose) at 30 °C with constant shaking (250 rpm) until saturation,
and inoculated into fresh MYG with a ratio of 1:100. The total RNA was extracted
using the RNeasy Mini Kit (QIAGEN, Valencia, CA). Reverse transcription was
carried out using the First-strand cDNA Synthesis Kit (Roche Applied Science,
Indianapolis, IN). Real-time PCR was performed with SYBR® Green PCR Master
Mix on the 7900HT Fast Real-Time PCR System (Applied Biosystems, Carlsbad,
CA). Primers were designed by the online tool provided by Integrated DNA
Technologies (https://www.idtdna.com/scitools/Applications/RealTimePCR/). 10 μL
of 2× SYBR Green Mix, 1 μL of cDNA, 1 μL of each primer at a concentration of 10
pmol/μL and 7 μl of ddH2O were mixed gently in each well of the Applied
Biosystems® MicroAmp® Optical 96-Well Reaction Plate. Reactions were performed
using the following program: 2 min at 50 °C, 10 min at 95 °C for one cycle followed
by 15 s at 95 °C, 30 s at 60 °C and 30 s at 72 °C for 40 cycles with a final cycle of 10
min at 72 °C. The endogenous gene hrdB, encoding the RNA polymerase sigma
factor, was used as the internal control for promoter screening. The expression levels
of other candidate genes were normalized by the expression of the control. Data was
analyzed using SDS2.4 software (Applied Biosystems).
4.4.6 Heterologous expression in S. lividans
The verified clones were transformed to E. coli WM6026 (19) and selected on LB
agar plates supplemented with 19 µg/mL 2,6-diaminopimelic acid and 50 µg/mL

141
apramycin. These transformants were then used as the donors for conjugative transfer
of the assembled plasmids to S. lividans 66 following the protocol described
elsewhere (19). S. lividans exconjugants were picked and re-streaked on ISP2 plates
supplemented with 50 µg/mL apramycin and grown for 2 days. For the reconstructed
gene cluster SGR810-815, a single colony was inoculated into 20 mL of ATCC172
liquid medium (5 g/L yeast extract, 20 g/L soluble starch, 5 g/L N-Z Amine Type A, 1
g/L CaCO3, and 10 g/L glucose) supplemented with 50 µg/mL apramycin in a 125 mL
shake-flask (3 mm glass beads added to improve liquid mixing and aeration). Aliquots
of this seed culture with a volume of 250 μL were spread for confluence over Petri
dish plates containing approximately 25-30 mL of YMS solid agar medium (4 g/L
yeast extract, 10 g/L malt extract, 4 g/L soluble starch, and 20 g/L Bacto agar) and the
plates were incubated for 7 days at 30 °C.
4.4.7 HPLC-MS analysis
To isolate potential compounds, agar and the adherent cells were stored at -80 °C
for 24 h, after which the frozen cultures were thawed completely and the released
liquids were collected. The liquids were extracted by ethyl acetate with a ratio of 1:1
twice, concentrated 1000-fold, and subjected to HPLC analysis. HPLC was performed
on the Agilent 1100 series LC/MSD XCT plus ion trap mass spectrometer with a
Phenomenex Luna C18 reverse-phase column (3.0 x 150 mm, 3.5 μm). HPLC
parameters were as follows: solvent A, 0.1% formic acid in water; solvent B, 0.1%
formic acid in acetonitrile; gradient, 10% B for 5 min, to 100% B in 25 min, maintain
at 100% B for 10 min, return to 10% B in 1 min and finally maintain at 10% B for 9

142
min; flow rate 0.3 mL/min; detection by UV spectroscopy at 260 nm. Under such
conditions, products are eluted at 28.5 min (compound c), 34.6 min (compound d) and
28.6 min (compound e). The MS system was operated using a drying temperature of
350 ○C, a nebulizer pressure of 35 psi, a drying gas flow of 8.5 L/min, and a capillary
voltage of 4500 V.
4.4.8 Structure elucidation of compounds c-e
Compounds c, d and e were isolated by reverse-phase HPLC using a Phenomenex
Luna 10u C18 column (10 mm × 250 mm) on the Agilent 1100 series LC/MSD XCT
with an isocratic solvent of 60% acetonitrile in water with 0.1% formic acid (with a
flow rate of 3 mL/min and a wavelength of 260 nm). The high resolution MS was
performed on a Waters Q-Tof Ultima system (Walters, Milford, MA). All NMR
experiments were carried out on a Varian UNITY INOVA 600 MHz spectrometer,
except for the 13C NMR spectra, which were recorded on a Bruker Avance III 500i
with a 5 mm 13C(1H) cryogenic probe at the National Magnetic Resonance Facility at
the University of Wisconsin at Madison. The structures were determined based on 1-
D and 2-D NMR data. The relative configurations were determined by using 2-D
NOESY experiments.
4.4.9 Cloning, expression and purification of the oxidoreductases
The genes were PCR amplified from the genomic DNA of S. griseus using
primers containing NdeI and XhoI restriction sites and cloned into the corresponding
sites of pET28a(+), creating both N- and C-terminal His6-tag.

143
E. coli BL21 (DE3) cells overexpressing these genes were grown in Luria-Bertani
(LB) medium supplemented with kanamycin (50µg/mL). Cells were grown at 37 to
OD600 ~0.6-0.8 and then induced at 16 by the addition of IPTG to a final
concentration of 0.1 mM (SGR810 and SGR815) and 0.01 mM (SGR811). The
cultures were incubated at 16 for an additional 18 hours, after which the cells were
harvested by centrifugation (10 minutes at 8,000 x g) and resuspended in 2 mL lysis
buffer (10 mM imidazole, 50 mM sodium phosphate buffer, 300 mM NaCl, 10 mM
imidazole, 15% glycerol, pH 8.0, 1 mg/mL lysozyme) per gram cell weight and
frozen at -80 °C. Subsequently, cells were lysed using sonication and cellular debris
was removed by centrifugation (40,000 x g, 4 °C, 10 minutes). Recombinant proteins
were purified by chromatography on Ni-NTA resins by the amino-terminal
hexahistidine affinity tag. Captured proteins were cleaned up with a wash buffer (20
and 50 mM imidazole, 50 mM sodium phosphate buffer, 300 mM NaCl, 20 or 50 mM
imidazole, 15% glycerol, pH 8.0) and finally eluted in an elution buffer (200 mM
imidazole, 50 mM sodium phosphate buffer, 300 mM NaCl, 200 mM imidazole, 15%
glycerol, pH 8.0). The protein content of individual elution fractions was estimated
using Quick Start Bradford Protein Assay (Bio-Rad, Hercules, CA) and the
appropriate fractions were pooled and buffer exchanged into 10 mM phosphate buffer
pH 7.5 containing 15% glycerol at 4 °C. The protein was concentrated using an
Amicon Ultra centrifugal filter device (Millipore, Billerca, MA).

144
4.4.10 Polyacrylamide gel electrophoresis (SDS-PAGE)
Protein standards, Powerpac 300 power supply, Mini-PROTEAN 3 assembly, and
precast acrylamide gels were purchased from Bio-Rad (Hercules, CA). Varying
amounts of samples, dependent upon protein concentrations, were mixed with 2 μl
SDS-PAGE loading buffer (30% glycerol, 1% SDS, 0.3% bromophenol blue, 0.5 M
Tris-HCl, pH 6.8) and water to a final volume of 20 μl. Samples were denatured at
98 °C for 10 minutes, cooled to 4 °C, and then loaded onto a gel in a Bio-Rad Mini-
PROTEAN 3 assembly. Voltage was supplied by a Powerpac 300 supply at a voltage
of 100 V for 100 minutes. Gels were stained with SimplyBlueTM Safestain from
Invitrogen (Carlsbad, CA) followed by destaining overnight in distilled water.
Destained SDS-PAGE gels were scanned subsequently discarded.
4.4.11 Western blot analysis of proteins
Proteins were subjected to SDS-PAGE as described above. The proteins were
then transferred to a polyvinylidene fluoride (PVDF) membrane using a Mini Trans-
Blot Cell from Bio-Rad (Hercules, CA). The PVDF membrane was blocked in 3%
non-fat milk in a phosphate buffered saline (PBS) buffer. The primary antibody, His-
tag mouse monoclonal antibody from Novagen (Madison WI) was added to the
blocking solution 1:1000 dilution and the membrane was incubated for 2 hours at
room temperature. The membrane was incubated with a secondary antibody, goat
anti-mouse antibody from Sigma (St. Louis, MO) for another 2 hrs at room
temperature, and then washed three times with PBS buffer. The membrane was then

145
incubated with Western blot substrate for 10 minutes to let the reaction reveal the
potential band.
4.5 References
1. Blodgett, J.A., Oh, D.C., Cao, S., Currie, C.R., Kolter, R. and Clardy, J. (2010) Common biosynthetic origins for polycyclic tetramate macrolactams from phylogenetically diverse bacteria. Proc Natl Acad Sci USA, 107, 11692-11697.
2. Graupner, P.R., Thornburgh, S., Mathieson, J.T., Chapin, E.L., Kemmitt, G.M., Brown, J.M. and Snipes, C.E. (1997) Dihydromaltophilin: a novel fungicidal tetramic acid containing metabolite from Streptomyces sp. J Antibiot, 50, 1014-1019.
3. Jakobi, M., Winkelmann, G., Kaiser, D., Kempler, C., Jung, G., Berg, G. and Bahl, H. (1996) Maltophilin: a new antifungal compound produced by Stenotrophomonas maltophilia R3089. J Antibiot, 49, 1101-1104.
4. Lou, L., Qian, G., Xie, Y., Hang, J., Chen, H., Zaleta-Rivera, K., Li, Y., Shen, Y., Dussault, P.H., Liu, F. et al. (2011) Biosynthesis of HSAF, a tetramic acid-containing macrolactam from Lysobacter enzymogenes. J Am Chem Soc, 133, 643-645.
5. Royles, B.J.L. (1995) Naturally-occurring tetramic acids-structure, isolation, and synthesis. Chem Rev, 95, 1981-2001.
6. Schobert, R. and Schlenk, A. (2008) Tetramic and tetronic acids: an update on new derivatives and biological aspects. Bioorg Med Chem, 16, 4203-4221.
7. Yu, F., Zaleta-Rivera, K., Zhu, X., Huffman, J., Millet, J.C., Harris, S.D., Yuen, G., Li, X.C. and Du, L. (2007) Structure and biosynthesis of heat-stable antifungal factor (HSAF), a broad-spectrum antimycotic with a novel mode of action. Antimicrob Agents Chemother, 51, 64-72.
8. Meyers, E., Cooper, R., Dean, L., Johnson, J.H., Slusarchyk, D.S., Trejo, W.H. and Singh, P.D. (1985) Catacandins, novel anticandidal antibiotics of bacterial origin. J Antibiot (Tokyo), 38, 1642-1648.
9. Gunasekera, S.P., Gunasekera, M. and Mccarthy, P. (1991) Discodermide - a new bioactive macrocyclic lactam from the marine sponge Discodermia Dissoluta. J Org Chem, 56, 4830-4833.
10. Kanazawa, S., Fusetani, N. and Matsunaga, S. (1993) Cylindramide - cytotoxic tetramic acid lactam from the marine sponge Halichondria-Cylindrata Tanita and Hoshino. Tetrahedron Lett, 34, 1065-1068.
11. Jomon, K., Kuroda, Y., Ajisaka, M. and Sakai, H. (1972) A new antibiotic, ikarugamycin. J Antibiot, 25, 271-280.
12. Blodgett, J.A., Oh, D.C., Cao, S., Currie, C.R., Kolter, R. and Clardy, J. (2010) Common biosynthetic origins for polycyclic tetramate macrolactams from phylogenetically diverse bacteria. Proc Natl Acad Sci U S A, 107, 11692-11697.

146
13. Antosch, J., Schaefers, F. and Gulder, T.A. (2014) Heterologous reconstitution of ikarugamycin biosynthesis in E. coli. Angew Chem Int Ed Engl, 53, 3011-3014.
14. Li, S., Du, L., Yuen, G. and Harris, S.D. (2006) Distinct ceramide synthases regulate polarized growth in the filamentous fungus Aspergillus nidulans. Mol Biol Cell, 17, 1218-1227.
15. Li, S.J., Calvo, A.M., Yuen, G.Y., Du, L.C. and Harris, S.D. (2009) Induction of cell wall thickening by the antifungal compound dihydromaltophilin disrupts fungal growth and is mediated by sphingolipid biosynthesis. J Eukaryot Microbiol, 56, 182-187.
16. Thevissen, K., Francois, I.E.J.A., Aerts, A.M. and Cammue, B.P.A. (2005) Fungal sphingolipids as targets for the development of selective antifungal therapeutics. Curr Drug Targets, 6, 923-928.
17. Xie, Y., Wright, S., Shen, Y. and Du, L. (2012) Bioactive natural products from Lysobacter. Nat Prod Rep, 29, 1277-1287.
18. Li, Y.Y., Huffman, J., Li, Y., Du, L.C. and Shen, Y.M. (2012) 3-Hydroxylation of the polycyclic tetramate macrolactam in the biosynthesis of antifungal HSAF from Lysobacter enzymogenes C3. Medchemcomm, 3, 982-986.
19. Woodyer, R.D., Shao, Z., Thomas, P.M., Kelleher, N.L., Blodgett, J.A., Metcalf, W.W., van der Donk, W.A. and Zhao, H. (2006) Heterologous production of fosfomycin and identification of the minimal biosynthetic gene cluster. Chem Biol, 13, 1171-1182.
20. Laemmli, U.K. (1970) Cleavage of structural proteins during the assembly of the head of bacteriophage T4. Nature, 227, 680-685.
21. Bradford, M.M. (1976) A rapid and sensitive method for the quantitation of microgram quantities of protein utilizing the principle of protein-dye binding. Anal Biochem, 72, 248-254.
22. Shao, Z. and Zhao, H. (2009) DNA assembler, an in vivo genetic method for rapid construction of biochemical pathways. Nucleic Acids Res, 37, e16.

147
4.6 Figures and tables
Figure 4.1 Characterization of the 7-gene cluster. (a) Vector map of the 7-gene cluster construct. (b) HPLC analysis of the 7-gene cluster construct compared with the 6-gene cluster construct.
24 26 28 30 32 34 36 38 40
Time (min)
RC6(6-gene) RC7(7-gene)
pYL-RC-SGR810-81626825 bp
SGR810
SGR811
SGR812
SGR813
SGR814
SGR815
SGR816
PhiC31 attP
int
tL3
oriR6K
accIV
oriT
oriT nicking site
CEN6
ARS H4
URA2
gapdhp(KR)
gapdhp(SG)
rpsLp(XC)
rpsLp(TP)
rpsLp(SG)
rpsLp(CF)
gapdhp(EL)
a b

148
Figure 4.2 Vector maps of the single-gene deletion constructs. For each single gene deletion construct, both the gene and its corresponding promoter were deleted.
pYL-RC-SG-6-gene-d81037075 bp
SGR811
SGR812
SGR813
SGR814SGR815
SGR805
SGR806
SGR807
SGR808
SGR809
SGR816
SGR817
SGR818
SGR819
SGR820
SGR821
SGR822
PhiC31 attP
int
tL3
CEN6
ARS H4
URA2
oriR6K
accIV
oriT
oriT nicking site
ermE*p
gapdhp(SG)
rpsLp(TP)
rpsLp(SG)
rpsLp(CF)
pYL-RC-SG-6-gene-d81137254 bp
SGR810
SGR812
SGR813
SGR814SGR815
SGR805
SGR806
SGR807
SGR808
SGR809
SGR816
SGR817
SGR818
SGR819
SGR820
SGR821
SGR822
PhiC31 attP
int
tL3
CEN6
ARS H4
URA2
oriR6K
accIV
oriT
oriT nicking site
gapdhp(KR)
ermE*p
rpsLp(TP)
rpsLp(SG)
rpsLp(CF)
pYL-RC-SG-6-gene-d81236523 bp
SGR810
SGR811
SGR813
SGR814SGR815
SGR805
SGR806
SGR807
SGR808
SGR809
SGR816
SGR817
SGR818
SGR819
SGR820
SGR821
SGR822
PhiC31 attP
int
tL3
CEN6
ARS H4
URA2
oriR6K
accIV
oriT
oriT nicking site
gapdhp(KR)
gapdhp(SG)
rpsLp(TP)
rpsLp(SG)
rpsLp(CF)
pYL-RC-SG-6-gene-d81336503 bp
SGR810
SGR811
SGR812
SGR814SGR815
SGR805
SGR806
SGR807
SGR808
SGR809
SGR816
SGR817
SGR818
SGR819
SGR820
SGR821
SGR822
PhiC31 attP
int
tL3
CEN6
ARS H4
URA2
oriR6K
accIV
oriT
oriT nicking site
gapdhp(SG)
gapdhp(KR)
ermE*p
rpsLp(SG)
rpsLp(CF)
pYL-RC-SG-6-gene-d81428767 bp
SGR810
SGR811
SGR812
SGR813
SGR815
SGR805
SGR806
SGR807
SGR808
SGR809
SGR816
SGR817
SGR818
SGR819
SGR820
SGR821
SGR822
PhiC31 attP
int
tL3
CEN6
ARS H4
URA2
oriR6K
accIV
oriT
oriT nicking site
gapdhp(KR)
gapdhp(SG)
ermE*p
rpsLp(TP)
rpsLp(CF)
pYL-RC-SG-6-gene-d81537188 bp
SGR810
SGR811
SGR812
SGR813
SGR814
SGR805
SGR806
SGR807
SGR808
SGR809
SGR816
SGR817
SGR818
SGR819
SGR820
SGR821
SGR822
PhiC31 attP
int
tL3
CEN6
ARS H4
URA2
oriR6K
accIV
oriT
oriT nicking site
gapdhp(KR)
gapdhp(SG)
ermE*p
rpsLp(TP)
rpsLp(SG)

149
Figure 4.3 HPLC analysis of single gene deletion constructs.
0 5 10 15 20 25 30 35
Time (min)
d815 d814 d813 d812 d811 d810 RC(6-gene) Control

150
Figure 4.4 Chemical structures of the products of the SGR810-815 gene-gene deletion clusters from S. griseus.
Compound c
C29
H39
N2O
5 494.2848
Compound d
C29
H37
N2O
4 476.2753
NH
O
NH
O
HO
O
HH
HH
H
H

151
a
b
Figure 4.5 LC/MS analysis of the S. lividans strain carrying the refactored deletion constructs. (a) MS data for compound c. (b) MS data for compound d.
102.3
495.4
511.3
596.3
495.4
511.3
+MS, 28.6min #2410
0.0
0.5
1.0
1.5
2.0
2.5
8x10Intens.
100 200 300 400 500 600 700 m/z
183.0231.1 253.4267.3
279.3293.3 331.3
398.4415.4 431.3
441.4
459.4
477.3
+MS2(495.7), 28.7min #2420
0
1
2
3
7x10Intens.
100 150 200 250 300 350 400 450 500 m/z
Compound c
C29
H39
N2O
5 494.2848
477.3
502.2
477.3+MS, 34.6min #2272
0.00
0.25
0.50
0.75
1.00
1.25
7x10Intens.
100 200 300 400 500 600 700 800 m/z
139.0164.9
183.0
213.1227.0 261.1279.1
293.1321.1
355.2 379.2 399.3 417.2
441.3
459.3
+MS2(477.6), 34.6min #2276
0.0
0.5
1.0
1.5
2.0
2.5
5x10Intens.
50 100 150 200 250 300 350 400 450 500 m/z
Compound d
C29
H37
N2O
4 476.2753
NH
O
NH
O
HO
O
HH
HH
H
H

152
Figure 4.6 NMR analysis of compound c from the refactored cryptic gene cluster SGR810-815. (a) 1H NMR spectrum. (b) Double-Quantum Filtered Correlation Spectroscopy (Phase-Sensitive) (DQ-COSY) NMR spectrum. (c) Heteronuclear Multiple Quantum Coherence (gHSQC) NMR spectrum. (d) Heteronuclear Multiple-Bond Correlation Spectroscopy (gHMBC) NMR spectrum.
b
a

153
Figure 4.6 (Cont.)
c
d
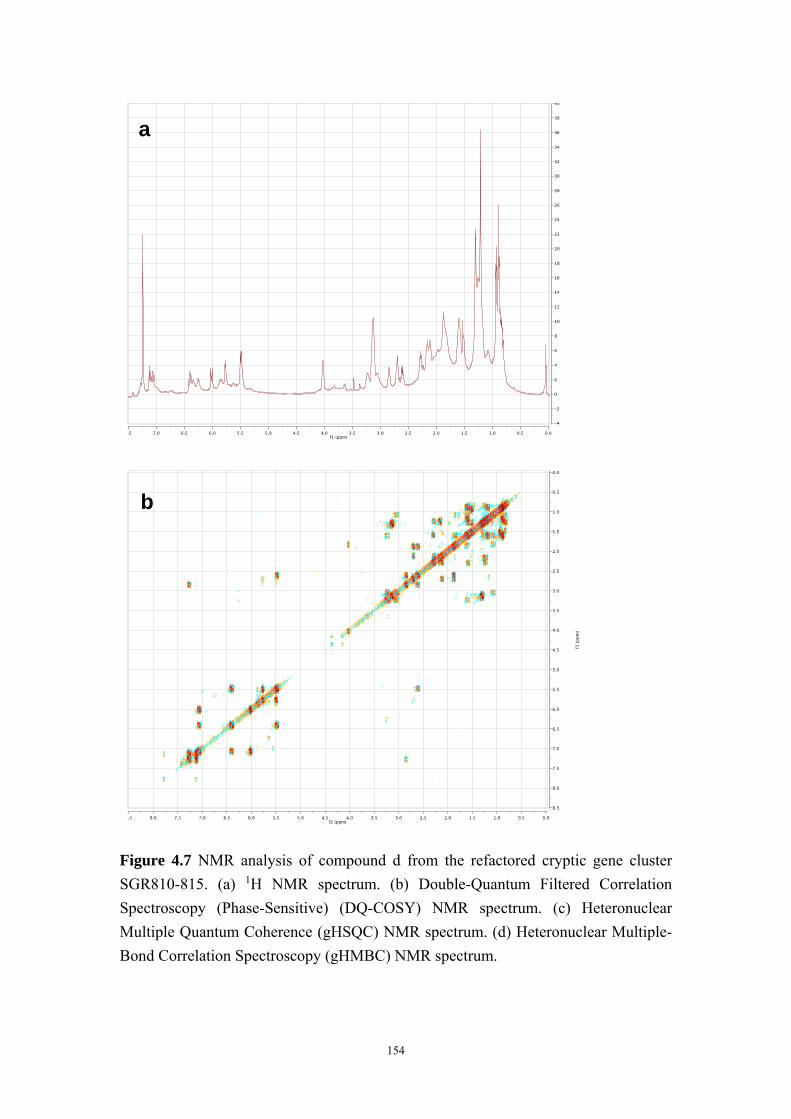
154
Figure 4.7 NMR analysis of compound d from the refactored cryptic gene cluster
SGR810-815. (a) 1H NMR spectrum. (b) Double-Quantum Filtered Correlation
Spectroscopy (Phase-Sensitive) (DQ-COSY) NMR spectrum. (c) Heteronuclear
Multiple Quantum Coherence (gHSQC) NMR spectrum. (d) Heteronuclear Multiple-
Bond Correlation Spectroscopy (gHMBC) NMR spectrum.
a
b

155
Figure 4.7 (Cont.)
c
d

156
Figure 4.8 Vector maps of the multiple-gene deletion constructs. pYL-RC-SGR814 only contains the gene SGR814 with gapdhp(EL) promoter; pYL-RC-SGR812-814 contains genes SGR812, SGR813, and SGR814 with corresponding promoters; pYL-RC-SGR812-815 contains genes SGR812, SGR813, SGR814 and SGR815 with corresponding promoters. pYL-RC-SGR810+812-814 contains genes SGR810, SGR812, SGR813 and SGR814 with corresponding promoters. pYL-RC-SGR811-814 contains genes SGR811, SGR812, SGR813 and SGR814 with corresponding promoters.
pYL-RC-SGR810+812-81421991 bp
SGR812
SGR813
SGR814
SGR810
PhiC31 attP
int
tL3
CEN6
ARS H4
URA2
oriR6K
accIV
oriT
oriT nicking site
yeast-f
Strep-rev
rpsLp(CF)
rpsLp(TP)
ermE*p
gapdhp(KR)
pYL-RC-SGR811-81421899 bp
SGR812
SGR813
SGR814
SGR811
PhiC31 attP
int
tL3
CEN6
ARS H4
URA2
oriR6K
accIV
oriT
oriT nicking site
yeast-f
Strep-rev
rpsLp(CF)
rpsLp(TP)
ermE*p
gapdhp(SG)
pYL-RC-SGR812-81420604 bp
SGR812
SGR813
SGR814
PhiC31 attP
int
tL3
CEN6
ARS H4
URA2
oriR6K
accIV
oriT
oriT nicking site
yeast-f
Strep-rev
ermE*p
rpsLp(TP)
rpsLp(CF)
pYL-RC-SGR812-81522602 bp
SGR812
SGR813
SGR814
SGR815
PhiC31 attP
int
tL3
CEN6
ARS H4
URA2
oriR6K
accIV
oriT
oriT nicking site
yeast-f
ermE*p
rpsLp(TP)
rpsLp(SG)
rpsLp(CF)
pYL-RC-SGR81416398 bp
SGR814
PhiC31 attP
int
tL3
oriR6K
accIV
oriT
oriT nicking site
CEN6
ARS H4
URA2
gapdhp(EL)

157
0 5 10 15 20 25 30 35
Time (min)
4 gene (811+812+813+814) 4-gene (810+812+813+814) 4-gene (812+813+814+815) 3-gene (812+813+814) RC (6-gene)
Figure 4.9 HPLC analysis of 3-gene and 4-gene constructs.

158
Figure 4.10 Chemical structures of the products of the SGR811-814 gene cluster from S. griseus.
Compound e
C29
H38
N2O
5 495.3
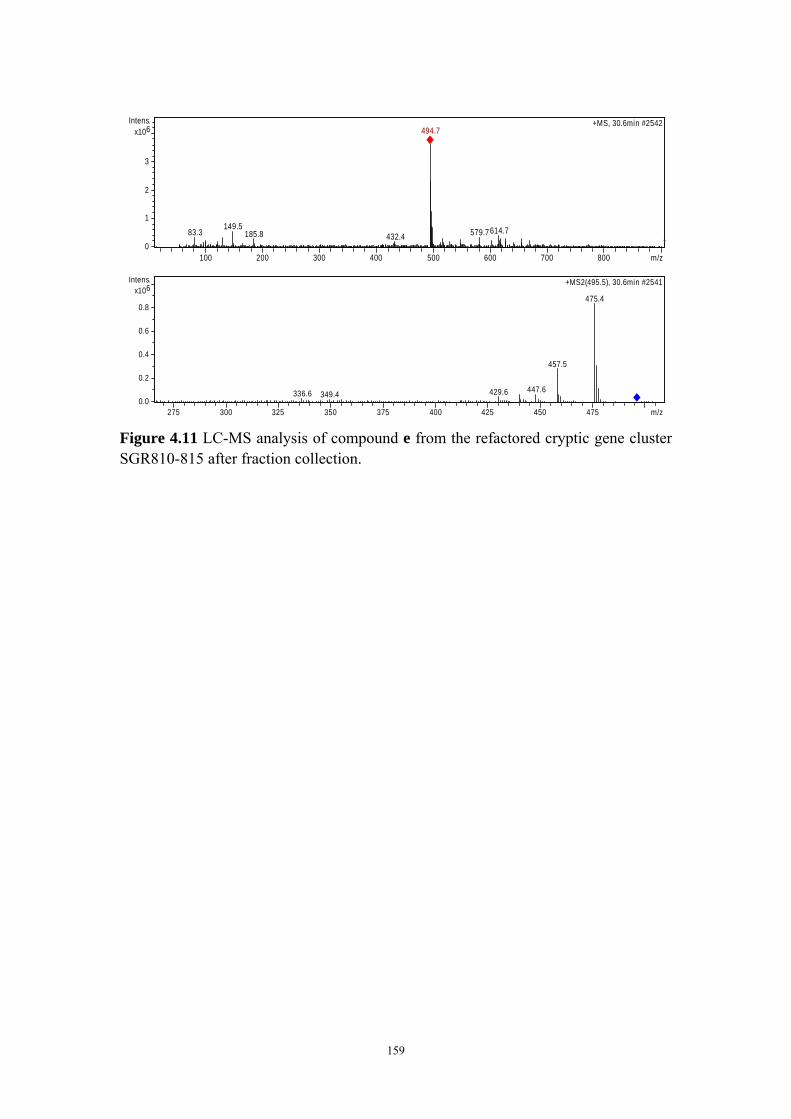
159
Figure 4.11 LC-MS analysis of compound e from the refactored cryptic gene cluster SGR810-815 after fraction collection.
83.3149.5
185.8 432.4
494.7
579.7614.7
494.7+MS, 30.6min #2542
0
1
2
3
6x10Intens.
100 200 300 400 500 600 700 800 m/z
336.6 349.4 429.6 447.6
457.5
475.4
+MS2(495.5), 30.6min #2541
0.0
0.2
0.4
0.6
0.8
6x10Intens.
275 300 325 350 375 400 425 450 475 m/z

160
Figure 4.12 NMR analysis of compound e from the refactored cryptic gene cluster SGR810-815. (a) 1H NMR spectrum. (b) Double-Quantum Filtered Correlation Spectroscopy (Phase-Sensitive) (DQ-COSY) NMR spectrum. (c) Heteronuclear Multiple Quantum Coherence (gHSQC) NMR spectrum. (d) Heteronuclear Multiple-Bond Correlation Spectroscopy (gHMBC) NMR spectrum.
a
b

161
Figure 4.12 (Cont.)
c
d

162
Figure 4.13 Proposed biosynthetic mechanism for formation of the five tetramic acid-containing macrolactams. The PKS is responsible for the hexaketide chain synthesis and works together with the NRPS to condense the two polyketide chains with ornithine. The formation of the first polycyclic ring is catalyzed by SGR812 and the second ring is closed by SGR813. Compound c is the key intermediate that can be converted into compound a by SGR815 or compound b by SGR810 or compound e by SGR811. A shunt product compound d will be formed if SGR813 is absent in the cluster. SEnz is the carrier protein within the PKS or NRPS. The red structures are the ones with full-set of NMR data.

163
a
b
c
d
Figure 4.14 SDS-PAGE analysis of proten overexpression. (a) SGR810. (b) SGR811. (c) SGR815. (d) Purification of SGR810 and SGR815.

164
Figure 4.15 Vector maps of the multiple-gene deletion constructs of the HSAF pathway. pYL-FC-HSAF-3-genes contains homologs of genes SGR812, SGR813, and SGR814 with corresponding promoters; pYL-FC-HSAF-3+1-genes contains homologs of genes SGR812, SGR813, SGR814 and SGR811 with corresponding promoters. pYL-FC-HSAF-4-genes contains homologs of genes SGR812, SGR813 SGR814 and OX1 from HSAF with corresponding promoters. pYL-FC-HSAF-4+1-genes contains homologs of genes SGR811, SGR812, SGR813, SGR814 and OX1 from HSAF with corresponding promoters.
pYL-FC-HSAF-3 genes20558 bp
OX3-812
OX2-813
PKS/NRPS
PhiC31 attP
int
tL3
CEN6
ARS H4
URA2
oriR6K
accIV
oriT
oriT nicking site
gapdhp(SG)
ermE*p
rpsLp(CF)
pYL-FC-HSAF-3+1 genes21849 bp
OX3-812
OX2-813
OX4-811
PKS/NRPS
PhiC31 attP
int
tL3
CEN6
ARS H4
URA2
oriR6K
accIV
oriT
oriT nicking site
gapdhp(SG)
ermE*p
rpsLp(CF)
gapdhp(KR)
pYL-FC-HSAF-4 genes22645 bp
OX3-812
OX2-813
OX1
PKS/NRPS
PhiC31 attP
int
tL3
CEN6
ARS H4
URA2
oriR6K
accIV
oriT
oriT nicking site
gapdhp(SG)
ermE*p
rpsLp(TP)
rpsLp(CF)
pYL-FC-HSAF-4+1 genes23936 bp
OX3-812
OX2-813
OX1
OX4-811
PKS/NRPS
PhiC31 attP
int
tL3
CEN6
ARS H4
URA2
oriR6K
accIV
oriT
oriT nicking site
gapdhp(SG)
ermE*p
rpsLp(TP)rpsLp(CF)
gapdhp(KR)

165
Figure 4.16 LC/MS analysis of the S. lividans strain carrying the refactored deletion HSAF constructs. MS data for key intermediate from the HSAF 3-gene pathway.
197.1394.6
477.4
614.5 664.5702.5 746.5 780.5
477.4+MS, 34.5min #2616
0.0
0.2
0.4
0.6
0.8
8x10Intens.
100 200 300 400 500 600 700 800 m/z
139.1
183.0
195.1 211.1
237.2 253.2
279.3
303.3 321.3
345.2 373.2398.4
424.3
441.3
459.2
+MS2(477.9), 33.6min #2541
0
1
2
3
4
5x10Intens.
50 100 150 200 250 300 350 400 450 500 m/z

166
Table 4.1 The primers used for refactoring the cryptic S. griseus gene cluster SGR 810-816.
Construct Primer name Primer sequence (5’-3’) pYL-FC-SGR810-816
810-for ccggtgcggggcccggtgagcgccgggccccgcaccggtcctaccacctgacgccgagcc 810-rev gccggagtgcaccgcacacccactcgcagaggagattgcaatgcaccggctgttcttcga gapdhp(KR)-for gacggggcggccccggttcctcgaagaacagccggtgcattgcaatctcctctgcgagtg gapdhp(KR)-rev gttgaccacgaccgaccccacgcgtccggccccggtgccgcacgggccggtgaaccccgc 811-for ccacatgaaccaacattcatgcggggttcaccggcccgtgcggcaccggggccggacgcg 811-rev ggcgtcgaaaaccggcgtacctaacgaggagatcggttcatgaagatcgcgaaatgggtg gapdhp(SG)-for cttcgacgtgttcgcggaccacccatttcgcgatcttcatgaaccgatctcctcgttagg gapdhp(SG)-rev gcccgttcgtcccgccgcaccgacggagaggaagtcatgactcggcggcgagcgggggac 812-for gctggaccacgcgggcgcgccgacgacgggcgccccggtgtcatgacttcctctccgtcg 812-rev tgccggttggtaggacaccactcgcgagagaggcgtatccgtgagcggcgacaggacagg rpsLp(XC)-for gggcgcccccgggccgggtccctgtcctgtcgccgctcacggatacgcctctctcgcgag rpsLp(XC)-rev gctcgaccggtggtccgcacgggagagcgaggaagcgtgaggtaccagcccgacccgagc 813-for gaccaggcgtgccggcgcgtgctcgggtcgggctggtacctcacgcttcctcgctctccc 813-rev gccgatggcagccgaaacgaagtaaggaacctgcgcttctatggcggatgacgatgacgaccccac rpsLp(TP)-for gttccctgctggtccagtcggtggggtcgtcatccgccatagaagcgcaggttccttact rpsLp(TP)-rev gcgctccgtcctggggggagacgcggcccatggcggatgaaccgggtccgcgatcggcgg 814-for gtggtcaaaagtgttcgcctccgccgatcgcggacccggttcatccgccatgggccgcgt 814-1-rev ggcaaactcatcgacctcga 814-2-for ctcgtcggtgatgtcgaggg 814-rev aggttagtttcacgaacggcacacagaaaccggagaagtaatggccgacgcgaacaaccg rpsLp(SG)-for ccaccttgttccgtaacgcccggttgttcgcgtcggccattacttctccggtttctgtgt rpsLp(SG)-rev tgcaccacggcttgctccaccacgacttgaggagttcggcaggggcgcgcggccccggcc 815-for ccccggacgggacggccggcggccggggccgcgcgcccctgccgaactcctcaagtcgtg 815-rev gtgccggtcagaccagagaacaccgacagacggagacgtaatggacgagcgcgagcactc rpsLp(CF)-for aatatattccgccatcggcggagtgctcgcgctcgtccattacgtctccgtctgtcggtg rpsLp(CF)-rev tctctctctccccctcatcgccacttgtggagggtcacggcccgccgcgggcgctggagg 8-for cggcccggggcccgcccgagcctccagcgcccgcggcgggcgtgaccctccacaagtggc 8-rev gtaaggtgcccgtagacgcacgtccgaccgaaggagcagcggggggctcctcgattcgtt gapdhp(EL)-for cgtccggcagcacatcagcgaacgaatcgaggagccccccgctgctccttcggtcggacg gapdhp(EL)-rev cggggaactgggcgcgcaccgcgccgatgtcgtacgacaagcgtatcccctttcagatac 816-for tcctgcaattcttagtgcgagtatctgaaaggggatacgcttgtcgtacgacatcggcgc 816-rev caggtggcacttttcgcttcgtcatctgggccctggccgctcacccctgtcgcagccagt yeast-for cgaaaagtgccacctgggtc yeast-rev gtgagtttagtatacatgca E.coli-for aaaactgtattataagtaaatgcatgtatactaaactcatgtcatcacgatactgtgat E.coli-rev aatattgtgagtttagtatacatgca Streptomyces-for
acccattcaaaggccggcattttcagcgtgacatcattctgtgggccgtacgctggtact
Streptomyces-rev
gtgcggggcccggcgctcaccgggccccgcaccgggggttcgcaatccagtgcaaagcta

167
Table 4.2 The primers used for the single-gene deletion constructs of S. griseus gene cluster.
Construct Primer name Primer sequence (5’-3’) pYL-RC-SG-6-gene-d810
1-for gtagaaacagacgaagaagctagctttgcactggattgcggtgggtcctttcgggtcgac 1-1-rev gatggttggcgatgccgttg 1-1-for gaccttcgagcaggccaacc 1-rev ccgggcggccaaccggggcaaggtactcgtcgaactctgagaccggtgcggggcccggcg 811-for ccggtgcggggcccggtgagcgccgggccccgcaccggtctcagagttcgacgagtacct 811-rev ggcgtcgaaaaccggcgtacctaacgaggagatcggttcatgaagatcgcgaaatgggtg gapdhp(SG)-for cttcgacgtgttcgcggaccacccatttcgcgatcttcatgaaccgatctcctcgttagg gapdhp(SG)-rev gcccgttcgtcccgccgcaccgacggagaggaagtcatgactcggcggcgagcgggggac 812-for gctggaccacgcgggcgcgccgacgacgggcgccccggtgtcatgacttcctctccgtcg 812-rev tgccggttggtaggacaccactcgcgagagaggcgtatccgtgagcggcgacaggacagg ermEp-for gggcgcccccgggccgggtccctgtcctgtcgccgctcacggatacgcctctctcgcgag ermEp-rev gctcgaccggtggtccgcacgggagagcgaggaagcgtgaggtaccagcccgacccgagc 813-for gaccaggcgtgccggcgcgtgctcgggtcgggctggtacctcacgcttcctcgctctccc 813-rev gccgatggcagccgaaacgaagtaaggaacctgcgcttctatggcggatgacgatgacgaccccac rpsLp(TP)-for gttccctgctggtccagtcggtggggtcgtcatccgccatagaagcgcaggttccttact rpsLp(TP)-rev gcgctccgtcctggggggagacgcggcccatggcggatgaaccgggtccgcgatcggcgg 814-for gtggtcaaaagtgttcgcctccgccgatcgcggacccggttcatccgccatgggccgcgt 814-1-rev ggcaaactcatcgacctcga 814-2-for ctcgtcggtgatgtcgaggg 814-rev aggttagtttcacgaacggcacacagaaaccggagaagtaatggccgacgcgaacaaccg rpsLp(SG)-for ccaccttgttccgtaacgcccggttgttcgcgtcggccattacttctccggtttctgtgt rpsLp(SG)-rev tgcaccacggcttgctccaccacgacttgaggagttcggcaggggcgcgcggccccggcc 815-for ccccggacgggacggccggcggccggggccgcgcgcccctgccgaactcctcaagtcgtg 815-rev gtgccggtcagaccagagaacaccgacagacggagacgtaatggacgagcgcgagcactc rpsLp(CF)-for aatatattccgccatcggcggagtgctcgcgctcgtccattacgtctccgtctgtcggtg rpsLp(CF)-rev tctctctctccccctcatcgccacttgtggagggtcacggcccgccgcgggcgctggagg 8-for cggcccggggcccgcccgagcctccagcgcccgcggcgggcgtgaccctccacaagtggc 8-rev ttatagcacgtgatgaaaaggacccaggtggcacttttcggggggctcctcgattcgtt 9-for cggcacccttccctacgagt 9-rev ttgaggagtgcctccaggtc 10-for ggttcggacgaagacgcgtc 10-rev ttatagcacgtgatgaaaaggacccaggtggcacttttcgcttcgtcatctgggccctgg yeast-for cgaaaagtgccacctgggtc yeast-rev gtgagtttagtatacatgca E.coli-for aaaactgtattataagtaaatgcatgtatactaaactcatgtcatcacgatactgtgat E.coli-rev aatattgtgagtttagtatacatgca Streptomyces-for
acccattcaaaggccggcattttcagcgtgacatcattctgtgggccgtacgctggtact
Streptomyces-rev
ccgcgatactgcgacgagccgtcgacccgaaaggacccaccgcaatccagtgcaaagcta
pYL-RC-SG-6-gene-d811
1-for gtagaaacagacgaagaagctagctttgcactggattgcggtgggtcctttcgggtcgac 1-1-rev gatggttggcgatgccgttg 1-1-for gaccttcgagcaggccaacc 1-rev gacctcccgcagcccgcggcggctcggcgtcaggtggtaggaccggtgcggggcccggcg 810-for ccggtgcggggcccggtgagcgccgggccccgcaccggtcctaccacctgacgccgagcc 810-rev gccggagtgcaccgcacacccactcgcagaggagattgcaatgcaccggctgttcttcga gapdhp(KR)-for gacggggcggccccggttcctcgaagaacagccggtgcattgcaatctcctctgcgagtg gapdhp(KR)-rev gttgaccacgaccgaccccacgcgtccggccccggtgccgcacgggccggtgaaccccgc Gap-for ccacatgaaccaacattcatgcggggttcaccggcccgtgcggcaccggggccggacgcg Gap-rev gcccgttcgtcccgccgcaccgacggagaggaagtcatgaacgcgacccgccctccgttc 812-for ctgggcagcaccgtcggatcgaacggagggcgggtcgcgttcatgacttcctctccgtcg 812-rev tgccggttggtaggacaccactcgcgagagaggcgtatccgtgagcggcgacaggacagg ermEp-for gggcgcccccgggccgggtccctgtcctgtcgccgctcacggatacgcctctctcgcgag ermEp-rev gctcgaccggtggtccgcacgggagagcgaggaagcgtgaggtaccagcccgacccgagc 813-for gaccaggcgtgccggcgcgtgctcgggtcgggctggtacctcacgcttcctcgctctccc 813-rev gccgatggcagccgaaacgaagtaaggaacctgcgcttctatggcggatgacgatgacgaccccac rpsLp(TP)-for gttccctgctggtccagtcggtggggtcgtcatccgccatagaagcgcaggttccttact rpsLp(TP)-rev gcgctccgtcctggggggagacgcggcccatggcggatgaaccgggtccgcgatcggcgg 814-for gtggtcaaaagtgttcgcctccgccgatcgcggacccggttcatccgccatgggccgcgt 814-1-rev ggcaaactcatcgacctcga 814-2-for ctcgtcggtgatgtcgaggg 814-rev aggttagtttcacgaacggcacacagaaaccggagaagtaatggccgacgcgaacaaccg rpsLp(SG)-for ccaccttgttccgtaacgcccggttgttcgcgtcggccattacttctccggtttctgtgt rpsLp(SG)-rev tgcaccacggcttgctccaccacgacttgaggagttcggcaggggcgcgcggccccggcc 815-for ccccggacgggacggccggcggccggggccgcgcgcccctgccgaactcctcaagtcgtg

168
Table 4.2 (Cont.)
Construct Primer name Primer sequence pYL-RC-SG-6-gene-d811
815-rev gtgccggtcagaccagagaacaccgacagacggagacgtaatggacgagcgcgagcactc rpsLp(CF)-for aatatattccgccatcggcggagtgctcgcgctcgtccattacgtctccgtctgtcggtg rpsLp(CF)-rev tctctctctccccctcatcgccacttgtggagggtcacggcccgccgcgggcgctggagg 8-for cggcccggggcccgcccgagcctccagcgcccgcggcgggcgtgaccctccacaagtggc 8-rev ttatagcacgtgatgaaaaggacccaggtggcacttttcggggggctcctcgattcgtt 9-for cggcacccttccctacgagt 9-rev ttgaggagtgcctccaggtc 10-for ggttcggacgaagacgcgtc 10-rev ttatagcacgtgatgaaaaggacccaggtggcacttttcgcttcgtcatctgggccctgg yeast-for cgaaaagtgccacctgggtc yeast-rev gtgagtttagtatacatgca E.coli-for aaaactgtattataagtaaatgcatgtatactaaactcatgtcatcacgatactgtgat E.coli-rev aatattgtgagtttagtatacatgca Streptomyces-for acccattcaaaggccggcattttcagcgtgacatcattctgtgggccgtacgctggtact Streptomyces-rev
ccgcgatactgcgacgagccgtcgacccgaaaggacccaccgcaatccagtgcaaagcta
pYL-RC-SG-6-gene-d812
1-for gtagaaacagacgaagaagctagctttgcactggattgcggtgggtcctttcgggtcgac 1-1-rev gatggttggcgatgccgttg 1-1-for gaccttcgagcaggccaacc 1-rev gacctcccgcagcccgcggcggctcggcgtcaggtggtaggaccggtgcggggcccggcg 810-for ccggtgcggggcccggtgagcgccgggccccgcaccggtcctaccacctgacgccgagcc 810-rev gccggagtgcaccgcacacccactcgcagaggagattgcaatgcaccggctgttcttcga gapdhp(KR)-for gacggggcggccccggttcctcgaagaacagccggtgcattgcaatctcctctgcgagtg gapdhp(KR)-rev gttgaccacgaccgaccccacgcgtccggccccggtgccgcacgggccggtgaaccccgc 811-for ccacatgaaccaacattcatgcggggttcaccggcccgtgcggcaccggggccggacgcg 811-rev ggcgtcgaaaaccggcgtacctaacgaggagatcggttcatgaagatcgcgaaatgggtg gapdhp(SG)-for cttcgacgtgttcgcggaccacccatttcgcgatcttcatgaaccgatctcctcgttagg gapdhp(SG)-rev gctcgaccggtggtccgcacgggagagcgaggaagcgtgactcggcggcgagcgggggac 813-for ccggcgggtgcgggaccaacgtcccccgctcgccgccgagtcacgcttcctcgctctccc 813-rev gccgatggcagccgaaacgaagtaaggaacctgcgcttctatggcggatgacgatgacgaccccac rpsLp(TP)-for gttccctgctggtccagtcggtggggtcgtcatccgccatagaagcgcaggttccttact rpsLp(TP)-rev gcgctccgtcctggggggagacgcggcccatggcggatgaaccgggtccgcgatcggcgg 814-for gtggtcaaaagtgttcgcctccgccgatcgcggacccggttcatccgccatgggccgcgt 814-1-rev ggcaaactcatcgacctcga 814-2-for ctcgtcggtgatgtcgaggg 814-rev aggttagtttcacgaacggcacacagaaaccggagaagtaatggccgacgcgaacaaccg rpsLp(SG)-for ccaccttgttccgtaacgcccggttgttcgcgtcggccattacttctccggtttctgtgt rpsLp(SG)-rev tgcaccacggcttgctccaccacgacttgaggagttcggcaggggcgcgcggccccggcc 815-for ccccggacgggacggccggcggccggggccgcgcgcccctgccgaactcctcaagtcgtg 815-rev gtgccggtcagaccagagaacaccgacagacggagacgtaatggacgagcgcgagcactc rpsLp(CF)-for aatatattccgccatcggcggagtgctcgcgctcgtccattacgtctccgtctgtcggtg rpsLp(CF)-rev tctctctctccccctcatcgccacttgtggagggtcacggcccgccgcgggcgctggagg 8-for cggcccggggcccgcccgagcctccagcgcccgcggcgggcgtgaccctccacaagtggc 8-rev ttatagcacgtgatgaaaaggacccaggtggcacttttcggggggctcctcgattcgtt 9-for cggcacccttccctacgagt 9-rev ttgaggagtgcctccaggtc 10-for ggttcggacgaagacgcgtc 10-rev ttatagcacgtgatgaaaaggacccaggtggcacttttcgcttcgtcatctgggccctgg yeast-for cgaaaagtgccacctgggtc yeast-rev gtgagtttagtatacatgca E.coli-for aaaactgtattataagtaaatgcatgtatactaaactcatgtcatcacgatactgtgat E.coli-rev aatattgtgagtttagtatacatgca Streptomyces-for acccattcaaaggccggcattttcagcgtgacatcattctgtgggccgtacgctggtact Streptomyces-rev
ccgcgatactgcgacgagccgtcgacccgaaaggacccaccgcaatccagtgcaaagcta
pYL-RC-SG-6-gene-d813
1-for gtagaaacagacgaagaagctagctttgcactggattgcggtgggtcctttcgggtcgac 1-1-rev gatggttggcgatgccgttg 1-1-for gaccttcgagcaggccaacc 1-rev gacctcccgcagcccgcggcggctcggcgtcaggtggtaggaccggtgcggggcccggcg 810-for ccggtgcggggcccggtgagcgccgggccccgcaccggtcctaccacctgacgccgagcc 810-rev gccggagtgcaccgcacacccactcgcagaggagattgcaatgcaccggctgttcttcga gapdhp(KR)-for gacggggcggccccggttcctcgaagaacagccggtgcattgcaatctcctctgcgagtg gapdhp(KR)-rev gttgaccacgaccgaccccacgcgtccggccccggtgccgcacgggccggtgaaccccgc 811-for ccacatgaaccaacattcatgcggggttcaccggcccgtgcggcaccggggccggacgcg 811-rev ggcgtcgaaaaccggcgtacctaacgaggagatcggttcatgaagatcgcgaaatgggtg gapdhp(SG)-for cttcgacgtgttcgcggaccacccatttcgcgatcttcatgaaccgatctcctcgttagg gapdhp(SG)-rev gcccgttcgtcccgccgcaccgacggagaggaagtcatgactcggcggcgagcgggggac

169
Table 4.2 (Cont.)
Construct Primer name Primer sequence pYL-RC-SG-6-gene-d813
812-for gctggaccacgcgggcgcgccgacgacgggcgccccggtgtcatgacttcctctccgtcg 812-rev tgccggttggtaggacaccactcgcgagagaggcgtatccgtgagcggcgacaggacagg ermEp-for gggcgcccccgggccgggtccctgtcctgtcgccgctcacggatacgcctctctcgcgag ermEp-rev gcgctccgtcctggggggagacgcggcccatggcggatgaggtaccagcccgacccgagc 814-for gaccaggcgtgccggcgcgtgctcgggtcgggctggtacctcatccgccatgggccgcgt 814-1-rev ggcaaactcatcgacctcga 814-2-for ctcgtcggtgatgtcgaggg 814-rev aggttagtttcacgaacggcacacagaaaccggagaagtaatggccgacgcgaacaaccg rpsLp(SG)-for ccaccttgttccgtaacgcccggttgttcgcgtcggccattacttctccggtttctgtgt rpsLp(SG)-rev tgcaccacggcttgctccaccacgacttgaggagttcggcaggggcgcgcggccccggcc 815-for ccccggacgggacggccggcggccggggccgcgcgcccctgccgaactcctcaagtcgtg 815-rev gtgccggtcagaccagagaacaccgacagacggagacgtaatggacgagcgcgagcactc rpsLp(CF)-for aatatattccgccatcggcggagtgctcgcgctcgtccattacgtctccgtctgtcggtg rpsLp(CF)-rev tctctctctccccctcatcgccacttgtggagggtcacggcccgccgcgggcgctggagg 8-for cggcccggggcccgcccgagcctccagcgcccgcggcgggcgtgaccctccacaagtggc 8-rev ttatagcacgtgatgaaaaggacccaggtggcacttttcggggggctcctcgattcgtt 9-for cggcacccttccctacgagt 9-rev ttgaggagtgcctccaggtc 10-for ggttcggacgaagacgcgtc 10-rev ttatagcacgtgatgaaaaggacccaggtggcacttttcgcttcgtcatctgggccctgg yeast-for cgaaaagtgccacctgggtc yeast-rev gtgagtttagtatacatgca E.coli-for aaaactgtattataagtaaatgcatgtatactaaactcatgtcatcacgatactgtgat E.coli-rev aatattgtgagtttagtatacatgca Streptomyces-for
acccattcaaaggccggcattttcagcgtgacatcattctgtgggccgtacgctggtact
Streptomyces-rev
ccgcgatactgcgacgagccgtcgacccgaaaggacccaccgcaatccagtgcaaagcta
pYL-RC-SG-6-gene-d814
1-for gtagaaacagacgaagaagctagctttgcactggattgcggtgggtcctttcgggtcgac 1-1-rev gatggttggcgatgccgttg 1-1-for gaccttcgagcaggccaacc 1-rev gacctcccgcagcccgcggcggctcggcgtcaggtggtaggaccggtgcggggcccggcg 810-for ccggtgcggggcccggtgagcgccgggccccgcaccggtcctaccacctgacgccgagcc 810-rev gccggagtgcaccgcacacccactcgcagaggagattgcaatgcaccggctgttcttcga gapdhp(KR)-for gacggggcggccccggttcctcgaagaacagccggtgcattgcaatctcctctgcgagtg gapdhp(KR)-rev gttgaccacgaccgaccccacgcgtccggccccggtgccgcacgggccggtgaaccccgc 811-for ccacatgaaccaacattcatgcggggttcaccggcccgtgcggcaccggggccggacgcg 811-rev ggcgtcgaaaaccggcgtacctaacgaggagatcggttcatgaagatcgcgaaatgggtg gapdhp(SG)-for cttcgacgtgttcgcggaccacccatttcgcgatcttcatgaaccgatctcctcgttagg gapdhp(SG)-rev gcccgttcgtcccgccgcaccgacggagaggaagtcatgactcggcggcgagcgggggac 812-for gctggaccacgcgggcgcgccgacgacgggcgccccggtgtcatgacttcctctccgtcg 812-rev tgccggttggtaggacaccactcgcgagagaggcgtatccgtgagcggcgacaggacagg ermEp-for gggcgcccccgggccgggtccctgtcctgtcgccgctcacggatacgcctctctcgcgag ermEp-rev gctcgaccggtggtccgcacgggagagcgaggaagcgtgaggtaccagcccgacccgagc 813-for gaccaggcgtgccggcgcgtgctcgggtcgggctggtacctcacgcttcctcgctctccc 813-rev gccgatggcagccgaaacgaagtaaggaacctgcgcttctatggcggatgacgatgacgaccccac rpsLp(TP)-for gttccctgctggtccagtcggtggggtcgtcatccgccatagaagcgcaggttccttact rpsLp(TP)-rev tgcaccacggcttgctccaccacgacttgaggagttcggcaccgggtccgcgatcggcgg Gap-for gtggtcaaaagtgttcgcctccgccgatcgcggacccggtgccgaactcctcaagtcgtg Gap-rev ctggcgacgccgaccggcgccgggccccgcgccggagtgagcaccccctccggagctccg 815-for ccccggacgggacggccggcggccggggccgcgcgcccctgccgaactcctcaagtcgtg 815-rev gtgccggtcagaccagagaacaccgacagacggagacgtaatggacgagcgcgagcactc rpsLp(CF)-for aatatattccgccatcggcggagtgctcgcgctcgtccattacgtctccgtctgtcggtg rpsLp(CF)-rev tctctctctccccctcatcgccacttgtggagggtcacggcccgccgcgggcgctggagg 8-for cggcccggggcccgcccgagcctccagcgcccgcggcgggcgtgaccctccacaagtggc 8-rev ttatagcacgtgatgaaaaggacccaggtggcacttttcggggggctcctcgattcgtt 9-for cggcacccttccctacgagt 9-rev ttgaggagtgcctccaggtc 10-for ggttcggacgaagacgcgtc 10-rev ttatagcacgtgatgaaaaggacccaggtggcacttttcgcttcgtcatctgggccctgg yeast-for cgaaaagtgccacctgggtc yeast-rev gtgagtttagtatacatgca E.coli-for aaaactgtattataagtaaatgcatgtatactaaactcatgtcatcacgatactgtgat E.coli-rev aatattgtgagtttagtatacatgca Streptomyces-for
acccattcaaaggccggcattttcagcgtgacatcattctgtgggccgtacgctggtact
Streptomyces-rev
ccgcgatactgcgacgagccgtcgacccgaaaggacccaccgcaatccagtgcaaagcta

170
Table 4.2 (Cont.)
Construct Primer name Primer sequence pYL-RC-SG-6-gene-d815
1-for gtagaaacagacgaagaagctagctttgcactggattgcggtgggtcctttcgggtcgac 1-1-rev gatggttggcgatgccgttg 1-1-for gaccttcgagcaggccaacc 1-rev gacctcccgcagcccgcggcggctcggcgtcaggtggtaggaccggtgcggggcccggcg 810-for ccggtgcggggcccggtgagcgccgggccccgcaccggtcctaccacctgacgccgagcc 810-rev gccggagtgcaccgcacacccactcgcagaggagattgcaatgcaccggctgttcttcga gapdhp(KR)-for gacggggcggccccggttcctcgaagaacagccggtgcattgcaatctcctctgcgagtg gapdhp(KR)-rev gttgaccacgaccgaccccacgcgtccggccccggtgccgcacgggccggtgaaccccgc 811-for ccacatgaaccaacattcatgcggggttcaccggcccgtgcggcaccggggccggacgcg 811-rev ggcgtcgaaaaccggcgtacctaacgaggagatcggttcatgaagatcgcgaaatgggtg gapdhp(SG)-for cttcgacgtgttcgcggaccacccatttcgcgatcttcatgaaccgatctcctcgttagg gapdhp(SG)-rev gcccgttcgtcccgccgcaccgacggagaggaagtcatgactcggcggcgagcgggggac 812-for gctggaccacgcgggcgcgccgacgacgggcgccccggtgtcatgacttcctctccgtcg 812-rev tgccggttggtaggacaccactcgcgagagaggcgtatccgtgagcggcgacaggacagg ermEp-for gggcgcccccgggccgggtccctgtcctgtcgccgctcacggatacgcctctctcgcgag ermEp-rev gctcgaccggtggtccgcacgggagagcgaggaagcgtgaggtaccagcccgacccgagc 813-for gaccaggcgtgccggcgcgtgctcgggtcgggctggtacctcacgcttcctcgctctccc 813-rev gccgatggcagccgaaacgaagtaaggaacctgcgcttctatggcggatgacgatgacgaccccac rpsLp(TP)-for gttccctgctggtccagtcggtggggtcgtcatccgccatagaagcgcaggttccttact rpsLp(TP)-rev gcgctccgtcctggggggagacgcggcccatggcggatgaaccgggtccgcgatcggcgg 814-for gtggtcaaaagtgttcgcctccgccgatcgcggacccggttcatccgccatgggccgcgt 814-1-rev ggcaaactcatcgacctcga 814-2-for ctcgtcggtgatgtcgaggg 814-rev aggttagtttcacgaacggcacacagaaaccggagaagtaatggccgacgcgaacaaccg rpsLp(SG)-for ccaccttgttccgtaacgcccggttgttcgcgtcggccattacttctccggtttctgtgt rpsLp(SG)-rev tgcaccacggcttgctccaccacgacttgaggagttcggcaggggcgcgcggccccggcc 8-for ccccggacgggacggccggcggccggggccgcgcgcccctgccgaactcctcaagtcgtg 8-rev gtctctctctccccctcatcgccacttgtggagggtcacggcaccccctccggagctccg 9-for cgtgctggagggggccgtgacggagctccggagggggtgccgtgaccctccacaagtggc 9-rev ttgaggagtgcctccaggtc 10-for ggttcggacgaagacgcgtc 10-rev ttatagcacgtgatgaaaaggacccaggtggcacttttcgcttcgtcatctgggccctgg yeast-for cgaaaagtgccacctgggtc yeast-rev gtgagtttagtatacatgca E.coli-for aaaactgtattataagtaaatgcatgtatactaaactcatgtcatcacgatactgtgat E.coli-rev aatattgtgagtttagtatacatgca Streptomyces-for
acccattcaaaggccggcattttcagcgtgacatcattctgtgggccgtacgctggtact
Streptomyces-rev
ccgcgatactgcgacgagccgtcgacccgaaaggacccaccgcaatccagtgcaaagcta
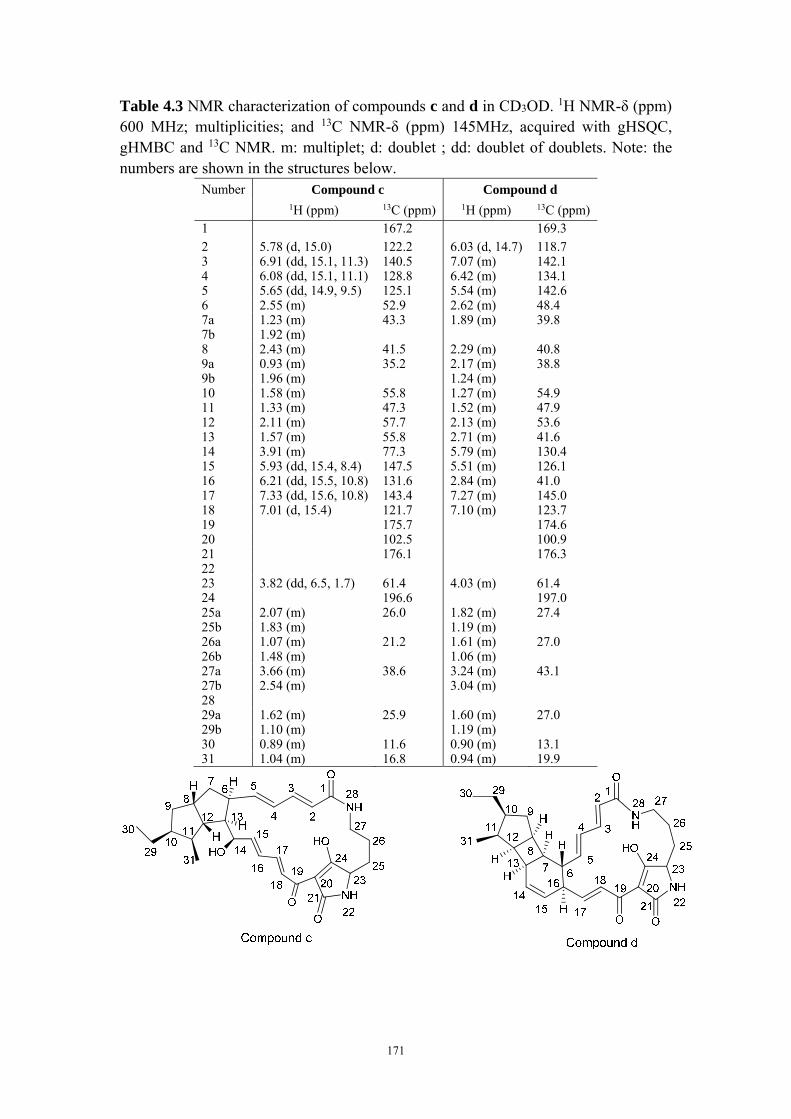
171
Table 4.3 NMR characterization of compounds c and d in CD3OD. 1H NMR-δ (ppm) 600 MHz; multiplicities; and 13C NMR-δ (ppm) 145MHz, acquired with gHSQC, gHMBC and 13C NMR. m: multiplet; d: doublet ; dd: doublet of doublets. Note: the numbers are shown in the structures below.
Number Compound c Compound d
1H (ppm) 13C (ppm) 1H (ppm) 13C (ppm) 1 167.2 169.3 2 5.78 (d, 15.0) 122.2 6.03 (d, 14.7) 118.7 3 6.91 (dd, 15.1, 11.3) 140.5 7.07 (m) 142.1 4 6.08 (dd, 15.1, 11.1) 128.8 6.42 (m) 134.1 5 5.65 (dd, 14.9, 9.5) 125.1 5.54 (m) 142.6 6 2.55 (m) 52.9 2.62 (m) 48.4 7a 1.23 (m) 43.3 1.89 (m) 39.8 7b 1.92 (m) 8 2.43 (m) 41.5 2.29 (m) 40.8 9a 0.93 (m) 35.2 2.17 (m) 38.8 9b 1.96 (m) 1.24 (m)10 1.58 (m) 55.8 1.27 (m) 54.9 11 1.33 (m) 47.3 1.52 (m) 47.9 12 2.11 (m) 57.7 2.13 (m) 53.6 13 1.57 (m) 55.8 2.71 (m) 41.6 14 3.91 (m) 77.3 5.79 (m) 130.4 15 5.93 (dd, 15.4, 8.4) 147.5 5.51 (m) 126.1 16 6.21 (dd, 15.5, 10.8) 131.6 2.84 (m) 41.0 17 7.33 (dd, 15.6, 10.8) 143.4 7.27 (m) 145.0 18 7.01 (d, 15.4) 121.7 7.10 (m) 123.7 19 175.7 174.6 20 102.5 100.9 21 176.1 176.3 22 23 3.82 (dd, 6.5, 1.7) 61.4 4.03 (m) 61.4 24 196.6 197.0 25a 2.07 (m) 26.0 1.82 (m) 27.4 25b 1.83 (m) 1.19 (m)26a 1.07 (m) 21.2 1.61 (m) 27.0 26b 1.48 (m) 1.06 (m)27a 3.66 (m) 38.6 3.24 (m) 43.1 27b 2.54 (m) 3.04 (m)28 29a 1.62 (m) 25.9 1.60 (m) 27.0 29b 1.10 (m) 1.19 (m)30 0.89 (m) 11.6 0.90 (m) 13.1 31 1.04 (m) 16.8 0.94 (m) 19.9

172
Table 4.4 The primers used for the multiple-gene deletion constructs of S. griseus gene cluster SGR 810-815.
Construct Primer name Primer sequence (5’-3’) pYL-RC-SGR814 814-for gtagaaacagacgaagaagctagctttgcactggattgcgtcatccgccatgggccgcgt
814-1-rev ggcaaactcatcgacctcga 814-2-for ctcgtcggtgatgtcgaggg 814-rev tcctgcaattcttagtgcgagtatctgaaaggggatacgcatggccgacgcgaacaaccg gapdhp(EL)-for ccaccttgttccgtaacgcccggttgttcgcgtcggccatgcgtatcccctttcagatac gapdhp(EL)-rev ttatagcacgtgatgaaaaggacccaggtggcacttttcggctgctccttcggtcggacg yeast-for cgaaaagtgccacctgggtc yeast-rev gtgagtttagtatacatgca E.coli-for aaaactgtattataagtaaatgcatgtatactaaactcatgtcatcacgatactgtgat E.coli-rev aatattgtgagtttagtatacatgca Streptomyces-for
acccattcaaaggccggcattttcagcgtgacatcattctgtgggccgtacgctggtact
Streptomyces-rev
gcgctccgtcctggggggagacgcggcccatggcggatgacgcaatccagtgcaaagcta
pYL-RC-SGR812-814
812-for gtagaaacagacgaagaagctagctttgcactggattgcgtcatgacttcctctccgtcg 812-rev tgccggttggtaggacaccactcgcgagagaggcgtatccgtgagcggcgacaggacagg ermEp-for gggcgcccccgggccgggtccctgtcctgtcgccgctcacggatacgcctctctcgcgag ermEp-rev gctcgaccggtggtccgcacgggagagcgaggaagcgtgaggtaccagcccgacccgagc 813-for gaccaggcgtgccggcgcgtgctcgggtcgggctggtacctcacgcttcctcgctctccc 813-rev gccgatggcagccgaaacgaagtaaggaacctgcgcttctatggcggatgacgatgacgaccccac rpsLp(TP)-for gttccctgctggtccagtcggtggggtcgtcatccgccatagaagcgcaggttccttact rpsLp(TP)-rev gcgctccgtcctggggggagacgcggcccatggcggatgaaccgggtccgcgatcggcgg 814-for gtggtcaaaagtgttcgcctccgccgatcgcggacccggttcatccgccatgggccgcgt 814-1-rev ggcaaactcatcgacctcga 814-2-for ctcgtcggtgatgtcgaggg 814-rev gtgccggtcagaccagagaacaccgacagacggagacgta atggccgacgcgaacaaccg rpsLp(CF)-for ccaccttgttccgtaacgcccggttgttcgcgtcggccattacgtctccgtctgtcggtg rpsLp(CF)-rev tctctctctccccctcatcgccacttgtggagggtcacggcccgccgcgggcgctggagg yeast-for cgaaaagtgccacctgggtc yeast-rev gtgagtttagtatacatgca E.coli-for aaaactgtattataagtaaatgcatgtatactaaactcatgtcatcacgatactgtgat E.coli-rev aatattgtgagtttagtatacatgca Streptomyces-for
acccattcaaaggccggcattttcagcgtgacatcattctgtgggccgtacgctggtact
Streptomyces-rev
gcccgttcgtcccgccgcaccgacggagaggaagtcatgacgcaatccagtgcaaagcta
pYL-RC-SGR812-
815
812-for gtagaaacagacgaagaagctagctttgcactggattgcgtcatgacttcctctccgtcg 812-rev tgccggttggtaggacaccactcgcgagagaggcgtatccgtgagcggcgacaggacagg ermEp-for gggcgcccccgggccgggtccctgtcctgtcgccgctcacggatacgcctctctcgcgag ermEp-rev gctcgaccggtggtccgcacgggagagcgaggaagcgtgaggtaccagcccgacccgagc 813-for gaccaggcgtgccggcgcgtgctcgggtcgggctggtacctcacgcttcctcgctctccc 813-rev gccgatggcagccgaaacgaagtaaggaacctgcgcttctatggcggatgacgatgacgaccccac rpsLp(TP)-for gttccctgctggtccagtcggtggggtcgtcatccgccatagaagcgcaggttccttact rpsLp(TP)-rev gcgctccgtcctggggggagacgcggcccatggcggatgaaccgggtccgcgatcggcgg 814-for gtggtcaaaagtgttcgcctccgccgatcgcggacccggttcatccgccatgggccgcgt 814-1-rev ggcaaactcatcgacctcga 814-2-for ctcgtcggtgatgtcgaggg 814-rev aggttagtttcacgaacggcacacagaaaccggagaagtaatggccgacgcgaacaaccg rpsLp(SG)-for ccaccttgttccgtaacgcccggttgttcgcgtcggccattacttctccggtttctgtgt rpsLp(SG)-rev tgcaccacggcttgctccaccacgacttgaggagttcggcaggggcgcgcggccccggcc 815-for ccccggacgggacggccggcggccggggccgcgcgcccctgccgaactcctcaagtcgtg 815-rev gtgccggtcagaccagagaacaccgacagacggagacgtaatggacgagcgcgagcactc rpsLp(CF)-for aatatattccgccatcggcggagtgctcgcgctcgtccattacgtctccgtctgtcggtg rpsLp(CF)-rev tctctctctccccctcatcgccacttgtggagggtcacggcccgccgcgggcgctggagg yeast-for cgaaaagtgccacctgggtc yeast-rev gtgagtttagtatacatgca E.coli-for aaaactgtattataagtaaatgcatgtatactaaactcatgtcatcacgatactgtgat E.coli-rev aatattgtgagtttagtatacatgca Streptomyces-for
acccattcaaaggccggcattttcagcgtgacatcattctgtgggccgtacgctggtact
Streptomyces-rev
gcccgttcgtcccgccgcaccgacggagaggaagtcatgacgcaatccagtgcaaagcta

173
Table 4.4 (Cont.) Construct Primer name Primer sequence (5’-3’)
pYL-RC-SGR810+812-814
810-for gtagaaacagacgaagaagctagctttgcactggattgcgctaccacctgacgccgagcc 810-rev gccggagtgcaccgcacacccactcgcagaggagattgcaatgcaccggctgttcttcga gapdhp(KR)-for
gacggggcggccccggttcctcgaagaacagccggtgcattgcaatctcctctgcgagtg
gapdhp(KR)-rev
gttgaccacgaccgaccccacgcgtccggccccggtgccgcacgggccggtgaaccccgc
Gap-for ccacatgaaccaacattcatgcggggttcaccggcccgtgcggcaccggggccggacgcg Gap-rev gcccgttcgtcccgccgcaccgacggagaggaagtcatgaacgcgacccgccctccgttc 812-for gtagaaacagacgaagaagctagctttgcactggattgcgtcatgacttcctctccgtcg 812-rev tgccggttggtaggacaccactcgcgagagaggcgtatccgtgagcggcgacaggacagg ermEp-for gggcgcccccgggccgggtccctgtcctgtcgccgctcacggatacgcctctctcgcgag ermEp-rev gctcgaccggtggtccgcacgggagagcgaggaagcgtgaggtaccagcccgacccgagc 813-for gaccaggcgtgccggcgcgtgctcgggtcgggctggtacctcacgcttcctcgctctccc 813-rev gccgatggcagccgaaacgaagtaaggaacctgcgcttctatggcggatgacgatgacgaccccac rpsLp(TP)-for gttccctgctggtccagtcggtggggtcgtcatccgccatagaagcgcaggttccttact rpsLp(TP)-rev gcgctccgtcctggggggagacgcggcccatggcggatgaaccgggtccgcgatcggcgg 814-for gtggtcaaaagtgttcgcctccgccgatcgcggacccggttcatccgccatgggccgcgt 814-1-rev ggcaaactcatcgacctcga 814-2-for ctcgtcggtgatgtcgaggg 814-rev gtgccggtcagaccagagaacaccgacagacggagacgta atggccgacgcgaacaaccg rpsLp(CF)-for ccaccttgttccgtaacgcccggttgttcgcgtcggccattacgtctccgtctgtcggtg rpsLp(CF)-rev tctctctctccccctcatcgccacttgtggagggtcacggcccgccgcgggcgctggagg yeast-for cgaaaagtgccacctgggtc yeast-rev gtgagtttagtatacatgca E.coli-for aaaactgtattataagtaaatgcatgtatactaaactcatgtcatcacgatactgtgat E.coli-rev aatattgtgagtttagtatacatgca Streptomyces-for
acccattcaaaggccggcattttcagcgtgacatcattctgtgggccgtacgctggtact
Streptomyces-rev
gacctcccgcagcccgcggcggctcggcgtcaggtggtagcgcaatccagtgcaaagcta
pYL-RC-SGR811-814
811-for gtagaaacagacgaagaagctagctttgcactggattgcgtcagagttcgacgagtacct 811-rev ggcgtcgaaaaccggcgtacctaacgaggagatcggttcatgaagatcgcgaaatgggtg gapdhp(SG)-for
cttcgacgtgttcgcggaccacccatttcgcgatcttcatgaaccgatctcctcgttagg
gapdhp(SG)-rev
gcccgttcgtcccgccgcaccgacggagaggaagtcatgactcggcggcgagcgggggac
812-for gctggaccacgcgggcgcgccgacgacgggcgccccggtgtcatgacttcctctccgtcg 812-rev tgccggttggtaggacaccactcgcgagagaggcgtatccgtgagcggcgacaggacagg ermEp-for gggcgcccccgggccgggtccctgtcctgtcgccgctcacggatacgcctctctcgcgag ermEp-rev gctcgaccggtggtccgcacgggagagcgaggaagcgtgaggtaccagcccgacccgagc 813-for gaccaggcgtgccggcgcgtgctcgggtcgggctggtacctcacgcttcctcgctctccc 813-rev gccgatggcagccgaaacgaagtaaggaacctgcgcttctatggcggatgacgatgacgaccccac rpsLp(TP)-for gttccctgctggtccagtcggtggggtcgtcatccgccatagaagcgcaggttccttact rpsLp(TP)-rev gcgctccgtcctggggggagacgcggcccatggcggatgaaccgggtccgcgatcggcgg 814-for gtggtcaaaagtgttcgcctccgccgatcgcggacccggttcatccgccatgggccgcgt 814-1-rev ggcaaactcatcgacctcga 814-2-for ctcgtcggtgatgtcgaggg 814-rev gtgccggtcagaccagagaacaccgacagacggagacgta atggccgacgcgaacaaccg rpsLp(CF)-for ccaccttgttccgtaacgcccggttgttcgcgtcggccattacgtctccgtctgtcggtg rpsLp(CF)-rev tctctctctccccctcatcgccacttgtggagggtcacggcccgccgcgggcgctggagg yeast-for cgaaaagtgccacctgggtc yeast-rev gtgagtttagtatacatgca E.coli-for aaaactgtattataagtaaatgcatgtatactaaactcatgtcatcacgatactgtgat E.coli-rev aatattgtgagtttagtatacatgca Streptomyces-for
acccattcaaaggccggcattttcagcgtgacatcattctgtgggccgtacgctggtact
Streptomyces-rev
ccgggcggccaaccggggcaaggtactcgtcgaactctgacgcaatccagtgcaaagcta

174
Table 4.5 NMR characterization of compound e in CD3OH. 1H NMR-δ (ppm) 600 MHz; multiplicities; and 13C NMR-δ (ppm) 145MHz, acquired with gHSQC, gHMBC and 13C NMR. m: multiplet; d: doublet ; dd: doublet of doublets. Note: the numbers are shown in the structures below.
Number Compound e
1H (ppm) 13C (ppm) 1 176.072 3.90 45.283 5.43 124.414 5.53 137.015 2.92 44.96 1.86 58.397a 1.95 35.097b 0.938 2.77 49.039a 2.09 35.099b 0.9510 1.33 46.6111 1.24 46.4312 1.68 52.6913 1.82 63.8814 3.66 80.8115 3.17 58.1516 5.74 136.7517 5.64 124.7618 3.91 45.2819 179.2620 101.321 176.322 23 3.83 61.4924 197.1725a 2.02 25.8725b 1.8326a 1.47 20.4626b 1.2527a 3.40 38.4927b 2.5628 29a 1.62 25.8729b 1.0730 0.89 11.4931 1.01 17.04

175
Chapter 5 Discovery and Characterization of Strong
Promoters from Actinomycetes
5.1 Introduction
The secondary metabolites produced by living organisms found in nature are
known as natural products. The natural products produced by actinomycetes serve as
excellent starting scaffolds for the development of antibiotics, anticancer agents,
immunomodulators, anthelminthic agents, and insect control agents (1,2). However,
natural product discovery from actinomycetes has been on the decline in recent years,
due to the lack of innovative ways to discover new compounds and the high
rediscovery rate of the known compounds. Recent advances in whole genome
sequencing techniques have revised our view of the metabolic capabilities of
actinomycetes as they encode multiple unknown secondary metabolite pathways with
the great potential for generating novel natural products. However, most of these
pathways remain silent under standard laboratory culturing conditions, thus they are
named cryptic pathways. This makes the discovery and economical production of
these potential natural products difficult as we are hampered in manipulating most
organisms, determining suitable conditions to elicit pathway expression, and
producing sufficient compounds for structure identification.
. One possible solution for novel natural product discovery is to target the
expression of these cryptic pathways. Rationally designed and well-characterized
controlling elements are invaluable tools for activating cryptic pathways as the fine-
tuning of gene expression could be reached. Promoters are the key regulators of gene

176
expression (3). Secondary metabolite production typically occurs during the early
stationary phase (4) and is affected by a variety of physiological and environmental
factors conducted through dozens of pleiotropic regulatory genes and pathway-
specific regulators (5-8). Currently, our understanding of the regulation hierarchy is
insufficient to accurately predict the functions of all the regulatory elements. Hence, it
is highly desirable to develop generally applicable approaches that reduce regulation
complexity and achieve transcriptional fine-tuning for optimal gene expression.
In Chapter 3 we have developed such plug-and-play platform to decouple
pathway expression from native sophisticated regulation cascades, thus addressing the
expression issue of cryptic pathways. In this strategy, we first identify novel pathways
by bioinformatics and then refactor the target pathways in well-characterized hosts
with known secondary metabolites. In the scaffold, the promoter modules, which
serve as the most important part to drive the expression of the target genes are set up
based on the choice of the expression host. Promoters can be chosen from the well-
studied ones reported in literature or cloned from the potential promoter regions of
endogenous housekeeping genes in the target expression host or other organisms
closely related to the target expression host. Native promoters, both constitutive and
inducible, have long been used in gene expression studies and strain engineering.
However, very few native constitutive or inducible promoters have been characterized
in actinomycetes, including the constitutive ermE promoter (9) and the inducible tipA
(10) and tcp (11) promoters. Later, a stronger variant called ermE*p was reported
with a TGG deletion in the -35 region of the ermEp promoter (12). To make this

177
scaffold generally applicable for cryptic pathway activation in actinomycetes, a
quantitatively characterized library of promoters is required to express target gene
clusters.
Since Streptomycetes are prolific sources of bioactive compounds, many of
which exhibit important medical properties (13,14), we chose to clone and
characterize a panel of constitutive promoters from Streptomycetes for applications in
the plug-and-play scaffold. Our strategy is to identify a set of strong promoters under
the selected conditions based on the RNA-seq data and characterize them at both
transcriptional level and translational level. To this end, we selected Streptomyces
albus, whose genome sequence is available, as the host for initial promoter screening.
Using RNA-seq, 32 genes stood out with much higher transcription levels than all the
other genes in our target culturing conditions, indicating that their corresponding
promoters could be very strong. These 32 candidate promoters were subsequently
cloned upstream of the Streptomycete reporter gene, xylE, encoding catechol 2, 3-
dioxygenase. The xylE activity assay (15) coupled with the qPCR reaction further
confirmed that 10 out of the 32 promoters showed much stronger activities than the
control promoters in S. albus.
Therefore, we have successfully cloned and characterized 32 constitutive
promoters from the S. albus genome under the culture conditions that are routinely
used in the laboratory for production of value added compounds in Streptomyces. The
comparison of their strengths at both transcriptional and translational level
distinguished 10 strong promoters from this library. The availability of these
178
promoters has greatly enabled the use of our recently developed plug-and-play system
(16,17) for cryptic pathway activation and pathway engineering in Streptomyces.
5.2 Results and discussion
5.2.1 Host selection
Heterologous expression of a target cryptic gene cluster has been commonly used
in natural product discovery, as it could address the tedious de-replication process.
Several laboratory and industrial production strains have been developed for
heterologous production of secondary metabolites. To identify products from cryptic
gene clusters of actinomycetes via the plug-and-play system we developed, it will be
important to select a suitable actinomycete host for high-level heterologous
expression of specific types of secondary metabolites, and to facilitate rapid
identification and testing of novel products. Molecular engineering, combinatorial
biosynthesis, and gene cluster expression studies have identified a number of potential
actinomycete hosts that are widely used in the laboratory, such as Streptomyces
coelicolor, Streptomyces lividans, and Streptomyces albus J1074 (18). These hosts
have already proven to be valuable for heterologous expression of cryptic biosynthetic
gene clusters for novel natural products and combinatorial biosynthesis to produce
novel derivatives of pharmacologically active secondary metabolites.
S. coelicolor and S. lividans are two very closely related laboratory strains that
have been used extensively in the development of streptomycete genetic tools (4). S.
albus J1074 is a mutant strain from S. albus G defective in SalI restriction and
modification (19). S. albus J1074 was first used as a cloning host by the Salas group

179
(20,21) to express the steffimycin biosynthetic genes, and obtained a yield of purified
compounds of about 10 mg/L (22,23). Later, the genome of S. albus J1074 was
sequenced at the Broad Institute, and is available at the National Center for
Biotechnology Information (NCBI) website (http://www.ncbi.nlm.nih.gov/). S. albus
J1074 has been used for the expression of several other secondary metabolite gene
clusters and in some cases it can lead to a better yield than S. coelicolor and S.
lividans.
For example, the fredericamycin biosynthetic gene cluster was heterologously
expressed in S. albus J1074 from both high copy number (24) and single copy number
φC31-integrating vectors (25), yielding 120 and 132 mg/L products, respectively. In
contrast, no product was detected in S. lividans after the fredericamycin pathway was
inserted into the φC31 attB site (25). Only after the fdmR1 gene encoding a positive
regulatory protein belonging to the Streptomyces antibiotic regulatory protein (SARP)
family (7,26,27) was added to the strain on a multicopy plasmid, a small amount of
product (0.5 mg/L) could be detected. The yield was further enhanced to 17 mg/L
when the fdmR1 and fdmC genes were expressed driven by the ermEp* promoter.
However, this is still only 13% of the yield obtained by expressing the fredericamycin
gene cluster from its native promoters in S. albus J1074.
Another comprehensive comparison among different Streptomyces hosts was the
cloning and expression of the complete biosynthetic gene cluster for isomigrastatin
from Streptomyces platensis NRRL18993 into pStreptoBac V (28). In this study, the
isomigrastatin gene cluster was integrated into the φC31 attB site in S. albus, S.

180
lividans, S. coelicolor, and S. avermitilis. The results showed that the parental strain
produced 58 mg/L target product, whereas the S. albus J1074 recombinant strain
produced 46 mg/L. S. lividans K4-114 and S. coelicolor M512 produced about two-
fold lower yields, and S. avermitilis SUKA5 produced a ten-fold lower yield.
Another interesting application of S. albus J1074 was the expression of the
thiocoraline pathway cloned from a marine Micromonospora strain (29). In this study,
the thiocoraline pathway was expressed in S. albus after the tioA positive regulatory
gene encoding an OmpR-family regulator was transcribed from the ermEp* promoter.
This demonstrated that a non-streptomycete actinomycete secondary metabolite gene
cluster can be expressed in S. albus J1074. Taken together, we decided to choose S.
albus J1074 as the heterologous host for our plug-and-play platform. The strong
constitutive promoters from this strain will be screened and characterized for
heterologous expression of cryptic secondary metabolite pathways from
streptomycete and non-streptomycete actinomycetes not amenable to standard
molecular genetics and fermentation manipulations.
5.2.2 Screening for strong promoters via RNA-seq
Seed cultures of the S. albus J1074 were grown for 48 hours and 0.5 mL was used
to inoculate 25 mL of main cultures in both MYG and R2YE medium. After 24 hours
and 72 hours of cultivation at 30 in shaking flasks, 1 mL of culture was pelleted and
the total RNA was isolated. The quality of the total RNA was determined by
Bioanalyzer using RNA chips. The RNA integrity number (RIN) numbers of the

181
samples were summarized in Table 5.1 and the Bioanalyzer trace of total RNA of all
the samples were shown in Figure 5.1.
The qualified samples were sent on dry ice to Roy J. Carver Biotechnology
Center (UIUC, Illinois) for removal of ribosomal RNA and whole transcriptome
shotgun sequencing (RNA-Seq). Briefly, the mRNA fragments were reverse-
transcribed into cDNA and subjected to Illumina sequencing. The processing of RNA-
Seq reads was submitted to High-Performance Biological Computing Center
(HPCBio) (University of Illinois, Urbana) for analysis.
The results obtained after analysis (Figure 5.2 and 5.3) showed that for all eight
samples, one SA-MYG-72-hour sample may be contaminated by genomic DNA as
the reads mapped evenly between “within a gene” and “not within a gene,” while the
other 7 total RNA samples are in good quality. The comparison between the
biological duplicates of each sample showed little variations. Therefore, the single
SA-MYG-72-hour sample could be used as well. The expression levels of all 5937
genes were sorted based on the two culture conditions and time points chosen. The
number of highly expressed genes was counted on different cut-offs (Figure 5.4).
Finally, we decided to characterize the promoters that drove the expression of the 1%
highly expressed genes (28 genes) based on all four criteria (two time points under
two culturing conditions).
5.2.3 Cloning of the constitutive promoters
Among all 28 highly expressed genes, some did not have a promoter directly in
front of the selected gene and some genes even contained overlap regions with the
182
adjacent genes. Therefore, to ensure the success rate of strong promoter identification,
we extended the selection to 32 promoter regions. The promoter region of the 32
highly expressed genes were PCR amplified and further spliced with the amplified
xylE gene, and inserted into a Yeast-E. coli-Streptomyces shuttle vector based on the
DNA assembler method (Figure 5.5). The assembled constructs were purified from E.
coli and submitted for sequencing to confirm the sequence of the promoter region
cloned. As a result, for all the promoter-xylE constructs built, an efficiency of 80-100%
has been achieved.
The verified clones were transformed to E. coli WM6026 (30) and these
transformants were then used as the donors for conjugative transfer of the assembled
plasmids to S. albus J1074 following the protocol described elsewhere (30). Initially,
two single colonies from different ex-conjugants were inoculated into 2 mL of MYG
liquid medium, and 1 mL of this seed culture was transferred to 50 mL fresh MYG
medium and incubated at 30 °C. Samples were taken every 48 hours and 72 hours.
In the meantime, three different control constructs were built. Previously, our lab
identified that the gapdh and rpsL promoters from actinomycetes are highly active
under normal laboratory culturing conditions (16). The gapdh promoter, named as
gapdhp, is located upstream of the gapdh operon consisting of Gapdh,
phosphoglycerate kinase (pgk) and triosephosphate isomerase (tpiA), the enzymes
catalyzing the 6th, 7th and 5th steps, respectively, in the glycolysis pathway; and the
rpsL promoter, named as rpsLp, resides upstream of another operon consisting of 30s
ribosomal proteins S12 and S7, and elongation factor G and Tu. Among all the 32

183
promoter regions selected, quite a few reside upstream of 30s ribosomal proteins.
Therefore, the previously characterized rpsLp from S. griseus was chosen as a
positive control as it is one of the strongest constitutive promoters ever reported.
Another control promoter was ermE*p, which is the mutated variant of the promoter
of the erythromycin resistance gene from Saccharopolyspora erythraea, and is
believed to be one of the strongest constitutive promoters in Streptomycetes (31,32).
Based on the RNA-seq analysis, the expression of the gene encoding for
glyceraldehyde-3-phosphate dehydrogenase from S. albus J1074 ranked number 86.
The promoter region of this gene was cloned to serve as a control as well.
5.2.4 Trouble-shooting experiments
The first batch XylE activity assay (15) showed that between the two biological
duplicates, large variations existed (data not shown). The second batch including two
single colonies from two different ex-conjugants respectively was repeated and large
variations still existed. To fix this problem, a trouble-shooting experiment was
designed as illustrated in Figure 5.6. We chose promoter 1 as the target and took
samples at 48 hours. As shown in Figure 5.7, the data from both qPCR analysis and
XylE activity assay confirmed that the variations generated from the same ex-
conjugant was much smaller than that from different ex-conjugants. Therefore, the
data for all four ex-conjugants of each promoter selected was analyzed again and the
one showed highest activity was selected to perform a biological duplicate experiment.

184
5.2.5 Characterization of the selected promoters
The S. albus strains harboring the candidate promoter constructs as well as the
three controls were subsequently cultured in MYG liquid medium. Two single
colonies from one ex-conjugant were picked and inoculated. Samples were taken at
48 hours and 72 hours, respectively. The XylE activity assay (15) revealed their
activities as shown in Figure 5.8. For the promoter library we constructed, it covered
promoter strengths varying from 4%-1300% of the strength of ermE*p.
According to the XylE activity assay, some of these promoters seem to be quite
weak under the culturing condition. To investigate the possible causes, we located
these promoters with their downstream genes on the chromosome of S. albus. For all
the 32 promoters we selected, they actually could be distributed in 19 clustered gene
groups (Table 5.2). Therefore, it is possible that several of the adjacent genes may
be involved in one operon structure and the high expression of these genes may be
driven by only one promoter in front of the whole operon. According to this
hypothesis, we could explain the weak activity performed by the #3, #5, #7, #10, #11,
#13, #17, #32 and #33 promoters, as they may actually just be intergenetic non-coding
regions instead of constitutive promoters. Among the rest of promoters, 10 promoters
showed strong activity under this culturing condition. Comparing with the ermE*p,
these 10 promoters (#1, #2, #8, #12, #14, #21, #22, #25, #28 and #30) showed at least
2-10 fold enhancement in expression levels.
To characterize these 10 strong constitutive promoters in detail, a time course
(24h-48h-72h) analysis was performed and the three controls were also included

185
(Figure 5.9). In general, these strong promoters are highly active at 24 hours, the most
active one reached nearly 10-fold enhancement in the expression level. The ermE*p is
a constitutive promoter as its activity does not vary distinguishably during the 72
hours time course. Using ermE*p as a benchmark, the #2, #8, #14, #25, #30 promoters
retain a consistent transcription level of the downstream gene. Therefore, we would
claim them as strong constitutive promoters under the chosen culturing condition. In
addition, the previously identified strong constitutive promoters closely related to
gapdhp seemed to be true in S. albus as well. For example, #35 is the gapdhp homolog
in S. albus and it showed strong activity in the chosen culturing condition.
5.2.6 Analysis of the strong promoters characterized
After we confirmed the strengths of all the 32 selected promoters and the three
controls at the translation level using the XylE activity assay, we analyzed the
strengths of all these promoters at their transcription level.
In order to quantify the gene expression level, quantitative real-time PCR (qPCR)
was employed to track the gene expression level. The rpoD gene, homologous to the
hrdB gene (33), the principal sigma factor, was chosen as the internal control for all
following qPCR experiments and its transcription signal remained comparable in all
samples. The RpoD (HrdB) protein is a house-keeping protein in Streptomyces strains
(34). Due to its stable and consistent expression level in Streptomyces strains, we
chose this gene to serve as the internal control. Primers for genes in the target cluster
were designed by the Real-Time PCR tools on the website of Integrated DNA
Technologies (https://www.idtdna.com/scitools/Applications/RealTimePCR/).

186
Samples were run on the ABI Prism 7900 HT Real-Time Quantitative PCR machine
and the results were analyzed by SDS software. Standard curves were made first for
the two pairs of primers using genomic DNA of S. albus harboring the #1-promoter-
xylE cassette as the template (Figure 5.10). Real-Time PCR was performed according
to a protocol described elsewhere (35).
In order to obtain stable and consistent data, cells were grown for 3 days and
samples for RNA isolation were collected at different time points: 48 hours and 72
hours. Total RNA was isolated based on the protocol of Total RNA Isolation Mini Kit
and cDNA was synthesized afterwards. In parallel, to eliminate genomic DNA
contamination, cDNA synthesis reaction without reverse transcriptase was carried out
to serve as the negative control. Primers were designed to amplify a ~300 bp fragment
for the xylE gene from the cDNA library. As shown in Figure 5.11, all 35 promoters
(32 selected ones plus three controls) were analyzed at both time points under the
chosen growth condition. The gene expression levels from different time points were
compared. Overall, the expression level reached its plateau at around 48 hours. The 10
strong promoters characterized from the XylE activity assay also showed high
expression levels in the qPCR experiments, which further confirmed the strengths of
these promoters. Interestingly, #24, #26, #29 and #33 promoters also showed strong
activity, while they did not appear in the XylE assay.
5.3 Conclusions
Notably, a total of 100 promoters in Escherichia coli were recently characterized
(36) and similarly, a total of 14 constitutive promoters from S. cerevisiae were cloned
187
and characterized using a green fluorescent protein (GFP) as a reporter (37). However,
no such promoter library of Streptomyces has been well-established. Our group firstly
identified 13 strong constitutive promoters for actinomycetes (16) and successfully
applied it for cryptic pathway activation (17). To further explore the application of
actinomycetes’ promoters, we have successfully screened 33 promoters from S. albus
J1074 via RNA-seq analysis. We analyzed the strengths of these 33 promoters,
indirectly determined through the activity of catecho1 2,3-dioxygenase, the product of
the xylE reporter gene. Their strengths range from 4%-1300% of the strength of the
ermE*p. This was further confirmed by qPCR analysis of these genes under the same
culturing condition. Meanwhile, we found that 11 out of the 33 characterized
promoters showed strong activities, which are at least 2-fold higher than that of the
ermE*p. A detailed 24h-48h-72h time course study of the selected 11 promoters
further revealed that several of them serve as strong constitutive promoters.
This variety of promoter strengths could be applied for different applications. For
single gene analysis or protein expression, strong constitutive promoters could be
used for the overexpression of a gene of interest, whereas the expression of genes
responsible for toxic substances would benefit from weak promoters. Moreover, the
promoters could be applied in pathway engineering. For example, they could be used
in our plug-and-play platform to replace the native promoters and therefore drive the
expression of the pathway genes. The strong promoters would be especially useful to
researchers’ work with actinomycetes to overproduce natural products via
transcription enhancements of the corresponding genes (38). This could benefit the

188
field of novel natural product discovery as a new approach for cryptic pathway
activation. Fine-tuning gene expression has been demonstrated to be very useful for
pathway optimization. Thus the promoter library could be employed in fine-tuning
and balancing specific gene expression due to the complexity of regulatory networks
(39,40). Promoters in our promoter library with various strength could be used for
such experiments.
5.4 Materials and methods
5.4.1 Strains and reagents
S. cerevisiae HZ848 (MATα, ade2-1, Δura3, his3-11, 15, trp1-1, leu2-3, 112 and
can1-100) was used as the host for DNA assembly and integration. S. albus J1074
was a gift from Professor Wenjun Zhang (University of California, Berkeley).
Plasmids pAE4, E. coli strains WM6026 and WM1788 were developed by the
Metcalf group (University of Illinois, Urbana-Champaign). The pRS426 and pRS416
plasmid (New England Biolabs, Beverly, MA) were modified by incorporating the
hisG and partial δ sequence (δ2) that flank the multiple cloning site and serve as the
vectors for assembly of various pathways. Nalidixic acid was obtained from Sigma-
Aldrich (St. Louis, MO). ISP2, agar, beef extract, yeast extract, malt extract, and other
reagents required for cell culture were obtained from Difco (Franklin Lakes, NJ).
All restriction endonucleases, as well as T4 DNA ligase and antarctic phosphatase,
were purchased from New England Biolabs (Beverly, MA). Q5 DNA polymerase was
from New England Biolabs (Beverly, MA). FailsafeTM 2x premix buffer G was

189
purchased from EPICENTRE Biotechnologies (Madison, WI). SYBR Green PCR
master mix was purchased from Applied Biosystems (San Francisco, CA). The
QIAprep Spin Plasmid Mini-prep Kit, QIAquick PCR Purification Kit, QIAquick Gel
Extraction Kit and the Total RNA Isolation Mini Kit were purchased from Qiagen
(Valencia, CA). All primers were synthesized by the Integrated DNA Technologies
(Coralville, IA). Yeast YPAD medium-containing 1% yeast extract, 2% peptone and 2%
dextrose supplied with 0.01% adenine hemisulphate was used to grow S. cerevisiae
YSG50 strain. Synthetic complete drop-out medium lacking uracil (SC-Ura) was used
to select transformants containing the assembled biochemical pathways of interest.
MYG medium (4 g/L yeast extract, 10 g/L malt extract and 4 g/L glucose) and R2YE
medium (41) was used for growing S. albus strains.
5.4.2 Streptomycete cultivation and RNA extraction
Wild type S. ablbus culture was grown in both MYG medium (10 g/L malt
extract, 4 g/L yeast extract, and 4 g/L glucose) and R2YE medium (41) at 30 °C with
constant shaking (250 rpm) until saturation, and inoculated into fresh MYG and
R2YW with a ratio of 1:100. Cells of 1 mL culture of each medium were collected at
24 hours and 72 hours respectively. The total RNA was extracted using the RNeasy
Mini Kit (QIAGEN, Valencia, CA). RNA preparations were treated with TURBO
DNA-free™ Kit (Life Technologies, Carlsbad, CA) to remove contaminating DNA.

190
5.4.3 RNA-seq analysis
For the analysis and quantitation of total RNA samples, Agilent RNA 6000 Nano
Kit from Agilent Technologies (Santa Clara, CA) was used to determinate the RNA
integrity number of the samples. Qualified samples with RIN larger than 8 were
submitted to the Roy J. Carver Biotechnology Center (CBC) (University of Illinois,
Urbana) and were sequenced on an Illumina HiSeq 2500 with a read length of 100
bases. The sequencing data was submitted to High-Performance Biological
Computing Center (HPCBio) (University of Illinois, Urbana) for analysis. The reads
were mapped to the published S. albus J1074 genome sequence, using the prokaryote
settings and RPKM (reads per kilobase of exon model per million mapped reads) (42)
as the method of determining the expression level of the gene regions.
5.4.4 Promoter cloning
The promoter region of 33 strong expressed genes under both culturing
conditions at the two time points chosen were selected and cloned with xylE gene by
DNA assembly method (43). S. albus was grown in liquid MYG medium (4 g/L yeast
extract, 10 g/L malt extract and 4 g/L glucose) at 30 °C with constant shaking (250
rpm) for 2 days. The genomic DNA was isolated from S. albus using the Wizard
Genomic DNA isolation kit from Promega (Madison, WI). Pairs of primers were
designed with the sequences shown in Table 5.3. Promoters of all 33 chosen regions
were amplified from the genomic DNA of S. albus. Generally, the PCRs were carried
out in 100 µL reaction mixture consisting of 50 µL FailSafeTM PCR 2xPreMix G from
Epicentre Biotechnologies (Madison, WI), 2.5 pmol of each primer, 0.5 µL genomic

191
DNA and 2.0 unit Phusion DNA polymerase for 35 cycles on a PTC-200 Thermal
Cycler (MJ Research, Watertown, MA). Each cycle consisted of 10 s at 98 °C, 30 s
at 58 °C and 1 min at 72 °C, with a final extension of 8 min. The S. cerevisaie helper
fragment was amplified from the commercial vector pRS416, while the E. coli helper
fragment and the S. albus helper fragment were amplified from the Streptomyces-E.
coli shuttle vector pAE4. Following electrophoresis, the PCR products were
individually gel-purified from 1.0% agarose gels using Qiagen Gel Purification kit.
100 ng of each individual fragments was mixed and precipitated with ethanol. The
resulting DNA pellet was air-dried and resuspended in 4 µL Milli-Q double deionized
water and subsequently electroporated into S. cerevisiae using the protocol reported
elsewhere (43).
5.4.5 Yeast transformation
Yeast transformation was performed by electroporation. YPAD medium (50 mL)
was inoculated with a 0.5 mL overnight S. cerevisiae YSG50 culture and shaken at
30 °C and 250 rpm for 4-5 h until OD600 reached 0.8-1.0. Yeast cells were harvested
by centrifugation at 4 °C and 4000 rpm for 5 min. The supernatant was discarded
and the cell pellet was washed with 50 mL ice-cold Milli-Q double-deionized water,
followed by another wash with cold 1 M sorbitol and finally resuspended in 250 µL
cold sorbitol. An aliquot of 50 µL of yeast cells together with 4 µL DNA mixture was
electroporated in a 0.2 cm cuvette at 1.5 kV. The transformed cells were immediately
mixed with 1 mL room temperature YPAD medium and shaken at 30 °C for 1 h.
Following that, the cells were harvested by centrifugation, washed with room

192
temperature 1 M sorbitol several times to remove the remaining medium and finally
resuspended in 1 mL sorbitol. Aliquots of 30-50 mL were spread on SC-Ura plates for
the selection of the transformants, and the plates were incubated at 30 °C for 2-4 days
until colonies appeared. Colonies were randomly picked to SC-Ura liquid medium
and grown for 1 day, after which yeast plasmid was isolated using Zymoprep II Yeast
plasmid Miniprep kit (Zymo Research, CA), and genomic DNA was prepared using
Wizard Genomic DNA isolation kit from Promega (Madison, WI).
5.4.6 Verification of the assembled gene clusters
Colonies were randomly picked to SC-Ura liquid media and grown for 2 days,
after which yeast plasmid was isolated using Zymoprep II Yeast plasmid Miniprep kit
(Zymo Research, CA). Yeast plasmids were transformed to E. coli strain WM1788
and selected on Luria Broth (LB) agar plates supplemented with 50 µg/ml apramycin.
Colonies were inoculated into 5 mL of LB media supplemented with 50 µg/mL
apramycin, and plasmids were isolated from the liquid culture using the plasmid
miniprep kit from Qiagen. Plasmids isolated from E. coli were then submitted for
sequencing.
5.4.7 Heterologous expression in S. albus
The verified clones were transformed to E. coli WM6026 (30) and selected on LB
agar plates supplemented with 19 µg/mL 2,6-diaminopimelic acid and 50 µg/mL
apramycin. These transformants were then used as the donors for conjugative transfer
of the assembled plasmids to S. lividans 66 following the protocol described
193
elsewhere (30). S. lividans exconjugants were picked and re-streaked on ISP2 plates
supplemented with 50 µg/mL apramycin and grown for 2 days. For each construct, a
single colony was inoculated into 2 mL of MYG liquid medium supplemented with
50 µg/mL apramycin in a 14 mL Falcon tube. 1 mL of the saturated culture was
inoculated into 50 mL of MYG medium supplemented with 50 µg/mL apramycin in a
125 mL shake-flask shake-flask (3 mm glass beads were added to improve liquid
mixing and aeration). Samples were taken for further analysis at different time points:
24 hours, 48 hours, and 72 hours.
5.4.8 Promoter characterization via the XylE assay
Catecho1 2,3-dioxygenase, the product of the xylE gene from the Pseudomonas
TOL p1asmid, converts colorless catecho1 into 2-hydroxymuconic semialdehyde,
which is yellow. Aliquots of 10 mL of the cell culture at different time points were
collected and centrifuged at 4000 rpm for 10 minutes to remove the supernatant. 5 mL
sample buffer (100 mM phosphate buffer, pH = 7.5; 20 mM NaEDTA, pH = 8.0; 10%
v/v acetone) were added to resuspend the cell pellets followed by sonication on ice.
0.1% of Triton X-100 solution was added into the samples and incubated on ice for 15
minutes. Then the samples were centrifuged for 5 minutes (40,000 g, 4 °C) and the
cell lysate was transferred to a fresh tube. 900 µL of the assay buffer (10 mM
phosphate buffer, pH = 7.5; 0.2 mM catechol 2,3-dioxygenase) was added to 100 µL
of the cell lysate and follow the change in absorbance at 375 nm (A375). The
concentrations of the total proteins were determined by the Bradford method (44).
The slope of the linear part of the spectrophotometric output was used to calculate the

194
specific activity as follows: mU catechol dioxygena [nmol min-1] = 30.03 * ΔA375
/time [min].
5.4.9 Promoter characterization via qPCR analysis
Wild type S. ablbus culture was grown in both MYG medium (10 g/L malt
extract, 4 g/L yeast extract, and 4 g/L glucose) and R2YE medium (41) at 30 °C with
constant shaking (250 rpm) until saturation, and inoculated into fresh MYG and
R2YW with a ratio of 1:100. Cells of 1mL culture of each medium were collected at
24 hours, 48 hours and 72 hours respectively. The total RNA was extracted using the
RNeasy Mini Kit (QIAGEN, Valencia, CA). RNA preparations were treated with
TURBO DNA-free™ Kit (Life Technologies, Carlsbad, CA) to remove
contaminating DNA. Reverse transcription was carried out using the ProtoScript®
First Strand cDNA Synthesis Kit (New England Biolabs, Beverly, MA). Real-time
PCR was performed with SYBR® Green PCR Master Mix on the 7900HT Fast Real-
Time PCR System (Applied Biosystems, Carlsbad, CA). Primers were designed by
the online tool provided by Integrated DNA Technologies
(https://www.idtdna.com/scitools/Applications/RealTimePCR/). 10 μL of 2× SYBR
Green Mix, 1 μL of cDNA, 1 μL of each primer at a concentration of 10 pmol/μL and
7 μl of ddH2O were mixed gently in each well of the Applied Biosystems®
MicroAmp® Optical 384-well Reaction Plate. Reactions were performed using the
following program: 2 min at 50 °C, 10 min at 95 °C for one cycle followed by 15 s at
95 °C, 30 s at 60 °C and 30 s at 72 °C for 40 cycles with a final cycle of 10 min at
72 °C. The endogenous gene rpoD, encoding a RNA polymerase sigma factor, was

195
used as the internal control for promoter characterization. The expression levels of the
XylE gene under different promoters were normalized by the expression of the control.
Data was analyzed using SDS2.4 software (Applied Biosystems).
5.5 References
1. Newman, D.J. and Cragg, G.M. (2012) Natural products as sources of new drugs over the 30 years from 1981 to 2010. J Nat Prod, 75, 311-335.
2. Li, J.W. and Vederas, J.C. (2009) Drug discovery and natural products: end of an era or an endless frontier? Science, 325, 161-165.
3. Hammer, K., Mijakovic, I. and Jensen, P.R. (2006) Synthetic promoter libraries--tuning of gene expression. Trends Biotechnol, 24, 53-55.
4. Kieser, T. (2000) Practical streptomyces genetics. John Innes Foundation, Norwich.
5. Bibb, M. and Hesketh, A. (2009) Chapter 4. Analyzing the regulation of antibiotic production in streptomycetes. Methods Enzymol, 458, 93-116.
6. van Wezel, G.P., McKenzie, N.L. and Nodwell, J.R. (2009) Chapter 5. Applying the genetics of secondary metabolism in model actinomycetes to the discovery of new antibiotics. Methods Enzymol, 458, 117-141.
7. Bibb, M.J. (2005) Regulation of secondary metabolism in streptomycetes. Curr Opin Microbiol, 8, 208-215.
8. Brakhage, A.A., Schuemann, J., Bergmann, S., Scherlach, K., Schroeckh, V. and Hertweck, C. (2008) Activation of fungal silent gene clusters: a new avenue to drug discovery. Prog Drug Res, 66, 1, 3-12.
9. Bibb, M.J., Janssen, G.R. and Ward, J.M. (1985) Cloning and analysis of the promoter region of the erythromycin resistance gene (ermE) of Streptomyces erythraeus. Gene, 38, 215-226.
10. Murakami, T., Holt, T.G. and Thompson, C.J. (1989) Thiostrepton-induced gene expression in Streptomyces lividans. J Bacteriol, 171, 1459-1466.
11. Rodriguez-Garcia, A., Combes, P., Perez-Redondo, R., Smith, M.C.A. and Smith, M.C.M. (2005) Natural and synthetic tetracycline-inducible promoters for use in the antibiotic-producing bacteria Streptomyces. Nucleic Acids Res, 33.
12. Bibb, M.J., White, J., Ward, J.M. and Janssen, G.R. (1994) The mRNA for the 23S rRNA methylase encoded by the ermE gene of Saccharopolyspora erythraea is translated in the absence of a conventional ribosome-binding site. Mol Microbiol, 14, 533-545.
13. Newman, D.J., Cragg, G.M. and Snader, K.M. (2000) The influence of natural products upon drug discovery. Nat Prod Rep, 17, 215-234.
14. Hopwood, D.A. (2007) Streptomyces in nature and medicine: the antibiotic makers. Oxford University Press, Inc., New York, United States.

196
15. Tobias Kieser, M.J.B., Mark J. Buttner, Keith F. Chater, and Hopwood, D.A. (2000) Practical Streptomyces genetics. John Innes Foundation, Norwich, United Kingdom.
16. Shao, Z., Rao, G., Li, C., Abil, Z., Luo, Y. and Zhao, H. (2013) Refactoring the silent spectinabilin gene cluster using a plug-and-play scaffold. ACS Synth Biol, 2, 662-669.
17. Luo, Y., Huang, H., Liang, J., Wang, M., Lu, L., Shao, Z., Cobb, R.E. and Zhao, H. (2013) Activation and characterization of a cryptic polycyclic tetramate macrolactam biosynthetic gene cluster. Nat Commun, 4, 2894.
18. Galm, U. and Shen, B. (2006) Expression of biosynthetic gene clusters in heterologous hosts for natural product production and combinatorial biosynthesis. Expert Opin Drug Discov, 1, 409-437.
19. Chater, K.F. and Wilde, L.C. (1976) Restriction of a bacteriophage of Streptomyces albus G involving endonuclease SalI. J Bacteriol, 128, 644-650.
20. Fernandez, E., Lombo, F., Mendez, C. and Salas, J.A. (1996) An ABC transporter is essential for resistance to the antitumor agent mithramycin in the producer Streptomyces argillaceus. Mol Gen Genet, 251, 692-698.
21. Rodriguez, A.M., Olano, C., Vilches, C., Mendez, C. and Salas, J.A. (1993) Streptomyces antibioticus contains at least three oleandomycin-resistance determinants, one of which shows similarity with proteins of the ABC-transporter superfamily. Mol Microbiol, 8, 571-582.
22. Gullon, S., Olano, C., Abdelfattah, M.S., Brana, A.F., Rohr, J., Mendez, C. and Salas, J.A. (2006) Isolation, characterization, and heterologous expression of the biosynthesis gene cluster for the antitumor anthracycline steffimycin. Appl Environ Microbiol, 72, 4172-4183.
23. Olano, C., Abdelfattah, M.S., Gullon, S., Brana, A.F., Rohr, J., Mendez, C. and Salas, J.A. (2008) Glycosylated derivatives of steffimycin: insights into the role of the sugar moieties for the biological activity. Chembiochem, 9, 624-633.
24. Wendt-Pienkowski, E., Huang, Y., Zhang, J., Li, B., Jiang, H., Kwon, H., Hutchinson, C.R. and Shen, B. (2005) Cloning, sequencing, analysis, and heterologous expression of the fredericamycin biosynthetic gene cluster from Streptomyces griseus. J Am Chem Soc, 127, 16442-16452.
25. Chen, Y., Wendt-Pienkowski, E. and Shen, B. (2008) Identification and utility of FdmR1 as a Streptomyces antibiotic regulatory protein activator for fredericamycin production in Streptomyces griseus ATCC 49344 and heterologous hosts. J Bacteriol, 190, 5587-5596.
26. Bibb, M. and Hesketh, A. (2009) Analyzing the regulation of antibiotic production in streptomycetes. Method Enzymol, 458, 93-116.
27. van Wezel, G.P., McKenzie, N.L. and Nodwell, J.R. (2009) Applying the genetics of secondary metabolism in model actinomycetes to the discovery of new antibiotics. Method Enzymol, 458, 117-+.

197
28. Feng, Z., Wang, L., Rajski, S.R., Xu, Z., Coeffet-LeGal, M.F. and Shen, B. (2009) Engineered production of iso-migrastatin in heterologous Streptomyces hosts. Bioorg Med Chem, 17, 2147-2153.
29. Lombo, F., Velasco, A., Castro, A., de la Calle, F., Brana, A.F., Sanchez-Puelles, J.M., Mendez, C. and Salas, J.A. (2006) Deciphering the biosynthesis pathway of the antitumor thiocoraline from a marine actinomycete and its expression in two Streptomyces species. Chembiochem, 7, 366-376.
30. Woodyer, R.D., Shao, Z., Thomas, P.M., Kelleher, N.L., Blodgett, J.A., Metcalf, W.W., van der Donk, W.A. and Zhao, H. (2006) Heterologous production of fosfomycin and identification of the minimal biosynthetic gene cluster. Chem Biol, 13, 1171-1182.
31. Wagner, N., Osswald, C., Biener, R. and Schwartz, D. (2009) Comparative analysis of transcriptional activities of heterologous promoters in the rare actinomycete Actinoplanes friuliensis. J Bacteriol, 142, 200-204.
32. Schmitt-John, T. and Engels, J.W. (1992) Promoter constructions for efficient secretion expression in Streptomyces lividans. Appl Microbiol Biotechnol, 36, 493-498.
33. Shiina, T., Tanaka, K. and Takahashi, H. (1991) Sequence of hrdB, an essential gene encoding sigma-like transcription factor of Streptomyces coelicolor A3(2): homology to principal sigma factors. Gene, 107, 145-148.
34. Shinkawa, H., Hatada, Y., Okada, M., Kinashi, H. and Nimi, O. (1995) Nucleotide sequence of a principal sigma factor gene (hrdB) of Streptomyces griseus. J Biochem, 118, 494-499.
35. Wang, X. and Seed, B. (2003) A PCR primer bank for quantitative gene expression analysis. Nucleic Acids Res, 31, e154.
36. Shimada, T., Makinoshima, H., Ogawa, Y., Miki, T., Maeda, M. and Ishihama, A. (2004) Classification and strength measurement of stationary-phase promoters by use of a newly developed promoter cloning vector. J Bacteriol, 186, 7112-7122.
37. Sun, J., Shao, Z.Y., Zhao, H., Nair, N., Wen, F., Xu, J.H. and Zhao, H.M. (2012) Cloning and characterization of a panel of constitutive promoters for applications in pathway engineering in Saccharomyces cerevisiae. Biotechnol Bioeng, 109, 2082-2092.
38. Dangel, V., Westrich, L., Smith, M.C., Heide, L. and Gust, B. (2010) Use of an inducible promoter for antibiotic production in a heterologous host. Appl Microbiol Biotechnol, 87, 261-269.
39. Boyle, P.M. and Silver, P.A. (2012) Parts plus pipes: synthetic biology approaches to metabolic engineering. Metab Eng, 14, 223-232.
40. Scalcinati, G., Knuf, C., Partow, S., Chen, Y., Maury, J., Schalk, M., Daviet, L., Nielsen, J. and Siewers, V. (2012) Dynamic control of gene expression in Saccharomyces cerevisiae engineered for the production of plant sesquitepene alpha-santalene in a fed-batch mode. Metab Eng, 14, 91-103.
198
41. Shepherd, M.D., Kharel, M.K., Bosserman, M.A. and Rohr, J. (2010) Laboratory maintenance of Streptomyces species. Curr Protoc Microbiol, Chapter 10, Unit 10E 11.
42. Mortazavi, A., Williams, B.A., McCue, K., Schaeffer, L. and Wold, B. (2008) Mapping and quantifying mammalian transcriptomes by RNA-Seq. Nat Methods, 5, 621-628.
43. Shao, Z. and Zhao, H. (2009) DNA assembler, an in vivo genetic method for rapid construction of biochemical pathways. Nucleic Acids Res, 37, e16.
44. Bradford, M.M. (1976) A rapid and sensitive method for the quantitation of microgram quantities of protein utilizing the principle of protein-dye binding. Anal Biochem, 72, 248-254.

199
5.6 Figures and tables
Figure 5.1 Bioanalyzer trace of total RNA samples. (a) S. albus J1074 in MYG medium (24 hours) sample 1. (b) S. albus J1074 in MYG medium (24 hours) sample 2. (c) S. albus J1074 in MYG medium at 72 hours sample 1. (d) S. albus J1074 in MYG medium at 72 hours sample 2. (e) S. albus J1074 in R2YE medium at 24 hours sample 1. (f) S. albus J1074 in R2YE medium at 24 hours sample 2. (g) S. albus J1074 in R2YE medium at 72 hours sample 1. (h) S. albus J1074 in R2YE medium at 72 hours sample 2.
a b
c d
e f
g h

200
Figure 5.2 Breakdown of total reads per sample. SA1_M24: S.albus sample 1 in MYG medium at 24 hours. SA1_M72: S.albus sample 1 in MYG medium at 72 hours. SA1_R24: S.albus sample 1 in R2YE medium at 24 hours. SA1_R72: S.albus sample 1 in R2YE medium at 72 hours. SA2_M24: S.albus sample 2 in MYG medium at 24 hours. SA2_M72: S.albus sample 2 in MYG medium at 72 hours. SA2_R24: S.albus sample 2 in R2YE medium at 24 hours. SA2_R72: S.albus sample 2 in R2YE medium at 72 hours.
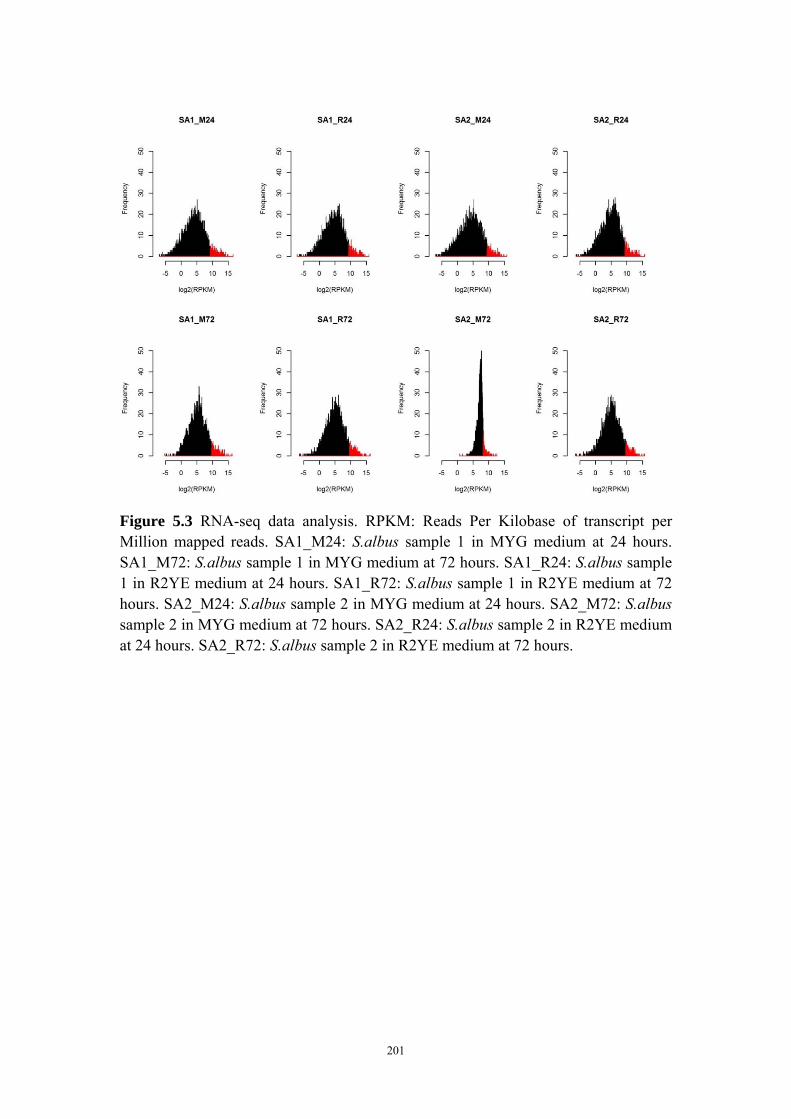
201
Figure 5.3 RNA-seq data analysis. RPKM: Reads Per Kilobase of transcript per Million mapped reads. SA1_M24: S.albus sample 1 in MYG medium at 24 hours. SA1_M72: S.albus sample 1 in MYG medium at 72 hours. SA1_R24: S.albus sample 1 in R2YE medium at 24 hours. SA1_R72: S.albus sample 1 in R2YE medium at 72 hours. SA2_M24: S.albus sample 2 in MYG medium at 24 hours. SA2_M72: S.albus sample 2 in MYG medium at 72 hours. SA2_R24: S.albus sample 2 in R2YE medium at 24 hours. SA2_R72: S.albus sample 2 in R2YE medium at 72 hours.

202
Cut off Number of hits Top of top
5% 195 126
3% 116 NA
2% 80 NA
1.5% 58 NA
1% 28 NA
Figure 5.4 Selection of top hits.

203
Figure 5.5 Vector map of the promoter-xylE cassettes for promoter 1 (promoter region for gene XNR_3584: Cold shock domain-containing protein CspD). The promoters were placed in front of the xylE reporter gene and assembled into the Yeast-E. coli-Streptomyces shuttle vector.
pYL-P3584(1)-xylE7995 bp
int
tL3
oriR6K
accIV
oriT
phiC31 attP
oriT nicking site
APHt
xylE
CEN6
ARS H4
URA2
P3584(1)

204
Figure 5.6 Design of the trouble-shooting experiments. Two different ex-conjugants were picked for the same promoter construct on two different ISP2 plates, and a single colony from each ex-conjugant was picked and inoculated into 2 mL MYG liquid medium. 1 mL saturated cell culture of each single colony was transferred into 50 mL fresh MYG liquid medium. For each time point, a duplicate sample was taken to calculate the error from experiment handling.

205
Figure 5.7 Data from trouble-shooting experiments. (a) qPCR analysis results of the trouble-shooting experiments. Sample annotation see Figure 5.6. For example: 1-1-Ea1-48h: the first sample for promoter #1 in batch E at 48 hours. 1-1-Ea1’-48h: duplicate of the first sample for promoter #1 in batch E at 48 hours. (b) XylE activity assay analysis results of the trouble-shooting experiments. Sample annotation see Figure 5.6. For example: 1-1-Ea1-48h: the first sample for promoter #1 in batch E at 48 hours. 1-1-Ea2-48h: the second sample for promoter #1 in batch E at 48 hours.
0.00
20.00
40.00
60.00
80.00
100.00
120.00
1‐1‐Ea‐1 1‐1‐Ea‐2 1‐1‐Eb‐1 1‐1‐Eb‐2 1‐2‐Ea‐1 1‐2‐Ea‐2 1‐2‐Eb‐1 1‐2‐Eb‐2
Specific Activity (m
U/m
g)
Specific Activity
Relative expression level
a
b

206
Figure 5.8 Promoter characterization. Evaluation of the activities of the heterologous promoters using xylE as a reporter. Promoters ermE*p is the commonly used promoter reported in literature.

207
Figure 5.9 The selected 10 strong promoter characterization. Evaluation of the activities of the heterologous promoters using xylE as a reporter. Promoters ermE*p is the commonly used promoter reported in literature.

208
Figure 5.10 The standard curves made for Real-Time-PCR. S. albus genomic DNA harboring the promoter-xylE cassette was used as the PCR template, which was diluted to 10, 100, 1000, 10000, 100000 and 1000000 times.
y = ‐3.2213x + 35.07R² = 0.991
0
5
10
15
20
25
30
35
0 1 2 3 4 5 6 7
Cycle Threshold (CT)
Log Starting Quantity
qPCR Standard Curve for rpoD Primers
y = ‐3.2713x + 33.837R² = 0.9957
0
5
10
15
20
25
30
35
0 1 2 3 4 5 6 7
Cycle Threshold (CT)
Log Starting Quantity
qPCR Standard Curve for xylE Primers

209
Figure 5.11 Promoter characterization via qPCR analysis. Characterization of strong constitutive promoters by real-time PCR analysis of the transcription of the xylE gene under different promoters in S. albus. Samples were taken at different time points. The y-axis scale represents the expression value relative to that of RpoD, a commonly used housekeeping sigma factor, which was set to 1.

210
Table 5.1 The total RNA samples submitted for RNA-seq analysis.
Sample ID Label on tube Concentration (ng/uL) Volumn(uL) RIN Note1 SA1 M24 663.7 50 9.8 pdf 1 sample 12 SA2 M24 562.5 50 10 pdf 1 sample 23 SA1 M72 229 50 9.8 pdf 1 sample 34 SA2 M72 398.6 15 9.1 pdf 1 sample 45 SA1 R24 236.5 50 10 pdf 1 sample 56 SA2 R24 293 50 10 pdf 1 sample 67 SA1 R72 327.5 50 8.2 pdf 2 sample 18 SA2 R72 362 50 8.5 pdf 2 sample 2
requirmentsall samples in one lane. Single read. Read length: 100nt.

211
Table 5.2 The 21 gene clusters identified for the 32 promoters chosen. The promoter number highlighted in red indicated the corresponding promoters showed strong activity in selected culture conditions. The gene name in red indicates the corresponding gene had a short gap between its neighbors (<70 bp). The gene name in blue indicates the corresponding promoter was selected to be cloned and characterized in this study. The gene name in pink shade indicates that the gene was in reverse direction on the chromosome. Ranking Number Gene Protein
2254 XNR_3719 transcriptional regulator, Crp/Fnr family
23 22 XNR_3720 30S ribosomal protein S12
47 XNR_3721 30S ribosomal protein S7
79 XNR_3722 Elongation factor G
4 4 XNR_3723 Elongation factor Tu 1
2404 XNR_3724 Magnesium or manganese‐dependent protein phosphatase
3752 XNR_3725 Transcriptional regulator, GntR family
2312 XNR_3726 Aspartate 1‐decarboxylase
1025 XNR_3727 Hypothetical protein
13 14 XNR_3728 30S ribosomal protein S10
29 XNR_3729 50S ribosomal protein L3
72 XNR_3730 50S ribosomal protein L4
19 XNR_3731 50S ribosomal protein L23
66 XNR_3732 50S ribosomal protein L2
63 XNR_3733 30S ribosomal protein S19
49 XNR_3734 50S ribosomal protein L22
76 XNR_3735 30S ribosomal protein S3
80 XNR_3736 50S ribosomal protein L16
107 XNR_3737 50S ribosomal protein L29
40 XNR_3738 30S ribosomal protein S17
43 XNR_3739 50S ribosomal protein L14
69 XNR_3740 50S ribosomal protein L24
50 XNR_3741 50S ribosomal protein L5
91 XNR_3742 30S ribosomal protein S14 type Z
14 15 XNR_3743 30S ribosomal protein S8
33 XNR_3744 50S ribosomal protein L6
31 XNR_3745 50S ribosomal protein L18
54 XNR_3746 30S ribosomal protein S5
105 XNR_3747 50S ribosomal protein L30
36 XNR_3748 50S ribosomal protein L15
139 XNR_3749 Preprotein translocase secY subunit
115 XNR_3750 Adenylate kinase
807 XNR_3751 Methionine aminopeptidase
11 12 XNR_3752 Translation initiation factor IF‐1 1
5 5 XNR_3753 50S ribosomal protein L36
9 10 XNR_3754 30S ribosomal protein S13
12 13 XNR_3755 30S ribosomal protein S11
119 XNR_3756 DNA‐directed RNA polymerase alpha subunit
10 11 XNR_3757 50S ribosomal protein L17

212
Table 5.2 (Cont.) Ranking Number Gene Protein
1450 XNR_1215 Ribosome maturation factor rimM
92 XNR_1216 putative RNA‐binding protein (contains KH domain)
24 23 XNR_1217 30S ribosomal protein S16
399 XNR_1218 Hypothetical protein
5218 XNR_1219 Hypothetical protein
Ranking Number Gene Protein
22 21 XNR_4375 30S ribosomal protein S20
Ranking Number Gene Protein
5895 XNR_2187 MutT‐like protein
45 XNR_2188 Hypothetical protein
18 19 XNR_2189 secreted protein
1123 XNR_2190 GntR‐family transcriptional regulator
1388 XNR_2191 Transposase
Ranking Number Gene Protein
2551 XNR_4882 SAM‐dependent methyltransferase
25 24 XNR_4883 SSU ribosomal protein S1p
5100 XNR_4884 Sheath polysaccharide‐degrading enzyme
Ranking Number Gene Protein
4477 XNR_1695
Oligopeptide ABC transporter, periplasmic oligopeptide‐
binding protein OppA
124 XNR_1696 Oligopeptide transport ATP‐binding protein OppF
146 XNR_1697 Oligopeptide transport ATP‐binding protein OppD
133 XNR_1698 Oligopeptide transport system permease protein OppC
97 XNR_1699 Dipeptide transport system permease protein DppB
26 25 XNR_1700
Peptide transport system secreted peptide‐binding
protein
503 XNR_1701 GTP‐binding protein TypA/BipA
2569 XNR_1702 Hypothetical protein

213
Table 5.2 (Cont.) Ranking Number Gene Protein
1228 XNR_4343 Ribonuclease, Rne/Rng family
39 34 XNR_4344 50S ribosomal protein L21
24 XNR_4345 50S ribosomal protein L27
833 XNR_4346 GTPase obg
Ranking Number Gene Protein
288 XNR_3706 Transcription antitermination protein nusG
17 18 XNR_3707 50S ribosomal protein L11
21 XNR_3708 50S ribosomal protein L1
569 XNR_3709 lipoprotein
8 9 XNR_3710 50S ribosomal protein L10
3 3 XNR_3711 50S ribosomal protein L7/L12
169 XNR_3712 DNA‐directed RNA polymerase beta subunit
Ranking Number Gene Protein
5097 XNR_3798 Polysaccharide deacetylase
2 2 XNR_3799 Heat shock protein 60 family co‐chaperone GroES
37 32 XNR_3800 Heat shock protein 60 family chaperone GroEL
2085 XNR_3801 Dehydrogenase
Ranking Number Gene Protein
5438 XNR_3583 Acyl‐CoA synthetase
1 1 XNR_3584 Cold shock domain‐containing protein CspD
1343 XNR_3585 Menaquinone via futalosine step 1
Ranking Number Gene Protein
4011 XNR_2392 Hypothetical protein
7 8 XNR_2393 Heat shock protein 60 family chaperone GroEL
87 XNR_2394 Cold shock protein
1488 XNR_2395 Threonine synthase

214
Table 5.2 (Cont.) Ranking Number Gene Protein
3770 XNR_2974 DNA‐damage‐inducible protein F
75 XNR_2975 50S ribosomal protein L9
38 33 XNR_2976 30S ribosomal protein S18 2
67 XNR_2977 Single‐stranded DNA‐binding protein 1
6 7 XNR_2978 30S ribosomal protein S6
3605 XNR_2979 integral membrane protein
Ranking Number Gene Protein
597 XNR_5228 Hypothetical protein
65 XNR_5229 Translation initiation factor IF‐3
15 16 XNR_5230 50S ribosomal protein L35
16 17 XNR_5231 50S ribosomal protein L20
2360 XNR_5232 rRNA methyltransferase
5615 XNR_5233 Hypothetical protein
Ranking Number Gene Protein
4641 XNR_2497 ATP‐dependent RNA helicase
27 26 XNR_2498 Cold shock protein
576 XNR_2499 MarR‐family transcriptional regulator
3029 XNR_2500 regulatory protein
Ranking Number Gene Protein
4678 XNR_3015 secreted protein
29 27 XNR_3016 Membrane protein
2988 XNR_3017 von Willebrand factor type A domain‐containing protein
Ranking Number Gene Protein
1496 XNR_1129 peptidase, M16 family
167 XNR_1130 Polyribonucleotide nucleotidyltransferase
30 28 XNR_1131 30S ribosomal protein S15
1753 XNR_1132 BldB protein

215
Table 5.2 (Cont.) Ranking Number Gene Protein
2640 XNR_3586 Cell division FtsK/SpoIIIE
32 29 XNR_3587 Hypothetical protein
539 XNR_3588 Hypothetical protein
Ranking Number Gene Protein
4807 XNR_3169 glycosyltransferase
34 30 XNR_3170 Chaperone protein DnaK
60 XNR_3171 Protein grpE
117 XNR_3172 Chaperone protein DnaJ 1
155 XNR_3173 HspR, transcriptional repressor of DnaK operon
1769 XNR_3174 LuxR‐family transcriptional regulator
Ranking Number Gene Protein
861 XNR_1473 Peptide chain release factor 1
35 31 XNR_1474 50S ribosomal protein L31
2344 XNR_1475
Cell envelope‐associated transcriptional attenuator LytR‐
CpsA‐Psr, subfamily A1

216
Table 5.3 The primers used for cloning the 32 promoters and the control promoter. Primer Name Primer Sequence
1 XNR_3584‐For GTAGAAACAGACGAAGAAGCTAGCTTTGCACTGGATTGCGCTCGTGAGGCTAGCTCCGCC
XNR_3584‐Rev GCAGCTGCACATGGCCCGGTCGCATTACACCTTTGTTCATAAGCCCTCCTTGGGCCAAAG
2 XNR_3799‐For GTAGAAACAGACGAAGAAGCTAGCTTTGCACTGGATTGCGGCCCGGCCATATCCGGCCCG
XNR_3799‐Rev GCAGCTGCACATGGCCCGGTCGCATTACACCTTTGTTCATGATCCGACCTCCCCCTTCGG
3 XNR_3711‐For GTAGAAACAGACGAAGAAGCTAGCTTTGCACTGGATTGCGTTCGGCTCGCGTAATGACCT
XNR_3711‐Rev GCAGCTGCACATGGCCCGGTCGCATTACACCTTTGTTCATGATGGCGTCCTTCCACTAAT
4 XNR_3723‐For GTAGAAACAGACGAAGAAGCTAGCTTTGCACTGGATTGCGCTCTTCGGAGCACACGCTTT
XNR_3723‐Rev GCAGCTGCACATGGCCCGGTCGCATTACACCTTTGTTCATTGGGGTCCTCCTGGAGAGTG
5 XNR_3753‐1‐For GTAGAAACAGACGAAGAAGCTAGCTTTGCACTGGATTGCGATCTTGCCCGCTCGCCGCCC
XNR_3753‐1‐Rev GCAGCTGCACATGGCCCGGTCGCATTACACCTTTGTTCATGGTGAGGTTCTCCGGGTCAG
6 XNR_3753‐2‐For CTGACCCGGAGAACCTCACCCTTCCCCGGGGTGGTGGCCGGCAC
XNR_3753‐2‐Rev GGTGAGGTTCTCCGGGTCAGGTGCCGGCCACCACCCCGGGGAAG
7 XNR_2978‐For GTAGAAACAGACGAAGAAGCTAGCTTTGCACTGGATTGCGTACGGCACCTCCTGCGGAAG
XNR_2978‐Rev GCAGCTGCACATGGCCCGGTCGCATTACACCTTTGTTCATGTAGAACCCACCTCCTTTGG
8 XNR_2393‐For GTAGAAACAGACGAAGAAGCTAGCTTTGCACTGGATTGCGGGCGCCGACCGCACCACACT
XNR_2393‐Rev GCAGCTGCACATGGCCCGGTCGCATTACACCTTTGTTCATGTGAAGTGGTCCTCCCAGGA
9 XNR_3710‐For GTAGAAACAGACGAAGAAGCTAGCTTTGCACTGGATTGCGTCCGCTCCTCCGGGCGGGGT
XNR_3710‐Rev GCAGCTGCACATGGCCCGGTCGCATTACACCTTTGTTCATGAGCCTCGGCCTCCTTCCGG
10 XNR_3754‐For GTAGAAACAGACGAAGAAGCTAGCTTTGCACTGGATTGCGCGCACACCTGCTCTCGCAGA
XNR_3754‐Rev GCAGCTGCACATGGCCCGGTCGCATTACACCTTTGTTCATCTAATGGCTCCAGTTGTCTG
11 XNR_3757‐For GTAGAAACAGACGAAGAAGCTAGCTTTGCACTGGATTGCGGGTTCTGCTCGGCAGGGGTG
XNR_3757‐Rev GCAGCTGCACATGGCCCGGTCGCATTACACCTTTGTTCATGGTCTTTCTCCTTGTGATCT
12 XNR_3752‐For GTAGAAACAGACGAAGAAGCTAGCTTTGCACTGGATTGCGTCCAGAGATGTCCGGCGTGC
XNR_3752‐Rev GCAGCTGCACATGGCCCGGTCGCATTACACCTTTGTTCATGCTTCGCCCTTCGAATCGAC
13 XNR_3755‐For GTAGAAACAGACGAAGAAGCTAGCTTTGCACTGGATTGCG
XNR_3755‐Rev GCAGCTGCACATGGCCCGGTCGCATTACACCTTTGTTCAT
14 XNR_3728‐For GTAGAAACAGACGAAGAAGCTAGCTTTGCACTGGATTGCG
XNR_3728‐Rev GCAGCTGCACATGGCCCGGTCGCATTACACCTTTGTTCAT
15 XNR_3743‐For GTAGAAACAGACGAAGAAGCTAGCTTTGCACTGGATTGCG
XNR_3743‐Rev GCAGCTGCACATGGCCCGGTCGCATTACACCTTTGTTCAT
16 XNR_5230‐For GTAGAAACAGACGAAGAAGCTAGCTTTGCACTGGATTGCG
XNR_5230‐Rev GCAGCTGCACATGGCCCGGTCGCATTACACCTTTGTTCAT
17 XNR_5231‐For GTAGAAACAGACGAAGAAGCTAGCTTTGCACTGGATTGCG
XNR_5231‐Rev GCAGCTGCACATGGCCCGGTCGCATTACACCTTTGTTCAT
18 XNR_3707‐For GTAGAAACAGACGAAGAAGCTAGCTTTGCACTGGATTGCG
XNR_3707‐Rev GCAGCTGCACATGGCCCGGTCGCATTACACCTTTGTTCAT
19 XNR_2189‐For GTAGAAACAGACGAAGAAGCTAGCTTTGCACTGGATTGCG
XNR_2189‐Rev GCAGCTGCACATGGCCCGGTCGCATTACACCTTTGTTCAT
20 XNR_3708‐For GTAGAAACAGACGAAGAAGCTAGCTTTGCACTGGATTGCG
XNR_3708‐Rev GCAGCTGCACATGGCCCGGTCGCATTACACCTTTGTTCAT
21 XNR_4375‐For GTAGAAACAGACGAAGAAGCTAGCTTTGCACTGGATTGCG
XNR_4375‐Rev GCAGCTGCACATGGCCCGGTCGCATTACACCTTTGTTCAT
22 XNR_3720‐For GTAGAAACAGACGAAGAAGCTAGCTTTGCACTGGATTGCG
XNR_3720‐Rev GCAGCTGCACATGGCCCGGTCGCATTACACCTTTGTTCAT
23 XNR_1217‐For GTAGAAACAGACGAAGAAGCTAGCTTTGCACTGGATTGCG
XNR_1217‐Rev GCAGCTGCACATGGCCCGGTCGCATTACACCTTTGTTCAT
24 XNR_4883‐For GTAGAAACAGACGAAGAAGCTAGCTTTGCACTGGATTGCG
XNR_4883‐Rev GCAGCTGCACATGGCCCGGTCGCATTACACCTTTGTTCAT
25 XNR_1700‐For GTAGAAACAGACGAAGAAGCTAGCTTTGCACTGGATTGCG
XNR_1700‐Rev GCAGCTGCACATGGCCCGGTCGCATTACACCTTTGTTCAT
26 XNR_2498‐For GTAGAAACAGACGAAGAAGCTAGCTTTGCACTGGATTGCG
XNR_2498‐Rev GCAGCTGCACATGGCCCGGTCGCATTACACCTTTGTTCAT
27 XNR_3016‐For GTAGAAACAGACGAAGAAGCTAGCTTTGCACTGGATTGCG
XNR_3016‐Rev GCAGCTGCACATGGCCCGGTCGCATTACACCTTTGTTCAT
28 XNR_1131‐For GTAGAAACAGACGAAGAAGCTAGCTTTGCACTGGATTGCG
XNR_1131‐Rev GCAGCTGCACATGGCCCGGTCGCATTACACCTTTGTTCAT
29 XNR_3587‐For GTAGAAACAGACGAAGAAGCTAGCTTTGCACTGGATTGCG
XNR_3587‐Rev GCAGCTGCACATGGCCCGGTCGCATTACACCTTTGTTCAT
30 XNR_3170‐For GTAGAAACAGACGAAGAAGCTAGCTTTGCACTGGATTGCG
XNR_3170‐Rev GCAGCTGCACATGGCCCGGTCGCATTACACCTTTGTTCAT
31 XNR_1474‐For GTAGAAACAGACGAAGAAGCTAGCTTTGCACTGGATTGCG
XNR_1474‐Rev GCAGCTGCACATGGCCCGGTCGCATTACACCTTTGTTCAT
32 XNR_3800‐For GTAGAAACAGACGAAGAAGCTAGCTTTGCACTGGATTGCG
XNR_3800‐Rev GCAGCTGCACATGGCCCGGTCGCATTACACCTTTGTTCAT
33 XNR_2976‐For GTAGAAACAGACGAAGAAGCTAGCTTTGCACTGGATTGCG
XNR_2976‐Rev GCAGCTGCACATGGCCCGGTCGCATTACACCTTTGTTCAT
35 XNR_4919‐For GTAGAAACAGACGAAGAAGCTAGCTTTGCACTGGATTGCGCGCACCCCCTGGTCAACGCG
XNR_4919‐Rev GCAGCTGCACATGGCCCGGTCGCATTACACCTTTGTTCATGAGCCGATCTCCTCGTTGGT