nature and science 2013;11(6) ... · effect of magnetite and some biofertilizer application on...
TRANSCRIPT

Nature and Science 2013;11(6) http://www.sciencepub.net/nature
46
Effect of Magnetite and Some Biofertilizer Application on Growth and Yield of Valencia Orange Trees Under El – Bustan Condition
Hoda, M. Mohamed 1; Faten, A. Al- kamar 2; and Azza, A. M. Abd-Elall 3
1Horticulture. Res. Instit. Citrus Dep., Agric. Res., Center, Giza, Egypt.
2Soil Water and Environment, Res. Inst., Sand and Calcareous Soils Dep. Agric. Res., Center, Giza, Egypt. 3Soil Water and Environment, Res. Inst., Microbiology Dep. Agric. Res., Center, Giza, Egypt.
Abstracts: The response of Valencia orange trees (Citrus Sinensis) budded on Volkamer lemon rootstock (Citrus Volkameriana) to Magnetite, Diatoms and biofertilizer (mixture of Cyanobacteria and Azolla) were studied during (2011 & 2012) seasons. Trees were four years old, planted at 4x6m apart (175 trees/ feddan), under drip irrigation system and growing in soil influenced by salinity, (where EC was 3.64 ds/m), in a private orchard, located at El Bustan County, El Behera Governorate, Egypt. The experiment involved 14 treatments. The obtained results indicated that, the application of biofertilizer plus 750 gm. Magnetite treatment was the best combination for achieving the highest total yield (51.44, 38.22 % over control) during two seasons, respectively. Diatoms either singly or in combination with Magnetite treatments improved fruit peel quality, where, (the peel thickness and firmness has increased, fruit peel was more lightness and had high good color quality), so it seems more attractive. Diatom treatments could earlier the harvest date by increasing fruit TSS/ Acid ratio and Vitamin C contents and to decrease fruit acidity especially Diatoms at5 ppm plus 750 gm. Magnetite. All treatments slightly reduced soil EC and pH, increased leaf K+ and reduced Na+ uptake especially biofertilizer plus 750 gm. Magnetite treatment. Treatments also enhanced of the soil biological activity in terms of increasing the total (bacterial, cyanobacterial) counts and CO2 evolution. Based on the economic study, it could be recommended to use biofertilizer plus 750 gm. Magnetite for achieving the best total yield and produced the highest net profit / fed., (4541.75 L.E), or use Diatoms at 5 ppm plus 750 gm. Magnetite for giving the high fruit peel quality which very important characteristics especially when fruits tended to be exported and earlier maturation of fruit as well as increased net profit / fed. (3426.75 L.E).While, it could not be recommended to use biofertilizer alone because it caused loss of money (-742 L.E). [Hoda, M. Mohamed; Faten, A. Al- kamar; and Azza, A. M. Abd-Elall. Effect of Magnetite and Some Bio fertilizer Application on Growth and Yield of Valencia Orange Trees Under El – Bustan Condition. Nat Sci 2013;11(6):46-61]. (ISSN: 1545-0740). http://www.sciencepub.net/nature. 7 Key words: Magnetite, Diatoms, cyanobacteria, Azolla, yield, fruit quality and Valencia orange trees. 1. Introduction
It will known that most of the new reclaimed areas in Egypt are planted with fruit trees especially citrus which considered the first fruit crop in Egypt. The area of citrus has increased rapidly through the last few years and reached about 462772 feddans (According to the yearly Bull. Agric. Economic and Statistics, Ministry of Agriculture and Land Reclamation of Egypt, 2010). Efforts are insistently devoted to raise the productivity of such a crop. Unfortunately, many factors are contributing to reduce crop yield. One of these factors is the salinity soil which is a biotic stress factors. Egypt has an area of about one million square kilometers or 238 million feddans (one feddan = 0.42 ha). The total agricultural land in Egypt amounts to nearly 8.4 million feddans (3.5 million ha) and accounts for around 3.5 percent of the total area. One million ha in the irrigated areas suffer from salinization problems, water logging and sodicity (FAO, 2005). The majority of salt-affected soils in Egypt are located in the Northern central part
of the Nile Delta and on its Eastern and Western sides. About 900 000 ha suffer from salinization problems in cultivated irrigated areas, 6 % of Northern Delta region are salt-affected, 20 % of the Southern Delta and Middle Egyptian region and 25 % of the Upper Egypt region (FAO, 2003). Million hectares of arable land too saline for agriculture and hundreds of thousands hectares of agriculture productive land are lost annually for food production due to salinization (FAO, 2008). Salinity stress depresses plant growth and development at different physiological levels. The mechanism by which salt stress damage plants are still a discussing matter due to very complex nature of the salt stress in plants (zhu, 2001). Plants growing in saline soil come across generally with major drawbacks; the first is the increase in the osmotic stress due to high salt concentration of soil; the second is the increase in concentration in Na+ and Cl-, exhibition tissue accumulation of Na+ and Cl-, and inhibition of mineral nutrient uptake, Mesut et al. (2010).

Nature and Science 2013;11(6) http://www.sciencepub.net/nature
47
Magnetite (Magnetite iron ore), Diatoms as a source of Silicon and some biofertilizer like (Azolla and Cyanobacteria) are the most important factors affecting plant growth, especially under salt conditions. Magnetite is a natural row rock that has very high iron content, Magnetite has a black or brownish-red, and it has hardness about 6 on the Mohs hardness scale, it is one of two natural row rocks in the world that is naturally magnetic (Mansour, 2007). Application of magnetic iron increased vegetative growth, yield and on pepper plant grow under saline irrigation conditions, Taha et al. (2011). Also, magnetic iron increased plant growth and leaf mineral content on cauliflower (Mansour, 2007) and on Roselle plants (Hibiscus Sabdariffal), Yasser et al. (2011). Moreover, some studies reported that, magnetic field had a positive effect on the number of flowers and total yield, Matsudo et al. (1993) on strawberry; Podlesny et al. (2005) on pea. In addition, application of a magnetic field to irrigation water was shown to increase plant nutrient content, Moon and Chung (2000).
Diatoms are the world’s largest contributors to bio silicification and are one of the predominant contributors to global carbon fixation. Silicon is a major limiting nutrient for diatom growth and hence is a controlling factor in primary productivity, Veronique et al. (2000). The function of Si as a protective agent is one of the most important for plants. Improved Si nutrition has been shown to increase plant tolerance to a biotic stresses such as Al, Mn, heavy metal toxicities, salinity, frost and drought (Epstein, 1999). In this respect, grove studies conducted in Russia on citrus responses to Si fertilizers showed 30 to 80 % accelerated growth, 2-4 week earlier maturation of fruits, and increased fruit yield (Taranovskaia, 1939). Moreover, (wutscher, 1989) reported that, citrus trees treated with Si absorbed more nutrients than the untreated trees. In plants growing under salt- stress conditions, added silicon helps in maintain an adequate supply of essential nutrient and reduce sodium uptake and its transport to shoots Tuna et al. (2008). Also, in experiments with salt- stressed barley, (Liang, 1999) indicated that, silicon (1 mmol dm-3 K2Sio3) decreases sodium but increases potassium concentrations both in roots and shoots. In addition, Romero- Aranda et al. (2006) stated that, silicon evidently improves water status in tomato growing under salt- stress (80 mmol dm-3 NaCl).
On the other hand, Cyanobacteria are a diverse group of prokaryotes possessing oxygen evolving photosynthetic system Prabina et al. (2004). Azolla is a free floating water fern that floats in the water and fixes atmospheric nitrogen because of its association with the nitrogen fixing cyanobacterium
Anabaena, Waseem et al. (2012). Several studies have indicated that, Azolla and cyanobacteria as biofertilizer could improve plant growth and yield under salinity conditions Sikander et al. (1995) and Aziz and Hashem, (2004). Also, the positive effect of Azolla on rice grain yield has also been reported from different countries, Kumarasinghe and Eskew, (1993). Moreover, inoculation of the cyanobacteria inoculums on rice in the saline soil resulted 80.48 % increase in yield over control.
The present study was therefore, undertaken to study the effects of application of Magnetite, Diatoms, and some bio fertilizer (Azolla and Cyanobacteria) on growth, yield and fruit quality of Valencia orange grown under saline soil conditions located at El Bustan County, Egypt. 2. Materials and Methods
Four years old trees of Olinda Valencia orange (Citrus Sinensis) budded on Volkamer lemon rootstock (Citrus Volkameriana) planted at 4x6m a apart (175 trees/ feddan), (feddan = 4200 m2) and growing in soil influenced by salinity in a private orchard, belong to Mr. Ashraf hegazi located at El Bustan County, El Behera Governorate, Egypt were selected for two seasons (2010, 2011 and 2011, 2012). The experiment area was irrigated by drip irrigation system. Fifty six of ‘Olinda Valencia orange” trees were used according to vigor and number of flowers for data collection. Different materials were used in the experiment as follow: 1) Magnetite (Magnetic iron ore), contained 48.8% Fe3O4, 17.3% Fe O, 26.7% Fe2 O3, 2.6% MgO, 4.3% SiO2 and 0.3% CaO, obtained from “El- Ahram company for mining and natural fertilizers” (ECMNF), Giza. Egypt. 2) Diatoms (the major constituent of diatom is amorphous silicon dioxide 93% Sio2 and was obtained from “World Foundation Stimuli Trading”, Cairo, Egypt. 3) biofertilizer consists of mixture of Azolla and cyanobacteria were obtained from the microbiology Department, Soil Water and Environment, Res. Inst., Agric Res., Center. Cyanobacteria strain (Spirulina platensis) was cultured in Zarrouk medium (Zarrouk, 1966) and incubated in a growth chamber under continuous illumination (2000 lux) and temperature of 32±2˚C. (Azolla pinnata) was grown on modified Yoshida medium, Yoshida et al. (1976). After 30 days of incubation, the cultures were homogenized and blended with a mixer to have a homogenized suspension (Fig.1). Fresh Azolla pinnata was harvested from the culture medium and mixed well with distilled water (1:2 w/v) using an electric mixer till obtaining a homogeneous suspension.(Fig.2). However, the obtained suspensions for both Azolla and cyanobacteria were also mixed together and kept at 4˚C till field applications as foliar spray.

Nature and Science 2013;11(6) http://www.sciencepub.net/nature
48
(Fig. 1) Cyanobacteria (Spirulina platensis) (Fig. 2) Azolla (Azolla pinnata)
A complete randomized block design with four replicates for each treatment was done. The experiment involved 14 treatments as follow:
1- Control (untreated) 2- Magnetite at 500gm. 3- Magnetite at 750gm. 4- Magnetite at 1000gm. 5- Diatoms at 5 ppm 6- Diatoms at 5 ppm + Magnetite at 500gm. 7- Diatoms at 5 ppm + Magnetite at 750gm. 8- Diatoms at 5 ppm + Magnetite at 1000gm. 9- Bio fertilizer at 300cm3 10- Biofertilizer at 300cm3+Magnetite at 500gm. 11- Biofertilizer at 300cm3+Magnetite at 750gm. 12- Biofertilizer at 300cm3+ Magnetite at 1000gm. 13- Diatoms at 3 ppm 14- Diatoms at 10 ppm In mid- December of each season Magnetite
rates were individually added in the soil at two trenches (100cm length x 20 cm width x 20cm depth) in the both side of the tree which was done at the end of the tree shadow and in the direction of irrigation furrows then immediately followed by drip irrigation. Biofertilizer (mixture of Azolla and cyanobacteria) was used at 300cm3/ tree and diluted with 3litres of tap water (50L/fed.plus550L tap water).Both Diatoms and bio fertilizer treatments were added in the soil and foliar sprayed at two times (full bloom stage and two weeks after full bloom). The following parameters of the studied treatments were carried out. Tree canopy volume (m3).
Tree volume was calculated according to the following equation reported by Morse and Robertson, (1987).TV = 0.5236 × HD2, Where H = tree height, D = tree diameter. Leaf area (cm2).
Forty mature leaves at different four sides of each tree were collected and average leaf area at the end of spring growth cycle (September) was calculated using the equation of (Chou, 1966). Leaf area = ⅔ length × width.
Yield. The number of fruits per tree was counted at the
harvesting time (mid February). The yield per tree (kg) was determined and the theoretical yield (ton/ fed.) was calculated. Fruit quality.
Ten fruits of Olinda Valencia orange were randomly taken from the yield in two seasons for each replicate and the following determinations were carried out:
Average of fruit weight (gm.) was determined. Fruit size (ml) was determined from the volume of water displaced by immersing the fruit sample in graduated jar filled with water and average volume was calculated. Fruit length, diameter and peel thickness (mm) in each individual fruit were measured by using a digital vernier caliper. Juice weight percentage was calculated and recorded. Fruit firmness was measured with Effegl, Pentrometer (11.1 mm diameter prop, Effegl, Alfonsing, Italy and expressed as Lb/inch2). Total soluble solids (T.S.S %) was determined by using Zeiss hand refractometer. Total acidity (%) was determined in fruit juice as percentage of anhydrous citric acid according to (A.O.A.C, 1995). Total soluble solids/acid ratio was calculated from the values of total soluble solids divided by values of total acids. Ascorbic acid (Vitamin C) was calculated as mg/100 ml juice according to (Horwitz, 1972). Leaf mineral content.
Leaf samples were collected from the third or fourth leaf and were taken from the up side of shoot of each tree replicate representing spring cycle after cessation of the shoot growth in length. Forty leaves of five to seven-month-old from non-fruiting and non flushing shoots, were collected according to Jones and Embleton, (1960) to determine leaf content of N,P,K, Fe, Zn and Mn on leaf dry weight basis. Total nitrogen (%) was determined in 0.2 g of dried substance of the leaves using microkjeldahl method according to (Pregl, 1945). Phosphorus (%) was

Nature and Science 2013;11(6) http://www.sciencepub.net/nature
49
determined calorimetrically using stannous chloride-sulfuric acid method according to Troug and Meyer, (1939). Potassium (%) was determined using the flame photometric method according to Brown and Lilliland, (1966).Iron, Manganese and Zinc were determined as ppm using atomic absorption according to (Carter, 1993). Soil analysis.
Soil samples were taken three times (before starting the experiment in October 2010, at the end of the first season in December 2011 and at the end of the second season in December 2012. Soil biological activities, soil physical and chemical properties were measured. The CO2 evolution was determined according to Gaur et al. (1971), total bacterial count was performed on nutrient agar using the spread plate
method (APHA, 1992) and total cyanobacterial counts were conducted by plating ten-fold serial soil suspension-dilutions in triplicate on to agarized BG11 medium, Allen and Stanier, (1968). Available nitrogen was determined according to (Black, 1982). Available phosphorus was determined spectrophotometrically as mentioned by Watanabe and Olsen, (1965). Available potassium was determined using flame-photometric method (APHA, 1992). Soil reaction (pH) was measured in 1: 2.5 soil water extract using glass electrode pH meter Model (955), and electric conductivity (EC) was measured in 1:5 soil water extract using glass electrode conductivity meter Model Jenway 4310. Table (1) shows Physical, chemical and biological analyses of the Soil.
Table (1). Physical, chemical and biological analyses of the Soil before starting the experiment.
Physical properties of soil (%) CaCo3 OM Texture Clay silt Fine sand Corse sand
1.8 0.28 Sandy loam 15.65 6.50 4 73.85 Chemical properties of soil
Anions meq / L Cations meq / L SP (%) SO4
= Cl- HCO3- CO3
= K+ Mg++ Na+ Ca++ ECds/m pH 1:2.5 28% 6.00 23.00 7.40 - 0. 61 15.69 9.50 10.6 3.64 8.82
Available macro and micro nutrients (mg / kg) of soil Mn zn Fe K P N 2.00 0.45 3.51 58.50 12.00 17.5
Biological analysis of soil
CO2 evolution (mg /100g soil-1day-1)
Total count Cyano. cfu (103 g soil-1)
Total count Bacteria cfu (106 g soil-1)
10.00 6.00 3.00 Where SP = Saturation percentage Statistical analysis.
The experiment was designed in completely randomized block design with four replicates for each treatment and each replicate was represented by one tree. The obtained data of both seasons were subjected to analysis of variance according to Clark and Kempson, (1997) and the means were differentiated using Duncan multiple range test at 5% level (Duncan, 1955). 3. Results and Discussions Growth Criteria. Results concerning the tree canopy volume (m3) and average leaf area (cm2) of Olinda Valencia orange trees as affected by Magnetite, Diatoms as a source of silicon (Si) and biofertilizer (mixture of cyanobacteria and Azolla) treatments are presented in Table (2).The obtained data showed that, all treatments increased tree canopy volume and leaf area in the second season in comparison with the first season. In more details and regarding the tree canopy volume, data indicated that, trees treated by Diatoms
at 5 ppm recorded the highest values (26.25 and 28.28 m3) followed by Diatoms at 5 ppm plus 1000 gm. Magnetite treatment (23.67 and 25.58 m3) and Diatoms at 10 ppm (23.60 and 25.55m3). While, the lowest significant values was in control treatment (19.31 and 21.64 m3) in the first and second seasons (2011 & 2012), respectively. On the other hand, the other treatments gave the intermediate values in this regard. As for leaf area, data in Table (2) showed that, all treatments increased leaf area as compared to control treatment. Also the changes of leaf area slightly fluctuated in both seasons, and no obvious trend could be detected.
Magnetic treatments may affect phytohormone production leading to improve cell activity and plant growth (Maheshwari, 2009). The present results were conforming to those of, Taha et al. (2011) they reported that, the application of Magnetic improved growth of pepper plant under salt condition.

Nature and Science 2013;11(6) http://www.sciencepub.net/nature
50
Table (2) Effect of Magnetite, Diatoms and bio fertilizer applications on tree volume and leaf area of Olinda Valencia orange trees.
Treatments Tree canopy volume(m3) Leaf area(cm2) 2011 2012 2011 2012
Control 19.31 i 21.64 f 17.71 h 19.25 e Magnetite at 500 gm. 21.79 ef 25.62 b 18.24 gh 21.84 d Magnetite at 750 gm. 23.60 b 25.11 bc 20.24 bc 19.83 e Magnetite at 1000 gm. 20.64 gh 22.51de 19.21 ef 21.71 d Diatoms at 5ppm 26.25 a 28.28 a 22.57 a 21.70 d Diatoms at 5ppm + 500 gm. Magnetite 22.00 e 23.62 bc 20.55 b 21.47 d Diatoms at 5ppm + 750 gm. Magnetite 23.31 c 25.00 bc 17.94 h 23.01 c Diatoms at 5ppm + 1000 gm. Magnetite 23.67 b 25.58 b 18.16 h 22.79 c Bio fertilizer at 300cm3 20.48 h 21.87 ef 19.59 de 24.81 ab Bio fertilizer + 500 gm. Magnetite 20.50 h 22.38 de 19.72 cd 24.14 b Bio fertilizer + 750 gm. Magnetite 21.62 f 24.07 bc 19.26 ef 22.84 c Bio fertilizer + 1000 gm. Magnetite 20.78 g 23.05 cd 19.17 ef 25.43 a Diatoms at 3 ppm 22.93 d 24.55 bc 18.94 fg 24.80 ab Diatoms at10 ppm 23.60 b 25.55 b 20.36 bc 22.81 c Mean separation within columns by Duncan’s multiple range test, 5% level. Values that don’t share the same letter are significantly different. Where Bio fertilizer refer to mixture of: Azolla pinnata and cyanobacteria (Spirulina platensis).
Also, (De souza, 2005) indicated that, Magnetic treatments led to a remarkable increase in plant root and stem length as well as fresh dry weight during the nursery period of tomato plant. On the other hand, our results are in harmony with the results obtained by Vladimir et al. (2001) who found that, the application of pro- Silsilica slag as a source of Si to young Valencia orange trees significantly increased both the total tree height and the length of tree branches. Also, (Wutscher,1989) demonstrated in a laboratory experiment that optimization of Si nutrition for 1 year old and 2 year old orange trees increased fresh weight of shoots by 30, 40 % during a 6 months period. Moreover, Anser et al. (2012) stated that, silicon improves growth and dry matter production under salt stress conditions, its application also enhances the crop performance against a biotic stress.
On the other hand, Azolla and cyanobacteria as biofertilizer could improve plant growth under salinity conditions Aziz and Hashem (2004). In this context, (Adam, 1999) in Egypt studied the effect of cyanobacteria on seed germination and related processes of wheat, sorghum, maize and lentil. It was observed that growth parameters were significantly increased compared with control. These increases could be attributed to the amino acids and peptides produced in the algal filtrate and/or other compounds that stimulate growth of crop plants. Also, Nanjappan-Karthikeyanl et al. (2007) stated that, cyanobacteria have growth promoting activity as inoculants of wheat. This stimulation effect of blue green algal (BGA) on plant growth may be attributed to their influence on increasing the biological activity
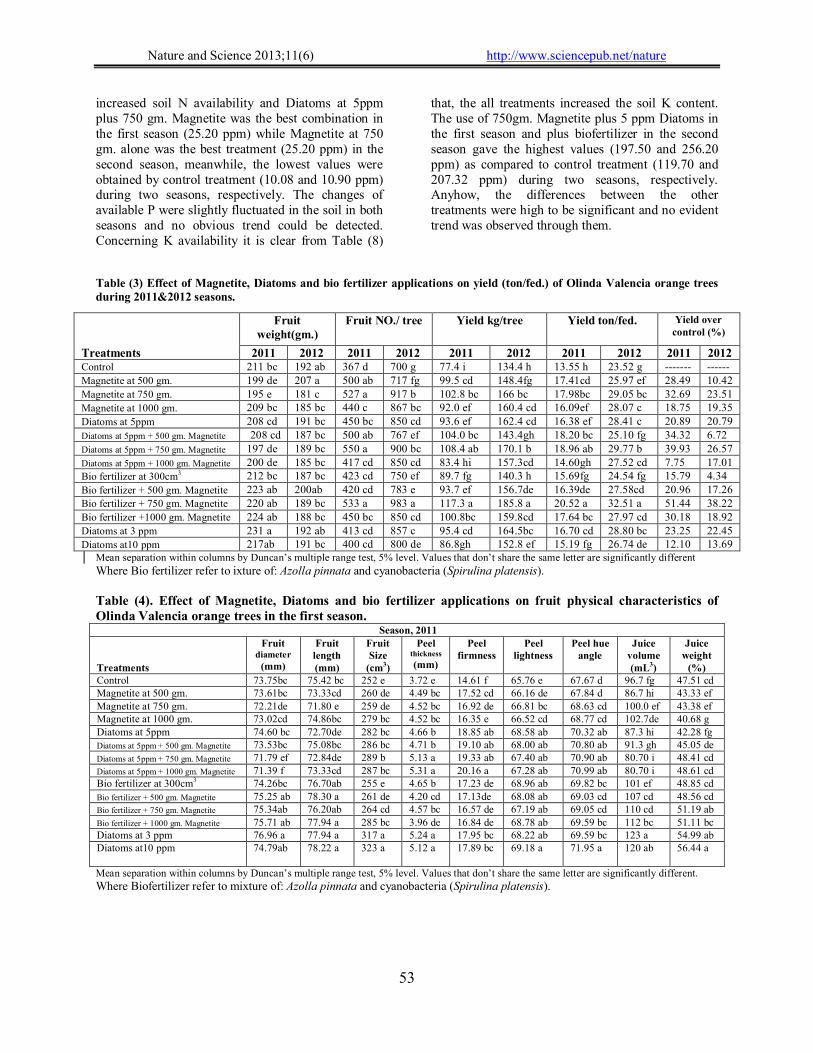
(Table 10) and chemical properties of the tested soil (Tables 8 & 9). Yield. Data in Table (3) showed that, all treatments increased fruit yield as compared with control treatment during two seasons. Also, it is noticed that, the application of biofertilizer plus 750 gm. Magnetite treatment was the best combination and was superior for achieving the highest total yield followed by Diatoms at 5 ppm plus 750 gm. Magnetite and 750gm. Magnetite alone, This increase of yield was about (51.44, 38.22 %), (39.93, 26.57 %) and (32.69, 23.51 %) during two seasons, respectively. Meanwhile, the other treatments gave the intermediate values in the first and second seasons.
These results are in the same line with the obtained by Taha et al. (2011) on Capsicum Annuum L. grown under saline irrigation conditions and they indicated that, the highest significant increase in yield appeared under the highest dose of Magnetite treatments (4g/pot). Moreover, (Mansour, 2007) revealed that, there were gradual increments in curd characters and yield of cauliflower plants with increasing the Magnetite levels, this increase might be attributed to stimulating effect of Magnetite on plant growth and the absorption of N, P, K, and Ca. Also, our results were in harmony with finding by Arab et al. (2011) who found that, in Iran the application of 600 kg Si ha-1 and 4 liter cycocel ha-
1increased total yield of rice. Moreover, (Bokhtiar, 2011) reported that, Si amendment increased yield in dry matter (26 to 70%) and in yield (30 to 66%) on sugarcane, the higher yields due to Si application were correlated with higher leaf Si concentrations (Epstein, 1994).On the other hand, Aziz and hashem,

Nature and Science 2013;11(6) http://www.sciencepub.net/nature
51
(2004) reported that, inoculation, of the cyanobacteral inoculums in the saline soil resulted 80.48 % increase in yield over control. Also, Sikander et al. (1995) revealed that the application of Azolla in rice grown under Saline Soil increased crop yield. Fruit quality. 1. Fruit physical properties.
Data in Tables (4 & 5) showed that Diatoms spray at (3 or 10 ppm) treatments and biofertilizer plus Magnetite at different rates increased fruit dimensions (diameter and length) with low significant differences between them during two seasons. On the other hand, trees sprayed with Diatoms at (3 or 10 ppm) alone increased fruit size, while, the other treatments were in between in the first and second seasons.
As for Fruit peel quality represented by peel thickness, firmness, lightness and Peel hue angle which are very important characteristics especially when fruits tended to be exported. In general data in Tables (4 & 5) indicated that, all treatments increased peel fruit quality especially trees were treated by Diatoms (as a source of Si) either singly or in combination with Magnetite treatments, which increased peel thickness and firmness, also its fruits were more lightness and had good rind color, so it seems more attractive than the other fruits which treated by other treatments. Concerning juice volume, results showed that, Diatoms at (3 or 10 ppm) increased juice volume in the first season, while, the differences between all treatments were low to be significant with no obvious trend with them in the second season. As for Juice weight percentage, it is clear from Tables (4 & 5) that, the best results were obtained by the use of 3 or 10 ppm Diatoms (54.99 &
56.44 %), (56.59 &55.67 %) and bio fertilizer plus 750 gm. Magnetite (51.19 & 58.11 %) treatments, While, the lower value resulted by using 1000 gm. Magnetite (40.68 & 50.66 %) in the first and second seasons, respectively. On the other hand, the changes of Juice weight percentage were slightly fluctuated during two seasons. 2. Fruit chemical properties.
It is noticed from Table (6) that, all treatments tended to increase fruit TSS/ Acid ratio and Vitamin C contents and to decrease fruit acidity as compared to control treatment. In more details and regarding fruit TSS percentage, the highest values were obtained by the use of 10 ppm Diatoms in the first season (10.17%) and trees treated by 10 ppm Diatom or 1000gm. Magnetite treatments (10.17 and 11.00%) in the second season. While, the minimum values were obtained by 5 ppm Diatoms (7.83%) in first season and 5 ppm Diatoms plus 500gm. Magnetite (9.33%) in the second season. Meanwhile, the
differences between the other treatments were in between during two seasons. As for acidity % data in Table (6) revealed that, all treatments reduced acidity, whereas, the lowest values were obtained by 5pmm Diatoms plus 750 gm. Magnetite treatment (0.67 and 0.71 %) comparing control treatment which recorded the highest values (1.76 and 1.76%) in the first and second seasons, respectively. while the differences between other treatments didn't show any obvious trend during two seasons. TSS/Acid ratio is an important characteristic for fruits exportation. The results indicated that, 5 ppm Diatoms plus 750 gm. Magnetite or 10 ppm Diatoms were the best treatments (14.26 & 13.15) and (14.36 & 14.36) followed by 5 ppm Diatoms plus 500gm. Magnetite (11.99 & 12.91). While, the minimum values were in control treatment (5.48 & 5.99) in the first and second seasons, respectively. Concerning the Vitamin C, it is clear that, all treatments increased V.C as compared with control treatment especially trees treated by Diatoms either singly or in combination with Magnetite treatments. Also, Diatoms at 5ppm plus 750gm. Magnetite was the best combination, and the changes of V.C were slightly fluctuated during two seasons.
Similar results were obtained by Ismail et al. (2010) who found that, the application of 71.5 gm. Magnetite/ tree on grapevine grown in a newly reclaimed area was more effective in achieving the best values of both length and diameter berry, gave low total acidity in juice and high ratio of TSS / acid ratio. Also, Taha et al. (2011) revealed that, treated pepper plants with Magnetite at (4 g/pot) progressive increases in V.C and capsaicin contents. On the other hand, from the previous results it could be noticed that, Diatoms could improved fruit peel thickness and firmness, whereas, Si is absorbed by plants as monosilicic acids or its anion forms (Youshida, 1975). Si is accumulated primarily in epidermal tissue both in roots and leaves as polymerized silica-gel and is associated with pectin and calcium ions Waterkeyn et al. (1982).The thickening epidermal silicon-cellulose layer supports mechanical stability of plants and can increase plant resistance against insects, diseases, salt and drought stresses (Epstein, 1999). Also, Diatoms could earlier the harvest date by increasing fruit TSS/ Acid ratio and Vitamin C contents and to decrease fruit acidity. These results were in the same line with finding by (Taranovskaia, 1939) who found that, Si fertilizers showed 30 to 80% accelerated growth, 2-4 week earlier maturation of fruit, and increased fruit yield. On the other hand, Amal et al. (2010) revealed that, the quality of seeds produced from common bean plants inoculated with

Nature and Science 2013;11(6) http://www.sciencepub.net/nature
52
cyanobacteria is greatly enhanced significantly than control treatment. Leaf mineral content.
As for leaf N content (%) results in Table (7) showed that, the differences between different treatments were low to be significant and the lowest value were obtained by control treatment for the two seasons. On the other hand, the results did not show any significant between all treatments for leaf P content (%). Concerning leaf K+ concentration (%) it is clear from Table (7) that, salt stress (control treatment) considerably reduced the leaf K+ concentration in both seasons in comparison with other treatments. The application of biofertilizer plus 750 gm. Magnetite was the best combination (1.06 and 1.05 %) compared to control treatment (0.84 and 0.99) for two seasons, respectively, followed by Diatoms treatments. On the other hand, the differences between the other treatments were slightly signification.
Concerning leaf Fe content (ppm) data showed that, all Magnetite treatments either singly or in combination with bio fertilizer or Diatoms increased leaf Fe (ppm), also the concentration of leaf Fe content increased in the second season as a result of application of Magnetite compared to the first season. However the differences between different treatments were high to be significant in both the experimental seasons (2011 and 2012). Regarding the concentration of leaf Zn content (ppm) it is clear that bio fertilizer treatment had the highest concentration (56.00, 47.00 ppm) compared to control treatment (19.00, 21.40 ppm) in the first and second season, respectively. While the other treatments gave the intermediate values during two seasons. Data also in Table (7) shows all treatments increased leaf Mn content (ppm) and didn’t show any obvious trend between them. As for leaf silicon content (ppm) the results revealed that, leaves of Olinda Valencia orange trees treated by Diatoms treatments either singly or in combination with Magnetite treatments had higher concentration of Si especially trees treated by 10ppm Diatoms which recorded the highest significant values (1250 & 1316 ppm) as compared to control treatment (817.20 & 916 ppm) in the first and second seasons, respectively. Also, it could be noticed that, the second season was higher leaf Si content than the first season, this increase due to application of Diatoms as a source of Si, the obtained results are in general agreed with the finding of Weber and Batchelor (1948) they found that, in citrus leaves the content of Si ranged from 400 – 2000 ppm of the dry weight. As for leaves Na+ content it is clear that, the uptake of Na+ by control treatment was more pronounced (0.280 & 0.274%) as compared to other treatments, however, application of all treatments
significantly reduced uptake of Na+ in leaves, and minimum concentration was observed in trees treated by biofertilizer plus 750 gm. Magnetite (0.162 & 0.158%) in the first and second season, respectively.
This result may be due to that Magnetic assisting to reduce the Na+ toxicity at cell level by detoxification of Na+, either by restricting the entry of Na+ at membrane level or by reduced absorption of Na+ by plant roots (Maheshwari, 2009). Also, Diatoms as a source of silicon inhibited the Na+
transportation to aerial parts of plants by its effect on transpiration movement, Yeo et al. (1999) or by making a complex with Na+, Ahmad et al. (1992). Moreover, Ma et al. (2001) stated that the alleviation of Na+ toxicity in corn plant was due to the formation of Na+ and Si complexes in the solution as compared to any other physiological impact of Si on the plant. Lower Na+ is a good indicator of salt tolerance in plants. Increased K+ concentration also shows the ability of trees to combat the salinity stress that will strongly depend upon Na+ and Si content. The added diatoms increased the K+ concentration than the trees under other treatments. Si uptake is positively correlated with K+ and negatively with Na+ uptake. Possibly, the K+ transport was improved by Si application by its effect on the flux through K+ ion transporters, Ali et al. (2009). In this respect (Wutscher, 1989) reported that, trees treated with Si absorbed more nutrients than the untreated trees.However he concluded that citrus is apparently not a Si accumulating plant and that the results indicated only limited role of this element in citrus nutrition. These results also were in the same line with those obtained by (Mansour, 2007) who reported that there were gradual increments in N,P,K and Fe concentrations in cauliflower leaves with increasing Magnetite levels. Similar results were obtained by Ismail et al. (2010) who found that, the highest concentrations of Fe in the leaves of Thompson Seedless were associated with trees grown in soil treated with Magnetite. On the other hand, (Grobbelaar, 1983) reported that, cyanobacteria can excrete other compounds and change the pH of their surroundings, which in turn can render adsorbed P available. In addition, cyanobacteria can store resources like P in excess of their immediate needs. In addition, (Waseem, et al., 2012) indicated that, Azolla has great ability than rice to accumulate potassium in its tissues in low potassium environment; thus, after decomposition, it makes this nutrient available to rice, also, Azolla fixes nitrogen at substantial rates, optimize fertilizers use, especially nitrogen, and increase tolerance to soil salinity. Soil analysis.
Soil analysis was shown from Tables (8&9) and it is evident from Table (8) that all treatments
Nature and Science 2013;11(6) http://www.sciencepub.net/nature
53
increased soil N availability and Diatoms at 5ppm plus 750 gm. Magnetite was the best combination in the first season (25.20 ppm) while Magnetite at 750 gm. alone was the best treatment (25.20 ppm) in the second season, meanwhile, the lowest values were obtained by control treatment (10.08 and 10.90 ppm) during two seasons, respectively. The changes of available P were slightly fluctuated in the soil in both seasons and no obvious trend could be detected. Concerning K availability it is clear from Table (8)
that, the all treatments increased the soil K content. The use of 750gm. Magnetite plus 5 ppm Diatoms in the first season and plus biofertilizer in the second season gave the highest values (197.50 and 256.20 ppm) as compared to control treatment (119.70 and 207.32 ppm) during two seasons, respectively. Anyhow, the differences between the other treatments were high to be significant and no evident trend was observed through them.
Table (3) Effect of Magnetite, Diatoms and bio fertilizer applications on yield (ton/fed.) of Olinda Valencia orange trees during 2011&2012 seasons.
Treatments
Fruit weight(gm.)
Fruit NO./ tree
Yield kg/tree
Yield ton/fed.
Yield over control (%)
2011 2012 2011 2012 2011 2012 2011 2012 2011 2012 Control 211 bc 192 ab 367 d 700 g 77.4 i 134.4 h 13.55 h 23.52 g ------- ------ Magnetite at 500 gm. 199 de 207 a 500 ab 717 fg 99.5 cd 148.4fg 17.41cd 25.97 ef 28.49 10.42 Magnetite at 750 gm. 195 e 181 c 527 a 917 b 102.8 bc 166 bc 17.98bc 29.05 bc 32.69 23.51 Magnetite at 1000 gm. 209 bc 185 bc 440 c 867 bc 92.0 ef 160.4 cd 16.09ef 28.07 c 18.75 19.35
Diatoms at 5ppm 208 cd 191 bc 450 bc 850 cd 93.6 ef 162.4 cd 16.38 ef 28.41 c 20.89 20.79
Diatoms at 5ppm + 500 gm. Magnetite 208 cd 187 bc 500 ab 767 ef 104.0 bc 143.4gh 18.20 bc 25.10 fg 34.32 6.72
Diatoms at 5ppm + 750 gm. Magnetite 197 de 189 bc 550 a 900 bc 108.4 ab 170.1 b 18.96 ab 29.77 b 39.93 26.57
Diatoms at 5ppm + 1000 gm. Magnetite 200 de 185 bc 417 cd 850 cd 83.4 hi 157.3cd 14.60gh 27.52 cd 7.75 17.01 Bio fertilizer at 300cm3 212 bc 187 bc 423 cd 750 ef 89.7 fg 140.3 h 15.69fg 24.54 fg 15.79 4.34
Bio fertilizer + 500 gm. Magnetite 223 ab 200ab 420 cd 783 e 93.7 ef 156.7de 16.39de 27.58cd 20.96 17.26 Bio fertilizer + 750 gm. Magnetite 220 ab 189 bc 533 a 983 a 117.3 a 185.8 a 20.52 a 32.51 a 51.44 38.22 Bio fertilizer +1000 gm. Magnetite 224 ab 188 bc 450 bc 850 cd 100.8bc 159.8cd 17.64 bc 27.97 cd 30.18 18.92 Diatoms at 3 ppm 231 a 192 ab 413 cd 857 c 95.4 cd 164.5bc 16.70 cd 28.80 bc 23.25 22.45 Diatoms at10 ppm 217ab 191 bc 400 cd 800 de 86.8gh 152.8 ef 15.19 fg 26.74 de 12.10 13.69
Mean separation within columns by Duncan’s multiple range test, 5% level. Values that don’t share the same letter are significantly different
Where Bio fertilizer refer to ixture of: Azolla pinnata and cyanobacteria (Spirulina platensis). Table (4). Effect of Magnetite, Diatoms and bio fertilizer applications on fruit physical characteristics of Olinda Valencia orange trees in the first season.
Season, 2011
Treatments
Fruit diameter
(mm)
Fruit length (mm)
Fruit Size
(cm3)
Peel thickness
(mm)
Peel firmness
Peel lightness
Peel hue angle
Juice volume (mL3)
Juice weight
(%) Control 73.75bc 75.42 bc 252 e 3.72 e 14.61 f 65.76 e 67.67 d 96.7 fg 47.51 cd Magnetite at 500 gm. 73.61bc 73.33cd 260 de 4.49 bc 17.52 cd 66.16 de 67.84 d 86.7 hi 43.33 ef Magnetite at 750 gm. 72.21de 71.80 e 259 de 4.52 bc 16.92 de 66.81 bc 68.63 cd 100.0 ef 43.38 ef Magnetite at 1000 gm. 73.02cd 74.86bc 279 bc 4.52 bc 16.35 e 66.52 cd 68.77 cd 102.7de 40.68 g Diatoms at 5ppm 74.60 bc 72.70de 282 bc 4.66 b 18.85 ab 68.58 ab 70.32 ab 87.3 hi 42.28 fg Diatoms at 5ppm + 500 gm. Magnetite 73.53bc 75.08bc 286 bc 4.71 b 19.10 ab 68.00 ab 70.80 ab 91.3 gh 45.05 de
Diatoms at 5ppm + 750 gm. Magnetite 71.79 ef 72.84de 289 b 5.13 a 19.33 ab 67.40 ab 70.90 ab 80.70 i 48.41 cd
Diatoms at 5ppm + 1000 gm. Magnetite 71.39 f 73.33cd 287 bc 5.31 a 20.16 a 67.28 ab 70.99 ab 80.70 i 48.61 cd Bio fertilizer at 300cm3 74.26bc 76.70ab 255 e 4.65 b 17.23 de 68.96 ab 69.82 bc 101 ef 48.85 cd
Bio fertilizer + 500 gm. Magnetite 75.25 ab 78.30 a 261 de 4.20 cd 17.13de 68.08 ab 69.03 cd 107 cd 48.56 cd Bio fertilizer + 750 gm. Magnetite 75.34ab 76.20ab 264 cd 4.57 bc 16.57 de 67.19 ab 69.05 cd 110 cd 51.19 ab
Bio fertilizer + 1000 gm. Magnetite 75.71 ab 77.94 a 285 bc 3.96 de 16.84 de 68.78 ab 69.59 bc 112 bc 51.11 bc Diatoms at 3 ppm 76.96 a 77.94 a 317 a 5.24 a 17.95 bc 68.22 ab 69.59 bc 123 a 54.99 ab Diatoms at10 ppm
74.79ab
78.22 a
323 a
5.12 a
17.89 bc
69.18 a
71.95 a
120 ab
56.44 a
Mean separation within columns by Duncan’s multiple range test, 5% level. Values that don’t share the same letter are significantly different.
Where Biofertilizer refer to mixture of: Azolla pinnata and cyanobacteria (Spirulina platensis).

Nature and Science 2013;11(6) http://www.sciencepub.net/nature
54
Table (5). Effect of Magnetite, Diatoms and bio fertilizer applications on fruit physical characteristics of Olinda Valencia orange trees in the second season.
Season, 2012
Treatments
Fruit diameter
(mm)
Fruit length (mm)
Fruit Size
(cm3)
Peel thickness
(mm)
Peel firmness
Peel lightness
Peel hue angle
Juice volume (mL3)
Juice weight
(%) Control 70.06 bc 70.08 b 257 b 3.91 b 17.83 c 63.61 f 65.40 g 94.7 b 52.75 cd Magnetite at 500 gm. 69.99 bc 70.92 b 257 bc 4.17 ab 18.45 ab 64.59 de 67.54 bc 104.0 a 56.13 ab Magnetite at 750 gm. 68.19 c 70.80 b 243 d 3.96 ab 20.58 ab 64.36 ef 65.50g 98.7 ab 51.57 de Magnetite at 1000 gm. 69.82 bc 71.10 b 251 bc 4.16 ab 20.06 ab 64.23 ef 66.12 fg 93.3 b 50.66 e Diatoms at 5ppm 70.13 bc 71.13 b 257 bc 4.20 ab 18.65 ab 67.09 ab 68.99 ab 96.7 ab 51.97 de Diatoms at 5ppm + 500 gm. Magnetite 69.70 bc 69.51 b 253 bc 4.49 a 20.90 a 66.00 ab 68.13 ab 95.3 ab 51.42 de Diatoms at 5ppm + 750 gm. Magnetite 69.37 bc 71.05 b 257 bc 4.36 ab 19.06 ab 66.58 ab 68.31 ab 97.3 ab 53.52 bc Diatoms at 5ppm + 1000 gm. Magnetite 69.52 bc 70.85 b 247 cd 4.08 ab 18.41 ab 65.99 ab 68.47 ab 94.0 b 54.14 bc Bio fertilizer at 300cm 70.24 bc 71.87 ab 255 bc 3.92 b 18.14 bc 65.14 bc 66.56 ef 96.0 ab 53.51 bc Bio fertilizer + 500 gm. Magnetite 71.28 ab 71.26 ab 260 ab 4.09 ab 19.22 ab 65.16 bc 66.68 de 104.0 a 53.00 cd Bio fertilizer + 750 gm. Magnetite 70.45 ab 71.57 ab 253 bc 4.14 ab 18.40 ab 64.96 cd 66.94 cd 94.0 b 58.11 a Bio fertilizer + 1000 gm. Magnetite 70.41 ab 71.36 ab 258 b 3.95 ab 18.85 ab 67.14 ab 68.24 ab 97.3 ab 54.61 bc Diatoms at 3 ppm 71.06 ab 72.15 ab 261 ab 4.50 a 19.49 ab 66.70 ab 66.35 fg 96.7 ab 56.59 ab Diatoms at10 ppm
73.14 a
73.99 a
268 a
4.10 ab
19.40 ab
67.25 a
69.35 a
100.0 ab
55.67 ab
Mean separation within columns by Duncan’s multiple range test, 5% level. Values that don’t share the same letter are significantly different
Where Biofertilizer refer to mixture of: Azolla pinnata and cyanobacteria (Spirulina platensis). Table (6) Effect of Magnetite, Diatoms and bio fertilizer applications on fruit chemical characteristics of Olinda Valencia orange trees during two seasons.
Treatments
TS.S. (%)
Acidity (%)
T.S.S/Acid Ratio
V.C (mg./100juice)
2011 2012 2011 2012 2011 2012 2011 2012 Control 9.58 ab 10.50 ab 1.76 a 1.76 a 5.48 i 5.99 i 35.83 f 40.17 e Magnetite at 500 gm. 8.67 ef 9.67 de 1.31 b 1.08 bc 6.93 hi 7.91 h 36.83 ef 40.67 e Magnetite at 750 gm. 8.83 de 10.67ab 1.18 bc 1.14 b 8.10 gh 10.01 fg 37.50 ef 45.33 bc Magnetite at 1000 gm. 9.00 cd 11.00 a 1.07 bc 1.08 bc 9.40 ef 10.83 ef 40.50 bc 45.67 bc Diatoms at 5ppm 7.83 g 10.33ab 0.74 fg 0.84 de 10.78 cd 12.46 bc 42.33 ab 45.50 bc Diatoms at 5ppm + 500 gm. Magnetite 8.67 ef 9.33 e 0.77 ef 0.76 ef 11.99 bc 12.91 b 41.50 b 45.17 bc Diatoms at 5ppm + 750 gm. Magnetite 9.42 ab 10.00 bc 0.67 g 0.71 f 14.26 a 14.36 a 44.50 a 50.50 a Diatoms at 5ppm + 1000 gm. Magnetite 8.58 fg 9.83 cd 0.84 de 0.94 bc 10.80 cd 11.03 de 42.00 b 45.50 bc Bio fertilizer at 300cm3 9.58 ab 10.50 ab 1.07 bc 1.10 b 9.01 fg 9.56 g 40.17 bc 43.33 cd Bio fertilizer + 500 gm. Magnetite 9.67 ab 10.33 ab 0.85 de 0.87cd 11.37 cd 12.02 bc 38.17 de 42.17 de Bio fertilizer + 750 gm. Magnetite 10.0 ab 10.07 bc 0.96 cd 0.98bc 11.45 cd 10.88 ef 41.17 b 45.33 bc Bio fertilizer + 1000 gm. Magnetite 9.50 ab 10.67 ab 0.99 cd 1.02 bc 10.14 de 10.54 ef 38.67 cd 44.17 cd Diatoms at 3 ppm 9.25 bc 10.00 bc 0.89 de 0.87 cd 10.41 cd 11.49 cd 41.50 b 44.50 bc Diatoms at10 ppm
10.17 a
10.83 a
0.84 de
0.80 de
13.15 ab
14.36 a
41.67 b
47.67 ab
Mean separation within columns by Duncan’s multiple range test, 5% level. Values that don’t share the same letter are significantly different.
Where Biofertilizer refer to mixture of: Azolla pinnata and cyanobacteria (Spirulina platensis).
As for soil Fe availability it could be noticed that, most of Magnetite treatments either singly or in combination with either Diatoms or biofertilizer increased the soil Fe availability content, while, the lowest results were obtained by control treatment in the first season, biofertilizer and control treatments in the second season. Also, it is noticed that, Soil Fe availability content in the second season scored higher values than the first season as a result of application of Magnetite. Regarding Zn and Mn availability in the soil data in Table (8) indicated that, trees treated by combination with 750 gm. Magnetite plus bio fertilizer recorded the highest averages followed by 750 gm. Magnetite plus Diatoms while the other treatments gave the intermediate values,
data also revealed that, the differences between the other treatments were high to be significant during two seasons.
Concerning soil electric conductivity (EC) data in Table (9) showed a slight reduction of soil EC in the first and second seasons.The least values resulted from the use of 1000 gm. Magnetite (3.19 and 3.18) where the highest values were recorded from control treatment (3.62 and 3.60) during two seasons, respectively. As for soil pH it is noticed that, all treatments slight reduction of soil pH and no obvious trend was observed during two seasons. Also, the Magnetite, Diatoms and biofertilizer applications increased K+ and reduced Na+, Cl- in the root rhizosphere as compared with control treatment (salt

Nature and Science 2013;11(6) http://www.sciencepub.net/nature
55
stress) and the use of biofertilizer plus 750gm. Magnetite was the best combination. The obtained results are in general agreed with the finding of (Maheshwari, 2009) who reported that, Magnetic application assisting to reduce the Na+ toxicity at cell level by detoxification of Na+, either by restricting the entry of Na+ at membrane level or by reduced absorption of Na+ by plant roots.
Also, these results are supported by Liang et al. (2005) who reported that, the Silicon amended stimulation of H+-ATPase activity on root plasma membrane and H+-PPase activity in tonoplast of barley roots under salt stress enhanced the compartmentation of Na+ into the vacuole through Na+/H+ antiport movement. The stimulated H+-ATPase enhanced the uptake and upward transport of K+ and retarded the movement of Na+ thus, improved the K+: Na selectivity ratio in the shoots of salt-stressed barley. As Na+/H+ antiport is operated with input of energy, thus, both the H+-ATPase and H+-PPase are the chief sources of H+ electrochemical potential gradient, which acts as an Electromotive
Force (EMF) for such energy dependent antiports (Blumwald, 2000). In this respect, Si soil amendments influence plant growth by soil treatment with biogeochemical active Si substances optimizes soil fertility through improved water, physical and chemical soil properties while maintaining nutrients in plant available form, Matichenkov et al. (1995). In addition, the extracellular polysaccharide production by offers some temporary relief by chelating exchangeable cations in soil and thereby decreases the soil EC, Most of Na+ removed by CB remains extracellulary trapped in their mucopolusaccharide sheaths, Apte and Thomas,(1997).
Moreover, Azolla cultivation in saline environment for a period of two consecutive years decreased salt content from 0.35-0.15 and desalinate rate (71.4%) was 1.8 times faster than through water leaching and 2.1 times faster than Sesbania and also reduced the electrical conductivity, pH of acidic soil and increased calcium content of soil, Anjuli et al. (2004).
Table (7). Effect of Magnetite, Diatoms and bio fertilizer applications on Leaf mineral content of Olinda Valencia orange trees in the first and second seasons.
Treatments
(%) ………………………………………………………………………………………………………………………….
Ppm …………………………………………………………………………………………………………………………………………………
N P K Na
Fe Zn Mn Si Season, 2011 Control 2.21 c 0.10 a 0.84 d 0.280 a 72.0 i 19.00g 26.40i 871.20g Fe at 500 gm. 2.39 ab 0.12 a 1.03 ab 0.213bc 80 gh 32.80f 38.80b 893.0ef Fe at 750 gm. 2.41 ab 0.13 a 1.01 ab 0.184de 83.0 f 48.20b 40.53a 897.00e Fe at 1000 gm. 2.40 ab 0.12 a 1.03 ab 0.235ab 100 b 49.20b 38.2bc 900.60e Diatoms at 5ppm 2.40 ab 0.12 a 1.05 a 0.230ab 79.0 h 38.94d 36.8cd 1081.0b Diatoms at5ppm + 500 gm. Magnetite 2.42 ab 0.12 a 1.03 ab 0.193de 83.0 f 35.40e 38.4bc 1083.0b Diatoms at5ppm + 750 gm. Magnetite 2.44 a 0.14 a 1.04 a 0.176ef 98.0 b 34.6ef 36.2de 1087.8b Diatoms at5ppm + 1000 gm. Magnetite 2.43 ab 0.12 a 1.03 ab 0.260ab 105 a 34.0ef 28.50h 1090.0b Bio fertilizer at 300cm3 2.44 a 0.12 a 0.93 c 0.252ab 87.0e 56.00a 33.8fg 876.9fg Bio fertilizer + 500 gm. Magnetite 2.41 ab 0.12 a 0.93 c 0.234ab 90.0d 32.80f 38.80b 883.5ef Bio fertilizer + 750 gm. Magnetite 2.44 a 0.14 a 1.06 a 0.162f 94.0 c 48.20b 34.40f 874.95g Bio fertilizer + 1000 gm. Magnetite 2.39 ab 0.13 a 0.98 bc 0.204cd 103 a 49.00b 32.20g 919.00d Diatoms at 3 ppm 2.39 ab 0.12 a 1.02 ab 0.221bc 82 fg 35.40e 27.1hi 1014.6c Diatoms at10 ppm 2.38 b 0.12 a 1.02 ab 0.261ab 89 de 44.60c 34.8ef 1250.0a
Control Season, 2012 2.28 e 0.11 a 0.99 b 0.274a 69.0 i 21.40g 26.70h 916.00h
Fe at 500 gm. 2.29 e 0.12 a 1.02 ab 0.203bc 87.0 f 23.60f 46.20a 940.0fg Fe at 750 gm. 2.40 bc 0.13 a 1.02 ab 0.173de 90.0 e 40.01b 40.40c 945.0fg Fe at 1000 gm. 2.41 ab 0.14 a 1.01 ab 0.221ab 103 c 41.66b 32.20e 948.0ef Diatoms at 5ppm 2.39 cd 0.16 a 1.03 ab 0.234ab 75.0 h 40.89b 30.20f 1138.0b Diatoms at5ppm + 500 gm. Magnetite 2.44 ab 0.14 a 1.04 ab 0.184cd 90.0 e 37.17c 35.40d 1140.0b Diatoms at5ppm + 750 gm. Magnetite 2.46 a 0.16 a 1.01 ab 0.163ef 102 c 36.3cd 33.40e 1145.0b Diatoms at5ppm + 1000 gm. Magnetite 2.39 cd 0.13 a 1.01 ab 0.253ab 109 b 35.0de 27.6gh 1148.0b Bio fertilizer at 300cm3 2.41 ab 0.12 a 1.03 ab 0.242ab 85.0 f 47.00a 35.80d 923.0gh Bio fertilizer + 500 gm. Magnetite 2.43 ab 0.13 a 1.02 ab 0.223ab 96.0 d 33.6ef 44.20b 930.0fg Bio fertilizer + 750 gm. Magnetite 2.45 ab 0.15 a 1.05 a 0.158f 111 b 41.51b 35.40d 921.00d Bio fertilizer + 1000 gm. Magnetite 2.38 d 0.14 a 1.02 ab 0.202bc 119 a 41.20b 29.0fg 1000.0e Diatoms at 3 ppm 2.40bc 0.14 a 1.01 ab 0.214bc 79.0 g 37.17c 28.3fg 1068.0c Diatoms at10 ppm 2.39cd 0.13 a 1.03 ab 0.252ab 85.0 f 46.83a 36.20d 1316.0a
Mean separation within columns by Duncan’s multiple range test, 5% level. Values that don’t share the same letter are significantly different.
Where Biofertilizer refer to mixture of: Azolla pinnata and cyanobacteria (Spirulina platensis).

Nature and Science 2013;11(6) http://www.sciencepub.net/nature
56
Table (8). Effect of Magnetite, Diatoms and bio fertilizer applications on available of macro and micro elements at the end of the first and second seasons.
Treatments Available (ppm)
N P K Fe Zn Mn Season, 2011 Control 10.08 f 22.0 d 119.70 h 3.76 f 1.04 h 1.19 i Fe at 500 gm. 18.90 c 26.0 b 148.00 g 5.41 de 1.28 f 1.79 d Fe at 750 gm. 18.90 c 28.0 a 179.7 cd 7.77 ab 1.88 bc 1.96 c Fe at 1000 gm. 12.60 e 28.0 a 151.15 f 7.58 ab 1.85 cd 1.45 g Diatoms at 5ppm 19.65 b 22.0 d 158.50 e 5.83 de 1.84 cd 1.96 c Diatoms at5ppm + 500 gm. Magnetite 18.90 c 24.0 c 178.00 d 5.48 de 1.20 g 1.61 f Diatoms at5ppm + 750 gm. Magnetite 25.20 a 28.0 a 197.50 a 7.48 ab 1.93 b 2.06 b Diatoms at5ppm + 1000 gm. Magnetite 18.90 c 26.0 b 181.15 c 7.90 a 1.23 fg 1.77 de Bio fertilizer at 300cm3 18.90 c 24.0 c 120.43 h 5.72 de 1.78 de 1.30 h Bio fertilizer + 500 gm. Magnetite 12.60 e 26.0 b 151.15 f 6.91 bc 1.72 e 1.98 c Bio fertilizer + 750 gm. Magnetite 18.90 c 28.0 a 188.00 b 8.32 a 2.10 a 2.40 a Bio fertilizer + 1000 gm. Magnetite 16.75 d 22.0 d 161.15 e 7.60 ab 1.26 fg 1.99 bc Diatoms at 3 ppm 18.90 c 22.0 d 178.00 d 5.28 e 1.24 fg 1.84 d
Diatoms at10 ppm
18.90 c
28.0 a
177.50 d
6.16 cd
1.29 f
1.71 e
Control Season, 2012
10.90 e 22.0 d 207.32 j 5.78 g 1.64 bc 1.58 f Fe at 500 gm. 18.90 c 28.0 a 220.25 g 7.20 e 1.36 fg 2.24 cd Fe at 750 gm. 25.20 a 26.0 b 240.76 c 8.92 b 1.64 bc 2.62 b Fe at 1000 gm. 12.60 d 22.0 d 230.25 e 10.36 a 1.40 ef 2.56 b Diatoms at 5ppm 22.05 b 22.0 d 217.32 h 8.04 cd 1.24 fg 1.99 e Diatoms at5ppm + 500 gm. Magnetite 22.05 b 24.0 c 238.43 c 8.48 bc 1.26 fg 2.10 de Diatoms at5ppm + 750 gm. Magnetite 18.90 c 26.0 b 246.65 b 9.92 a 1.82 b 2.70 ab Diatoms at5ppm + 1000 gm. Magnetite 18.57 c 24.0 c 210.25 i 9.92 a 1.22 g 2.30 c Bio fertilizer at 300cm3 18.57 c 22.0 d 212.50 i 5.56 g 1.22 g 2.60 b Bio fertilizer + 500 gm. Magnetite 22.05 b 24.0 c 233.87 d 6.52 f 1.42 de 2.32 c Bio fertilizer + 750 gm. Magnetite 22.05 b 26.0 b 256.20 a 9.76 a 2.08 a 2.82 a Bio fertilizer + 1000 gm. Magnetite 18.90 c 24.0 c 233.0 de 8.80 b 1.68 bc 2.24 cd Diatoms at 3 ppm 12.60 d 20.0 e 226.20 f 8.32 bc 1.58 cd 2.30 c
Diatoms at10 ppm
12.60 d
22.0 d
212.00 i
7.84 d
1.60 cd
2.00 e
Mean separation within columns by Duncan’s multiple range test, 5% level. Values that don’t share the same letter are significantly different.
Where Biofertilizer refer to mixture of: Azolla pinnata and cyanobacteria (Spirulina platensis). Biological activity of the soil.
Changes in root rhizosphere could give an approximate vision to the ability of different applications to enhance crop production, especially under salt conditions. However, all treatments affected significantly biological activity of the soil, Table (10) in terms of increasing the total bacterial counts, total cyanobacterial counts and CO2 evolution compared to control treatment in the two seasons. The maximum microbial activity was achieved by the combined effect of biofertilizer with 750 gm. Magnetite application followed by Diatoms at5ppm with 750 gm. Magnetite. While, the changes of biological activity in root rhizosphere were greatly fluctuated among the other treatments, with no obvious trend could be observed during two seasons (2011&2012).Also, it could be noticed that, the high doses of Magnetite (1000gm.) applications either singly or in combination with Diatoms or biofertilizer decreased the growth and yield and therefore decreased microbial activity. This results are in
harmony with those obtained by Josep et al. (2004) who reported that, root growth inhibition by the high forces of magnetic field on (Lens culinaris), (Glycine soja) and (Triticum aestivum) and therefore a significant effect on the microbial activity. Moreover, the application of both Azolla and cyanobacteria enhanced the soil microbial activity. The obtained results are in line with those found by Waseem et al. (2012) they observed that. The biological health of the soil due to application of Azolla has resulted in improving mineralization and consequent increase microbial status of the soil. Also, cyanobacteria promoted establishment of microbial population, increased organic matter and nutrient content and also soil stability Acea et al. (2003). The enhancement influence of blue green algal (BGA) on the biological activity and chemical properties of the soil positively affected plant characteristics which led to improve in yield and fruit quality of Olinda Valencia orange trees.

Nature and Science 2013;11(6) http://www.sciencepub.net/nature
57
Table (9). Effect of Magnetite, Diatoms and bio fertilizer applications on soil chemical analysis at the end of the first and second seasons.
Treatments
pH EC Cations meq / L ………………………………………………………………….
Anions meq / L ……………………………………………………………………
1: 2.5 ds/m Ca++ Mg++ Na+ K+ Co3= Hco3
- Cl- So4= Season, 2011
Control 8.81 3.62 10.61 15.01 9.95 0.63 - 7.27 23.07 5.86 Fe at 500 gm. 8.79 3.33 11.24 13.23 7.85 0.98 - 3.86 20.95 8.49 Fe at 750 gm. 8.80 3.36 21.37 3.31 7.31 1.61 - 5.63 17.58 10.39 Fe at 1000 gm. 8.82 3.19 14.93 7.76 7.69 1.52 - 4.36 21.25 6.29 Diatoms at 5ppm 8.79 3.48 7.58 19.31 6.34 1.57 - 5.15 19.49 10.16 Diatoms at5ppm + 500 gm. Magnetite 8.78 3.41 18.18 7.89 6.69 1.34 - 6.21 20.20 7.69 Diatoms at5ppm + 750 gm. Magnetite 8.79 3.46 9.64 16.89 6.30 1.77 - 6.34 16.68 11.58 Diatoms at5ppm + 1000 gm. Magnetite 8.80 3.63 10.29 17.64 6.91 1.46 - 4.56 20.47 11.27 Bio fertilizer at 300cm3 8.82 3.40 21.23 3.32 7.78 1.67 - 7.44 20.11 6.45 Bio fertilizer + 500 gm. Magnetite 8.81 3.60 17.10 10.11 7.26 1.53 - 7.47 19.26 9.27 Bio fertilizer + 750 gm. Magnetite 8.80 3.30 11.20 14.16 5.66 1.98 - 4.47 15.80 12.73 Bio fertilizer + 1000 gm. Magnetite 8.78 3.26 10.97 12.87 7.64 1.12 - 3.48 18.81 10.31 Diatoms at 3 ppm 8.80 3.56 14.50 12.79 7.28 1.03 - 5.73 18.86 11.01
Diatoms at10 ppm
8.79
3.41
9.13
16.26
7.21
1.50
-
6.97
20.32
6.81
Control Season, 2012
8.83 3.60 9.37 16.11 9.77 0.75 - 5.27 26.87 3.86 Fe at 500 gm. 8.82 3.45 11.66 13.78 7.50 1.56 - 4.86 20.00 9.64 Fe at 750 gm. 8.80 3.40 10.90 14.37 7.07 1.66 - 5.60 18.39 10.01 Fe at 1000 gm. 8.76 3.18 12.56 10.23 7.51 1.50 - 4.62 22.00 5.18 Diatoms at 5ppm 8.80 3.45 7.55 18.31 7.07 1.57 - 5.05 12.45 17.0 Diatoms at5ppm + 500 gm. Magnetite 8.79 3.50 18.48 7.59 7.19 1.74 - 6.96 15.14 12.90 Diatoms at5ppm + 750 gm. Magnetite 8.81 3.52 10.29 16.75 6.39 1.77 - 6.40 17.50 11.30 Diatoms at5ppm + 1000 gm. Magnetite 8.84 3.25 10.90 13.04 7.10 1.46 - 3.06 18.87 10.57 Bio fertilizer at 300cm3 8.80 3.34 11.43 12.52 7.75 1.70 - 7.24 20.91 5.25 Bio fertilizer + 500 gm. Magnetite 8.84 3.48 18.60 7.15 7.52 1.53 - 8.17 16.29 10.34 Bio fertilizer + 750 gm. Magnetite 8.83 3.46 12.00 15.76 5.26 1.58 - 8.77 15.20 10.63 Bio fertilizer + 1000 gm. Magnetite 8.82 3.52 15.67 10.57 7.34 1.62 - 4.38 11.71 19.11 Diatoms at 3 ppm 8.81 3.56 11.70 14.59 7.78 1.53 - 6.93 18.56 10.11
Diatoms at10 ppm
8.83
3.47
12.40
13.47
7.33
1.50
-
8.54
19.13
7.03
Mean separation within columns by Duncan’s multiple range test, 5% level. Values that don’t share the same letter are significantly different.
Where Biofertilizer refer to mixture of: Azolla pinnata and cyanobacteria (Spirulina platensis). Table (10). Effect of Magnetite, Diatoms and bio fertilizer applications on soil biological activity at the end of the first and second seasons (2011&2012).
Treatments
Total count Bacteria cfu (106 g soil-1)
Total count Cyano. cfu (103 g soil-1)
CO2 evolution (mg /100g soil-1day-1)
2011 2012 2011 2012 2011 2012
Control 3.73 j 13.0 L 8.33 j 7.00 j 13.00 i 17.0 i Fe at 500 gm. 11.0 h 22.7 k 8.33 j 7.70 j 21.3 g 37 cd Fe at 750 gm. 39.0 c 115 h 25.0 c 15.7 g 35.0 c 36.7 e Fe at 1000 gm. 16.0 f 111 h 12.0 h 11.7 h 25.0 f 38.3bc Diatoms at 5ppm 7.33 i 52.0 i 7.67 j 9.70 i 18.0 h 38.0 bc Diatoms at5ppm + 500 gm. Magnetite 23.0 d 203 d 14.7 g 36.5 c 33.0 d 37.0 de Diatoms at5ppm + 750 gm. Magnetite 49.7 b 260 b 31.0 b 38.7 b 36.7 b 39.0 b Diatoms at5ppm + 1000 gm. Magnetite 14.0 g 34.0 j 10.7 i 13.0 h 26.0 f 37.0 de Bio fertilizer at 300cm3 19.0 e 185ef 21.7 d 25.7 d 34.0 cd 33.7 f Bio fertilizer + 500 gm. Magnetite 23.0 d 225 c 20.0 e 23.7 e 18.0 h 26.3 h Bio fertilizer + 750 gm. Magnetite 54.0 a 285 a 59.0 a 62.7 a 38.0a 41.8 a Bio fertilizer + 1000 gm. Magnetite 20.0 e 188 e 19.7 e 20.0 f 21.0 g 25.7 h Diatoms at 3 ppm 20.0 e 181 f 20.0 e 23.0 e 30.3 e 32.7 f Diatoms at 10 ppm
13.7 g
137 g
18.0 f
20.0 f
26.0 f
30.7 g
Mean separation within columns by Duncan’s multiple range test, 5% level. Values that don’t share the same letter are significantly different.
Where Biofertilizer refer to mixture of: Azolla pinnata and cyanobacteria (Spirulina platensis).

Nature and Science 2013;11(6) http://www.sciencepub.net/nature
58
Table (11). Economic study for using Magnetite, Diatoms and bio fertilizer applications on yield of Olinda Valencia orange trees.
Treatments
Total Q.of eachTrea./ fed.
Unit Price (L.E)
Cost of each Trea./fed. (L.E)
NO. Labor/ year
Labor & S.M. fees (L.E)
Labor & S.M. Cost (L.E)
Total cost trea./fed. (L.E)
Average yield for Two seas. Ton/fed.
yield over control Ton/fed.
yield over control Price (L.E)
Net Profit/ Fed. (L.E)
control ……….. ………. ……… ……… ……… ……. ……. 18.54 …… …….. …….. Magnetite at 500 gm. 87.5 kg 5 437.5 2 50 100 537.5 21.69 3.15 3150 2612.5 Magnetite at 750 gm. 131.25kg 5 656.25 2 50 100 756.25 23.52 4.98 4098 3341.75 Magnetite at 1000 gm. 175 kg 5 875 2 50 100 975 22.08 3.54 3054 2079 Diatoms at 5ppm 3 kg
100 x 2time 600
(2+S.M.) x 2time 50,50 300 900 22.40 3.86 3086 2186
Diatoms at 5ppm + 500 gm. Magnetite
3 kg 100 x 2time
1037.5
(2+S.M.) x 2time 50,50
400 1437.5 21.65 3.11 3011 1573.5 87.5 kg 5 2 50
Diatoms at 5ppm + 750 gm. Magnetite
3 kg 100 x 2time
1256.25
(2+S.M.) x 2time 50,50
400 1656.25 24.37 5.83 5083 3426.75 131.25kg 5 2 50
Diatoms at 5ppm + 1000 gm. Magnetite
3 kg 100 x 2time
1475
(2+S.M.) x 2time 50,50
400 1875 21.06 2.52 2052 177 175 kg 5 2 50 Bio fertilizer at 300cm3 50 Liter 15 x 2time 1500
(2+S.M.) x 2time 50,50 300 1800 20.12 1.58 1058 -742
Bio fertilizer + 500 gm. Magnetite
50 Liter 15x 2time 1937.5
(2+S.M.) x 2time 50,50
400 2337.5 21.99 3.45 3045 707.5 87.5 kg 5 2 50
Bio fertilizer + 750 gm. Magnetite
50 Liter 15x 2time 2156.25
(2+S.M.) x 2time 50,50
400 2556.25 26.52 7.98 7098 4541.75 131.25kg 5 2 50
Bio fertilizer + 1000 gm. Magnetite
50 Liter 15x 2time 2375
(2+S.M.) x 2time 50,50
400 2775 22.81 4.27 4027 1252 175 kg 5 2 50 Diatoms at 3 ppm 1800 gm..
100 x2time 360
(2+S.M.) x 2time 50,50 300 660 22.75 4.21 4021 3361
Diatoms at10 ppm 6 kg 100x2time 1200
(2+S.M.) x 2time 50,50 300 1500 20.97 2.43 2043 543
Where: (S.M.) refers to Spraying Motor., two times refer to (full bloom stage and two weeks after full bloom)
Economic study.
In economic study of yield production the main economic criteria were cost of each substance (Magnetite, Diatoms and biofertilizer) that used under study(L.E / fed.), cost of labor and spraying motor (L.E / fed.), averages yield (ton / fed) for two seasons (2011 & 2012), price of yield over control (L.E) and net profit (L.E / fed.) for each treatment. Results are given in Table (11). Other expenses such as the costs of supervision and royalties were not taken into consideration in this study.
In more details unite price of Magnetite was (5 L.E / k.gm.), Diatoms was (100 L.E / k.gm.) and unite price of biofertilizer was (15 L.E / Liter) taking into account of both Diatoms and biofertilizer were sprayed at two times under study. The study also revealed that the cost of labor that were used per treatment as well as the spraying motor and thus the total costs were calculated. Also averages yield (ton / fed.) for the first and second seasons and yield over control were calculated and finally the net profit (L.E / fed.) for yield over control was determine.
From this economic study it could be noticed that, application of bio fertilizer plus 750 gm. Magnetite was the best combination for giving the highest net profit / fed. (4541.75 L.E) followed in descending order by using of Diatoms at 5 ppm plus 750 gm. Magnetite (3426.75 L.E), Diatoms at 3 ppm, (3361 L.E),750 gm. Magnetite (3341.75 L.E), 500 gm. Magnetite (2168 L.E), 1000gm. Magnetite (2079 L.E) and so on as shown in Table (11),while the lowest net profit was obtained by using combination of Diatoms at 5ppm plus 1000gm. Magnetite (177 L.E). On the other hand using of biofertilizer treatment only achieved loss of money (-742 L.E) although the increasing of yield. References
1. A.O.A.C (1995). Official Methods of Analysis (A.O.A.C) Pub. By official A.O.A.C chapter 4,
p.18-37, p.10, 44 p. 8-9. 2. Acea, M.J.; Prieto.F, A.; and Diz,C. N. (2003).
“Cyanobacterial inoculation of heated soils: effect on microorganisms of C and N cycles and

Nature and Science 2013;11(6) http://www.sciencepub.net/nature
59
on chemical composition in soil surface” Soil Biol. Biochem., 35, pp.513-524.
3. Adam, M.S. (1999). The promotive effect of the cyanobacterium Nostoc muscorum on the growth of some crop plants. Acta Microbiologica Polonica. 48(2): 163-171.
4. Ahmad, R.; Zaheer, S.H. and Ismail,S. (1992). Role of Si in salt tolerance of wheat (Triticum aestivum L.). Plant Science 85: 43-50.
5. Ali, A.; Basra, S.M.A.; Ahmad,R.
and Wahid, A. (2009). Optimizing silicon application to improve salinity tolerance in wheat Soil & Environ. 28(2): 136-144,
6. Allen, M. M. and R. Y. Stanier (1968). Selective isolation of blue- green algae from water and soil. J. Gen. Microbiol., 51: 203 – 209.
7. Amal, Z. Hegazi.; Soha S. M. Mostafa and Hamdino, M. I. Ahmed (2010). Influence of Different Cyanobacterial Application Methods on Growth and Seed Production of Common Bean under Various Levels of Mineral Nitrogen Fertilization. Nature and Science. 8(11),183-194. (ISSN: 1545-0740).
8. Anjuli, R. P.; Prasanna, P.K.; and Singh. (2004). Biological significance of and its utilization in agriculture, Proc. Indian Natl. Sci. Acad., 70 299-333.
9. Anser, A.; Shahzad, M.A. B.; Safdar, H.; Javaid, I.; Ahmad, M. A. H. A. B.; and Muhammad, S. (2012). Salt Stress Alleviation in Field Crops Through Nutritional Supplementation of Silicon. Pakistan Journal of Nutrition 11 (8): 637-655.
10. APHA, American Public Health Association (1992). Standard Methods Examination of Wastewater, 17th ed. American Public Health Association, Washington D.C., p. 116.
11. Apte, S.K. and Thomas, J. (1997). Possible amelioration of coastal soil salinity using halotolerant nitrogen- fixing cyanobacteria, Plant Soil, 189, 205-211.
12. Arab, R.; Dastan, S.; Mobasser, HR.; and Ghanbari-Malidarreh, A. (2011). Effect of silicon and cycocel application on yield components and quantity yield of rice (Oryza Sativa L.) in Iran. Proc. of the 5th International Conference on silicon in Agriculture, 13-18, Beijing, China.
13. Aziz, M.A., and Hashem, M.A (2004). Role of cyanobacteria on yield of rice in saline soil. Bakistan Journal of Biological Sciences, 7 (3): 309-311.
14. Black, C.A. (1982). Methods of soil analysis. Amer. Soc. Agron. Madison, Wisconsin, U.S.A. soil. CO2 evolution, microbiological and
chemical transformation. Plant and Soil, 34:17-28.
15. Blumwald, E. (2000). Sodium transport and salt tolerancein plants. Curr. Opin. Cell Biol., 12: 431-434.
16. Bokhtiar, SM. (2011). Effect of silicon on yield contributing parameters and its accumulation in abaxial epidermis of sugarcane leaf blade using energy dispersive x – ray analysis. Proc.of the 5th International Conference on silicon in Agriculture, 13-18, Beijing, China.
17. Brown, J.D. and Lilliland, O. (1966). Rapid determination of potassium and sodium in plan material and soil extracts by Flame-photometry. J. Amer. Soc. Hort. Sci., 48: 341-346.
18. Carter, M.R. (1993). Soil sampling and methods of analysis, Canada Soc., Soil Sci. Lewis, London, Tokyo.
19. Chou, G.J. (1966). A new method of measuring the leaf area of citrus trees. Acta. Hort. Sci, 1966 5:17-20 (Hort. Abst. 36:7315).
20. Clarke, G.M. and Kempson, R.E. (1997). Introduction to the design and analysis of experiments. Arnold, a member of the Holder Headline Group,1st Edt., London, UK.
21. De Souza, A., (2005). Increase of vegetable productivity cultivated under organic conditions and small extensions by pre-sowing magnetic treatment of seeds. Agricultural Research Institute «Jorge Dimitrov», Bayamo, Cuba.
22. Duncan, D.B. (1955). Multiple range and multiple F-Test Biometrics, 11:1-42.
23. Epstein, E. (1994). The anomaly of silicon in plant biology. Proc. Natl. Acad. Sci. USA Vol. 91, pp. 11-17.
24. Epstein, E., (1999). Silicon. Annu. Rev. Plant Physiol. Plant Mol. Biol. 50, 641e 664.
25. Food and Agriculture Organization of the United Nation. (2003). Salt affected soils, contract No. PR 26897. ISCW Project Gw 561003120.
26. Food and Agriculture Organization of the United Nation. (2005). Land and Plant Nutrition Management Service Land and Water Development Division.
27. Food and Agriculture Organization of the United Nation. (2008). Land and plant nutrition management service. http://WWW.Fao.Org/ag/agl/agll/spush.
28. Gaur, A.C.; Sadasivan K.V.; Vimal O.P.; Mathur R.S. (1971). A study of decomposition of organic matter in an alluvial.
29. Grobbelaar, JU (1983). Availability to algae of N and P adsorbed on suspended solids in turbid waters of the Amazon River. Arch. Hydrobiol., 96: 302-316.

Nature and Science 2013;11(6) http://www.sciencepub.net/nature
60
30. Horwitz, W. (1972). Official Methods of Analysis Association of Official Analytical Chemists 11 thed. Washington, D.C.
31. Ismail, A.E.; Soliman, S.S.; Abd El- Moniem, E. M.; Awaad, M.S.; and Rashad, A.A. (2010). Effect of magnetic iron ore, metal compound fertilizer and bio-NK in controlling Root- Knot Nematode in a newly reclaimed area of Egypt. Pak. J. Nematol., 28(2): 307-328.
32. Jones, W.W. and Embleton, T.W. (1960). Leaf analysis nitrogen content program for orange- Calif. Citrogen 15 (10:321).
33. Josep, P.; Joan, L.; Benjamin, M.; and Josep,P. (2004). Diamagnetic susceptibility and root growth responces to magnetic field in Lens culinaris, Glycine soja and Triticum aestivum. Electromagnetic biology and medicine. Vol.23, No.2, pp.97-112.
34. Kumarasinghe, K.S. and Eskew, D.L. (1993). Isotopic studies of azolla and nitrogen fertilizer on rice Kluwer Acad. Publisher. Drodrecht.145P.
35. Liang, Y.C., (1999). Effects of silicon on enzyme activity, and sodium, potassium and calcium concentration in barley under salt stress. Plant Soil 209, 217e224.
36. Liang, Y.C.; Zhang, W.Q.; Chen, J. and Ding, R. (2005). Effect of silicon on H+-ATPase and H+-PPase ctivity, fatty acid composition and fluidity of tonoplast vesicles from roots of salt-stressed barley (Hordeum vulgare L.). J. Environ. Exp. Bot., 53: 29-37.
37. Ma, J.F.; Miyake, Y., and Takahashi, E. (2001). Silicon as a beneficial element for crop plants. p. 17-34. In: Silicon in Agriculture. L.E. Datnoff and G.H. Snyder (eds.). Elsevier, New York, USA.
38. Maheshwari, L.B., (2009). Magnetic treatment of irrigation water: evaluation of its effects on vegetable crop yield and water productivity. Ph.D. Thesis. University of Western Sydney, School of Environ. And Agriculture.
39. Mansour, E.R., (2007). Effect of some culture practices on cauliflower tolerance to salinity under Ras Suder conditions. Msr Thesis. Fac. of Agric., Horticulture Dept. Ain Shams Univ.
40. Matichenkov, V.V.; Pinsky, D. L.; and Bocharnikova, E.A. (1995). Influence of mechanical compaction of soils on the state and form of available silicon. Eurasian Soil Sci. 27 (12):58-67.
41. Matsuda, T., Asou, H., Kobayashi, M., Yonekura, M. (1993). Influences of magnetic fields on growth and fruit production of strawberry. Acta Horticulturae 348, 378–380.
42. Mesut, Ç.K., T. Önder, T. Metin and T. Burcu, (2010). Phosphorus and humic acid application
alleviate salinity stress of pepper seedling. African Journal of Biotechnology, 9(36): 5845-5851.
43. Moon, J., Chung, H. (2000). Acceleration of germination of tomato seeds by applying AC electric and magnetic fields. Journal of Electrostatics 48, 103–114.
44. Morse, J.G. and Robertson, C.A., (1987). Calculating canopy area of citrus trees and surface area of fruits. Florida Entomol. 70-168, (J. Amer. Soc. Hort Sci., 115 (1): 6:8, 1990.
45. Nanjappan-Karthikeyan; Radha-Prasanna; Lata-Nain; Kaushik, B.D. (2007). Evaluating the potential of plant growth promoting cyanobacteria as inoculants for wheat. European-Journal-of-Soil-Biology. 43(1): 23-30.
46. Podleśny, J., Pietruszewski, S., Podleśna, A. (2005). Influence of magnetic stimulation of seeds on the formation of morphological features and yielding of the pea. International Agrophysics 19, 61–68.
47. Prabina, B.J.; Kumar, K.; Kannaiyan, S. (2004). Growth pattern and chlorophyll content of the cyanobacterial strains for their utilization in the quality control of cyanobacterial biofertilizers. Biofertilizers-technology. 446-450.
48. Pregl, F. (1945). Quantitative organic micro-analysis, 4th ed J.A. Churchill, Ltd, London.
49. Romero-Aranda, R.; Oliva, J. and Jesu`s, C. (2006). Silicon alleviates the deleterious salt effect on tomato plant growth by improving plant water status. Journal of Plant Physiology 163 847—855.
50. Sikander, A.; Naima, H.; Ghulam, R.; and Kauser, A.M. (1995). Use of biofertilizers to enhance rice yield, nitrogen uptake and fertilizer-N use efficiency in saline soils. Pak. J., 27 (2): 275-281.
51. Taha, B. A; Soha, E. Khalil and Ashraf, M.Khalil. (2011). Magnetic treatments of capsicum Annuum L. grown under saline irrigation conditions. Journal of Applied Sciences Research, 7(11): 1558- 1568.
52. Taranovskaia, V.G. (1939). The silicication of subtropics greenhouse and plantations. Soviet subtropics 7:32-37.
53. Troug, E. and Meyer, A.H. (1939). Improvement in deiness colorimetric method for phosphorous and arsenic. Ind. Eng. Chem. Anal., Ed. I: 136-159.
54. Tuna, A.L.; Kaya, C.; Higgs, D.; Murillo-Amador, B.; Aydemir, S. and Girgin, A.R. (2008). Silicon improves salinity tolerance in wheat plants. Environ. Exp. Bot., 62:10-16.

Nature and Science 2013;11(6) http://www.sciencepub.net/nature
61
55. Veronique, M.J.; Mark, H.; and Mark, A.B. (2000). Silicon metabolism in Diatoms: Implications for growth. J.Phycol.36,821-840.
56. Vladimir,M.; Elena, B.; and David, C. (2001). Response of citrus to silicon soil amendments. Proc. Fla. State Hort. Soc.114:94-97.
57. Waseem, R.; Preeti, R.; Suchit, A. J., and Pramod, W. R. (2012). Azolla-Anabaena Association and Its Significance In Supportable Agriculture. J. Biol. & Chem., 2012, 40 (1),1–6.
58. Watanabe, F.S.; Olsen, S.R. (1965). Test of an ascorbic acid method for determine phosphorus in water and NaHCO3 extract from soil. Soil Sci. Soc. Am Proc. 29: 677-678.
59. Waterkeyn, L.; Bientait, A.; and Peeters, A. (1982). Callose et silice epidermiques rapports avec la transpiration culticulair. La Cellule. 73:263-287.
60. Weber, H.J. and Batchelor, L.D. (1948). The citrus industry, History, Botany, and Breeding. Vol.1, Univ. of Calif. Press, Perkeley and Los Angeles.
61. Wutschr, H.K. (1989). Growth and mineral nutrition of young orange trees grown with high levels of silicon. HortScience 24:275-277.
62. Yasser, M.A.; Emad, A.S., and Nermeen, T. Shanan. (2011). The use of organic and inorganic cultures in improving vegetative
growth, yield characters and antioxidant activity of roselle plants (Hibiscus sabdariffa L.) African Journal of Biotechnology Vol.10(11), pp.1988-1996.
63. Yeo, A.R.; Flowers, S.A.; Rao, G.; Welfare, K.; Senanayake, N. and Flowers, T.J. (1999). Silicon reduces sodium uptake in rice (Oryza sativa L.) in saline conditions and this is accounted for by reduction in transpirational bypass flow. Plant Cell Environment 22: 559-565.
64. Yoshida, S. (1975). The physiology of silicon in rice. Food Fert. Tech Centr., Tech. Bull. No. 4, Taiwan.
65. Yoshida, S., Forno, D. A., Corck J. H., and Gomez K. A. (1976). Laboratory manual for physiology studies of rice, The International Rice Res. Inst. (IRRI), LoS Banos, Manila, Phlippines Pp. 61- 65.
66. Zarrouk C. (1966). Contribution á l’étude d’une cyanophycée. Influence de divers facteurs physiques et chimiques sur la croissance et la photosynthése de Spirulina maxima (Setch. Et Gardner) Geitler. Ph.D. Thesis, University of Paris, France.
67. Zhu, J.K. (2001). Plant salt tolerance. Trends Plant Sci., 6: 66-71.
4/29/2013