nb private equity partners investor presentation... · nb private equity partners nbpe is a closed...
TRANSCRIPT

LPEQ Private Equity SeminarLondon, United Kingdom
NB Private Equity Partners26 September 2013 – Financial Information as of 31 August 2013 (unless otherwise noted)

NB Private Equity PartnersNBPE is a closed end investment company providing investors with a diversified exposure to the private equity asset class and the opportunity for capital gains as well as current income
• NBPE is designed to give investors diversified exposure to the private equity asset class in a liquid, publicly tradeable format Investments sourced from across the NB Alternatives platform
Listed in 2007; ordinary shares trade on both Euronext Amsterdam (NBPE AS) and the LSE (NBPE LN)
• Managed by NB Alternatives, the private equity division of Neuberger BermanOver 26 years as a private equity investor
Active investor across equity co-investments, private debt and healthcare credits and fund investments
• High quality portfolio focused on direct private equity co-investments and debt investments in private equity-backed companiesEquity co-investments and direct yielding investments constitute 53% of NAV and this is expected to
increase over time
Portfolio of cash generative fund investments
• Intention to pay sustainable dividendsDividend yield (annualized): 4.8% on share price1, 3.5% on NAV per Share1
On a run rate basis, the dividend is 70% covered by the cash yield from the direct yielding portfolio; we expect the dividend to be 100% covered by the cash yield on a run rate basis by the end of 2013
_______________________As of 31 August 2013. See endnote three for important information related to the dividend.1. Based on the NYSE Euronext closing share price of $8.84 on 31 August 2013 and the 31 August 2013 unaudited NAV of $11.98 per share.
NBPE Listed in 2007
NB ALTERNATIVESInvestment Manager
HIGH QUALITY PORTFOLIO
DIVIDENDS$0.41 / Share in 2013
1

Neuberger Berman & Neuberger Berman Private Equity
Integrated platform provides superior deal flow and enhanced due diligence and execution capabilities
PRIVATE EQUITY PLATFORMOver $18 billion of commitments managed
Industry Leadership: Over 26 years as a private equity investor
Integrated Platform: Drives deal flow, access and information
Experienced Investors: Expertise across buyout, venture, growth equity and distressed investing
Deep Team: ~60 investment professionals and ~110 investor services professionals in New York, Dallas, London and Hong Kong
EquityAUM: $105 billion
Fixed IncomeAUM: $93 billion
AlternativesAUM / Committed Capital:
$22 billion
FUND INVESTMENTS DIRECT INVESTMENTS
Primary Secondary Equity Co-Investments Private Debt Other
Yielding
NEUBERGER BERMANOver $214 billion in assets under management1
Global Presence: Approximately 1,900 employees in 29 cities worldwide
Employee Owned: Majority owned by senior professionals
_______________________Note: Information as of June 30, 2013, unless otherwise noted.1. Includes $105 billion in Equity assets, $93 billion Fixed Income assets and $16 billion in Alternatives assets under management. Committed Capital is a contractual agreement between an investor and a fund that obligates the investor to contribute that money to the fund as requested. The investor will generally make contributions over a period of time, typically over a number of years. As of August 1, 2013.
2

Our direct investment programs leverage the broader Neuberger Berman private equity platform to source and execute transactions
NB Alternatives Direct Investment Platform
NEUBERGER BERMANPLATFORM
NEUBERGER BERMANPLATFORM
Significant Investor in Private Equity Funds• Limited partner in funds for more than 25 years1
• Over $1 billion of capital committed to fund and direct investments annually
• Over 300 active fund investments, approximately 75advisory board seats
• Access to information on 12,000+ private equity-owned companies
Team and Platform• ~60 private equity investment professionals with
extensive networks, supported by ~110 investor services professionals
• Global presence with investment offices in the U.S., Europe and Asia
• Includes 37 Senior Principals with over 18 years of average industry experience
Direct Investment Capabilities
Deal Flow Advantages• Relationships: Utilize our integrated private equity
platform to generate direct deal flow• Access: Our relationships help secure allocations in
highly sought after investment opportunities
Due Diligence• Company Information: Institutional knowledge affords
robust diligence with an emphasis on credit quality• Sponsor Knowledge: Knowledge of manager
provides insight to analyzing investments
Experienced Direct Private Equity Investor• Reviewed over 1,000 transactions since 2006• Invested approximately $3 billion into more than 130
direct investments since 2006
_______________________Information as of June 30, 2013.
3

Investment StrategyActively pursuing equity co-investments and direct yielding investments and reducing exposure to private equity fund investments. The portfolio is tactically overweighted to North America
___________________________Note: As of 31 August 2013 (unaudited). May not sum due to rounding.
Fund Investments51%
Direct Yielding Investments
22%
Equity Co-investments
27%
DIRECT INVESTMENTS
FUND INVESTMENTS
INVESTMENT TYPE BY FAIR VALUE
• Increased direct investments from 37% of NAV at 31 December 2012 to 53% of NAV at 31 August 2013
• Equity co-investments: minority investments alongside premier private equity sponsors in their core areas of expertise
• Direct yielding investments: private debt investments in private equity backed companies & healthcare credits backed by healthcare assets or royalties
Strong cash yields with additional upside through PIK and / or equity
North America80%
Asia / ROW7%
Europe13%
GEOGRAPHIC DIVERSIFICATION BY FAIR VALUE
• High quality fund portfolio allocated to special situations and mid-cap buyout funds
• Mature portfolio of funds in realization mode
Funding new investments with distributions from fund portfolio
4

Equity Co-investment PortfolioNBPE’s equity co-investment portfolio contains approximately $154.3 million of fair value and is diversified across sponsor, industry and vintage year
_______________________Note: As of 31 August 2013 (unaudited).
EQUITY CO-INVESTMENTS
• $154.3 million of fair value invested in equity co-investments, representing 26% of NAV
• 42 equity co-investments diversified across industry, sponsor and vintage
Primarily buyout investments
Over 50% of fair value invested since 2010
• Focus on opportunities where the private equity manager can add value and realize its investment
in a discrete period of time
• Significant activity in portfolio during 2013
Nine investments completed year to date totaling $24.0 million of fair value
Early liquidity from two 2012 vintage equity co-investments
◦ Dividend re-capitalizations as a result of strong underlying company performance
• Strong performance to date
84% of fair value is held above cost as of 31 August 2013
PORTFOLIO
2013 ACTIVITY
PERFORMANCE
5

Portfolio of Insurance
Industry Loss Warranties
Investment Date Mar. 2013 Mar. 2013 Apr. 2013 Apr. 2013 June 2013 July 2013 July 2013 July 2013 July 2013
Asset Class Buyout Buyout Buyout Growth Equity Buyout Buyout Buyout Buyout Buyout
SituationSponsor to
sponsor transaction
Carve-out New Buyout Growth Equity
Portfolio of Insurance Contracts
Take-Private
Oil and Gas Exploration
and Production
Oil and Gas Exploration
and Production
Carve-out
Lead PE Firm
Compass Investment Partners
Castle Harlan
PartnersLeeds Equity 3i Cartesian KKR Lindsay
Goldberg Pine Brook Thoma Bravo
Industry Business Services Energy Consumer /
RetailConsumer /
RetailFinancial Services
Chemicals and
MaterialsEnergy Energy Financial
Technology
Range of% NBPE NAV 0% – 1% 0% – 1% 0% – 1% 0% – 1% 0% – 1% 0% – 1% 0% – 1% 0% – 1% 0% – 1%
New Equity Co-investments in 2013Nine new equity co-investments from 1 January 2013 through 31 August 2013 totaling $24.0 million or 4.1% of NBPE NAV at 31 August 2013
___________________________Source: NB Alternatives Due Diligence and investment case. Data as of 31 August 2013 (unaudited).
6

Direct Yielding Investment PortfolioNBPE’s direct yielding portfolio includes mezzanine and second lien debt investments and healthcare credit investments totaling $156.8 million of fair value
_______________________Note: As of 31 August 2013 (unaudited). Private equity fair value includes equity as part of the mezzanine transactions but the yield calculations and percentages of the portfolio invested in fixed vs. floating rate debt are based on the value of the debt only. Numbers may not sum due to rounding.
CORPORATE DEBT INVESTMENTS
Yield:9.3% Cash
10.8% Total Yield$11.8 million
Run Rate Cash Income
$133.0 millionof Private Equity
Fair Value
HEALTHCARE CREDIT INVESTMENTS
12.6% Total Yield $2.6 millionRun Rate Cash Income
$23.8 millionof Private Equity
Fair Value
• Total portfolio fair value of $156.8 million,
representing 27% of NAV
$133.0 million of private equity fair value in
corporate debt
$23.8 million of private equity fair value in
healthcare credit investments
• Total cash yield of $14.3 million, or 9.7%
• Interest rate type:
36% of fair value invested in fixed rate debt
64% of fair value invested in floating rate debt
• Junior debt investments in private equity-backed companies
• Healthcare credits backed by strong intellectual property and / or contracted revenues
7

New Direct Yielding Investments in 2013In 2013, NBPE has participated in seven direct yielding investments. These investments totaled $68.3 million or 11.7% of NBPE NAV at 31 August 2013
___________________________Note: As of 31 August 2013 (unaudited). Past performance is not indicative of future results.1. NBPE participated in the primary issuance of the second lien debt in January 2013. The notes purchased in this transaction were issued at a 1.5% OID. Subsequent to this financing, NBPE made an additional purchase of
the second lien notes through a secondary transaction.2. NBPE holds an unsecured note that is serviced by a royalty from the sales of an internal medication drug.
Investment Description
Heartland Dental1
Internal Medication
Royalty Notes
Term Loan to Medical Device
Company (Cardiac Device)
KIK Custom Products
Term Loan to Diagnostic Laboratory Company
(Genetic Testing)
Term Loan to a Medical
Device Company
(Cosmetics)
Blue Coat
Investment Date Jan. 2013 Jan. 2013 Feb. 2013 May 2013 June 2013 July 2013 July 2013
Security Description
Second Lien Debt
Synthetic Healthcare
Royalty2
Senior Secured Term Loan
Second Lien Debt
Senior Secured Loan
Senior Secured Loan
Second Lien Debt
OID / Purchase Discount 1.5% OID1 N/A 1.5% OID 2.0% OID N/A N/A 1.0% OID
Cash InterestL+8.5%
1.25% L Floor11.0% 13.5%
L+8.25%1.25% L Floor
10.0% 10.5%L+8.5%
1.0% L Floor
PIK Interest N/A N/A N/A N/A N/A N/A N/A
Maturity Profile 2020 2024 2018 2019 2018 2018 2020
Range of% NBPE NAV 3% – 4% 0% – 1% 0% – 1% 3% – 4% 0% – 1% 0% – 1% 3% – 4%
8
NBPE Fund Investment Portfolio
_______________________Note: As of 31 August 2013 (unaudited).1. Some portion of this amount may be called in future periods for fees, expenses, and/or follow-on investments.
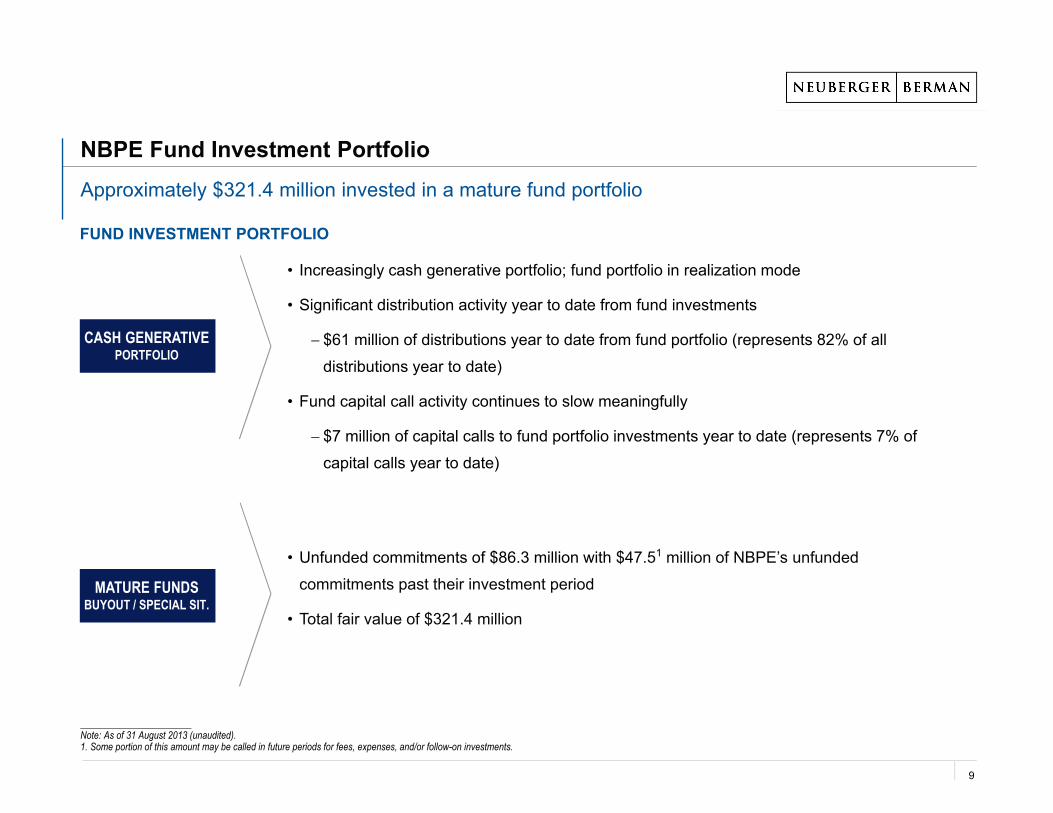
Approximately $321.4 million invested in a mature fund portfolio
• Increasingly cash generative portfolio; fund portfolio in realization mode
• Significant distribution activity year to date from fund investments
$61 million of distributions year to date from fund portfolio (represents 82% of all
distributions year to date)
• Fund capital call activity continues to slow meaningfully
$7 million of capital calls to fund portfolio investments year to date (represents 7% of
capital calls year to date)
FUND INVESTMENT PORTFOLIO
CASH GENERATIVEPORTFOLIO
MATURE FUNDSBUYOUT / SPECIAL SIT.
• Unfunded commitments of $86.3 million with $47.51 million of NBPE’s unfunded
commitments past their investment period
• Total fair value of $321.4 million
9

Capital PositionNBPE has significant capital resources with a 108% commitment coverage level
_______________________Note: As of 31 August 2013 (unaudited).1. Some portion of this amount may be called in future periods for fees, expenses, and/or follow-on investments.
UNFUNDEDCOMMITMENTS
• Total unfunded commitments of $214.9 million
$127.2 million of unfunded commitments to the NB Alternatives Direct Co-investment and
Healthcare Credit programs
$86.3 million unfunded commitments to fund investments, of which $47.5 million1 was to
funds past their investment period
CAPITAL POSITION
• NBPE has a $200 million revolving credit facility with a term expiring in April 2017, which is
currently undrawn
• Cash balance of $32.1 million
• Excess capital resources of $17.3 million and 108% commitment coverage level
OVER COMMITMENTSTRATEGY
• Private equity fair value of $632.5 million and net asset value of $584.7 million
Private equity investment level of 108%
10

Dividends
• NBPE intends to pay sustainable dividends to Shareholders from the cash yield generated on the direct yielding investment portfolio
Dividend yield (annualized): 4.8% on share price1, 3.5% on NAV per Share1
Dividends are 70% covered by the cash yield on a run rate basis
• Goal is to have the dividend fully supported by the end of the year on a run rate basis from the cash yield generated on the direct yielding
investments
NBPE intends to pay sustainable dividends to Shareholders from the cash yield generated on direct yielding investments
___________________________Note: See endnote three for important information related to the dividend.1. Based on the NYSE Euronext closing share price of $8.84 on 31 August 2013 and the 31 August 2013 unaudited NAV of $11.98 per share.
11

$4.00$5.00$6.00$7.00$8.00$9.00
$10.00$11.00$12.00$13.00Price
0200400600800
Volume (000s)1
$9.00
31-Aug-2012 30-Nov-2012 31-May-201328-Feb-2013 23-Sept-2013
Daily Trading Volume Price per Share (Euronext)
NBPE Share Price vs. NAV per Share Including Dividends
_______________________Source: Bloomberg. Market data as of 23 September 2013. Past performance is not indicative of future results.Note: Daily Trading Volume includes combined volume of ordinary shares traded on NYSE Euronext and London Stock Exchange as well as over-the-counter trades reported via Markit BOAT.1. Daily trading volume was greater than 800,000 shares on 28 September 2012, 7 March 2013, 22 April 2013 and 17 July 2013 and had trading volume of 1.1 million, 12.1 million, 1.2 million, and 4.1 million shares, respectively.
Over the last 12 months, NBPE’s share price has increased 16.3% and NAV per Share including dividends has increased 10.2%. NAV per Share including dividends was $12.39 at 31 August 2013
$12.39
NAV per Ordinary ShareIncluding Dividends
12

0100200300400500
Share Volume (000's)
115.0p
120.0p
125.0p
130.0p
135.0p
140.0p
145.0p
Price
ZDP Price and NAV per ZDP ShareNBPE’s ZDP shares have consistently traded at a premium to accreted value since they were issued in late 2009. The GRY is currently 4.5% at the prevailing market priceZDP PRICE PERFORMANCE AND NAV PER ZDP SHARE OVER THE LAST TWELVE MONTHS
___________________________Source: Bloomberg. Market data as of 23 September 2013. Past performance is not indicative of future results.Note: NAV per ZDP share is defined as the accreted value of the ZDP shares.Daily trading volume was greater than 500,000 shares on 21 June 2013 and had trading volume of 860,000 shares.
130.87p
144.13p(10.1% Premium)
30-Nov-201231-Aug-2012 28-Feb-2013 31-May-2013 23-Sept-2013
Daily Trading Volume Net Asset Value per ZDP Share Price per Share
13

Attractive Value Proposition
• Experienced Investment Manager with a strong long-term track record in direct investing
• Invested approximately $3 billion into more than 130 direct investments since 2006
We believe that NBPE offers a compelling investment opportunity
VALUE PROPOSITION
• High quality private equity portfolio
• Equity co-investment and direct yielding investment exposure funded by a mature, cash generative,
diversified portfolio of private equity fund interests
• NBPE intends to pay sustainable dividends to Shareholders from the cash yield generated on the
direct yielding investment portfolio
• Dividend yield (annualized): 4.8% on share price1, 3.5% on NAV per Share1
TRACKRECORD
PORTFOLIO
DIVIDENDS
___________________________Note: See endnote three for important information related to the dividend.1. Based on the NYSE Euronext closing share price of $8.84 on 31 August 2013 and the 31 August 2013 unaudited NAV of $11.98 per share.
14

Trading Information
ORDINARY SHARE INFORMATION ZDP SHARE INFORMATION
Trading Symbol: NBPE
Exchanges: Euronext Amsterdam & London Stock Exchange
Base Currency: USD
Bloomberg: NBPE NA, NBPE LN
Reuters: NBPE.AS, NBPE.L
ISIN: GG00B1ZBD492
COMMON: 030991001
Trading Symbol: NBPZ
Exchanges: London Stock Exchange & Channel Islands Stock Exchange
Base Currency: GBP
Bloomberg: NBPEGBP LN
Reuters: NBPEO.L
ISIN: GG00B4ZXGJ22
SEDOL: B4ZXGJ2
Gross Redemption Yield: 7.30% at issuance
Share Life: 7.5 years to 31 May 2017
Final Capital Entitlement: 169.73 pence per share at maturity
15

Contact Information
Registered Office: NB Private Equity Partners LimitedP.O. Box 225Heritage Hall, Le Marchant StreetSt. Peter Port, Guernsey GY1 4HYChannel IslandsTel: +44.(0).1481.716.000
Investment Manager: NB Alternatives Advisers LLC325 N. Saint Paul StreetSuite 4900Dallas, TX 75201United States of America
Investor Relations: Web: www.nbprivateequitypartners.comEmail: [email protected]: +1.214.647.9593
Media Relations: FTI ConsultingEdward BerryTel: +44.20.7269.7297
Corporate Brokers: Oriel SecuritiesNeil WinwardTel: +44.20.7710.7600
Jefferies International LimitedGary Gould/Stuart KleinTel: +44.20.7029.8766
Research Analysts: Oriel Securities – Iain ScoullerEmail: [email protected]
Jefferies – Louisa Symington-MillsEmail: [email protected]
Cazenove – Christopher BrownEmail: [email protected]
Canaccord Genuity – Alan BrierleyEmail: [email protected]
Dexion – Tom Skinner & Hiba LarssonEmail: [email protected]
Liberum Capital – Conner FinnEmail: [email protected]
Numis – Charles Cade & Sarah LewandowskiEmail: [email protected]
Winterflood – Simon ElliottEmail: [email protected]
16

APPENDIX

NAV Update
___________________________Note: As of 31 August 2013 (unaudited). Past performance is not indicative of future results. Numbers may not sum due to rounding.
On a total return basis, including dividends, NBPE’s NAV per share increased 4.9% during the first eight months of 2013
• Significant amount of investment and realization activity in 2013
Direct/co-investments and Capital calls of $99 million YTD 2013
Sale proceeds and Distributions of $75 million YTD 2013
PORTFOLIO ACTIVITY
AUGUST 2013 NAV UPDATE
($ in millions, except per share values)31 August 2013
(Unaudited)31 December 2012
(Audited)Fund Investments $321.4 $350.6Direct / Co-investments
Direct Yielding Investments $156.8 $82.9Equity Co-investments $154.3 $130.6
Total Direct / Co-investments $311.1 $213.4Total Private Equity Fair Value $632.5 $564.0Private Equity Investment Level 108% 98%
Cash and Cash Equivalents $32.1 $67.4Credit Facility - -ZDP Share Liability, including Forward Currency Contract ($69.4) ($66.9)Net Other Assets (Liabilities), including Minority Interest ($10.6) $12.1Net Asset Value $584.7 $576.6Net Asset Value Including Dividends $604.7 $576.6Net Asset Value per Share $11.98 $11.81Cumulative Dividends per Share $0.41 -Net Asset Value per Share Including Dividends $12.39 $11.81
17

NBPE Equity Co-investment PortfolioDiversified portfolio of equity co-investments
_______________________Note: As of 31 August 2013 (unaudited). 1. SonicWall is a mostly realized investment with escrow proceeds as remaining unrealized value which we expect to be fully realized in the future.
Company Name Asset ClassInvestment
Year Lead Sponsor Fair Value% of
NBPE NAVActeon Mid-cap Buyout 2012 KKR - 0% - 1%ADPI Mid-cap Buyout 2012 JLL Partners - 0% - 1%Avaya Large-cap Buyout 2007 TPG / Silver Lake Partners - 0% - 1%Blue Coat Systems Mid-cap Buyout 2012 Thoma Bravo - 0% - 1%Boa Vista Mid-cap Buyout 2012 TMG Capital - 0% - 1%Capsugel Large-cap Buyout 2011 KKR - 1% - 2%CoAdvantage Mid-cap Buyout 2013 Compass Investment Partners - 0% - 1%CommScope Large-cap Buyout 2011 Carlyle Group - 0% - 1%Deltek Mid-cap Buyout 2012 Thoma Bravo - 0% - 1%Digital Insight Mid-cap Buyout 2013 Thoma Bravo - 0% - 1%Edgen Group Mid-cap Buyout 2007 Jefferies Capital Partners - 0% - 1%Energy Future Holdings Large-cap Buyout 2007 KKR / TPG - 0% - 1%Fairmount Minerals Mid-cap Buyout 2010 American Securities Partners - 0% - 1%First Data Large-cap Buyout 2007 KKR - 0% - 1%Firth Rixson Equity Mid-cap Buyout 2007 Carlyle Group - 0% - 1%Formation Energy Mid-cap Buyout 2013 Lindsay Goldberg - 0% - 1%Freescale Semiconductor Large-cap Buyout 2006 Blackstone / Carlyle/ Permira / TPG - 0% - 1%Gabriel Brothers Special Situations 2012 A&M Capital - 0% - 1%Gardner Denver Large-cap Buyout 2013 KKR - 0% - 1%GazTransport & Technigaz Mid-cap Buyout 2008 Hellman & Friedman - 0% - 1%Group Ark Insurance Mid-cap Buyout 2007 Aquiline Capital Partners - 3% - 4%Insurance Inudstry Loss Warranties Mid-cap Buyout 2013 Cartesian - 0% - 1%INTO University Partnerships Mid-cap Buyout 2013 Leeds Equity Partners - 0% - 1%J.Crew Group Large-cap Buyout 2011 TPG / Leonard Green - 0% - 1%Kyobo Life Insurance Mid-cap Buyout 2007 Corsair Capital Partners - 0% - 1%Oticas Carol Growth / Venture 2013 3i Brazil - 0% - 1%Pepcom Mid-cap Buyout 2011 STAR - 0% - 1%Press Ganey Associates Mid-cap Buyout 2008 Vestar Capital - 0% - 1%RAC Large-cap Buyout 2011 Carlyle Group - 0% - 1%Revspring Mid-cap Buyout 2012 Compass Investment Partners - 0% - 1%Sabre Large-cap Buyout 2007 TPG / Silver Lake Partners - 3% - 4%Saguaro Resources Mid-cap Buyout 2013 Pine Brook - 0% - 1%Salient Solutions Mid-cap Buyout 2010 Frontenac Company - 0% - 1%Seventh Generation Growth / Venture 2008 Catamount Ventures - 0% - 1%Shelf Drilling Mid-cap Buyout 2013 Castle Harlan Partners - 0% - 1%SonicWall (Equity)1 Mid-cap Buyout 2010 Thoma Bravo - 0% - 1%Swissport Mid-cap Buyout 2011 PAI - 0% - 1%Syniverse Large-cap Buyout 2011 Carlyle Group - 0% - 1%Taylor Precision Products Mid-cap Buyout 2012 Centre Partners - 0% - 1%The SI Organization Mid-cap Buyout 2010 Veritas Capital - 0% - 1%TPF Genco Mid-cap Buyout 2006 Tenaska Capital Management - 1% - 2%Univar Large-cap Buyout 2010 Clayton, Dublier & Rice - 0% - 1%
Total Equity Co-investment Portfolio $154.3 26.4%
18
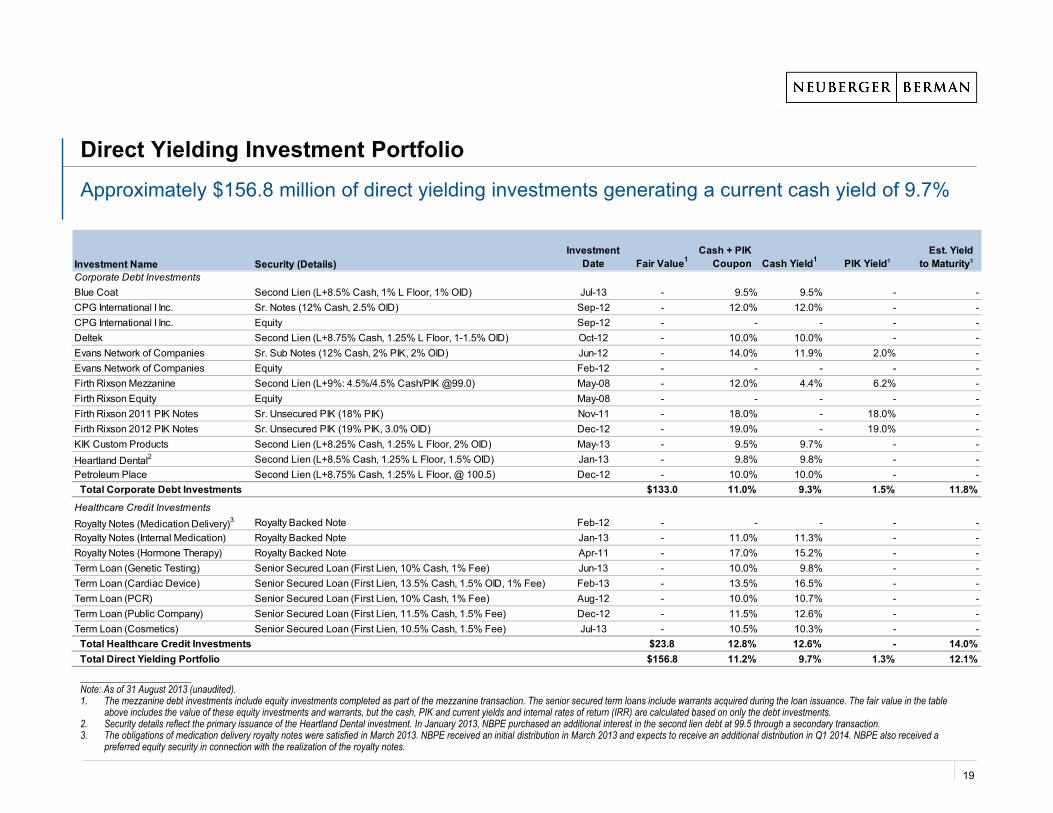
Direct Yielding Investment PortfolioApproximately $156.8 million of direct yielding investments generating a current cash yield of 9.7%
_______________________Note: As of 31 August 2013 (unaudited). 1. The mezzanine debt investments include equity investments completed as part of the mezzanine transaction. The senior secured term loans include warrants acquired during the loan issuance. The fair value in the table
above includes the value of these equity investments and warrants, but the cash, PIK and current yields and internal rates of return (IRR) are calculated based on only the debt investments.2. Security details reflect the primary issuance of the Heartland Dental investment. In January 2013, NBPE purchased an additional interest in the second lien debt at 99.5 through a secondary transaction. 3. The obligations of medication delivery royalty notes were satisfied in March 2013. NBPE received an initial distribution in March 2013 and expects to receive an additional distribution in Q1 2014. NBPE also received a
preferred equity security in connection with the realization of the royalty notes.
Investment Name Security (Details)Investment
Date Fair Value1Cash + PIK
Coupon Cash Yield1 PIK Yield1Est. Yield
to Maturity1
Corporate Debt InvestmentsBlue Coat Second Lien (L+8.5% Cash, 1% L Floor, 1% OID) Jul-13 - 9.5% 9.5% - -CPG International I Inc. Sr. Notes (12% Cash, 2.5% OID) Sep-12 - 12.0% 12.0% - -CPG International I Inc. Equity Sep-12 - - - - -Deltek Second Lien (L+8.75% Cash, 1.25% L Floor, 1-1.5% OID) Oct-12 - 10.0% 10.0% - -Evans Network of Companies Sr. Sub Notes (12% Cash, 2% PIK, 2% OID) Jun-12 - 14.0% 11.9% 2.0% -Evans Network of Companies Equity Feb-12 - - - - -Firth Rixson Mezzanine Second Lien (L+9%: 4.5%/4.5% Cash/PIK @99.0) May-08 - 12.0% 4.4% 6.2% -Firth Rixson Equity Equity May-08 - - - - -Firth Rixson 2011 PIK Notes Sr. Unsecured PIK (18% PIK) Nov-11 - 18.0% - 18.0% -Firth Rixson 2012 PIK Notes Sr. Unsecured PIK (19% PIK, 3.0% OID) Dec-12 - 19.0% - 19.0% -KIK Custom Products Second Lien (L+8.25% Cash, 1.25% L Floor, 2% OID) May-13 - 9.5% 9.7% - -Heartland Dental2 Second Lien (L+8.5% Cash, 1.25% L Floor, 1.5% OID) Jan-13 - 9.8% 9.8% - -Petroleum Place Second Lien (L+8.75% Cash, 1.25% L Floor, @ 100.5) Dec-12 - 10.0% 10.0% - -
Total Corporate Debt Investments $133.0 11.0% 9.3% 1.5% 11.8%
Healthcare Credit InvestmentsRoyalty Notes (Medication Delivery)3 Royalty Backed Note Feb-12 - - - - -Royalty Notes (Internal Medication) Royalty Backed Note Jan-13 - 11.0% 11.3% - -Royalty Notes (Hormone Therapy) Royalty Backed Note Apr-11 - 17.0% 15.2% - -Term Loan (Genetic Testing) Senior Secured Loan (First Lien, 10% Cash, 1% Fee) Jun-13 - 10.0% 9.8% - -Term Loan (Cardiac Device) Senior Secured Loan (First Lien, 13.5% Cash, 1.5% OID, 1% Fee) Feb-13 - 13.5% 16.5% - -Term Loan (PCR) Senior Secured Loan (First Lien, 10% Cash, 1% Fee) Aug-12 - 10.0% 10.7% - -Term Loan (Public Company) Senior Secured Loan (First Lien, 11.5% Cash, 1.5% Fee) Dec-12 - 11.5% 12.6% - -Term Loan (Cosmetics) Senior Secured Loan (First Lien, 10.5% Cash, 1.5% Fee) Jul-13 - 10.5% 10.3% - -
Total Healthcare Credit Investments $23.8 12.8% 12.6% - 14.0%Total Direct Yielding Portfolio $156.8 11.2% 9.7% 1.3% 12.1%
19

NBPE Fund Investment Portfolio
_______________________Note: As of 31 August 2013 (unaudited).
Mature fund portfolio with approximately $321.4 million of fair valueInvestment Name Asset Class
VintageYear
UnfundedCommitment Fair Value
% ofNBPE NAV
NB Crossroads Fund XVIII Mid-cap Buyout Mid-cap Buyout Diversified $7.7 $29.7 5.1%NB Crossroads Fund XVII Fund XVII (Diversified) Diversified 1.9 28.7 4.9%First Reserve Fund XI Large-cap Buyout 2006 0.0 20.8 3.6%Centerbridge Credit Partners Special Situations 2008 0.0 19.9 3.4%Sankaty Credit Opportunities III Special Situations 2007 0.0 17.5 3.0%Platinum Equity Capital Partners II Special Situations 2007 3.7 14.5 2.5%OCM Principal Opportunities Fund IV Mid-cap Buyout 2007 2.0 13.8 2.4%Avista Capital Partners Mid-cap Buyout 2006 0.7 11.2 1.9%NB Crossroads Fund XVIII Large-cap Buyout Large-cap Buyout Diversified 2.7 11.2 1.9%NB Crossroads Fund XVIII Venture Capital Growth / Venture Diversified 1.9 9.5 1.6%Wayzata Opportunities Fund II Special Situations 2007 18.4 9.4 1.6%Oaktree Opportunities Fund VIII Special Situations 2009 0.0 9.4 1.6%Lightyear Fund II Mid-cap Buyout 2006 1.4 9.0 1.5%Catalyst Fund III Special Situations 2011 6.8 8.5 1.4%CVI Global Value Fund Special Situations 2006 0.8 8.2 1.4%Bertram Growth Capital I Growth / Venture 2007 1.3 8.1 1.4%Sun Capital Partners V Special Situations 2007 2.4 8.0 1.4%OCM Opportunities Fund VIIb Special Situations 2008 3.0 7.7 1.3%NB Crossroads Fund XVIII Special Situations Special Situations Diversified 1.3 7.1 1.2%NB Fund of Funds Secondary 2009 Mid-cap Buyout 2009 1.5 7.0 1.2%Corsair III Financial Services Capital Partners Mid-cap Buyout 2007 1.3 6.5 1.1%Wayzata Opportunities Fund II (Secondary) Special Situations 2011 5.3 6.3 1.1%ArcLight Energy Partners Fund IV Mid-cap Buyout 2007 4.6 6.2 1.1%NG Capital Partners Growth / Venture 2010 0.7 6.2 1.1%Aquiline Financial Services Fund Mid-cap Buyout 2005 0.0 5.7 1.0%Trident IV Mid-cap Buyout 2007 0.6 4.4 0.8%American Capital Equity II Mid-cap Buyout 2005 1.2 4.2 0.7%Carlyle Europe Partners II Large-cap Buyout 2003 0.7 4.2 0.7%Doughty Hanson & Co IV Large-cap Buyout 2003 0.1 3.6 0.6%Bertram Growth Capital II Growth / Venture 2010 5.1 3.4 0.6%Highstar Capital II Mid-cap Buyout 2004 0.1 2.7 0.5%J.C. Flowers II Large-cap Buyout 2006 0.3 2.7 0.5%Summit Partners Europe Private Equity Fund Growth / Venture 2010 2.9 2.4 0.4%Clessidra Capital Partners Mid-cap Buyout 2004 0.1 1.3 0.2%Strategic Value Global Opportunities Fund I-A Special Situations 2010 0.1 0.8 0.1%Prospect Harbor Credit Partners Special Situations 2007 0.0 0.7 0.1%Strategic Value Special Situations Fund Special Situations 2010 0.0 0.5 0.1%Investitori Associati III Mid-cap Buyout 2000 0.5 0.2 0.0%DBAG Expansion Capital Fund Growth / Venture 2012 5.1 0.2 0.0%
Total Fund Portfolio $86.3 $321.4 55.0%
20

Experienced and Deep Team
Jeffry BrownManaging Director30 Years Experience
Jeffry BrownManaging Director30 Years Experience
Michael KramerManaging Director17 Years Experience
Michael KramerManaging Director17 Years Experience
Patricia MillerManaging Director26 Years Experience
Patricia MillerManaging Director26 Years Experience
Samuel PoratManaging Director13 Years Experience
Samuel PoratManaging Director13 Years Experience
Mark O’SullivanPrincipal10 Years Experience
Mark O’SullivanPrincipal10 Years Experience
Sean WardManaging Director8 Years Experience
Sean WardManaging Director8 Years Experience
Brian TalbotManaging Director29 Years Experience
Brian TalbotManaging Director29 Years Experience
Joana RochaManaging Director14 Years Experience
Joana RochaManaging Director14 Years Experience
Ethan FalkoveManaging Director18 Years Experience
Ethan FalkoveManaging Director18 Years Experience
Tristram PerkinsManaging Director18 Years Experience
Tristram PerkinsManaging Director18 Years Experience
ADDITIONAL SENIOR INVESTMENT PROFESSIONALS
Michael ReesManaging Director13 Years Experience
Michael ReesManaging Director13 Years Experience
Chris NeiraSenior Vice President17 Years Experience
Chris NeiraSenior Vice President17 Years Experience
Blake RiceSenior Vice President11 Years Experience
Blake RiceSenior Vice President11 Years Experience
LEGAL, TRANSACTION EXECUTION AND CLIENT SOLUTIONS TEAM
Randy BoytsManaging Principal34 Years Experience
Randy BoytsManaging Principal34 Years Experience
Scott ElphingstoneManaging Principal36 Years Experience
Scott ElphingstoneManaging Principal36 Years Experience
Greg BarrettManaging Director20 Years Experience
Greg BarrettManaging Director20 Years Experience
Mattie WorthamPrincipal20 Years Experience
Mattie WorthamPrincipal20 Years Experience
DUE DILIGENCE & EXECUTION
___________________________Note: as of 31 August 2013.
Kelly MaughanSenior Vice President21 Years Experience
Kelly MaughanSenior Vice President21 Years Experience
David MorseManaging Director27 Years Experience
David MorseManaging Director27 Years Experience
Christopher FrattaroliSenior Vice President25 Years Experience
Christopher FrattaroliSenior Vice President25 Years Experience
Jeannette ChangAssociate4 Years Experience
Jeannette ChangAssociate4 Years Experience
Anthony TutroneManaging Director
25 Years of Experience
David StonbergManaging Director
22 Years of Experience
Brien SmithManaging Director
31 Years of Experience
Peter Von LeheManaging Director
19 Years of Experience
Tonia AlbanoPrincipal13 Years Experience
Tonia AlbanoPrincipal13 Years Experience
Josh MillerPrincipal10 Years Experience
Josh MillerPrincipal10 Years Experience
Ben PerlPrincipal10 Years Experience
Ben PerlPrincipal10 Years Experience
Elizabeth TraxlerPrincipal11 Years Experience
Elizabeth TraxlerPrincipal11 Years Experience
Jackie WangPrincipal11 Years Experience
Jackie WangPrincipal11 Years Experience
Craig CoxAssociate4 Years Experience
Craig CoxAssociate4 Years Experience
Frank GuglielmoAssociate4 Years Experience
Frank GuglielmoAssociate4 Years Experience
Walker AngellAnalyst2 Years Experience
Walker AngellAnalyst2 Years Experience
Nan WangAssociate6 Years Experience
Nan WangAssociate6 Years Experience
Nikhil KrishnanAssociate3 Years Experience
Nikhil KrishnanAssociate3 Years Experience
Will SmithAnalyst2 Years Experience
Will SmithAnalyst2 Years Experience
Tyler CzinegeAnalyst2 Years Experience
Tyler CzinegeAnalyst2 Years Experience
Clemens FeilAssociate3 Years Experience
Clemens FeilAssociate3 Years Experience
Matthew WienerAssociate5 Years Experience
Matthew WienerAssociate5 Years Experience
Paul DaggettPrincipal14 Years Experience
Paul DaggettPrincipal14 Years Experience
Brock WilliamsPrincipal17 Years Experience
Brock WilliamsPrincipal17 Years Experience
Kevin ChiuAssociate3 Years Experience
Kevin ChiuAssociate3 Years Experience
Kaci BoyerAssociate6 Years Experience
Kaci BoyerAssociate6 Years Experience
Peter BockVice President14 Years Experience
Peter BockVice President14 Years Experience
Langston TheisAssociate5 Years Experience
Langston TheisAssociate5 Years Experience
Jose Luis Gonzalez PastorAssociate6 Years Experience
Jose Luis Gonzalez PastorAssociate6 Years Experience
Maura Reilly KennedyPrincipal10 Years Experience
Maura Reilly KennedyPrincipal10 Years Experience
Doug ManorVice President8 Years Experience
Doug ManorVice President8 Years Experience
Whitney GreenAnalyst4 Years Experience
Whitney GreenAnalyst4 Years Experience
Jonathan ShofetManaging Director
17 Years of Experience
John MasseyChairman
46 Years of Experience
John BuserManaging Director
31 Years of Experience
Julie AtwellAssociate13 Years Experience
Julie AtwellAssociate13 Years Experience
Piotr BogusAssociate6 Years Experience
Piotr BogusAssociate6 Years Experience
Susan KasserManaging Director15 Years Experience
Susan KasserManaging Director15 Years Experience
NB INDUSTRY RESEARCH TEAM• 144 buy-side research analysts • 250+ third party research firms
Matt TaiAnalyst2 Years Experience
Matt TaiAnalyst2 Years Experience
Kimberly MarlarAssistant Vice President / Paralegal13 Years Experience
Kimberly MarlarAssistant Vice President / Paralegal13 Years Experience
Dominique de la TorreAnalyst4 Years Experience
Dominique de la TorreAnalyst4 Years Experience
Courtney ClendeninAnalyst / Paralegal1 Year Experience
Courtney ClendeninAnalyst / Paralegal1 Year Experience
Asha BhatAnalyst2 Years Experience
Asha BhatAnalyst2 Years Experience
Jackie FishAnalyst2 Years Experience
Jackie FishAnalyst2 Years Experience
Ann SheuVice President8 Years Experience
Ann SheuVice President8 Years Experience
Yonah FederVice President7 Years Experience
Yonah FederVice President7 Years Experience
Zachary SigelVice President8 Years Experience
Zachary SigelVice President8 Years Experience
NBPE leverages an experienced investment committee as well as a broader team of professionals
21
Endnotes
1. The diversification analysis by asset class and investment type is based on the fair value of underlying fund investments and direct/co-investments. Determinationsregarding asset class and investment type represent the Investment Manager’s estimates. Accordingly, the actual diversification of our investment portfolio and thediversification of our investment portfolio on an ongoing basis may vary from the foregoing information. For the NB Alternatives Direct Co-investment Program and theNB Healthcare Credit Investment Program commitments, total exposure only reflects the funded investments to date. Unfunded amounts and unfunded percentageswithin each of these programs are excluded from the analysis, as capital deployment is opportunistic and cannot be accurately forecast at this time.
2. The diversification analysis by geography is based on the diversification of underlying portfolio company investments at fair value as estimated by the InvestmentManager. Determinations regarding geography and industry also represent the Investment Manager’s estimates. Accordingly, the actual diversification of ourinvestment portfolio and the diversification of our investment portfolio on an ongoing basis may vary from the foregoing information. For the NB Alternatives Direct Co-investment Program and the NB Healthcare Credit Investment Program commitments, total exposure only reflects the funded investments to date. Unfunded amountsand unfunded percentages within each of these programs are excluded from the analysis, as capital deployment is opportunistic and cannot be accurately forecast atthis time.
3. Guidance regarding NBPE’s future portfolio and performance is a target only and not a profit forecast. There can be no assurance that this target will be met or that theCompany will make any future distributions whatsoever. Any such changes will be notified to shareholders through a regulatory information service. NBPE’s Board ofDirectors will continue to evaluate the Company’s financial position, annual dividend target and the timing of future dividends. Future dividend payments will beannounced by NBPE after the Board of Directors have completed such evaluation.
22

Legal Disclaimer
THE CONTENTS OF THIS DOCUMENT AND THE PRESENTATION ARE STRICTLY CONFIDENTIAL AND MAY NOT BE COPIED, DISTRIBUTED, PUBLISHED OR REPRODUCED INWHOLE OR IN PART, OR DISCLOSED OR DISTRIBUTED BY RECIPIENTS TO ANY OTHER PERSON. ANY RECIPIENT OF THIS DOCUMENT AGREES TO KEEP PERMANENTLYCONFIDENTIAL ALL INFORMATION HEREIN NOT ALREADY IN THE PUBLIC DOMAIN.This document and the presentation are not for release, publication or distribution (directly or indirectly) in or into the United States, Canada, Australia or Japan or to any "US person" asdefined in Regulation S under the United States Securities Act of 1933, as amended (the "Securities Act") or into any other jurisdiction where applicable laws prohibit its release,distribution or publication. It does not constitute an offer of securities for sale anywhere in the world, including in or into the United States, Canada, Australia or Japan. No recipient maydistribute, or make available, this document or the presentation (directly or indirectly) to any other person. Recipients of this document and the presentation should inform themselves aboutand observe any applicable legal requirements in their jurisdictions. In particular, the distribution of this document and the presentation may in certain jurisdictions be restricted by law.Accordingly, recipients represent that they are able to receive this document and relating presentation without contravention of any applicable legal or regulatory restrictions in thejurisdiction in which they reside or conduct business.This document and the presentation have been prepared by NB Private Equity Partners Limited ("NBPE") and NB Alternatives Advisers LLC (the "Investment Manager"). No member ofthe Neuberger Berman Group nor any of their respective directors, officers, employees, advisors, representatives, or other agents makes or has been authorised to make any representationor warranties (express or implied) in relation to NBPE or as to the truth, accuracy or completeness of this document or the presentation, or any other written or oral statement provided. Inparticular, no representation or warranty is given as to the achievement or reasonableness of, and no reliance should be placed on any projections, targets, estimates or forecasts containedin this document or the presentation and nothing in this document or the presentation is or should be relied on as a promise or representation as to the future. The name "NeubergerBerman" is used interchangeably throughout these materials for a number of entities that are part of, or are associated with, the Neuberger Berman Group and when used in this noticeincludes all such entities.This document does not constitute a prospectus or offering memorandum or an offer in respect of any securities and is not intended to provide the basis for any decision inrespect of NBPE or other evaluation of any securities of NBPE or any other entity and should not be considered as a recommendation that any investor should subscribe for orpurchase any such securities. Neither the issue of this document nor the presentation nor any part of their contents constitutes an offer to sell or invitation to purchase anysecurities of NBPE or any other entity or any persons holding securities of NBPE and no information set out in this document or the presentation or referred to in other writtenor oral information is intended to form the basis of any contract of sale, investment decision or any decision to purchase any securities referred to in it.The information contained in this document is given at the date of its publication (unless otherwise marked) and is subject to updating, revision and amendment. No reliance may be placedfor any purpose whatsoever on the information of opinions contained in this document or on its completeness, accuracy or fairness. The contents of this document have not been approvedby any competent regulatory or supervisory authority.This document, any presentation made in conjunction with this document and any accompanying materials (the "Information Materials") are made available for information purposes only.The Information Materials, which are not a prospectus or listing particulars or an admission document, do not contain any representations, do not constitute or form part of any offer orinvitation to sell or transfer, or to underwrite, subscribe for or acquire, any shares or other securities, and do not constitute or form any part of any solicitation of any such offer or invitation,nor shall they are or any part of them or the fact of their distribution form the basis of or be relied upon in connection with any contract therefore, and do not constitute a recommendationregarding the securities of NBPE.Neither NBPE nor Neuberger Berman gives any undertaking to provide the recipient with access to any additional information, or to update this document, the presentation or any additionalinformation, or to correct any inaccuracies in it which may become apparent and the distribution of this document and the presentation shall not be deemed to be any form of commitment onthe part of NBPE, the Investment Manager or Neuberger Berman to proceed with any transaction.
23

Legal Disclaimer
THE PROMOTION OF NBPE AND THE DISTRIBUTION OF THIS DOCUMENT AND THE PRESENTATION IN THE UNITED KINGDOM IS RESTRICTED BY LAW. ACCORDINGLY, THIS COMMUNICATION ISDIRECTED ONLY AT (I) PERSONS OUTSIDE THE UNITED KINGDOM TO WHOM IT IS LAWFUL TO COMMUNICATE TO, OR (II) PERSONS HAVING PROFESSIONAL EXPERIENCE IN MATTERS RELATING TOINVESTMENTS WHO FALL WITHIN THE DEFINITION OF "INVESTMENT PROFESSIONALS" IN ARTICLE 19(5) OF THE FINANCIAL SERVICES AND MARKETS ACT 2000 (FINANCIAL PROMOTION) ORDER2005 (AS AMENDED), OR (III) HIGH NET WORTH COMPANIES, UNINCORPORATED ASSOCIATIONS AND PARTNERSHIPS AND TRUSTEES OF HIGH VALUE TRUSTS AS DESCRIBED IN ARTICLE 49(2) OFTHE FINANCIAL SERVICES AND MARKETS ACT 2000 (FINANCIAL PROMOTION) ORDER 2005 (AS AMENDED); PROVIDED THAT IN THE CASE OF PERSONS FALLING INTO CATEGORIES (II) OR (III), THECOMMUNICATION IS ONLY DIRECTED AT PERSONS WHO ARE ALSO "QUALIFIED INVESTORS" AS DEFINED IN SECTION 86 OF THE FINANCIAL SERVICES AND MARKETS ACT 2000 (EACH A "RELEVANTPERSON"). ANY INVESTMENT OR INVESTMENT ACTIVITY TO WHICH THIS COMMUNICATION RELATES IS AVAILABLE ONLY TO AND WILL BE ENGAGED IN ONLY WITH SUCH RELEVANT PERSONS.PERSONS WITHIN THE UNITED KINGDOM WHO RECEIVE THIS COMMUNICATION (OTHER THAN PERSONS FALLING WITHIN (II) AND (III) ABOVE) SHOULD NOT RELY ON OR ACT UPON THISCOMMUNICATION. YOU REPRESENT AND AGREE THAT YOU ARE A RELEVANT PERSON.NBPE HAS NOT BEEN, AND HAS NO INTENTION TO BE, REGISTERED UNDER THE U.S. INVESTMENT COMPANY ACT OF 1940, AS AMENDED (THE "INVESTMENT COMPANY ACT") AND INVESTORS WILLNOT BE ENTITLED TO THE BENEFITS OF THAT ACT. THE SECURITIES DESCRIBED IN THIS DOCUMENT HAVE NOT BEEN AND WILL NOT BE REGISTERED UNDER THE SECURITIES ACT.CONSEQUENTLY, SUCH SECURITIES MAY NOT BE OFFERED OR SOLD IN THE UNITED STATES OR TO U.S. PERSONS (AS SUCH TERM IS DEFINED IN REGULATION S UNDER THE SECURITIES ACT)UNLESS SUCH SECURITIES ARE REGISTERED UNDER THE SECURITIES ACT OR AN EXEMPTION FROM THE REGISTRATION REQUIREMENT OF THE SECURITIES ACT IS AVAILABLE. NO PUBLICOFFERING OF THE SECURITIES IS BEING MADE IN THE UNITED STATES.PROSPECTIVE INVESTORS SHOULD TAKE NOTE THAT ANY SECURITIES MAY NOT BE ACQUIRED BY INVESTORS USING ASSETS OF ANY RETIREMENT PLAN OR PENSION PLAN THAT IS SUBJECT TOPART 4 OF SUBTITLE B OF TITLE I OF THE UNITED STATES EMPLOYEE RETIREMENT INCOME SECURITY ACT OF 1974, AS AMENDED ("ERISA") OR SECTION 4975 OF THE UNITED STATES INTERNALREVENUE CODE OF 1986, AS AMENDED (THE "CODE"), ENTITIES WHOSE UNDERLYING ASSETS ARE CONSIDERED TO INCLUDE "PLAN ASSETS" OF ANY SUCH RETIREMENT PLAN OR PENSION PLAN,OR ANY GOVERNMENTAL PLAN, CHURCH PLAN, NON-U.S. PLAN OR OTHER INVESTOR SUBJECT TO ANY STATE, LOCAL, NON-U.S. OR OTHER LAWS OR REGULATIONS SIMILAR TO TITLE I OR ERISAOR SECTION 4975 OF THE CODE OR THAT WOULD HAVE THE EFFECT OF THE REGULATIONS ISSUED BY THE UNITED STATES DEPARTMENT OF LABOR SET FORTH AT 29 CFR SECTION 2510.3-101,AS MODIFIED BY SECTION 3(42) OF ERISA.THE MERITS OR SUITABILITY OF ANY SECURITIES MUST BE INDEPENDENTLY DETERMINED BY THE RECIPIENT ON THE BASIS OF ITS OWN INVESTIGATION AND EVALUATION OF NBPE, THEINVESTMENT MANAGER, AND NEUBERGER BERMAN. ANY SUCH DETERMINATION SHOULD INVOLVE, AMONG OTHER THINGS, AN ASSESSMENT OF THE LEGAL, TAX, ACCOUNTING, REGULATORY,FINANCIAL, CREDIT AND OTHER RELATED ASPECTS OF THE SECURITIES. RECIPIENTS OF THIS DOCUMENT AND THE PRESENTATION ARE RECOMMENDED TO SEEK THEIR OWN INDEPENDENTLEGAL, TAX, FINANCIAL AND OTHER ADVICE AND SHOULD RELY SOLELY ON THEIR OWN JUDGMENT, REVIEW AND ANALYSIS IN EVALUATING NBPE, THE INVESTMENT MANAGER, AND NEUBERGERBERMAN, AND THEIR BUSINESS AND AFFAIRS.THIS DOCUMENT AND THE PRESENTATION MAY CONTAIN CERTAIN FORWARD-LOOKING STATEMENTS. FORWARD-LOOKING STATEMENTS RELATE TO EXPECTATIONS, BELIEFS, PROJECTIONS,FUTURE PLANS AND STRATEGIES, ANTICIPATED EVENTS OR TRENDS AND SIMILAR EXPRESSIONS CONCERNING MATTERS THAT ARE NOT HISTORICAL FACTS. IN SOME CASES, FORWARD-LOOKING STATEMENTS CAN BE INDENTIFIED BY TERMS SUCH AS "ANTICIPATE", BELIEVE", "COULD", "ESTIMATE", "EXPECT", "INTEND", "MAY", "PLAN", "POTENTIAL", "SHOULD", "WILL", AND "WOULD",OR THE NEGATIVE OF THOSE TERMS OR OTHER COMPARABLE TERMINOLOGY. THE FORWARD-LOOKING STATEMENTS ARE BASED ON NBPE’S AND/OR NEUBERGER BERMAN'S BELIEFS,ASSUMPTIONS AND EXPECTATIONS OF FUTURE PERFORMANCE AND MARKET DEVELOPMENTS, TAKING INTO ACCOUNT ALL INFORMATION CURRENTLY AVAILABLE. THESE BELIEFS,ASSUMPTIONS, AND EXPECTATIONS CAN CHANGE AS A RESULT OF MANY POSSIBLE EVENTS OR FACTORS, NOT ALL OF WHICH ARE KNOWN OR ARE WITHIN NBPE’S OR NEUBERGER BERMAN’SCONTROL. IF A CHANGE OCCURS, NBPE’S BUSINESS, FINANCIAL CONDITION, LIQUIDITY AND RESULTS OF OPERATIONS MAY VARY MATERIALLY FROM THOSE EXPRESSED IN FORWARD-LOOKINGSTATEMENTS. SOME OF THE FACTORS THAT COULD CAUSE ACTUAL RESULTS TO VARY FROM THOSE EXPRESSED IN FORWARD-LOOKING STATEMENTS, INCLUDE, BUT ARE NOT LIMITED TO: THEFACTORS DESCRIBED IN THIS DOCUMENT AND THE PRESENTATION; THE RATE AT WHICH NBPE DEPLOYS ITS CAPITAL IN INVESTMENTS AND ACHIEVES EXPECTED RATES OF RETURN; NBPE’SAND THE INVESTMENT MANAGER’S ABILITY TO EXECUTE NBPE'S INVESTMENT STRATEGY, INCLUDING THROUGH THE IDENTIFICATION OF A SUFFICIENT NUMBER OF APPROPRIATE INVESTMENTS;THE CONTINUATION OF THE INVESTMENT MANAGER AS MANAGER OF NBPE'S INVESTMENTS, THE CONTINUED AFFILIATION WITH NEUBERGER BERMAN OF ITS KEY INVESTMENT PROFESSIONALS;NBPE’S FINANCIAL CONDITION AND LIQUIDITY; CHANGES IN THE VALUES OF OR RETURNS ON INVESTMENTS THAT THE NBPE MAKES; CHANGES IN FINANCIAL MARKETS, INTEREST RATES ORINDUSTRY, GENERAL ECONOMIC OR POLITICAL CONDITIONS; AND THE GENERAL VOLATILITY OF THE CAPITAL MARKETS AND THE MARKET PRICE OF NBPE’S SHARES.BY THEIR NATURE, FORWARD-LOOKING STATEMENTS INVOLVE KNOWN AND UNKNOWN RISKS AND UNCERTAINTIES BECAUSE THEY RELATE TO EVENTS, AND DEPEND ON CIRCUMSTANCES THATMAY OR MAY NOT OCCUR IN THE FUTURE. FORWARD-LOOKING STATEMENTS ARE NOT GUARANTEES OF FUTURE PERFORMANCE. ANY FORWARD-LOOKING STATEMENTS ARE ONLY MADE AS ATTHE DATE OF THIS DOCUMENT AND THE PRESENTATION, AND NEITHER NBPE NOR THE INVESTMENT MANAGER ASSUMES ANY OBLIGATION TO UPDATE FORWARD-LOOKING STATEMENTS SETFORTH IN THIS DOCUMENT WHETHER AS A RESULT OF NEW INFORMATION, FUTURE EVENTS, OR OTHERWISE, EXCEPT AS REQUIRED BY LAW OR OTHER APPLICABLE REGULATION. IN LIGHT OFTHESE RISKS, UNCERTAINTIES, AND ASSUMPTIONS, THE EVENTS DESCRIBED BY ANY SUCH FORWARD-LOOKING STATEMENTS MIGHT NOT OCCUR. NBPE QUALIFIES ANY AND ALL OF THEIRFORWARD-LOOKING STATEMENTS BY THESE CAUTIONARY FACTORS. PLEASE KEEP THIS CAUTIONARY NOTE IN MIND WHILE READING THIS DOCUMENT.
Continued
24

Legal Disclaimer
BY ATTENDING THE PRESENTATION TO WHICH THIS DOCUMENT RELATES YOU WILL BE DEEMED TO HAVE REPRESENTED, WARRANTED AND UNDERTAKEN FOR THEBENEFIT OF NBPE, THE INVESTMENT MANAGER, NEUBERGER BERMAN AND OTHERS THAT (A) YOU ARE OUTSIDE OF THE UNITED STATES AND ARE AN "INVESTMENTPROFESSIONAL" (AS DEFINED ABOVE), (B) YOU HAVE READ AND AGREE TO COMPLY WITH THE CONTENTS OF THIS NOTICE, YOU WILL KEEP THE INFORMATION IN THISDOCUMENT AND DELIVERED DURING ANY ACCOMPANYING DOCUMENT AND ALL INFORMATION ABOUT NEUBERGER BERMAN CONFIDENTIAL, AND WILL NOT REPRODUCEOR DISTRIBUTE, IN WHOLE OR IN PART, (DIRECTLY OR INDIRECTLY) ANY SUCH INFORMATION, UNTIL SUCH INFORMATION HAS BEEN MADE PUBLICLY AVAILABLE ANDTAKE ALL REASONABLE STEPS TO PRESERVE SUCH CONFIDENTIALITY, AND (C) YOU ARE PERMITTED, IN ACCORDANCE WITH APPLICABLE LAWS, TO RECEIVE SUCHINFORMATION.NBPE IS ESTABLISHED AS A CLOSED-END INVESTMENT COMPANY IN GUERNSEY AND IS REGISTERED WITH THE DUTCH AUTHORITY FOR THE FINANCIAL MARKETS AS ACOLLECTIVE INVESTMENT SCHEME WHICH MAY OFFER PARTICIPATIONS IN THE NETHERLANDS PURSUANT TO ARTICLE 2:66 OF THE FINANCIAL MARKETS SUPERVISIONACT (WET OP HET FINANCIEEL TOEZICHT). ALL INVESTMENTS ARE SUBJECT TO RISK. PAST PERFORMANCE IS NO GUARANTEE OF FUTURE RETURNS. PROSPECTIVEINVESTORS ARE ADVISED TO SEEK EXPERT LEGAL, FINANCIAL, TAX AND OTHER PROFESSIONAL ADVICE BEFORE MAKING ANY INVESTMENT DECISION. THE VALUE OFINVESTMENTS MAY FLUCTUATE. RESULTS ACHIEVED IN THE PAST ARE NO GUARANTEE OF FUTURE RESULTS.THIS DOCUMENT IS ISSUED BY NBPE WHOSE REGISTERED ADDRESS IS AT HERITAGE HALL, PO BOX 225, LE MARCHANT STREET, ST. PETER PORT, GUERNSEY GY1 4HY.NB ALTERNATIVES ADVISERS LLC IS A REGISTERED INVESTMENT ADVISER IN THE UNITED STATES. NEUBERGER BERMAN IS A REGISTERED TRADEMARK. ALL RIGHTSRESERVED. ©2012 NB ALTERNATIVES ADVISERS LLC.
Continued
25