nber working paper series the impact of ... working paper series the impact of teacher training on...
TRANSCRIPT

NBER WORKING PAPER SERIES
THE IMPACT OF TEACHER TRAINING ON STUDENT ACHIEVEMENT:
QUASI-EXPERIMENTAL EVIDENCE FROM SCHOOL REFORM EFFORTS IN CHICAGO
Brian A. Jacob
Lars Lefgren
Working Paper 8916
http://www.nber.org/papers/w8916
NATIONAL BUREAU OF ECONOMIC RESEARCH
1050 Massachusetts Avenue
Cambridge, MA 02138
April 2002
We would like to thank the Consortium on Chicago School Research and the Chicago Public Schools for
providing the data used in this study. We are grateful to Joshua Angrist, Mark Duggan, Michael Greenstone,
Steven Levitt, Brigitte Madrian, and seminar participants at the University of Chicago and BYU for helpful
suggestions. All remaining errors are our own. The views expressed herein are those of the authors and not
necessarily those of the National Bureau of Economic Research.
© 2002 by Brian A. Jacob and Lars Lefgren. All rights reserved. Short sections of text, not to exceed two
paragraphs, may be quoted without explicit permission provided that full credit, including © notice, is given
to the source.

The Impact of Teacher Training on Student Achievement:
Quasi-Experimental Evidence from School Reform Efforts in Chicago
Brian A. Jacob and Lars Lefgren
NBER Working Paper No. 8916
April 2002
JEL No. I21, I28, J24
ABSTRACT
While there is a substantial literature on the relationship between general teacher characteristics
and student learning, school districts and states often rely on in-service teacher training as a part of school
reform efforts. Recent school reform efforts in Chicago provide an opportunity to examine in-service
training using a quasi-experimental research design. In this paper, we use a regression discontinuity
strategy to estimate the effect of teacher training on the math and reading performance of elementary
students. We find that marginal increases in-service training have no statistically or academically
significant effect on either reading or math achievement, suggesting that modest investments in staff
development may not be sufficient to increase the achievement of elementary school children in high
poverty schools.
Brian A. Jacob Lars Lefgren
John F. Kennedy School of Government Department of Economics
Harvard University Brigham Young University
79 JFK Street 130 Faculty Office Building
Cambridge, MA 02138 Provo, UT 84602-2363
and NBER [email protected]
617-384-7968

1
I. Introduction
There is a substantial literature on the relationship between teacher characteristics and
student learning. Most prior research on this topic has focused on teachers’ educational
background, years of teaching experience and salaries. The results of this work are mixed.
While it is clear that certain teachers are more effective than others at increasing student
performance, there is considerably less consensus on whether specific, observable teacher
characteristics such as education or experience produce higher performance.1
While most research has focused on general skills, school districts and states often rely on
in-service staff development as a way to improve student learning. This on-the-job training seeks
to instruct teachers in content as well as pedagogy. Professional development is an extremely
widespread practice in U.S. Public Schools. Seventy-two percent of teachers report having
engaged in training related to the subject area of their main teaching assignment during the
previous 12 months (Parsad et. al. 2000). A similar fraction reports having received training on
how to implement new teaching methods. Despite the widespread nature of these activities, the
intensity of training is typically fairly low, with more than half of the teachers engaging in eight
hours or less of training in each of these areas per year. Unfortunately, most of the existing
research on in-service training suffers from the fact that the training is endogenously determined
by teachers and schools.
1 There is still considerable disagreement regarding the causal effect of educational expenditures on academic
achievement. Hanushek (1996) asserts that there is little evidence that increased educational expenditures can
systematically increase academic achievement. Hedges and Greenwald (1996) offer a different interpretation of the
evidence, claiming that although many individual studies find no significant effect, the average effect estimate is
positive. More recent experimental evidence suggests that at least one form of expenditure—reduced class size—
does have a substantial effect on student achievement (Krueger 1999). Using a quasi-random research design,

2
Recent school reforms in Chicago, however, provide an excellent opportunity to evaluate
the causal impact of teacher training on student performance. In 1996, the Chicago Public
School system (CPS) placed 71 of its 489 elementary schools on academic probation. These
probation schools received special funding for staff development as well as technical assistance
and enhanced monitoring. Eligibility for probation was determined on the basis of standardized
reading scores—schools in which fewer than 15 percent of students scored at or above national
norms in reading were subject to probation; those with 15 percent or more of students at national
norms were not subject to probation. The existence of strict cutoffs created a highly non-linear
relationship between a school’s reading achievement in 1996 and the likelihood that the school
was on probation in subsequent years. We exploit this discontinuity to identify the impact of
teacher training on student achievement.
Note that this strategy does not identify the aggregate effect of the school probation policy
since the accountability measures provided all low-achieving schools (both those who just
missed and just made the cutoff) an incentive to increase student performance because such low-
achieving schools that did not demonstrate improvement were subject to further sanctions.2
Rather, this strategy effectively identifies the impact of the resources provided to certain low-
achieving schools under the probation policy. Because the technical assistance and monitoring
resources provided to probation schools were quite small (see discussion below) and were
designed primarily to enhance teacher classroom performance (and thus might be considered a
component of teacher training), our discussion in this paper will focus on the impact of teacher
Guryan (2000) also finds that increases in school funding may have increased the performance of elementary school
students in Massachusetts. 2 Jacob (2002) finds evidence that the incentives provided by school probation, along with student-oriented
accountability measures, led to a substantial increase in math and reading achievement.

3
training with the understanding that it includes the effect of all of the resources provided to
schools under the probation policy.
Utilizing exogenous variation in probation status caused by the discontinuity described
above, we find that moderate increases in teacher training have no statistically or academically
significant effect on either reading or math achievement. These results do not vary across race,
gender, socio-economic background or student ability and are robust to a number of alternative
specifications. Our results suggest that modest investments in staff development may not be
sufficient to increase the achievement of elementary school children in high poverty schools.
The remainder of this paper is organized as follows. Section 2 reviews the literature on
teacher training and provides background on the Chicago probation policy. Section 3 describes
our data and Section 4 explains our empirical strategy. Section 5 presents findings on the
effectiveness of in-service training. Section 6 explores the policy effects in more detail,
examining the heterogeneity in effects across students and providing a series of robustness
checks for our results. Section 7 discusses some of the implications of these findings and
concludes.
II. Background
A. Prior Literature
Despite the importance of teacher training in most school districts, there is surprisingly
little evidence on the effect of teacher training on student achievement. Indeed, as Angrist and
Lavy (2001) pointed out, there seems to have been more research on the impact of teacher
training in developing countries than in developed countries. Early research on teacher training
presents a rather pessimistic view of the effectiveness of staff development for increasing student

4
performance. In a meta-analysis of 93 studies of the effect of teacher development on student
performance, Kennedy (1998) report that only 12 studies show positive effects of staff
development. Consistent with this finding, Corcoran (1995) and Little (1993) claim that
typically staff development is a low intensity affair that lacks continuity and accountability.
There are some notable exceptions to these findings however. Bressoux (1996), using a quasi-
experimental research design, and Dildy (1982), examining the results of a randomized trial, find
that teacher training increases student performance. Wiley and Yoon (1995) and Cohen and Hill
(2000) are others who find teacher development programs to have at least small impacts on
student performance.
One recent paper that finds particularly strong effects of teacher training is Angrist and
Lavy (2001). The authors use difference-in-difference and matching strategies to estimate the
causal effect of teacher training on student math and reading performance in Jerusalem
elementary schools. They find that teacher training increases student achievement by roughly
0.25 standard deviations. While this paper presents strong evidence regarding the potential
effectiveness of teacher training programs, several features of the intervention limit the
generalizability of the results. First, because the schools were not randomly assigned to
treatment, it is possible that the schools selected for the project were on an upward (or
downward) trajectory, which may bias the difference-in-difference estimates. Second, in
addition to funding teacher training, the Jerusalem intervention consisted of several other
components that might have increased student achievement, including the establishment of a
learning center to assist failing students after school and a project to support immigrant students
and their families. Finally, the training component of the program was highly structured and
directed specifically toward teaching a common curriculum.

5
B. Background on School Reform in Chicago
The CPS is the nation’s third-largest school district, serving over 430,000 largely low-
income students. In the late eighties, then Secretary of Education William Bennett described
Chicago public schools as the worst in the nation. In 1996, the CPS introduced a highly
publicized reform effort that emphasized holding students, teachers and administrators
accountable for academic achievement.
Under the Chicago policy, schools in which fewer than 15 percent of students met
national norms on standardized reading exams were placed on academic probation.3 While
several schools received waivers, 71 elementary schools serving over 45,000 students were
placed on academic probation in the first year of the program.4 To improve student achievement
in these schools, the CPS provided probation schools additional resources to buy staff
development services from an external organization of their choice. In 1998-99, probation
schools were working with 17 different external partners, including universities, non-profit
organizations and independent consultants. During the first year a school was on probation, the
CPS paid 100 percent of the costs of the external partner (up to $90,000). In the second year, the
3 The Chicago reform also included a student accountability policy in which students in third, sixth and eighth grade
were required to meet minimum achievement levels in reading and math in order to move to the next grade. For
more details on the student accountability policy and its impact on student outcomes, see Jacob (2002) and Jacob and
Lefgren (2001). 4 Probation schools that do not exhibit sufficient improvement may be reconstituted, which involves the dismissal or
reassignment of teachers and school administrators. It appears that this was “cheap talk” as no elementary schools
were ever reconstituted. Additionally, teacher surveys suggest that the teachers did not perceive reconstitution as a
threat. In the early years of the program, in order to move off of probation, at least 20 percent of students in the
school had to meet national norms in reading. In 2000, the standard was raised so that schools with fewer than 20
percent of students at national norms in reading were subject to probation and all schools needed to meet a 25
percent standard to move off of probation. In 1997-98, eight elementary schools were removed from probation
because of achievement gains, but 13 additional schools were placed on probation. By 1998-99, only 54 elementary
schools were on probation.

6
reimbursement dropped to 50 percent. After two years, the Board paid one-third of the cost of
external partners.
In addition to these direct resources, the CPS provided probation schools with technical
assistance and monitored the progress of the school. The Office of Accountability (OA) assigned
each probation school a probation manager, generally a high-level school administrator with
experience as a principal, whose job was to help school staff to develop and implement a school
improvement plan. Elementary schools on probation were also assigned a business manager
intern to manage the operational and financial aspects of the school, freeing the principal to
address educational issues and to assist the external partners in staff development.
Table 1 presents information regarding the effect of probation on teacher development
(see Smylie et al. 2001 for a more detailed discussion of professional development in the CPS).5
The first two columns show that in 1994, teachers in schools that would be placed on probation
in 1997 participated in school sponsored professional development at about the same rate as
other teachers. In 1997 and 1999, teachers in probation schools were participating at
substantially higher levels than their colleagues. In 1997, probation teachers attended an average
of 3.4 professional development activities each month compared to only 2.6 activities for other
teachers.6 The increase is reflected in activities sponsored by the school, teacher networks,
outside partners, and the CPS. The differences in 1999 are somewhat less dramatic, which may
be explained by the fact that some schools on probation in 1997 were taken off probation while
5 The data used for table come from surveys conducted by the Consortium on Chicago School Research. These
surveys were administered in 1994, 1997, and 1999 to all CPS teachers and asked a number of questions regarding
the teachers’ work environment—including the extent and nature of professional development activities. We thank
the Consortium for making these data available. 6 The data report participation during the past school year using ranges of values (e.g. 3-5 times in the last year). To
calculate average participation we assume that teacher participation was in the midpoint of the range. We further
assume teachers in the highest category attended 12 activities during the school year. We divide the number of

7
other schools were placed on probation. This evidence suggests that probation increased the
frequency of professional development activities by about 25 percent in the first year. Teachers
in probation schools also believed that the quality of teacher training activities improved under
probation (see Smylie et al. 2001). Finally, it is possible that teachers in probation schools
received additional informal advice from probation partners.
It is also useful to put the magnitude of probation expenditures into perspective.
Unfortunately, school-level records of professional development expenditures are not available.
In addition, a significant fraction of the resources spent on teacher development efforts would not
appear in a school’s budget, including the time of principals and district administrators used to
coordinate development programs and monitor teachers. Despite these challenges, it is useful to
perform some back of the envelope calculations to put the magnitude of the probation policy into
perspective.
Smylie et al. (2001) report that the CPS budgeted $75 million for professional
development in the 1997-1998 school year. This represented about 2.5 percent of the district’s
total expenditures. If teacher development expenditures were divided equally among grades (first
to twelfth), then approximately $50 million would have been spent on elementary schools and
average expenditures per elementary school would have been about $108,000. If we use this as a
rough baseline for professional development expenditures, the additional financial resources that
were available under the probation policy seem substantial.
reported activities by 6 (the number of months school had been in session at the time of the survey) to obtain
monthly participation.

8
III. Data
This study utilizes administrative data from the Chicago Public School system. Student
records provide detailed demographic and educational background data on individual students for
each academic year, including prior achievement scores, previous school and residential
mobility, birth date, race, gender, family composition, free lunch status, and special education
and bilingual services received. School records provide average demographic data at the school
level, including percent low-income, average daily attendance, and school mean test scores. The
primary outcome measures we use are math and reading scores on the Iowa Test of Basic Skills
(ITBS), a multiple-choice exam that CPS students take annually in grades two to eight. The
ITBS is measured in terms of grade equivalents (GEs), which reflect the years and months of
learning that a student has mastered. For example, a student at national norms in sixth grade will
score 6.8 GEs, which means the student has mastered material up to the eighth month of sixth
grade.
The baseline sample for this study consists of the cohort of third through sixth grade
students who were enrolled in a Chicago elementary school in the Fall of 1996 (n=131,314). We
limit the sample to students in these grades because we measure performance gains over three
years and ITBS scores are not available for students beyond eighth grade. We delete 198
students who attended a special needs school in the Fall of 1996 and 3,981 students (three
percent) who are missing student or school demographic data, which leaves us with a sample of
127,135 students in 461 different schools.7
7 26,907 of these students did not take the ITBS exam in the Spring of 1996. Most of the students with missing test
scores were third graders in the Fall of 1996 because not all schools tested second grade students at this time. In
order to avoid dropping these students, we set the missing 1996 test scores to zero and include a binary variable to
indicate that the test score was missing. As a check, we have done the analysis excluding students with missing 1996
test scores and obtained virtually identical results.

9
Table 2 presents summary statistics on this sample. Roughly 20 percent of students
attended a school on probation at some point between 1997-99 and these students spent an
average of 1.9 years in a school on probation. As one would expect, probation schools served the
most disadvantaged students in the CPS. Students who spent at least one year in a probation
school scored roughly six to seven months beyond their peers in math and reading in 1996. Over
95 percent of students who attended a probation school received free lunch compared with 75
percent of students who did not attend a probation school and students in probation schools were
nearly twice as likely to be living in a foster home in Fall 1996. Hispanic students were
substantially less likely to attend a probation school than Black students—on average 12 percent
of students attending probation schools were Hispanic compared with 25 percent of the CPS
whereas nearly 87 percent of students attending probation schools were Black compared with
only 60 percent in the CPS. Similarly, students in probation schools experienced school level
mobility, truancy, and low-income rates considerably higher than peers in non-probation schools.
IV. Empirical Strategy
Teacher training is one of many factors that may influence student learning. The
relationship between inputs such as teacher training and learning outcomes can be captured in the
following education production function:
(1) ( )isissisis
uZXTrainingY ενβ +++Γ+Β+=1
,
where Y is the outcome, Training indicates whether a student’s teachers received in-service
training, X is a vector of student demographic and past performance variables, Z is a vector of
other teacher and school characteristics, u represents the effect of unobserved school quality, ν

10
is unobserved student ability, ε is an error term, and the i and s subscripts identify the individual
and school respectively.
The difficulty in estimating the causal impact of Training is that teachers and schools
may select, or be selected, into training on the basis of characteristics that are unobservable to the
researcher. In the case of teacher training, it is difficult to even sign the direction of the potential
bias. On one hand, as Lavy (1995) and others have noted, there is often a negative correlation
between school inputs and pupil achievement because measures of socioeconomic disadvantage
are used to decide which schools get the most inputs. In this case, it is likely that
( ) 0, <s
uTrainingCov , which will bias the estimate of 1
β downward. On the other hand, to the
extent that teacher training is often a voluntary activity determined by the teachers and
administrators in a particular school, it is possible that the most motivated teachers and schools
seek training so that ( ) 0, >s
uTrainingCov , which will tend to bias 1
β upward.
The recent school reform efforts in Chicago, however, provide a unique opportunity to
identify the causal impact of teacher training on student achievement. The strict test score cutoff
for probation generated a highly non-linear relationship between school reading performance in
1996 and the average number of years a student spent in a school on probation between 1997 and
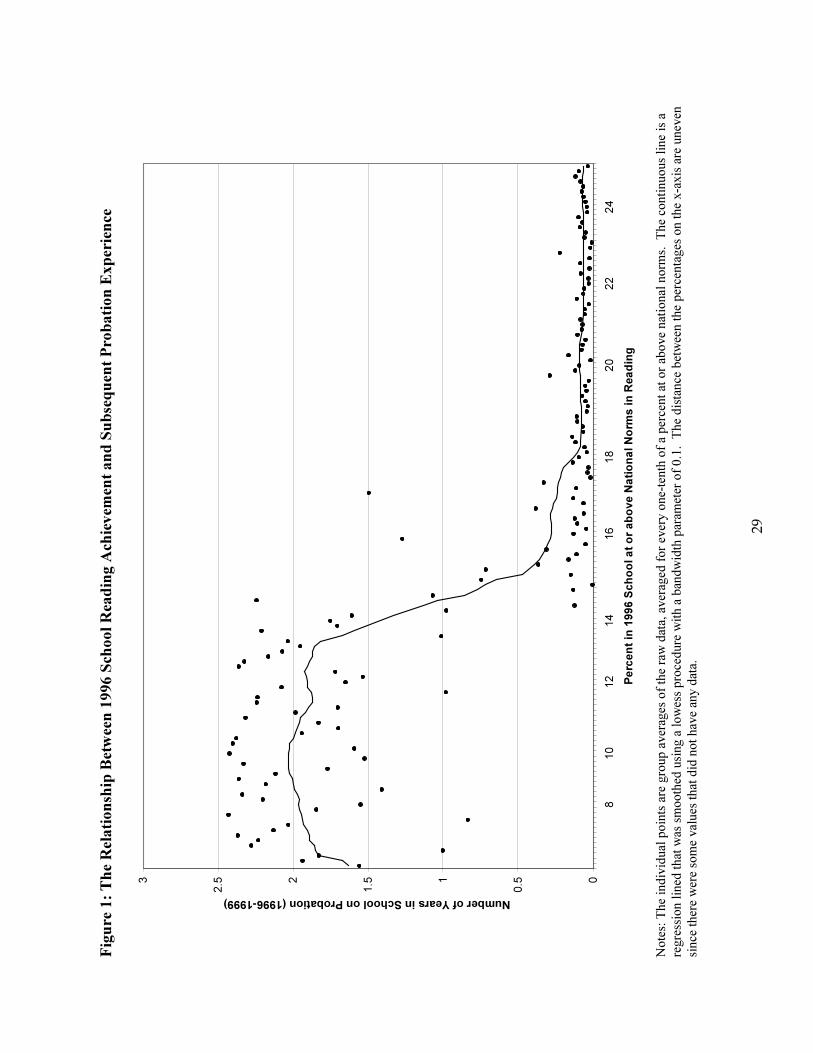
1999. Figure 1 illustrates the relationship between the percent of students meeting national
norms in a student’s 1996 school and the number of years between 1996 and 1999 that the
student attended a school on probation. We can see that students enrolled in schools where 13
percent of students met national norms in 1996 attended schools on probation for an average of
two years over this period. In contrast, students in schools where 15 percent of students met
national norms in 1996 attended schools on probation for only 0.30 years on average over the
same period.

11
This discontinuity provides a way to estimate the effect of teacher training on student
achievement. Assuming that unobservable characteristics do not vary discontinuously around the
cutoff, the probation decision rule essentially replicates random assignment of training to schools
around the cutoff. One can thus identify the treatment effect by simply comparing students in
schools on either side of the cutoff. For example, if students in schools that just missed the
cutoff (and were thus likely to be placed on probation and have access to the additional teacher
training resources) learned much more than students in schools that just made the cutoff (and
thus avoided probation), then one might conclude that the staff development and technical
assistance associated with probation has a positive impact.
This strategy is often referred to as a regression discontinuity design.8 If there is a perfect
relationship9 between 1996 school reading achievement and the number of years a student spends
in a school on probation, then a properly specified OLS model that included a dummy variable
indicating whether the student was in a school below the cutoff in 1996 would provide unbiased
estimates of the training effect. However, there are several reasons that the relationship between
years in a probation school and 1996 school reading achievement is not perfect. First, several
schools that scored below the probation cutoff were waived from the policy (e.g., 15 of the 77
elementary schools that scored below the cutoff in 1996 received waivers). Second, 25 schools
that were placed on probation in 1996-97 raised achievement enough to be removed from
8 This type of regression discontinuity analysis was pioneered in educational evaluation research. In one of the first
papers to introduce this design, Thistlethwaite and Campbell (1960) utilized the fact that National Merit Awards are
given on the basis of whether a test score exceeds a threshold to estimate the effect of the award on a student’s other
scholarship receipt and college aspirations. This strategy was used widely in evaluations of compensatory education
programs mandated under Title I (Trochim, 1984) as well as other contexts. Other studies to use this design include
Berk and Rauma (1983), Angrist and Lavy (1999), Black (1999), Hahn et al. (1999), Jacob and Lefgren (2001) and
Guryon (2001). 9 By perfect relationship, we mean that the treatment is completely determined by observed performance. In this
case, treatment is necessarily orthogonal to any unobserved characteristics. Thus, after controlling appropriately for

12
probation in the next two years. Conversely, 16 schools that missed the probation cutoff in the
first year were placed on probation in the following two years. Finally, there was substantial
student mobility. Many students moved between probation and non-probation schools during
this period.
To account for the “fuzzy” discontinuity, we utilize an instrumental variables strategy. In
the first stage, we predict the number of years a student will spend in a school on probation as a
function of observable student demographics and prior achievement as well as the mean reading
achievement in the student’s school in 1996. Specifically, the first stage equation takes the
following form:
(2) ( ) ( ) ( )siisissssis
uXZNormsNormsNormsTraining ,5411
15
3
1514
2
140
1 ηνγγγγγ +++Β+Γ+++= +−−
where Z and X are defined as previously indicated. The variables labeled Norms capture the non-
linear relationship observed in Figure 1. The superscripts over the Norms variables indicate the
use of a spline. For example, a student in a school with 16 percent of the students at or above
national norms would have a value of 14 for 140−Norms , a value of 1 for 1514−
Norms , and a value
of 1 for +15Norms . We then estimate the 1999 achievement in a two-stage least squares
framework using the predicted value of the years in a probation school.
Because we know the nature of the non-linearity between school reading performance and
years in a probation school ex-ante, the functional form of the selection equation provides
convincing exclusion restrictions necessary for IV estimation. However, our approach does rely
on several assumptions. Most importantly, we must assume that unobserved characteristics
performance, the OLS estimates should be unbiased because the treatment is orthogonal to the error term.
Furthermore, IV and OLS estimates will be the same because the treatment is perfectly predicted in the first stage.

13
and/or effort vary continuously with the measured performance around the cutoff.10 This may
not be true in cases where participants have precise control over their performance, particularly
near the margin of interest, or in cases in which failing to achieve a cutoff is associated with
additional consequences not directly related to the treatment in question.
One such concern in our case is that teachers or school administrators may attempt to
influence student scores on the margin. For example, a school that knows it is in danger of
probation may attempt to influence testing to get on probation (and thus get the associated
resources) or get off probation (to avoid potential sanctions). While Jacob and Levitt (2002)
identify cases in which Chicago teachers may have improperly assisted students on exams, this
behavior appears limited to a relatively small number of classrooms and is thus unlikely to affect
our results.
Another concern is student mobility. Since prior research indicates that student mobility
rates are generally higher in lower achieving schools (see Kerbow, 1996; Hanushek, Kain, and
Rivikin 2001), we expect to find higher mobility rates among probation schools in comparison to
non-probation schools. While high mobility in itself is not problematic, if probation causes high-
achieving or motivated students to leave the CPS our estimates may be biased.11 Using the
regression discontinuity design above, we are able to examine whether probation status itself
caused certain students to leave the school or the CPS. As we show in the next section, it
10 Actually, it is sufficient that the unobserved characteristics do not vary discontinuously in the same fashion as the
treatment. 11 If probation simply causes students to change schools within the CPS, our estimates will not be biased but the
interpretation of the IV estimates may change. See Imbens and Angrist (1994) and Heckman and Vytlacil (2001) for
a more detailed discussion of these issues.

14
appears that probation did not induce student mobility, which reinforces the validity of the
achievement estimates.12
The other important assumption in our analysis involves the functional form of the
relationship between current school achievement and future student achievement. Our
instruments in equation (2) are nonlinear functions of school-level achievement. If the true
relationship between school mean achievement and future student performance is non-linear for
the range of values we examine, the estimated treatment effect could reflect underlying non-
linearity in the achievement relationship.
While this concern is mitigated to some extent since we examine schools within a limited
range around the probation cutoff, we nonetheless examine whether it is a serious concern in this
study. First, we estimate models that allow for school mean achievement in 1996 to influence
future student performance in a non-linear fashion by including second and third order
polynomials in equations (1) and (2). Second, we include a cohort of students who were enrolled
in third to sixth grade in 1993, prior to the introduction of the Chicago school accountability
reforms. This allows us to control for the nonlinear function of school achievement that we use
as instruments in our baseline specification. For this specification, we obtain instruments by
interacting the spline of school reading achievement with a dummy that takes a value of one if
the probation policy was in effect. If the relationship between school and student achievement is
stable over time, this procedure will guarantee that our findings are not driven by non-linearity in
the effect of school reading performance on student performance. In the next section, we show
that this does not change our results.
12 Because the probation policy was not commonly known until the beginning of the 1996-1997 school year, it seems
unlikely that students would have shifted schools before this point.

15
IV. Results
A. Main Findings
Under the assumptions described above, if teacher training has a substantial impact on
academic achievement, we would expect to see a rapid change in the average achievement level
around the probation cutoff. Figure 2 provides a way to visually identify the treatment effect.
The heavy solid line shows the average number of years the student attended a school on
probation between 1996-97 and 1998-99. The other lines show the average 1999 reading (solid
line) and math (broken line) achievement respectively. If the teacher training associated with
probation were beneficial, we would expect to see a drop in performance as school reading
performance neared and surpassed the cutoff.
As expected, we see that 1999 student achievement increases as a function of 1996 school
mean achievement. However, the lines are relatively jagged, reflecting the fact that there are a
limited number of schools at each level of school performance. The dark vertical lines at 13 and
16 percent bound the marginal area, where there is a sharp decline in the treatment. Average
1999 achievement increases steadily over this range, but does not appear to change
discontinuously in reading or math, particularly in comparison to other jagged areas of the graph
(e.g., 18-20 percent, 11-13 percent). This suggests that the teacher training in Chicago did not
have a substantial impact on student achievement.
Using the instrumental variables strategy described above, we can quantify our estimates
of the treatment effect. In the baseline specifications, we limit our sample to students in low-
performing schools where between 5 and 25 percent of students met national norms in 1996. We
do so because the assumption of linearity between school reading achievement and student
performance is most plausible in this narrower ranges of the data. Additionally, by focusing on a

16
narrow range around the cutoff, schools and students that receive treatment are likely to be
comparable to their untreated counterparts. We later show that the results are robust to changes
in the sample and model specification.
Table 3 presents the results of the first stage estimation. The dependent variable is the
number of years a student attended a school on probation between the 1996-1997 and 1998-1999
school years (ranging from zero to three). Note that all of the coefficients have the expected
signs and the instruments are highly predictive.
Table 4 presents the OLS and IV estimates. The OLS estimate in column 1 of –0.098
indicates that one additional year in a school on probation is associated with a decrease of
roughly one month of learning (0.10 GEs) in reading and math. However, we know from Table
2 that probation schools served a significantly more disadvantaged student population than other
schools. When we control for a variety of observable student and school characteristics, our
estimates drop to one-fifth of this size, although they remain negative and significant.
Columns three to six present the IV estimates. All of these estimates suggest that
probation has no economically or statistically important effect on reading and math achievement.
The coefficient with the largest absolute magnitude, -0.026, corresponds to roughly a 0.01
standard deviation effect. Note that the standard errors on the IV estimates in column six are
roughly 0.025, meaning that we could detect a positive significant result as small as 0.05 GEs.
Considering that the average elementary student during this period gained roughly 0.90 GEs per
year and the standard deviation of 1999 achievement scores in our sample was roughly 1.9 GEs,

17
it does not appear that the teacher training and/or technical assistance provided to probation
schools had any meaningful effect.13
In addition, note that the results from columns four to six show that our IV results are not
sensitive to the inclusion of control variables. This suggests that after controlling for school
reading performance, students in schools just above and below the cutoff have comparable
observable characteristics. This lends more credence to the assumption that the unobserved
characteristics of students in schools just above and below the cutoff are comparable as well.
Finally, we see that there is no significant difference between the OLS and IV results presented in
columns four and six. This suggests that, conditional on the set of student and school controls
included in the models, probation waivers were not distributed on the basis of unobservable
characteristics.
B. Other Effects of Probation
As was mentioned previously, probation might influence student mobility and test-taking
patterns. In particular, motivated families may want to remove their children from probation
schools and probation schools may want to avoid testing the lowest ability children. Using the
IV methodology described above, we examine the causal impact of being in a probation school in
1996-97 on the probability that a student changes schools, leaves the CPS, or fails to have an
included test score. These results are found in Table 5.
13 This strategy identifies the net effect of attending a school on probation compared to a school that just missed
being placed on probation. In addition to the teacher training and technical assistance, probation schools may have
experienced somewhat different incentives than those schools that just missed the cutoff for probation. Because
schools that just missed being placed on probation in 1996 were at risk of being placed on probation in subsequent
years, they too had an incentive to increase student performance. However, to the extent that schools that were
placed on probation in 1996 were one step closer to actual sanctions, they may have had even greater incentives to
increase achievement. Note that these three mechanisms—teacher training, technical assistance and differential
incentives—all operate in the same direction, suggesting that students in schools placed on probation in 1996 should
outperform students in schools who narrowly avoided probation that year.

18
The first row suggests that being in a probation school in 1997 has no significant effect
on the probability of being enrolled in the CPS in 1999. Because there are few high achieving
students in probation schools it is difficult to ascertain whether probation has a differential effect
on the enrollment decisions of high ability students.
In the second row, we see that probation appears to increase the probability that a student
changes schools by 1999. Furthermore, the point estimates are not trivial relative to the baseline
mobility of 24 percent, particularly among the top ability quartile. Despite this, the coefficients
are not significantly different from zero. The standard errors are particularly large for the high
ability students. Taken at face value, however, the point estimates suggest that probation may
have induced high ability students to change schools.
Finally, it does not appear that being in a probation school is associated with changes in
the probability that a previously tested student has test scores is included for evaluation. This
holds even for students who are in the bottom of national reading distribution. This suggests that
being put on probation does not cause administrators to discourage low ability students from
being tested or from having the test scores counted for school evaluation. Overall, probation may
affect student decision regarding school attendance within the CPS. However, there is no
evidence that being in a probation school in 1997 causes students to leave the district, avoid
testing, or have their scores excluded for evaluation purposes.
Because students who change schools but remain in the district are retained in our
sample, there is no reason to believe our point estimates are biased by differential attrition of
high and low ability students. This is true because although the treatment is at the school level,
we are examining student level outcomes and are not attributing average school level changes in
performance due to student migration to the probation policy. To see this, consider the situation

19
in which high ability students leave probation schools and move to non-probation schools within
the CPS. If high ability students leave probation schools, then the difference in outcomes
between students who initially attended schools below and above the cutoff will be lower than
otherwise. However, the difference in treatment will be lower as well. Since the IV estimates
essentially scale the difference in outcomes by the difference in treatment, the IV treatment effect
estimate will not be biased. However, because our instruments will induce more variation in the
treatment of low ability students than high ability students, the estimated treatment effect will
reflect disproportionately the experience of low ability students. In this way migration simply
changes the Local Average Treatment Effect (LATE) interpretation of our results. Insofar as the
probation policy and teacher training resources were primarily aimed at improving performance
of low-ability students, the IV estimates provide quite important and useful information.
C. Heterogeneous Effects and Robustness Checks
Table 6 examines the heterogeneity of effects by student age, ability, and other
demographic characteristics. Each row corresponds to a separate regression that includes only
students in the subgroup listed. The cells contain IV estimates of the effect of the number of
years in a probation school on 1999 achievement. The top panel shows that probation has no
effect on student performance in any grade from third to sixth in either reading or math. The
second panel shows separate effects for students at different points in the ability distribution in
Spring 1996. Because probation is determined by the percent of students who score above the
50th percentile, the policy creates an incentive for schools to focus attention on students near this
point, since they are more likely to meet this standard with sufficient support. However, we see
that probation does not appear to have any larger effect on students in the second and third

20
quartiles than on students at the extremes of the ability distribution. The third panel shows no
difference in impact across race, gender, or SES.
Table 7 displays results from a number of alternative specifications. The first row
presents the original estimates from Table 3 as a basis for comparison. In the second row, we
include students from all schools—regardless of the average school reading performance in
1996—which should increase the efficiency of our estimates. Once again we find probation to
have no significant effect on reading and math achievement. When we include third order
polynomials of school performance in the third row, we find that our results do not significantly
differ from the case in which we assume linearity. In rows four to six, we include a cohort of
students from 1993, prior to the introduction of the school reforms. While no students or schools
in this cohort received the treatment, we can use these data to make certain our findings are not
driven by non-linearity in the relationship between school reading performance and student
achievement. The instruments in these models are the interaction between the splines of school
reading performance and cohort. We see that the estimates do not change for either reading or
mathematics.
Many of the schools that scored just above the probation cutoff, or were waived from
probation, were placed on remediation. These schools did not receive the same close monitoring
or financial support as probation schools, but they were subject to somewhat heightened
oversight. To check whether this heightened oversight may have impacted achievement, row
seven examines whether being in a school on probation or remediation has any effect on
academic achievement.14 We find no effect.
14 For this specification, our instrument is a single dummy variable indicating whether 15 percent or more students in
a school performed at or above national norms in reading in 1996, rather than the spline in 1996 reading achievement
that is used in the baseline specification. We do so because the discontinuity between 1996 school mean reading

21
Even after schools were taken off probation, they were required to maintain a relationship
with their external partner for an additional year. Also, some low performing schools that were
not placed on probation chose to hire an external partner even though it was not officially
required. To test whether the presence of an external partner, rather than simply being on
probation, influenced achievement levels in low-achieving elementary schools, row eight of
Table 7 shows the estimated effect of being in a school with an external partner. This effect is
not statistically different from zero.15
One might argue that the monitoring and staff development that probation schools receive
should not have an observable impact on student achievement for several years. The final two
rows in Table 7 explore this possibility. In row 9, we examine the effect of probation on students
who remained in the same school between 1996 and 1999. Thus, in this sample, the students in
probation schools received three full years of treatment. If one believes that probation has a
greater impact for students who spend an extended period in the school, then these estimates
should be larger than the original estimates. However, it appears that even these students
received no significant benefit from being in a school on probation. It is possible that reforms
instituted by the external partners and probation managers took a year or two to become
effective, in which case one would not expect any impacts until the 1998-99 school year. By
examining the three-year period, we will observe a small, diluted effect. To explore this
possibility, row 10 shows the effect of probation on 1998-99 gains, but still finds no effect.
Finally, row 11 shows the effect of probation on 1998-99 gains for the sub-sample of students
achievement and the average years in a school on probation or remediation is extremely sharp at the official
probation cutoff of 15 percent, in contrast to the baseline specification that uses years on probation alone. 15 Once again, our instrument is a single dummy variable that indicates whether at least 15 percent of students in a
school performed at or above national norms in reading in 1996.

22
who remained in the same school between 1996 and 1999. The point estimates are not
statistically different than zero.
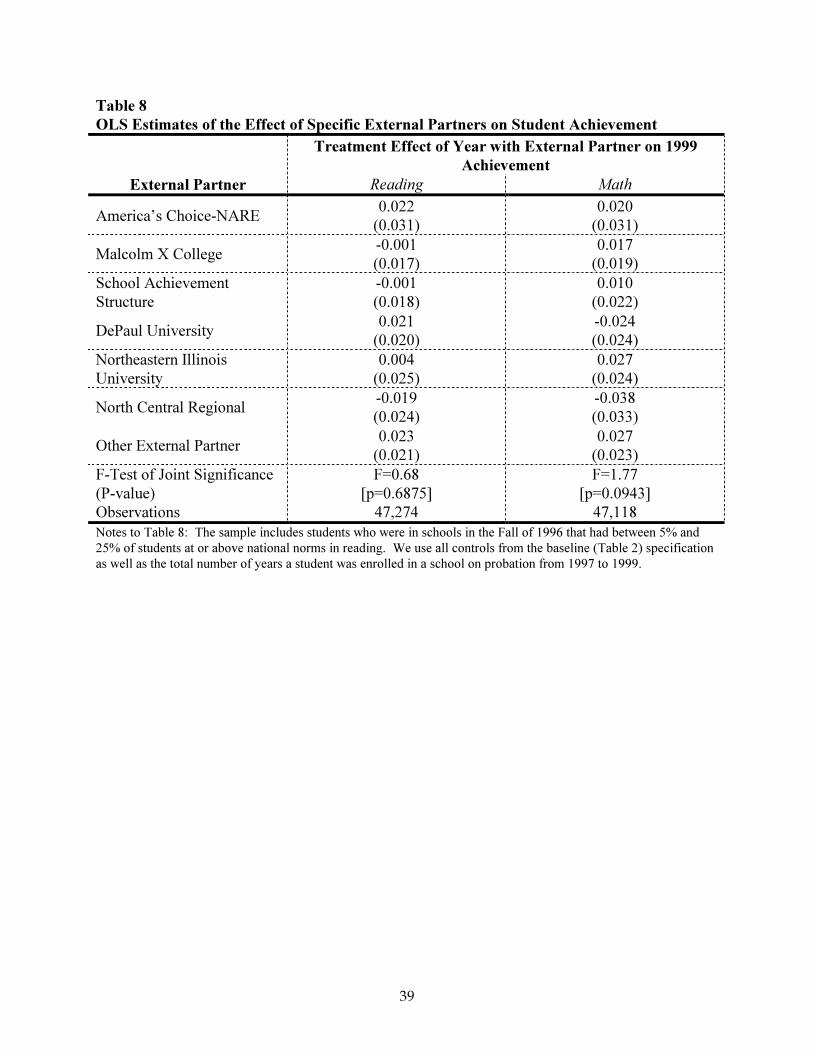
A wide variety of non-profit organizations and universities worked with probation
schools in order to improve student achievement. These external partners varied considerably in
their institutional affiliation (e.g., universities versus private organizations), programmatic focus
(e.g., school organization versus staff training versus curriculum development) and educational
philosophy (e.g., whole-language versus direct instruction). It is possible that some external
partners were more effective than others, which might explain the weak aggregate effects that we
find. Note, however, that the zero net effect implies that if some external partners increased
student performance then others must have decreased student achievement levels. Table 8
examines the probation effects for several of the largest external partners. Because schools were
largely free to select their external partner, these estimates cannot be interpreted as causal effects,
although they may still provide some insight. Nonetheless, it does not appear that any of the
major external partners had a significant impact on student achievement in the probation schools.
V. Conclusions
In an effort to improve student achievement in Chicago in the mid-nineties, the CPS
placed nearly 20 percent of the lowest achieving elementary schools in the city on probation.
The financial and technical support provided to probation schools was dedicated specifically to
improving classroom instruction, primarily through teacher training and staff development.
Indeed, teachers in probation schools reported moderate increases in the frequency with which
they attended professional development activities as well as more substantial increases in the
quality of the professional development they received.

23
The preceding analysis, however, indicates that the training provided to teachers in
probation schools had no discernable effect on student achievement. These results are robust to a
variety of alternative specifications and do not differ across student ability, gender, race, or
family income. While consistent with much of the earlier research on teacher training in the
United States, these findings are in stark contrast to the recent work of Angrist and Lavy (2001),
who found that teacher training in Jerusalem schools yielded large dividends in terms of student
performance.
While it may not be surprising that different programs in different settings have different
effects, it is useful to examine some of the possible explanations for the discrepancies in order to
better understand how the results from each study might be generalized. Several differences
stand out between the Chicago and Jerusalem programs. First, the Chicago program was
implemented in a group of extremely high-poverty, low-achieving schools. In contrast, the
program in Jerusalem took place in mostly middle to lower-middle class neighborhoods, which
included a combination of some upper middle class schools attended by children of Hebrew
University faculty as well as some poorer schools attended by immigrants (Angrist 2001).
Second, the training provided in the Jerusalem schools was highly structured and closely aligned
with the school curriculum whereas the training in Chicago was relatively unstructured and less
well aligned. Finally, the training in Jerusalem was complemented by direct services to students
in the form of after school learning centers and other programs for immigrant families.
In this light, one might interpret the findings of these two studies as showing that teacher
training can have a significant, positive impact on student achievement under generally favorable
conditions, but that such benefits depend on the context and quality of the program.
Unfortunately, national data suggest that the frequency and nature of professional development

24
activities in Chicago is comparable to other school districts in this country (Parsad et. al. 2001).
Thus, our findings suggest that moderate increases in the intensity of the professional
development efforts along the lines of the Chicago program will likely fail to improve the
achievement of students in failing schools.

25
References
Angrist, J. D. and V. Lavy (1999). “Using Maimonides Rule to Estimate the Effect of Class Size
on Scholastic Achievement.” Quarterly Journal of Economics 114(2): 535-75.
Angrist, J. D. and V. Lavy (2001). “Does Teacher Training Affect Pupil Learning? Evidence
from Matched Comparisons in Jerusalem Public Schools.” Journal of Labor Economics
19(2): 343-369.
Angrist, J.D. (2001). Personal communication.
Berk, R. A. and D. Rauma (1983). “Capitalizing on Nonrandom Assignment to Treatments: A
Regression-Discontinuity Evaluation of a Crime-Control Program.” Journal of the
American Statistical Association 78(381): 21-28.
Black, S. (1996). Do Better Schools Matter? Parents Think So! Cambridge, MA.
Bressoux, P. (1996) “The Effect of Teachers’ Training of Pupils’ Achievement: The Case of
Elementary Schools in France.” School Effectiveness and School Improvement 7 (3):
252-279.
Cohen, D. F. and H. C. Hill (2000). “Instructional Policy and Classroom Performance: The
Mathematics Reform in California.” Teachers College Record 102(2): 294-343.
Corcoran, T. B. (1995). “Helping Teachers Teach Well: Transforming Professional
Development.” CPRE Policy Briefs.
Dildy, P. (1982) “Improving Student Achievement by Appropriate Teacher In-Service Training:
Utilizing Program for Effective Teaching (PET).” Education 102 (2): 132-138.
Guryan, J. (2000) "Does Money Matter? Regression Discontinuity Estimates from Education
Finance Reform in Massachusetts.” University of Chicago Working Paper.

26
Hanushek, E. A. (1996). “School Resources and Student Performance.” In Does Money Matter?
The Effect of School Resources on Student Achievement and Adult Success, ed. Burtless,
G. Washington D.C.: Brookings Institution Press.
Hanushek, E. A., J. F. Kain, and S. G. Rivkin (2001) “Disruption versus Tiebout Improvement:
The Costs and Benefits of Switching Schools.” Working Paper.
Hedges, L. V. and R. Greenwald (1996). “Have Times Changed? The Relation between School
Resources and Student Performance.” In Does Money Matter? The Effect of School
Resources on Student Achievement and Adult Success, ed. Burtless, G. Washington
D.C.: Brookings Institution Press.
Imbens, G. W. and J. D. Angrist (1994). “Identification and Estimation of Local Average
Treatment Effects.” Econometrica 62(2): 467-475.
Jacob, B. A. (2002). “Accountability, Incentives and Behavior: Evidence from High-Stakes
Testing in Chicago.” Working Paper.
Jacob, B. A. and S. D. Levitt (2002). “Rotten Apples: An Investigation of the Prevalence and
Predictors of Teacher Cheating.” Working Paper.
Jacob, B. A. and L. Lefgren (2001). “Remedial Education and Student Achievement: Quasi-
Experimental Evidence from Reform Efforts in Chicago.” Working Paper.
Hahn, J., P. Todd, et al. (1999). Evaluating the Effect of an Antidiscrimination Law Using a
Regression-Discontinuity Design. NBER Working Paper #7131. Cambridge, MA.
Heckman, J. And E. Vytlacil (2001) “Local Instrumental Variables.” In Nonlinear Statistical
Inference: Essays in Honor of Takeshi Amemiya, ed. C. Hsiao, K. Morimune, and J.
Powell, Cambridge University Press, Cambridge.

27
Kennedy, M. M. (1998). “Form and Substance in Inservice Teacher Education.” Research Report
from the National Institute for Science Education, University of Wisconsin.
Kerbow, D. (1996). “Patterns of Urban Student Mobility and Local School Reform.” Journal of
Education for Students Placed at Risk 1 2:147-169.
Ladd, H. F. (1999). “The Dallas School Accountability and Incentive Program: An Evaluation of
its Impacts on Student Outcomes.” Economics of Education Review 18: 1-16.
Lavy, V. (1995) “Endogenous School Resources and Cognitive Achievement in Primary Schools
in Israel.” Discussion Paper no. 95.03. Jerusalem: Falk Institute for Economic Research
in Israel.
Little, J. W. (1993). “Teacher’s Professional Development in a Climate of Educational Reform.”
Educational Evaluation and Policy Analysis 15 2: 129-151.
Parsad, B., L. Lewis, E. Farris, and B. Greene (2001) “Teacher Preparation and Professional
Development 2000.” National Center for Educational Statistics publication 2001-088.
Richards, C. E. and T. M. Sheu (1992). “The South Carolina School Incentive Reward Program:
A Policy Analysis.” Economics of Education Review 11 1: 71-86.
Roderick, M., B. Jacob, and A. Bryk (2000). “Evaluating Chicago’s Efforts to End Social
Promotion.” In Governance and Performance: New Perspectives, eds. Lynn, L. and C.
Heinrich. Washington D.C.: Georgetown University Press.
Smylie, M. A., E. Allensworth, R. C. Greenberg, R. Harris, and S. Luppescu (2001). “Teacher
Professional Development in Chicago: Supporting Effective Practice.” Consortium on
Chicago School Research report.
Thistlewaite, D. and D. Campbell (1960). “Regression-Discontinuity Analysis: An Alternative to
the Ex-Post Facto Experiment.” Journal of Educational Psychology 51: 309-317.

28
Trochim, W. (1984). Research Design for Program Evaluation: The Regression-Discontinuity
Approach. Beverley Hills, CA, Sage Publications.
Wiley, D. E. and B. Yoon (1995). “Teacher Reports on Opportunity to Learn: Analyses of the
1993 California Learning Assessment System (CLAS).” Educational Evaluation and
Policy Analysis 17 3: 355-370.
29
Fig
ure
1:
Th
e R
elati
on
ship
Bet
wee
n 1
996 S
chool
Rea
din
g A
chie
vem
ent
an
d S
ub
seq
uen
t P
rob
ati
on
Exp
erie
nce
No
tes:
The
ind
ivid
ual
po
ints
are
gro
up
aver
ages
of
the
raw
dat
a, a
ver
aged
fo
r ev
ery o
ne-
tenth
of
a p
erce
nt
at o
r ab
ove
nat
ional
no
rms.
T
he
conti
nuo
us
line
is a
regre
ssio
n l
ined
that
was
sm
oo
thed
usi
ng a
lo
wes
s p
roce
dure
wit
h a
ban
dw
idth
par
amet
er o
f 0
.1. T
he
dis
tance
bet
wee
n t
he
per
cen
tages
on t
he
x-a
xis
are
unev
en
since
ther
e w
ere
som
e val
ues
that
did
no
t hav
e an
y d
ata.
0
0.51
1.52
2.53
810
12
14
16
18
20
22
24
Perc
en
t in
1996 S
ch
oo
l at
or
ab
ove N
ati
on
al N
orm
s in
Read
ing
Number of Years in School on Probation (1996-1999)

30
Fig
ure
2:
Th
e R
elati
on
ship
Bet
wee
n 1
996 S
chool
Rea
din
g A
chie
vem
ent
an
d S
ub
seq
uen
t P
erfo
rman
ce
No
tes:
The
figure
dis
pla
ys
dat
a th
at w
ere
smo
oth
ed u
sing l
ow
ess
wit
h a
ban
dw
idth
par
amet
er o
f 0
.1. T
he
dis
tance
bet
wee
n t
he
perc
enta
ges
on t
he
x-a
xis
are
unev
en s
ince
ther
e w
ere
som
e val
ues
that
did
no
t hav
e an
y d
ata.
4.55
5.56
6.57
7.5
810
12
14
16
18
20
22
24
Pe
rce
nt
in 1
99
6 S
ch
oo
l a
t o
r a
bo
ve
Na
tio
na
l N
orm
s i
n R
ea
din
g
1999 Achievement Score (Grade Equivalents)
00.5
11.5
22.5
3
Number of Years in School on Probation (1996-1999)
Reading
Math

31
Table 1
Monthly Participation in Professional Development Activities by 1997 Probation Status
1994 1997 1999
Variable Probation
Schools
Other
Schools
Probation
Schools
Other
Schools
Probation
Schools
Other
Schools
All Activities 3.119
(2.167)
2.976
(2.206)
3.420
(2.432)
2.644
(2.110)
3.445
(2.440)
2.877
(2.205)
Activities with
Own School
1.174
(.645)
1.129
(.679)
1.069
(.708)
.821
(.650)
1.114
(.761)
.881
(.682)
Activities with
Teacher Network
.443
(.520)
.470
(.594)
.723
(.676)
.596
(.655)
.799
(.706)
.644
(.669)
Activities with
Outside Partner
.496
(.547)
.469
(.558)
.645
(.644)
.494
(.590)
.642
(.647)
.498
(.601)
Activities with
District
.347
(.454)
.302
(.454)
.393
(.515)
.288
(.421)
.374
(.508)
.341
(.494)
Activities with
Union
.255
(.407)
.201
(.373)
.195
(.408)
.152
(.352)
.226
(.442)
.174
(.393)
Activities with
College or
University
.503
(.650)
.406
(.601)
.412
(.640)
.348
(.581)
.348
(.594)
.345
(.598)
Observations 215 936 365 2,068 145 1,375
Notes for Table 1: Probation status refers to the probation status of the school in 1997. Standard deviations are in
parentheses. Data come from teacher surveys generously provided by the Consortium on Chicago School Research.

32
Table 2
Summary Statistics
Means
(standard deviations) Total
Never in school on
probation between
1997 and 1999
In school on
probation for at
least one year
between 1997 and
1999
Treatment
In school on probation in 1997 0.140 0.000 0.772
Years in school on probation from 1997 to 1999 0.334 0.000 1.889
Student Outcomes
1999 Reading Score
6.372
(1.995)
6.530
(1.995)
5.671
(1.838)
1999 Math Score
6.630
(1.821)
6.777
(1.814)
5.978
(1.707)
Not tested in 1999 0.163 0.171 0.126
Tested, but excluded from reporting in 1999 0.163 0.163 0.164
Enrolled in the CPS 0.860 0.851 0.904
Changed schools (left 1996 school) 0.240 0.211 0.371
Student Demographics
1996 Reading Score
3.571
(1.623)
3.704
(1.649)
2.998
(1.363)
1996 Math Score
3.877
(1.359)
3.988
(1.376)
3.397
(1.169)
Tested, but excluded from reporting in 1996 0.069 0.068 0.071
Black 0.534 0.476 0.802
Hispanic 0.322 0.351 0.190
Male 0.506 0.505 0.511
Black Male 0.267 0.237 0.408
Hispanic Male 0.165 0.179 0.098
Age in June 1996
10.146
(1.243)
10.152
(1.242)
10.117
(1.247)
Free Lunch 0.798 0.764 0.957
Reduced Price Lunch 0.082 0.094 0.027
Currently in Bilingual Program 0.196 0.211 0.124
Formerly in Bilingual Program 0.154 0.175 0.057
Special Education 0.116 0.115 0.117
Living with Relatives 0.132 0.143 0.080
Living in Foster Care 0.044 0.039 0.071
Concentration of Poverty (block group)
0.233
(0.713)
0.107
(0.646)
0.818
(0.722)
Social Status (block group)
-0.280
(0.687)
-0.197
(0.687)
-0.667
(0.538)
Third grade 0.268 0.264 0.288
Fourth grade 0.250 0.249 0.254
Fifth grade 0.241 0.242 0.237
Sixth grade 0.241 0.245 0.222
School Characteristics
Enrollment
781
(316)
793
(329)
723
(244)
Attendance Rate 92.6 93.1 90.7
Mobility Rate 29.3 28.0 35.6

33
Truancy Rate 2.5 1.9 5.1
Percent Black 53.3 47.8 79.1
Percent Hispanic 32.1 34.7 19.7
Percent Limited English Proficient 17.4 18.8 10.9
Percent Low Income 85.4 83.3 95.1
Number of Observations 127,135 104,687 22,448
Notes to Table 2: The sample includes students who were in the third through sixth grades in Fall 1996. We exclude
children who were missing demographic information. We also drop observations with missing school demographic
variables as well as all students in special needs schools.

34
Table 3
The Effect of the 1996 School Reading Performance on the Average Years a Student
Spends in a School on Probation between 1997 and 1999
Dependent Variables
Independent Variables Number of years a student spends in a school on
probation from 1997 to 1999
% at or Above National Norms in Reading
(5%-14%)
0.018
(0.026)
% at or Above National Norms in Reading
(14%-15%)
-1.724
(0.124)
% at or Above National Norms in Reading
(15%-25%)
-0.021
(0.010)
Number of Schools 246
Number of Observations 47,274
R-Squared 0.642
F-Statistic of Instruments F=105.7
[p=0.000]
Notes to Table 3: Sample includes students who were in schools in the Fall of 1996 that had between 5% and 25%
of students at or above national norms in reading. The F-statistic of the instruments takes into account that the
instruments are jointly collinear with the second stage control variable “% at or above national norms in reading.”
All test statistics are computed taking into account that observations within a school may not be independent. The
regression includes the following variables that are not shown here: 1996 math and reading scores, student
demographics including whether the student was included for test reporting purposes in 1996, age as of Fall 1996,
race and gender indicators (Black, Hispanic, male, Black*male, Hispanic*male), free and reduced price lunch status,
current and former bilingual status, special education, an indicator of whether the student was living with relatives or
living in foster care, concentration of poverty and social status in the student’s census block group, and school
demographics including the attendance rate, percent Black, percent Hispanic, percent LEP, percent low income,
mobility rate, truancy rate, and percent at or above national norms in math.

35
Table 4
IV and OLS Estimates of the Effect of Teacher Training on Student Achievement
Dependent
Variables OLS OLS OLS IV IV IV
1999 Reading Scores
[n=47,274]
-0.098
(0.019)
-0.085
(0.018)
-0.020
(0.010)
-0.026
(0.029)
-0.020
(0.027)
-0.007
(0.022)
1999 Math Score
[n=47,118]
-0.093
(0.018)
-0.077
(0.017)
-0.021
(0.010)
-0.015
(0.032)
-0.006
(0.028)
0.005
(0.026)
Student Level
Covariates No No Yes No No Yes
School Level
Covariates No Yes Yes No Yes Yes
Notes to Table 4: Sample includes students who were in schools in the Fall of 1996 that had between 5% and 25%
of students at or above national norms in reading.

36
Table 5
IV Estimates of the Effect of Being in a Probation School in 1997
Sample
Dependent
Variable Full Sample
1st Quartile
of National
Reading
Distribution
2nd
Quartile
of National
Reading
Distribution
3rd
Quartile
of National
Reading
Distribution
4th
Quartile
of National
Reading
Distribution
Enrolled in CPS in
1999 [n=53,767]
-0.002
(0.008)
-0.005
(0.009)
0.016
(0.011)
-0.022
(0.017)
-0.026
(0.040)
Changed schools by
1999 [n=43,638]
0.034
(0.022)
0.039
(0.026)
0.031
(0.023)
0.014
(0.037)
0.069
(0.058)
Not tested in 1999
[n=53,767]
0.004
(0.008)
0.013
(0.010)
-0.018
(0.012)
0.007
(0.018)
0.045
(0.041)
Excluded in 1999
[n=47,075]
-0.015
(0.008)
-0.023
(0.012)
-0.002
(0.006)
0.002
(0.005)
-0.004
(0.005)
Not tested or
excluded in 1999
[n=53,767]
-0.009
(0.010)
-0.008
(0.014)
-0.018
(0.011)
0.010
(0.019)
0.038
(0.041)
Notes to Table 5: Baseline sample includes students who were in schools in the Fall of 1996 that had between 5%
and 25% of students at or above national norms in reading. Also included (but not shown) in the regression
specification are the controls described in Table 2. All estimates are computed using two stage least squares. The
instruments and controls are as previously indicated.

37
Table 6
The Effect of Probation on Student Achievement
Probation Treatment Effect
Subgroup 1999 Reading Score 1999 Math Score
Grade Level
Third Grade 0.053
(0.036)
0.038
(0.040)
Fourth Grade -0.017
(0.033)
-0.001
(0.032)
Fifth Grade -0.039
(0.036)
0.001
(0.037)
Sixth Grade -0.014
(0.037)
0.000
(0.041)
Prior Achievement
1st Quartile National Reading Distribution
-0.017
(0.023)
0.018
(0.026)
2nd
Quartile National Reading Distribution 0.021
(0.031)
-0.000
(0.031)
3rd
Quartile National Reading Distribution -0.022
(0.036)
-0.022
(0.041)
4th
Quartile National Reading Distribution 0.036
(0.064)
0.014
(0.056)
Race, Gender & SES
Black -0.007
(0.025)
-0.004
(0.029)
Hispanic 0.025
(0.045)
0.054
(0.047)
White/Other -0.287
(0.149)
-0.049
(0.106)
Male -0.026
(0.023)
0.009
(0.026)
Female 0.009
(0.027)
0.000
(0.029)
Free Lunch -0.009
(0.022)
0.008
(0.026)
No Free Lunch 0.014
(0.055)
-0.011
(0.046)
Notes to Table 6: Sample includes students who were in schools in the Fall of 1996 that had between 5% and 25%
of students at or above national norms in reading. Also included (but not shown) in the regression specification are
the controls described in Table 2.

38
Table 7
Robustness Checks
Row Sample Dependent
Variable Treatment
Readin
g Math
Original Estimates
1
Baseline sample (students in
1996 schools where 5-25%
of students met national
norms in reading)
1999
Achievemen
t
Years in school on
probation
-0.007
(0.022)
0.005
(0.026)
Alternative Samples &
Specifications
2 All schools 1999
Achievement
Years in school on
probation
-0.012
(0.013)
-0.003
(0.015)
3
Baseline sample (controlling
for third order polynomials
of school performance)
1999
Achievement
Years in school on
probation
-0.016
(0.029)
0.027
(0.036)
4
All schools + cohort of
students in school in 1993 in
schools where 5-25% of
students met national norms
in reading
1999
Achievement
Years in school on
probation
0.024
(0.015)
0.018
(0.015)
5 Baseline sample + 1993
cohort (all schools)
1999
Achievement
Years in school on
probation
0.017
(0.012)
0.001
(0.012)
6
Baseline sample + 1993
cohort (controlling for
polynomials of school
performance)
1999
Achievement
Years in school on
probation
0.030
(0.016)
0.019
(0.014)
7 Baseline sample 1999
Achievement
Years in school on
probation or
remediation
-0.004
(0.029)
0.011
(0.034)
8 Baseline sample 1999
Achievement
Years in school with
external partner
-0.003
(0.027)
0.011
(0.032)
9 Students in same school
from 1996 to 1999
1999
Achievement
Years in school on
probation
-0.002
(0.025)
0.006
(0.028)
10 Baseline sample 1998-1999
Achievement
Gain
Years in school on
probation
-0.035
(0.018)
-0.027
(0.016)
11 Students in same school
from 1996 to 1999
1998-1999
Achievement
Gain
Years in school on
probation
-0.026
(0.020)
-0.019
(0.017)
Notes to Table 7: Baseline sample includes students who were in schools in the Fall of 1996 that had between 5%
and 25% of students at or above national norms in reading. Also included (but not shown) in the regression
specification are the controls described in Table 2. All estimates are computed using two stage least squares. The
instruments are as previously indicated except in the specifications in which the treatment is defined as years in
school on probation or remediation and years in school with external partner. For these specifications, the
instrument is a dummy variable indicating the school surpassed 15% at or above national norms in reading.
39
Table 8
OLS Estimates of the Effect of Specific External Partners on Student Achievement
Treatment Effect of Year with External Partner on 1999
Achievement
External Partner Reading Math
America’s Choice-NARE 0.022
(0.031)
0.020
(0.031)
Malcolm X College -0.001
(0.017)
0.017
(0.019)
School Achievement
Structure
-0.001
(0.018)
0.010
(0.022)
DePaul University 0.021
(0.020)
-0.024
(0.024)
Northeastern Illinois
University
0.004
(0.025)
0.027
(0.024)
North Central Regional -0.019
(0.024)
-0.038
(0.033)
Other External Partner 0.023
(0.021)
0.027
(0.023)
F-Test of Joint Significance
(P-value)
F=0.68
[p=0.6875]
F=1.77
[p=0.0943]
Observations 47,274 47,118
Notes to Table 8: The sample includes students who were in schools in the Fall of 1996 that had between 5% and
25% of students at or above national norms in reading. We use all controls from the baseline (Table 2) specification
as well as the total number of years a student was enrolled in a school on probation from 1997 to 1999.