ncc director of public annual report v3
TRANSCRIPT

0344 800 8029www.norfolk.gov.uk/norfolkslivingwell
Director of Public Health Annual Report
A Health Profi le for Norfolk
2018

Welcome ............................................................................................................................................................. 1.
1. Are we living longer ...................................................................................................................................
Population ...............................................................................................................................................
Life expectancy .........................................................................................................................................
Health life expectancy ..............................................................................................................................
1. What are we dying from? ..............................................................................................................................
Death rates ...............................................................................................................................................
Cause of death ..........................................................................................................................................
1. What’s making us ill? ....................................................................................................................................
Years lost to disability ................................................................................................................................
Multi-morbidity .........................................................................................................................................
Mental Health ...........................................................................................................................................
1. Can we be healthier ......................................................................................................................................
Risk factors for ill health ...........................................................................................................................
Healthy lifestyles in Norfolk .....................................................................................................................
High Blood Pressure .................................................................................................................................
Alcohol and Drug Consumption ...............................................................................................................
Inequalities in health ................................................................................................................................
1. Looking Forward ............................................................................................................................................
Contents
1
2
3
4
5
03
04
04
04
05
06
06
07
08
08
09
10
11
11
11
12
13
13
15
02

Welcome
Welcome to my Director of Public Health Annual Report for 2018. I am publishing this report to coincide with our publicati on of Norfolk’s Joint Health and Wellbeing Strategy. This year’s theme is a ‘Health Profi le for Norfolk’, providing a baseline health assessment to inform the way in which our health and social care services work together.
My report examines what we know about our Norfolk populati on and its health. Based on the Public Health England’s Health Profi le for England1 it summarises and interprets current health trends in Norfolk - in parti cular life expectancy, causes of death and ill health, mental health, preventi on and health inequaliti es.
I explore some key data about our populati on’s health: the impact of risk factors on health, consider how Norfolk compares with the rest of England and provide some key messages for future planning.
It is concerning to report that our life expectancy is not conti nuing to increase as it has done previously and that we may be seeing early signs that the number of years spent in poor health is increasing.
As our populati on ages, having several illnesses is becoming more common - making individuals’ needs more complex.
1 Public Health England, 2017, Health Profi le for England www.gov.uk/government/publicati ons/health-profi le-for-england
Most of the top risk factors for ill health are behaviour-related, which means we have a chance to change how we behave to prevent us falling into ill health. Of concern are our rates of smoking, poor diet and alcohol consumpti on, that parti cularly lead to reduced life expectancy for those living in deprivati on.
I hope that this report helps inform the acti ons we could take as a local system to respond to new pa� erns of need, with an increasing populati on health burden from extreme old age, frailty and people with more than one health conditi on. Our commitments in the Joint Health and Wellbeing strategy to work together to integrate strategy and services will be important in planning services.
Secondly, to prevent ill health, the data in this report suggests that we need to target health improvement support to areas and individuals with highest needs, especially those living in poverty.
Dr S.J. Louise SmithDirector of Public Health
We are seeing changes in pa� erns of death with an increasingly advanced age at death associated with frailty. This is changing the demand for health and social care services.
Are we living longer?
What’s making us ill?
Can we Be More Healthy?
Looking forward
What are we dying from?
03
Are We Living Longer?
3 Offi ce for Nati onal Stati sti cs, 2018, Is the growth in life expectancy coming to an end?
blog.ons.gov.uk/2018/06/18/grinding-to-a-halt-is-life-expectancy-coming-to-an-end/
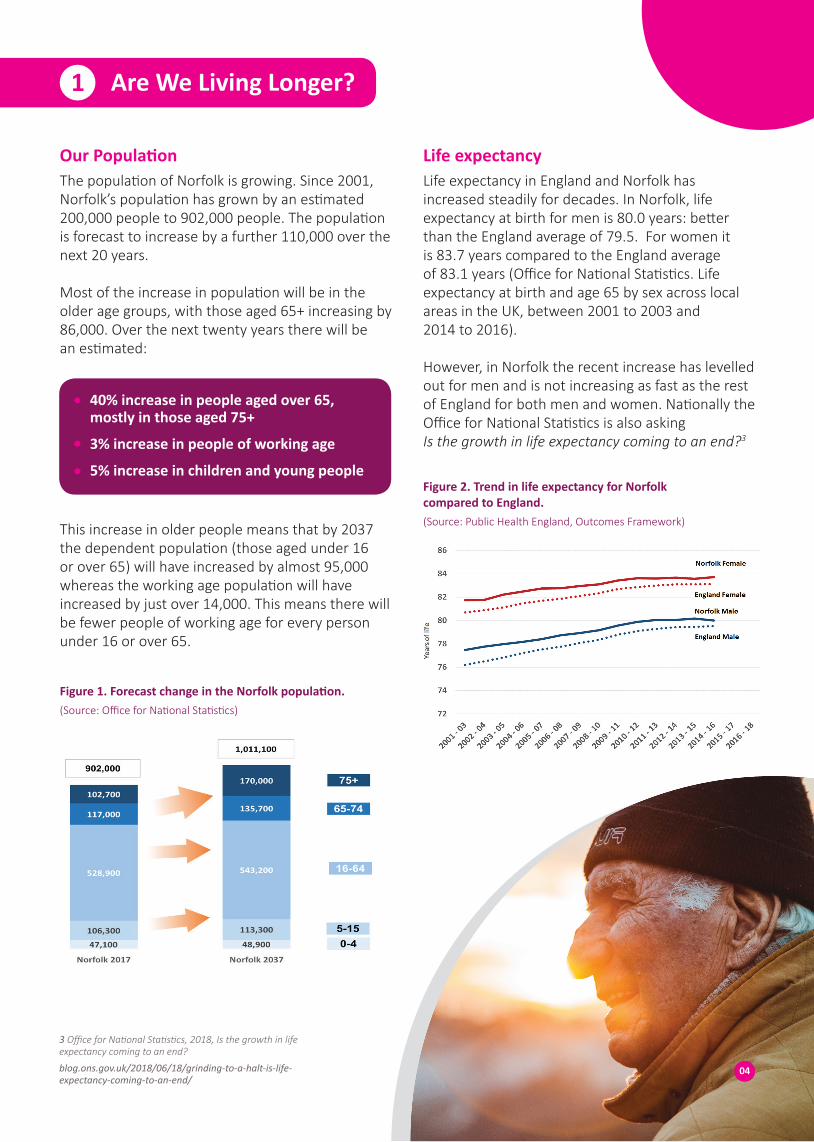
The populati on of Norfolk is growing. Since 2001, Norfolk’s populati on has grown by an esti mated 200,000 people to 902,000 people. The populati on is forecast to increase by a further 110,000 over the next 20 years.
Most of the increase in populati on will be in the older age groups, with those aged 65+ increasing by 86,000. Over the next twenty years there will be an esti mated:
Life expectancy in England and Norfolk has increased steadily for decades. In Norfolk, life expectancy at birth for men is 80.0 years: be� er than the England average of 79.5. For women it is 83.7 years compared to the England average of 83.1 years (Offi ce for Nati onal Stati sti cs. Life expectancy at birth and age 65 by sex across local areas in the UK, between 2001 to 2003 and 2014 to 2016).
However, in Norfolk the recent increase has levelled out for men and is not increasing as fast as the rest of England for both men and women. Nati onally the Offi ce for Nati onal Stati sti cs is also asking Is the growth in life expectancy coming to an end?3
This increase in older people means that by 2037 the dependent populati on (those aged under 16 or over 65) will have increased by almost 95,000 whereas the working age populati on will have increased by just over 14,000. This means there will be fewer people of working age for every person under 16 or over 65.
Our Populati on Life expectancy
1
40% increase in people aged over 65, mostly in those aged 75+
3% increase in people of working age
5% increase in children and young people
Figure 1. Forecast change in the Norfolk populati on. (Source: Offi ce for Nati onal Stati sti cs)
Figure 2. Trend in life expectancy for Norfolk compared to England. (Source: Public Health England, Outcomes Framework)
04

Living a healthy life is as important as living a long life. ‘Healthy life expectancy’ is the average number of years that a person can expect to live in “full health”.
In Norfolk on average this is 64.7 years for men and 64.4 years for women. Again this is be� er than the England average but it means men are living in poor health for an average 15.4 years and women 19.4 years. Of concern, the ti me spent in poor health for women has increased by almost a year over the past decade.
Healthy life expectancy
Figure 3. Healthy life expectancy in Norfolk, Men. (Source: Public Health England, Outcomes Framework)
Figure 4. Healthy life expectancy in Norfolk, women. (Source: Public Health England, Outcomes Framework)
The total populati on of Norfolk is increasing and most of the increase in populati on will be in those aged 65 years or older.
Life expectancy has been rising, but recent increases may now be levelling off . There is a signifi cant period of ti me where people are living in poor health and this has increased recently for women.
From the age of 65 years, on average people will spend about half of their remaining years in ill health.
Key messages
05

What are we dying from?
With the improvements in life expectancy over past decades we have seen year on year reducti ons in death rates. However, as the number of people living in Norfolk increases and ages the actual number of people dying each year is increasing.
Most deaths are in older people, with very few deaths in younger age bands. For example, in 2016 the total number of deaths for those aged 5-29 was 66 (less than 1% of total deaths) and the most common age at which people died was 87.
This increase in total numbers of deaths and the increasing age at death, will impact on our health and social care services.
Death rates
2
Figure 5. Total deaths in Norfolk 2006-2017. (Source: Primary Care Mortality Database)
Figure 6. Deaths by age group and sex in Norfolk 2017 (Source: Offi ce for Nati onal Stati sti cs)
06

Figure 7. Trends in the causes of death for males in Norfolk 2006 - 2016. (Source: Primary Care Mortality Database)
Figure 8. Trends in the causes of death for females in Norfolk 2006-2016.(Source: Primary Care Mortality Database)
As we are living longer, the leading causes of death are changing. The death rates from heart disease and stroke, once clearly the most common causes of death, have reduced by almost half since 2006. Similarly death rates from some common cancers such as lung and breast have dropped. At the same ti me there has been a doubling of the death rate from conditi ons associated with extreme old age and frailty such as dementi a.
Cause of death
07
As our populati on increases and ages, we are seeing drops in death rates but increases in the total number of deaths.
The most common causes of death are changing. We are seeing increases from conditi ons associated with frailty, such as dementi a.
This changing pa� ern of health and care needs has signifi cant implicati ons for services.
Key messages
What’s making us ill?
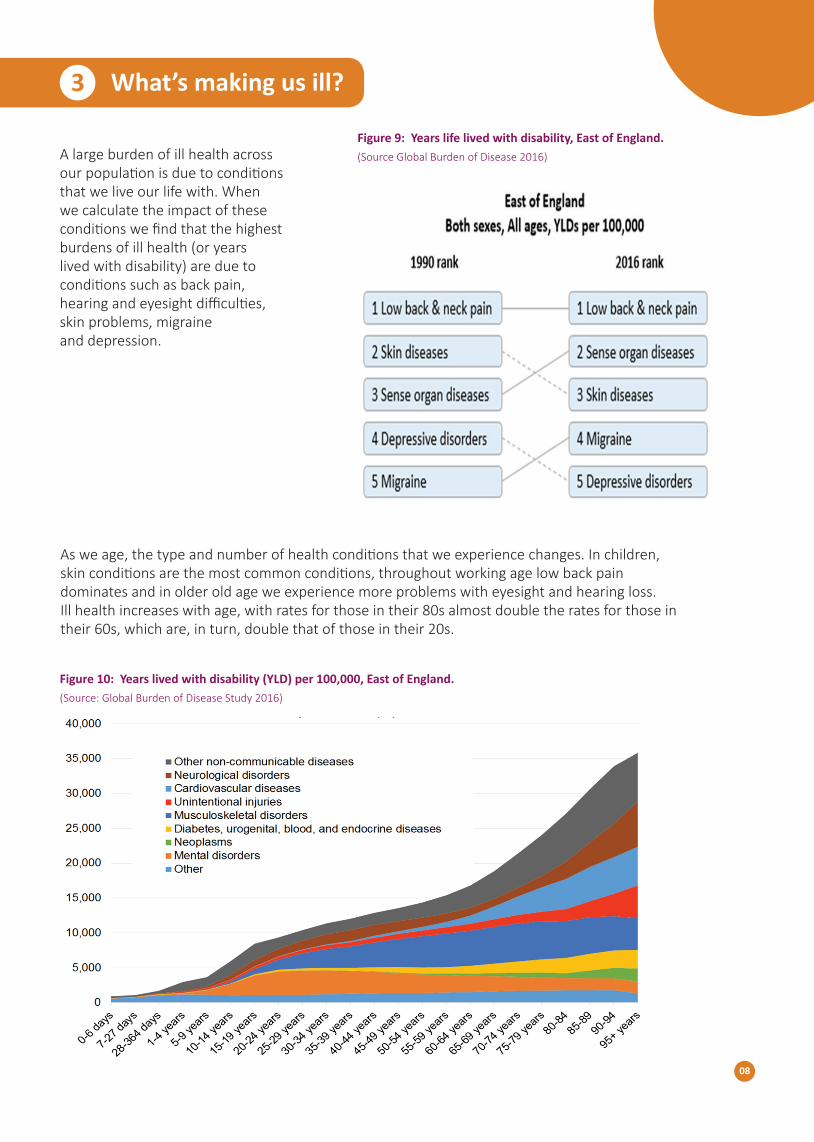
A large burden of ill health across our population is due to conditions that we live our life with. When we calculate the impact of these conditions we find that the highest burdens of ill health (or years lived with disability) are due to conditions such as back pain, hearing and eyesight difficulties, skin problems, migraine and depression.
3
As we age, the type and number of health conditions that we experience changes. In children, skin conditions are the most common conditions, throughout working age low back pain dominates and in older old age we experience more problems with eyesight and hearing loss. Ill health increases with age, with rates for those in their 80s almost double the rates for those in their 60s, which are, in turn, double that of those in their 20s.
Figure 10: Years lived with disability (YLD) per 100,000, East of England. (Source: Global Burden of Disease Study 2016)
08
Figure 9: Years life lived with disability, East of England. (Source Global Burden of Disease 2016)

It is increasingly common for people with a long-term health conditi on to have at least one other conditi on. The number of multi ple illnesses increases with age, with older people more likely to have several long-term conditi ons.
The most common combinati ons of conditi ons are high blood pressure along with heart disease or diabetes.
By 2036, there will be an esti mated 40% increase in pati ents admi� ed to hospital with more than one health conditi ons. The more health conditi ons a person has, the more complex their health and social care needs.
Multi ple Conditi ons
09
Figure 11: Number of long term conditi ons across age groups in people admi� ed to hospital in Norfolk & Waveney 2013/14-2015/16. (Source: Hospital Episode Stati sti cs NHS Digital)
Figure 12: Common chronic conditi ons and comorbidity matrix, Norfolk & Waveney 2013/14 –2015/16. (Source: Hospital Episode Stati sti cs NHS Digital)

As a group of conditi ons, mental health disorders are a leading cause of ill-health. Taken together they cause more years lived with disability than the total burden of disease caused by heart disease, injuries, respiratory conditi ons and cancer. This refl ects the fact that most mental health conditi ons start early in life, some of them are very common (e.g. depression and anxiety) and many have a major impact on quality of life.
It is esti mated that more than one in six adults, or more than 89,000 people in Norfolk, have experienced a common mental disorder (CMD) in the past week.
Mental Health
Leading causes of disability and ill health are back pain, eyesight and hearing problems, skin disorders, migraines and depression. These conditi ons consti tute a signifi cant proporti on of health and care service needs.
Mental health conditi ons especially depression and anxiety consti tute a signifi cant burden of ill health.
As our populati on ages, having several illnesses is becoming more common - making care needs more complex.
Key messages
10
Figure 13: Prevalence of common mental health disorders in Norfolk and Waveney. Source: Adult Psychiatric Morbidity Study 2014 (APMS), NHS Digital, Offi ce for Nati onal Stati sti cs 2016)

Can we be healthier?
Trends in ill health are infl uenced by a broad range of factors. Some of these, like our geneti cs, age and sex, we are not able to infl uence. Other factors, parti cularly individual behaviour, can be changed. These individual lifestyle risk factors infl uence not just whether we become unwell, but also when we do the impact of that illness on our quality of life. These risk factors are preventable and changing lifestyles can reduce or prevent illness.
Risk factors for ill health
4
We don’t have data specifi cally for Norfolk, but looking at data for the East of England, smoking remains the single largest risk factor contributi ng to deaths, a contributory factor in over one in six deaths.
About one in seven adults sti ll smoke. There were about 4,500 deaths in Norfolk a� ributable to smoking in 2014-16. We also have a high rate of smoking-related hospital admissions compared to England average.
Poor diet is the leading preventable risk factor for ill health, contributi ng to heart disease, diabetes and cancer. In Norfolk about two in three adults are esti mated to be overweight or obese.
Healthy lifestyles in Norfolk
11
Figure 14: A� ributi on of risk factors to causes of death in East of England, 2016. (Source: Global Burden of Disease Study)

High blood pressure is the third main risk factor a� er smoking and poor diet. It increases the risk of developing heart disease, stroke, kidney disease and dementi a. An esti mated 110,00 people in Norfolk are unaware that they have high blood pressure and are therefore at high risk of developing these diseases.
High Blood Pressure
12
Figure 15: Observed versus expected diagnosis of hypertension in Norfolk.(Source: Offi ce for Nati onal Stati sti cs 2017)

Life expectancy is lower in more deprived areas. In Norfolk there is nearly 14 years difference in life expectancy for women (between 77.7 years in areas of West Norfolk to 91.3 years in areas of Broadland) and just over 13 years difference for men (71.9 years in areas of Great Yarmouth to 85.1 years in areas of South Norfolk).
The difference in life expectancy is largely due to higher rates of cancer, respiratory disease and heart disease in deprived areas. In men there are also higher numbers of deaths linked to external causes such as trauma.
Alcohol consumption is the biggest risk factor of ill-health, premature death and disability for younger adults (aged 15-49 years). The rate of alcohol-related hospital admissions is higher in Norfolk than England at 6,020 admissions in 2016/17. Alcohol-related hospital admissions have increased throughout England, but Norfolk saw a particularly steep rise and it remains high. About one in ten of all adults in Norfolk are dependent upon alcohol.
Inequalities in health
Alcohol and Drug Consumption
13
Figure 16: Estimated Population dependent on Alcohol for Norfolk by age group and gender. APMS, NHS Digital, ONS 2016.
Figure 17: Breakdown of the life expectancy gap between the most deprived and least deprived quintiles, by broad cause of death for males and females, Norfolk, 2013 to 2015. (Source: Primary Care Mortality Database)

As we have seen earlier in this report, preventable risk factors linked to smoking, diet and alcohol consumption are the major risk factors for cancer, respiratory and heart disease. When we examine data on these behavioural risk factors there is a higher occurrence of these factors in the more deprived areas.
Preventable behavioural risk factors such as smoking, poor diet and alcohol consumption have an important impact on ill health.
High blood pressure is the third leading risk for deaths and disability in Norfolk; an estimated 110,000 people in Norfolk are living with undiagnosed high blood pressure.
Lifestyle risk factors occur more in more deprived areas. This is one of the reasons why there are marked differences in life expectancy between affluent and deprived areas.
Key messages
14
Figure 18: Prevalence of risk factors according to deprivation.(Source: Public Health Outcomes Framework)

Looking Forward 4
We are seeing changes in our populati on’s health and social care needs.
Decades of improvements in life expectancy and forecasts for future populati on growth mean that an increasing proporti on of our populati on are elderly, have multi ple illnesses and need care and support as they become frail in extreme old age. Common causes of death such as heart disease are decreasing and being replaced with conditi ons such as dementi a.
The way current services are organised with emphasis on clinical specialisms are not well designed to deal with the complex needs of pati ents. Current service provision, quality improvement eff orts and research are heavily invested in areas such as cancer and heart disease, rather than emerging prioriti es such as dementi a and end of life care.
We will need to respond to increasing numbers of deaths. Current models of service and end of life care focused in specialist hospital se� ngs are unlikely to be sustainable.
At the same ti me, we may be seeing life expectancy stalling and healthy life expectancy decreasing. The major causes of ill health can be strongly infl uenced by behaviour risk factors, especially diet, exercise, smoking and alcohol consumpti on. Changing lifestyles can prevent the onset and reduce the severity of long term illnesses. Higher levels of risk occur more in deprived areas and there are diff erences in life expectancy of about 13 years across the county.
This suggests that health improvement services should be be� er targeted to provide a more holisti c approach for an individual with multi ple risk factors, focusing in local areas of highest need.
15
