ncoss cost of living report · ncoss cost of living report ... montoya, d. (2014). ... many nsw...
TRANSCRIPT
NCOSS Cost of Living ReportJune 2015
The experience of cost of living pressures for low to middle income families with dependent children in NSW

About NCOSS
The Council of Social Service of New South Wales (NCOSS) is the peak body for the social and community services sector in New South Wales. NCOSS works with its membership on behalf of disadvantaged people and communities towards achieving social justice in New South Wales.
NCOSS was established in 1935 to promote cooperation in the provision of community services and influence social legislation. Today our constituents are:
• our members• other peak community service agencies in NSW• service providers• other agencies working in the social policy and social services field• individual members interested in social policy and social service issues• disadvantaged and low income people and communities in NSW.NCOSS provides an independent voice on welfare policy issues and social and economic reforms and is the major co-ordinator for non-government social and community services in NSW.
We act as a channel for consultation with government and between parts of the non-government sector with common interests and diverse functions.
NCOSS is a membership organisation. Members range from the smallest community services to the largest major welfare agencies, state and regional level peak councils, churches, hospitals, local government and consumer groups.
Published July 2015.
ISSN: 2203 5117
© NSW Council of Social Service (NCOSS)
This publication is copyright. Non-profit groups have permission to reproduce part of this book as long as the original meaning is retained and proper credit is given to the NSW Council of Social Service. All other persons and organisations wanting to reproduce material from this book should obtain permission from the publishers.
NCOSS can be found at:
3/52 William St, WOOLLOOMOOLOO NSW 2011phone: (02) 9211 2599email: [email protected]: www.ncoss.org.aufacebook: on.fb.me/ncosstwitter: @_ncoss_

NCOSS Cost of Living ReportJune 2015
The experience of cost of living pressures for low to middle income families with dependent children in NSW
NCOSS Cost of Living Report June 2015
4
In New South Wales, 181,000, or 13.8% of children under the age of 15 are experiencing poverty – a rate higher than any other mainland state1. Almost 1 in 7 children are living in households below the poverty line.
These statewide statistics mask a situation that is even more troubling in some towns and suburbs in our state. Country towns like Brewarrina (31.8%), Kyogle (28.2%), and Tenterfield (27.9%), and suburbs like Auburn (26.1%) and Canterbury (25.6%)2 – among others – have child poverty rates that far exceed the statewide average. And we know that Aboriginal and Torres Strait Islander children are overrepresented amongst children experiencing poverty and are particularly disadvantaged across a range of indicators3.
There is no shortage of research and evidence to show the prevalence and consequences of child poverty here in New South Wales. Children who experience disadvantage are more likely to have health problems, develop behavioural issues and to be hospitalised for specific types of injuries4. They are also more likely to experience housing and food insecurity and not achieve their full potential at school5. Their experiences during childhood have an impact across the entire life course, shaping their employment prospects, their health outcomes and sense of wellbeing6.
There is also no shortage of evidence to point to the many causes of poverty. Unemployment and underemployment, jobs shortages, poor health, disability, dysfunction within a family, as well as the effects of racism and other forms of discrimination, can all contribute7.
But whatever causes a child to experience poverty, that child is not responsible.
Whatever causes a child to experience poverty, it shouldn’t determine their life chances.
And we know that here in New South Wales, we can act to break the cycle of disadvantage and ensure that the 1 in 7 children who are experiencing poverty have the best chance in life.
Message from the CEO
1 - Montoya, D. (2014). E-brief: Child disadvantage in NSW: recent findings. Sydney: NSW Parliamentary Library2 - Ibid3 - Australian Institute of Health and Welfare (2011). Headline Indicators for Children’s Health, Development and Wellbeing. Canberra4 - Poulos, R., Hayen, A., Finch, C., Zwi, A. (2007). ‘Area socioeconomic status and childhood injury morbidity in New South Wales, Australia,’ Injury Prevention, 13(5): 322-327. 5 - Considine, G. & Zappala, R. (2002). The influence of social and economic disadvantage in the academic performance of school students in Australia. Journal of Sociology, 38(2): 129-148. 6 - Australian Institute of Health and Welfare (2011). Headline Indicators for Children’s Health, Development and Wellbeing. Canberra7 - Aboriginal Disability Network (2007). A report on community consultations with Aboriginal people with disability and their associates throughout NSW, 2004-2005. Sydney: Aboriginal Disability Network , p. 26-27.

NCOSS Cost of Living Report
5
Today, NCOSS is starting a conversation with our members and other stakeholders to talk about their own experiences, the experiences of the children and families they work with, and what makes a difference in the lives of children experiencing poverty. Before we started this conversation we gathered some data and spoke with 400 low and middle income families about their experience of the cost of living today – with the results outlined in this report.
But NCOSS also plans to visit cities, suburbs and towns across New South Wales to talk to you about how our sector can work together with children, families, government and other players to ensure that the 1 in 7 children who are experiencing poverty have the best possible start in life. Our focus will be on solutions – how together we shape a future where the life outcomes of our children aren’t determined by their socio-economic status and the poverty they experience in childhood.
Before then, we are asking you to think about what are the solutions that you have seen work in your communities to break the cycle of disadvantage. We want to know from you how the New South Wales Government can shape policy responses that can make a difference to the life chances of the 1 in 7 children experiencing poverty. And we want to hear from you about how you can work with us to make it a reality.
Our focus during this conversation is on the five key areas identified by the research8 as affecting a child’s risk of social exclusion, and what we all can do to reduce that risk.
• Socioeconomic: how do we ensure that families can afford a decent standard of living here in NSW? • Education: how do we ensure that all children – including children experiencing poverty – get a world class education, and have world class educational outcomes? • Connectedness: how do we ensure that all children, including children experiencing poverty, are safe, and connected with their communities and the world around them? • Housing: how do we ensure that all children and families have a safe, secure, decent and affordable roof over their head? • Health: how do we ensure that all children are healthy, and have access to the health services they need when they need them?
You are more than welcome to come along to one of our forums we have planned to talk about the experience of people in your community and your organisations experience working with children and families. Otherwise you can provide your feedback to us in writing. Either way, we need your input, your experience and your action to make change happen and ensure good life chances for all children in New South Wales.
Yours,
Tracy HoweCEO
8 - Montoya, D. (2014). E-brief: Child disadvantage in NSW: recent findings. Sydney: NSW Parliamentary Library

NCOSS Cost of Living Report June 2015
6
Message from the CEO
2. Executive Summary
3. Methodology
3.1 Outline
3.2 How We Undertook This Survey
3.3 About the Field Team
3.4 Survey Reliability
3.5 Note to the Reader
4. Incomes, Wealth and Poverty – A Brief Summary
5. ABS Data on Household Costs
6. Indicators of Deprivation for New South Wales Families on Low and Middle Incomes
6.1 Analysis
6.2 Conclusion
7. Drilling Deeper – The Experience of Low to Middle Income Families in New South Wales
7.1 Socioeconomic
7.2 Housing
7.2.1 Housing Stress
7.2.2 Perceptions of the adequacy of housing and ability to meet housing costs
7.3 Connectedness
CONTENTS4
8
10
10
10
11
11
11
12
14
18
a 19
20
21
a 21
24
25
26 a
28

NCOSS Cost of Living Report
7
7.4 Education
7.5 Transport
7.6 Food
7.7 Health
7.8 Utilities
8. Raising Children – The Perspectives of Families on Low to Middle Incomes
8.1 What Have You Found Most Stressful About Managing On Your Household’s Income?
8.2 What Are The Top Items Or Experiences That You Can’t Currently Afford For Your Child/ren, But Would Buy If Your Finances Allowed?
8.3 How Concerned Or Unconcerned Are You About Meeting The Current Costs Of Each Of The Following Specific Expenses For Your Household?
8.4 How Concerned Or Unconcerned Would You Be About The Following Changes To The GST?
9. Conclusions
Appendix 1 – Indicators of Deprivation
Appendix 2 - How concerned or unconcerned are you about meeting the current costs of each of the following specific expenses for your household?
Appendix 3 Reference List
30
31
32
33
34
35 a
35 a
37
38 a a
39 a
40
42
46 a a
49

NCOSS Cost of Living Report June 2015
8
2. Executive Summary
It’s not uncommon to hear that the cost of living in Australia is among the highest in the world, and cost of living is now our number one source of anxiety.
But at the same time, much of the hard data indicates that, in fact, Australia has had a good decade – despite the Global Financial Crisis and the recent economic challenges. Household incomes have increased, unemployment has fallen and low-income households have shared some of the benefits.
Yet the level of wealth between Australian households continues to vary greatly – averaging $2.2m for the wealthiest 20% of households and $31,000 for the poorest 20%. Unemployment benefits have not increased in real terms over the last ten years, meaning jobless families have been left behind. More than 14% of people in NSW are living below the poverty line – higher than the national rate of 13.9%. And Sydney has a higher poverty rate than any other capital city in Australia at 15%.
And today, almost 1 in 7 children in NSW are living in households below the poverty line.
This report provides a sketch of how NSW families on low to middle incomes (less than $75,000) with dependent children experience cost of living pressures. This is achieved by providing a summary of changes in incomes, wealth and poverty over time, by examining Australian Bureau of Statistics data on household costs and changes in those costs over the past decade, and by talking directly to a sample of NSW families on low and middle incomes about their experiences and perspectives of the cost of living via a survey undertaken through a partnership between NCOSS, Essential Media Communication and Research Now.
This report concludes that:
1. The costs that make up many of the essentials of life for low to middle income families are rising faster than the CPI - in particular, the cost of housing, health and utilities.
2. Many NSW families on low and middle incomes are living pay cheque to pay cheque. While 40% of survey respondents indicated that they cannot afford $500 in savings for an emergency, sole parent families said they found saving more difficult, with more than half (52%) not able to afford this financial buffer.
3. Many NSW families on low to middle incomes – particularly sole parent families – can’t afford essential housing related costs, and a majority (58%) are experiencing housing stress. At least one in five low and middle income families report they could not afford a decent and secure home, a roof and gutters that don’t leak or a separate bedroom for every child over 10. One in three couldn’t afford home and contents insurance and 17% couldn’t afford secure locks on doors and windows. Sole parent families indicated these items were unaffordable at either the same or higher rates.
4. The cost of dental treatment is out of reach for many families – particularly in regional NSW. While most respondents indicated that they could afford medical treatment and buy prescription medicines, dental treatment was out of reach for more than one in three low to middle income families in regional NSW, and more than two out of five sole parent families.
NCOSS Cost of Living Report
9
5. Hobbies, outings and school activities for children are unaffordable for many low and middle income families. These items are particularly unaffordable for sole parent families.
6. Parents are employing a number of strategies to make ends meet, including making personal sacrifices to improve their children’s standard of living.
7. NSW families on low to middle incomes are particularly “stressed” about their ability to manage the cost of a range of essential items, including housing, bills generally (with a significant proportion highlighting electricity bills and unexpected bills), the cost of food and groceries, lack of or insufficient paid employment, vehicle running costs and education costs.
8. Some parents on low to middle incomes report that they carry a level of “guilt” about their capacity to provide a decent standard of living for their children, but most parents on low to middle incomes would invest more in their child’s education through extra-curricular activities, technology, books, fees, and clothes: if they could afford it.
9. A majority of NSW families on low and middle incomes are either very or quite concerned about their ability to meet their current costs of healthcare, education, housing, groceries, running their car and electricity. Significant minorities were concerned about their ability to meet the current costs of fresh food, insurance, phone and internet.
10. More than 67% of sole parent families were concerned about their ability to meet their housing costs. Sole parent families also reported higher levels of concern about their ability to meet the cost of many other items.
11. Sydney families on low to middle incomes were more likely to report concern about their ability to meet their housing costs, the cost of education and the cost of public transport than their regional counterparts.
12. Regional families on low to middle incomes were more likely to report concern about meeting the cost of internet than Sydney families.
13. More than one third of survey respondents are currently receiving the NSW Government Low Income Household Energy Rebate, and of those families, 58% said they would prefer a percentage based (15%) rebate on their bill, rather than the flat rate rebate.
14. Families on low to middle income are very concerned about the potential for an increase to the rate or base of the GST. More than 6 in 10 are opposed to expanding the base of the GST to cover fresh food, and almost 7 in 10 are opposed to increasing the rate to 12%.
NCOSS intends to use this report to engage with our members and other stakeholders about their own experiences, the experiences of the children and families they work with, and what makes a difference in the lives of children experiencing poverty. Our focus during this conversation is on the five key areas identified by the research as affecting a child’s risk of social exclusion, and what we all can do to reduce that risk.
NCOSS intends to use this input, experience and action to shape and achieve the policy change we need to see to ensure that poverty is not determinative of a child’s life chances here in NSW.
NCOSS Cost of Living Report June 2015
10
3. Methodology
3.1 OutlineNCOSS aims in this report to provide a sketch of how families with dependent children in NSW on low to middle income experience cost of living pressures. This is achieved in three ways:
1. By providing a summary of changes in incomes, wealth and poverty over time,
2. By examining Australian Bureau of Statistics data on household costs and changes in those costs over the past decade, and
3. By talking directly to a sample of NSW families on low and middle incomes (less than $75,000 per annum) about their experience of and perspectives on the cost of living.
3.2 How We Undertook This SurveyThe survey part of this research was undertaken online and was completed by 401 respondents. The survey was in the field from Thursday 18th June to Thursday 25th June 2015. The survey fieldwork was conducted by Research Now. Data tables and weighting were prepared by Essential Research.
The target population for this research was NSW, low to middle income (household income $75,000 gross or less) households with dependent children 18 or younger. Participants were drawn from the online research panel of Research Now. Participants were invited to take part via an email invitation. Those who completed the survey were rewarded with ‘points’ that can be redeemed for a variety of rewards.
This data was weighted. In order to weight the file, Essential Research developed a profile of the target population (see above) based on 10 weeks of data collected in the ‘Essential Report’ (a weekly online omnibus). The ‘Essential Report’ is reflective of the Australian population aged 18+ and is itself weighted to ABS. The profile was used to weight the proportions of age, gender and location (metropolitan and regional split).
During the fieldwork, loose quotas were placed on age and gender. The survey was designed by Essential Research (Kate Whelan) in conjunction with NCOSS (Deputy CEO John Mikelsons), and based on previous cost of living surveys and the SPRC Left out Missing Out project9. The analysis of this data was conducted by NCOSS. Themes were identified from the open ended responses via a comprehensive thematic analysis, sometimes graphically represented via a “word cloud”.
The research design and fieldwork for this project were conducted in line with ISO 20252 accreditation (the international ISO quality assurance standard for market and social research).
9 - Saunders, P et al. 2007, Towards new indicators of Disadvantage: Deprivation and social exclusion in Australia, Social Policy Research Centre, University of New South Wales
NCOSS Cost of Living Report
11
3.3 About the Field TeamBoth Essential Research and Research Now are ISO 20252 accredited. Essential Research is a member of the Australian Market & Social Research Organisation (AMSRO). All research team members belong to the Australian Market and Social Research Society (AMSRS). All Essential Research staff ascribe to the AMSRS Code of Professional Behaviour, as well as to a company-specific privacy policy. Research Now are ESOMAR members and adhere to ICC/ESOMAR International Code of Marketing and Social Research Practice.
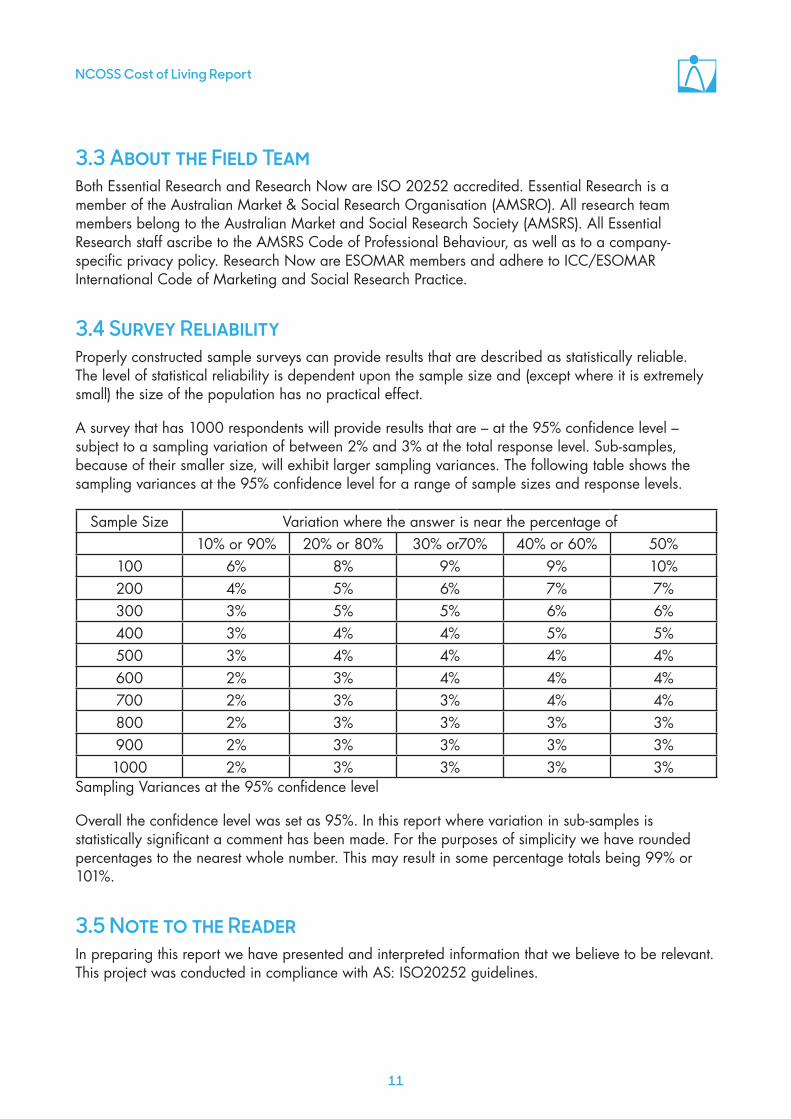
3.4 Survey ReliabilityProperly constructed sample surveys can provide results that are described as statistically reliable. The level of statistical reliability is dependent upon the sample size and (except where it is extremely small) the size of the population has no practical effect.
A survey that has 1000 respondents will provide results that are – at the 95% confidence level – subject to a sampling variation of between 2% and 3% at the total response level. Sub-samples, because of their smaller size, will exhibit larger sampling variances. The following table shows the sampling variances at the 95% confidence level for a range of sample sizes and response levels.
Sample Size Variation where the answer is near the percentage of10% or 90% 20% or 80% 30% or70% 40% or 60% 50%
100 6% 8% 9% 9% 10%200 4% 5% 6% 7% 7%300 3% 5% 5% 6% 6%400 3% 4% 4% 5% 5%500 3% 4% 4% 4% 4%600 2% 3% 4% 4% 4%700 2% 3% 3% 4% 4%800 2% 3% 3% 3% 3%900 2% 3% 3% 3% 3%1000 2% 3% 3% 3% 3%
Sampling Variances at the 95% confidence level
Overall the confidence level was set as 95%. In this report where variation in sub-samples is statistically significant a comment has been made. For the purposes of simplicity we have rounded percentages to the nearest whole number. This may result in some percentage totals being 99% or 101%.
3.5 Note to the ReaderIn preparing this report we have presented and interpreted information that we believe to be relevant. This project was conducted in compliance with AS: ISO20252 guidelines.

NCOSS Cost of Living Report June 2015
12
4. Incomes, Wealth and Poverty – a brief summary
It’s not uncommon to hear that the cost of living in Australia – and Sydney in particular – is among the highest in the world. Cost of living is now our number one source of anxiety, according to two separate reports by NAB10 and social researchers McCrindle11.
But at the same time, much of the hard data indicates that, in fact, Australia has had a good decade – despite the Global Financial Crisis in 2008 and the recent economic challenges. Household incomes have increased, unemployment has fallen and low-income households have shared some of the benefits12.
NATSEM estimates that between 1984 and 2011, high-income households experienced growth averaging $429 per week above their living costs, and low-income households came out ahead by an average of $93 per week13.
Incomes – changes over time
10 - NAB (2015) Quarterly Australian Consumer Anxiety Index: Q1, 2015. Accessed 10 June 2015 http://business.nab.com.au/nab-quarterly-australian-consumer-anxiety-index-q1-2015-10230/11 - McCrindle Research (2013) Cost of Living: Still the Number One Issue. Accessed 28 February 2014 http://mccrindle.com.au/resources/2013/Cost-of-Living-Still-the-Number-One-Issue_McCrindle-Research.pdf12 - Grattan Institute (2013) The NSW Budget Context. Presentation by CEO John Daley at NCOSS Pre Budget Submission launch, Oct 2013. 13 - NATSEM (2013) Cost of living and Standard of Living Indexes For Australia ,September 2013, pp 9-10.
Sydney has a higher poverty rate than any other capital city in Australia at 15%
NCOSS Cost of Living Report
13
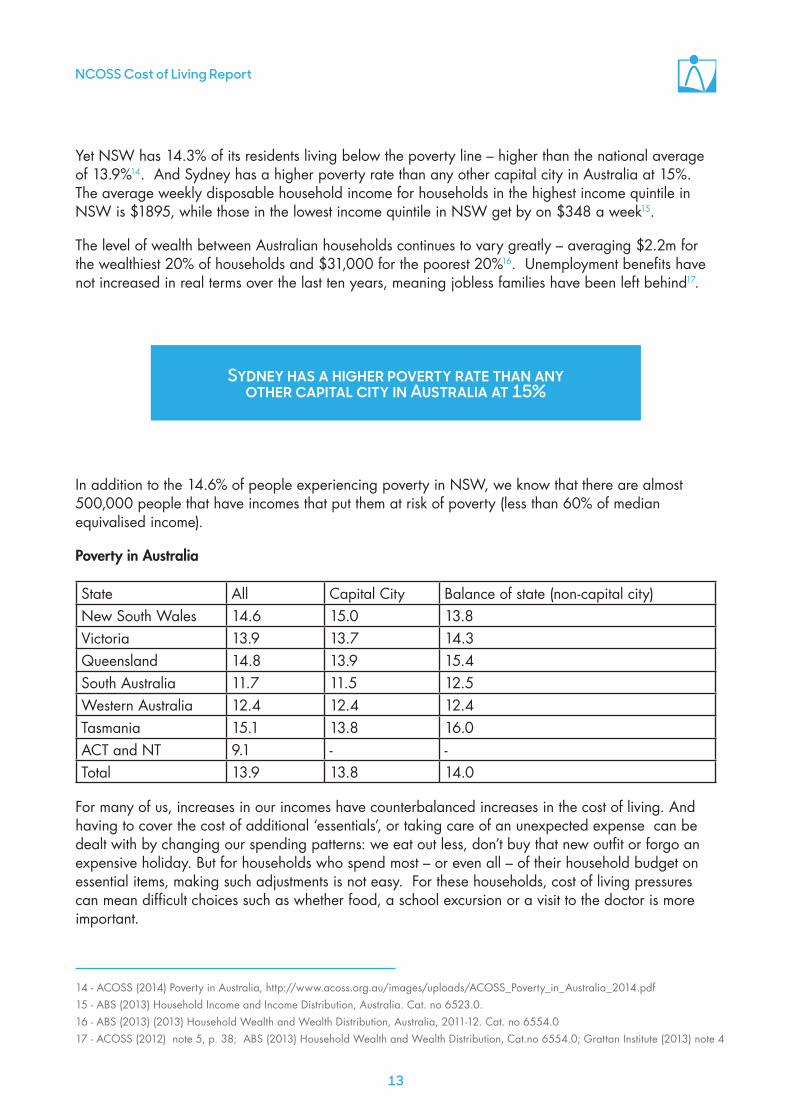
Yet NSW has 14.3% of its residents living below the poverty line – higher than the national average of 13.9%14. And Sydney has a higher poverty rate than any other capital city in Australia at 15%. The average weekly disposable household income for households in the highest income quintile in NSW is $1895, while those in the lowest income quintile in NSW get by on $348 a week15.
The level of wealth between Australian households continues to vary greatly – averaging $2.2m for the wealthiest 20% of households and $31,000 for the poorest 20%16. Unemployment benefits have not increased in real terms over the last ten years, meaning jobless families have been left behind17.
In addition to the 14.6% of people experiencing poverty in NSW, we know that there are almost 500,000 people that have incomes that put them at risk of poverty (less than 60% of median equivalised income).
Poverty in Australia
State All Capital City Balance of state (non-capital city) New South Wales 14.6 15.0 13.8 Victoria 13.9 13.7 14.3 Queensland 14.8 13.9 15.4 South Australia 11.7 11.5 12.5 Western Australia 12.4 12.4 12.4 Tasmania 15.1 13.8 16.0 ACT and NT 9.1 - - Total 13.9 13.8 14.0
For many of us, increases in our incomes have counterbalanced increases in the cost of living. And having to cover the cost of additional ‘essentials’, or taking care of an unexpected expense can be dealt with by changing our spending patterns: we eat out less, don’t buy that new outfit or forgo an expensive holiday. But for households who spend most – or even all – of their household budget on essential items, making such adjustments is not easy. For these households, cost of living pressures can mean difficult choices such as whether food, a school excursion or a visit to the doctor is more important.
14 - ACOSS (2014) Poverty in Australia, http://www.acoss.org.au/images/uploads/ACOSS_Poverty_in_Australia_2014.pdf15 - ABS (2013) Household Income and Income Distribution, Australia. Cat. no 6523.0.16 - ABS (2013) (2013) Household Wealth and Wealth Distribution, Australia, 2011-12. Cat. no 6554.017 - ACOSS (2012) note 5, p. 38; ABS (2013) Household Wealth and Wealth Distribution, Cat.no 6554.0; Grattan Institute (2013) note 4

18 - Housing and CPI All Groups, Sydney (ABS, 2013). 19 - COAG Reform Council (2012) Affordable Housing 2010–11: Comparing performance across Australia, COAG Reform Council, Sydney. Households in rental stress are defined as those in the lowest 40% of incomes who spend more than 30% of their income on rent. 20 - This figure is based on the 2009-10 HES, updated to December 2013 using the Sydney CPI for food and non-alcoholic beverages. 21 - Food and CPI All Groups, Sydney (ABS, 2013). 22 - Proportion of weekly food expenditure allocated to selected food items by gross household income quintile (ABS, 2011).
NCOSS Cost of Living Report June 2015
14
5. ABS Data on Household Costs
Housing costs are the largest area of expenditure for NSW households, with the proportion of weekly household spending allocated to housing higher than the national average, and higher still for those who are renting or those whose main source of income is a Government allowance or pension. Prices over the last 10 years (including rents and new dwelling purchases but not mortgage repayments) have risen at twice the rate of inflation18. With home purchase out of reach and public housing a dwindling commodity, many NSW families on low to middle incomes have no alternative but to rent – and nearly half are estimated to be in rental stress19.
Sydney – Housing CostsData Source: ABS, 64-01.0 Consumer Price Index, March 2015
NSW households spend on average 17% of their weekly expenditure on food, rising to 19% for low income households20. Prices for food staples (such as milk, bread and vegetables) over the last 10 years have generally risen in line with CPI21, and low-income households spend a greater proportion of their food budget on such staples. For high-income households, a much greater proportion – over one third – of the weekly food budget goes on eating out and fast food22.

23 - Selected Transport Sub-Groups and CPI All Groups, Sydney (ABS, 2013).24 - NSW Department of Infrastructure, Planning and Natural Resources (2007) Transfigures. April 2007, Transport & Population Data Centre.25 - Health and CPI All Groups, Sydney (ABS, 2013). 26 - These figures are based on the 2009-10 HES, updated to December 2013 using the Sydney CPI for health.
NCOSS Cost of Living Report
15
For transport, it’s the higher income earners in NSW who spend proportionally more on this essential. More of their transport outlay goes towards the cost of buying or leasing a vehicle – where prices have gone down in real terms23. For low income groups the largest transport cost is fuel, the component most susceptible to price fluctuations. We know from the NSW Bureau of Transport Statistics that weekend and non-work trips in Sydney, for the purposes of participating in sport, socialising and holidaying, are increasing24. Higher income earners are driving this increase, contributing to their larger proportional outlay in this area.
Health care costs in NSW have risen at faster than inflation25. For households where there is disability, chronic illness or where the main source of income is the aged pension, expenditure on this item takes a greater slice of the weekly budget. But while those in the lowest income quintile spend a larger chunk of their weekly budget on health care, in absolute terms higher income households spend three times as much – an average of $126 per week compared to $43 per week26.
Sydney – Cost of HealthData Source: ABS, 64-01.0 Consumer Price Index, March 2015
NCOSS Cost of Living Report June 2015
16
While education costs in NSW have risen significantly in the last 10 years, the steepest rise has been in secondary education and much of it relates to private school fees – reported to be higher in Sydney than other capitals. But for low-income households it’s not a question of whether they can find $20,000 to cover a year of private schooling; it’s a question of whether they can find the $2,000 plus which The Smith Family estimates as the annual cost of a ‘free’ public primary school education for one student27. For jobless families, and particularly those with more than one child, this is obviously a strain on an already stretched budget.
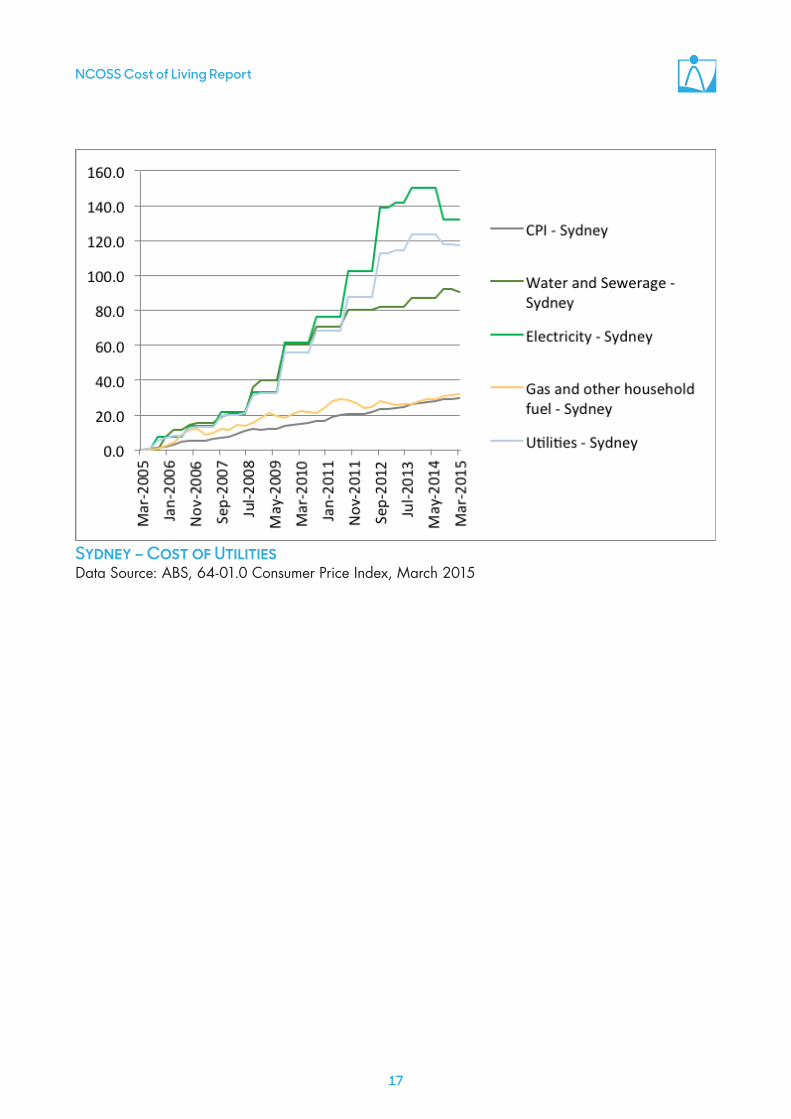
While comprising a smaller component of the weekly budget for all NSW households, the cost of utilities (water and sewerage, electricity and gas) has also risen sharply over the last 10 years more than 4 times the rate of CPI28. This is particularly pertinent to low to middle income families. Not only do they spend a higher proportion of their budget on domestic fuel and power, but the ‘lumpy’ nature of these bills can make them difficult to manage. For people living in older, poor quality housing or those with disability or chronic health conditions, there are added challenges. Over one in five households in the lowest income quintile report being unable to pay their bills on time; and the number of households being disconnected increased by 37% in the five years to 201329.
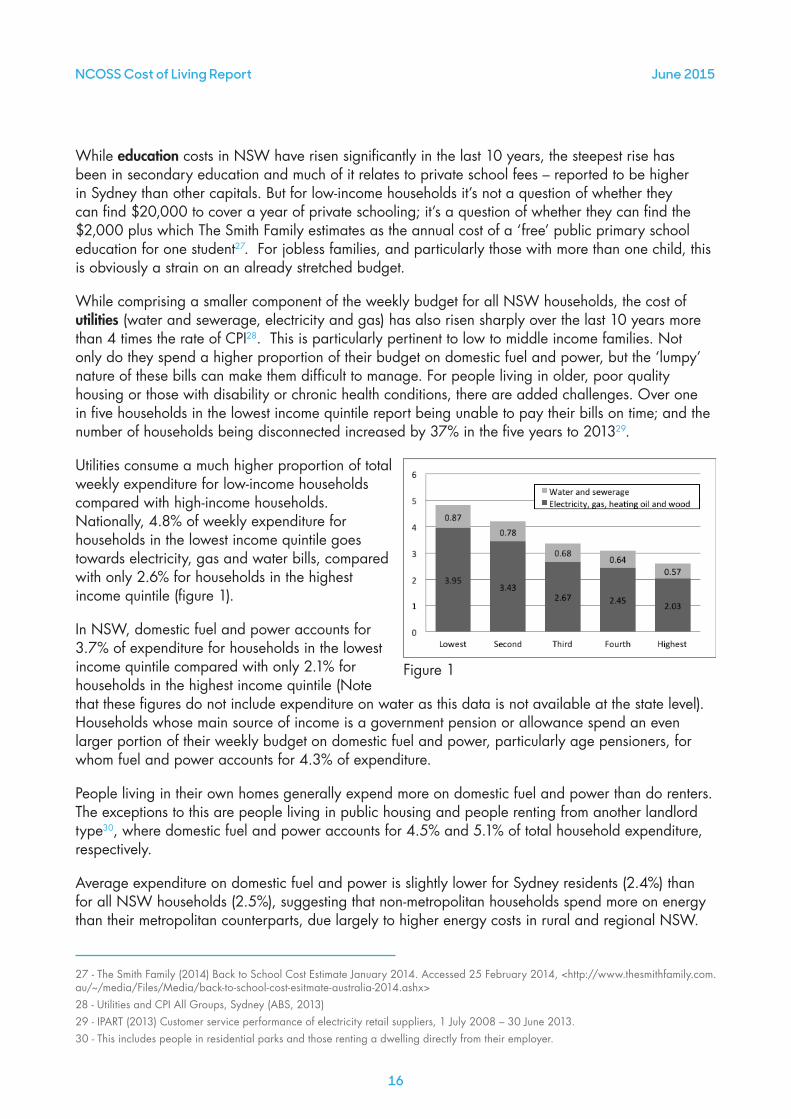
Utilities consume a much higher proportion of total weekly expenditure for low-income households compared with high-income households. Nationally, 4.8% of weekly expenditure for households in the lowest income quintile goes towards electricity, gas and water bills, compared with only 2.6% for households in the highest income quintile (figure 1).
In NSW, domestic fuel and power accounts for 3.7% of expenditure for households in the lowest income quintile compared with only 2.1% for households in the highest income quintile (Note that these figures do not include expenditure on water as this data is not available at the state level). Households whose main source of income is a government pension or allowance spend an even larger portion of their weekly budget on domestic fuel and power, particularly age pensioners, for whom fuel and power accounts for 4.3% of expenditure.
People living in their own homes generally expend more on domestic fuel and power than do renters. The exceptions to this are people living in public housing and people renting from another landlord type30, where domestic fuel and power accounts for 4.5% and 5.1% of total household expenditure, respectively.
Average expenditure on domestic fuel and power is slightly lower for Sydney residents (2.4%) than for all NSW households (2.5%), suggesting that non-metropolitan households spend more on energy than their metropolitan counterparts, due largely to higher energy costs in rural and regional NSW.
27 - The Smith Family (2014) Back to School Cost Estimate January 2014. Accessed 25 February 2014, <http://www.thesmithfamily.com.au/~/media/Files/Media/back-to-school-cost-esitmate-australia-2014.ashx> 28 - Utilities and CPI All Groups, Sydney (ABS, 2013)29 - IPART (2013) Customer service performance of electricity retail suppliers, 1 July 2008 – 30 June 2013.30 - This includes people in residential parks and those renting a dwelling directly from their employer.
Figure 1
NCOSS Cost of Living Report
17
Sydney – Cost of UtilitiesData Source: ABS, 64-01.0 Consumer Price Index, March 2015
Although it is widely accepted that income provides a valuable way of measuring poverty, it has also become
clear that the concept of poverty needs to be grounded in the conditions faced by those who experience it32.
31 - Ibid.32 - Saunders, P et al. 2007, Towards new indicators of Disadvantage: Deprivation and social exclusion in Australia, Social Policy Research Centre, University of New South Wales.33 - Ibid p vii.
NCOSS Cost of Living Report June 2015
18
6. Indicators of Deprivation for New South Wales Families on Low and Middle Incomes
Poverty is one of the most significant causes of disadvantage for families. We know that children often carry the negative effects of child and family poverty with them throughout their lives31. We also know that by just using income to measure poverty we don’t see the whole picture of the lived experience of families.
In 2007, the Social Policy Research Centre at the University of NSW took a closer look at disadvantage in Australia, via a comprehensive study known as The Left Out and Missing Out project. This project “…draws on the concepts of deprivation (‘missing out’) and social exclusion (‘left out’) that relate directly to people’s living standards…” and “…complement poverty studies in ways that enrich our understanding of the nature and extent of social disadvantage33.”
The basic premise underlying the Centre’s research was that a process of measuring poverty and disadvantage needs to be grounded in the living standards and experiences of people experiencing poverty. Through a comprehensive and “democratic” process involving a survey of more than 2700 randomly selected Australians, the Centre determined the items the Australian public considered were essential for a decent standard of living. Some of these items include a decent and secure home, a substantial meal at least once a day, warm clothes and bedding if it is cold, and furniture in reasonable condition.
NCOSS has taken the list of items compiled and used it to survey 400 NSW families on low to middle incomes (less than $75,000 per annum) about their own experience of “deprivation”. The full list of items and the results of our survey are provided at appendix 1.

NCOSS Cost of Living Report
19
6.1 AnalysisMany NSW families on low and middle incomes are living pay cheque to pay cheque.
While 40% of survey respondents indicated that they cannot afford $500 in savings for an emergency, sole parent families said they found saving more difficult, with more than half (52% not able to afford this financial buffer.
Many NSW families – particularly sole parent families – can’t afford essential housing related costs
At least one in five low and middle income families reported they could not afford a decent and secure home (21%), a roof and gutters that don’t leak (23%) or a separate bedroom for every child over 10 (20%). One in three couldn’t afford home and contents insurance (32%) and 17% couldn’t afford secure locks on doors and windows. Sole parent families indicated that all these housing items were unaffordable at either the same or higher rates.
The cost of dental treatment is out of reach for many families – particularly in regional NSW
While most respondents indicated that they could afford medical treatment and buy prescription medicines, dental treatment was out of reach for more than one in three low to middle income families in regional NSW, and more than two out of five sole parent families.
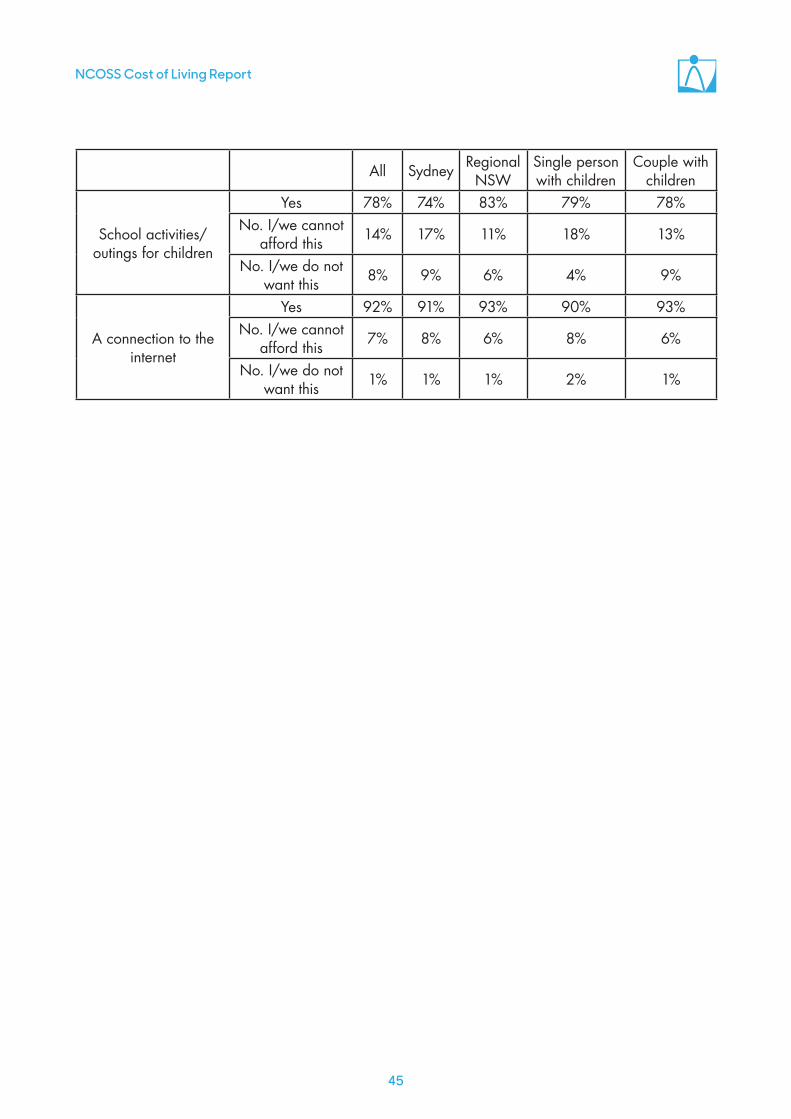
Hobbies, outings and school activities for children are unaffordable for many low and middle income families
Many families on low to middle incomes are unable to afford a hobby or leisure activity for their children or school activities/outings. These items are particularly unaffordable for sole parent families.
Activities for children – Does your family have or is able to afford the following:
All Sydney Regional NSW
Single person with children
Couple with children
A hobby or leisure activity for children
Yes 70% 71% 69% 64% 72%No. I/we cannot
afford this 25% 24% 27% 33% 23%
No. I/we do not want this 5% 5% 4% 3% 5%
School books/
clothes for children
Yes 87% 84% 91% 93% 87%No. I/we cannot
afford this 7% 8% 4% 5% 6%
No. I/we do not want this 6% 7% 4% 2% 7%
School activities/outings for children
Yes 78% 74% 83% 79% 78%No. I/we cannot
afford this 14% 17% 11% 18% 13%
No. I/we do not want this 8% 9% 6% 4% 9%
NCOSS Cost of Living Report June 2015
20
Around 9 in 10 low to middle income families have furniture in reasonable condition, a telephone and is connected to the internet.
Almost all respondents also indicated that they owned a television and washing machine.
6.2 ConclusionMany NSW families on low to middle incomes are struggling to afford many essential items. Emergency savings, decent housing, and activities for their children are out of reach for many. While Medicare, the Pharmaceutical Benefits Scheme and the public hospital system provide a safety net, many low income families are struggling to afford dental treatment – particularly in regional NSW.

NCOSS Cost of Living Report
21
7. Drilling Deeper – the experience of low to middle income families in New South Wales
In this chapter we turn to an analysis that drills deeper into the experience of low to middle income families – how they think about their economic situation, their perspectives on the housing market, their experience of the cost of connecting themselves and their families with each other, their friends and their communities, and what they do to meet and/or manage the cost of health, education, transport, food and utilities.
It is clear that in low to middle income families, parents regularly sacrifice essentials for themselves, and their own standard of living, so they can afford a decent life for their children.
The cost of housing, education, health, transport and utilities are placing low to middle income families in an increasingly precarious situation, where they are either just breaking even or spending more than they receive. For many families, extras like holidays, gifts, outings and extracurricular activities are beyond their reach.
7.1 SocioeconomicThe majority of low to middle income families describe themselves as “just getting along” or “struggling”, with sole parent families significantly more like to describe themselves as struggling or struggling a lot (42%). While around half of low to middle income families break even most weeks, 30% of sole parent families “spend more money than (they) receive”. Forty percent report that they owe more than they can afford, and a majority either don’t have enough for the essentials, or can afford essentials and nothing extra. A majority in every location and family type report that their income has fallen behind their living costs, with this proportion rising to 64% for sole parent families.
Over the last 12 months what have you found most stressful about managing on your household’s income?
The income isn't as steady due to higher costs and we have our own rendering company. If people didn't pay we wouldn't have any money. It’s so stressful. There has been many a time we have only just made rent and not had money to buy food for ourselves just the kids.

NCOSS Cost of Living Report June 2015
22
Families – particularly sole parent families and those in regional areas – are also struggling to pay back their debts to family members, and around 1 in 10 (1 in 6 for sole parent families) put off paying outstanding fines. Half of families in regional areas (42% overall) reported being unable to raise $2,000 within a week to pay for something important.
Have you forgone or put off any of the following in the last 12 months due to a lack of finances?
All Sydney Regional NSW
Single person with children
Couple with children
Paying back a debt to a family member or friend 23% 18% 30% 31% 20%
Paying back a debt to another lender 16% 16% 16% 23% 14%
Paying outstanding fines 10% 12% 8% 16% 9%
Over the past 12 months, which best describes your weekly finances of you or your family?
All Sydney Regional NSW
Single person with children
Couple with children
I/we spend more money than I receive 22% 18% 26% 30% 19%
I/we break even most weeks 49% 51% 47% 51% 50%I/we am able to save some
money most week 24% 25% 23% 13% 27%
I/we am able to save a lot of money most weeks 2% 2% 2% 3% 2%
Don't know 2% 4% 1% 3% 2%

NCOSS Cost of Living Report
23
How would you describe your household's financial situation?
All Sydney Regional NSW
Single person with children
Couple with children
I/we don't have enough money for basic essentials, like housing, food
and electricity9% 8% 11% 13% 9%
I/we have enough money for basic essentials, but nothing extra 45% 44% 46% 49% 43%
I/we have enough money for basic essentials and can afford the odd
luxury like going out to dinner35% 35% 35% 29% 38%
I/we have am financially comfortable and can afford to do things like travel 8% 10% 6% 7% 8%
Don't know 2% 3% 2% 2% 3%
In the last two years, do you think your household's income has:
All Sydney Regional NSW
Single person with children
Couple with children
Gone up more than the cost of living 13% 14% 11% 10% 13%Fallen behind the cost of living 53% 52% 54% 64% 51%
Stayed even with the cost of living 28% 27% 29% 19% 31%Don't know 6% 7% 6% 7% 5%
Given your current needs and financial responsibilities, would you describe yourself as:
All Sydney Regional NSW
Single person with children
Couple with children
Very comfortable 3% 5% 1% 1% 3%Comfortable 20% 23% 16% 13% 23%
Just getting along 47% 48% 47% 42% 48%Struggling 19% 15% 23% 27% 16%
Struggling a lot 9% 8% 12% 16% 8%Don't know 1% 1% 1% 1% 2%

NCOSS Cost of Living Report June 2015
24
In terms of your own level of personal debt do you:
All Sydney Regional NSW
Single person with children
Couple with children
owe a lot more than I can afford 16% 13% 19% 21% 15%
owe a little more than I can afford 24% 25% 23% 33% 21%
owe about what I can afford 36% 36% 35% 22% 40%
owe less than I can afford 7% 9% 5% 3% 9%
I do not have debts 17% 17% 17% 21% 15%
Low to middle income families in NSW are employing a range of measures to meet their immediate financial needs including:
• Borrowing money from family or friends (32%)• Taking out a short-term pay day loan (9%)• Using the services of a charity or welfare agency (14%)• Trading in goods at Cash Converters or similar (10%)• Selling an item of value (i.e. a car, jewellery or electronics) (20%)• Transferring money out of a long-term savings account (23%)• Increasing the limit on an existing credit card, or take out a new card (12%)• Taking out a personal loan (9%)• Taking out an overdraft or redraw on an existing loan (i.e. your home loan) (7%)• Taking a job or an additional job (13%)• Requesting additional work or overtime work (13%)
Around 1 in 3 survey respondents (29%) took none of these actions to meet their immediate needs over the past 12 months.
7.2 HousingWhile a majority of survey respondents report owning their own home or having a mortgage (52%), this proportion was higher for families headed by a couple (59%), and a majority of sole parent families rent their property (57%) or live in social housing (3%).

NCOSS Cost of Living Report
25
7.2.1 Housing StressWhile there are several definitions of Housing Stress, this report uses a modified version of the “30 only rule” - the most basic of the ratio measures of housing stress. According to this rule, a household is defined to be in housing stress if it spends more than 30 per cent of its disposable or gross income on housing costs34. This rule was modified for this report by restricting the survey to NSW families with dependent children with household incomes less than the median (approx. $75,000).
The data indicates that a majority (58%) of NSW families on low to middle incomes are experiencing housing stress. Survey respondents in regional areas were just as likely to report housing stress as those in Sydney. The different experience of more severe housing stress for sole parent families when compared couples with children was more pronounced – 32% of sole parent families reported spending more than half of their income on housing, compared to 17% for couples with children.
While the majority of respondents indicated that they were confident in their ability to meet their housing costs into the future, a significant minority in Sydney (37%) and Regional NSW (40%) were either not confident or unsure. Sole parents were significantly more likely to report uncertainty about their future capacity to meet their housing costs, with a majority (53%) of families headed by a sole person indicating that they were either unsure, or not confident about their ability to meet their housing costs into the foreeable future, compared to 36% of families headed by a couple.
34 - Nepal B, et al, Measuring housing stress at small area levels: How much do definitions matter? Paper prepared for the 3rd Australian Housing Researchers Conference, Melbourne, 18 – 20 June 2008.

NCOSS Cost of Living Report June 2015
26
7.2.2 Perceptions of the adequacy of housing and ability to meet housing costsSurvey respondents generally reported high levels of satisfaction with the specific aspects of their housing discussed with them, including the safety of the area they live in, the convenience of their location, the amenity of their location, the appropriateness of the dwelling size and the availability of study and/or play areas for their children. That said, a significant minority of sole parent families (34%) and couple families (25%) reported dissatisfaction with the state of repair of their housing.
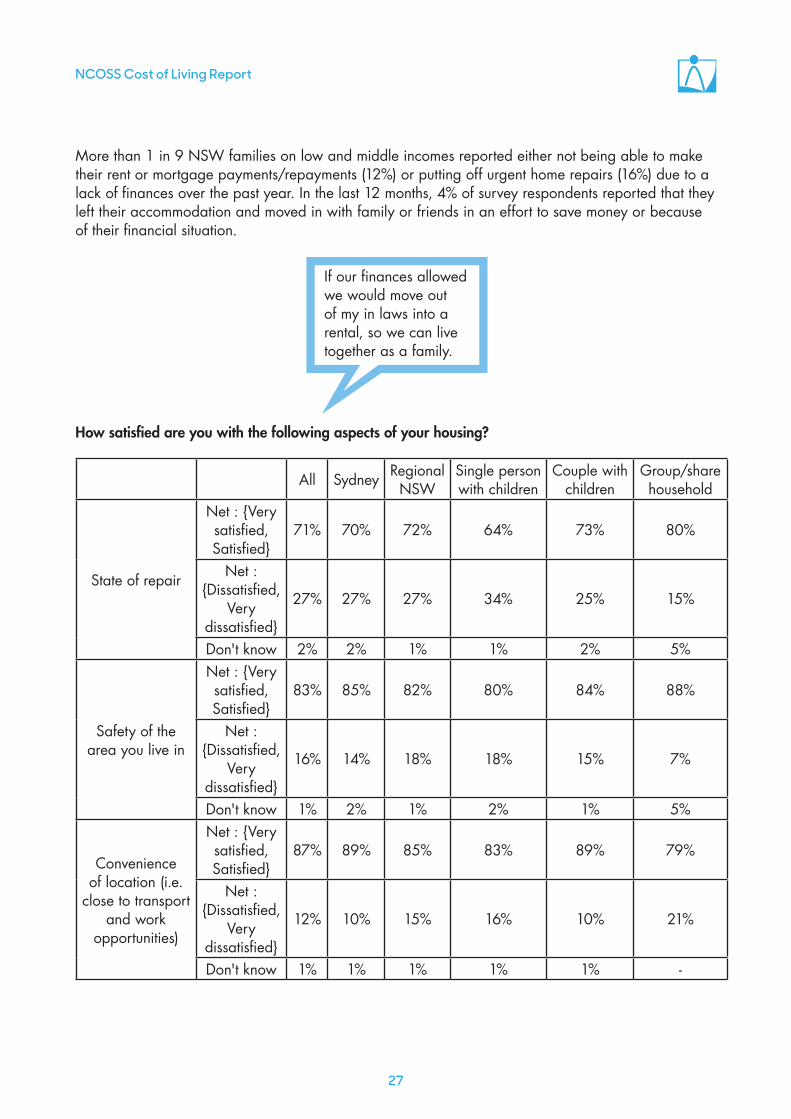
If our finances allowed we would move out of my in laws into a rental, so we can live together as a family.
NCOSS Cost of Living Report
27
More than 1 in 9 NSW families on low and middle incomes reported either not being able to make their rent or mortgage payments/repayments (12%) or putting off urgent home repairs (16%) due to a lack of finances over the past year. In the last 12 months, 4% of survey respondents reported that they left their accommodation and moved in with family or friends in an effort to save money or because of their financial situation.
How satisfied are you with the following aspects of your housing?
All Sydney Regional NSW
Single person with children
Couple with children
Group/share household
State of repair
Net : {Very satisfied, Satisfied}
71% 70% 72% 64% 73% 80%
Net : {Dissatisfied,
Very dissatisfied}
27% 27% 27% 34% 25% 15%
Don't know 2% 2% 1% 1% 2% 5%
Safety of the area you live in
Net : {Very satisfied, Satisfied}
83% 85% 82% 80% 84% 88%
Net : {Dissatisfied,
Very dissatisfied}
16% 14% 18% 18% 15% 7%
Don't know 1% 2% 1% 2% 1% 5%
Convenience of location (i.e.
close to transport and work
opportunities)
Net : {Very satisfied, Satisfied}
87% 89% 85% 83% 89% 79%
Net : {Dissatisfied,
Very dissatisfied}
12% 10% 15% 16% 10% 21%
Don't know 1% 1% 1% 1% 1% -

NCOSS Cost of Living Report June 2015
28
Amenity of location (i.e. local parks,
schools, shops and services)
Net : {Very satisfied, Satisfied}
88% 89% 88% 92% 87% 93%
Net : {Dissatisfied,
Very dissatisfied}
11% 10% 12% 7% 13% 7%
Don't know 1% 1% 1% 1% 1% -
Appropriateness of dwelling (size is appropriate for your family
etc.)
Net : {Very satisfied, Satisfied}
75% 74% 77% 71% 76% 85%
Net : {Dissatisfied,
Very dissatisfied}
24% 25% 23% 28% 23% 15%
Don't know 1% 1% 1% 1% 1% -
Availability of study or play areas for your
children
Net : {Very satisfied, Satisfied}
75% 75% 75% 78% 75% 55%
Net : {Dissatisfied,
Very dissatisfied}
24% 23% 25% 21% 23% 42%
Don't know 2% 2% 1% 1% 2% 3%
7.3 ConnectednessHolidays, eating out, special meals, and leisure and hobby activities are crucial for wellbeing and connecting parents and children with each other, their friends and their community. But many low and middle income families are unable to afford these items, or can only afford them for their children, not themselves.
A majority of low to middle income families reported being unable to afford an annual holiday, a night out once a fortnight, or leisure or hobby activities. This was most pronounced for survey respondents in regional areas and sole parent families, who were significantly more likely to report that these items were unaffordable.
They need new bed mattresses and pillows. Also one daughter needs $500 worth of dental treatment. I would like to take them to Jambaroo fun park, we have never been.

NCOSS Cost of Living Report
29
A majority of sole parent families reported that they were unable to afford a special meal once a week, and that they were only able to afford second hand clothes most of the time.
All Sydney Regional NSW
Single person with children
Couple with children
I can afford a holiday for at least one week a year
Yes 45% 53% 35% 31% 49%No 55% 47% 65% 69% 51%
I can afford a night out once a fortnight
Yes 34% 41% 27% 29% 35%No 66% 59% 73% 71% 65%
I can afford to have friends or family over for a meal once a
month
Yes 65% 65% 65% 53% 69%
No 35% 35% 35% 47% 31%
I can afford a special meal once a week
Yes 57% 60% 54% 48% 59%No 43% 40% 46% 52% 41%
I can only afford second hand clothes most of the time
Yes 43% 44% 42% 54% 38%No 57% 56% 58% 46% 62%
I can afford leisure or hobby activities
Yes 44% 49% 38% 34% 48%No 56% 51% 62% 66% 52%
Low to middle income families are also going without due to a lack of finances to make ends meet, with adult members of the household significantly more likely to forgo or put off purchases for themselves than their children. Four in ten adults have gone without or put off buying clothing, footwear or haircuts for themselves, however one in four parents reported limiting extracurricular or after school/weekend activities, and one in six reported putting off or forgoing haircuts for their children due to finances.
Have you forgone or put off any of the following in the last 12 months due to a lack of finances? Please select all that apply.
All Sydney Regional NSW
Single person with children
Couple with children
Buying clothing or footwear for adult members of the household (yourself
included) 41% 36% 48% 60% 36%
Buying clothing or footwear for child members of the household 17% 15% 19% 20% 16%
Limit extracurricular or after-school/weekend activities for your children 26% 23% 29% 35% 24%
Haircuts for adult members of the household (yourself included) 42% 35% 49% 60% 36%
Haircuts for child members of the household 16% 13% 20% 27% 13%
None of these 20% 26% 14% 13% 23%
NCOSS Cost of Living Report June 2015
30
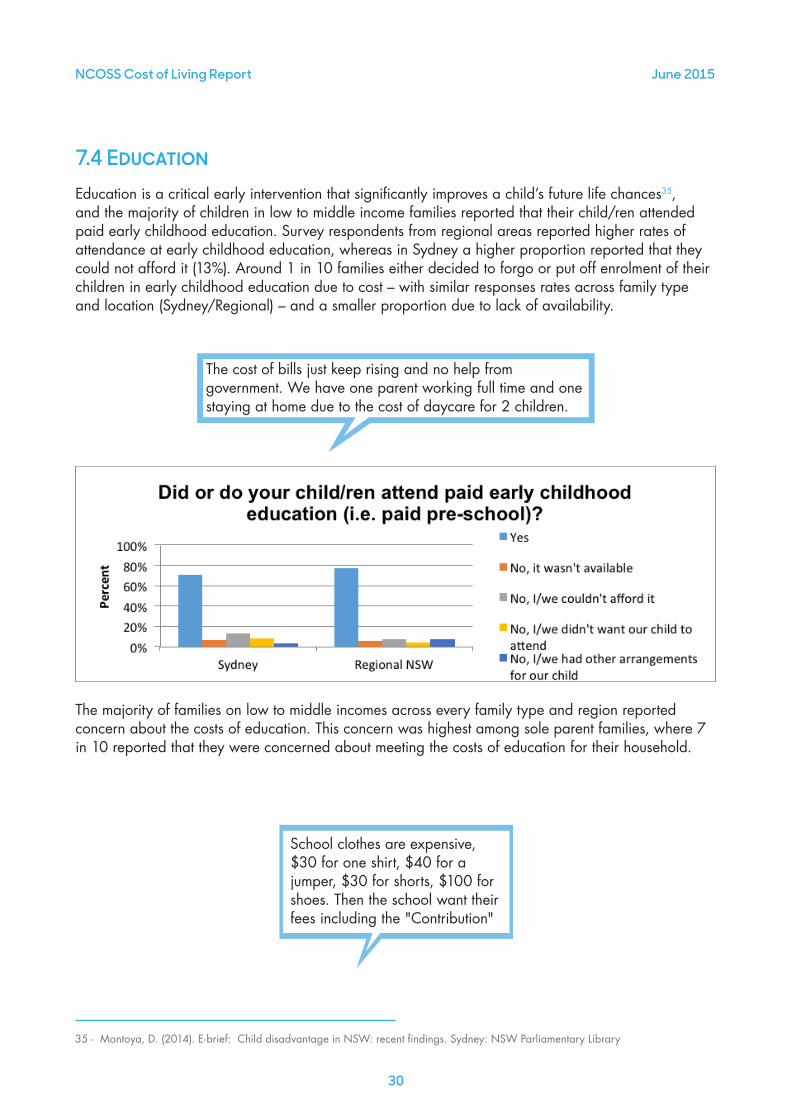
7.4 EducationEducation is a critical early intervention that significantly improves a child’s future life chances35, and the majority of children in low to middle income families reported that their child/ren attended paid early childhood education. Survey respondents from regional areas reported higher rates of attendance at early childhood education, whereas in Sydney a higher proportion reported that they could not afford it (13%). Around 1 in 10 families either decided to forgo or put off enrolment of their children in early childhood education due to cost – with similar responses rates across family type and location (Sydney/Regional) – and a smaller proportion due to lack of availability.
The majority of families on low to middle incomes across every family type and region reported concern about the costs of education. This concern was highest among sole parent families, where 7 in 10 reported that they were concerned about meeting the costs of education for their household.
The cost of bills just keep rising and no help from government. We have one parent working full time and one staying at home due to the cost of daycare for 2 children.
35 - Montoya, D. (2014). E-brief: Child disadvantage in NSW: recent findings. Sydney: NSW Parliamentary Library
School clothes are expensive, $30 for one shirt, $40 for a jumper, $30 for shorts, $100 for shoes. Then the school want their fees including the "Contribution"

NCOSS Cost of Living Report
31
How concerned or unconcerned are you about meeting the current costs of education for your household?
All Sydney Regional NSW Single person with children
Couple with children
Very concerned 21% 22% 20% 24% 21%Quite concerned 37% 38% 36% 45% 34%
Not very concerned 25% 20% 31% 19% 27%Not at all concerned 9% 12% 6% 7% 10%
Don't know 1% 1% * - 1%Household does not have this
expense 6% 6% 6% 4% 7%
Around one in five low to middle income families reported that they did not enrol their children in swimming lessons or sporting teams because they could not afford it, and one in four could not afford paid tutoring for their children. Around one in eight families reported that they decided to forgo or put off allowing their child to attend a school excursion, event or camp due to lack of finances in the last 12 months.
During the last 12 months 5% of survey respondents (8% in sole parent households) pulled out of a course or other study in an effort to save money or because of their financial situation.
7.5 TransportFamilies on low and middle incomes are heavily reliant on car transport – 87% (94% in regional areas) reporting that they own or have easy access to a car. While six out of ten respondents indicated that they have easy access to public transport, that figure was significantly lower in regional areas (45%). Almost half (47%) of families in regional areas put off or were unable to afford a service for their car, and a quarter (23%) put off or were unable to afford urgent car repairs, due to a lack of finances in the last 12 months. Almost half of all respondents (48%) reported limiting driving or other travel in the last 12 months in an effort to save money or because of their financial situation, with higher rates reported among families living in regional areas (54%) and sole parent families (51%).
Does your household own or have easy access to:
Base Sydney Regional NSW Single person with children
Couple with children
Public transport 62% 76% 45% 58% 63%A car 87% 81% 94% 88% 88%
None of these 1% 1% 1% 1% 1%
(I am concerned that I) have a car I cannot maintain and cannot meet any extra bills so hopefully we stay healthy so no unexpected bills

NCOSS Cost of Living Report June 2015
32
7.6 FoodWhile ABS data shows that the cost of food has only risen slightly faster than CPI over the past 10 years, low and middle income families are clearly using their food and grocery bill as a mechanism to reduce household costs. One in five respondents (43% in sole parent households) reported they had gone without meals themselves in an effort to save money or because of their financial situation.
In the last 12 months have you gone without meals yourself in an effort to save money or because of your financial situation? (Yes)
Many low and middle income families reported taking a number of actions in an effort to save money, including making rather than buying household items, having a weekly menu plan that they didn’t deviate from, and cutting back or cutting out treats for themselves, and cutting back or cutting out treats for their children. Three quarters of respondents reported buying cheaper, lesser quality food and household products in an effort to save money.
NCOSS Cost of Living Report
33
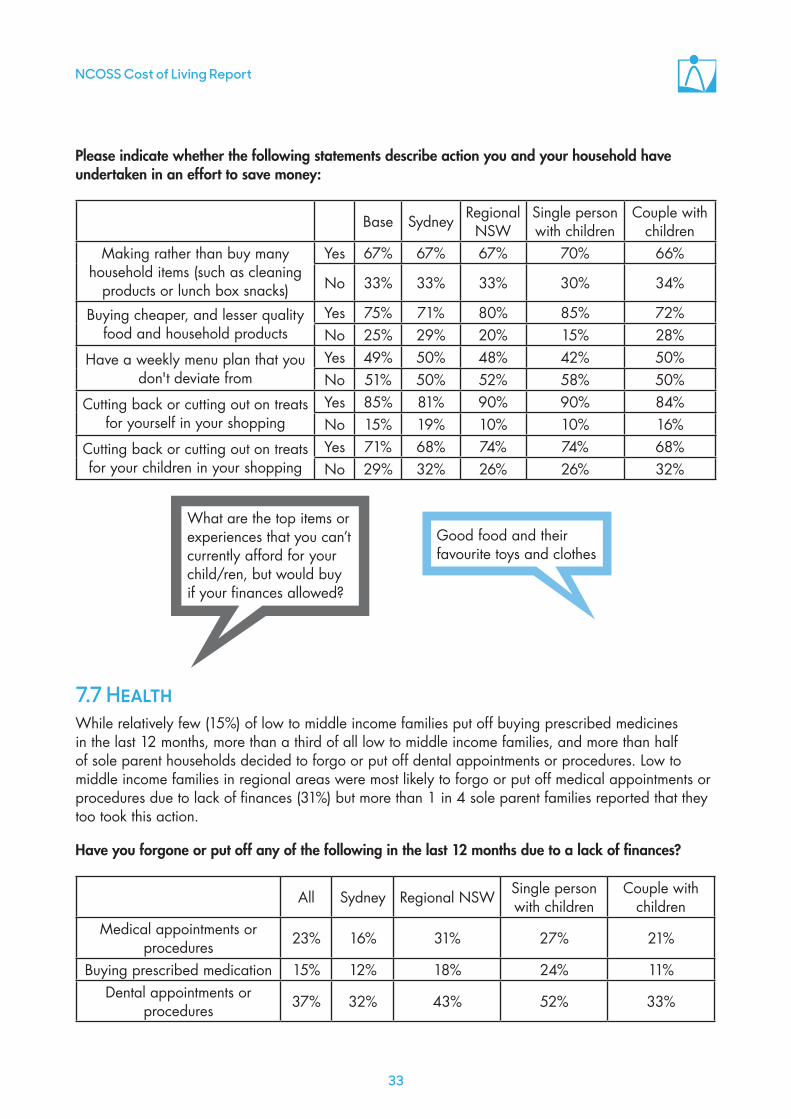
Please indicate whether the following statements describe action you and your household have undertaken in an effort to save money:
Base Sydney Regional NSW
Single person with children
Couple with children
Making rather than buy many household items (such as cleaning
products or lunch box snacks)
Yes 67% 67% 67% 70% 66%
No 33% 33% 33% 30% 34%
Buying cheaper, and lesser quality food and household products
Yes 75% 71% 80% 85% 72%No 25% 29% 20% 15% 28%
Have a weekly menu plan that you don't deviate from
Yes 49% 50% 48% 42% 50%No 51% 50% 52% 58% 50%
Cutting back or cutting out on treats for yourself in your shopping
Yes 85% 81% 90% 90% 84%No 15% 19% 10% 10% 16%
Cutting back or cutting out on treats for your children in your shopping
Yes 71% 68% 74% 74% 68%No 29% 32% 26% 26% 32%
7.7 HealthWhile relatively few (15%) of low to middle income families put off buying prescribed medicines in the last 12 months, more than a third of all low to middle income families, and more than half of sole parent households decided to forgo or put off dental appointments or procedures. Low to middle income families in regional areas were most likely to forgo or put off medical appointments or procedures due to lack of finances (31%) but more than 1 in 4 sole parent families reported that they too took this action.
Have you forgone or put off any of the following in the last 12 months due to a lack of finances?
All Sydney Regional NSW Single person with children
Couple with children
Medical appointments or procedures 23% 16% 31% 27% 21%
Buying prescribed medication 15% 12% 18% 24% 11%Dental appointments or
procedures 37% 32% 43% 52% 33%
What are the top items or experiences that you can’t currently afford for your child/ren, but would buy if your finances allowed?
Good food and their favourite toys and clothes
NCOSS Cost of Living Report June 2015
34
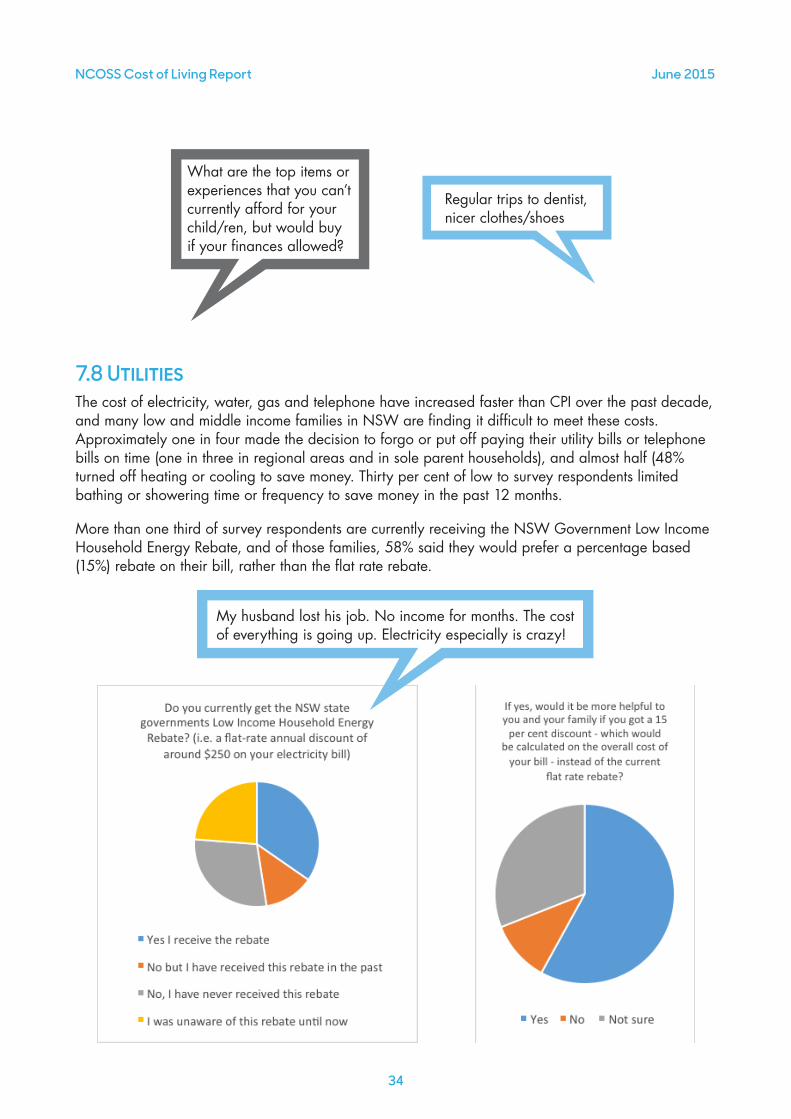
7.8 UtilitiesThe cost of electricity, water, gas and telephone have increased faster than CPI over the past decade, and many low and middle income families in NSW are finding it difficult to meet these costs. Approximately one in four made the decision to forgo or put off paying their utility bills or telephone bills on time (one in three in regional areas and in sole parent households), and almost half (48% turned off heating or cooling to save money. Thirty per cent of low to survey respondents limited bathing or showering time or frequency to save money in the past 12 months.
More than one third of survey respondents are currently receiving the NSW Government Low Income Household Energy Rebate, and of those families, 58% said they would prefer a percentage based (15%) rebate on their bill, rather than the flat rate rebate.
What are the top items or experiences that you can’t currently afford for your child/ren, but would buy if your finances allowed?
Regular trips to dentist, nicer clothes/shoes
My husband lost his job. No income for months. The cost of everything is going up. Electricity especially is crazy!

NCOSS Cost of Living Report
35
8. Raising children – the perspectives of families on low to middle incomes
In this chapter we listen to the voices of low and middle income families directly, by asking them to answer in their own voice, what they have found stressful about managing on their household’s income, the key things that place pressure on their household budget (in terms of raising their children), and the top experiences they cannot currently afford for their children but would buy if finances allowed. We also look at concerns that low and middle income families in NSW have about meeting a range of essential items, and how concerned they would be about changes to the GST.
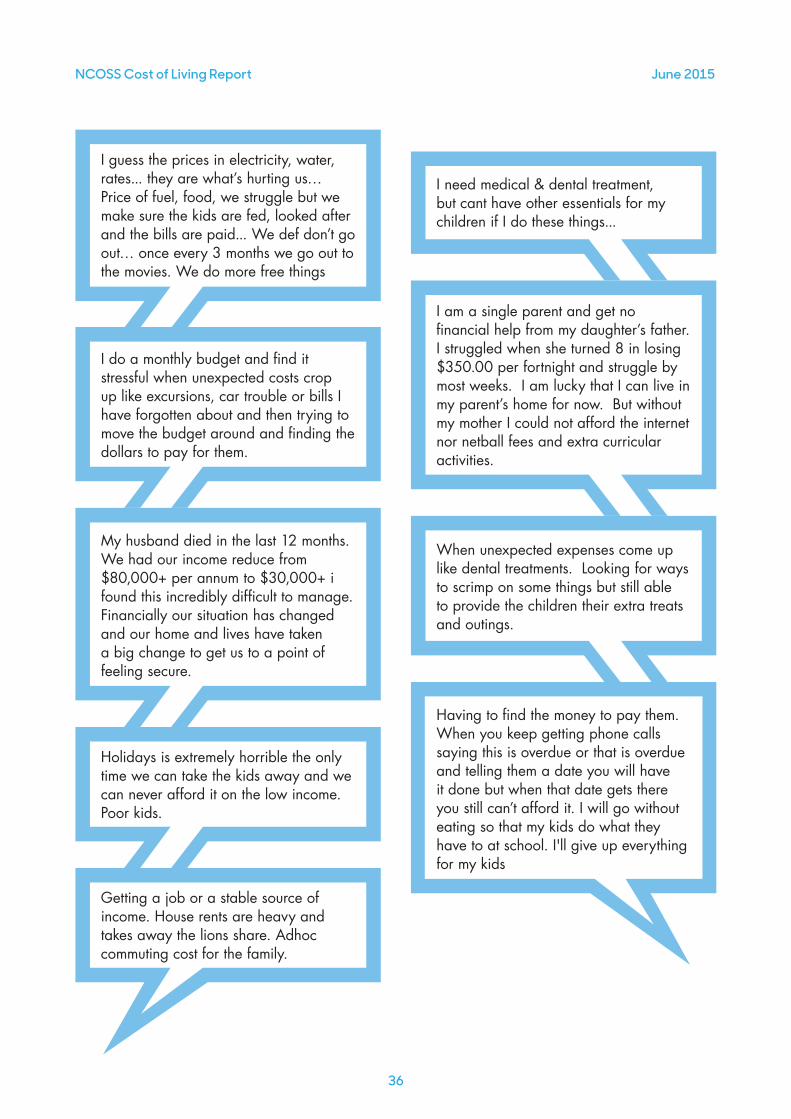
8.1 What Have You Found Most Stressful About Managing On Your Household’s Income?Survey respondents were asked to indicate via free text, open ended responses what they found most stressful about managing on their household’s income. Some of the key themes that emerged from the data include housing costs, bills generally (with a significant proportion highlighting electricity bills and unexpected bills), the cost of food and groceries, lack of or insufficient paid employment, the costs of running a car and education costs. Several reported that they felt guilt at not being able to afford gifts and extra-curricular or leisure activities for their children.
What have you found most stressful about managing on your household’s income?
NCOSS Cost of Living Report June 2015
36
I guess the prices in electricity, water, rates... they are what’s hurting us… Price of fuel, food, we struggle but we make sure the kids are fed, looked after and the bills are paid... We def don’t go out… once every 3 months we go out to the movies. We do more free things
I am a single parent and get no financial help from my daughter’s father. I struggled when she turned 8 in losing $350.00 per fortnight and struggle by most weeks. I am lucky that I can live in my parent’s home for now. But without my mother I could not afford the internet nor netball fees and extra curricular activities.
My husband died in the last 12 months. We had our income reduce from $80,000+ per annum to $30,000+ i found this incredibly difficult to manage. Financially our situation has changed and our home and lives have taken a big change to get us to a point of feeling secure.
Having to find the money to pay them. When you keep getting phone calls saying this is overdue or that is overdue and telling them a date you will have it done but when that date gets there you still can’t afford it. I will go without eating so that my kids do what they have to at school. I'll give up everything for my kids
Holidays is extremely horrible the only time we can take the kids away and we can never afford it on the low income. Poor kids.
I need medical & dental treatment, but cant have other essentials for my children if I do these things...
I do a monthly budget and find it stressful when unexpected costs crop up like excursions, car trouble or bills I have forgotten about and then trying to move the budget around and finding the dollars to pay for them.
When unexpected expenses come up like dental treatments. Looking for ways to scrimp on some things but still able to provide the children their extra treats and outings.
Getting a job or a stable source of income. House rents are heavy and takes away the lions share. Adhoc commuting cost for the family.
NCOSS Cost of Living Report
37
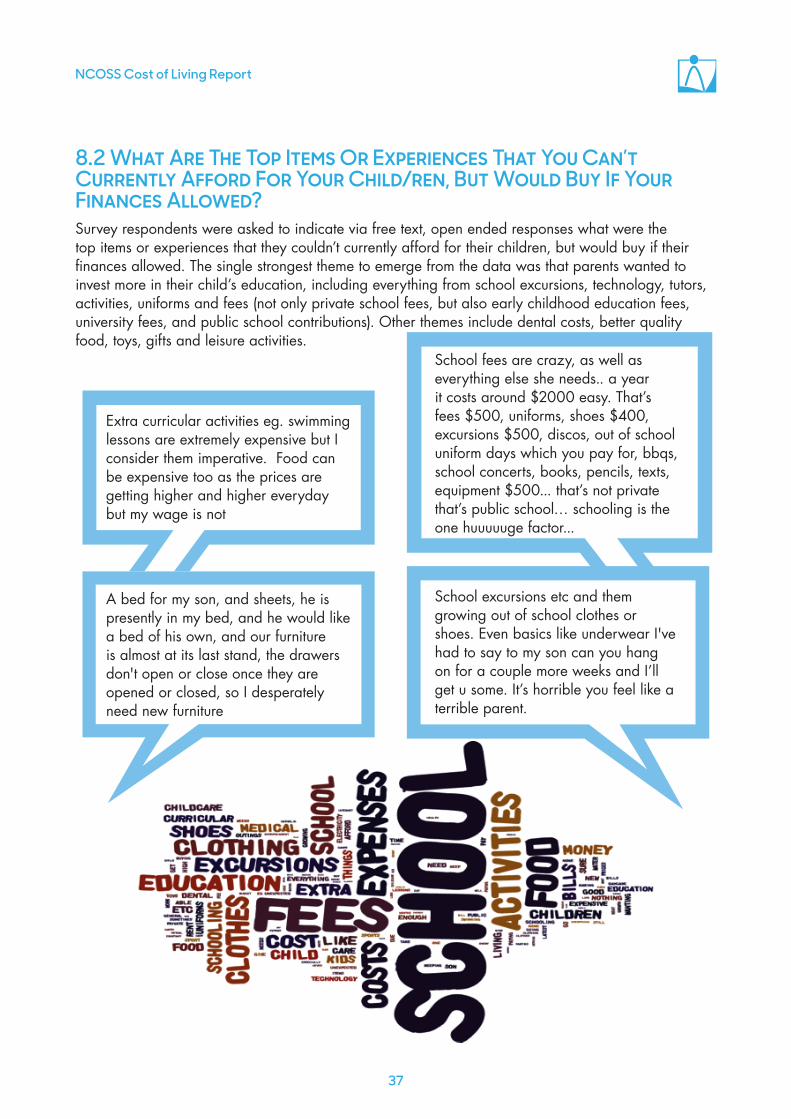
8.2 What Are The Top Items Or Experiences That You Can’t Currently Afford For Your Child/ren, But Would Buy If Your Finances Allowed? Survey respondents were asked to indicate via free text, open ended responses what were the top items or experiences that they couldn’t currently afford for their children, but would buy if their finances allowed. The single strongest theme to emerge from the data was that parents wanted to invest more in their child’s education, including everything from school excursions, technology, tutors, activities, uniforms and fees (not only private school fees, but also early childhood education fees, university fees, and public school contributions). Other themes include dental costs, better quality food, toys, gifts and leisure activities.
School fees are crazy, as well as everything else she needs.. a year it costs around $2000 easy. That’s fees $500, uniforms, shoes $400, excursions $500, discos, out of school uniform days which you pay for, bbqs, school concerts, books, pencils, texts, equipment $500... that’s not private that’s public school… schooling is the one huuuuuge factor...
Extra curricular activities eg. swimming lessons are extremely expensive but I consider them imperative. Food can be expensive too as the prices are getting higher and higher everyday but my wage is not
School excursions etc and them growing out of school clothes or shoes. Even basics like underwear I've had to say to my son can you hang on for a couple more weeks and I’ll get u some. It’s horrible you feel like a terrible parent.
A bed for my son, and sheets, he is presently in my bed, and he would like a bed of his own, and our furniture is almost at its last stand, the drawers don't open or close once they are opened or closed, so I desperately need new furniture
NCOSS Cost of Living Report June 2015
38
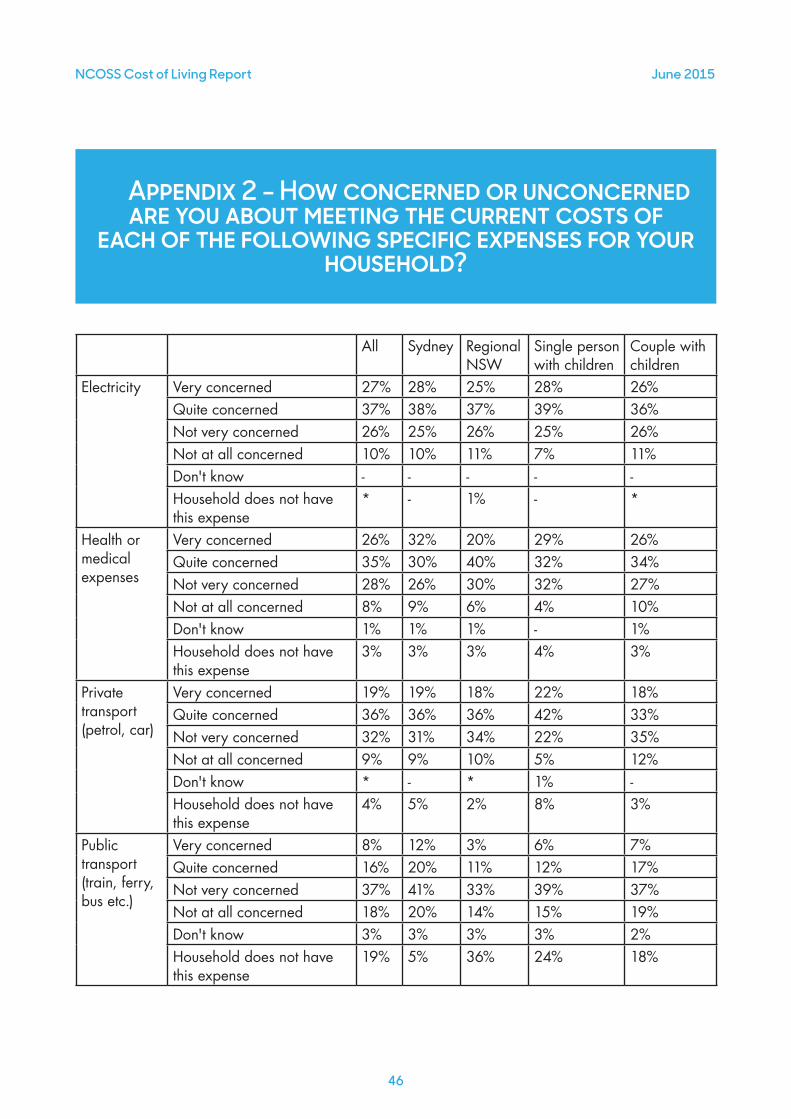
8.3 How Concerned Or Unconcerned Are You About Meeting The Current Costs Of Each Of The Following Specific Expenses For Your Household? Survey respondents were asked to outline their level of concern about their ability to meet the current costs of a range of household items. Detailed responses are at appendix 2.
The data indicates that a majority of NSW families on low and middle incomes are concerned about meeting the current costs of health (61%), education (58%), housing (55%), groceries (57%), running their car (55%) and electricity (54%). Significant minorities were concerned about their ability to meet the current costs of fresh food (44%), insurance (46%), phone and internet (45%). Some were also concerned about their ability to meet the costs of water (39%), public transport (24%) and gas (35%) – although it should be noted that 31% did not have gas connected.
Sole parent families reported higher levels of concern about all items except public transport, home insurance and gas (although sole parent households were significantly more likely to report that they did not have gas connected or home insurance). More than 67% of sole parent families were concerned about their ability to meet their housing costs.
Sydney families were more likely to report concern about their ability to meet their housing costs, the cost of education and the cost of public transport than their regional counterparts. Regional families were more likely to report concern about meeting the cost of internet (50%) than Sydney families (44%).
Would love to pay for pre school, taking them to a petting zoo type thing, taking them to shows they like eg. the Wiggles
NCOSS Cost of Living Report
39
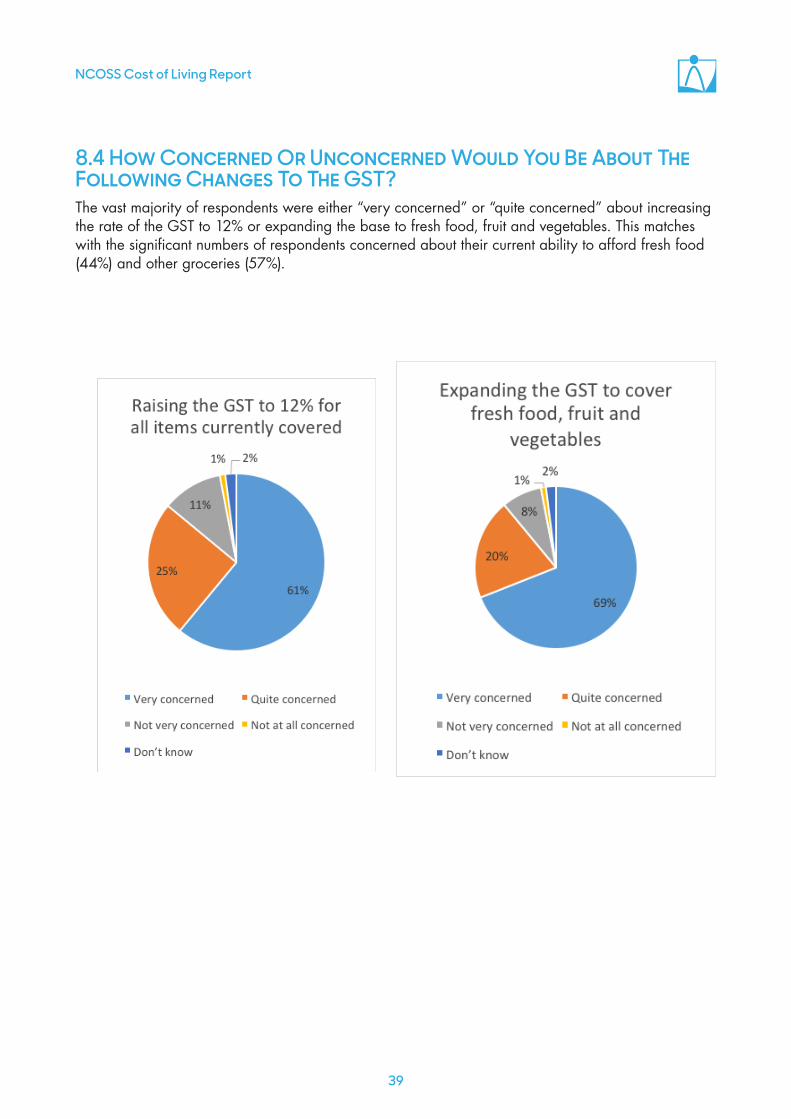
8.4 How Concerned Or Unconcerned Would You Be About The Following Changes To The GST?The vast majority of respondents were either “very concerned” or “quite concerned” about increasing the rate of the GST to 12% or expanding the base to fresh food, fruit and vegetables. This matches with the significant numbers of respondents concerned about their current ability to afford fresh food (44%) and other groceries (57%).

NCOSS Cost of Living Report June 2015
40
9. Conclusions
On the one hand it seems obvious that families on low and middle incomes (ie the median - less than $75,000) are struggling to meet the costs that are essential to achieve a decent life for them and their families. That said, this report is useful in quantifying some of those challenges, and in hearing the voices of the people who are working hard to raise their families on low to middle incomes. A number of conclusions can be drawn from the data:
1. The costs that make up many of the essentials of life for low to middle income families are rising faster than the CPI - in particular, the cost of housing, health and utilities.
2. Many NSW families on low and middle incomes are living pay cheque to pay cheque. 40% of survey respondents report they cannot afford $500 in emergency savings, and more than half of sole parent families say they cannot afford this financial buffer.
3. Many NSW families on low to middle incomes – particularly sole parent families – can’t afford essential housing related costs, and a majority (58%) are experiencing housing stress. At least 1 in 5 low to middle income families cannot afford a decent and secure home, a roof and gutters that don’t leak or a separate bedroom for every child over 10. One in three can’t afford home and contents insurance and 17% can’t afford secure locks.
4. The cost of dental treatment is out of reach for many families – particularly in regional NSW. While most respondents indicated that they could afford medical treatment and buy prescription medicines, dental treatment was out of reach for more than one in three low to middle income families in regional NSW, and more than two out of five sole parent families.
5. Hobbies, outings and school activities for children are unaffordable for many low and middle income families. These items are particularly unaffordable for sole parent families.
6. Parents are employing a number of strategies to make ends meet, including making personal sacrifices to improve their children’s standard of living.
7. NSW families on low to middle incomes are particularly “stressed” about their ability to manage the cost of a range of essential items, including housing, bills generally (with a significant proportion highlighting electricity bills and unexpected bills), the cost of food and groceries, lack of or insufficient paid employment, vehicle running costs and education costs.
8. Some parents on low to middle incomes report that they carry a level of “guilt” about their capacity to provide a decent standard of living for their children, but most parents on low to middle incomes would invest more in their child’s education through extra-curricular activities, technology, books, fees, and clothes: if they could afford it.

NCOSS Cost of Living Report
41
9. A majority of NSW families on low and middle incomes are either very or quite concerned about their ability to meet their current costs of healthcare, education, housing, groceries, running their car and electricity. Significant minorities were concerned about their ability to meet the current costs of fresh food, insurance, phone and internet.
10. More than 67% of sole parent families are concerned about their ability to meet their housing costs. Sole parent families also reported higher levels of concern about their ability to meet the cost of many other items.
11. More than one third of survey respondents are currently receiving the NSW Government Low Income Household Energy Rebate, and of those families, 58% said they would prefer a percentage based (15%) rebate on their bill, rather than the flat rate rebate.
12. Sydney families on low to middle incomes are more likely to report concern about their ability to meet their housing costs, the cost of education and the cost of public transport than their regional counterparts.
13. Regional families on low to middle incomes are more likely to report concern about meeting the cost of internet than Sydney families.
14. Families on low to middle income are very concerned about the potential for an increase to the rate or base of the GST. More than 6 in 10 are opposed to expanding the base of the GST to cover fresh food, and almost 7 in 10 are opposed to increasing the rate to 12%.
NCOSS Cost of Living Report June 2015
42
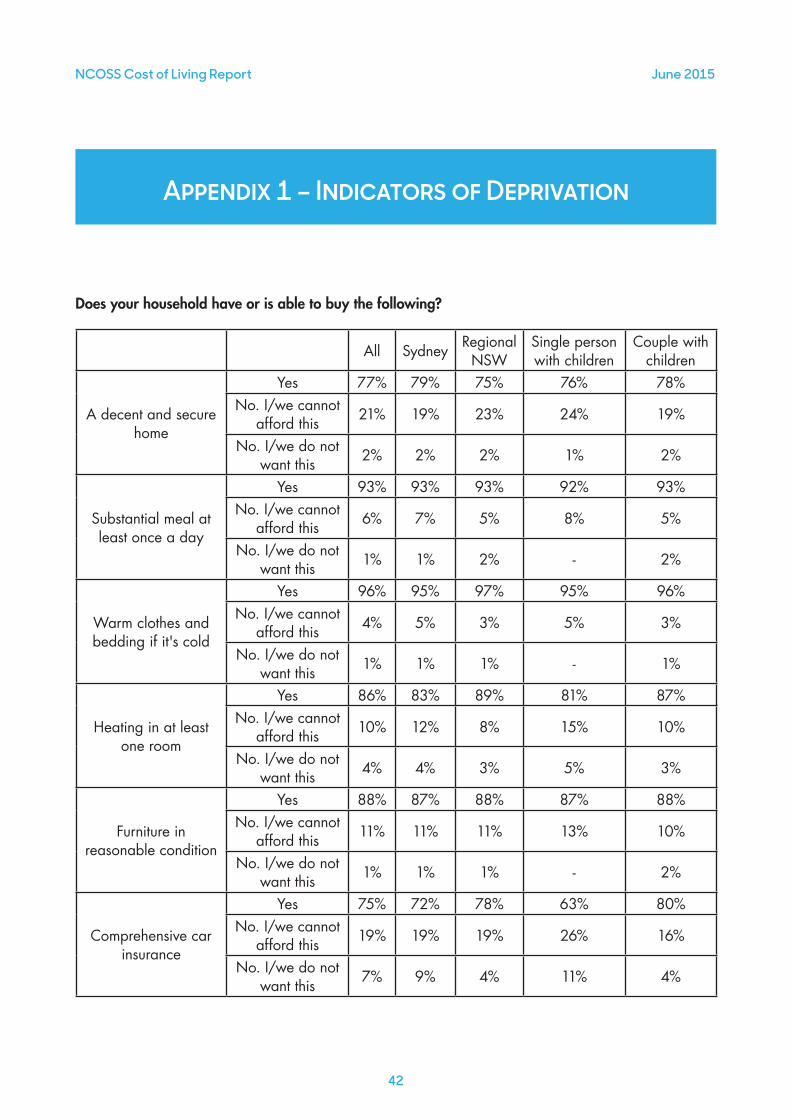
Appendix 1 – Indicators of Deprivation
Does your household have or is able to buy the following?
All Sydney Regional NSW
Single person with children
Couple with children
A decent and secure home
Yes 77% 79% 75% 76% 78%No. I/we cannot
afford this 21% 19% 23% 24% 19%
No. I/we do not want this 2% 2% 2% 1% 2%
Substantial meal at least once a day
Yes 93% 93% 93% 92% 93%No. I/we cannot
afford this 6% 7% 5% 8% 5%
No. I/we do not want this 1% 1% 2% - 2%
Warm clothes and bedding if it's cold
Yes 96% 95% 97% 95% 96%No. I/we cannot
afford this 4% 5% 3% 5% 3%
No. I/we do not want this 1% 1% 1% - 1%
Heating in at least one room
Yes 86% 83% 89% 81% 87%No. I/we cannot
afford this 10% 12% 8% 15% 10%
No. I/we do not want this 4% 4% 3% 5% 3%
Furniture in reasonable condition
Yes 88% 87% 88% 87% 88%No. I/we cannot
afford this 11% 11% 11% 13% 10%
No. I/we do not want this 1% 1% 1% - 2%
Comprehensive car insurance
Yes 75% 72% 78% 63% 80%No. I/we cannot
afford this 19% 19% 19% 26% 16%
No. I/we do not want this 7% 9% 4% 11% 4%
NCOSS Cost of Living Report
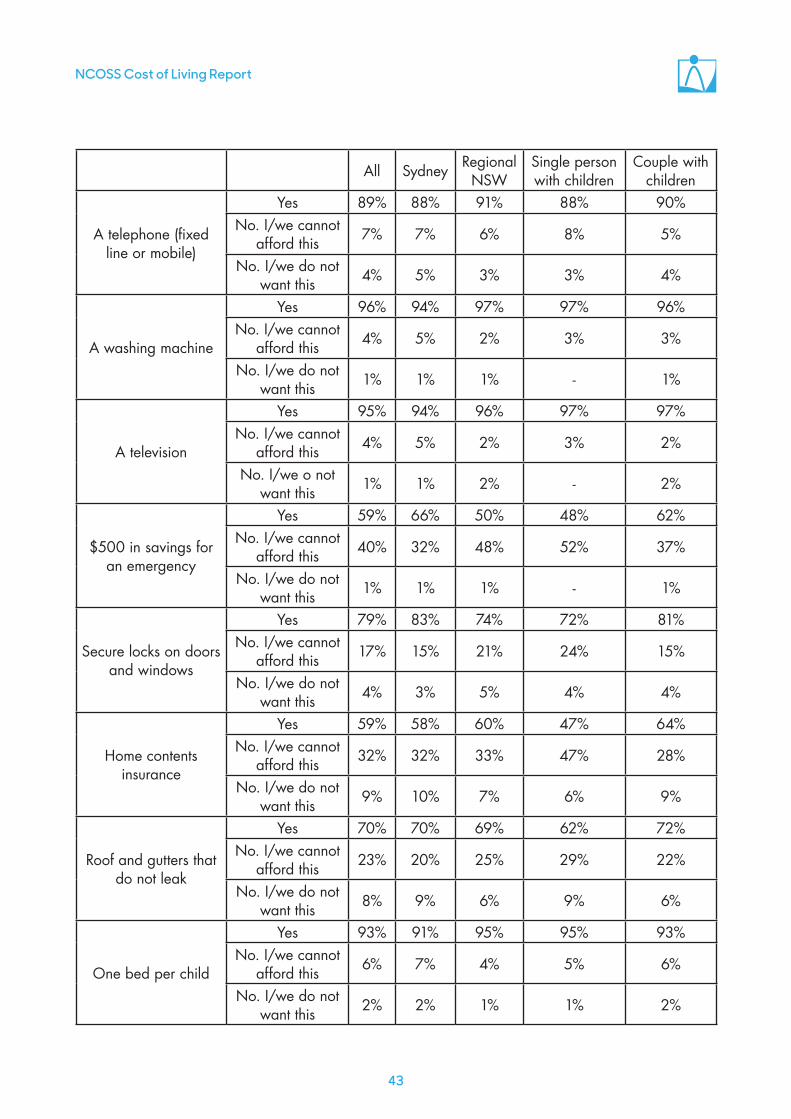
43
All Sydney Regional NSW
Single person with children
Couple with children
A telephone (fixed line or mobile)
Yes 89% 88% 91% 88% 90%No. I/we cannot
afford this 7% 7% 6% 8% 5%
No. I/we do not want this 4% 5% 3% 3% 4%
A washing machine
Yes 96% 94% 97% 97% 96%No. I/we cannot
afford this 4% 5% 2% 3% 3%
No. I/we do not want this 1% 1% 1% - 1%
A television
Yes 95% 94% 96% 97% 97%No. I/we cannot
afford this 4% 5% 2% 3% 2%
No. I/we o not want this 1% 1% 2% - 2%
$500 in savings for an emergency
Yes 59% 66% 50% 48% 62%No. I/we cannot
afford this 40% 32% 48% 52% 37%
No. I/we do not want this 1% 1% 1% - 1%
Secure locks on doors and windows
Yes 79% 83% 74% 72% 81%No. I/we cannot
afford this 17% 15% 21% 24% 15%
No. I/we do not want this 4% 3% 5% 4% 4%
Home contents insurance
Yes 59% 58% 60% 47% 64%No. I/we cannot
afford this 32% 32% 33% 47% 28%
No. I/we do not want this 9% 10% 7% 6% 9%
Roof and gutters that do not leak
Yes 70% 70% 69% 62% 72%No. I/we cannot
afford this 23% 20% 25% 29% 22%
No. I/we do not want this 8% 9% 6% 9% 6%
One bed per child
Yes 93% 91% 95% 95% 93%No. I/we cannot
afford this 6% 7% 4% 5% 6%
No. I/we do not want this 2% 2% 1% 1% 2%

NCOSS Cost of Living Report June 2015
44
All Sydney Regional NSW
Single person with children
Couple with children
One bedroom per child over 10
Yes 70% 63% 77% 69% 72%No. I/we cannot
afford this 20% 23% 15% 20% 18%
No. I/we do not want this 11% 14% 8% 12% 10%
Medical treatment
Yes 87% 86% 89% 84% 89%No. I/we cannot
afford this 10% 12% 8% 14% 9%
No. I/we do not want this 3% 2% 3% 2% 2%
Dental check-ups for children
Yes 73% 73% 72% 68% 76%No. I/we cannot
afford this 24% 24% 24% 30% 21%
No. I/we do not want this 3% 3% 3% 1% 3%
Dental treatment
Yes 62% 64% 60% 58% 63%No. I/we cannot
afford this 34% 33% 36% 41% 33%
No. I/we do not want this 3% 3% 3% 1% 4%
Able to buy prescribed medication
Yes 90% 88% 92% 89% 90%No. I/we cannot
afford this 8% 9% 6% 10% 7%
No. I/we do not want this 2% 3% 2% 1% 3%
Presents for family or friends
Yes 74% 74% 75% 71% 76%No. I/we cannot
afford this 23% 22% 23% 28% 22%
No. I/we do not want this 3% 3% 2% 1% 2%
A hobby or leisure activity for children
Yes 70% 71% 69% 64% 72%No. I/we cannot
afford this 25% 24% 27% 33% 23%
No. I/we do not want this 5% 5% 4% 3% 5%
School books/clothes for children
Yes 87% 84% 91% 93% 87%No. I/we cannot
afford this 7% 8% 4% 5% 6%
No. I/we do not want this 6% 7% 4% 2% 7%
NCOSS Cost of Living Report
45
All Sydney Regional NSW
Single person with children
Couple with children
School activities/outings for children
Yes 78% 74% 83% 79% 78%No. I/we cannot
afford this 14% 17% 11% 18% 13%
No. I/we do not want this 8% 9% 6% 4% 9%
A connection to the internet
Yes 92% 91% 93% 90% 93%No. I/we cannot
afford this 7% 8% 6% 8% 6%
No. I/we do not want this 1% 1% 1% 2% 1%
NCOSS Cost of Living Report June 2015
46
Appendix 2 - How concerned or unconcerned are you about meeting the current costs of
each of the following specific expenses for your household?
All Sydney Regional NSW
Single person with children
Couple with children
Electricity Very concerned 27% 28% 25% 28% 26%Quite concerned 37% 38% 37% 39% 36%Not very concerned 26% 25% 26% 25% 26%Not at all concerned 10% 10% 11% 7% 11%Don't know - - - - -Household does not have this expense
* - 1% - *
Health or medical expenses
Very concerned 26% 32% 20% 29% 26%Quite concerned 35% 30% 40% 32% 34%Not very concerned 28% 26% 30% 32% 27%Not at all concerned 8% 9% 6% 4% 10%Don't know 1% 1% 1% - 1%Household does not have this expense
3% 3% 3% 4% 3%
Private transport (petrol, car)
Very concerned 19% 19% 18% 22% 18%Quite concerned 36% 36% 36% 42% 33%Not very concerned 32% 31% 34% 22% 35%Not at all concerned 9% 9% 10% 5% 12%Don't know * - * 1% -Household does not have this expense
4% 5% 2% 8% 3%
Public transport (train, ferry, bus etc.)
Very concerned 8% 12% 3% 6% 7%Quite concerned 16% 20% 11% 12% 17%Not very concerned 37% 41% 33% 39% 37%Not at all concerned 18% 20% 14% 15% 19%Don't know 3% 3% 3% 3% 2%Household does not have this expense
19% 5% 36% 24% 18%

NCOSS Cost of Living Report
47
All Sydney Regional NSW
Single person with children
Couple with children
Fresh fruit, vegetables and meat
Very concerned 18% 20% 16% 21% 17%Quite concerned 26% 23% 30% 30% 24%Not very concerned 38% 38% 37% 39% 39%Not at all concerned 15% 16% 15% 8% 18%Don't know 2% 3% 1% 1% 1%Household does not have this expense
1% * 1% 1% 1%
Other grocery items
Very concerned 18% 19% 17% 20% 18%Quite concerned 29% 28% 31% 39% 25%Not very concerned 36% 35% 38% 34% 39%Not at all concerned 15% 17% 12% 7% 17%Don't know 1% 1% 1% 1% 1%Household does not have this expense
* - 1% - *
Water Very concerned 15% 18% 10% 16% 14%Quite concerned 24% 24% 25% 28% 25%Not very concerned 36% 36% 37% 37% 35%Not at all concerned 18% 16% 20% 9% 21%Don't know 1% 1% 1% - 1%Household does not have this expense
6% 6% 6% 11% 5%
Home insurance
Very concerned 19% 20% 17% 19% 19%Quite concerned 27% 25% 28% 24% 27%Not very concerned 28% 28% 28% 26% 29%Not at all concerned 10% 11% 10% 6% 12%Don't know 1% 1% 1% 1% 1%Household does not have this expense
15% 16% 15% 24% 12%
Gas Very concerned 14% 16% 10% 9% 14%Quite concerned 21% 19% 24% 24% 20%Not very concerned 23% 25% 20% 17% 24%Not at all concerned 10% 11% 9% 4% 13%Don't know 1% 1% 2% 1% 1%Household does not have this expense
31% 28% 35% 45% 28%

NCOSS Cost of Living Report June 2015
48
All Sydney Regional NSW
Single person with children
Couple with children
Mortgage or rent
Very concerned 26% 29% 22% 29% 25%Quite concerned 29% 28% 31% 38% 26%Not very concerned 23% 18% 29% 19% 24%Not at all concerned 9% 10% 8% 6% 11%Don't know 1% 1% 1% - 1%Household does not have this expense
12% 15% 9% 9% 13%
Education Very concerned 21% 22% 20% 24% 21%Quite concerned 37% 38% 36% 45% 34%Not very concerned 25% 20% 31% 19% 27%Not at all concerned 9% 12% 6% 7% 10%Don't know 1% 1% * - 1%Household does not have this expense
6% 6% 6% 4% 7%
Telephone Very concerned 17% 19% 15% 18% 16%Quite concerned 28% 24% 33% 39% 24%Not very concerned 42% 42% 41% 37% 43%Not at all concerned 11% 12% 9% 5% 14%Don't know 1% 1% * 1% 1%Household does not have this expense
1% 2% 1% 1% 2%
Internet Very concerned 17% 19% 16% 22% 16%Quite concerned 28% 24% 34% 35% 25%Not very concerned 41% 42% 39% 37% 42%Not at all concerned 11% 13% 8% 4% 14%Don't know * * - - *Household does not have this expense
2% 1% 3% 2% 3%
NCOSS Cost of Living Report
49
Appendix 3 Reference List
Aboriginal Disability Network 2007, A report on community consultations with Aboriginal people with disability and their associates throughout NSW, 2004-2005. Sydney: Aboriginal Disability Network
ABS 2013, Food and CPI All Groups, Sydney
ABS 2013, Household Income and Income Distribution, Australia. Cat. no 6523.0.
ABS 2013, Household Wealth and Wealth Distribution, Australia, 2011-12. Cat. no 6554.0
ABS 2013, Housing and CPI All Groups, Sydney
ABS 2013, Selected Transport Sub-Groups and CPI All Groups, Sydney
ABS 2013, Utilities and CPI All Groups, Sydney
ACOSS 2014 Poverty in Australia, http://www.acoss.org.au/images/uploads/ACOSS_Poverty_in_Australia_2014.pdf
Australian Institute of Health and Welfare 2011, Headline Indicators for Children’s Health, Development and Wellbeing. Canberra
COAG Reform Council 2012, Affordable Housing 2010–11: Comparing performance across Australia, COAG Reform Council, Sydney
Considine, G. & Zappala, R. 2002, ‘The influence of social and economic disadvantage in the academic performance of school students’ Australia. Journal of Sociology, 38(2): 129-148.
Grattan Institute 2013, The NSW Budget Context. Presentation by CEO John Daley at NCOSS Pre Budget Submission launch, Oct 2013
IPART 2013, Customer service performance of electricity retail suppliers, 1 July 2008 – 30 June 2013.
McCrindle Research 2013, Cost of Living: Still the Number One Issue. Accessed 28 February 2014 http://mccrindle.com.au/resources/2013/Cost-of-Living-Still-the-Number-One-Issue_McCrindle-Research.pdf
Montoya, D. 2014, E-brief: Child disadvantage in NSW: recent findings. Sydney: NSW Parliamentary Library
NAB 2015, Quarterly Australian Consumer Anxiety Index: Q1, 2015. Accessed 10 June 2015 http://business.nab.com.au/nab-quarterly-australian-consumer-anxiety-index-q1-2015-10230/
NATSEM 2013, Cost of living and Standard of Living Indexes For Australia ,September 2013, pp 9-10.

NCOSS Cost of Living Report June 2015
50
Nepal B, et al, Measuring housing stress at small area levels: How much do definitions matter? Paper prepared for the 3rd Australian Housing Researchers Conference, Melbourne, 18 – 20 June 2008.
NSW Department of Infrastructure, Planning and Natural Resources 2007, Transfigures. April 2007, Transport & Population Data Centre.
Poulos, R., Hayen, A., Finch, C., Zwi, A. 2007, ‘Area socioeconomic status and childhood injury morbidity in New South Wales, Australia,’ Injury Prevention, 13(5): 322-327.
Saunders, P et al. 2007, Towards new indicators of Disadvantage: Deprivation and social exclusion in Australia, Social Policy Research Centre, University of New South Wales
The Smith Family (2014) Back to School Cost Estimate January 2014. Accessed 25 February 2014, http://www.thesmithfamily.com.au/~/media/Files/Media/back-to-school-cost-esitmate-australia-2014.ashx

NCOSS Cost of Living Report
51

www.ncoss.org.au