poor health: the cost of living in nsw - a nsw free from ... · page | 2 about ncoss the nsw...
TRANSCRIPT
Poor Health: The Cost of Living in NSW December 2016

Page | 2
About NCOSS The NSW Council of Social Service (NCOSS) works with and for people experiencing poverty and disadvantage to see positive change in our communities.
When rates of poverty and inequality are low, everyone in NSW benefits. With 80 years of knowledge and experience informing our vision, NCOSS is uniquely placed to bring together civil society to work with government and business to ensure communities in NSW are strong for everyone.
As the peak body for health and community services in NSW we support the sector to deliver innovative services that grow and evolve as needs and circumstances evolve.
Published November 2016
© NSW Council of Social Service (NCOSS)
This publication is copyright. Non-profit groups have permission to reproduce part of this book as long as the original meaning is retained and proper credit is given to the NSW Council of Social Service. All other persons and organisations wanting to reproduce material from this book should obtain permission from the publishers.
NCOSS can be found at: 3/52 William St, WOOLLOOMOOLOO NSW 2011 phone: (02) 9211 2599 email: [email protected] website: www.ncoss.org.au facebook: on.fb.me/ncoss twitter: @_ncoss_

Page | 3
Message from the CEO The high and growing cost of health is having a very real impact on people experiencing or at risk of poverty and their families across NSW. There is plenty of research highlighting the negative health outcomes that low-income people experience as a result of being unable to meet growing health costs. But we wanted to not only look at what the data and research tells us; but hear directly from people experiencing or at risk of poverty about their experiences and what would make a real difference in their lives.
The broader data and research already tells us that people on low incomes – including those who rely on government support and those who are poorly paid – are much more likely to experience poor health. We also know the relationship between health and disadvantage is multi-dimensional, and many of these dimensions are mutually reinforcing. We know that people on low incomes are less likely to eat well, more likely to be overweight or obese, and less likely to participate in physical activity. They are more likely to experience a broad range of chronic health conditions, such as arthritis, kidney disease, diabetes, heart disease, stroke, poor oral health and some cancers1. We know people with poor health face higher health costs, with a significant body of research demonstrating the high cost burden on individuals for many of these chronic conditions – including cancer2, kidney disease3, chronic obstructive pulmonary disease4, stroke5 and multiple chronic conditions6. People experiencing poor health also often experience a loss of income because they can only work shorter hours or not at all.
When it comes to improving or treating their health, many low-income people – such as people receiving an Age or Disability Support Pension, unemployed people, low-income families with children, and people on low incomes living in rural and regional NSW - are missing out because they cannot afford to pay or wait for the healthcare they need.
Research tells us that Australians pay more out of their own pockets for health treatment than most other OECD countries7. And the costs consumers face are growing. In NSW, the cost of health care has risen by just
1 Australian Institute of Health and Welfare (2016) Australia’s health 2016. Australia’s health series No. 15. Cat. no. AUS 199. Canberra: AIHW. 2 Gordon, LG, Ferguson, M, Chambers, SK, and Dunn, J. (2009) ‘Fuel, beds, meals and meds: out-of pocket expenses for patients with cancer in rural Queensland’. Cancer Forum 33(3). 3 Essue, B, Wong, G, Chapman, J et al. (2013) ‘How are patients managing with the costs of care for chronic kidney disease in Australia? A cross- sectional study’, BMC Nephrology 14(5). 4 Essue B, Kelly P, Roberts M, et al. ‘We can’t afford my chronic illness! The out-of-pocket burden associated with managing chronic obstructive pulmonary disease in western Sydney, Australia.’ Journal of Health Services Res Policy 2011; 16: 226-231. 5 Dewey, HM, Thrift, AG, Mihalopoulos, C. et al. (2004) ‘‘Out of pocket’ costs to stroke patients during the first year after stroke – results from the north East Melbourne Stroke Incidence Study’. Journal of Clinical Neuroscience 11:134-137. 6 Mcrae, I, Yen, l, Jeon, YH. et al. (2012) ‘Multimorbidity is associated with higher out-of pocket spending: a study of older Australians with multiple chronic conditions’, Australian Journal of Primary Health. Accessed 26 September 2016 from www.publish.csiro.au/paper/PY12035.htm 7 AIHW (2015) Health at a glance 2015: How does Australia compare? Accessed 26 September 2016 from https://www.oecd.org/australia/Health-at-a-Glance-2015-Key-Findings-AUSTRALIA.pdf
Page | 4
over twice the rate of CPI over the last ten years. The cost of things like GPs who don’t bulk bill, allied health treatment, and over-the-counter medicines are increasingly out of reach for people on low incomes.
To find out about people’s experience of health services in NSW and what would make a difference for those most in need, we surveyed over 400 low-income earners from Sydney and regional NSW. When we asked their top priorities for the State Government to take action on, health was nominated as the number one issue, with affordable dental care the top priority for budgetary investment. When asked what was stopping people from improving their health, cost was the most frequently identified barrier. We also looked at what items people find it most difficult to afford and who is most affected.
We understand that different groups of low-income people can have varying experiences and needs. Accordingly, we have looked at the experience of different major sub-groups that provided stronger sample sizes. These include: people receiving the Age or Disability Support Pension, people receiving a Carer Allowance, Newstart recipients, people receiving a parenting payment, and families with dependent children.
We also know that people living in regional, rural and remote communities have different needs and experiences and require targeted solutions.
While all levels of Government play a role in ensuring everyone can access the supports they need in order to improve their health, our focus is on what the NSW State Government can do to minimise affordability barriers to good health and improve the health outcomes of vulnerable people.
Recommendations:
• Increase access to timely and affordable dental care for people on low incomes. Investing in Communities: NCOSS Pre-Budget Submission 2017-18 calls for the investment of an additional $25 million into oral health services in NSW to improve access and reduce oral health inequities.
• Invest in communication efforts to ensure all families are aware of the dental health services available for their children.
• Increase the availability and affordability of community mental health services, including through implementation of Living Well: A strategic Plan for Mental Health in NSW 2014-2024. As an immediate step, Investing in Communities: NCOSS Pre-Budget Submission 2017-18 recommends an investment of $14 million over four years to deliver Youth Community Living Support Services (YCLSS) in six new locations across NSW.
• Further investigate transport as a barrier to accessing health care with a view to increasing investment in health transport. As a starting point, Investing in Communities: NCOSS Pre-Budget Submission 2017-18 recommends the investment of $4 million over four years to extend the Isolated Patient Travel and Accommodation Assistance Scheme (IPTAAS) to include payments to Community Transport providers in the Far West and Western NSW.

Page | 5
• Increase investment in onsite accommodation and carer-friendly wards in order to enable the important role that carers play in the health care of hospital patients.
• Efforts to improve people’s diets, particularly current responses to the NSW Premier’s commitment to reduce overweight and obesity rates in children, should take affordability barriers into account.
• Strategies aiming to increase the participation rates of under-represented groups in organised sport must recognise that cost (including the cost of transport) is an important barrier to participation and work to address this.
These are just some of the steps we need to take towards a stronger, more robust system that supports the health of all people. And we know that if we are to make real progress we must take the time to listen to the voices of those people who often struggle to be heard, and who are missing out as a result. We look forward to continuing to raise these voices and work with the NSW Government to make sure our State becomes a place in which everyone can access the care and support they need to improve their health.
Tracy Howe Chief Executive Officer

Page | 6
Contents
1 Method ............................................................................................................................................... 7
2 What we heard: results and discussion ................................................................................................. 8
2.1 Top priorities ........................................................................................................................................... 9
2.2 Cost: A barrier to better health ............................................................................................................. 12
3 Conclusion ......................................................................................................................................... 25
APPENDIX A .............................................................................................................................................. 26
APPENDIX B .............................................................................................................................................. 27

Page | 7
1 Method This report provides a snapshot of how people on low incomes in NSW are struggling to meet the costs of keeping themselves and their families in good health. It is based on results obtained via an online survey of 417 people experiencing poverty or at risk of poverty conducted between 29 April and 4 May 2016. The survey fieldwork and data processing was conducted by Essential Media’s Online Research Unit.
The target population for this research was NSW recipients of income support payments (i.e., Newstart, Age Pension, parenting payment, youth allowance, etc.) as a proxy for experience or risk of poverty or disadvantage. People who received the Family Tax Benefit or Carer Allowance only were not included. Respondents were invited to take part in the survey via an email invitation to the Online Research Unit’s online research panel. Those who qualified for and completed the survey were rewarded with ‘points’ that can be redeemed for a variety of rewards.
During the fieldwork, loose quotas were placed on gender and region. The data has otherwise not been weighted. The survey was designed by Essential Research (Kate Whelan) in conjunction with NCOSS. The analysis of this data was conducted by NCOSS. The research design and fieldwork for this project were conducted in line with ISO 20252 accreditation (the international ISO quality assurance standard for market and social research).
More information about the field team and survey reliability is provided in Appendix A.

Page | 8
2 What we heard: results and discussion A total of 417 people completed our online survey, which was in the field between 29 April and 4 May 2016. All respondents were welfare recipients with household incomes of less than $75,000. Over half of the respondents were female (58%) and 55% were from regional or rural areas. A breakdown of the profile of survey respondents is provided in Appendix B.
We started by asking our survey respondents how they described their own health and wellbeing (Figure 1). While the vast majority of respondents described their own health as fair or good, more than one in ten reported their health as being poor. People were more likely to describe their wellbeing more positively than their health.
Figure 1: The self-reported health and wellbeing of people on low incomes
People receiving the Disability Support Pension were the most likely to describe their health as being poor (24%), and much less likely to consider themselves as being in good or excellent health. Families with children also reported poor health (20%), whereas people receiving an Age Pension and those at the higher end of the low-income spectrum reported comparatively better health than other groups.
0
10
20
30
40
50
Poor Fair Good Excellent
How would you describe your health and well-being?
Current health
Overall well-being

Page | 9
2.1 Top priorities
A quality health system When asked to select what they saw as the most important state issues, the top response for our survey respondents was ‘a quality health system’ (Figure 2).8
Figure 2: State Issues nominated by people on low incomes as one of three priority issues
Other issues related to health, or issues that can impact on a person’s health and their access to services and items, also ranked highly amongst people’s priorities. ‘The cost of living generally’ (which might include the cost of items such as healthy food), as well as ‘reducing the cost of running a car’ and ‘public transport’ (both of which can impact a person’s ability to get to places where health treatment is available) also ranked in the top ten priority issues.
8 Respondents were asked: “Thinking about the NSW Government, their policies, and the policies of other political parties in NSW, which are the three most important issues to you today?”
0% 10% 20% 30% 40% 50% 60%
A quality health system
The cost of living generally
Reducing the cost of running a car
Ensuring we are all safe from crime
Jobs and unemployment
The cost of housing
Economic management
Reducing domestic and family violence
Supporting people with disability
Public transport

Page | 10
Affordable dental care
Our survey also asked participants about their top priorities for the state government in terms of budgetary policy. A state-wide dental health scheme that provided all people with health care cards access to timely and affordable dental care emerged as the top policy proposal, with two-thirds (67%) of respondents saying that it would make a big difference to their lives and the lives of their families (Figure 3).
Dental health also emerged the top priority when respondents were presented with a list of health-specific policy proposals and asked what would make a real difference (Figure 4). Again, 67% of respondents said that access to timely, affordable dental care would make a big difference to themselves and their families.
Figure 3: Responses to the question ‘Thinking about the NSW Government's annual budget. Which of the following policies would make a difference in your life, and the life of your family?’
0% 50% 100%
Timely, affordable dental care for people with health care cards
Affordable green slips
Reduced wait times for specialists and surgery
Significantly reduced wait times in public hospital emergency rooms
A 15% reduction on utility bills
Exemptions on licence fees, registration fees and transport concessions forhealth care card holders
More funding for mental health services
Better public transport in regional areas
More funding for housing
More funding for legal advice and assistance for people on low incomes
Make a bigdifference
Make somedifference
Make nodifference

Page | 11
Figure 4: Responses to the questions ‘There are a number of different ways that governments can invest in health services and healthy
lifestyles. Which of the following options would make a real difference to you and your family?’
Issues relating to waiting times for surgery and specialist treatment and emergency care also rated highly in both sets of responses.
0% 20% 40% 60% 80% 100%
Timely, affordable dental care
Reduced wait times for specialists and surgery
Reduced wait times in public hospital emergency rooms
Free or low cost access allied health professionals
Free diagnostic services
Free counselling or support for mental health concerns
Ongoing home visits by a nurse where mothers require additional support
Better, or cheaper, transport to and from medical or related appointments
More public parks, recreational facilities or outdoor spaces
Programs to reduce the cost of organised sport or swimming
Support to connect with people in my community
Someone to come walking or swimming with me
Make abigdifferenceMakesomedifferenceMakelittledifferenceMake nodifference
N/A
Page | 12
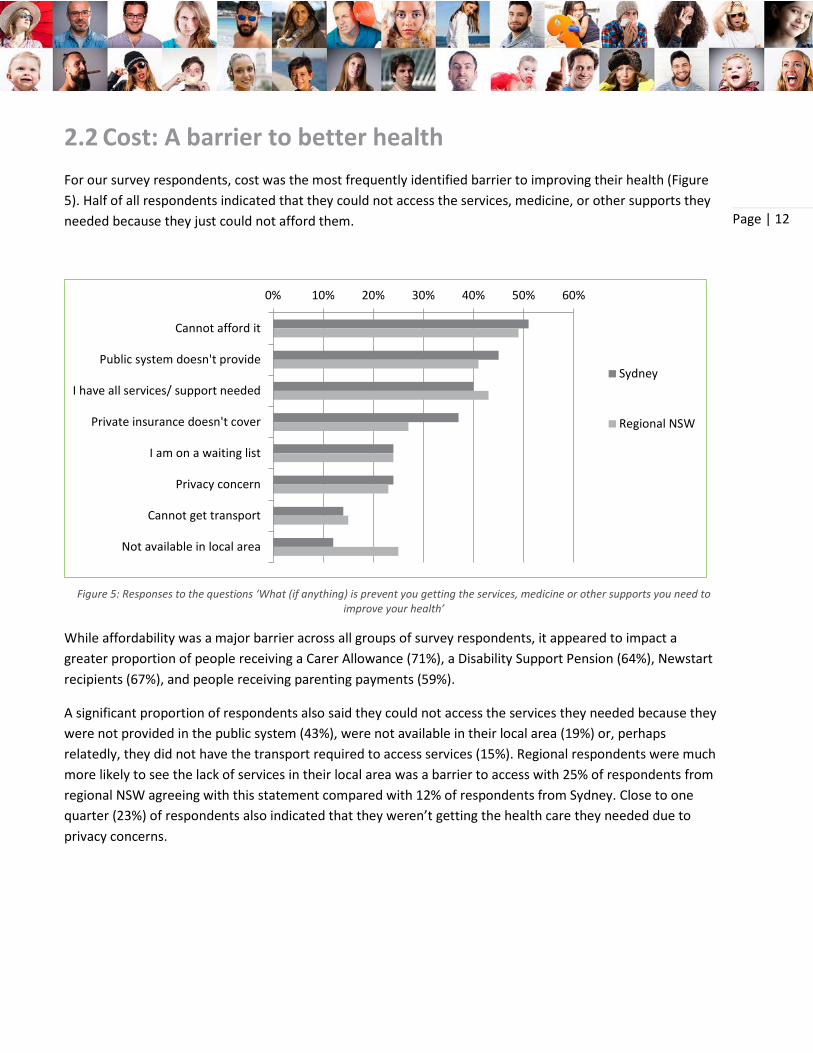
2.2 Cost: A barrier to better health For our survey respondents, cost was the most frequently identified barrier to improving their health (Figure 5). Half of all respondents indicated that they could not access the services, medicine, or other supports they needed because they just could not afford them.
Figure 5: Responses to the questions ‘What (if anything) is prevent you getting the services, medicine or other supports you need to improve your health’
While affordability was a major barrier across all groups of survey respondents, it appeared to impact a greater proportion of people receiving a Carer Allowance (71%), a Disability Support Pension (64%), Newstart recipients (67%), and people receiving parenting payments (59%).
A significant proportion of respondents also said they could not access the services they needed because they were not provided in the public system (43%), were not available in their local area (19%) or, perhaps relatedly, they did not have the transport required to access services (15%). Regional respondents were much more likely to see the lack of services in their local area was a barrier to access with 25% of respondents from regional NSW agreeing with this statement compared with 12% of respondents from Sydney. Close to one quarter (23%) of respondents also indicated that they weren’t getting the health care they needed due to privacy concerns.
0% 10% 20% 30% 40% 50% 60%
Cannot afford it
Public system doesn't provide
I have all services/ support needed
Private insurance doesn't cover
I am on a waiting list
Privacy concern
Cannot get transport
Not available in local area
Sydney
Regional NSW

Page | 13
The changing cost of health care While there is much discussion of increasing government health budgets, less attention has been given to consumers who have been similarly affected by steady and significant real increases in out-of-pocket costs for health care. Out-of-pocket expenses currently account for 20% of expenditure on health care in Australia – considerably more than comparable OECD countries.9 Over the last ten years, the cost of health care has risen by just over twice the rate of CPI (Figure 6).
The most significant cost increases relate to medical and hospital services (GP and specialist consultation fees, hospital charges, and medical insurance prices) – which have risen at almost three times the rate of CPI, followed by dental services (Figure 7).
9 AIHW (2015) Health at a glance 2015: How does Australia compare? Accessed 26 September 2016 from https://www.oecd.org/australia/Health-at-a-Glance-2015-Key-Findings-AUSTRALIA.pdf
Figure 6: Cost of health vs CPI All Groups, Sydney (ABS, 2016)
80
90
100
110
120
130
140
150
160
170
CPI
Health

Page | 14
Figure 7: Selected Health Cost Sub-Groups vs CPI All Groups, Sydney (ABS, 2016)
Part of the increased cost of health care relates to rapidly rising private health insurance premiums, which have become increasingly out of reach of low-income earners. In 2009, the National Health and Hospitals Reform Commission noted concerns that this is contributing to a two-tiered health system in which people who rely on public health and dental services often face unacceptably long waits in accessing services.10 Even within the public health system people from low-income households are more likely to experience longer wait times, with the Bureau of Health Information reporting that the median waiting time for non-urgent elective surgery for patients living in low socio-economic areas was almost 100 days longer than for patients living in high socio-economic areas.11
10 National Health and Hospitals reform Commission (2009) A Healthier Future For All Australians. 11 Bureau of Health Information (2016) Healthcare in Focus 2015 – How does NSW Compare? Sydney (NSW).
80
100
120
140
160
180
200
CPI
Health
Medical products, appliances andequipment

Page | 15
Going without
In our survey, we wanted to find out more about what health-related items were out of reach for people on low incomes. Respondents were presented with two lists of items and asked what they could or could not afford, or did not want. The first list contained a range of common household items and activities taken from UNSW’s Social Policy Research Centre work on indicators of disadvantage, deprivation, and social exclusion12 (Figure 8). The second list contained health-specific items (Figure 9).
12 This list contained a number of items that were only of relevance to families with children. These items are not included in Figure X.X as only XX% of respondents to our survey had children in their care. However, where relevant this results are reference in the discussion below.
Figure 8: Responses to the question ‘Does your household have or is able to buy the following?'
0% 50% 100%
Dental treatment$500 in savings for an emergency
A decent and secure homePresents for family or friends
Home contents insuranceRoof and gutters that do not leak
Comprehensive car insuranceMedical treatment
Secure locks on doors and windowsHeating in at least one room
Furniture in reasonable conditionPrescribed medication
Substantial meal at least once a dayA connection to the internet
Warm clothes and bedding if it’s coldA washing machine
A telephone (fixed line or mobile)A television
No. I/wecannotafford this
Yes
No. I/wedo notwant this
Page | 16
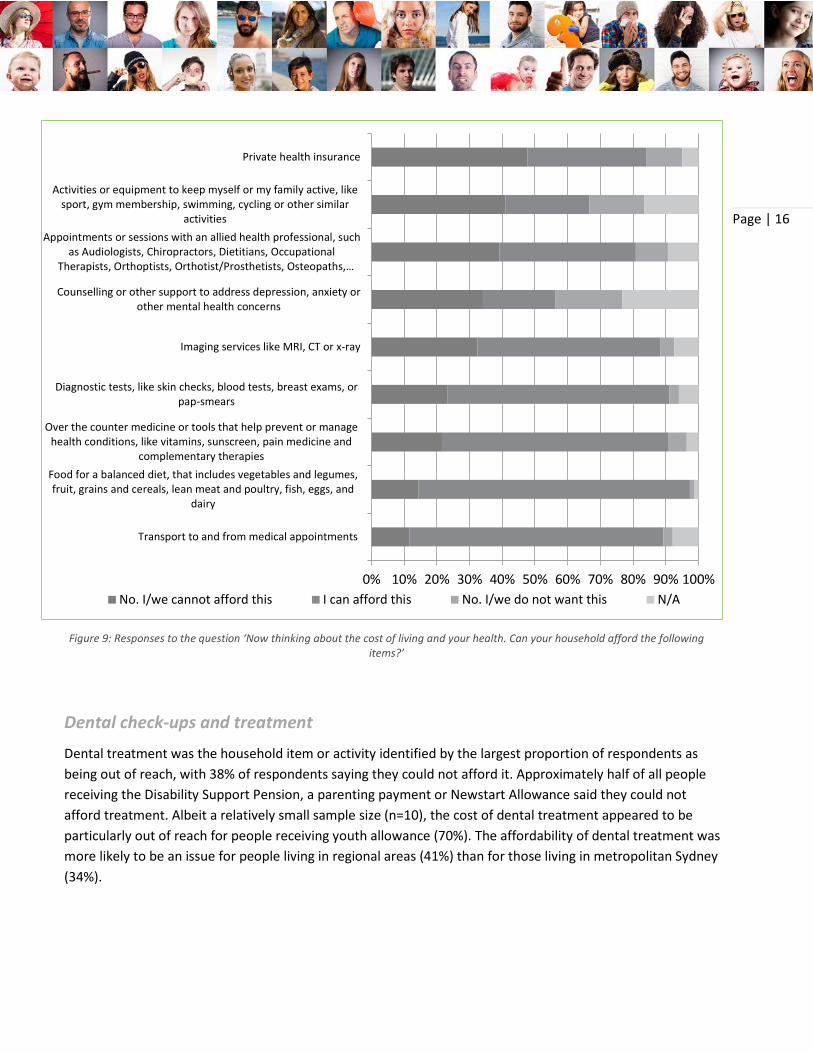
Dental check-ups and treatment
Dental treatment was the household item or activity identified by the largest proportion of respondents as being out of reach, with 38% of respondents saying they could not afford it. Approximately half of all people receiving the Disability Support Pension, a parenting payment or Newstart Allowance said they could not afford treatment. Albeit a relatively small sample size (n=10), the cost of dental treatment appeared to be particularly out of reach for people receiving youth allowance (70%). The affordability of dental treatment was more likely to be an issue for people living in regional areas (41%) than for those living in metropolitan Sydney (34%).
Figure 9: Responses to the question ‘Now thinking about the cost of living and your health. Can your household afford the following items?’
0% 10% 20% 30% 40% 50% 60% 70% 80% 90% 100%
Transport to and from medical appointments
Food for a balanced diet, that includes vegetables and legumes,fruit, grains and cereals, lean meat and poultry, fish, eggs, and
dairy
Over the counter medicine or tools that help prevent or managehealth conditions, like vitamins, sunscreen, pain medicine and
complementary therapies
Diagnostic tests, like skin checks, blood tests, breast exams, orpap-smears
Imaging services like MRI, CT or x-ray
Counselling or other support to address depression, anxiety orother mental health concerns
Appointments or sessions with an allied health professional, suchas Audiologists, Chiropractors, Dietitians, Occupational
Therapists, Orthoptists, Orthotist/Prosthetists, Osteopaths,…
Activities or equipment to keep myself or my family active, likesport, gym membership, swimming, cycling or other similar
activities
Private health insurance
No. I/we cannot afford this I can afford this No. I/we do not want this N/A
Page | 17
Our findings are in keeping with larger studies which show that across the population as a whole, almost one in five people delay or avoid seeing a dentist due to cost.13 Of those people who do visit the dentist, 20% do not go ahead with recommended treatment because they cannot afford it.14
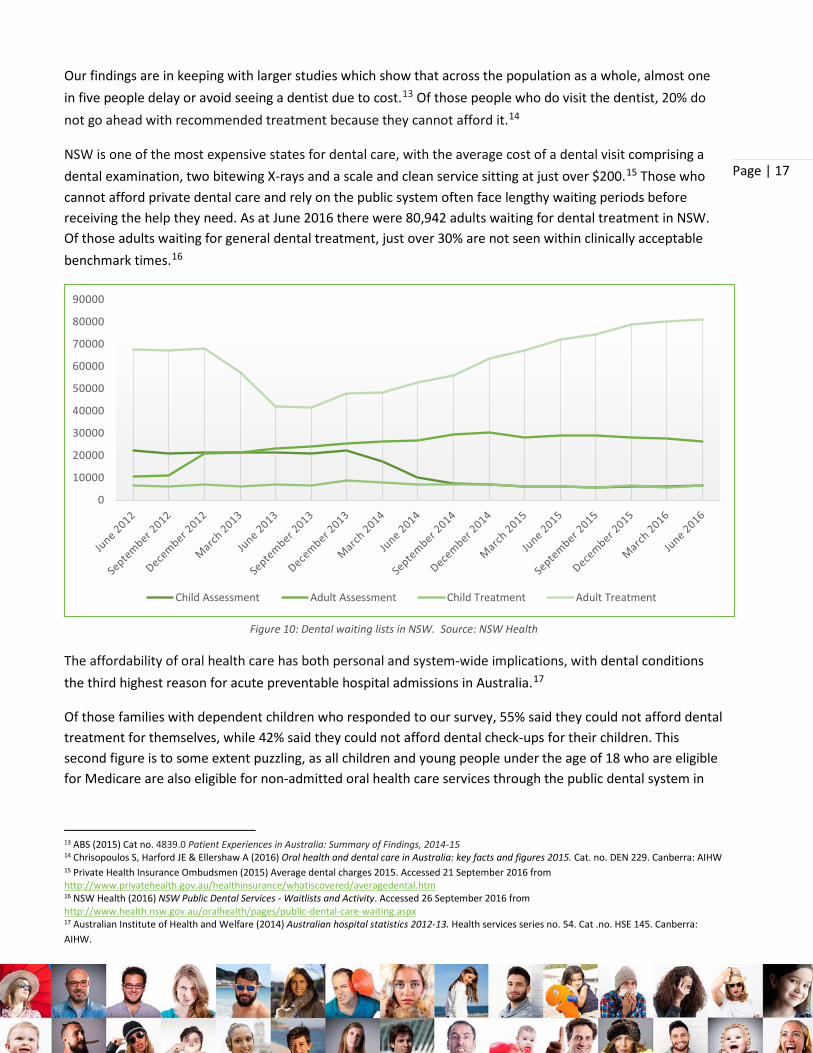
NSW is one of the most expensive states for dental care, with the average cost of a dental visit comprising a dental examination, two bitewing X-rays and a scale and clean service sitting at just over $200.15 Those who cannot afford private dental care and rely on the public system often face lengthy waiting periods before receiving the help they need. As at June 2016 there were 80,942 adults waiting for dental treatment in NSW. Of those adults waiting for general dental treatment, just over 30% are not seen within clinically acceptable benchmark times.16
Figure 10: Dental waiting lists in NSW. Source: NSW Health
The affordability of oral health care has both personal and system-wide implications, with dental conditions the third highest reason for acute preventable hospital admissions in Australia.17
Of those families with dependent children who responded to our survey, 55% said they could not afford dental treatment for themselves, while 42% said they could not afford dental check-ups for their children. This second figure is to some extent puzzling, as all children and young people under the age of 18 who are eligible for Medicare are also eligible for non-admitted oral health care services through the public dental system in
13 ABS (2015) Cat no. 4839.0 Patient Experiences in Australia: Summary of Findings, 2014-15 14 Chrisopoulos S, Harford JE & Ellershaw A (2016) Oral health and dental care in Australia: key facts and figures 2015. Cat. no. DEN 229. Canberra: AIHW 15 Private Health Insurance Ombudsmen (2015) Average dental charges 2015. Accessed 21 September 2016 from http://www.privatehealth.gov.au/healthinsurance/whatiscovered/averagedental.htm 16 NSW Health (2016) NSW Public Dental Services - Waitlists and Activity. Accessed 26 September 2016 from http://www.health.nsw.gov.au/oralhealth/pages/public-dental-care-waiting.aspx 17 Australian Institute of Health and Welfare (2014) Australian hospital statistics 2012-13. Health services series no. 54. Cat .no. HSE 145. Canberra: AIHW.
0
10000
20000
30000
40000
50000
60000
70000
80000
90000
Child Assessment Adult Assessment Child Treatment Adult Treatment

Page | 18
NSW. This suggests there are significant communication gaps in terms of ensuring families with children are aware of the support for which they are eligible.
Additional investment is needed to ensure all people in NSW access timely, affordable dental care. We also recognise that there needs to be change at a national level and support calls to maintain and enhance the Child Dental Benefit Schedule.
The NSW Government should work to increase access to timely and affordable dental care for people on low incomes. Investing in Communities: NCOSS Pre-Budget Submission 2017-18 calls for the investment of an additional $25 million into oral health services in NSW to improve access and reduce oral health inequities.
The NSW Government should invest in communication efforts to ensure all families are aware of the dental health services available for their children.
Doctors and specialists
Almost one in five (17.3%) respondents to our survey said they could not afford medical treatment with cost issues most likely to be identified by people receiving Newstart Allowance (31%) or parenting payments (35%).
These findings are consistent with other surveys that find cost barriers to medical treatment exist across the entire population – with one in twenty people delaying or putting off GP visits due to cost18 and 8% of people delaying or avoiding specialist appointments due to cost19 – and are particularly acute for people on low incomes. A recent survey of 906 adult clients of a large community welfare agency in NSW found an inability to access health care was reported by more than one-third of the sample (38%), compared to just 5% for the general population. The least accessible types of health care were Dentists (47%), specialists (43%) or GPs (29%), with cost accounting for 60% of responses.20
When people put off going to the doctor it not only leads to worse health outcomes at an individual level, but has a flow on impact to the health care system as a whole: people who delay appointments due to cost are 1.3 times more likely to end up in an emergency department.21
According to the Commonwealth Fund International Health Policy Survey, people with chronic health conditions in Australia are significantly more likely to skip healthcare due to cost than people in Canada, the United Kingdom, Germany, France, Norway, Sweden or Switzerland.22
18 ABS (2015) Cat no. 4839.0 - Patient Experiences in Australia: Summary of Findings, 2014-15 19 Ibid 20 Paul, C., Bonevski, B., Twyman, L., D'Este, C., Siahpush, M., Guillaumier, A., Bryant, J., Fradgley, E. and Palazzi, K. (2016), The ‘price signal’ for health care is loud and clear: A cross-sectional study of self-reported access to health care by disadvantaged Australians. Australian and New Zealand Journal of Public Health, 40: 132–137. 21 National Health Performance Authority (2016) Healthy Communities: Use of emergency department and GP services in 2013–14 22 Callander EJ., Corscadden L., Levesque J-F., (2016) Out-of-pocket healthcare expenditure and chronic disease – do Australians forgo care because of

Page | 19
Affordability issues relating to access to specialists are particularly acute, with only 30% of specialist appointments bulk-billed. 23 Across Australia non bulk-billed appointments cost the consumer an average of $71 while costs are even higher in NSW with the average patient contribution being $78.24 When accessing specialist care most people rely on their GP’s advice and there is little or no discussion of price.25 The lack of transparency around the cost of specialists means people cannot look for the lowest cost option, and often do not know in advance how much a service will cost. For people on low incomes in particular, this can create stress, act as a deterrent to accessing care, and risks exposure to bill shock.
Allied health and counselling
Almost 4 in 10 respondents to our survey (39%) said they could not afford appointments or sessions with allied health professionals while one third (33%) said they could not afford counselling or other support to address depression, anxiety or other mental health concerns. Of all the health-related items we examined, counselling was the least likely item to be described as affordable (22%).
In comparison to other types of medical services, less attention has been paid to cost barriers to allied health services and there is no large-scale systematic data collection. Yet our survey indicates that people on low incomes struggle to afford these services even though they play a critical role in supporting health and wellbeing, and are particularly important for people with chronic health conditions. Our survey results found that the affordability of allied health services is of particular concern to people receiving the Disability Support Pension (58%) and those with dependent children (54%). The Medicare Benefits Scheme typically covers only a limited number of visits to allied health professionals for people in certain circumstances, and health system advocates have suggested that a restructure of current funding arrangements is needed to improve access for people on low incomes who are unlikely to be able to cover the full cost of additional treatment sessions themselves.26
For people with assessed mental disorders the Better Access initiative provides Medicare rebates for up to ten individual and group allied mental health services per calendar year. However, the affordability of gap payments remains an issue, and many people require support beyond the services for which subsidies are available. Thus adequate support for many people on low incomes experiencing mental ill-health remains out-of-reach. This is part of a problem that has been described as the ‘missing middle’ in mental health care, whereby there is little in the way of affordable, accessible support for people with poor mental health in the community before a problem becomes acute and requires hospitalisation.27 In our survey, respondents with dependent children were most likely to describe counselling and other mental health supports as unaffordable
the cost?. Australian Journal of Primary Health, 40:2, pp 132–13. 23 Medicare Australia. Annual Medicare Statistics 1984-84 to 2015-16. Accessed 26 September 2016 from https://www.health.gov.au/internet/main/publishing.nsf/Content/Annual-Medicare-Statistics 24 Ibid 25 Sivey, P (2016) ‘How much?! Seeing private specialists often costs more than you bargained for’ The Conversation. Accessed 26 September 2016 from http://theconversation.com/how-much-seeing-private-specialists-often-costs-more-than-you-bargained-for-53445 26 Refshauge, K., Dennis, S., Vassallo, A. (2016) Chronic conditions and allied health: The untapped potential in the Australian healthcare system. The Advocate, April 2016, Australian Healthcare and Hospitals Association. 27 http://theconversation.com/from-asylums-to-gp-clinics-the-missing-middle-in-mental-health-care-46345

Page | 20
(54%) which is of concern not only in relation to the individuals themselves, but also in relation to the potential impact on family functioning.
The NSW Government should continue working to increase the availability and affordability of community mental health services, including through implementation of Living Well: A strategic Plan for Mental Health in NSW 2014-2024. As an immediate step, Investing in Communities: NCOSS Pre-Budget Submission 2017-18 recommends an investment of $14 million over four years to deliver Youth Community Living Support Services (YCLSS) in six new locations across NSW.
Diagnostic tests and imaging services
Almost one quarter of our survey respondents (32%) described imaging services as unaffordable, while approximately one quarter (23%) said they could not afford diagnostic tests. Those with dependent children were most likely to say they could not afford imaging services (53%) while the cost of these services was out of reach for 46% of those receiving the Disability Support Pension or Newstart Allowance. Those receiving Newstart Allowance were also the most likely to describe diagnostic services as being unaffordable.
While Medicare covers the cost of some diagnostic tests and imaging services, others (such as skin cancer screening) do not attract a rebate. Even when an item is included on the Medicare Benefit Schedule there may be a gap between the fee (which is set by the provider) and the Medicare rebate. As is the case for specialists both the fee in and of itself, as well as the lack of information about the fees charged by different providers, is problematic for people on low incomes.
Prescription and over-the-counter medicine
Almost 1 in ten of our survey respondents (9%) said that they could not afford prescription medicines. This is despite the fact that prescription medicines are heavily subsidised: consumers contribute up to $38.30 for most PBS medicines, or $6.20 for concession card holders.28
Our survey findings are consistent with other research showing that the percentage of adults who delay filling or do not fill a medical prescription due to cost ranges from 5% to 15%.29 In our survey an even higher proportion of people receiving the Newstart Allowance (21%) and those with dependent children (19%) were unable to afford prescription medicines.
A much larger proportion of respondents (22%) said that they could not afford over-the-counter medicine or tools that help prevent or manage health conditions such as vitamins, sunscreen, pain medicine and
28 Australian Government, Department of Health (2016) The PBS. Accessed 26 September 2016 from http://www.pbs.gov.au/info/about-the-pbs 29 National Health Performance Authority 2013, Healthy Communities: Australians’ experiences with access to health care in 2011–12.

Page | 21
complementary therapies. Here, people receiving a Carer Allowance were most likely to identify affordability concerns, with 43% identifying over-the-counter medicines as being out of reach.
The PBS Safety Net threshold is designed to protect consumers from excessive medical expenses: the cost of prescription medicines is further reduced (for concession card holders fees are reduced to zero) once the annual threshold is reached. For households at the low end of the income spectrum, however, the Safety Net threshold still represents a considerable sum of money. Kemp et al found that some low-income households would have to forego the equivalent of between 5 and 26% of their discretionary income for between 7 and 9 months of the year before receiving additional subsidies.30 Further, over-the-counter medicines such as pain-killers and complementary medicines such as vitamins do not count towards the PBS Safety Net, yet account for a significant and increasing proportion of out-of-pocket expenditure31 and can play an important role in preventing, treating or management pain and disease.
Getting to and from appointments
Just over ten percent (11.5%) of our survey respondents said they could not afford transport to and from medical appointments. The cost of transport was seen as particularly problematic by those with caring responsibilities – those receiving a Carer Allowance (20%) and those with dependent children (25%).
The cost of travel (and accommodation) is frequently over-looked in discussions about the out-of-pocket costs of health care, yet it can be a significant barrier to accessing timely health care.
Travel costs are particularly problematic for people who must either travel frequently or travel long distances32. In NSW, patient travel subsidies recognise this to some extent, but they do not cover all modes including hire cars and community transport. People who have no option but to use these modes of transport – usually because they have limited mobility, do not have access to a car, or live in areas with no public transport – can end up paying significantly more in order to access healthcare.33
The cost of parking can also be prohibitive. Cancer Council NSW’s report on car parking found it was the biggest unmet practical need among patients, with consumers being charged up to $11 for the first hour when parking was available onsite at cancer treatment centres.34 Similarly, Kidney Health Australia’s research found that dialysis patients often face parking costs of between $10 and $15 for each treatment session. 35
30 Kemp, A, Preen, DB, Glover, J. et al. (2013) ‘Impact of cost of medicines for chronic conditions on low income households in Australia’, Journal of Health Services Research and Policy 18:21-27. 31 AIHW (2012) Health expenditure Australia 2010- 11. Health and welfare expenditure series no. 47. Cat. no. HWE 56. Canberra: AIHW. 32 Essue, B, Jan, S (2012) ‘The household economic burden of chronic illness: an under-recognised problem in Australia’. Health Voices, Journal of the Consumers Health Forum of Australia. 12. 33 Kidney Health Australia (2012) in NCOSS (2012) Provided there’s Transport: Transport as a barrier to accessing health care in New South Wales. Accessed 20 January 2014 www.ncoss.org.au/resources/121206health- transport-report.pdf 34 Cancer Council NSW (2012) Car parking for cancer patients in NSW. Accessed 26 September from http://www.cancercouncil.com.au/wp-content/uploads/2012/06/Car-parking-for-cancer-patients-in-NSW_June-2012.pdf 35 NCOSS and Community Transport NSW Inc, 2015, Staying Alive: Transport to treatment for people living with a chronic disease, p 4. Available at http://www.ncoss.org.au/images/2015healthtransportreportfinal.pdf.

Page | 22
NSW Health should further investigate transport as a barrier to accessing health care with a view to increasing investment in health transport. As a starting point, Investing in Communities: NCOSS Pre-Budget Submission 2017-18 recommends the investment of $4 million over four years to extend the Isolated Patient Travel and Accommodation Assistance Scheme (IPTAAS) to include payments to Community Transport providers in the Far West and Western NSW.
As per the recommendation made by Carers NSW, NSW Health should look to increase investment in onsite accommodation and carer-friendly wards in order to enable the important role that carers play in the health care of hospital patients.
Private health insurance
Almost half (48%) of our survey respondents said they could not afford private health insurance. People receiving a Disability Support Pension (69%) and those receiving Newstart Allowance (62%) were the most likely to describe health insurance as unaffordable.
Rapid increases in the cost of private health insurance premiums means this commodity has become increasingly out of reach of low-income earners. People who cannot afford private health insurance often have very little choice but to rely on public health and dental services. Here they may experience long waits for services, and/or be unable to afford additional services and items that are not available in the public system.
Eating well
In our survey, 14.4% of respondents said they were unable to afford food for a balanced diet that includes vegetables and legumes, fruit, grains and cereals, lean meat and poultry, fish, eggs, and dairy. The groups most affected were recipients of a Newstart Allowance (26%) and families with dependent children (28%). Relatedly, one in ten respondents reported being unable to buy a healthy meal at least once a day.
These findings are consistent with other research showing that healthy eating habits are simply out of reach for a significant cohort of low-income earners.
The Cancer Council NSW’s Healthy Food Basket Survey, for example, found that families in the lowest income quintile would need to spend 56% of their average weekly income on food to afford a healthy food basket.36 Similarly, Anglicare’s study of food insecurity in NSW and the ACT found that people accessing their services –
36 The Cancer Council NSW (2007). NSW Healthy Food Basket Cost, Availability and Quality Survey, p10.

Page | 23
that is, people struggling to make ends meet, forgo healthier food options and substitute cheaper energy dense foods such as refined grains, added sugars, and added fats in order to stretch limited funds further.37
While our survey did not find any major differences in responses between Sydney-siders and regional respondents, there is some evidence that healthy food can be more expensive in remote areas38, and in some areas with low socioeconomic status. 39
While there is considerable research showing that people on low incomes have poorer diets – being less likely to eat the recommended amount of fruit and vegetables – and are more likely to be overweight or obese40 the relationship between poor diet and affordability has been largely over-looked in policy responses. In part this is due to the assumption that healthy food is cheaper than unhealthy food. But this assumption ignores a range of cost-related issues that impact the choices people make when it comes to food, such as:
• Transport: low-income households are less likely to have and use their own vehicle for regular food shopping than more advantaged households.41 They cannot shop around to find the best deal, but must purchase food from the most accessible locations – such as convenience stores – which are often more expensive.
• Time: Accessing, purchasing and preparing healthy food can be time-consuming, but many families on low-incomes live further from work and/or work longer, less sociable hours. They therefore have less time to prepare healthy meals.42
• Refrigeration: Very low-income families may not have access to refrigeration43 and are therefore unable to store healthy food or buy food in advance.
• Cash flow: People on low incomes may be unable to afford a weekly grocery shop where savings can be made by buying in bulk, but purchase food in small amounts when money is available.
We therefore recommend that all efforts to improve people’s diets particularly current responses to the NSW Premier’s commitment to reduce overweight and obesity rates in children, take affordability barriers into account.
All efforts to improve people’s diets, particularly current responses to the NSW Premier’s commitment to reduce overweight and obesity rates in children, should take affordability barriers into account.
37 Anglicare (2013) Going Without in a Time of Plenty: A Study of Food Security in NSW and the ACT. 38 Burns CM, et al. (2004) Food cost and availability in a rural setting in Australia. Rural and Remote Health; 4: 311. 39 Tsang A, et al. (2007) Adelaide healthy food basket: a survey on food cost, availability and affordability in five local government areas in metropolitan Adelaide, South Australia. Nutrition and Dietetics; 64:241-7 40 HealthStats NSW (2015) Fruit and Vegetables: Recommended consumption; Overweight and obesity. 41 Food Research and Action Centre (2015) Why Low-Income and Food Insecure People are Vulnerable to Obesity. 42 Nogrady, B (2015) Time and Money: Why we need both to be healthy. 43 In Anglicare’s national study of people accessing Emergency Relief, 9% reported being limited in their choice of food because they did not have a fridge, while 7% did not have the power connected. Anglicare (2013) Going Without in a Time of Plenty: A Study of Food Security in NSW and the ACT.

Page | 24
Being active
A large proportion – 41% – of respondents to our survey said that activities or equipment such as sport, gym membership, swimming, cycling were unaffordable. People with caring responsibilities – receiving a Carer Allowance (60%) or those with dependent children (61%) – were most likely to nominate this item as being unaffordable.
The affordability of physical activities is of concern when we also know that less than half (45%) of people in the lowest income quintile have participated in sport or physical activity within the last year, compared to 80% in the most advantaged quintile.44Cost barriers to participation can be substantial and include registration, uniforms and other incidentals. Depending on the sport, the cost of participating in a junior sport activity ranges from $1 000-$5 000 per child.45 Transport is also a barrier to participation, with the cost of owning and running a car a cause of stress for many households on low incomes who tend to live in neighborhoods that are poorly serviced by public transport.
Low-income neighbourhoods are also typically less conducive to active living, with fewer parks, green spaces, and recreational facilities than higher income neighbourhoods.46 This makes it harder to exercise outdoors or to incorporate incidental physical activity into a daily routine, intensifying the cost barriers to participation in organised activities.
The NSW Government’s Healthy Eating Active Living (HEAL) Strategy 2013-201847 states that the government will work in partnership with national and state sporting organisations to support the development of participation strategies, particularly for under-represented groups. For such strategies to successfully increase the participation of people on low incomes, they must recognise that cost (including the cost of transport) is an important barrier to participation.
Strategies aiming to increase the participation rates of under-represented groups in organised sport must recognise that cost (including the cost of transport) is an important barrier to participation and work to address this.
44Australian Bureau of Statistics (2012) ‘Sport and Physical Recreation’ in Australian Social Trends June 2011. 45 Balish et al (2014) “Correlates of youth sport attrition: A review and future directions”, Psychology of Sport and Exercise, 15:4, pp. 239-249. 46 Astell-Burt, T. et al(2013) Do low-income neighbourhoods have the least green space? A cross-sectional study of Australia’s most populous cities. BMC Public Health, 14:292. 47 NSW Ministry of Health (2013) NSW Healthy Eating Active Living Strategy: Preventing overweight and obesity in New South Wales 2013-2018.

Page | 25
3 Conclusion This report outlines the cost barriers preventing people on low incomes from accessing the healthcare they need to stay healthy. By asking low-income people directly about their experiences, we’ve been able to show exactly how issues of affordability and lack of access to healthcare identified in earlier research are playing out in people’s lives in NSW.
And the picture is not a good one. What we’ve found is that many low-income people simply cannot afford to meet out-of-pocket health costs like fees for dentists and other allied health professionals, mental health support, health insurance, and medication. This means that people in need of health services and items either miss out, or find themselves waiting – sometimes for years – on public waiting lists.
However, we’ve also found that the low-income people we talked to have good ideas about how to make things better. This is particularly important as the NSW Government starts to plan its budget for next year.
The message from our respondents to the NSW Government is clear – healthcare needs to be the number one issue for the state, with stronger investment in areas like oral healthcare and with more attention given to the full range of supports needed to enable people on the lowest incomes to be healthy.

Page | 26
APPENDIX A About the Field Team
Online Research Unit is ISO 20252 and ISO 26362 (Global Panel Standard) accredited. Essential Research and Online Research Unit are members of the Australian Market & Social Research Organisation (AMSRO). All research team members belong to the Australian Market and Social Research Society (AMSRS). All Essential Research staff ascribe to the AMSRS Code of Professional Behaviour, and a company-specific privacy policy.
Survey Reliability
Properly constructed sample surveys can provide results that are described as statistically reliable. The level of statistical reliability is dependent upon the sample size and (except where it is extremely small) the size of the population has no practical effect.
A survey that has 400 respondents will provide results that are – at the 95% confidence level – subject to a sampling variation of between 3% and 5% at the total response level. Sub-samples, because of their smaller size, will exhibit larger sampling variances. The following table shows the theoretical sampling variances at the 95% confidence level for a range of sample sizes and response levels. For the purposes of simplicity we have rounded percentages to the nearest whole number. This may result in some percentage totals being 99% or 101%.
Sampling variances at the 95% confidence level
Sample Size Variation where the answer is near the percentage of
10% or 90% 20% or 80% 30% or70% 40% or 60% 50%
100 6% 8% 9% 9% 10%
200 4% 5% 6% 7% 7%
300 3% 5% 5% 6% 6%
400 3% 4% 4% 5% 5%
Page | 27
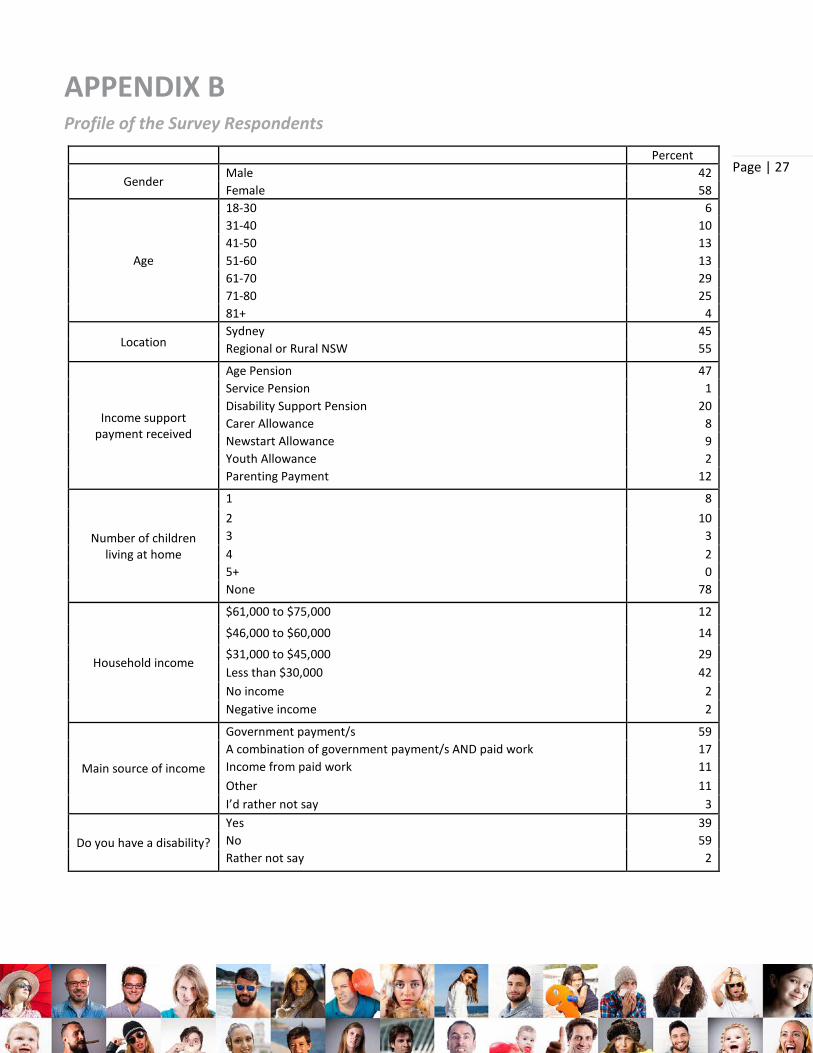
APPENDIX B Profile of the Survey Respondents
Percent
Gender Male 42 Female 58
Age
18-30 6 31-40 10 41-50 13 51-60 13 61-70 29 71-80 25 81+ 4
Location Sydney 45 Regional or Rural NSW 55
Income support payment received
Age Pension 47 Service Pension 1 Disability Support Pension 20 Carer Allowance 8 Newstart Allowance 9 Youth Allowance 2 Parenting Payment 12
Number of children living at home
1 8 2 10 3 3 4 2 5+ 0 None 78
Household income
$61,000 to $75,000 12
$46,000 to $60,000 14
$31,000 to $45,000 29 Less than $30,000 42 No income 2 Negative income 2
Main source of income
Government payment/s 59 A combination of government payment/s AND paid work 17 Income from paid work 11 Other 11 I’d rather not say 3
Do you have a disability? Yes 39 No 59 Rather not say 2
Page | 28