turning off the lights - ncoss...those living in regional nsw faced significantly height costs,...
TRANSCRIPT
1 1
Turning Off The Lights
The Cost of Living in NSWJune 2017

About NCOSSThe NSW Council of Social Service (NCOSS) works with and for people experiencing poverty and disadvantage to see positive change in our communities.
When rates of poverty and inequality are low, everyone in NSW benefits. With 80 years of knowledge and experience informing our vision, NCOSS is uniquely placed to bring together civil society to work with government and business to ensure communities in NSW are strong for everyone.
As the peak body for health and community services in NSW we support the sector to deliver innovative services that grow and evolve as needs and circumstances evolve.
Published June 2017
© NSW Council of Social Service (NCOSS)
This publication is copyright. Non-profit groups have permission to reproduce part of this book as long as the original meaning is retained and proper credit is given to the NSW Council of Social Service. All other persons and organisations wanting to reproduce material from this book should obtain permission from the publishers.
NCOSS can be found at:
3/52 William St, WOOLLOOMOOLOO NSW 2011
phone: (02) 9211 2599
email: [email protected]
website: www.ncoss.org.au
facebook: on.fb.me/ncoss
twitter: @_ncoss_
1

Message from the CEO Though we sometimes don’t think about it; energy, particularly electricity, is essential to our daily lives. Access to this service underpins our health, wellbeing and general quality of life. But increasingly many households across our State are struggling to afford its high and growing cost. NCOSS spoke to people and families doing it tough across NSW, hearing from people living below the poverty line on their experience and what would make a real difference for them.
The picture is a sobering one. We heard about vulnerable households going to extreme lengths to ration and afford energy costs. We heard about individuals, and even families with children, skipping meals, delaying health treatment or purchasing medication, not using hot water and going to bed early to save energy in order to pay their energy bills. Having reduced their energy usage below acceptable community standards, we heard about people then getting into debt, selling personal items, and going without a range of household essentials just to keep the lights on.
We heard that:
7-9% of respondents regularly and 19-25% sometimes go without medical treatment and medication when needed in order to pay energy bills
9% regularly (including 6.5% of families with children) and 22% (including 19% of families with children) sometimes go without a substantial daily meal in order to pay energy bills
Those living in regional NSW faced significantly height costs, particularly those living in Central Western and Western NSW
“I can never pay on time and I have to go without other things like proper meals to be able to pay my electricity bills, water and phone bills.”“Living expenses are so high and it’s hard to find work as a single mum. Bills take up whatever income is left after paying high rent.”In a State like NSW this is just not good enough. We acknowledge that Government and retailers do offer a range of supports to low-income households; but the picture we see is that this assistance is not always working well for those who need it most. Supports are poorly understood, not well accessed, and often undermined by a lack of co-ordination. Not only are we failing to stop people falling into debt, we are not providing assistance in ways that improve the financial sustainability of low-income household’s energy usage in the longer-term. We need to, and can, do better.
2

With energy prices likely to continue rising into the foreseeable future, many more households will reach crisis point. We know that all levels of Government play a role in ensuring that everyone has reliable and affordable access to essential energy services. Our focus here is on the steps the NSW State Government can take, including;
Quarantine a significant portion of funds from the lease of electricity network assets to fund substantial energy efficiency updates for vulnerable households, including generation, storage and other efficiency measures that will reduce the long-term burden of energy costs.
Commence work on reform of rental tenancy laws to improve minimum efficiency standards of rental properties, and facilitate the adoption of more significant energy efficiency measures for vulnerable rental households.
Expand the Home Energy Action Program as part of measures being considered in the Draft Plan to Save NSW Energy and Money, linking sustainability and affordability.
Review the EAPA system to improve availability, awareness, ease of access and linkages to other supports for long-term sustainability.
That eligibility for the Low Income Household Energy Rebate and Gas Rebate be extended to holders of Commonwealth Low Income Health Care Cards.
That the NSW Government work with the Commonwealth Department of Social Services to improve the coordination of supports and rebates for people on low-incomes.
That the Low Income Household Energy Rebate, with additional funds reallocated from the discontinued Family Energy Rebate, transition to a percentage-based concession providing eligible households with a 17.5% rebate on their electricity bills.
Work with retailers to improve the effectiveness of competition, and the way retail practices and supports interact with assistance for vulnerable households.
These are just some of the steps we need to take towards a stronger, more robust system that ensures people on low incomes can afford to cover the costs of their energy needs. We know that if we are to make real progress we must take the time to listen to those who are currently missing out. We know that together we can shape a fairer NSW for all.
Tracy Howe
Chief Executive Officer
3

About NCOSS 1
Message from the CEO 2
1 Method 5
2 Who did we hear from? 6
3 Energy, as an essential service, is a top priority 7
4 The energy bills of low-income households 11
5 What impact do these bills have? 13
5.1 Energy bills and day-to-day living 13
5.2 Late payment and debt 16
5.3 Disconnection 17
5.4 How households attempt to lower their energy costs 19
6 Assistance and access to support 20
6.1 Access to energy efficiency 20
6.2 Access to energy assistance 23
6.3 Retailer supports and accessing the best offers 28
7 Conclusion 34
APPENDIX A 35
APPENDIX B 36
APPENDIX C 37
2 Contents
4

This report provides a snapshot of how people in NSW living on very low incomes are struggling to meet the costs of their essential energy needs. It is based on results obtained via an online survey of 440 people living below the poverty line, conducted between 8 April and 30 April 2017.
The survey fieldwork and data processing was conducted by Essential Media’s Online Research Unit. The data was tested twice during the course of the survey (after 45 and 220 responses) to ensure it was operating as intended, with adjustments made as required.
This research targeted low-income earners in NSW who are struggling to make ends meet. The most recent ACOSS definition of the poverty line was used as the basis for determining the target population.1 The target population was selected by cross-matching responses to a question about after-tax household income with information about the number of people in the household. Only responses that met the upper limit for the relevant ‘poverty line’ could continue the survey. Respondents were invited to take part in the survey via an email invitation to the Online Research Unit’s online research panel. Those who qualified for and completed the survey were rewarded with ‘points’ that can be redeemed for a variety of rewards.
During the fieldwork, soft quotas were placed on gender, family composition, region and language spoken at home. We also placed a hard quota of 25% on the number of responses from pensioners in order to gain a balance of responses from households with children. The data has otherwise not been weighted.
The survey was designed by NCOSS, with input from representatives from the Public Interest Advocacy Centre and the Ethnic Communities’ Council of NSW, in conjunction with Essential Media Research (Andrew Bunn). The analysis of this data was conducted by NCOSS. The research design and fieldwork for this project were conducted in line with ISO 20252 accreditation, the international ISO quality assurance standard for market and social research.
Throughout this report we also use case examples to illustrate the experiences of people on low-incomes, and the impact of the cost of energy on their lives. While these examples are based upon individual’s responses to our survey, we have removed or altered any potentially identifying information in order to maintain anonymity.
More information about the field team and survey reliability is provided in Appendix A, and further detail on our method can be found in Appendix B.
1 Method
5
1 ACOSS & SPRC (201) Poverty in Australia 2016. P11. www.acoss.org.au/wp-content/uploads/2016/10/Poverty-in-Australia-2016.pdf

A total of 440 people completed our online survey, which was in the field between 8 April and 30 April 2017. All respondents are living below the poverty line according to the definition used by ACOSS and the UNSW’s Social Policy Research Centre (SPRC).2 This line is determined using after-tax weekly household income and household composition (for a more detailed explanation see Appendix B). It is worth noting that all respondents also fall below the income range that would qualify them as low or very low income households according to the definitions that NSW FACS uses to determine eligibility for social housing.3 The distribution of responses according to after-tax household income is shown in Figure 1.
Over half of the respondents were female (65%) and 46% were from regional or rural areas. We captured results by postcode and used this to group results into regions loosely based on NSW FACS Districts (due to smaller sample sizes, data has been amalgamated). A map of responses is provided above, while a full breakdown of the profile of survey respondents is provided in Appendix C.
2 Who did we hear from?
Figure 1: The number of responses that fell within each income band in Sydney and in rural and regional NSW.
0
5
10
15
20
25
30
25
22
18
109
35
8
24
21
13
6
11
8
5
12
Regional & Rural NSWSydney
$895-1075 (24)
$819-894 (22)
$768-818 (27)
$683-767 (44)
$640-682 (34)
$513-639 (48)
$428-512 (94)
$0-427 (107)
Income Bands
% O
f Res
pons
es
Survey responses according to weekly income
6
2 ACOSS & SPRC (2016) Poverty in Australia 2016. P11. www.acoss.org.au/wp-content/uploads/2016/10/Poverty-in-Australia-2016.pdf 3 FACS http://www.housing.nsw.gov.au/centre-for-affordable-housing/for-managers-of-affordable-housing/household-median-incomes-2016-17

The high and rising cost of energy has been the subject of much political and community discussion in recent years. Between 2000-2014 household electricity prices across the country increased by 174%.4 More recently we have seen a brief plateau in prices, but with the cost of wholesale electricity now escalating, and network charges set to increase 5, electricity prices are likely to once again begin to rise, with this trend continuing into the foreseeable future.
The rising cost of electricity affects almost everyone, but it has a much greater impact on people on very low incomes, for whom energy costs comprise a much larger proportion of weekly expenditure.6 For such households – where the majority of their household budget is spent on essential items – it can be impossible to accommodate these rising costs without forgoing some other necessity.
Indeed, our survey found that many people on low incomes are struggling to cover the cost of household items that are essential to a decent standard of living. When presented with a list of essential household items (with our list of items taken from SPRC’s work on indicators of deprivation) 7, 20% of households with children said they could not afford heating in one room (Figure 3), 35% of all households could not afford up to $500 in emergency savings (41% for households with children), and 21% of all households couldn’t afford medical treatment when needed (Figure 4).
3 Energy, as an essential service, is a top priority
7
4 http://theconversation.com/myths-not-facts-muddy-the-electricity-privatisation-debate-38524 5 http://www.smh.com.au/business/households-facing-price-spike-as-regulator-loses-key-court-case-20170523-gwbrjv.html 6 NCOSS (2014) Cost of Living: Who’s Really Hurting?7 Peter Saunders, Yuvisthi Naidoo and Megan Griffiths (2007) Towards new indicators of disadvantage: deprivation and social exclusion in Australia. Social Policy Research Centre, University of NSW.
80
100
120
140
160
180
200
220
240
Electricity CPI
Mar-2017
Mar-2016
Mar-2015
Mar-2014
Mar-2013
Mar-2012
Mar-2011
Mar-2010
Mar-2009
Mar-2008
Mar-2007
Figure 2: Over the ten year period to March 2017 the price of electricity has risen at a significantly higher rate than CPI.
Electricity prices vs CPI

0
5
10
15
20
25
30
35
11
Don’t needCan’t a�ord
% O
f all
Resp
onse
s
Internet c
onnection
Annual prese
nts for fa
mily
Prescriptio
ns
Dental treatm
ent
Medical tr
eatment
Roof and gutte
rs with
out leaks
Home insu
rance
Secure lo
cks
$500 emergency sa
vings
Washing m
achine
A phone
Comprehensive m
otor in
surance
Decent fu
rnitu
re
Heating in
one room
Warm cl
othes in
cold
Substantia
l daily
meal
Decent s
ecure home
11
2 2
5 5 5 5 5
1 1 1 13 3
6 64
0 0
87
16 1614
18
10
1513
35 35
29
2221
0
5
10
15
20
25
30
35
40
45
20
Don’t needCan’t a�ord
% o
f res
pons
es fr
om h
ouse
hold
s w
ith c
hild
ren
Internet c
onnection
School a
ctivitie
s
Schoolbooks a
nd cloth
es
Leisure activ
ity fo
r child
ren
Annual prese
nts for fa
mily
Prescriptio
ns
Dental treatm
ent
Childs y
early dental c
heck
Medical tr
eatment
Separate beds for c
hildren
Roof and gutte
rs with
out leaks
Home insu
rance
Secure lo
cks
$500 emergency sa
vings
Washing m
achine
A phone
Comprehensive m
otor in
surance
Decent fu
rnitu
re
Heating in
one room
Warmth
cloth
es in co
ld
Substantia
l daily
meal
Decent s
ecure home
18
1 1 1 1 1
7 7 7 76 6 65 5 5
18 1819 19
0 0
8
3 3 3 3
13
9
2 24
10 10
15
25 2524
2830
41 40 39
Figure 3: Items that households with children who are living below the poverty line report they cannot afford or don’t need.
Figure 4: Items households living below the poverty line report they cannot afford or don’t need (items relating only to children have been removed).
Items households with children report they cannot afford
Items low-income households report they cannot afford
8

It is not surprising then that people on low incomes nominate the affordability of essential services as a top priority for Government. In our survey, when presented with a list of possible priorities, 17% of respondents chose ‘affordable essential services’ as the number one priority, with over 46% choosing it as one of their top three priorities (Figure 5). Affordable essential services came in second only to ‘a quality and affordable healthcare system’ and ranked a much higher priority than reducing crime or reducing taxes
We also asked our survey respondents what would make the biggest difference to their own quality of life and that of their families. Again, affordable essential services ranked in the top three responses (Figure 6).
0 50 100 150 200 250
Reducing taxes
A transport system that meets everyone's needs
Reducing crime
More jobs
A quality education system
Safe and secure housing
A�ordable essential services
A quality and a�ordable healthcare system
Thinking about the NSW Government, their policies and the policies of other political parties in NSW.
What do you think should be their highest priority?
0 50 100 150 200 250
Assistance �nding and maintaining meaningful employment
Appropriate and a�ordable transport
Access to a�ordable, healthy food
Access to timely, a�ordable dental care
Assistance paying bills for essential services
A safe and secure place to live
Access to timely, a�ordable health services
Thinking about yourself and your family, which of the following would make the biggest difference?
Figure 5: Number of respondents who selected the listed priority area as one of three top priorities (out of a total of 440 respondents)
Figure 6: Top responses to a question about what would make the biggest difference to the respondent’s quality of life
9

These responses deliver a strong and consistent message that assistance making essential services affordable should be one of the NSW Government’s top priorities, and that this would make a meaningful difference to the quality of life of households on very low incomes.
Assistance with essential services is a top priority
‘It can be a struggle to pay bills. There is never any money left over for emergencies, and a lot of things get left undone. If we had the money to cover our bills, we could then fix a lot of things around the house that are broken and not working.’
‘Living expenses are so high and it’s hard to find work as a single mum. Bills take up whatever income is left after paying high rent.’
‘With the price of essential services continuing to rise and rise again, trying to find $400-$600 a quarter is really difficult whilst trying to provide for a family on a daily basis.’
‘Essential services are too expensive. Even though we do not use much energy and live in a small house, no pool and no air-conditioning, the energy and water bills are very big as prices go up even if our consumption is reducing.’
‘I can never pay on time and I have to go without other things like proper meals to be able to pay my electricity bills, water and phone bills.’
‘It is hard to keep on top of the bills and the money goes there instead of other essential items I could be buying for my children.’
‘Poor choice and higher prices in the country.’
10

Our survey respondents reported average quarterly bills of $382.57 for electricity, $118.93 for gas and $204.46 for dual services.8 If used as a basis for annual bills, these figures translate as slightly lower than those found through other work on energy prices. For example, the St Vincent de Paul Society’s recent report on energy prices in NSW found that across the state annual average electricity bills range from $1,880 to $2,200, with average gas bills ranging from $800 to $1300.9 Given St Vincent’s research covers average bills across all customers – not just low-income households – our research supports findings that in general, low-income households use less energy than higher income households.10
Our research also found a pronounced difference between bills in metropolitan Sydney – where the average bill was $363 for electricity, $118.93 for gas and $204.46 for combined services – and other regions of the State where average bills were $404.31, $107.52 and $253.13 respectively.
The difference between regional and metropolitan electricity bills largely relates to significantly higher network costs in regional areas, and is a consistent with findings in other research11. Table 1 provides a more detailed look at the breakup of average bills on a regional basis, and shows that the bills of respondents living in Central Western and Western NSW were particularly high.
While low-income households tend to have lower than average bills, our research also found significant variation in bill size. Just over one third (33.7%) of respondents’ last electricity bills were in excess of $400, while 19% received a bill in excess of $600. For gas, 23.5% of respondents reported bills over $200 (compared to an average of $118.93), while 7.5% reported receiving bills over $400. Other research has similarly found that a small proportion of low-income households are high-energy users.12 The full breakdown of the distribution of bills for electricity, gas and combined services is provided in Figure 7.
4 The energy bills of low-income households
Region No. of Responses Average Electricity Bill Average Gas BillMetropolitan Sydney 221 $362 $162
Outer Western & Southwestern Sydney 35 $415 $128
Central Coast 28 $472 $71
Hunter / Newcastle 36 $417 $166
New England 9 $274 $106
Central Western & Western NSW 22 $664 $214
Mid North & Far North Coast 46 $327 $42
Illawarra 27 $347 $80
Murrumbidgee & South-eastern NSW 15 $440 $211
Table 1: Average bills by region. Regional groupings are guided by NSW FACS districts. Districts have been amalgamated where there were not enough responses. Sydney has been divided into metropolitan and outer metropolitan areas reflecting the different electricity networks.
8 Our survey used last quarterly bill as an indicator of average bills. An explanation of this method and the reasoning behind it is provided in Appendix B 9 St Vincent de Paul Society & Alviss Consulting. NSW Energy Prices 2016: An update report on the NSW Tariff-tracking project 2016. 10 See, for example ABS (2012) Household Energy Consumption Survey, Australia: Summary of Results, 2012, Cat. No. 4670.011 Ibid12 IPART (2012) Strengthening the Foundation for Australia’s Energy Future: IPART’S submission to the Draft Energy White Paper 2011. March 2012. Pp. 20-21
11

While bill size can relate to a variety of factors including location, the condition of housing, inefficient appliances and heating systems, household size, health requirements, and usage patterns, our survey found no significant and consistent predictor of bill size. This suggests household energy bills are a result of the interaction of multiple factors. This finding is critical to the intent and design of the assistance provided to people experiencing poverty and disadvantage, an issue that will be discussed in detail in Section 6.
If we extrapolate our findings on quarterly bills across the course of the year, this would mean nearly 20% of the people in our survey face annual electricity bills in excess of $2400, and 5% in excess of $4000. For gas, it would mean nearly one quarter of very low income earners would face annual bills over $800, with 7.5% facing bills over $1600. It is also important to remember that energy is not the only essential that has seen rapid price rises in recent years. The current state-wide median rent (as a broad indicator of weekly housing costs), is between $450-$550. This alone exceeds the income of just under half of our survey respondents. In such circumstances even an average electricity bill would present a significant cost burden. This is particularly felt by those families that do not have any accumulated emergency savings, a circumstance in which 35% of respondents find themselves.
Sarah is 33 and lives with her partner and 3 children in a house in East Hills. Her family pays $600/week in rent from an after tax income of $1000 a week, received through full-time work. They cannot afford insurance, basic household repairs, or up to $500 in emergency savings. In the last 12 months they have paid their electricity bill late at least once because they did not have enough money put aside to pay. They have also received a disconnection notice. Their last quarterly electricity bill was $600.
0
20
40
60
80
100
120
140
19
175 2 2
10
0 0
125 3
24
5 3
25
4 2
30
6 5
82
16
2
101
33
8
63
117
2
Combined bill rangeGas bill rangeElectricity bill range
$1000-1685$900-1000$800-900$700-800$600-700
$500-600$400-500$300-400$200-300$1-200
Num
ber o
f res
pons
es
Figure 7: The distribution of energy bills according to the last quarterly bill. We have excluded responses reporting $0 bills. Examination of bills under $100 suggests these are a combination of errors in data entry, misunderstanding of the information being sought, households with solar generation capacity, and the potential for anomalous low bills of new accounts or accounts with transferred credits (see Appendix B for further information).
Distribution of energy bills based on last quarterly bill
12

For low-income households, the high cost of securing their energy needs now regularly exceeds their capacity to pay. The impact is not only financial; it can have serious consequences in terms of health, mental health and the broader opportunities available to individuals and their families.
5.1 Energy bills and day-to-day livingWhile much analysis of energy bills focuses on annual costs compared to annual household income, that is not how vulnerable households experience these bills. Energy bills must be dealt with as they fall due, and come amidst the range of other planned or unplanned weekly expenses such as rent/mortgage, food, transport and medical treatment.
Our results identified a core (4-9%) of respondents who regularly, or always, go without many daily household essentials in order to pay their energy costs (Figure 8). These people are regularly going without medical treatment, healthy meals, basic household repairs and transport in order to scrape together the money needed to pay their energy bills. Such behaviour risks serious impacts on health and wellbeing for themselves and their families. Further, many of the measures people are undertaking in order to pay their energy bills are likely to compound their financial vulnerability and debt, and in extreme cases risk pushing them into homelessness as they skip rent payments, take out short term loans and sell personal items.
The day-to-day impact of high-energy costs is not restricted to this group of very vulnerable households. Our survey also found a significantly larger proportion of people (in excess of 20%) for whom the cost of energy is sometimes impacting their ability to afford many of the essentials that most of us take for granted (Figure 9).
5 What impact do these bills have?
Rada is a 47-year old woman living in Punchbowl with her partner and two children under 18. The total household after-tax income of the household is $425, coming in the form of Newstart Allowance. They are renting, do not have secure tenure, and cannot afford many of the basics of daily life, including $500 in emergency savings. Their last quarterly electricity bill was $400. In the last 12 months they have paid bills late and have been disconnected from their electricity supply. They often, or always go without medical treatment, dental treatment, medications and healthy food in order to pay their energy bills, and regularly miss rent payments, water bills and phone bills. They often have to take out short-term loans, borrow from family or pawn personal items.
13

5.1.1 Impact on health and well-being
The household essentials people were most likely to sacrifice in order to pay their energy bills were medical and dental treatment and prescription medication. Of our respondents, 7-9% reported that they regularly go without medical treatment and medication when needed, while 19-25% of people were sometimes forced to make a choice between their health and paying their energy bills. The figures for those missing dental treatment when needed are even starker: 20% regularly go without, and 36% sometimes prioritise energy bills over their need for dental treatment.
9% of respondents regularly go without a substantial daily meal for themselves, while a very worrying 6.5% of respondents’ children regularly go without a substantial daily meal as a result of energy bills. Again, the figures for those whose meals are sometimes impacted by energy costs point to a much larger vulnerability, with 22% sometimes going without, and 19% who sometimes cannot afford a daily meal for their children.
Figure 8: The items low-income households forego and the behaviours in which they engage in order to pay their energy bills.
0
5
10
15
20
25
30
35
40
8
20
79
3
7 7
13
4
79
76 6
9
4
7
25
36
19
22
9
19
22
26
10
2324
1917
13
23
8
19
Often/ AlwaysSometimes
% o
f hou
seho
lds
impa
cted
Pawning
Payday lender
Friend/Fa
mily borro
wing
Rent/Mortg
age late
Insurance
late
Water late
Phone late
Transport
School it
ems
House re
pairs
Internet L
ate Payment
Without in
ternet
Meal child
Meal you
Medicine
Dental treatm
ent
Medical tr
eatment
Essentials gone without to pay energy bills
What low-income households do in order to pay their bills
14

5.1.2 Impact on children
As we highlighted in our ‘One in Seven’ report on child poverty in NSW, access to healthy food, health services, secure housing, educational opportunities and activities that enable children and young people to connect to their peers and the wider community are key to ensuring that children get the best start in life, and do not remain part of a cycle of poverty, ill-health and disadvantage.13 It is worrying that a significant proportion of households feel compelled to prioritise energy bills above other essentials their children need for a healthy start to life:
46% of households with children report going without necessary house repairs in order to pay their energy bills, with 21% doing so on a regular basis.
24% of households with children have gone without school books or uniforms in order to pay energy bills, with nearly 7% doing so on a regular basis.
31% of households with children have gone without school excursions or activities in order to pay energy bills, with nearly 9% doing so on a regular basis.
40% of households with children are going without an Internet connection, or paying bills late, in order to pay their energy bill, with 12% doing so regularly.
5.1.3 Impact on access to community and opportunity
For people experiencing poverty, access to educational opportunities, employment, and information about services and supports is critical not only for day-to-day survival, but for their longer-term ability to build independence and financial stability. Our survey found that many people are sacrificing their access to fundamental enablers of opportunity – such as transport, the internet and phone connections – in order to pay the immediate costs of their energy usage. Key finding include:
29.6% of people had foregone public transport or use of a private vehicle in order to pay their bills, with 6.4% doing so regularly. More significantly, of the 45 responses from people receiving Newstart Allowance, nearly 50% had not used public transport or a private vehicle as a result of their energy bills. This would likely have a marked impact on their ability to attend interviews, successfully find employment, and even their continued eligibility for Newstart support.
29.1% of people had not paid an Internet bill or paid it late as a result of energy bills, with 6.6% doing so regularly. Again nearly 50% of those receiving Newstart, many of whom would rely on an internet connection to access information on supports, training and potentially find employment, are not paying their Internet bills or going without a connection in order to pay their energy bills.
32.9% of people had not paid a phone bill or paid it late in order to pay their energy bills, with 8.6% doing so regularly. Once again, 50% of responses from those receiving Newstart had paid a phone bill late or gone without, impacting their ability to access support services and find employment
15
13 NCOSS. One in Seven: almost 1 in 7 seven children are living in households below the poverty line. July 2015 https://www.ncoss.org.au/policy/1-in-7-campaign-report

5.1.4 Impact on financial stability and independence
Our survey results also demonstrate that in order to pay their energy bills, many low-income households are engaging in practices that are likely to exacerbate financial difficulties:
12.3% of people reported being forced to use payday lenders, one of the most problematic and expensive sources of finance, or take out a short-term loan in order to pay an energy bill, with 4% of respondents regularly resorting to these practices.
26.2% of people have pawned or sold personal items in order to pay energy bills, with 7% doing so on a regular basis.
31.4% of people have borrowed money from friends or family in order to pay energy bills, with 8.4% doing so regularly.
18.7% of people have missed a rent or mortgage payment in order to pay an energy bill, with 5.3% doing so regularly. This is a particularly worrying result given its potential to put people at serious risk of eviction and even homelessness.
23% of people had cancelled or missed a payment on their insurance in order to pay an energy bill, with 6% doing so regularly. Again, this has long-term implications in relation to increased vulnerability, with the potential to magnify the impact of what would otherwise be relatively minor incidents – such as car accidents, theft or damage.
These results show that energy costs contribute to broader health issues and can compound the vulnerability of many people already experiencing poverty. They add weight to an already significant body of work – such as Dr Lynne Chester’s 201314 study on the impact of rising energy prices, and Consumer Action Law Centre’s 201515 Heat or Eat Report – which shows that low-income households are being forced to make very difficult decisions in order to cover the cost of their energy needs.
In conjunction with other work, our results demonstrate that energy, particularly electricity, is regarded as an essential service, and that energy bills are given a higher priority than almost all other basic costs – sometimes including the cost of rent, food and medicine. Alleviating the cost of energy is therefore likely to make an important difference not only to the financial situation of people experiencing poverty and disadvantage, but will have flow-on effects into many aspects of their lives.
5.2 Late payment and debtHouseholds that are struggling to pay their bills will often pay late and/or enter into debt if they do not have money available when their bills fall due. Our survey found that more than one third (35.3%) of people reported having to pay their electricity bill late in the last 12 months. 34.6% of people paid their gas bill late, and 35.3% were late to pay bills for combined gas and electricity. Late payment disproportionately affected households with children who comprised 42% of our responses but represented over 56% of those who reported paying late in the last 12 months (Figure 9).
“ We don’t have
enough left over from
our pension to pay our
bills and I have to pay
them late, then I get a
late fee which makes
the bill higher…”16
14 Dr Lynne Chester, Department of Political Economy, University of Sydney. The impacts and consequences for low-income Australian Households of rising energy prices. October 201315 Consumer Action Law Centre. Heat or Eat: households should not have to decide whether they heat or eat. August 2015.

Late payments are particularly important in the context of the practices of most energy retailers, who impose significant penalties, in late payment fees and the removal of significant on-time discounts, on people who do not pay their bills within very narrow ‘on-time’ windows. In their most recent NSW Tariff tracking report, St Vincent de Paul demonstrated that customers who pay late are penalised between $200 and $566 in loss of discounts. This means those who are already in financial distress are further disadvantaged as a result.
The AER monitors figures on the energy-related debt that results from customers not paying their bills on time. These state-wide figures show that over 80,000 people have an accumulated electricity debt, and over 44,000 people have an accumulated gas debt as at the end of 2016.17 While that number has remained relatively stable, the average amount of debt has increased over the course of the last two years, with the average electricity debt now being $643 and the equivalent figure for gas $512.18
These figures provide compelling evidence that low-income earners are not coping with the high and increasing level of energy prices, and do not have the emergency resources to cover their bills when due. A significant and concerning proportion of vulnerable households – particularly families with children – are paying late and accumulating debt, a situation that further increases the cost of energy and adds to the compounding experience of stress and financial hardship over time.
5.3 DisconnectionWhen people are unable to pay their energy bills, one of the most acute results is disconnection19. Disconnection has immediate effects on a household’s quality of life, making heating, lighting, cooling, bathing and cooking difficult or impossible. Disconnection often compounds a household’s financial instability, incurring significant additional costs; in spoiled food, the need to access alternative means of bathing, cooking, and other daily essentials. It also usually requires the payment of debt, often facilitated by expensive short-term loans, before reconnection can occur. This process and its wide-reaching consequences can have serious and ongoing impacts on people’s mental wellbeing and physical health, and can cause people to feel anxious, afraid, depressed and ashamed.20
0
5
10
15
20
25
30
35
40
45
50
43
23
4.3
24.4
9
1.6
Households with childrenHouseholds without children
Dual ServicesGasElectricity
% o
f tot
al c
ohor
t
Paying late: Households with and without children
Figure 9: The proportion of low-income households who report having paid bills late in the last 12 months
17
16 St Vincent de Paul Society & Alviss Consulting. NSW Energy Prices 2016: an update report on the NSW tariff-tracking project. October 2016. Pp23-2517 AER https://www.aer.gov.au/retail-markets/retail-statistics/nsw-customer-energy-debt 18 Ibid19 Consumer Action Law Centre. Heat or Eat: households should not have to decide whether they heat or eat. August 2015. 20 ibid
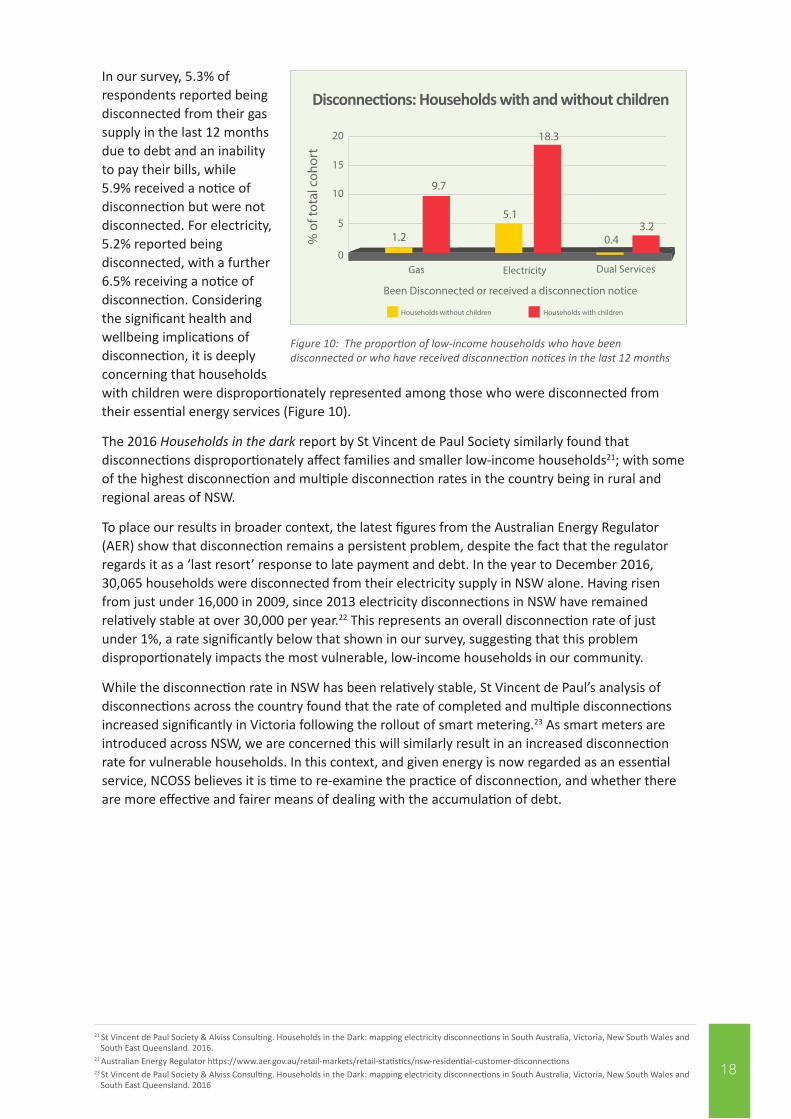
In our survey, 5.3% of respondents reported being disconnected from their gas supply in the last 12 months due to debt and an inability to pay their bills, while 5.9% received a notice of disconnection but were not disconnected. For electricity, 5.2% reported being disconnected, with a further 6.5% receiving a notice of disconnection. Considering the significant health and wellbeing implications of disconnection, it is deeply concerning that households with children were disproportionately represented among those who were disconnected from their essential energy services (Figure 10).
The 2016 Households in the dark report by St Vincent de Paul Society similarly found that disconnections disproportionately affect families and smaller low-income households21; with some of the highest disconnection and multiple disconnection rates in the country being in rural and regional areas of NSW.
To place our results in broader context, the latest figures from the Australian Energy Regulator (AER) show that disconnection remains a persistent problem, despite the fact that the regulator regards it as a ‘last resort’ response to late payment and debt. In the year to December 2016, 30,065 households were disconnected from their electricity supply in NSW alone. Having risen from just under 16,000 in 2009, since 2013 electricity disconnections in NSW have remained relatively stable at over 30,000 per year.22 This represents an overall disconnection rate of just under 1%, a rate significantly below that shown in our survey, suggesting that this problem disproportionately impacts the most vulnerable, low-income households in our community.
While the disconnection rate in NSW has been relatively stable, St Vincent de Paul’s analysis of disconnections across the country found that the rate of completed and multiple disconnections increased significantly in Victoria following the rollout of smart metering.23 As smart meters are introduced across NSW, we are concerned this will similarly result in an increased disconnection rate for vulnerable households. In this context, and given energy is now regarded as an essential service, NCOSS believes it is time to re-examine the practice of disconnection, and whether there are more effective and fairer means of dealing with the accumulation of debt.
0
5
10
15
20
9.7
18.3
3.21.2
5.1
0.4
Dual ServicesGas Electricity
% o
f tot
al c
ohor
tHouseholds with childrenHouseholds without children
Been Disconnected or received a disconnection notice
Figure 10: The proportion of low-income households who have been disconnected or who have received disconnection notices in the last 12 months
Disconnections: Households with and without children
18
21 St Vincent de Paul Society & Alviss Consulting. Households in the Dark: mapping electricity disconnections in South Australia, Victoria, New South Wales and South East Queensland. 2016. 22 Australian Energy Regulator https://www.aer.gov.au/retail-markets/retail-statistics/nsw-residential-customer-disconnections 23 St Vincent de Paul Society & Alviss Consulting. Households in the Dark: mapping electricity disconnections in South Australia, Victoria, New South Wales and South East Queensland. 2016

5.4 How households attempt to lower their energy costsThere is a general understanding in the community, which is encouraged by energy providers and advice services, that people can lower their bills by being mindful of their energy usage. For an increasing proportion of people on time-of-use tariff arrangements, managing when they use most of their energy also has the potential to reduce bills. However, there is also a growing body of evidence demonstrating that extreme energy rationing and under-usage can significantly impact health and well-being, and leads to living conditions that are well below accepted community standards.
Our own results highlighted a number of behaviours that illustrate the degree to which many vulnerable people with low incomes are engaging in extreme energy rationing that is detrimental to health and well-being:
30.2% of people surveyed had not used hot water for bathing in an attempt to reduce their energy usage, with half of those responses (67 of 134) from households with children.
76.8% of people surveyed had not used any heating, or limited their heating to a single room to reduce their energy usage, with 15% of people indicating this was something that they always did. Again, nearly 50% lived in households with children.
61.8% of people said that they had gone to bed early in an attempt to reduce their energy usage, with 50% of those people living in households with children.
Behaviours such as not using lighting (even when it is needed), not using heating or cooling when conditions require it, not using hot water for bathing, and even going to bed early to save on lighting and heating show how desperate people are becoming in their attempts to lower their costs. These results also show that the proportion of people driven to these behaviours sometimes or often is significant, in many cases representing between 50-70% of responses (Figure 11).
It is also worth noting that electricity prices are increasingly being ‘rebalanced’ so that a greater proportion of charges are fixed, and not subject to individual household usage. There is a very real concern that many vulnerable people are reaching a point where they have no further ‘fat’ to cut, but will continue to see increases in bills for the provision of essential services from which they are not able to properly benefit.
0
10
20
30
40
50
60
32.1 33
39.8
19.3
53.4
25
10.2
22
8.4
38.438.4
40.9
20.9
33.4
13
32.7
15.7
30
17
Not used oven/micro
Not used Tv
Not used computer
Early bed
Not used heater
Not used hot water
Not used washing machine
Not used Dryer
Not used A/C
Not used lighting
32.7
Often/ AlwaysSometimes
Behaviour
% o
f res
pons
es
Figure 11: Rationing behaviours employed by low-income households attempting to lower their energy bills.
What low-income households are doing to reduce their energy bills
“ I have cut down on electricity everywhere and every way possible. If I cut down anymore than we simply would not be using any ever! It is a nightmare. It is causing a lot of anxiety and depression”
19

A range of options exist to support vulnerable households to pay their bills, or to lower their bills – including by increasing the efficiency of their energy usage or by getting a better deal. Our survey examined how well-known and utilised these measures are amongst households experiencing poverty, and how effective they are for those who access them.
6.1 Access to energy efficiency Most households recognise that becoming more energy efficient is the most effective way to reduce their energy usage - and thereby their bills. Over the last 10 years this message has been reinforced by various programs run by both the State and Commonwealth Governments. The focus has been on informing people about the potential benefits of improved household energy efficiency, and supporting adoption of a range of energy efficiency measures; such as energy efficient light-bulbs, appliance star rating systems, in-home energy audits, and even large scale programs to improve insulation.
Our results (detailed in Figure 12) show that when it comes to even the simplest measures that might improve household energy efficiency, such as the installation of energy efficient light-bulbs, a significant proportion of vulnerable households still believe they are either not able to access them, or are unaware of their significance. It is also very clear from our results that the measures that offer the most significant efficiency savings, such as improved insulation and generation and storage capacity, are the least likely to have been adopted by vulnerable households
Of the 20% of responses that did not have energy efficient light-bulbs, over 55% (50 responses) were households with children.
Of the 37.9% of responses that did not have a 4-6 star refrigerator, 46% (76 responses) were households with children.
6 Efficiency, assistance and access to support
0
20
40
60
80
100
38.2
12.520
42.3
57
82.7
72
3.2 3.4 6.4 8.6 8.4 5.5 5.5 5.2 7.3
79.886.4
37.9 38.4
66.8
79.1
62.1
4-6 star a
ircon
4-6 star h
eating
4-6 star d
ishwash
er
4-6 star d
ryer
4-6 star w
ashing
4-6 star fr
idge
Battery st
orage
Solar power
Solar hot w
ater
Wall insu
lation
Roof/ceilin
g insu
lation
E�cient li
ghtbulbs
Don’t knowDon’t have it/not possible where I live
Figure 12: Lack of take-up of energy efficiency measures amongst low-income households in the last three years, expressed as a percentage of total responses.
20
0
10
20
30
40
50
60
32.1 33
39.8
19.3
53.4
25
10.2
22
8.4
38.438.4
40.9
20.9
33.4
13
32.7
15.7
30
17
Not used oven/micro
Not used Tv
Not used computer
Early bed
Not used heater
Not used hot water
Not used washing machine
Not used Dryer
Not used A/C
Not used lighting
32.7
Often/ AlwaysSometimesBehaviour
% o
f res
pons
es
Take-up of energy efficiency measures

For vulnerable households, barriers inhibiting access to the benefits that flow from improved household energy efficiency include:
The cost of energy efficient appliances and household improvements,
Household tenure (with many vulnerable people living in rental or social housing), and
A lack of awareness of programs that may assist them to access energy efficiency measures.
For more significant energy efficiency measures such as insulation, our survey found that while take-up was low across all households, for several of these measures – such as insulation and solar generation – take-up was significantly higher amongst those that own their own or are paying off their own home (Figure 13). Across all the major energy efficiency measures, however, the rate of take-up is relatively equivalent across owners and renters (Figure 14). This suggests that the most immediate barriers to accessing energy efficiency upgrades are cost and awareness, with tenure a secondary factor.
There is therefore significant opportunity for the NSW Government to improve the long-term financial sustainability of vulnerable households by supporting improved access to energy efficiency, while undertaking longer-term reforms to tenancy laws that would facilitate wider access to more substantial efficiency measures.
Given that a growing proportion of energy bills relate to fixed charges rather than usage, it is possible that the benefit of improved energy efficiency could be diluted. While in the short to medium term there is still significant scope to replace inefficient appliances and improve household insulation, for vulnerable households to benefit substantially from improved energy efficiency, access to generation and storage technology will be key.
21
0
5
10
15
20
25
30
35
40
2 13
11
6
14
5
11
38
23
Wall InsulationRoof InsulationSolar Hot WaterBatterySolar PV
% o
f tot
al re
spon
ses
Renting or SharingOwn or Paying Mortgage
Energy e�ciency measure
Figure 13: Proportion of low-income households who have accessed major energy efficiency improvements in the last three years, according to tenure type.
Take-up of major energy efficiency measures by tenure

0%
10%
20%
30%
40%
50%
60%
70%
80%
90%
100%
E�cient Airc
on
E�cient heatin
g
E�cient dish
wash
E�cient dryer
E�cient wash
ing
E�cient fridge
Battery
Solar power
Solar water
E�cient lights
Wall insu
lation
Roof insu
lation
% o
f res
pons
es w
ithou
t
Don’t know ownCan’t have, ownDon’t have, ownDon’t have, rentingCan’t have, rentDon’t know, rent
Energy e�ciency measures not accessed
Lack of access to energy efficiency by tenure
Access and awareness of the Home Energy Action Program (HEAP)
The NSW Government’s Home Energy Action Program (HEAP) assists low-income households to replace old and inefficient fridges and televisions . However, our survey found that many respondents who would be eligible for the HEAP have not benefitted from the $100-200 in annual savings that it can facilitate. For example, of the 167 respondents who do not yet have a 4-6 star rated fridge (as an indicator of those who could benefit from the program), 92.2% had not accessed the program, while 59.0% were not aware it existed. A significant proportion of people also believed they were not able to access it (13.7%), or believed they didn’t need it (20%).
22
Figure 15: Lack of take-up of energy efficiency measures in the last three years, broken down by tenure type and reason measure not accessed, expressed as a percentage of the total number of respondents who did not access that measure (shown in Figure 12).

6.2 Access to energy assistanceOur survey found a universally low level of awareness of the range of government supports available to people experiencing poverty or otherwise vulnerable to high energy costs. For example, 35% of people in our survey did not know about the Low Income Household Energy Rebate – the largest and most well-utilised support, while approximately 40% were unaware of Energy Accounts Payment Assistance (EAPA) vouchers and the Family Energy Rebate (Figure 16). In fact, it is informative that awareness of specialist rebates, which are closely targeted to people with particular vulnerabilities, that is medical energy needs, or energy needs related to life support, are on par with those available to a much wider pool of recipients.
0
10
20
30
40
50
60
70
HEAPLife support Rebate
Medical Energy Rebate
Gas RebateFamily Energy Rebate
Low income household rebate
EAPA
3532
40
18
32.3
18
10
22
14
No I can’t get itNo I didn’t need itYes I received it No I didn’t know about it
% o
f all r
espo
nses 44.1
13.6
33.9
13.2
20.9
15.2
41.8
35.7
9.8
29.1
15.9
45.2
5.7
40.9
13.4
8.2
23.2
11.4
57.3
Figure 16: Access to and awareness of energy assistance provided by the NSW Government, amongst low-income households
Access to energy assistance provided by the NSW Government
23
Recommendations
1. Quarantine a significant portion of funds from the lease of electricity network assets to invest in substantial energy efficiency updates for vulnerable households, including generation, storage and other efficiency measures that will reduce the long-term burden of energy costs.
2. Commence work on reform of rental tenancy laws to improve minimum efficiency standards of rental properties, and facilitate the adoption of more significant energy efficiency measures for vulnerable rental households.
3. Further expand the Home Energy Action Program as part of measures being considered in the Draft Plan to Save NSW Energy and Money, such that:
The expanded program better links retailer, rebate and emergency supports to improved energy efficiency for vulnerable households, including provision of in-home audits, access to financial counselling, NILs, appliance upgrades and community solar schemes.
The expanded program be developed in consultation with stakeholders, with reference to the successes of previous programs such as the Home Power Savings Scheme.

For each type of support, a large proportion of respondents also nominated that they ‘didn’t need it’ or ‘can’t get it’. These results suggest that awareness of supports, knowledge of how to access them and understanding of their purpose are significant barriers to gaining assistance.
6.2.1 Emergency Accounts Payments Assistance (EAPA)
EAPA is a voucher-based scheme that is not means tested, and is provided through approved community organisations that individually assess people in short term need of assistance to pay an energy bill.24
Over 44% of the people we surveyed didn’t know that EAPA support existed, while 13.6% of respondents believed they couldn’t get EAPA vouchers, even though they are theoretically available to anyone who is unable to pay their bills. Figure 17 illustrates the extent of the problem, showing that of those respondents who are having trouble paying their bills – and who therefore might benefit from the EAPA scheme– a significant proportion do not know about
0
10
20
30
40
50
60
11
16 1513
15 14
33
18
13
19 2018
44
5149 50 49
51
No Emergency Savings
(156)
Missed rent or mortgage to pay
(82)
Pawned to Pay bills
(115)
Disconnected from Electricity
or received notice(47)
Paid Electricity Bill late
(142)
Income from Govt supports only
(150)
% o
f tot
al c
ohor
t
Can’t get itDon’t need itDidn’t know about it
Indicators of di�culty paying bills
Figure 17: Households who showed indications of financial stress, but who did not access EAPA vouchers, broken down by reason.
Households experiencing financial stress who did not access EAPA vouchers
Diana is 37-year old single woman with three children under the age of 18 living in a rental household in Bexley. She pays $400 a week in rent, from a weekly after-tax income of $630: a combination of part time work and income support payments. The household does not have any emergency savings and is not living in a secure situation. They often go without many of the basics, including medical treatment, and have to borrow money or pawn items to pay bills. They have received disconnection notices for both their gas and electricity supplies, although they have not yet been disconnected. Their last quarterly bills were $500 for electricity and $120 for gas. Despite the household’s tenuous financial situation, they believed they were unable to access any of the supports on offer, including EAPA vouchers.
24
24 http://www.resourcesandenergy.nsw.gov.au/energy-consumers/financial-assistance/energy-accounts-payment-assistance-EAPA

it, do not understand its purpose, or do not see it as something from which they could benefit.
6.2.2 Family Energy Rebate (FER)
The FER is a supplementary rebate available to recipients of the Family Tax Benefit. The rebate offers either $15 ($16.50 for people in residential parks) to those who already receive the LIHER, or $150 ($165 for people in residential parks) to those who do not already receive the LIHER25.
Applications for the FER must be submitted after the end of financial year via an online application form. Given the process involved in accessing the FER, it is not surprising that the overall rate of uptake is very low (22%). Our survey demonstrate a high level of confusion about the FER. While 22% of respondents reported that they had accessed this rebate, more than half of these do not appear to meet the eligibility criteria. Even if we do not take this anomaly into account, our results show that over 75% of the low-income households with children we surveyed are not receiving any benefit from the program.
Our results on the low uptake are supported by NSW Government figures for the program which show that the $14 million budget for the program in 2015-16 was underspent by $4 million.26
6.2.3 Low Income Household Energy Rebate (LIHER)
The LIHER provides a fixed rebate of $235 (or $258.50 for residents of residential parks)27 to eligible holders of a Commonwealth Pension Card or a Commonwealth/Centrelink Health Care Card, though not those who have a Low Income Health Care Card.
Our results found that while this was the best utilised of the available supports (33.9% said they received it), a large proportion of respondents were unaware of its existence (35%), and 13.2% of
25
Recommendations
4. Review the EAPA system to improve availability, awareness, ease of access and linkages to other supports. Particular attention should be paid to:
Expanding the number of organisations able to issue EAPA vouchers, ensuring better availability beyond faith based organisations, and better availability across all regions
Better information regarding EAPA to be provided through all available Government and community information points, including Service NSW Centres and Centrelink Offices
Linking the receipt of EAPA vouchers to other government and retail supports, energy efficiency programs and financial counselling services, to help build longer-term financial sustainability for people accessing the program
Recommendation
5. That the funds currently allocated to the Family Energy Rebate be redirected to a more effective and more comprehensive rebate scheme that is better targeted towards low-income households (see Recommendation 7).
25 Family energy rebate http://www.resourcesandenergy.nsw.gov.au/energy-consumers/financial-assistance/rebates/family-energy-rebate 26 NSW Government. Budget 2016-17: Budget paper number 1: Budget Statement. 2016. A6-19. 27 Low income Household rebate http://www.resourcesandenergy.nsw.gov.au/energy-consumers/financial-assistance/rebates/low-income-household-rebate

respondents did not view it is a support they might be able to access.
Of those households who were not receiving the rebate many are likely to be eligible: 41% were either partially or totally reliant upon major income support payments. This suggests that awareness of the rebate is a barrier for a significant proportion of potentially eligible recipients.
Of the 16% (46) of respondents who believed they were unable to get or ‘did not need’ the LIHER, all received income support payments and had incomes significantly below the qualification for a Low Income Health Care Card , and many reported quarterly bills well above the average ($380-400). This group have a demonstrated need, and if they were able to access the support offered by the LIHER it would make a substantial difference to their financial stability and longer-term health and wellbeing.
The LIHER provides a fixed $235 rebate to low-income households. Our results show that a household receiving an average annual electricity bill ($1528) would receive a rebate equivalent to 15.4%. However, for the one fifth of households with bills in excess of $2400, the rebate would be equivalent to less than 10%. The inverse is also true: some households with very low bills ($800 and less) would receive a rebate equivalent to 30% or more. Given the cost of electricity is higher in regional NSW, the rebate typically covers a greater proportion of energy bills for those people living in metropolitan Sydney. Also of note is that while all of the people we surveyed are very low-income households, many are not currently eligible for the LIHER and receive no assistance.
Were the LIHER to transition to a rebate providing a 17.5% reduction of a household bill, it would mean:
• Those with a bill based upon the average bill results received in our survey would receive a rebate of $267.5, instead of a $235 rebate
• Those with a bill of $2400 would receive a rebate of $420, instead of $235.
• Those with very small or zero bills, such as customers with solar generation capacity would receive a very small or zero rebate, instead of the $235 rebate they are currently able to access
Figure 18 shows a breakdown of the bill range of those accessing the various supports, which is particularly relevant for the LIHER, and consideration of transitioning to provision of a percentage based support.
26

0
10
20
30
40
50
60
70
3
16
6
03
0 0 0
6 59
04
0
7
0
15
710
2
16
25
12
3
17 16
24
5
15
9 10
5
107 7
26
119
12
58
Accessed Gas (62)Accessed FER (97)Accessed EAPA (44)Accessed LIHER (149)
$1000-1685$900-1000$800-900$700-800$600-700
$500-600$400-500$300-400$200-300$1-200
% o
f tho
se re
ceiv
ing
supp
ort
Bill range of those receiving major supports and rebates
Recommendations
6. That eligibility for the Low Income Household Energy Rebate be extended to holders of Commonwealth Low Income Health Care Cards.
7. That the NSW Government work with the Commonwealth Department of Social Services to improve the coordination of supports and rebates for people on low-incomes, including:
Ensuring comprehensive and accurate information on the range of supports is given to eligible people:
Improved data sharing between the State and Commonwealth Governments to facilitate the targeting of information to vulnerable consumers
The systematic provision of information on energy assistance through Centrelink and other commonwealth government information portals for vulnerable consumers
Exploring the possibility of automatic application of rebates to overcome significant barriers in information and self-identification.
8. That the Low Income Household Energy Rebate, with additional funds reallocated from the Family Energy Rebate, transition to a percentage-based concession providing eligible households with a 17.5% rebate on their electricity bills.
9. That arrangements for setting ‘floors’ for rebate payment to be developed in consultation with stakeholders and community service providers.
10. That LIHER rebate support be subject to an ‘excess’ amount be set (in consultation with community stakeholders) that triggers secondary evaluation, to identify potential efficiency benefits and other mitigation measures, before an ‘excess’ rebate continues (a similar system currently operates in Victoria)
27
Figure 18: breakdown of those receiving major energy supports according to their last quarterly bill, represented as a proportion of the total number of people accessing that support.

6.2.4 Gas Rebate
The Gas rebate was introduced in July 2016 and offers a rebate of $90-99 for the Gas and LPG bills of vulnerable people with a Commonwealth Pension card or Centrelink Health Care Card, though not those who have a Low Income Health Care Card.29
In our survey, a large proportion of respondents reported that they ‘don’t need it’. This likely relates to the fact that many people do not have gas accounts. However, 32% of respondents said they did not know about the program, again indicating that lack of awareness is a significant barrier to accessing supports. Similarly, 18% of people believed they could not get this rebate, in addition to those who believed they don’t need it, suggesting there is potentially significant value in extending eligibility for the Gas rebate to those who hold a Low Income Health Care Card
6.3 Retailer supports and accessing the best offersThe belief that competition between retailers drives choice and lower prices has led to the deregulation of the electricity market in recent years. Residential gas is similarly transiting to a deregulated, competitive market. The reduction in regulatory intervention in retail markets leaves the onus on consumers to be informed about what is available in the market, compare what is on offer, choose the best deal for their circumstances, and keep their choices up to date.
Several recent reviews have looked at the operation of the competitive markets for electricity and gas to determine the effectiveness of competition. In these reviews, basic metrics on switching, take-up of market offers, and the difference between best and worst deals are used as markers of effective competition. While valuable, these measures do not provide an accurate assessment of how retail competition is working for specific cohorts, and particularly for people with low incomes.
Our research indicates that the people who are most negatively impacted by the failures of the retail energy market, are the people on low-incomes who can least afford it.
6.3.1 Comparing, switching and renewing.
The Australian Energy Regulator (AER) tracks monthly data on ‘switching rates’ as a means of understanding how many people are actively participating in the market and switching to get a better deal. Switching rates for electricity have hovered around 4-5% per month over the last few years30. Simple extrapolation of these figures would suggest up to 60% of people have switched annually. However, the number of people still on standard contracts (23.6%) suggests that a significant proportion of this switching is ‘churn’ by a smaller percentage of people who are informed, motivated and capable of getting a better deal.
Our results support this conclusion: only 16.8% of respondents to our survey indicated that they had contacted a retailer in the last 12 months in order to switch. More concerning is the fact that of the 83.2% of people (366) who believed they didn’t need to switch or didn’t know it was possible, 34.4% (or 126) had bills in excess of $400 a quarter, suggesting they are the most likely to be able to benefit from a better deal. We found a similarly low rate of respondents had contacted their retailer in the last 12 months in order to get a better deal (25.5%), or to renew a deal (20%) (Figure 20).
Recommendation
11. Extend eligibility for the Gas rebate to those who hold a Low Income Health Care Card, in line with the criteria for the LIHER
28
30 Australian Energy Regulator https://www.aer.gov.au/retail-markets/retail-statistics/electricity-customer-switching

There are some cohorts who are of particular interest (shown in Figure 21) either because they are less likely to have contacted their retailer, or because their circumstances mean that they should have been assisted to do so, such as people receiving income support payments, and people accessing EAPA and LIHER. The experiences of these groups illustrate how the potential benefits of retail competition are not reaching vulnerable low-income households.
Retailers typically have ‘sunset’ clauses on their offers, whereby the conditions of the deal revert to a standard contract that is often significantly more expensive. Additionally, the range of deals on offer changes regularly. In order to get and retain the best deals it is necessary to compare offers every 3-6 months, and contact your retailer in order to switch, change or renew the best offer for you. Our research shows that this is not how people on low-incomes are engaging in the market, suggesting they are more likely to be on a more expensive ‘standing offer’, more likely to be on a more expensive market offer, and more likely not to realise that the conditions of their contract may have lapsed, leaving them worse off.
St Vincent de Paul’s NSW Tariff-Tracking Project suggests that as at July 2016, the 23.6% of people who were on standing/transitional offers would be able to save $400-$30 per annum if they switched to the best market offer. The report also shows that the potential savings available for switching from the worst market offer to the best market offer range from $260 and $380 per annum, depending on location. According to these figures, it is possible for people to gain substantial benefits from choosing a better deal, but a significant proportion of people are missing out on these benefits. In fact, the potential benefits of switching to a better deal would in many cases exceed the value of NSW Government rebates. This means that at least part of the investment in rebates that should be accruing benefits to vulnerable people is effectively operating as a subsidy to retailers, because vulnerable people are not resourced to make the best choices.
Contacted forbill extension
Contacted tocomplain
Contacted forhardship
assistance
Contacted forpayment plan
Contacted torenew
Contacted forbetter deal
Contacted toSwitch
Didn’t know about itDidn’t need toYes
0
10
20
30
40
50
60
70
80
90
9.316.1
11.4 13.220.2
8.4 8.4
73.9
58.4
68.673.2 71.8 72
80.9
16.8
25.520
13.68
19.5
10.7
% o
f all
resp
onse
s
Figure 20: Low-income households interaction with their energy retailer over the last 12 months.
Low-income households contact with retailers in the last 12 months
29

Many reviews by regulators such as IPART31 have concluded that, on the basis of the basic metrics examined, competition is working well for people, and is delivering them the choice and the better prices that were intended. Our results support the more recent report from the Grattan Institute32, which found that retail competition (using Victoria as an example) is not actually delivering better outcomes for most consumers and is in fact leaving a very significant proportion of people much worse off. Our research indicates the retail market is least likely to be working well for the most vulnerable in our community. Our survey results also suggests that the way in which people on low-incomes experience the retail energy market is potentially undermining the assistance provided by government supports and rebates, and that further reform is required to ensure these supports deliver the intended benefits.
0
20
40
60
80
100
7468 71
80 80
70
84
75 7680
75
84
Didn’t need/ Didnt know about renewing deal
Didn’t need/ didnt know about better deal
Didn’t need/didnt know about Switching
Accessed EAPA
Government support incomeSpeak Language other than English at home
OverallAccessed LIHER
% o
f tot
al c
ohor
t
83
7480
Figure 21: Cohorts of low-income households that are not contacting their retailers, represented as a % of that cohort.
30
Cohorts not likely to have contacted their retailer
31 IPART. Review of the performance and competitiveness of the retail electricity market in NSW: from June 2015 to July 2016. November 2016 32 The Grattan Institute. Tony Wood & David Blowers. Price Shock: Is the retail electricity market failing consumers? March 2017.
Cohorts who didn’t contact their retailer and why
In the current system a rebate recipient on the average standing offer in the Ausgrid (Sydney) network area could be paying $2200 a year, on which they would receive a rebate of $235 (10.7%). The same customer could pay $1950 and save at least $250 by switching to the average market offer. In practice this means that potentially all of the rebate benefit has been absorbed by the retailer that allows that customer to remain on a poor deal, with the customer still being $15 worse off (still paying $1965). If the goal of rebate support is to assist vulnerable people with their energy costs, it has clearly failed in cases such as this.
Moving to a system that provided a 17.5% rebate, and required the retailer to place that customer on the best deal would see this same customer put on the $1950 offer, on which they would receive a rebate of $341.25 (leaving them to pay $1608.75). Here, all the support actually flows to the customer who is $356.25 better off than they would have been under the current system. The Government has paid $44 less in support than would have been the case if the best retail deal was not a requirement, and for a total cost of $341.25 has facilitated $591.25 in overall benefit for that vulnerable household.

6.3.2 Payment extensions, payment plans and hardship schemes
Retailers are required to put in place a range of measures designed to support vulnerable customers who cannot pay their bills. These range from payment extensions and payment plans to hardship schemes. Official figures show that as at December 2016 in NSW there were 81,000 people on electricity retailer payment plans (up from 60,960 in 2014), with the figure being 21,182 for gas retailers (up from 10,584 in 2014).33 For electricity, this represents 2.4% of all electricity customers.
The number of customers participating in their retailers’ hardship scheme has similarly increased in recent years. Between 2014 and December 2016 the number of people on electricity retailer hardship programs grew from 18,293 to 25,276, while for gas retailers the number of people increased from 3,884 to 8,016.34
Our survey results show that although people are more likely to be aware of various retailer supports than of government supports, there remains a significant group of vulnerable households who do not realise that assistance is available from their retailer. Indeed, 8.4% of all respondents were unaware of retail payment extensions, 13.2% were unaware of the existence of retail payment plans, and 20.2% were not aware that retail hardship programs existed. Levels of awareness were lower than average amongst households that spoke a language other than English at home, and households whose main source of income was an income support payment (Figure 22). Awareness of assistance measures was also particularly low amongst those who had paid late, been disconnected or accessed EAPA vouchers. This is a major concern and indicates that retailers are not proactively engaging with their customers to ensure they are appropriately supported.
31
33 Australian Energy Regulator https://www.aer.gov.au/retail-markets/retail-statistics/nsw-customers-on-payment-plans 34 Australian Energy regulator https://www.aer.gov.au/retail-markets/retail-statistics/nsw-customers-on-hardship-programs
Recommendation
12. Require retailers to make all deals, including the low cost deals, more transparent and understandable, and publish them on the basis of the base rate, not including possible discounts
13. Ensure that retail deals are not subject to ‘sunset’ arrangements. Additionally, or alternatively, retailers should be required to directly inform customers in writing prior to the end of their current deal and tell them what the end of the deal will mean for them if they do not do anything (eg. If you do not contact us prior to x date you will be placed on a standard contract which will mean $YY a year more than your current deal).
14. Require retailers to work with the NSW and Commonwealth government on a system allowing the automatic application of the Low Income Household Energy Rebate to eligible customers.
15. Require retailers to put all Low Income Household Energy Rebate recipients, hardship customers and customers on payment plans onto a ‘best deal’ or to develop special low-cost deals for this cohort

32
0
10
20
30
40
50
20
34
11
26
43
17
23
39
1412
21
6
20 20
1013
23
8
2023
8
1822
1313
20
8
Didn’t know about Payment extensionsDidn’t know about Hardship programsDidn’t know about Payment plans
DisconnectionNo savingsReceived LIHER
Govt Income supportLanguage other than englishOverall
Paid lateReceived EAPA
Income <$639
% o
f peo
ple
in th
at c
ohor
t
Figure 22: Detailed look at those who were unaware of the various retailer supports and assistance schemes, broken down into particular cohorts who may be more likely to benefit from them.
Cohorts who are unaware of retail supports
0
20
40
6053
4642
45
4044
52 51 50
4346 47
44 43 4446
5046
26 26 26
37
4542
Didn’t need hardship assistanceDidn’t need payment planDidn’t need payment extension
Missed rent or mortgage (82)Gone without medical (146)
Borrowed from family (138)Disconnected or received notice (47)Paid late (142)
Gone without medication (112)Pawned (115)
Payday lender (54)
% o
f tho
se e
ngag
ing
in b
ehav
iour
Figure 23: People experiencing indicators of financial stress who do not identify themselves as needing retailer supports and assistance.
People are struggling but do not identify themselves as being eligible for available supports.
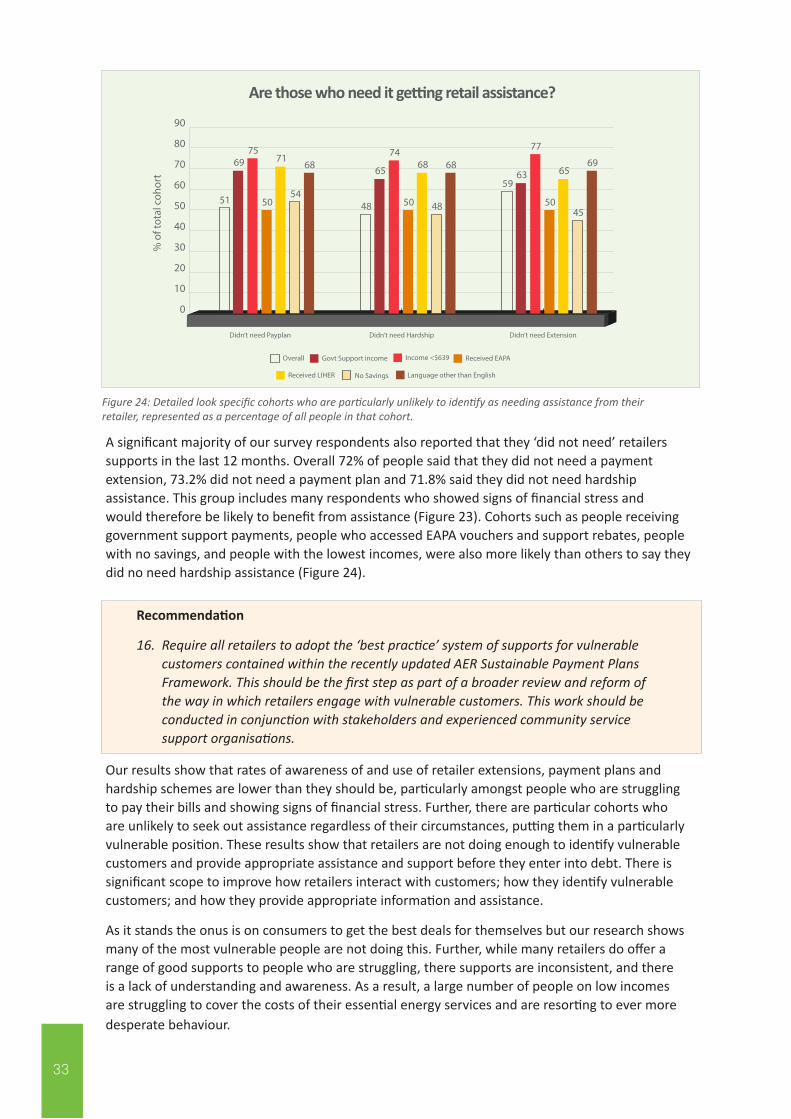
A significant majority of our survey respondents also reported that they ‘did not need’ retailers supports in the last 12 months. Overall 72% of people said that they did not need a payment extension, 73.2% did not need a payment plan and 71.8% said they did not need hardship assistance. This group includes many respondents who showed signs of financial stress and would therefore be likely to benefit from assistance (Figure 23). Cohorts such as people receiving government support payments, people who accessed EAPA vouchers and support rebates, people with no savings, and people with the lowest incomes, were also more likely than others to say they did no need hardship assistance (Figure 24).
Our results show that rates of awareness of and use of retailer extensions, payment plans and hardship schemes are lower than they should be, particularly amongst people who are struggling to pay their bills and showing signs of financial stress. Further, there are particular cohorts who are unlikely to seek out assistance regardless of their circumstances, putting them in a particularly vulnerable position. These results show that retailers are not doing enough to identify vulnerable customers and provide appropriate assistance and support before they enter into debt. There is significant scope to improve how retailers interact with customers; how they identify vulnerable customers; and how they provide appropriate information and assistance.
As it stands the onus is on consumers to get the best deals for themselves but our research shows many of the most vulnerable people are not doing this. Further, while many retailers do offer a range of good supports to people who are struggling, there supports are inconsistent, and there is a lack of understanding and awareness. As a result, a large number of people on low incomes are struggling to cover the costs of their essential energy services and are resorting to ever more desperate behaviour.
Recommendation
16. Require all retailers to adopt the ‘best practice’ system of supports for vulnerable customers contained within the recently updated AER Sustainable Payment Plans Framework. This should be the first step as part of a broader review and reform of the way in which retailers engage with vulnerable customers. This work should be conducted in conjunction with stakeholders and experienced community service support organisations.
33
0
10
20
30
40
50
60
70
80
90
68 68 69
5448 45
71 68 65
50 50 50
75 74 77
6965 63
51 48
59
Didn’t need ExtensionDidn’t need HardshipDidn’t need Payplan
Language other than EnglishNo Savings
Income <$639Govt Support incomeOverall
Received LIHER
Received EAPA
% o
f tot
al c
ohor
t
Figure 24: Detailed look specific cohorts who are particularly unlikely to identify as needing assistance from their retailer, represented as a percentage of all people in that cohort.
Are those who need it getting retail assistance?

By asking people on low-incomes directly about their experiences, we’ve been able to show exactly how energy costs impact their daily lives.
The picture is very sobering. Energy costs continue to increase, and many low-income households are struggling with costs that already exceed their capacity to pay. We’ve found that many low-income households are paying their bills late and being disconnected. In an attempt to lower these bills, households are rationing their energy use in ways that will have potentially serious impacts on their own health and wellbeing and that of their families. Having reduced their usage as far as possible, many are now running into debt, pawning household items, and going without a range of household essentials just to keep the lights on. With energy costs likely to escalate35 many households will reach crisis point and the flow-on effects to the health, wellbeing and inclusion of the adults and children living in these households should cause us all genuine concern.
However, our report suggests a range of practical measures for action for the NSW Government. These would have a significant effect on the daily lives of people living below the poverty line. The NSW Government has the means and responsibility to address the needs of the community, and should ensure that a fair proportion of those benefits flow to people experiencing poverty and disadvantage – the people for whom essential energy services are increasingly unaffordable.
The message is clear – energy is an essential service, and addressing the crisis that people on low-incomes face as they struggle with the cost of this essential service should be a priority for our State. We need to push for better retail practices, and ensure that the current review of the way in which we provide energy assistance leads to better outcomes for vulnerable people. Finally, we need to invest in improving the energy efficiency and independence of vulnerable people in order to improve their longer-term financial stability, health and well-being.
7 Conclusion
34
35 SMH Online http://www.smh.com.au/business/households-facing-price-spike-as-regulator-loses-key-court-case-20170523-gwbrjv.html
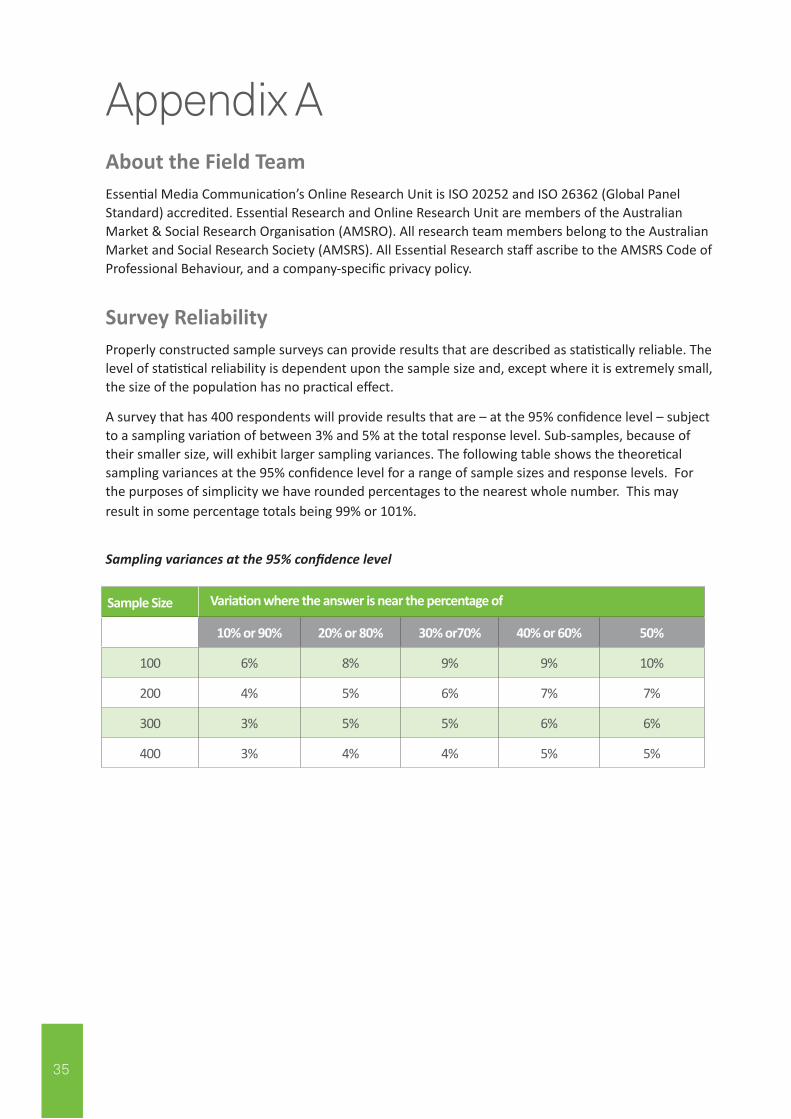
Appendix AAbout the Field TeamEssential Media Communication’s Online Research Unit is ISO 20252 and ISO 26362 (Global Panel Standard) accredited. Essential Research and Online Research Unit are members of the Australian Market & Social Research Organisation (AMSRO). All research team members belong to the Australian Market and Social Research Society (AMSRS). All Essential Research staff ascribe to the AMSRS Code of Professional Behaviour, and a company-specific privacy policy.
Survey ReliabilityProperly constructed sample surveys can provide results that are described as statistically reliable. The level of statistical reliability is dependent upon the sample size and, except where it is extremely small, the size of the population has no practical effect.
A survey that has 400 respondents will provide results that are – at the 95% confidence level – subject to a sampling variation of between 3% and 5% at the total response level. Sub-samples, because of their smaller size, will exhibit larger sampling variances. The following table shows the theoretical sampling variances at the 95% confidence level for a range of sample sizes and response levels. For the purposes of simplicity we have rounded percentages to the nearest whole number. This may result in some percentage totals being 99% or 101%.
Sampling variances at the 95% confidence level
Sample Size
10% or 90% 20% or 80% 30% or70% 40% or 60% 50%
100 6% 8% 9% 9% 10%
200 4% 5% 6% 7% 7%
300 3% 5% 5% 6% 6%
400 3% 4% 4% 5% 5%
Variation where the answer is near the percentage of
35

Appendix BData Qualifiers and Method ExplanationThis section further explains the approach we took in framing of some of the questions included in our survey, and where necessary qualifies the data we collected in order to ensure that the results are viewed in the correct context.
GeneralOnline format surveys are recognised as having a number of limitations in relation to the target group that was the focus of this research. Many people experiencing poverty, and many vulnerable people with low incomes, either do not have a reliable connection to the internet, or do not have the time and resources to spare on an online survey. Further, some of those groups who are potentially most vulnerable, Aboriginal people, CALD people, new arrivals, unemployed people, people with complex needs and people with disability, have cultural, social or personal reasons why they are less likely to participate. Recognising these limitations, our survey set a range of soft and hard quotas to maximise the range of responses from people within the target income brackets, and the survey was left in the field for an extended period to allow these quotas to be met.
IncomeThe target group, people experiencing poverty, and vulnerable to experiencing poverty, were selected according to income responses, cross-matched against the number of people in the household. We based our income brackets on 60% of median household incomes for each household configuration (Table 1). We used self-reported estimates of total weekly income after tax to assess income levels, believing this information the most likely to be easily and accurately recallable by respondents.
Our results included a slightly disproportionate rate of responses from people age 60-64+, and a number of respondents who indicated that their main source of income related to neither employment nor incomes supports. Taken together, this suggests that our survey captured a small proportion of self-funded retirees and others who may own their own property and technically live on a very low weekly income, and who therefore met the criteria for our survey. However this cohort is likely to be very small and not significant enough to bias the overall results.
50% of median 60% of median
Lone person $427 $512
Couple only $640 $767
Lone parent with 2 Children $682 $818
Couple with 2 children $895 $1075
Table 1: Maximum income thresholds based on the ACOSS/SPRC report ‘Poverty in Australia 2016’, and are expressed as after tax figures before housing costs are taken into account
36

Household compositionOur survey included separate questions on the number of people over 18 and the number of people under 18 living in the households, so that this information, in conjunction with information on eligibility, could be used to determine eligibility as well as variable in our data analysis.
Bill informationWe asked respondents to self-report their last quarterly bill for each of essential service. This approach was chosen as we believed this is the information people would be most likely to have on hand or accurately recall, and would result in more accurate information that an estimation of annual bills. However, there are some potential limitations in this approach as quarterly bills can vary significantly according to season (and are therefor not always indicative of annual costs). In addition, the last bill could be in credit, or have a zero or unusually low balance as a result of being a new account or other anomalous circumstances. Analysis of our data suggests that this is the case for only a very small number of respondents, and does not undermine the overall value of the data.
Energy supportsIn asking about the supports our respondents had accessed we used the official name for each support, as well as short names where we were aware these were in common usage. The data suggests that the respondents were not always sure which supports they were receiving. For example, that there were a number of households without children who reported that they received the Family Energy Rebate suggests there may have been some confusion about this rebate. We have taken these anomalies into account in our analysis.
37

Appendix CProfile of the Survey Respondents
38
Percent (%)Male 34.8
Gender Female 65Other 0.218-29 12.330-39 16.340-49 21.8
Age 50-59 1560-69 22.570-79 9.381+ 2.7
Location Sydney 53.9Regional or Rural NSW 46.1Age Pension 17.9Service Pension 0.2Disability Support Pension 8.9Carer Allowance 7.5
Income support payment received Newstart Allowance 10.2Austudy/ Abstudy 0.7Youth Allowance 2.7Parenting Payment 13.6No payments/ none of the payments nominated 41.81 16.82 17
Number of children living at home 3 6.44 1.65+ 0.5None 57.70 - $427 24.3$428 - $512 21.4$513 - $639 15.5
Household weekly income income $640 - $682 7.7(after tax) $683 - $767 10
$768 - $818 6.1$819 - $894 5.$895 - $1,075 10Government payment/s 34A combination of government payment/s AND paid work 17
Main source of income Income from fulltime work 20.5Income from part-time work 12Income from casual or contract work 6.4Other 10
Language other than English at home? Yes 22.7No 77.3
Are you of Aboriginal or Yes 2
Torres Strait Islander origin? No 97Prefer not to say 0.9Yes 25.2
Do you have a disability? No 73.4Rather not say 1.4

39 39