ndoutils database model - nagios · commenthistory table description: this table is used to store...
TRANSCRIPT
NDOUtils Database Model
Copyright (c) 2006-2007 Ethan Galstad
Last Updated: November 14, 2016
Page 1 / 57 NDOUtils Database Model – www.nagios.org Copyright (c) 2006-2007 Ethan Galstad

NDOUtils DB ModelSection Page
Introduction ........................................................................................ 4
Central Tables .................................................................................... 5instances ................................................................................ 7objects .................................................................................... 8
Debugging Tables ............................................................................ 9 conninfo ................................................................................. 11
Historical Tables ............................................................................... 13 acknowledgements ................................................................ 16 commenthistory ...................................................................... 17 contactnotifications ................................................................ 18 contactnotificationmethods .................................................... 19 downtimehistory ..................................................................... 20 eventhandlers ........................................................................ 22 externalcommands ................................................................. 24 flappinghistory ........................................................................ 25 hostchecks ............................................................................. 26 logentries ............................................................................... 28 notifications ............................................................................ 29 processevents ........................................................................ 31 servicechecks ........................................................................ 32 statehistory ............................................................................. 34 systemcommands .................................................................. 36 timedevents ............................................................................ 37
Currnet Status Tables ...................................................................... 38 comments ............................................................................... 41 customvariablestatus .............................................................. 42 hoststatus ............................................................................... 43 programstatus ......................................................................... 46 runtimevariables ..................................................................... 48
Page 2 / 57 NDOUtils Database Model – www.nagios.org Copyright (c) 2006-2007 Ethan Galstad

Current Status Tables Cont'd scheduleddowntime ................................................................ 49 servicestatus ......................................................................... 51 timedeventqueue ................................................................... 54
Configuration Tables ...................................................................... 55commands ............................................................................. 55configfiles ............................................................................... 55configfilevariables .................................................................. 55contact_addresses ................................................................. 55contact_notificationcommands .............................................. 55contactgroup_members ......................................................... 55contactgroups ........................................................................ 55contactnotificationmethods .................................................... 55contacts ................................................................................. 55customobjectvariables ........................................................... 55host_contactgroups ............................................................... 55host_parenthosts ................................................................... 55hostdependencies ................................................................. 55hostescalation_contactgroups ............................................... 55hostescalations ...................................................................... 55hostgroup_members ............................................................. 55hostgroups ............................................................................ 55hosts ...................................................................................... 55service_contactgroups .......................................................... 55servicedependencies ............................................................. 55serviceescalation_contactgroups .......................................... 55serviceescalations ................................................................. 55servicegroup_members ......................................................... 55servicegroups ........................................................................ 55services ................................................................................. 55timeperod_timeranges ........................................................... 55timeperiods ............................................................................ 55
Page 3 / 57 NDOUtils Database Model – www.nagios.org Copyright (c) 2006-2007 Ethan Galstad
Introduction
This documentation is still in flux, and there are undoubtably errors presents, so take everything you find here with a grain of salt. If you have suggestions, changes, etc. for the documentation, please let me know.
Table Names
The NDOUtils addon allows users to specify a custom prefix to each table name in the database. By default, this prefix is "nagios_". The tables documented here are listed without any prefix, so for example the "instances" table as referenced in this documentation may actuallybe called "nagios_instances" in the database.
Configuration Tables
I have not yet documented the tables that contain configuration data. A few changes are being made in the Nagios 3 code that will alter thetable structures, so I don't want to have to redo a ton of work updating the documentation. The configuration tables represent a read-only output view of the configuration that Nagios is using. Nagios doesn't read the tables to determine its configuration – the tables are just provided so you know how Nagios was last configured.
Page 4 / 57 NDOUtils Database Model – www.nagios.org Copyright (c) 2006-2007 Ethan Galstad

Central Tables
Page 5 / 57 NDOUtils Database Model – www.nagios.org Copyright (c) 2006-2007 Ethan Galstad
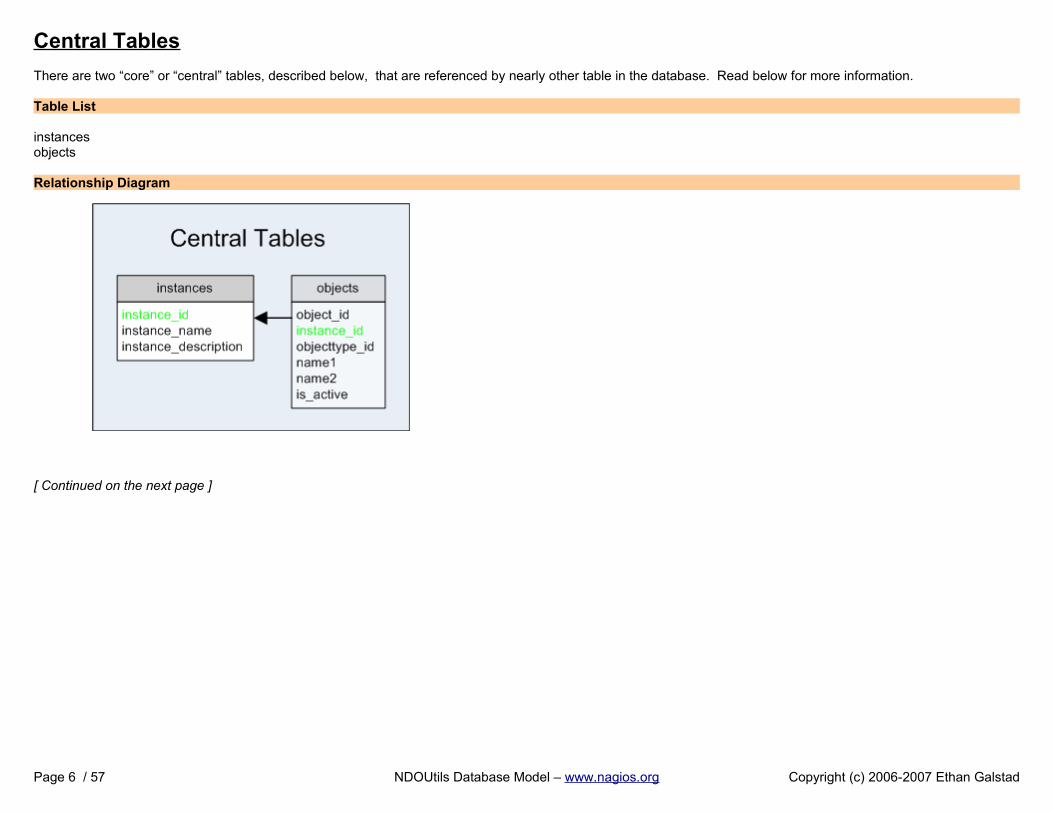
Central Tables
There are two “core” or “central” tables, described below, that are referenced by nearly other table in the database. Read below for more information.
Table List
instancesobjects
Relationship Diagram
[ Continued on the next page ]
Page 6 / 57 NDOUtils Database Model – www.nagios.org Copyright (c) 2006-2007 Ethan Galstad
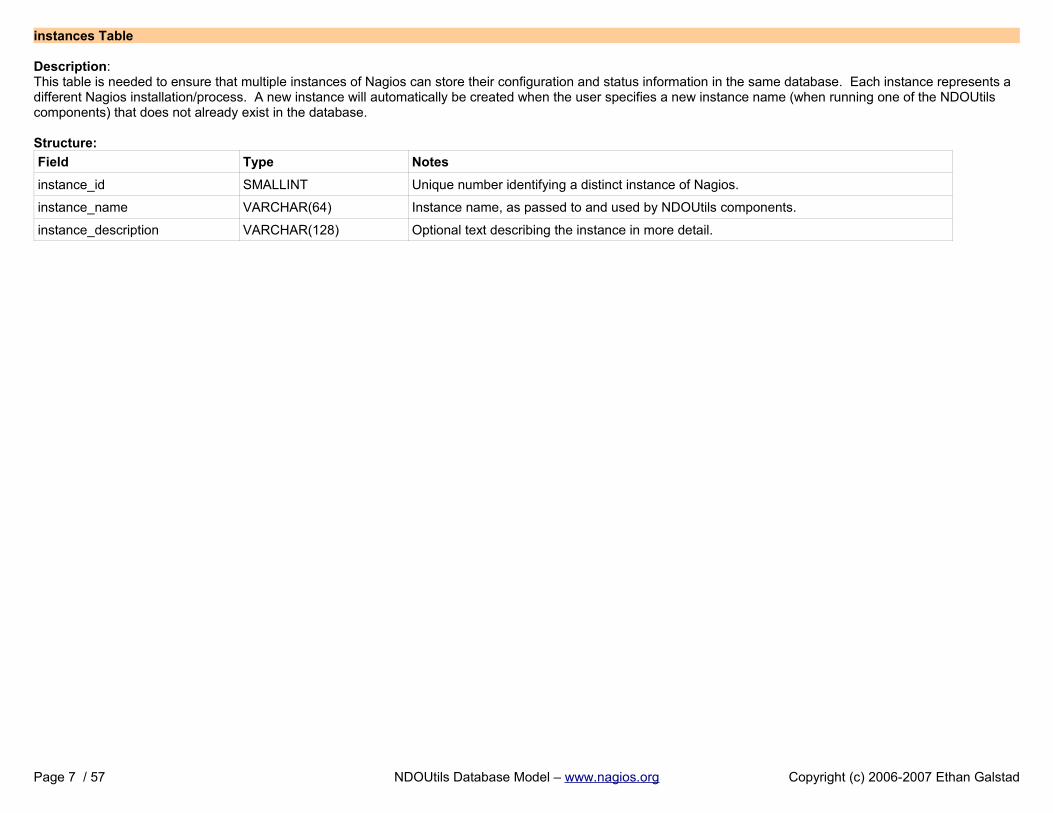
instances Table
Description:This table is needed to ensure that multiple instances of Nagios can store their configuration and status information in the same database. Each instance represents a different Nagios installation/process. A new instance will automatically be created when the user specifies a new instance name (when running one of the NDOUtils components) that does not already exist in the database.
Structure:
Field Type Notes
instance_id SMALLINT Unique number identifying a distinct instance of Nagios.
instance_name VARCHAR(64) Instance name, as passed to and used by NDOUtils components.
instance_description VARCHAR(128) Optional text describing the instance in more detail.
Page 7 / 57 NDOUtils Database Model – www.nagios.org Copyright (c) 2006-2007 Ethan Galstad

objects Table
Description:This table is used to store all current (and past) objects that are (and have been) defined in your Nagios configuration files. Why are the names of the objects stored in this table and not elsewhere? Well, when you delete an object definition from you Nagios configuration, that object will no longer appear in the object tables of the database. Since you're still going to want to be able to run reports for old hosts, service, etc., we store the name of the object here so you're not completely baffled by the reports you get. :-)
Structure:
Field Type Notes Values
object_id INT A unique number identifying the object.
instance_id SMALLINT A number indicating the instance of Nagios to which the object belongs.
objecttype_id SMALLINT A number indicating what type of object this is. 1 = Host2 = Service3 = Host group4 = Service group5 = Host escalation6 = Service escalation7 = Host dependency8 = Service dependency9 = Timeperiod10 = Contact11 = Contact group12 = Command13 = Extended host info (deprecated)14 = Extended service info (deprecated)
name1 VARCHAR(128) The first name associated with the object definition, as used in your Nagios configuration files.
name2 VARCHAR(128) The second name (if any) associated with the object definition, as used in your Nagios configuration files. This field is only used for service definitions which have a host name (name1 field) and service description (name2 field).
is_active SMALLINT A number indicating whether or not the object is currently defined in your Nagios configuration files. If an object definition is removed from your Nagiosconfiguration files, it will remain in this table, but will be marked as inactive.
0 = Inactive1 = Active
Relationships:
Field Foreign Key
instance_id instances.instance_id
Page 8 / 57 NDOUtils Database Model – www.nagios.org Copyright (c) 2006-2007 Ethan Galstad
Debugging Tables
Page 9 / 57 NDOUtils Database Model – www.nagios.org Copyright (c) 2006-2007 Ethan Galstad
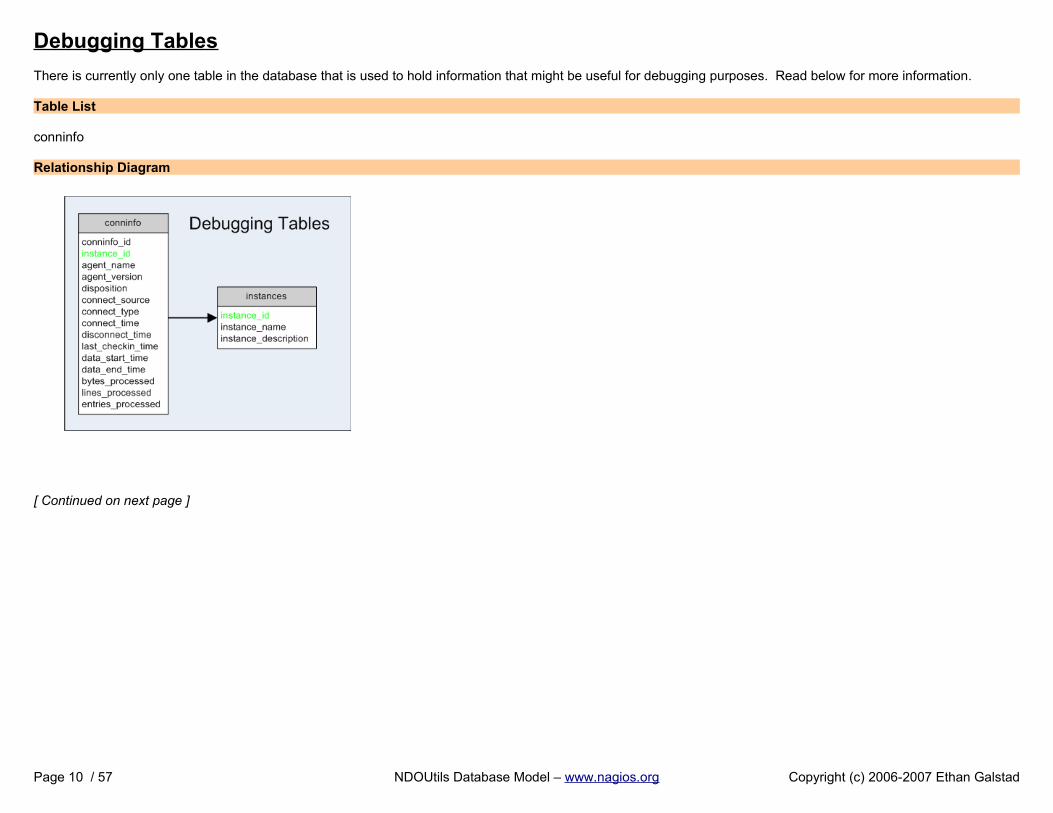
Debugging Tables
There is currently only one table in the database that is used to hold information that might be useful for debugging purposes. Read below for more information.
Table List
conninfo
Relationship Diagram
[ Continued on next page ]
Page 10 / 57 NDOUtils Database Model – www.nagios.org Copyright (c) 2006-2007 Ethan Galstad
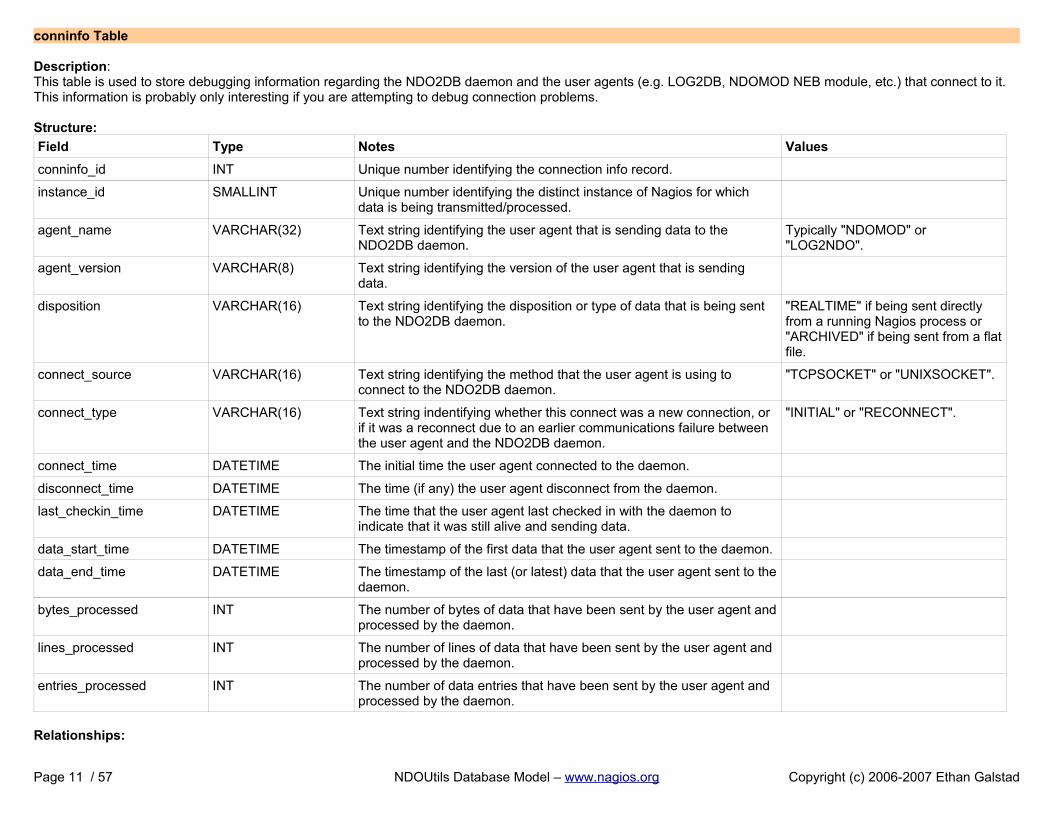
conninfo Table
Description:This table is used to store debugging information regarding the NDO2DB daemon and the user agents (e.g. LOG2DB, NDOMOD NEB module, etc.) that connect to it. This information is probably only interesting if you are attempting to debug connection problems.
Structure:
Field Type Notes Values
conninfo_id INT Unique number identifying the connection info record.
instance_id SMALLINT Unique number identifying the distinct instance of Nagios for which data is being transmitted/processed.
agent_name VARCHAR(32) Text string identifying the user agent that is sending data to the NDO2DB daemon.
Typically "NDOMOD" or "LOG2NDO".
agent_version VARCHAR(8) Text string identifying the version of the user agent that is sending data.
disposition VARCHAR(16) Text string identifying the disposition or type of data that is being sent to the NDO2DB daemon.
"REALTIME" if being sent directly from a running Nagios process or "ARCHIVED" if being sent from a flatfile.
connect_source VARCHAR(16) Text string identifying the method that the user agent is using to connect to the NDO2DB daemon.
"TCPSOCKET" or "UNIXSOCKET".
connect_type VARCHAR(16) Text string indentifying whether this connect was a new connection, or if it was a reconnect due to an earlier communications failure between the user agent and the NDO2DB daemon.
"INITIAL" or "RECONNECT".
connect_time DATETIME The initial time the user agent connected to the daemon.
disconnect_time DATETIME The time (if any) the user agent disconnect from the daemon.
last_checkin_time DATETIME The time that the user agent last checked in with the daemon to indicate that it was still alive and sending data.
data_start_time DATETIME The timestamp of the first data that the user agent sent to the daemon.
data_end_time DATETIME The timestamp of the last (or latest) data that the user agent sent to thedaemon.
bytes_processed INT The number of bytes of data that have been sent by the user agent andprocessed by the daemon.
lines_processed INT The number of lines of data that have been sent by the user agent and processed by the daemon.
entries_processed INT The number of data entries that have been sent by the user agent and processed by the daemon.
Relationships:
Page 11 / 57 NDOUtils Database Model – www.nagios.org Copyright (c) 2006-2007 Ethan Galstad

Field Foreign Key
instance_id instances.instance_id
Page 12 / 57 NDOUtils Database Model – www.nagios.org Copyright (c) 2006-2007 Ethan Galstad
Historical Data Tables
Page 13 / 57 NDOUtils Database Model – www.nagios.org Copyright (c) 2006-2007 Ethan Galstad
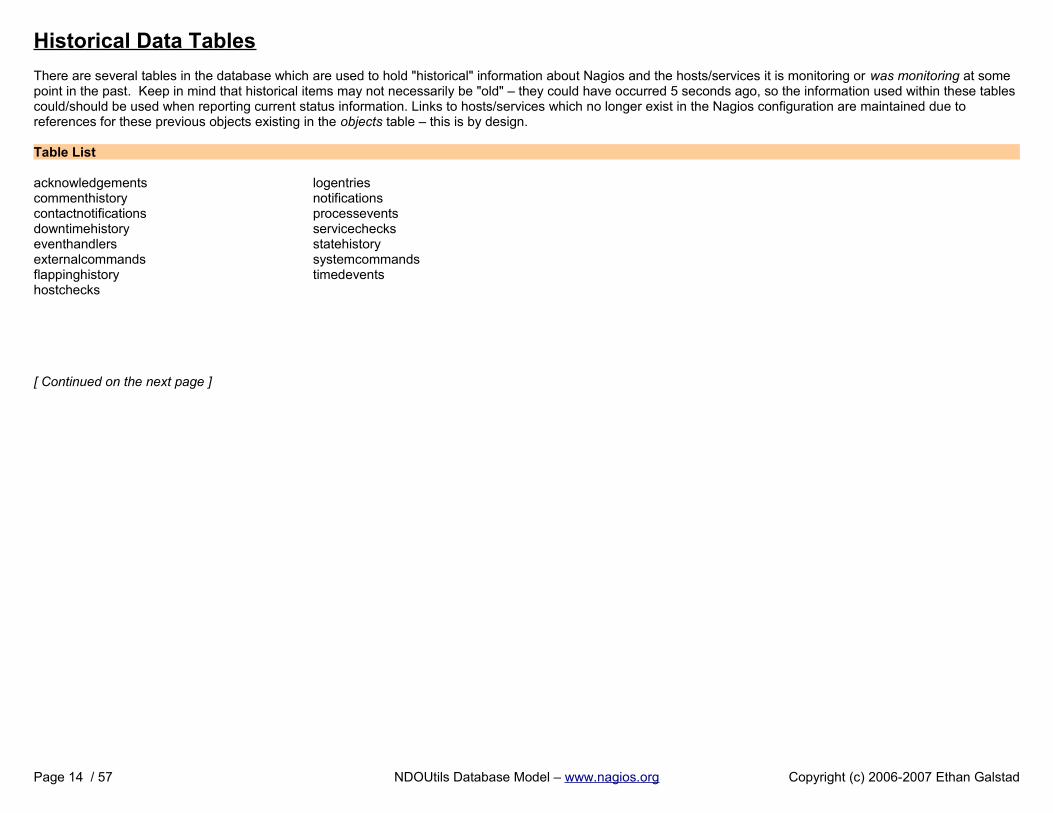
Historical Data Tables
There are several tables in the database which are used to hold "historical" information about Nagios and the hosts/services it is monitoring or was monitoring at some point in the past. Keep in mind that historical items may not necessarily be "old" – they could have occurred 5 seconds ago, so the information used within these tablescould/should be used when reporting current status information. Links to hosts/services which no longer exist in the Nagios configuration are maintained due to references for these previous objects existing in the objects table – this is by design.
Table List
acknowledgementscommenthistorycontactnotificationsdowntimehistoryeventhandlersexternalcommandsflappinghistoryhostchecks
logentriesnotificationsprocesseventsservicechecksstatehistorysystemcommandstimedevents
[ Continued on the next page ]
Page 14 / 57 NDOUtils Database Model – www.nagios.org Copyright (c) 2006-2007 Ethan Galstad

Relationship Diagram
Notes: For clarity, the instances table (to which all these tables are related) is not shown. There are 17 historical tables, so please excuse the mess. :-)
Page 15 / 57 NDOUtils Database Model – www.nagios.org Copyright (c) 2006-2007 Ethan Galstad

acknowledgements Table
Description:This table is used to store host and service acknowledgements for historical purposes.
Structure:
Field Type Notes Values
acknowledgement_id INT Unique number identifying the acknowledgement record.
instance_id SMALLINT Unique number identifying the distinct instance of Nagios which this entry is associated with.
entry_time DATETIME Date and time the acknowledgement was entered.
entry_time_usec INT Microsecond portion of acknowledgement entry time.
acknowledgement_type SMALLINT Indicates whether this is a host or service acknowledgement. 0 = Host ack1 = Service ack
object_id INT The object id of the host or service this acknowledgement applies to.
state SMALLINT Integer indicating the state the host or service was in when the acknowledgement was made.
Host acks0 = UP1 = DOWN2 = UNREACHABLE
Service acks0 = OK1 = WARNING2 = CRTICAL3 = UNKNOWN
author_name VARCHAR(64) Text field containing the name of the person who made the acknowledgement.
comment_data VARCHAR(255) Text field containing notes on the acknowledgement.
is_sticky SMALLINT Indicates whether or not the acknowledgement is considered "sticky".
0 = Not sticky1 = Sticky
persistent_comment SMALLINT Indicates whether or not the comment associated with the acknowledgement is persistent.
0 = Not persistent1 = Persistent
notify_contacts SMALLINT Indicates whether or not contacts are to be notified of the acknowledgement.
0 = Don't notify1 = Notify
Relationships:
Field Foreign Key
instance_id instances.instance_id
object_id objects.object_id
Page 16 / 57 NDOUtils Database Model – www.nagios.org Copyright (c) 2006-2007 Ethan Galstad
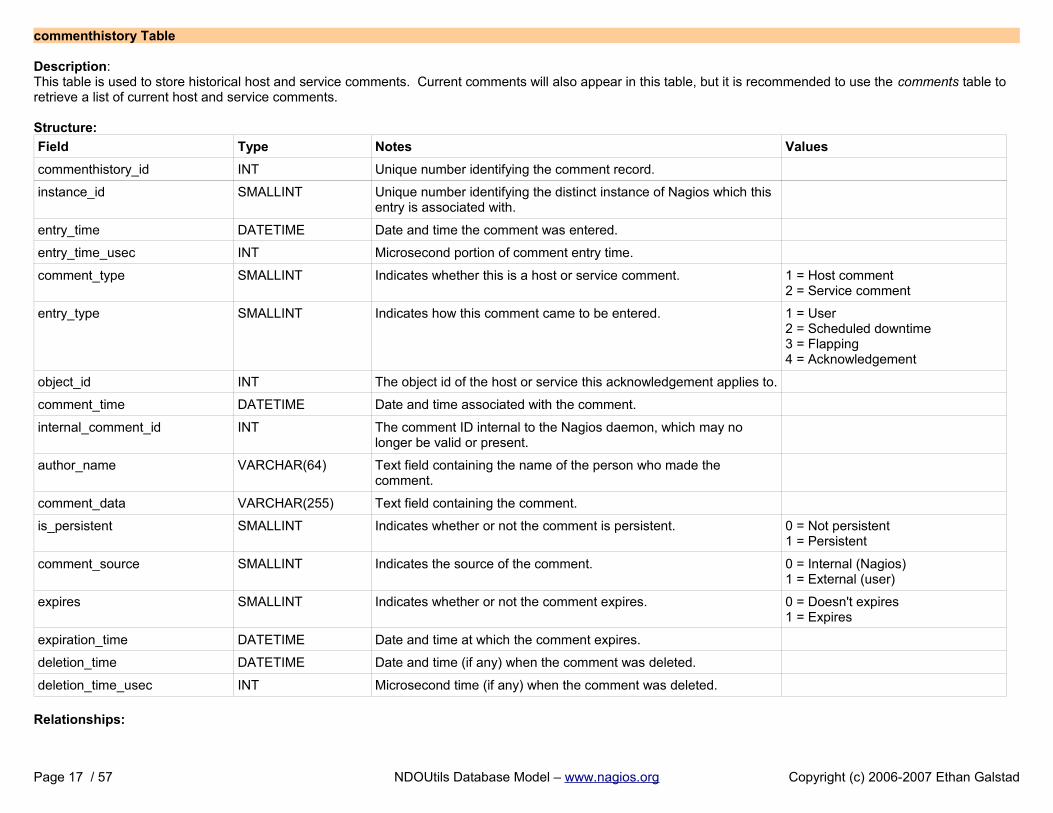
commenthistory Table
Description:This table is used to store historical host and service comments. Current comments will also appear in this table, but it is recommended to use the comments table to retrieve a list of current host and service comments.
Structure:
Field Type Notes Values
commenthistory_id INT Unique number identifying the comment record.
instance_id SMALLINT Unique number identifying the distinct instance of Nagios which this entry is associated with.
entry_time DATETIME Date and time the comment was entered.
entry_time_usec INT Microsecond portion of comment entry time.
comment_type SMALLINT Indicates whether this is a host or service comment. 1 = Host comment2 = Service comment
entry_type SMALLINT Indicates how this comment came to be entered. 1 = User2 = Scheduled downtime3 = Flapping4 = Acknowledgement
object_id INT The object id of the host or service this acknowledgement applies to.
comment_time DATETIME Date and time associated with the comment.
internal_comment_id INT The comment ID internal to the Nagios daemon, which may no longer be valid or present.
author_name VARCHAR(64) Text field containing the name of the person who made the comment.
comment_data VARCHAR(255) Text field containing the comment.
is_persistent SMALLINT Indicates whether or not the comment is persistent. 0 = Not persistent1 = Persistent
comment_source SMALLINT Indicates the source of the comment. 0 = Internal (Nagios)1 = External (user)
expires SMALLINT Indicates whether or not the comment expires. 0 = Doesn't expires1 = Expires
expiration_time DATETIME Date and time at which the comment expires.
deletion_time DATETIME Date and time (if any) when the comment was deleted.
deletion_time_usec INT Microsecond time (if any) when the comment was deleted.
Relationships:
Page 17 / 57 NDOUtils Database Model – www.nagios.org Copyright (c) 2006-2007 Ethan Galstad
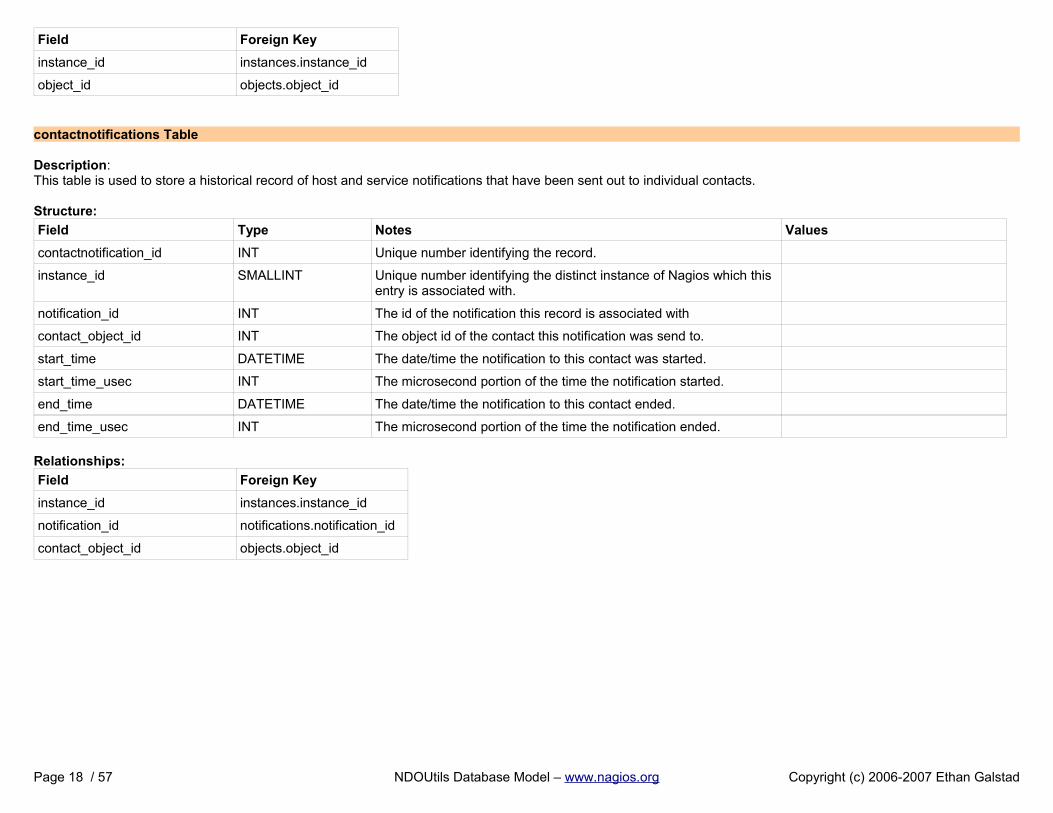
Field Foreign Key
instance_id instances.instance_id
object_id objects.object_id
contactnotifications Table
Description:This table is used to store a historical record of host and service notifications that have been sent out to individual contacts.
Structure:
Field Type Notes Values
contactnotification_id INT Unique number identifying the record.
instance_id SMALLINT Unique number identifying the distinct instance of Nagios which this entry is associated with.
notification_id INT The id of the notification this record is associated with
contact_object_id INT The object id of the contact this notification was send to.
start_time DATETIME The date/time the notification to this contact was started.
start_time_usec INT The microsecond portion of the time the notification started.
end_time DATETIME The date/time the notification to this contact ended.
end_time_usec INT The microsecond portion of the time the notification ended.
Relationships:
Field Foreign Key
instance_id instances.instance_id
notification_id notifications.notification_id
contact_object_id objects.object_id
Page 18 / 57 NDOUtils Database Model – www.nagios.org Copyright (c) 2006-2007 Ethan Galstad
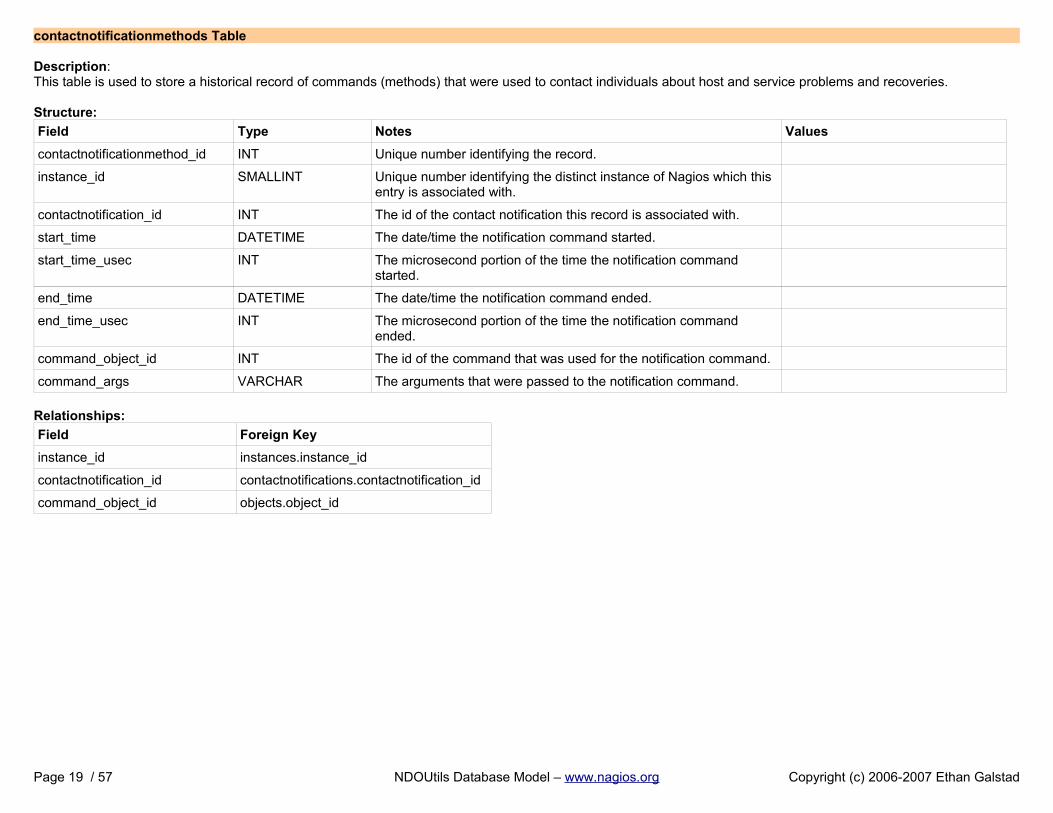
contactnotificationmethods Table
Description:This table is used to store a historical record of commands (methods) that were used to contact individuals about host and service problems and recoveries.
Structure:
Field Type Notes Values
contactnotificationmethod_id INT Unique number identifying the record.
instance_id SMALLINT Unique number identifying the distinct instance of Nagios which this entry is associated with.
contactnotification_id INT The id of the contact notification this record is associated with.
start_time DATETIME The date/time the notification command started.
start_time_usec INT The microsecond portion of the time the notification command started.
end_time DATETIME The date/time the notification command ended.
end_time_usec INT The microsecond portion of the time the notification command ended.
command_object_id INT The id of the command that was used for the notification command.
command_args VARCHAR The arguments that were passed to the notification command.
Relationships:
Field Foreign Key
instance_id instances.instance_id
contactnotification_id contactnotifications.contactnotification_id
command_object_id objects.object_id
Page 19 / 57 NDOUtils Database Model – www.nagios.org Copyright (c) 2006-2007 Ethan Galstad
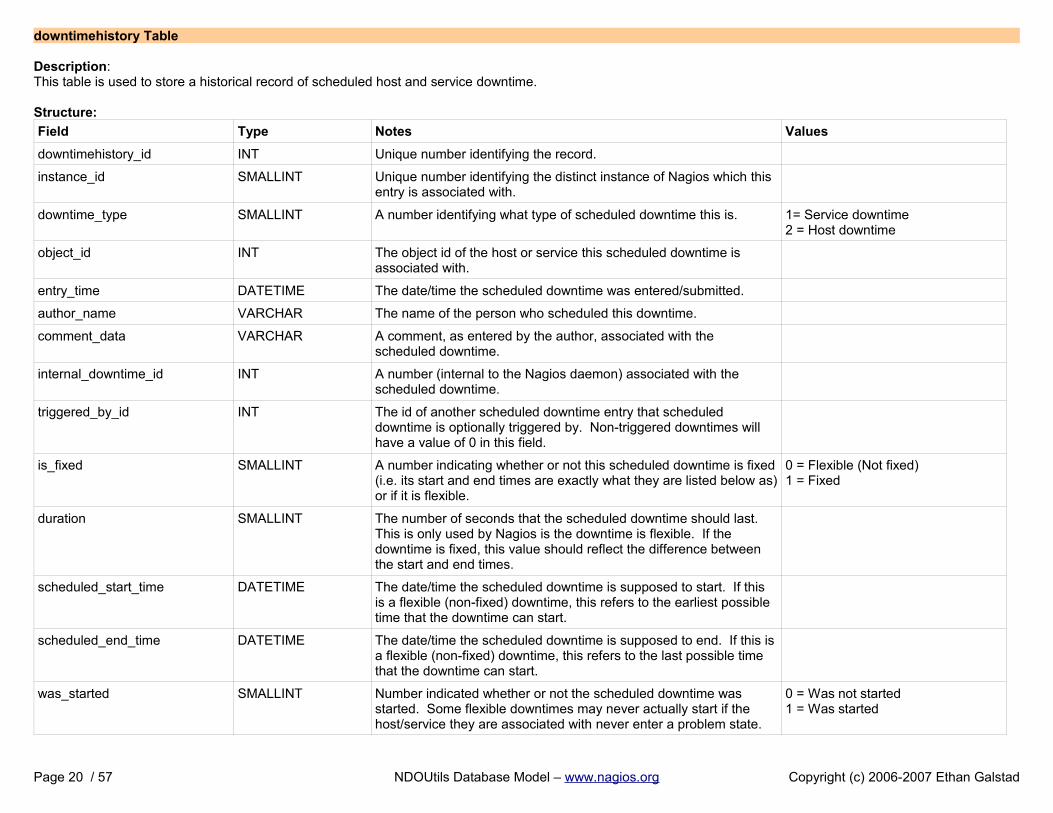
downtimehistory Table
Description:This table is used to store a historical record of scheduled host and service downtime.
Structure:
Field Type Notes Values
downtimehistory_id INT Unique number identifying the record.
instance_id SMALLINT Unique number identifying the distinct instance of Nagios which this entry is associated with.
downtime_type SMALLINT A number identifying what type of scheduled downtime this is. 1= Service downtime2 = Host downtime
object_id INT The object id of the host or service this scheduled downtime is associated with.
entry_time DATETIME The date/time the scheduled downtime was entered/submitted.
author_name VARCHAR The name of the person who scheduled this downtime.
comment_data VARCHAR A comment, as entered by the author, associated with the scheduled downtime.
internal_downtime_id INT A number (internal to the Nagios daemon) associated with the scheduled downtime.
triggered_by_id INT The id of another scheduled downtime entry that scheduled downtime is optionally triggered by. Non-triggered downtimes will have a value of 0 in this field.
is_fixed SMALLINT A number indicating whether or not this scheduled downtime is fixed(i.e. its start and end times are exactly what they are listed below as)or if it is flexible.
0 = Flexible (Not fixed)1 = Fixed
duration SMALLINT The number of seconds that the scheduled downtime should last. This is only used by Nagios is the downtime is flexible. If the downtime is fixed, this value should reflect the difference between the start and end times.
scheduled_start_time DATETIME The date/time the scheduled downtime is supposed to start. If this is a flexible (non-fixed) downtime, this refers to the earliest possible time that the downtime can start.
scheduled_end_time DATETIME The date/time the scheduled downtime is supposed to end. If this isa flexible (non-fixed) downtime, this refers to the last possible time that the downtime can start.
was_started SMALLINT Number indicated whether or not the scheduled downtime was started. Some flexible downtimes may never actually start if the host/service they are associated with never enter a problem state.
0 = Was not started1 = Was started
Page 20 / 57 NDOUtils Database Model – www.nagios.org Copyright (c) 2006-2007 Ethan Galstad
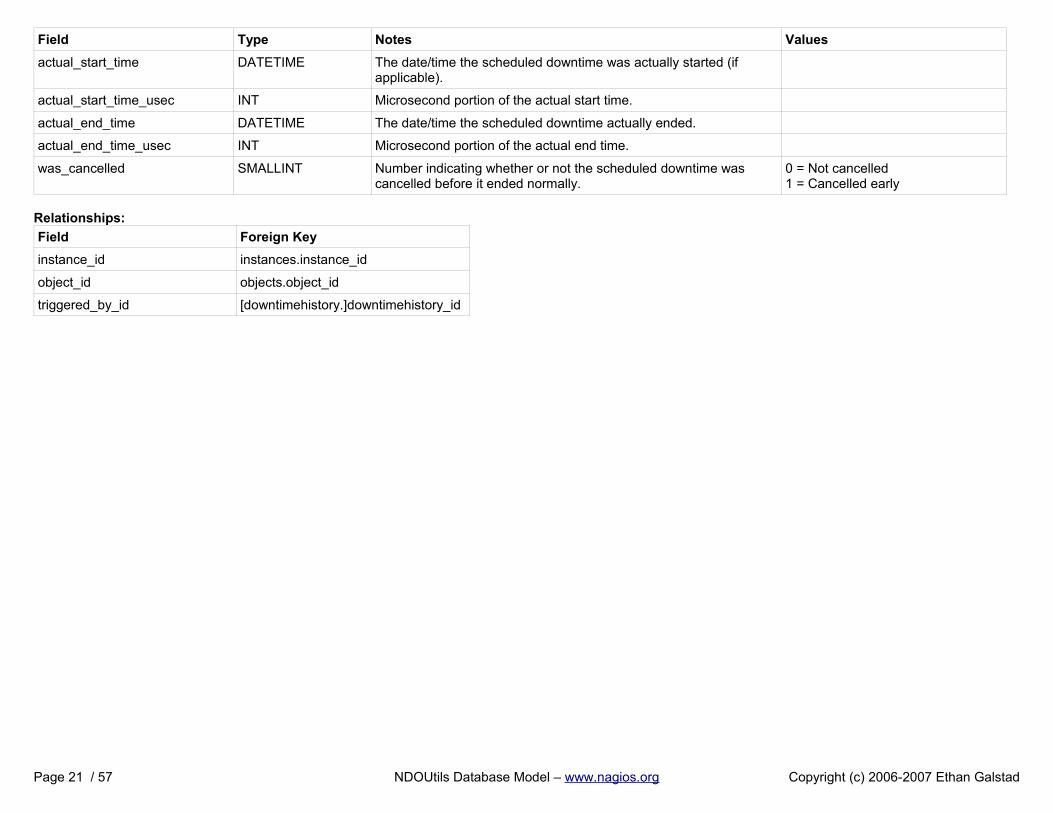
Field Type Notes Values
actual_start_time DATETIME The date/time the scheduled downtime was actually started (if applicable).
actual_start_time_usec INT Microsecond portion of the actual start time.
actual_end_time DATETIME The date/time the scheduled downtime actually ended.
actual_end_time_usec INT Microsecond portion of the actual end time.
was_cancelled SMALLINT Number indicating whether or not the scheduled downtime was cancelled before it ended normally.
0 = Not cancelled1 = Cancelled early
Relationships:
Field Foreign Key
instance_id instances.instance_id
object_id objects.object_id
triggered_by_id [downtimehistory.]downtimehistory_id
Page 21 / 57 NDOUtils Database Model – www.nagios.org Copyright (c) 2006-2007 Ethan Galstad
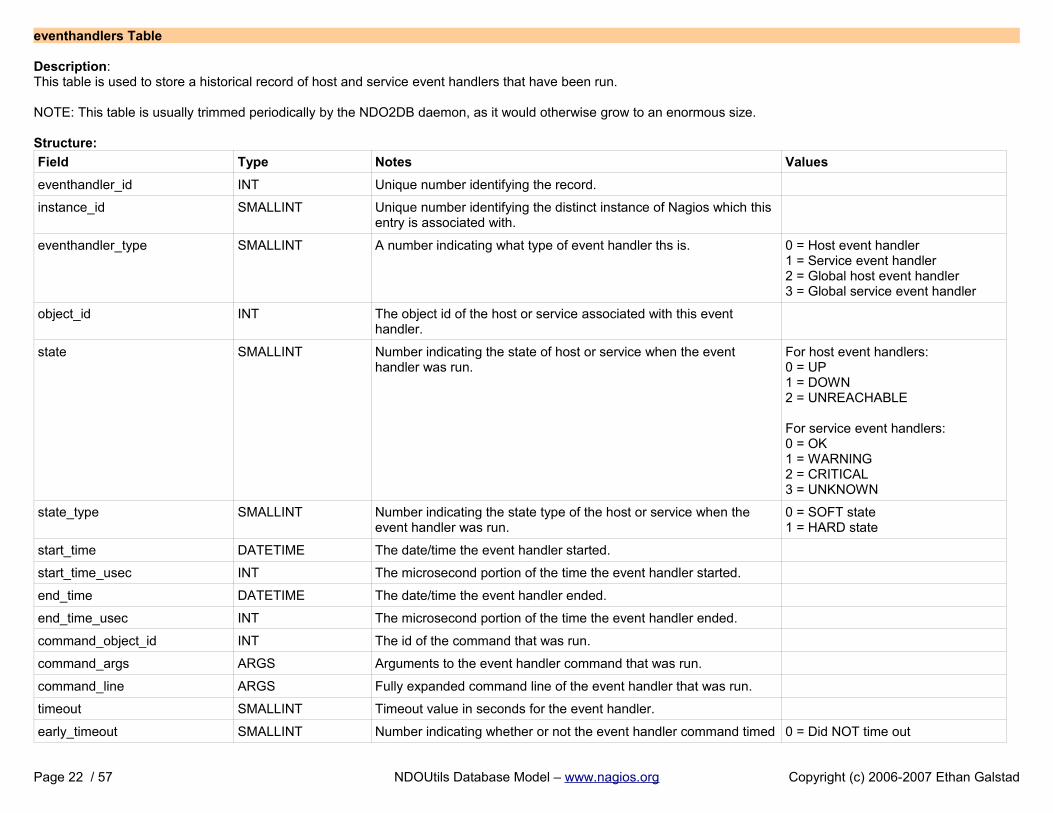
eventhandlers Table
Description:This table is used to store a historical record of host and service event handlers that have been run.
NOTE: This table is usually trimmed periodically by the NDO2DB daemon, as it would otherwise grow to an enormous size.
Structure:
Field Type Notes Values
eventhandler_id INT Unique number identifying the record.
instance_id SMALLINT Unique number identifying the distinct instance of Nagios which this entry is associated with.
eventhandler_type SMALLINT A number indicating what type of event handler ths is. 0 = Host event handler1 = Service event handler2 = Global host event handler3 = Global service event handler
object_id INT The object id of the host or service associated with this event handler.
state SMALLINT Number indicating the state of host or service when the event handler was run.
For host event handlers:0 = UP1 = DOWN2 = UNREACHABLE
For service event handlers:0 = OK1 = WARNING2 = CRITICAL3 = UNKNOWN
state_type SMALLINT Number indicating the state type of the host or service when the event handler was run.
0 = SOFT state1 = HARD state
start_time DATETIME The date/time the event handler started.
start_time_usec INT The microsecond portion of the time the event handler started.
end_time DATETIME The date/time the event handler ended.
end_time_usec INT The microsecond portion of the time the event handler ended.
command_object_id INT The id of the command that was run.
command_args ARGS Arguments to the event handler command that was run.
command_line ARGS Fully expanded command line of the event handler that was run.
timeout SMALLINT Timeout value in seconds for the event handler.
early_timeout SMALLINT Number indicating whether or not the event handler command timed 0 = Did NOT time out
Page 22 / 57 NDOUtils Database Model – www.nagios.org Copyright (c) 2006-2007 Ethan Galstad
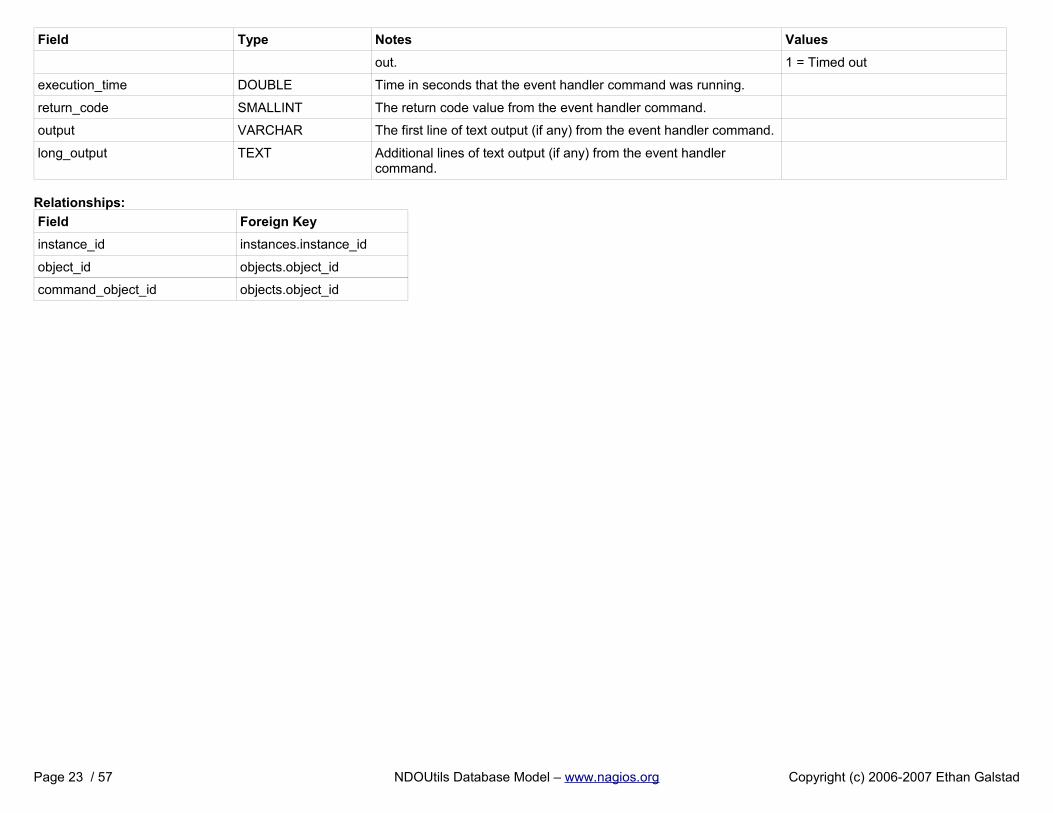
Field Type Notes Values
out. 1 = Timed out
execution_time DOUBLE Time in seconds that the event handler command was running.
return_code SMALLINT The return code value from the event handler command.
output VARCHAR The first line of text output (if any) from the event handler command.
long_output TEXT Additional lines of text output (if any) from the event handler command.
Relationships:
Field Foreign Key
instance_id instances.instance_id
object_id objects.object_id
command_object_id objects.object_id
Page 23 / 57 NDOUtils Database Model – www.nagios.org Copyright (c) 2006-2007 Ethan Galstad
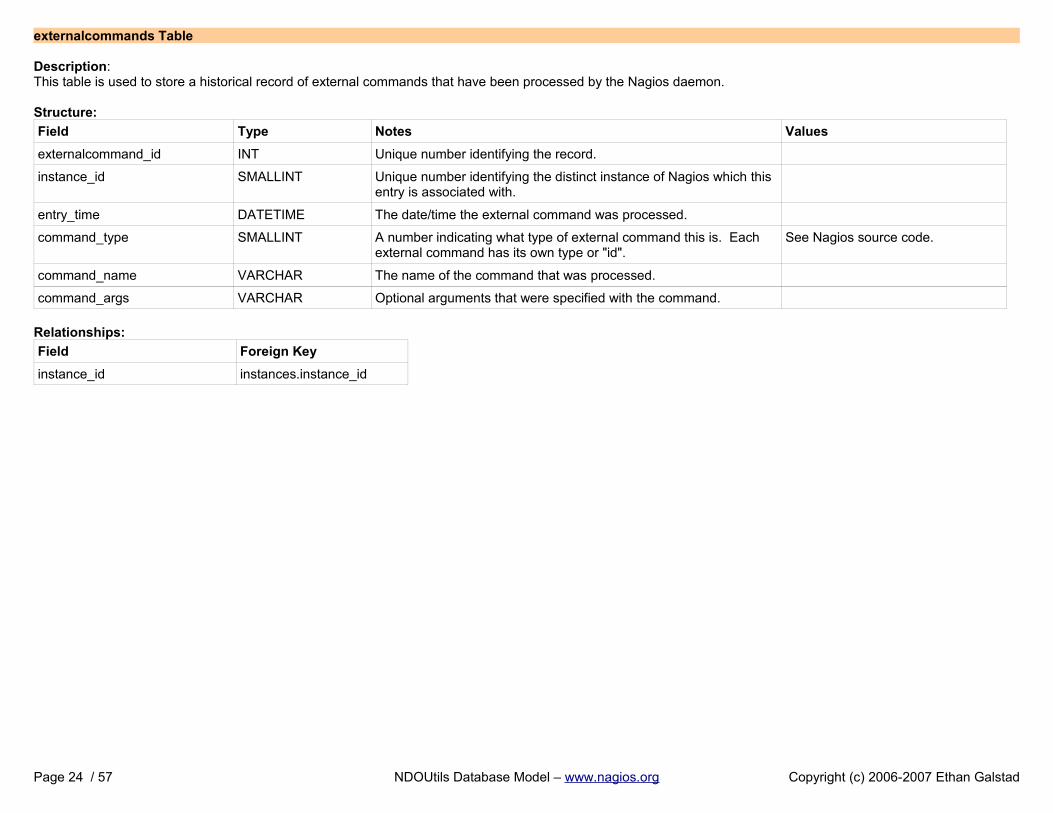
externalcommands Table
Description:This table is used to store a historical record of external commands that have been processed by the Nagios daemon.
Structure:
Field Type Notes Values
externalcommand_id INT Unique number identifying the record.
instance_id SMALLINT Unique number identifying the distinct instance of Nagios which this entry is associated with.
entry_time DATETIME The date/time the external command was processed.
command_type SMALLINT A number indicating what type of external command this is. Each external command has its own type or "id".
See Nagios source code.
command_name VARCHAR The name of the command that was processed.
command_args VARCHAR Optional arguments that were specified with the command.
Relationships:
Field Foreign Key
instance_id instances.instance_id
Page 24 / 57 NDOUtils Database Model – www.nagios.org Copyright (c) 2006-2007 Ethan Galstad
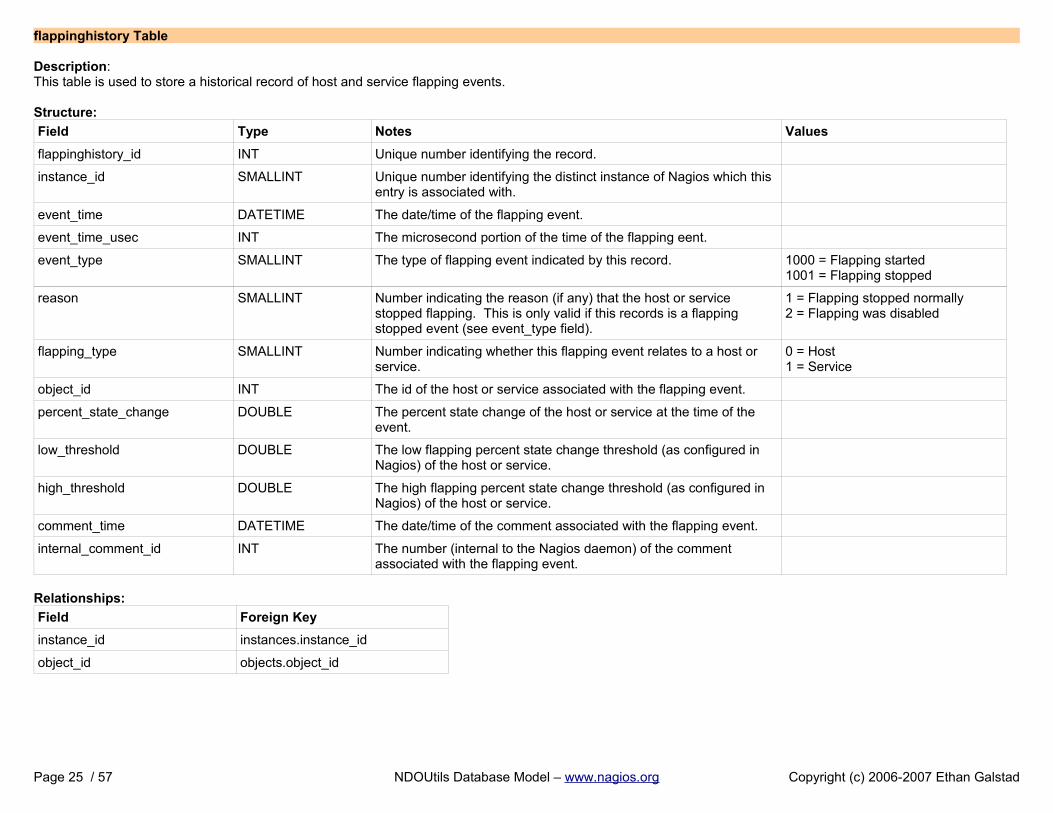
flappinghistory Table
Description:This table is used to store a historical record of host and service flapping events.
Structure:
Field Type Notes Values
flappinghistory_id INT Unique number identifying the record.
instance_id SMALLINT Unique number identifying the distinct instance of Nagios which this entry is associated with.
event_time DATETIME The date/time of the flapping event.
event_time_usec INT The microsecond portion of the time of the flapping eent.
event_type SMALLINT The type of flapping event indicated by this record. 1000 = Flapping started1001 = Flapping stopped
reason SMALLINT Number indicating the reason (if any) that the host or service stopped flapping. This is only valid if this records is a flapping stopped event (see event_type field).
1 = Flapping stopped normally2 = Flapping was disabled
flapping_type SMALLINT Number indicating whether this flapping event relates to a host or service.
0 = Host1 = Service
object_id INT The id of the host or service associated with the flapping event.
percent_state_change DOUBLE The percent state change of the host or service at the time of the event.
low_threshold DOUBLE The low flapping percent state change threshold (as configured in Nagios) of the host or service.
high_threshold DOUBLE The high flapping percent state change threshold (as configured in Nagios) of the host or service.
comment_time DATETIME The date/time of the comment associated with the flapping event.
internal_comment_id INT The number (internal to the Nagios daemon) of the comment associated with the flapping event.
Relationships:
Field Foreign Key
instance_id instances.instance_id
object_id objects.object_id
Page 25 / 57 NDOUtils Database Model – www.nagios.org Copyright (c) 2006-2007 Ethan Galstad
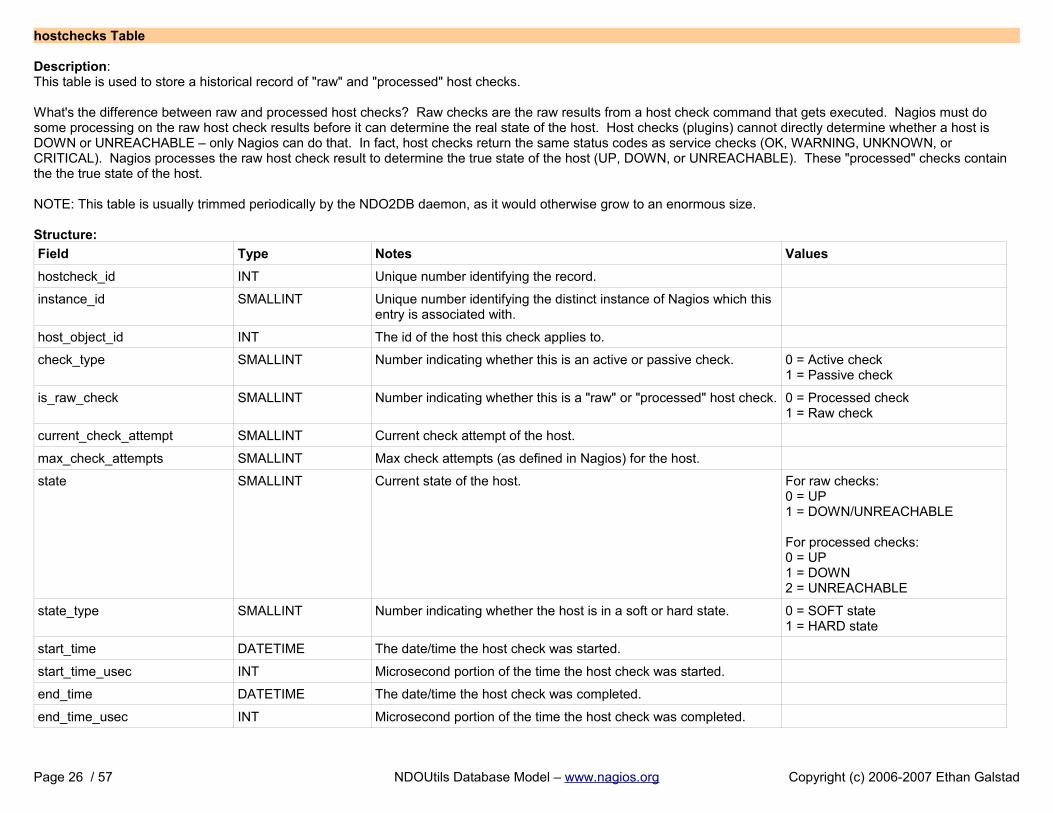
hostchecks Table
Description:This table is used to store a historical record of "raw" and "processed" host checks.
What's the difference between raw and processed host checks? Raw checks are the raw results from a host check command that gets executed. Nagios must do some processing on the raw host check results before it can determine the real state of the host. Host checks (plugins) cannot directly determine whether a host is DOWN or UNREACHABLE – only Nagios can do that. In fact, host checks return the same status codes as service checks (OK, WARNING, UNKNOWN, or CRITICAL). Nagios processes the raw host check result to determine the true state of the host (UP, DOWN, or UNREACHABLE). These "processed" checks contain the the true state of the host.
NOTE: This table is usually trimmed periodically by the NDO2DB daemon, as it would otherwise grow to an enormous size.
Structure:
Field Type Notes Values
hostcheck_id INT Unique number identifying the record.
instance_id SMALLINT Unique number identifying the distinct instance of Nagios which this entry is associated with.
host_object_id INT The id of the host this check applies to.
check_type SMALLINT Number indicating whether this is an active or passive check. 0 = Active check1 = Passive check
is_raw_check SMALLINT Number indicating whether this is a "raw" or "processed" host check. 0 = Processed check1 = Raw check
current_check_attempt SMALLINT Current check attempt of the host.
max_check_attempts SMALLINT Max check attempts (as defined in Nagios) for the host.
state SMALLINT Current state of the host. For raw checks:0 = UP1 = DOWN/UNREACHABLE
For processed checks:0 = UP1 = DOWN2 = UNREACHABLE
state_type SMALLINT Number indicating whether the host is in a soft or hard state. 0 = SOFT state1 = HARD state
start_time DATETIME The date/time the host check was started.
start_time_usec INT Microsecond portion of the time the host check was started.
end_time DATETIME The date/time the host check was completed.
end_time_usec INT Microsecond portion of the time the host check was completed.
Page 26 / 57 NDOUtils Database Model – www.nagios.org Copyright (c) 2006-2007 Ethan Galstad
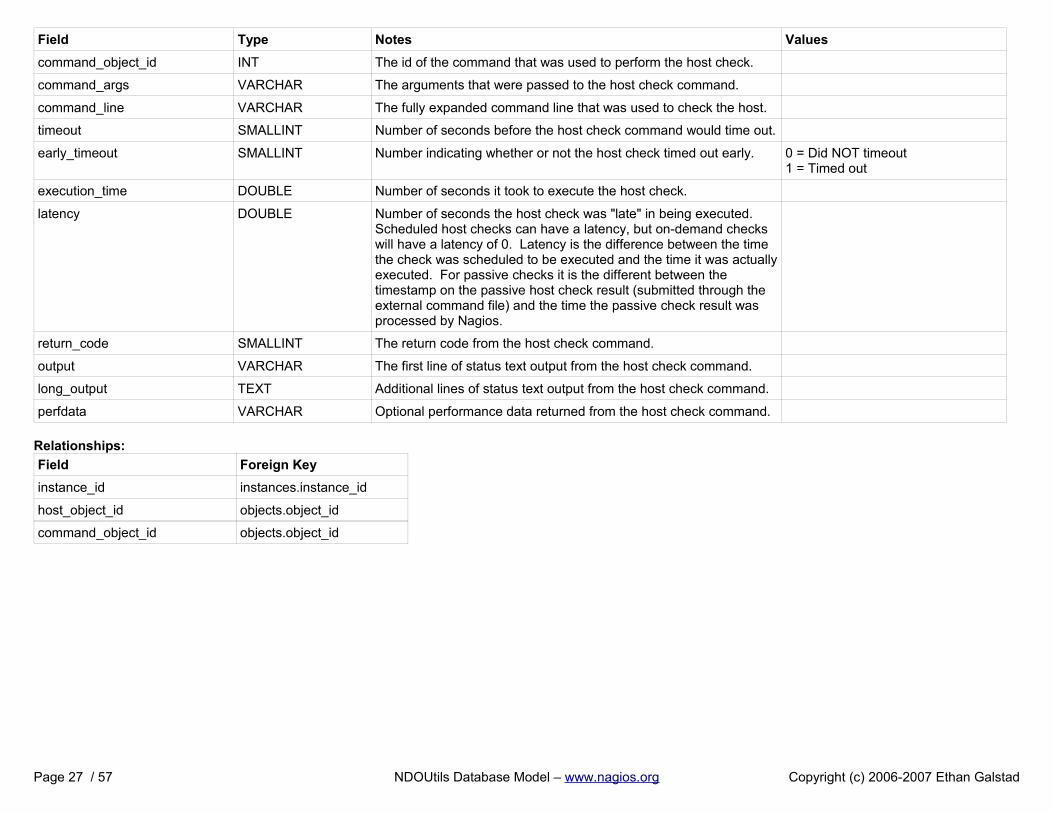
Field Type Notes Values
command_object_id INT The id of the command that was used to perform the host check.
command_args VARCHAR The arguments that were passed to the host check command.
command_line VARCHAR The fully expanded command line that was used to check the host.
timeout SMALLINT Number of seconds before the host check command would time out.
early_timeout SMALLINT Number indicating whether or not the host check timed out early. 0 = Did NOT timeout1 = Timed out
execution_time DOUBLE Number of seconds it took to execute the host check.
latency DOUBLE Number of seconds the host check was "late" in being executed. Scheduled host checks can have a latency, but on-demand checks will have a latency of 0. Latency is the difference between the time the check was scheduled to be executed and the time it was actuallyexecuted. For passive checks it is the different between the timestamp on the passive host check result (submitted through the external command file) and the time the passive check result was processed by Nagios.
return_code SMALLINT The return code from the host check command.
output VARCHAR The first line of status text output from the host check command.
long_output TEXT Additional lines of status text output from the host check command.
perfdata VARCHAR Optional performance data returned from the host check command.
Relationships:
Field Foreign Key
instance_id instances.instance_id
host_object_id objects.object_id
command_object_id objects.object_id
Page 27 / 57 NDOUtils Database Model – www.nagios.org Copyright (c) 2006-2007 Ethan Galstad
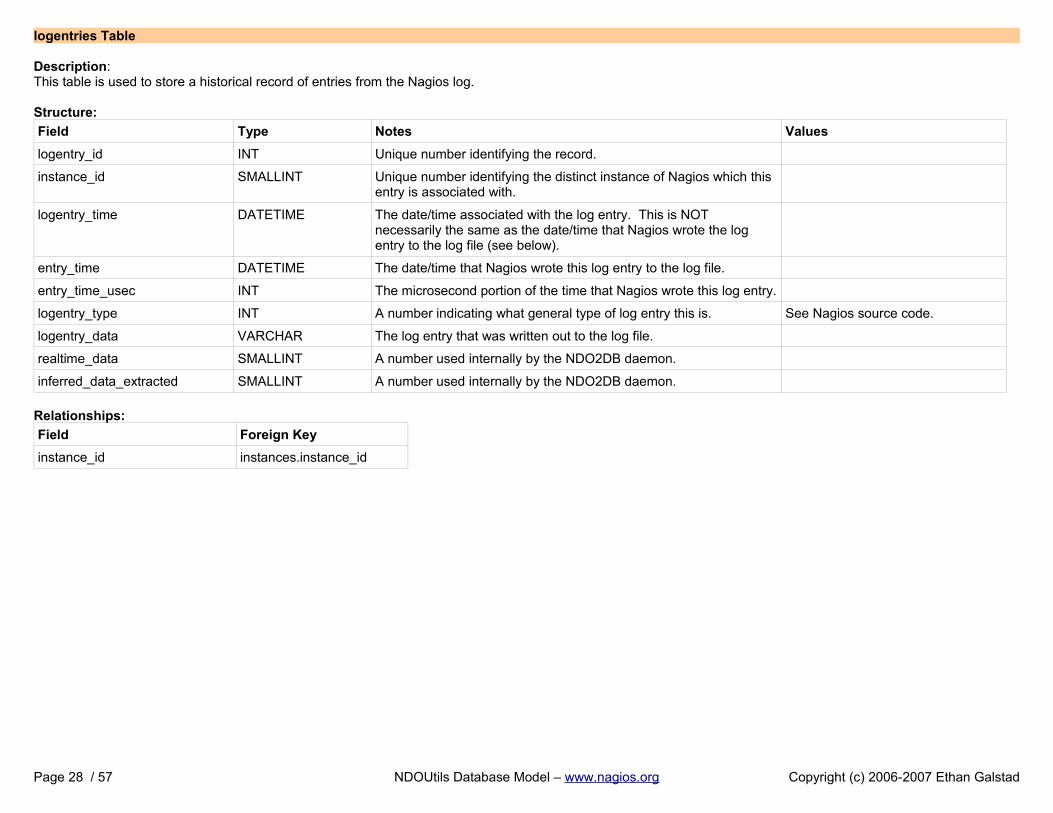
logentries Table
Description:This table is used to store a historical record of entries from the Nagios log.
Structure:
Field Type Notes Values
logentry_id INT Unique number identifying the record.
instance_id SMALLINT Unique number identifying the distinct instance of Nagios which this entry is associated with.
logentry_time DATETIME The date/time associated with the log entry. This is NOT necessarily the same as the date/time that Nagios wrote the log entry to the log file (see below).
entry_time DATETIME The date/time that Nagios wrote this log entry to the log file.
entry_time_usec INT The microsecond portion of the time that Nagios wrote this log entry.
logentry_type INT A number indicating what general type of log entry this is. See Nagios source code.
logentry_data VARCHAR The log entry that was written out to the log file.
realtime_data SMALLINT A number used internally by the NDO2DB daemon.
inferred_data_extracted SMALLINT A number used internally by the NDO2DB daemon.
Relationships:
Field Foreign Key
instance_id instances.instance_id
Page 28 / 57 NDOUtils Database Model – www.nagios.org Copyright (c) 2006-2007 Ethan Galstad
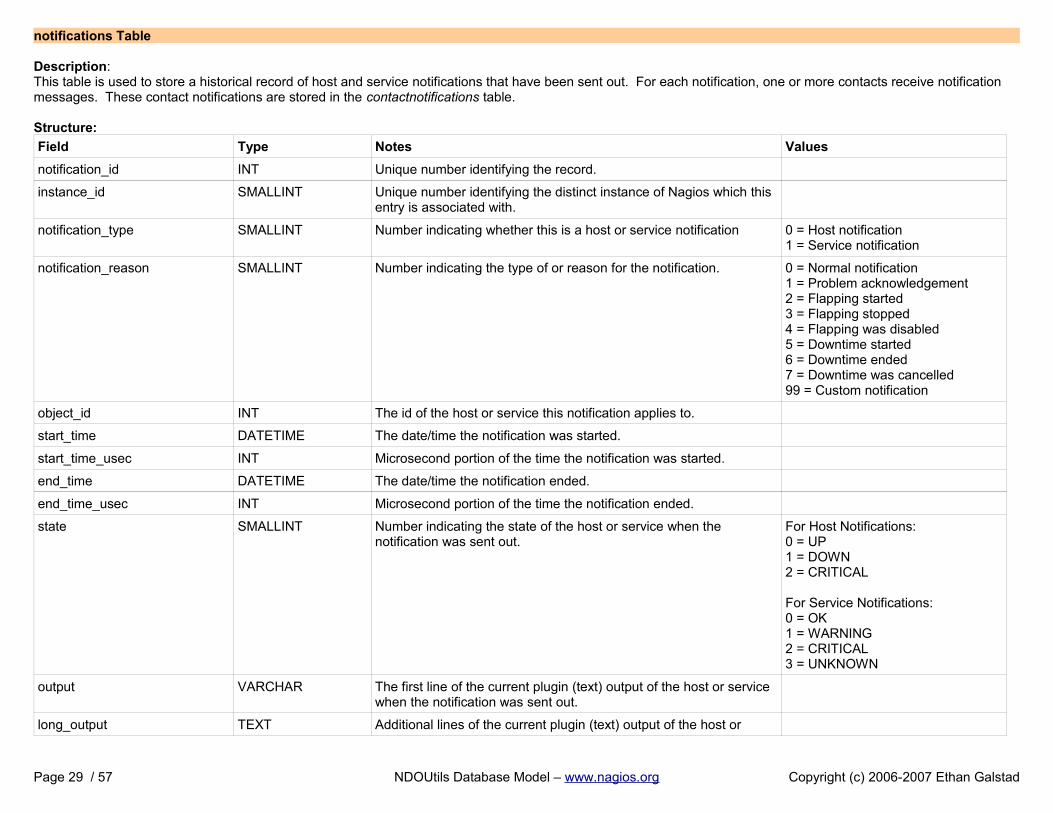
notifications Table
Description:This table is used to store a historical record of host and service notifications that have been sent out. For each notification, one or more contacts receive notification messages. These contact notifications are stored in the contactnotifications table.
Structure:
Field Type Notes Values
notification_id INT Unique number identifying the record.
instance_id SMALLINT Unique number identifying the distinct instance of Nagios which this entry is associated with.
notification_type SMALLINT Number indicating whether this is a host or service notification 0 = Host notification1 = Service notification
notification_reason SMALLINT Number indicating the type of or reason for the notification. 0 = Normal notification1 = Problem acknowledgement2 = Flapping started3 = Flapping stopped4 = Flapping was disabled5 = Downtime started6 = Downtime ended7 = Downtime was cancelled99 = Custom notification
object_id INT The id of the host or service this notification applies to.
start_time DATETIME The date/time the notification was started.
start_time_usec INT Microsecond portion of the time the notification was started.
end_time DATETIME The date/time the notification ended.
end_time_usec INT Microsecond portion of the time the notification ended.
state SMALLINT Number indicating the state of the host or service when the notification was sent out.
For Host Notifications:0 = UP1 = DOWN2 = CRITICAL
For Service Notifications:0 = OK1 = WARNING2 = CRITICAL3 = UNKNOWN
output VARCHAR The first line of the current plugin (text) output of the host or service when the notification was sent out.
long_output TEXT Additional lines of the current plugin (text) output of the host or
Page 29 / 57 NDOUtils Database Model – www.nagios.org Copyright (c) 2006-2007 Ethan Galstad

Field Type Notes Values
service when the notification was sent out.
escalated SMALLINT Number indicating whether or not this notification was escalated or not.
0 = NOT escalated1 = Escalated
contacts_notifified SMALLINT Number of contacts that were notified about the host or service as part of this notification.
Relationships:
Field Foreign Key
instance_id instances.instance_id
object_id objects.object_id
Page 30 / 57 NDOUtils Database Model – www.nagios.org Copyright (c) 2006-2007 Ethan Galstad
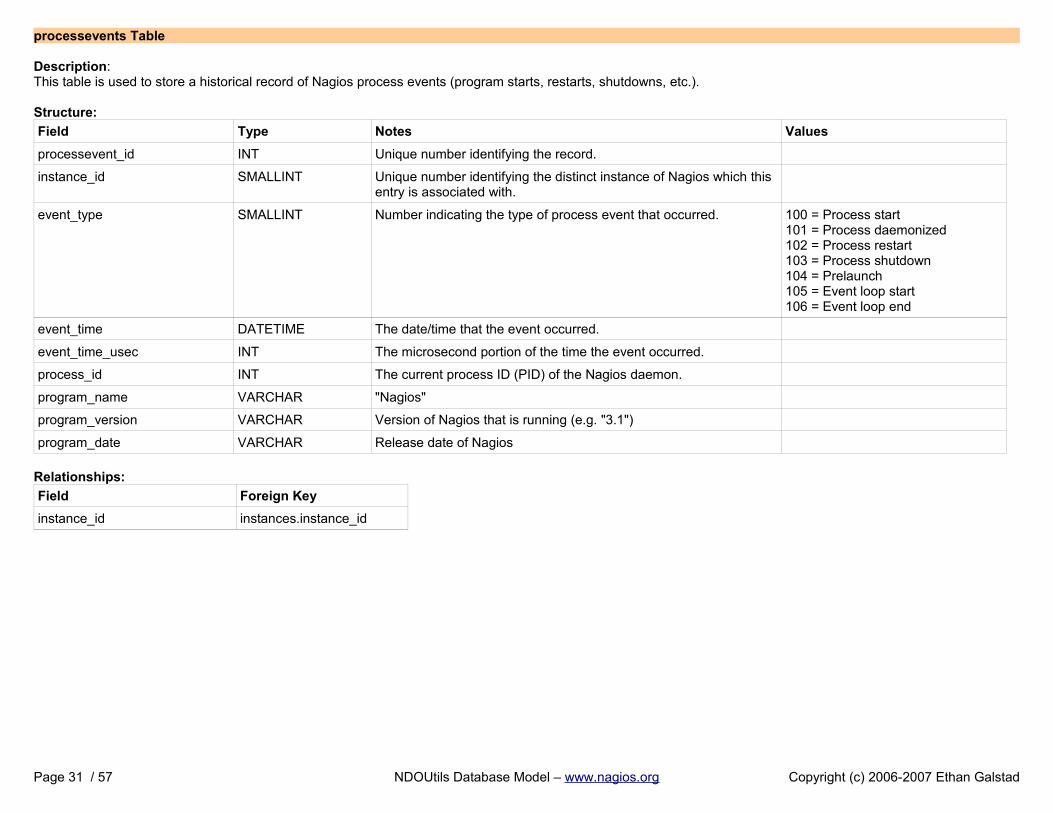
processevents Table
Description:This table is used to store a historical record of Nagios process events (program starts, restarts, shutdowns, etc.).
Structure:
Field Type Notes Values
processevent_id INT Unique number identifying the record.
instance_id SMALLINT Unique number identifying the distinct instance of Nagios which this entry is associated with.
event_type SMALLINT Number indicating the type of process event that occurred. 100 = Process start101 = Process daemonized102 = Process restart103 = Process shutdown104 = Prelaunch105 = Event loop start106 = Event loop end
event_time DATETIME The date/time that the event occurred.
event_time_usec INT The microsecond portion of the time the event occurred.
process_id INT The current process ID (PID) of the Nagios daemon.
program_name VARCHAR "Nagios"
program_version VARCHAR Version of Nagios that is running (e.g. "3.1")
program_date VARCHAR Release date of Nagios
Relationships:
Field Foreign Key
instance_id instances.instance_id
Page 31 / 57 NDOUtils Database Model – www.nagios.org Copyright (c) 2006-2007 Ethan Galstad
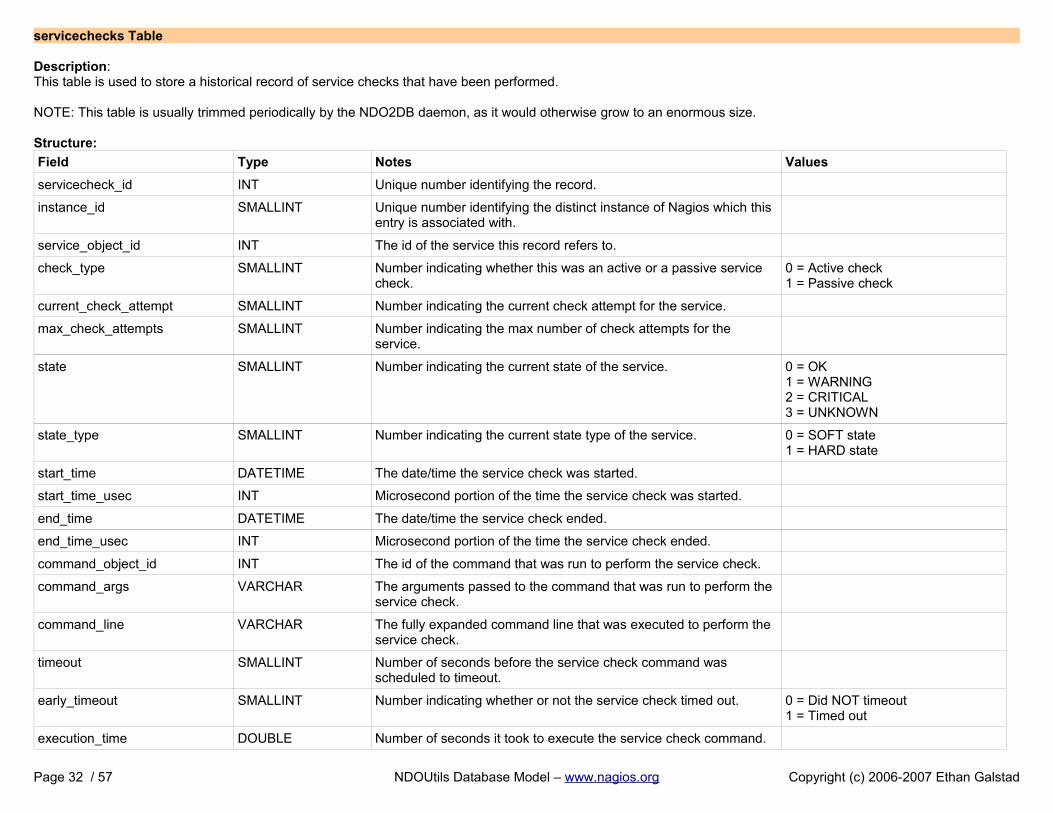
servicechecks Table
Description:This table is used to store a historical record of service checks that have been performed.
NOTE: This table is usually trimmed periodically by the NDO2DB daemon, as it would otherwise grow to an enormous size.
Structure:
Field Type Notes Values
servicecheck_id INT Unique number identifying the record.
instance_id SMALLINT Unique number identifying the distinct instance of Nagios which this entry is associated with.
service_object_id INT The id of the service this record refers to.
check_type SMALLINT Number indicating whether this was an active or a passive service check.
0 = Active check1 = Passive check
current_check_attempt SMALLINT Number indicating the current check attempt for the service.
max_check_attempts SMALLINT Number indicating the max number of check attempts for the service.
state SMALLINT Number indicating the current state of the service. 0 = OK1 = WARNING2 = CRITICAL3 = UNKNOWN
state_type SMALLINT Number indicating the current state type of the service. 0 = SOFT state1 = HARD state
start_time DATETIME The date/time the service check was started.
start_time_usec INT Microsecond portion of the time the service check was started.
end_time DATETIME The date/time the service check ended.
end_time_usec INT Microsecond portion of the time the service check ended.
command_object_id INT The id of the command that was run to perform the service check.
command_args VARCHAR The arguments passed to the command that was run to perform the service check.
command_line VARCHAR The fully expanded command line that was executed to perform the service check.
timeout SMALLINT Number of seconds before the service check command was scheduled to timeout.
early_timeout SMALLINT Number indicating whether or not the service check timed out. 0 = Did NOT timeout1 = Timed out
execution_time DOUBLE Number of seconds it took to execute the service check command.
Page 32 / 57 NDOUtils Database Model – www.nagios.org Copyright (c) 2006-2007 Ethan Galstad
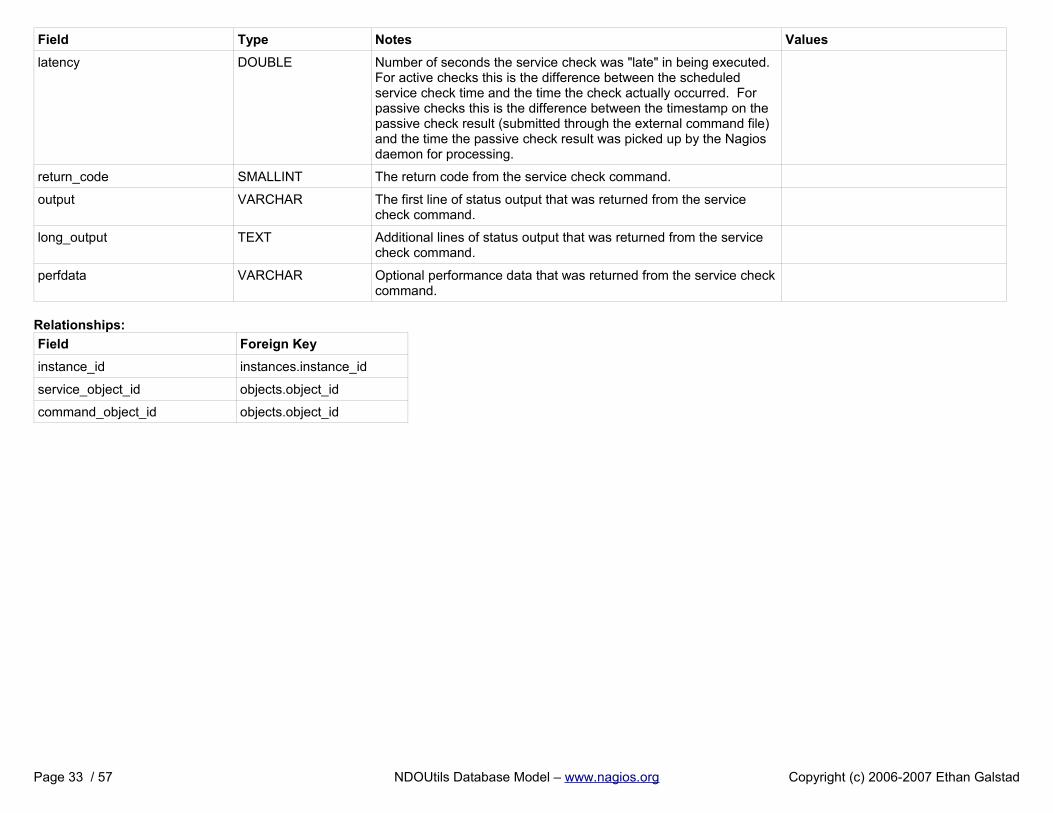
Field Type Notes Values
latency DOUBLE Number of seconds the service check was "late" in being executed. For active checks this is the difference between the scheduled service check time and the time the check actually occurred. For passive checks this is the difference between the timestamp on the passive check result (submitted through the external command file) and the time the passive check result was picked up by the Nagios daemon for processing.
return_code SMALLINT The return code from the service check command.
output VARCHAR The first line of status output that was returned from the service check command.
long_output TEXT Additional lines of status output that was returned from the service check command.
perfdata VARCHAR Optional performance data that was returned from the service checkcommand.
Relationships:
Field Foreign Key
instance_id instances.instance_id
service_object_id objects.object_id
command_object_id objects.object_id
Page 33 / 57 NDOUtils Database Model – www.nagios.org Copyright (c) 2006-2007 Ethan Galstad
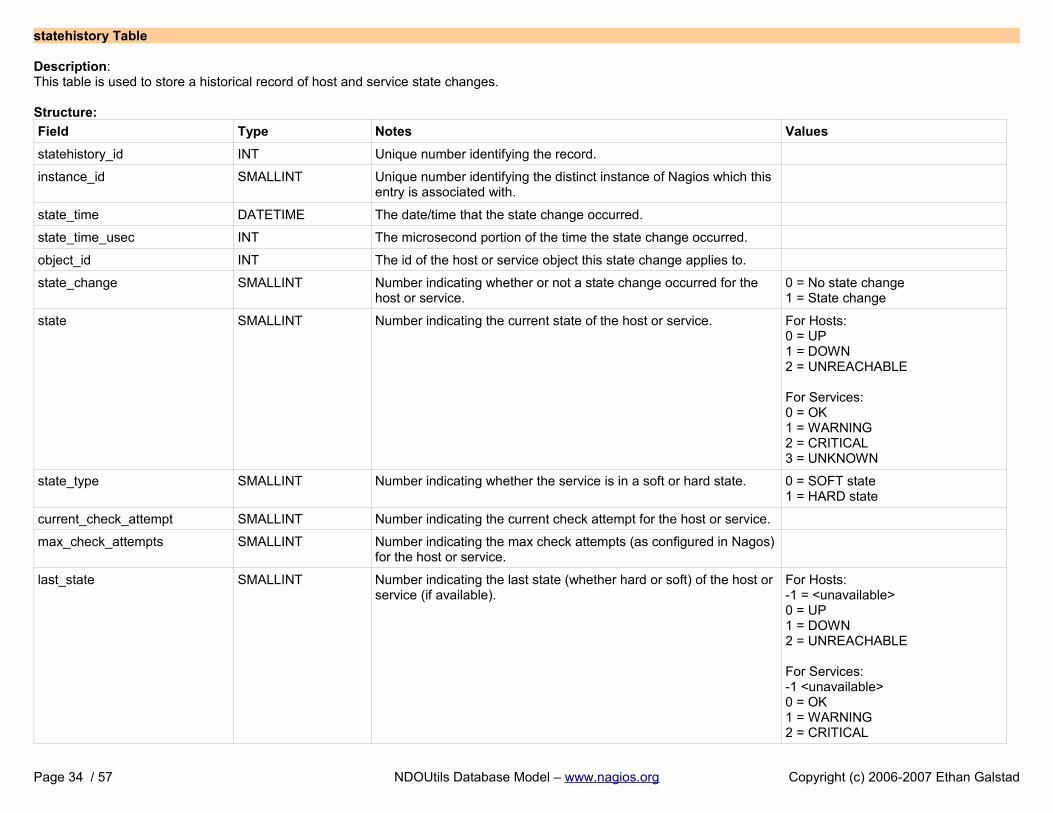
statehistory Table
Description:This table is used to store a historical record of host and service state changes.
Structure:
Field Type Notes Values
statehistory_id INT Unique number identifying the record.
instance_id SMALLINT Unique number identifying the distinct instance of Nagios which this entry is associated with.
state_time DATETIME The date/time that the state change occurred.
state_time_usec INT The microsecond portion of the time the state change occurred.
object_id INT The id of the host or service object this state change applies to.
state_change SMALLINT Number indicating whether or not a state change occurred for the host or service.
0 = No state change1 = State change
state SMALLINT Number indicating the current state of the host or service. For Hosts:0 = UP1 = DOWN2 = UNREACHABLE
For Services:0 = OK1 = WARNING2 = CRITICAL3 = UNKNOWN
state_type SMALLINT Number indicating whether the service is in a soft or hard state. 0 = SOFT state1 = HARD state
current_check_attempt SMALLINT Number indicating the current check attempt for the host or service.
max_check_attempts SMALLINT Number indicating the max check attempts (as configured in Nagos)for the host or service.
last_state SMALLINT Number indicating the last state (whether hard or soft) of the host or service (if available).
For Hosts:-1 = <unavailable>0 = UP1 = DOWN2 = UNREACHABLE
For Services:-1 <unavailable>0 = OK1 = WARNING2 = CRITICAL
Page 34 / 57 NDOUtils Database Model – www.nagios.org Copyright (c) 2006-2007 Ethan Galstad

Field Type Notes Values
3 = UNKNOWN
last_hard_state SMALLINT Number indicating the last hard state of the host or service (if available).
For Hosts:-1 = <unavailable>0 = UP1 = DOWN2 = UNREACHABLE
For Services:-1 <unavailable>0 = OK1 = WARNING2 = CRITICAL
output VARCHAR The first line of the current plugin/status output of the host or service.
long_output TEXT Additional lines of the current plugin/status output of the host or service.
Relationships:
Field Foreign Key
instance_id instances.instance_id
object_id objects.object_id
Page 35 / 57 NDOUtils Database Model – www.nagios.org Copyright (c) 2006-2007 Ethan Galstad
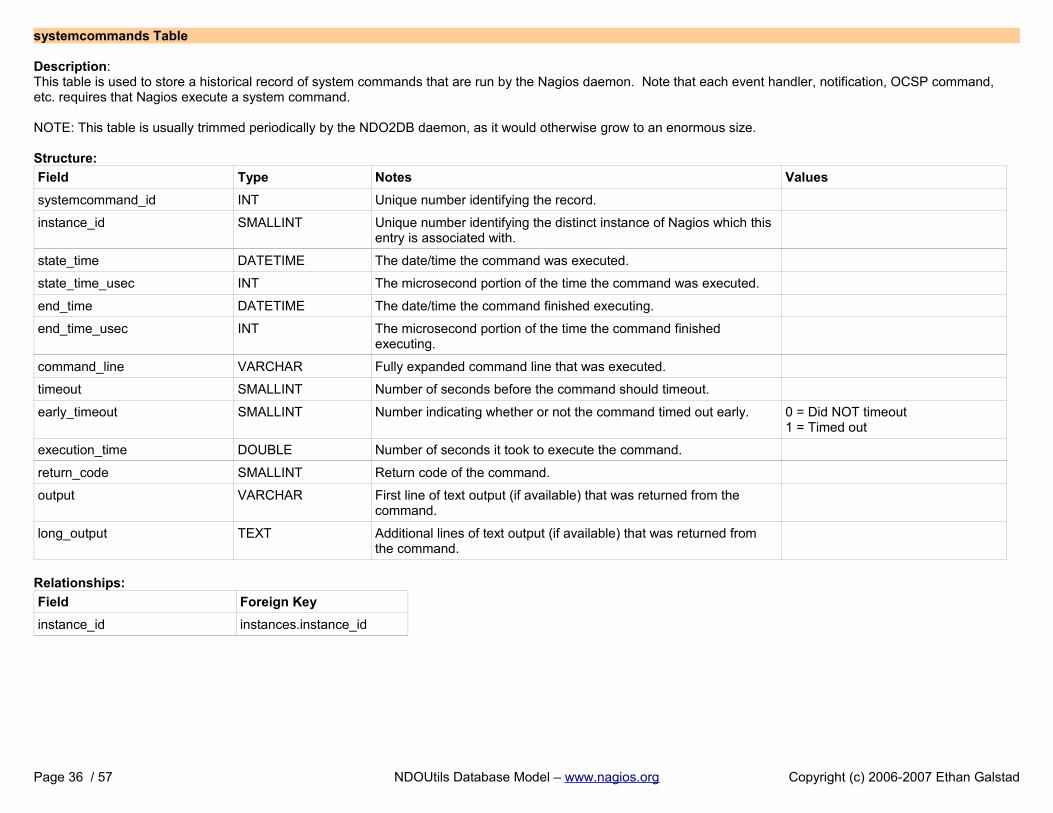
systemcommands Table
Description:This table is used to store a historical record of system commands that are run by the Nagios daemon. Note that each event handler, notification, OCSP command, etc. requires that Nagios execute a system command.
NOTE: This table is usually trimmed periodically by the NDO2DB daemon, as it would otherwise grow to an enormous size.
Structure:
Field Type Notes Values
systemcommand_id INT Unique number identifying the record.
instance_id SMALLINT Unique number identifying the distinct instance of Nagios which this entry is associated with.
state_time DATETIME The date/time the command was executed.
state_time_usec INT The microsecond portion of the time the command was executed.
end_time DATETIME The date/time the command finished executing.
end_time_usec INT The microsecond portion of the time the command finished executing.
command_line VARCHAR Fully expanded command line that was executed.
timeout SMALLINT Number of seconds before the command should timeout.
early_timeout SMALLINT Number indicating whether or not the command timed out early. 0 = Did NOT timeout1 = Timed out
execution_time DOUBLE Number of seconds it took to execute the command.
return_code SMALLINT Return code of the command.
output VARCHAR First line of text output (if available) that was returned from the command.
long_output TEXT Additional lines of text output (if available) that was returned from the command.
Relationships:
Field Foreign Key
instance_id instances.instance_id
Page 36 / 57 NDOUtils Database Model – www.nagios.org Copyright (c) 2006-2007 Ethan Galstad
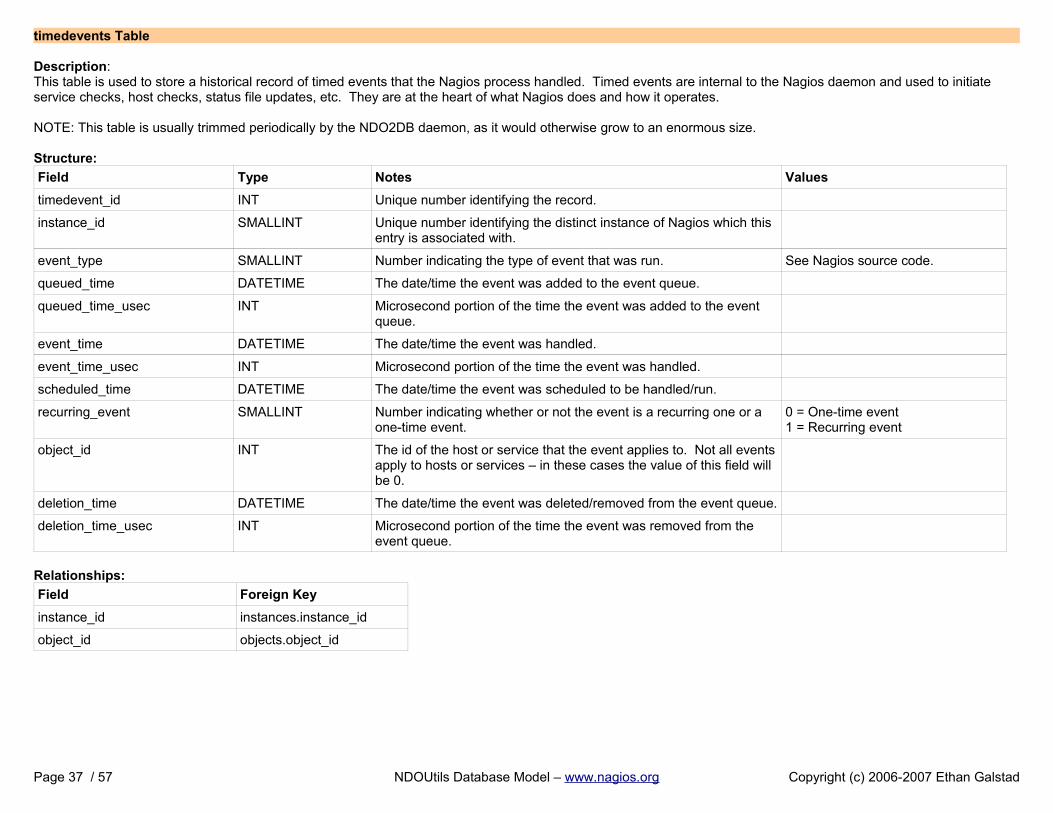
timedevents Table
Description:This table is used to store a historical record of timed events that the Nagios process handled. Timed events are internal to the Nagios daemon and used to initiate service checks, host checks, status file updates, etc. They are at the heart of what Nagios does and how it operates.
NOTE: This table is usually trimmed periodically by the NDO2DB daemon, as it would otherwise grow to an enormous size.
Structure:
Field Type Notes Values
timedevent_id INT Unique number identifying the record.
instance_id SMALLINT Unique number identifying the distinct instance of Nagios which this entry is associated with.
event_type SMALLINT Number indicating the type of event that was run. See Nagios source code.
queued_time DATETIME The date/time the event was added to the event queue.
queued_time_usec INT Microsecond portion of the time the event was added to the event queue.
event_time DATETIME The date/time the event was handled.
event_time_usec INT Microsecond portion of the time the event was handled.
scheduled_time DATETIME The date/time the event was scheduled to be handled/run.
recurring_event SMALLINT Number indicating whether or not the event is a recurring one or a one-time event.
0 = One-time event1 = Recurring event
object_id INT The id of the host or service that the event applies to. Not all eventsapply to hosts or services – in these cases the value of this field will be 0.
deletion_time DATETIME The date/time the event was deleted/removed from the event queue.
deletion_time_usec INT Microsecond portion of the time the event was removed from the event queue.
Relationships:
Field Foreign Key
instance_id instances.instance_id
object_id objects.object_id
Page 37 / 57 NDOUtils Database Model – www.nagios.org Copyright (c) 2006-2007 Ethan Galstad

Current Status Tables
Page 38 / 57 NDOUtils Database Model – www.nagios.org Copyright (c) 2006-2007 Ethan Galstad
Current Status Tables
There are several tables in the database which are used to hold current status information on the Nagios process and all hosts and services that it is monitoring. Entries in these tables are cleared whenever the Nagios daemon (belonging to the same instance) (re)starts.
Table List
commentscustomvariablestatushoststatusprogramstatus
runtimevariablesscheduleddowntimeservicestatustimedeventqueue
[ Continued on the next page ]
Page 39 / 57 NDOUtils Database Model – www.nagios.org Copyright (c) 2006-2007 Ethan Galstad
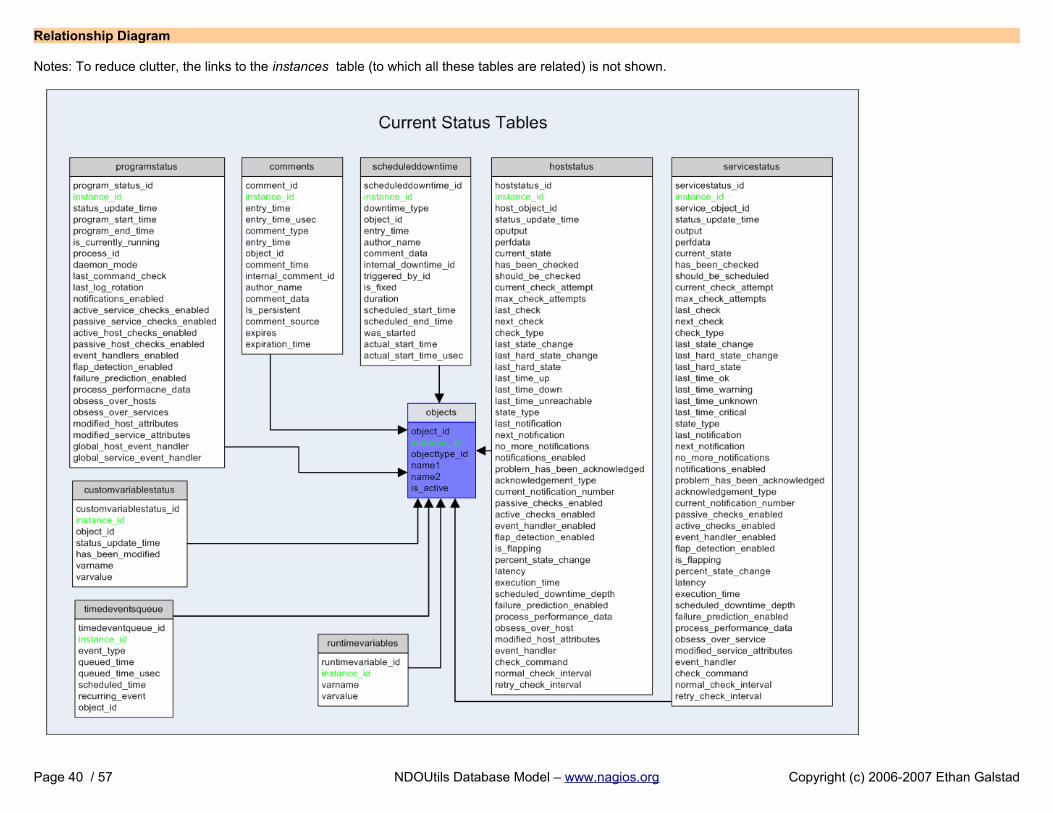
Relationship Diagram
Notes: To reduce clutter, the links to the instances table (to which all these tables are related) is not shown.
Page 40 / 57 NDOUtils Database Model – www.nagios.org Copyright (c) 2006-2007 Ethan Galstad

comments Table
Description:This table is used to store current host and service comments. Historical comments can be found in the commenthistory table.
Structure:
Field Type Notes Values
comment_id INT Unique number identifying the comment record.
instance_id SMALLINT Unique number identifying the distinct instance of Nagios which this entry is associated with.
entry_time DATETIME Date and time the comment was entered.
entry_time_usec INT Microsecond portion of comment entry time.
comment_type SMALLINT Indicates whether this is a host or service comment. 1 = Host comment2 = Service comment
entry_type SMALLINT Indicates how this comment came to be entered. 1 = User2 = Scheduled downtime3 = Flapping4 = Acknowledgement
object_id INT The object id of the host or service this acknowledgement applies to.
comment_time DATETIME Date and time associated with the comment.
internal_comment_id INT The comment ID internal to the Nagios daemon.
author_name VARCHAR(64) Text field containing the name of the person who made the comment.
comment_data VARCHAR(255) Text field containing the comment.
is_persistent SMALLINT Indicates whether or not the comment is persistent. 0 = Not persistent1 = Persistent
comment_source SMALLINT Indicates the source of the comment. 0 = Internal (Nagios)1 = External (user)
expires SMALLINT Indicates whether or not the comment expires. 0 = Doesn't expires1 = Expires
expiration_time DATETIME Date and time at which the comment expires.
Relationships:
Field Foreign Key
instance_id instances.instance_id
object_id objects.object_id
Page 41 / 57 NDOUtils Database Model – www.nagios.org Copyright (c) 2006-2007 Ethan Galstad
customvariablestatus Table
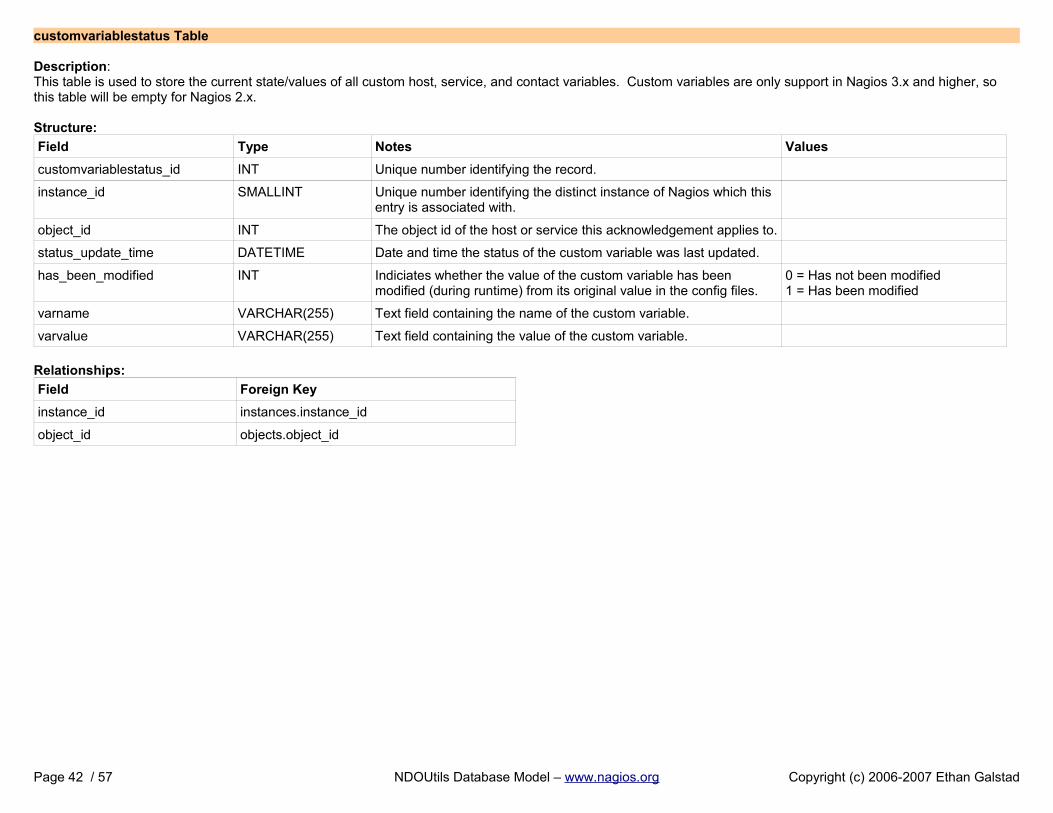
Description:This table is used to store the current state/values of all custom host, service, and contact variables. Custom variables are only support in Nagios 3.x and higher, so this table will be empty for Nagios 2.x.
Structure:
Field Type Notes Values
customvariablestatus_id INT Unique number identifying the record.
instance_id SMALLINT Unique number identifying the distinct instance of Nagios which this entry is associated with.
object_id INT The object id of the host or service this acknowledgement applies to.
status_update_time DATETIME Date and time the status of the custom variable was last updated.
has_been_modified INT Indiciates whether the value of the custom variable has been modified (during runtime) from its original value in the config files.
0 = Has not been modified1 = Has been modified
varname VARCHAR(255) Text field containing the name of the custom variable.
varvalue VARCHAR(255) Text field containing the value of the custom variable.
Relationships:
Field Foreign Key
instance_id instances.instance_id
object_id objects.object_id
Page 42 / 57 NDOUtils Database Model – www.nagios.org Copyright (c) 2006-2007 Ethan Galstad
hoststatus Table
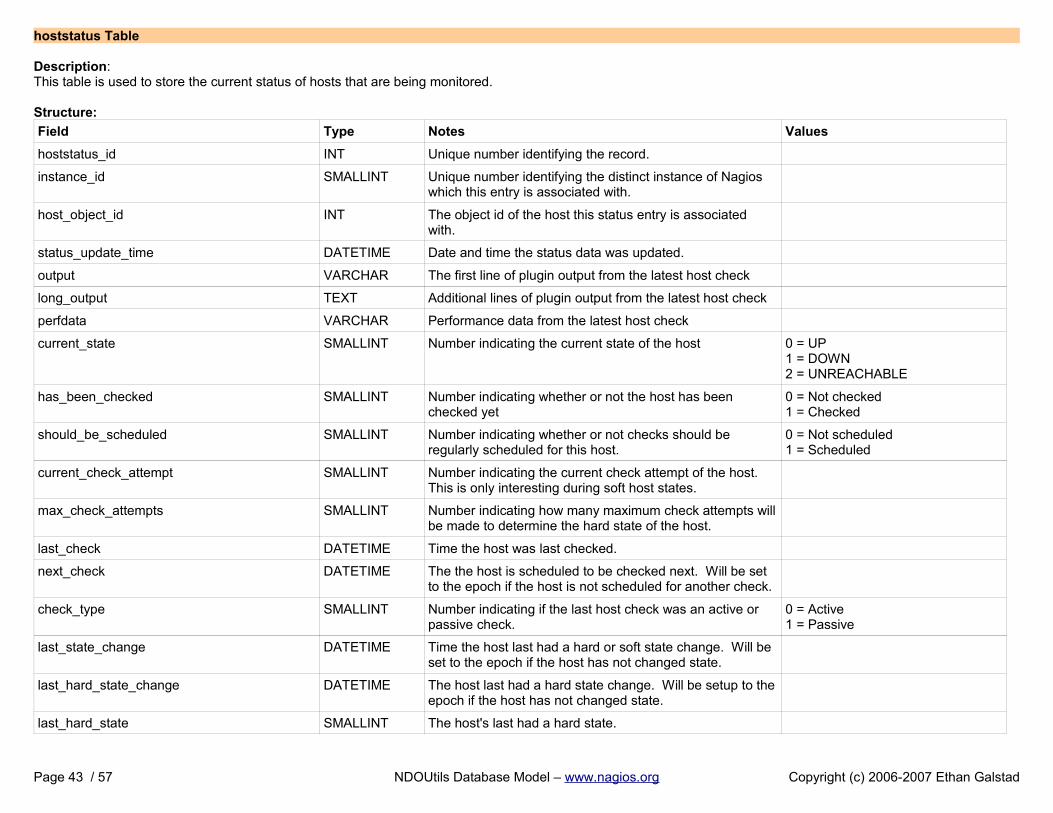
Description:This table is used to store the current status of hosts that are being monitored.
Structure:
Field Type Notes Values
hoststatus_id INT Unique number identifying the record.
instance_id SMALLINT Unique number identifying the distinct instance of Nagios which this entry is associated with.
host_object_id INT The object id of the host this status entry is associated with.
status_update_time DATETIME Date and time the status data was updated.
output VARCHAR The first line of plugin output from the latest host check
long_output TEXT Additional lines of plugin output from the latest host check
perfdata VARCHAR Performance data from the latest host check
current_state SMALLINT Number indicating the current state of the host 0 = UP1 = DOWN2 = UNREACHABLE
has_been_checked SMALLINT Number indicating whether or not the host has been checked yet
0 = Not checked1 = Checked
should_be_scheduled SMALLINT Number indicating whether or not checks should be regularly scheduled for this host.
0 = Not scheduled1 = Scheduled
current_check_attempt SMALLINT Number indicating the current check attempt of the host. This is only interesting during soft host states.
max_check_attempts SMALLINT Number indicating how many maximum check attempts willbe made to determine the hard state of the host.
last_check DATETIME Time the host was last checked.
next_check DATETIME The the host is scheduled to be checked next. Will be set to the epoch if the host is not scheduled for another check.
check_type SMALLINT Number indicating if the last host check was an active or passive check.
0 = Active1 = Passive
last_state_change DATETIME Time the host last had a hard or soft state change. Will be set to the epoch if the host has not changed state.
last_hard_state_change DATETIME The host last had a hard state change. Will be setup to theepoch if the host has not changed state.
last_hard_state SMALLINT The host's last had a hard state.
Page 43 / 57 NDOUtils Database Model – www.nagios.org Copyright (c) 2006-2007 Ethan Galstad
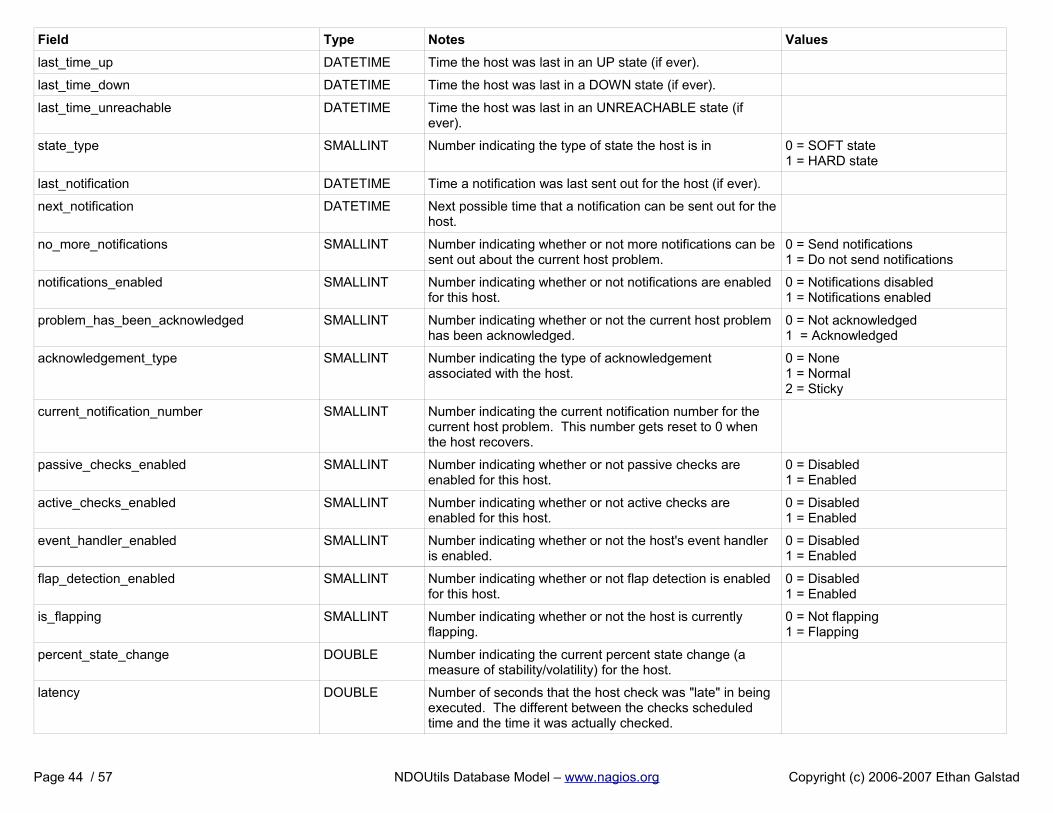
Field Type Notes Values
last_time_up DATETIME Time the host was last in an UP state (if ever).
last_time_down DATETIME Time the host was last in a DOWN state (if ever).
last_time_unreachable DATETIME Time the host was last in an UNREACHABLE state (if ever).
state_type SMALLINT Number indicating the type of state the host is in 0 = SOFT state1 = HARD state
last_notification DATETIME Time a notification was last sent out for the host (if ever).
next_notification DATETIME Next possible time that a notification can be sent out for thehost.
no_more_notifications SMALLINT Number indicating whether or not more notifications can besent out about the current host problem.
0 = Send notifications1 = Do not send notifications
notifications_enabled SMALLINT Number indicating whether or not notifications are enabled for this host.
0 = Notifications disabled1 = Notifications enabled
problem_has_been_acknowledged SMALLINT Number indicating whether or not the current host problem has been acknowledged.
0 = Not acknowledged1 = Acknowledged
acknowledgement_type SMALLINT Number indicating the type of acknowledgement associated with the host.
0 = None1 = Normal2 = Sticky
current_notification_number SMALLINT Number indicating the current notification number for the current host problem. This number gets reset to 0 when the host recovers.
passive_checks_enabled SMALLINT Number indicating whether or not passive checks are enabled for this host.
0 = Disabled1 = Enabled
active_checks_enabled SMALLINT Number indicating whether or not active checks are enabled for this host.
0 = Disabled1 = Enabled
event_handler_enabled SMALLINT Number indicating whether or not the host's event handler is enabled.
0 = Disabled1 = Enabled
flap_detection_enabled SMALLINT Number indicating whether or not flap detection is enabled for this host.
0 = Disabled1 = Enabled
is_flapping SMALLINT Number indicating whether or not the host is currently flapping.
0 = Not flapping1 = Flapping
percent_state_change DOUBLE Number indicating the current percent state change (a measure of stability/volatility) for the host.
latency DOUBLE Number of seconds that the host check was "late" in being executed. The different between the checks scheduled time and the time it was actually checked.
Page 44 / 57 NDOUtils Database Model – www.nagios.org Copyright (c) 2006-2007 Ethan Galstad
Field Type Notes Values
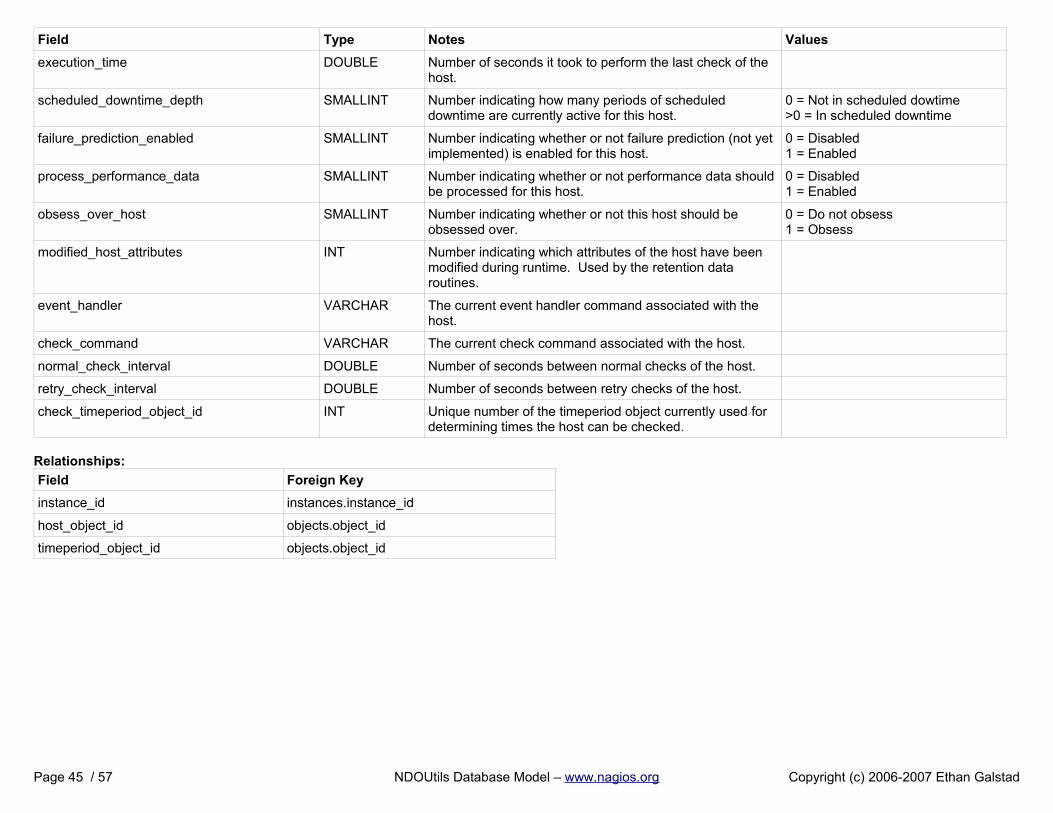
execution_time DOUBLE Number of seconds it took to perform the last check of the host.
scheduled_downtime_depth SMALLINT Number indicating how many periods of scheduled downtime are currently active for this host.
0 = Not in scheduled dowtime>0 = In scheduled downtime
failure_prediction_enabled SMALLINT Number indicating whether or not failure prediction (not yet implemented) is enabled for this host.
0 = Disabled1 = Enabled
process_performance_data SMALLINT Number indicating whether or not performance data shouldbe processed for this host.
0 = Disabled1 = Enabled
obsess_over_host SMALLINT Number indicating whether or not this host should be obsessed over.
0 = Do not obsess1 = Obsess
modified_host_attributes INT Number indicating which attributes of the host have been modified during runtime. Used by the retention data routines.
event_handler VARCHAR The current event handler command associated with the host.
check_command VARCHAR The current check command associated with the host.
normal_check_interval DOUBLE Number of seconds between normal checks of the host.
retry_check_interval DOUBLE Number of seconds between retry checks of the host.
check_timeperiod_object_id INT Unique number of the timeperiod object currently used for determining times the host can be checked.
Relationships:
Field Foreign Key
instance_id instances.instance_id
host_object_id objects.object_id
timeperiod_object_id objects.object_id
Page 45 / 57 NDOUtils Database Model – www.nagios.org Copyright (c) 2006-2007 Ethan Galstad

programstatus Table
Description:This table stored status information on the currently (or previously) running Nagios process/daemon.
Structure:
Field Type Notes Values
programstatus_id INT Unique number identifying the record.
instance_id SMALLINT Unique number identifying the distinct instance of Nagios which this entry is associated with.
status_update_time DATETIME Date and time the status of the process was last updated.
program_start_time DATETIME Date and time the Nagios process was started.
program_end_time DATETIME Date and time the Nagios process as stopped (if currently not running).
is_currently_running SMALLINT Indicates whether or not the Nagios process is currently running.
0 = Process is not running1 = Process is running
process_id INT The processed ID (PID) of the Nagios process.
daemon_mode SMALLINT Indicates whether Nagios is running as a foreground process or a daemon.
0 = Foreground process1 = Daemon
last_command_check DATETIME Date and time the Nagios process last checked external commands.
last_log_rotation DATETIME Date and time the log file was last rotated (if at all).
notifications_enabled SMALLINT Indicates whether or not notifications are enabled. 0 = Disabled1 = Enabled
active_service_checks_enabled SMALLINT Indicates whether or not active service checks are enabled.
0 = Disabled1 = Enabled
passive_service_checks_enabled SMALLINT Indicates whether or not passive service checks are enabled.
0 = Disabled1 = Enabled
active_host_checks_enabled SMALLINT Indicates whether or not active host checks are enabled.
0 = Disabled1 = Enabled
passive_host_checks_enabled SMALLINT Indicates whether or not passive host checks are enabled.
0 = Disabled1 = Enabled
event_handlers_enabled SMALLINT Indicates whether or not event handlers are enabled. 0 = Disabled1 = Enabled
flap_detection_enabled SMALLINT Indicates whether or not flap detection is enabled. 0 = Disabled1 = Enabled
failure_prediction_enabled SMALLINT Indicates whether or not failure prediction is enabled. 0 = Disabled
Page 46 / 57 NDOUtils Database Model – www.nagios.org Copyright (c) 2006-2007 Ethan Galstad
Field Type Notes Values
1 = Enabled
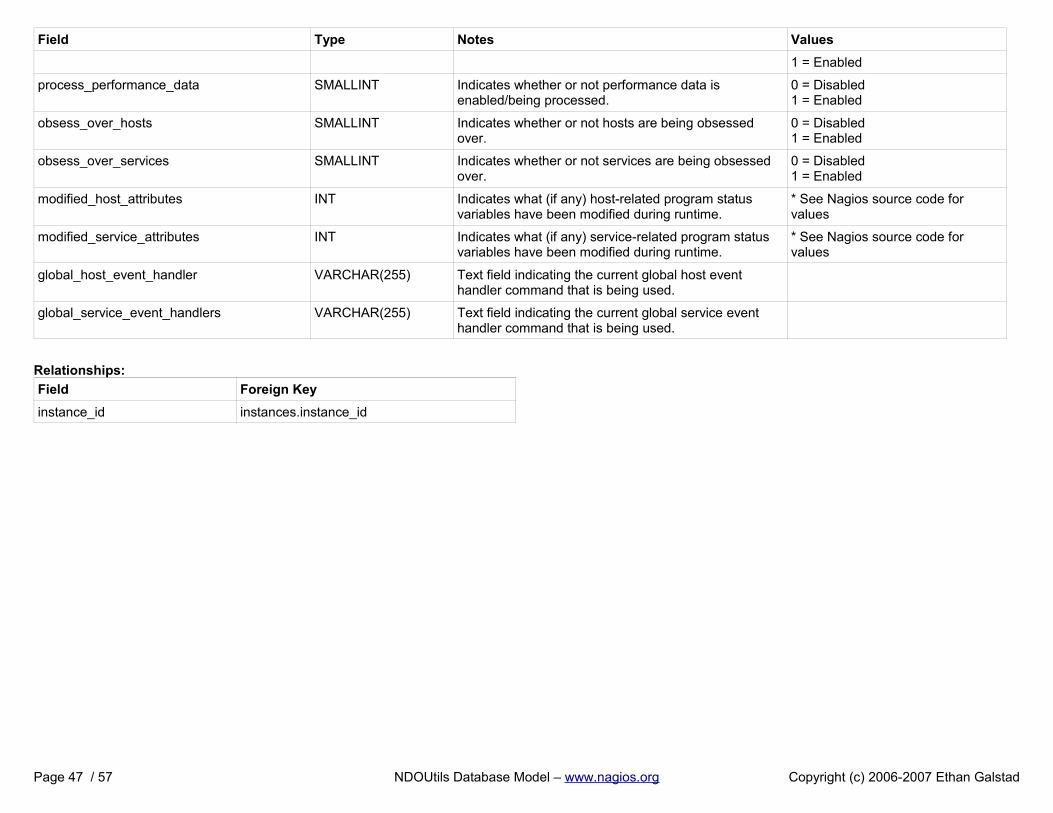
process_performance_data SMALLINT Indicates whether or not performance data is enabled/being processed.
0 = Disabled1 = Enabled
obsess_over_hosts SMALLINT Indicates whether or not hosts are being obsessed over.
0 = Disabled1 = Enabled
obsess_over_services SMALLINT Indicates whether or not services are being obsessed over.
0 = Disabled1 = Enabled
modified_host_attributes INT Indicates what (if any) host-related program status variables have been modified during runtime.
* See Nagios source code for values
modified_service_attributes INT Indicates what (if any) service-related program status variables have been modified during runtime.
* See Nagios source code for values
global_host_event_handler VARCHAR(255) Text field indicating the current global host event handler command that is being used.
global_service_event_handlers VARCHAR(255) Text field indicating the current global service event handler command that is being used.
Relationships:
Field Foreign Key
instance_id instances.instance_id
Page 47 / 57 NDOUtils Database Model – www.nagios.org Copyright (c) 2006-2007 Ethan Galstad

runtimevariables Table
Description:This table is used to store some runtime variables from the Nagios process that may be useful to you. The only variables currently stored in this table are some initial variables calculated at startup, but more variables may be stored here in future versions.
Structure:
Field Type Notes Values
runtimevariable_id INT Unique number identifying the record.
instance_id SMALLINT Unique number identifying the distinct instance of Nagios which this entry is associated with.
varname VARCHAR(64) Text field containing the name of the variable.
varvalue VARCHAR(255) Text field containing the value of the variable.
Relationships:
Field Foreign Key
instance_id instances.instance_id
Page 48 / 57 NDOUtils Database Model – www.nagios.org Copyright (c) 2006-2007 Ethan Galstad
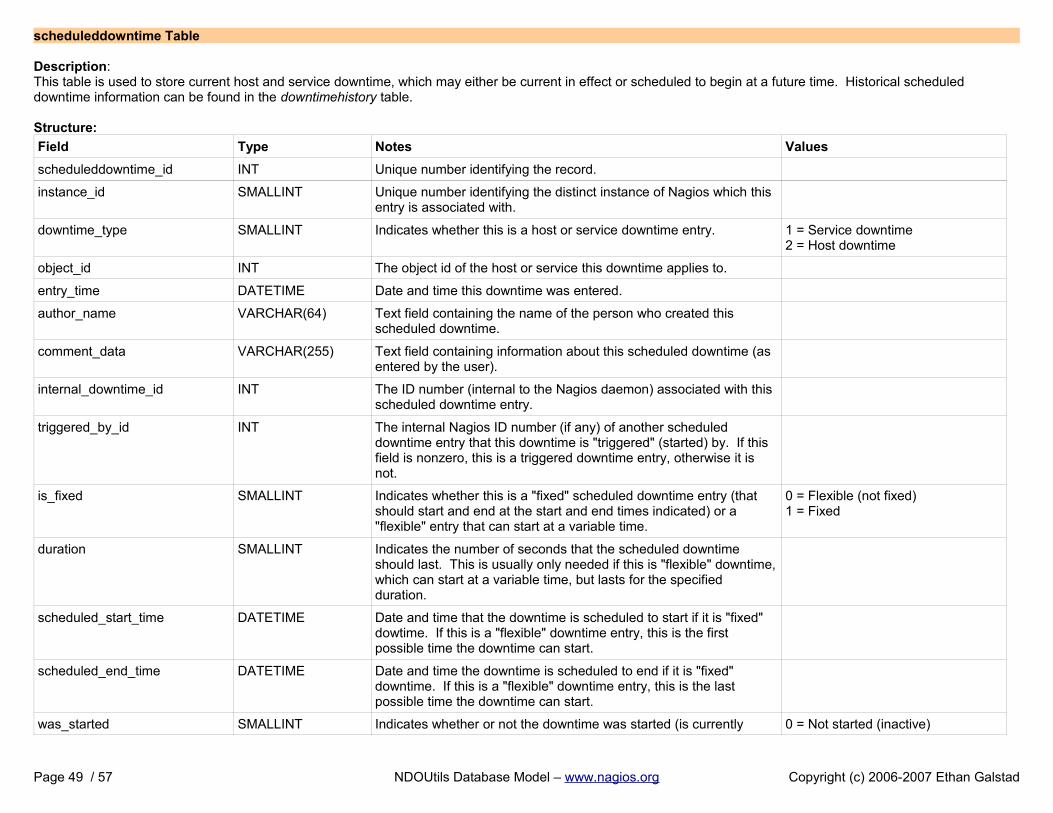
scheduleddowntime Table
Description:This table is used to store current host and service downtime, which may either be current in effect or scheduled to begin at a future time. Historical scheduled downtime information can be found in the downtimehistory table.
Structure:
Field Type Notes Values
scheduleddowntime_id INT Unique number identifying the record.
instance_id SMALLINT Unique number identifying the distinct instance of Nagios which this entry is associated with.
downtime_type SMALLINT Indicates whether this is a host or service downtime entry. 1 = Service downtime2 = Host downtime
object_id INT The object id of the host or service this downtime applies to.
entry_time DATETIME Date and time this downtime was entered.
author_name VARCHAR(64) Text field containing the name of the person who created this scheduled downtime.
comment_data VARCHAR(255) Text field containing information about this scheduled downtime (as entered by the user).
internal_downtime_id INT The ID number (internal to the Nagios daemon) associated with this scheduled downtime entry.
triggered_by_id INT The internal Nagios ID number (if any) of another scheduled downtime entry that this downtime is "triggered" (started) by. If this field is nonzero, this is a triggered downtime entry, otherwise it is not.
is_fixed SMALLINT Indicates whether this is a "fixed" scheduled downtime entry (that should start and end at the start and end times indicated) or a "flexible" entry that can start at a variable time.
0 = Flexible (not fixed)1 = Fixed
duration SMALLINT Indicates the number of seconds that the scheduled downtime should last. This is usually only needed if this is "flexible" downtime,which can start at a variable time, but lasts for the specified duration.
scheduled_start_time DATETIME Date and time that the downtime is scheduled to start if it is "fixed" dowtime. If this is a "flexible" downtime entry, this is the first possible time the downtime can start.
scheduled_end_time DATETIME Date and time the downtime is scheduled to end if it is "fixed" downtime. If this is a "flexible" downtime entry, this is the last possible time the downtime can start.
was_started SMALLINT Indicates whether or not the downtime was started (is currently 0 = Not started (inactive)
Page 49 / 57 NDOUtils Database Model – www.nagios.org Copyright (c) 2006-2007 Ethan Galstad
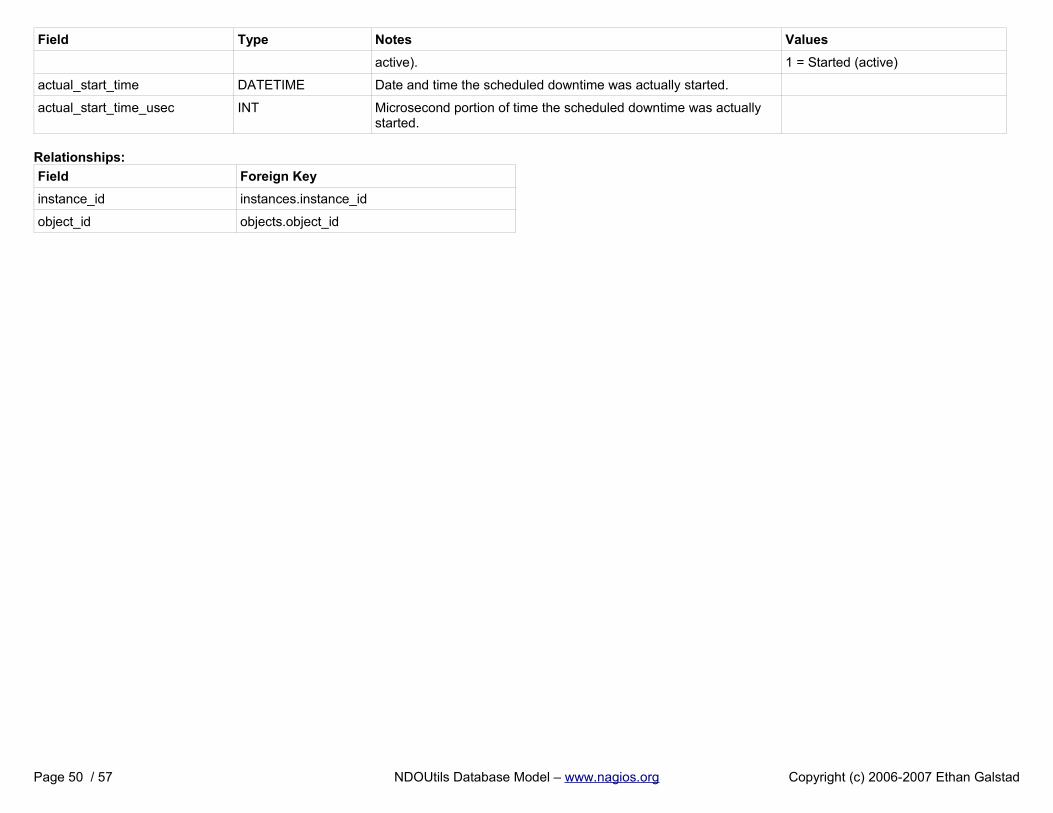
Field Type Notes Values
active). 1 = Started (active)
actual_start_time DATETIME Date and time the scheduled downtime was actually started.
actual_start_time_usec INT Microsecond portion of time the scheduled downtime was actually started.
Relationships:
Field Foreign Key
instance_id instances.instance_id
object_id objects.object_id
Page 50 / 57 NDOUtils Database Model – www.nagios.org Copyright (c) 2006-2007 Ethan Galstad

servicestatus Table
Description:This table is used to store current status information for all services that are being monitored.
Structure:
Field Type Notes Values
servicestatus_id INT Unique number identifying the record.
instance_id SMALLINT Unique number identifying the distinct instance of Nagios which this entry is associated with.
service_object_id INT The id of the service this record is associated with.
status_update_time DATETIME The date/time the status record was updated.
output VARCHAR The first line of text output from the most current service check.
long_output TEXT Additional lines of text output from the most current service check.
perfdata VARCHAR Optional performance data from the most current service check.
current_state SMALLINT Number indicating the current state of the service. 0 = OK1 = WARNING2 = CRITICAL3 = UNKNOWN
has_been_checked SMALLINT Number indicating whether or not the service has been checked yet. 0 = Has NOT been checked1 = Has been checked
should_be_scheduled SMALLINT Number indicating whether or not the service should be scheduled for periodic checks on a regular basis.
0 = Not scheduled1 = Scheduled
current_check_attempt SMALLINT The current check attempt for the service.
max_check_attempts SMALLINT The max check attempts (as configured in Nagios) for the service.
last_check DATETIME The date/time the service was last checked. Set to the epoch if the service has not been checked yet.
next_check DATETIME The date/time the service is scheduled to be checked next.
check_type SMALLINT Number indicating whether or not the last service check was active or passive.
0 = Active1 = Passive
last_state_change DATETIME The date/time the service last changed state (if at all). This gets updated for both HARD and SOFT state changes.
last_hard_state_change DATETIME The date/time the service last changed HARD states (if at all).
last_hard_state SMALLINT The last service state.
last_time_ok DATETIME The date/time the service was last in an OK state (if at all).
last_time_warning DATETIME The date/time the service was last in a WARNING state (if at all).
Page 51 / 57 NDOUtils Database Model – www.nagios.org Copyright (c) 2006-2007 Ethan Galstad
Field Type Notes Values
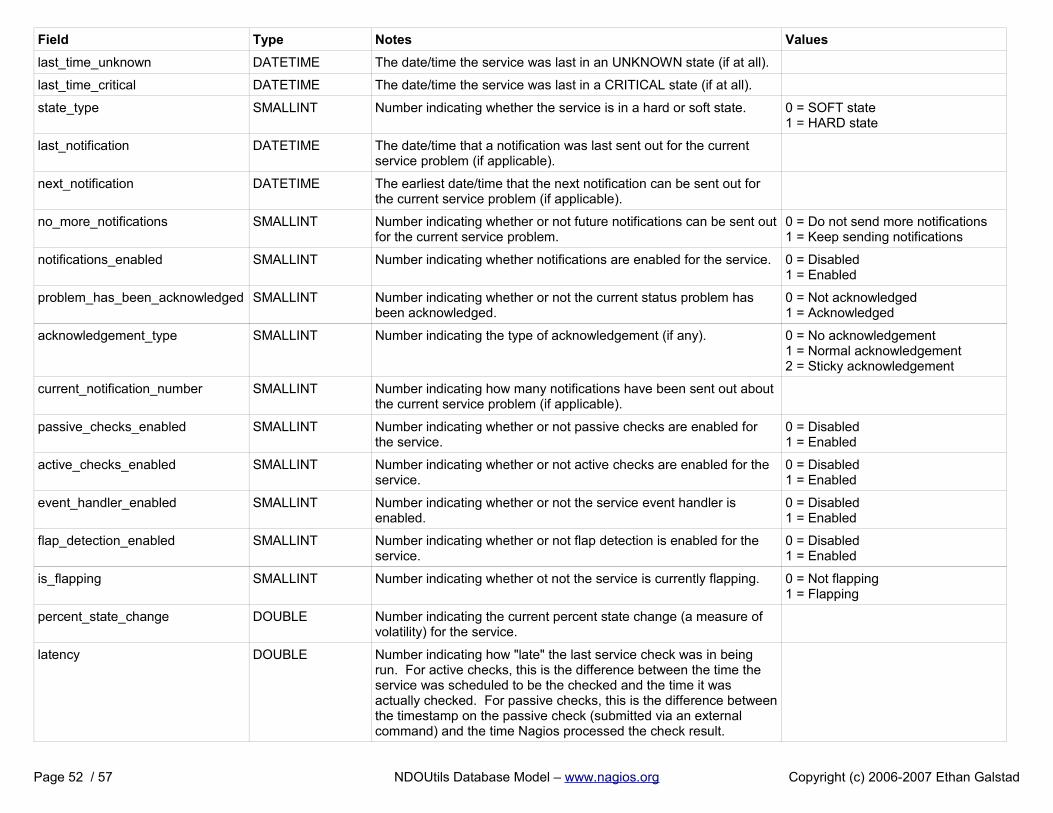
last_time_unknown DATETIME The date/time the service was last in an UNKNOWN state (if at all).
last_time_critical DATETIME The date/time the service was last in a CRITICAL state (if at all).
state_type SMALLINT Number indicating whether the service is in a hard or soft state. 0 = SOFT state1 = HARD state
last_notification DATETIME The date/time that a notification was last sent out for the current service problem (if applicable).
next_notification DATETIME The earliest date/time that the next notification can be sent out for the current service problem (if applicable).
no_more_notifications SMALLINT Number indicating whether or not future notifications can be sent outfor the current service problem.
0 = Do not send more notifications1 = Keep sending notifications
notifications_enabled SMALLINT Number indicating whether notifications are enabled for the service. 0 = Disabled1 = Enabled
problem_has_been_acknowledged SMALLINT Number indicating whether or not the current status problem has been acknowledged.
0 = Not acknowledged1 = Acknowledged
acknowledgement_type SMALLINT Number indicating the type of acknowledgement (if any). 0 = No acknowledgement1 = Normal acknowledgement2 = Sticky acknowledgement
current_notification_number SMALLINT Number indicating how many notifications have been sent out about the current service problem (if applicable).
passive_checks_enabled SMALLINT Number indicating whether or not passive checks are enabled for the service.
0 = Disabled1 = Enabled
active_checks_enabled SMALLINT Number indicating whether or not active checks are enabled for the service.
0 = Disabled1 = Enabled
event_handler_enabled SMALLINT Number indicating whether or not the service event handler is enabled.
0 = Disabled1 = Enabled
flap_detection_enabled SMALLINT Number indicating whether or not flap detection is enabled for the service.
0 = Disabled1 = Enabled
is_flapping SMALLINT Number indicating whether ot not the service is currently flapping. 0 = Not flapping1 = Flapping
percent_state_change DOUBLE Number indicating the current percent state change (a measure of volatility) for the service.
latency DOUBLE Number indicating how "late" the last service check was in being run. For active checks, this is the difference between the time the service was scheduled to be the checked and the time it was actually checked. For passive checks, this is the difference betweenthe timestamp on the passive check (submitted via an external command) and the time Nagios processed the check result.
Page 52 / 57 NDOUtils Database Model – www.nagios.org Copyright (c) 2006-2007 Ethan Galstad
Field Type Notes Values
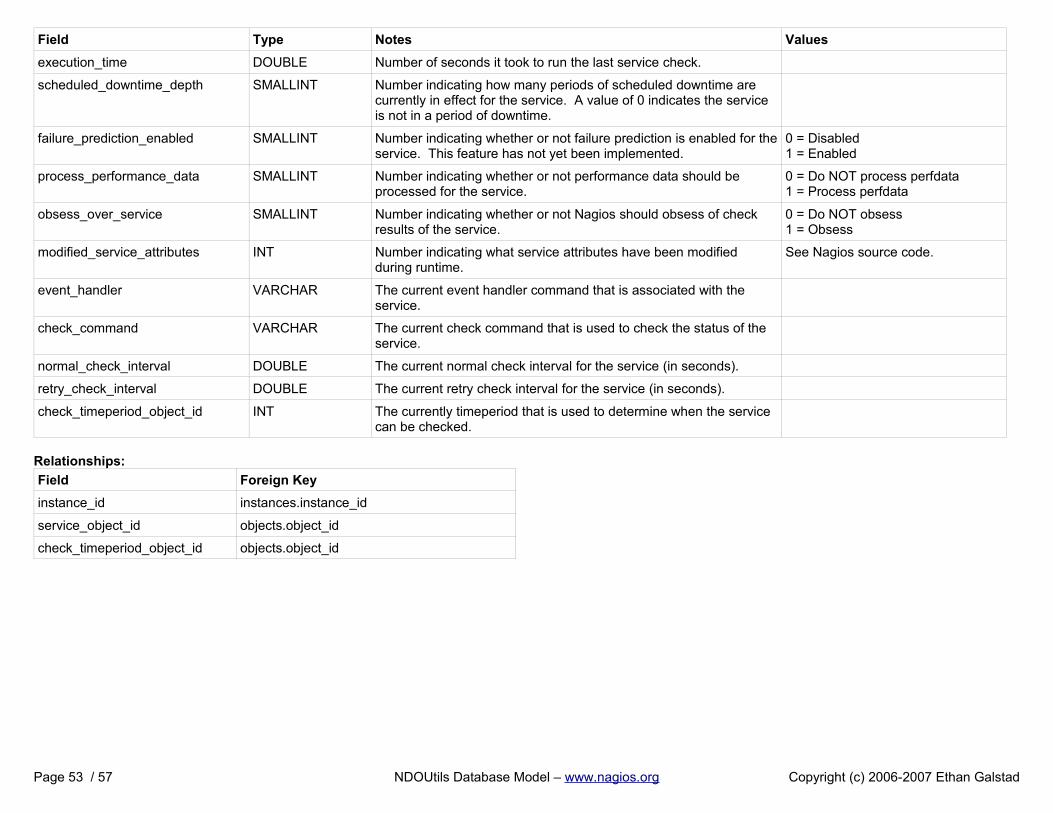
execution_time DOUBLE Number of seconds it took to run the last service check.
scheduled_downtime_depth SMALLINT Number indicating how many periods of scheduled downtime are currently in effect for the service. A value of 0 indicates the service is not in a period of downtime.
failure_prediction_enabled SMALLINT Number indicating whether or not failure prediction is enabled for theservice. This feature has not yet been implemented.
0 = Disabled1 = Enabled
process_performance_data SMALLINT Number indicating whether or not performance data should be processed for the service.
0 = Do NOT process perfdata1 = Process perfdata
obsess_over_service SMALLINT Number indicating whether or not Nagios should obsess of check results of the service.
0 = Do NOT obsess1 = Obsess
modified_service_attributes INT Number indicating what service attributes have been modified during runtime.
See Nagios source code.
event_handler VARCHAR The current event handler command that is associated with the service.
check_command VARCHAR The current check command that is used to check the status of the service.
normal_check_interval DOUBLE The current normal check interval for the service (in seconds).
retry_check_interval DOUBLE The current retry check interval for the service (in seconds).
check_timeperiod_object_id INT The currently timeperiod that is used to determine when the service can be checked.
Relationships:
Field Foreign Key
instance_id instances.instance_id
service_object_id objects.object_id
check_timeperiod_object_id objects.object_id
Page 53 / 57 NDOUtils Database Model – www.nagios.org Copyright (c) 2006-2007 Ethan Galstad
timedeventqueue Table
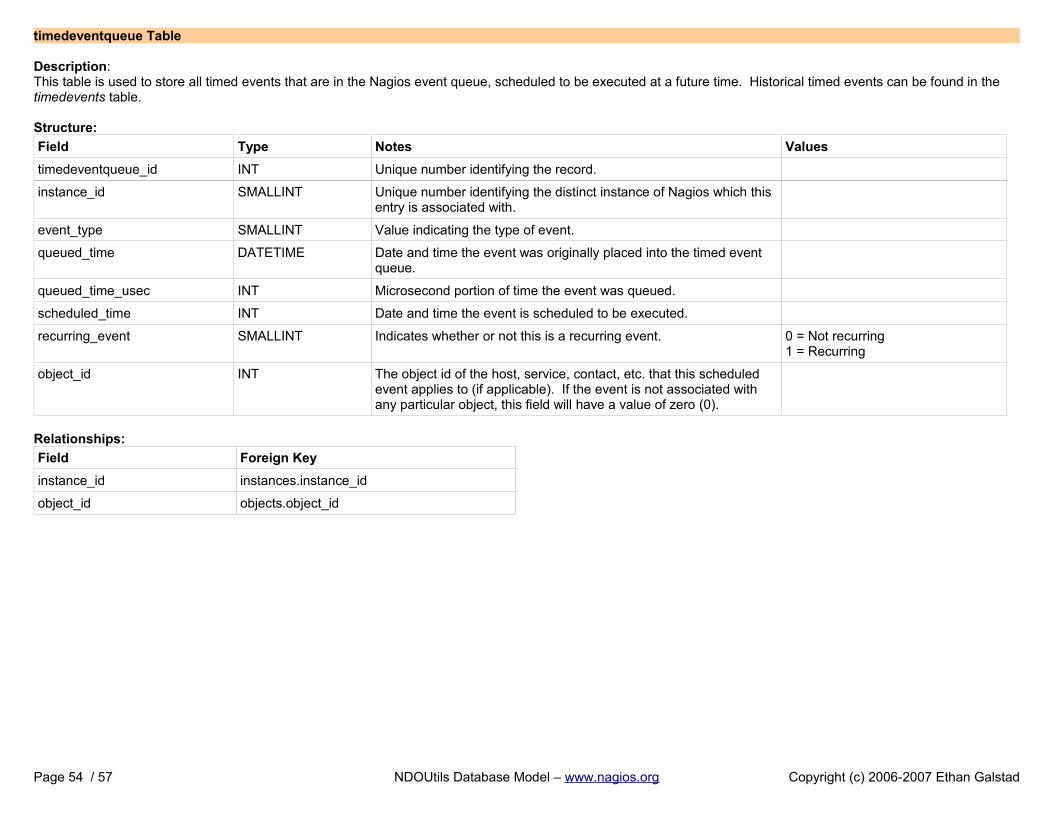
Description:This table is used to store all timed events that are in the Nagios event queue, scheduled to be executed at a future time. Historical timed events can be found in the timedevents table.
Structure:
Field Type Notes Values
timedeventqueue_id INT Unique number identifying the record.
instance_id SMALLINT Unique number identifying the distinct instance of Nagios which this entry is associated with.
event_type SMALLINT Value indicating the type of event.
queued_time DATETIME Date and time the event was originally placed into the timed event queue.
queued_time_usec INT Microsecond portion of time the event was queued.
scheduled_time INT Date and time the event is scheduled to be executed.
recurring_event SMALLINT Indicates whether or not this is a recurring event. 0 = Not recurring1 = Recurring
object_id INT The object id of the host, service, contact, etc. that this scheduled event applies to (if applicable). If the event is not associated with any particular object, this field will have a value of zero (0).
Relationships:
Field Foreign Key
instance_id instances.instance_id
object_id objects.object_id
Page 54 / 57 NDOUtils Database Model – www.nagios.org Copyright (c) 2006-2007 Ethan Galstad

Configuration Tables
Page 55 / 57 NDOUtils Database Model – www.nagios.org Copyright (c) 2006-2007 Ethan Galstad

Configuration Tables
There are many tables in the database that are used to store Nagios configuration. Note that the data in these tables represents a read-only output view of the configuration that Nagios was using during its last (or current) run. Configuration information from these tables is NOT read by the Nagios daemon in any way, and thus cannot be used to configure Nagios.
Table List
commandsconfigfilesconfigfilevariablescontact_addressescontact_notificationcommandscontactgroup_memberscontactgroupscontactnotificationmethodscontactscustomobjectvariableshost_contactgroupshost_parenthostshostdependencieshostescalation_contactgroups
hostescalationshostgroup_membershostgroupshostsservice_contactgroupsservicedependenciesserviceescalation_contactgroupsserviceescalationsservicegroup_membersservicegroupsservicestimeperod_timerangestimeperiods
[ Continued on the next page ]
Page 56 / 57 NDOUtils Database Model – www.nagios.org Copyright (c) 2006-2007 Ethan Galstad

Relationship Diagram
TODO
Table Descriptions
TODO
Page 57 / 57 NDOUtils Database Model – www.nagios.org Copyright (c) 2006-2007 Ethan Galstad