near-infrared spectroscopy of nitrogenated … · the near-infrared (nir) spectra and absolute band...
TRANSCRIPT

The Astrophysical Journal 6801243Y1255 2008 June 20 2008 The American Astronomical Society All rights reserved Printed in USA
NEAR-INFRARED SPECTROSCOPY OF NITROGENATED POLYCYCLIC AROMATIC HYDROCARBON CATIONS FROM 07 TO 25 microm
Andrew L Mattioda12
Lindsay Rutter123 John Parkhill4 Martin Head-Gordon4
Timothy J Lee1 and Louis J Allamandola1
Received 2007 April 25 accepted 2007 December 21
ABSTRACT
The near-infrared (NIR) spectra and absolute band strengths of 10 nitrogenated polycyclic aromatic hydrocarbon (PANH) radical cations isolated in an argon matrix are presented and compared with the spectra of their parent polycyclic aromatic hydrocarbon (PAH) radical cations The 07Y25 microm (14500Y4000 cm-1) spectrum for the open-shell cation forms of two nitrogenated anthracenes (C13H9N and C 12H8N2) four isomeric nitrogenated benshyzanthracenes (C17H11N) and four isomeric nitrogenated dibenzanthracenes (C21H13N) are reported These ionized PANHs have allowed electronic transitions that give rise to strong absorption bands in the NIR Low-lying excited states for these PANH ions are computed using time-dependent density functional theory (TDDFT) The resulting vertical excitation spectrum characterizes the transitions and leads to a simple model that predicts the qualitative trends in absorption energy The direction of the shift depends on the position of the nitrogen atom within the PANH and the relative magnitudes of the donor and acceptor molecular orbitals involved in the transitions As with nonshynitrogenated PAHs ionized interstellar PANHs can be expected to contribute to the mid-IR emission features from UV-rich as well as UV-poor regions and add weak broad band structure to the NIR region of the interstellar exshytinction curve
Subject headinggs astrochemistry mdash dust extinction mdash ISM general mdash ISM molecules mdash molecular data
1 INTRODUCTION sponsible for the emission band family The constraints of cosshymic abundance chemical rules for aromaticity and the proposed
More than 25 years of observations theoretical development PAH circumstellar formation mechanisms are indications that
and laboratory studies have led to the consensus that the midshythe interstellar PAH population could include species in which
infrared (mid-IR) interstellar emission features formerly referred a few nitrogen atoms are substituted for some of the carbon atoms
to as the unidentified infrared (UIR) bands are produced bymixshythat make up the moleculersquos fused hexagonal ring skeleton
tures of highly vibrationally excited polycyclic aromatic hydroshy(Peeters et al 2002 Hudgins et al 2005) To test and refine this
carbons (PAHs) PAH ions and related species including species idea Mattioda et al (2003 2005a) measured the mid-IR spectra
such as PAH clusters and polycyclic aromatic nitrogen heteroshyof a number of two three and four-ring polycyclic aromatic nishy
cycles or PANHs Detected in many galactic and extragalactic trogen heterocycles (PANHs) and their cations while Hudgins
objects including several with significant redshift the interstellar et al (2005) theoretically determined the mid-IR spectra of larger
infrared emission features present an important and unique probe more complex experimentally inaccessible PANHs Taken to-
of chemical and physical conditions across the universe Recent gether these studies showed that PANHs readily accommodate
reviews of the observational and laboratory work (eg Peeters the observed variations in the peak position of the strong inter-
et al 2004 Hudgins amp Allamandola 2004 Van Dishoek 2004) stellar emission feature near 62 microm and make the case that the
and theoretical models (Verstraete et al 2001 Bakes et al 2001 precise peak position is a measure of PANH size and nitrogen
Draine amp Li 2001 Li amp Draine 2001 Pech et al 2002) can be substitution pattern
found elsewhere As part of our laboratory program to provide the overall
Variations in the intensities band profiles and positions of the spectroscopic properties of PAHs under interstellar conditions
infrared emission provide important information about the na-Mattioda et al (2005b) reported the near-infrared (NIR) spectra
ture of the emitting PAH population and reflect conditions in the and absolute band strengths of 27 PAH cations ranging in size
emitting regions The small shift in the peak position of the in-from C14H10 to C50H22 This work was motivated in part by a
terstellar emission band near 62 microm is one such variation It was desire to understand whether open-shell PAHs in UV poor rashy
recognized that this could not be completely accommodated by diation fields could be pumped into highly vibrationally excited
the changes in the C-C stretching frequency of pure PAHs sevshystates byNIR photons Mattioda et al (2005c) showed that this is
eral years ago However the strong correlation of the 62 microm indeed possible and demonstrated that PAHs could be vibrashy
feature with the other emission features assigned to PAHs inshytionally excited even by the radiation from an M type star With
dicated that these variations in peak position arose from small these data Mattioda et al (2005c) developed a semiempirical exshy
changes in the population of aromatic materials that were re-tension of the Li amp Draine (2001 2002) PAH UV-visible model spectrum through the NIR spectral range
1 NASA Ames Research Center Moffett Field CA 94035-1000 Andrew Here this NIR study is extended to include PANHs The 07Y LMattiodanasagov
2 25 microm (14500Y4000 cm-1) spectrum for the 10 PANHs and the Carl Sagan Center SETI Institute 515 North Whisman Road Mountain
three parent PAHs listed in Table 1 have been measured These View CA 94043 3 The Pennsylvania State University University Park PA 16802 include anthracene (C14H10) and two nitrogenated anthracenes 4 University of California Berkeley CA 94720 acridine (C13H9N) and phenazine (C12H8N2) benz[a]anthracene
1243
1244
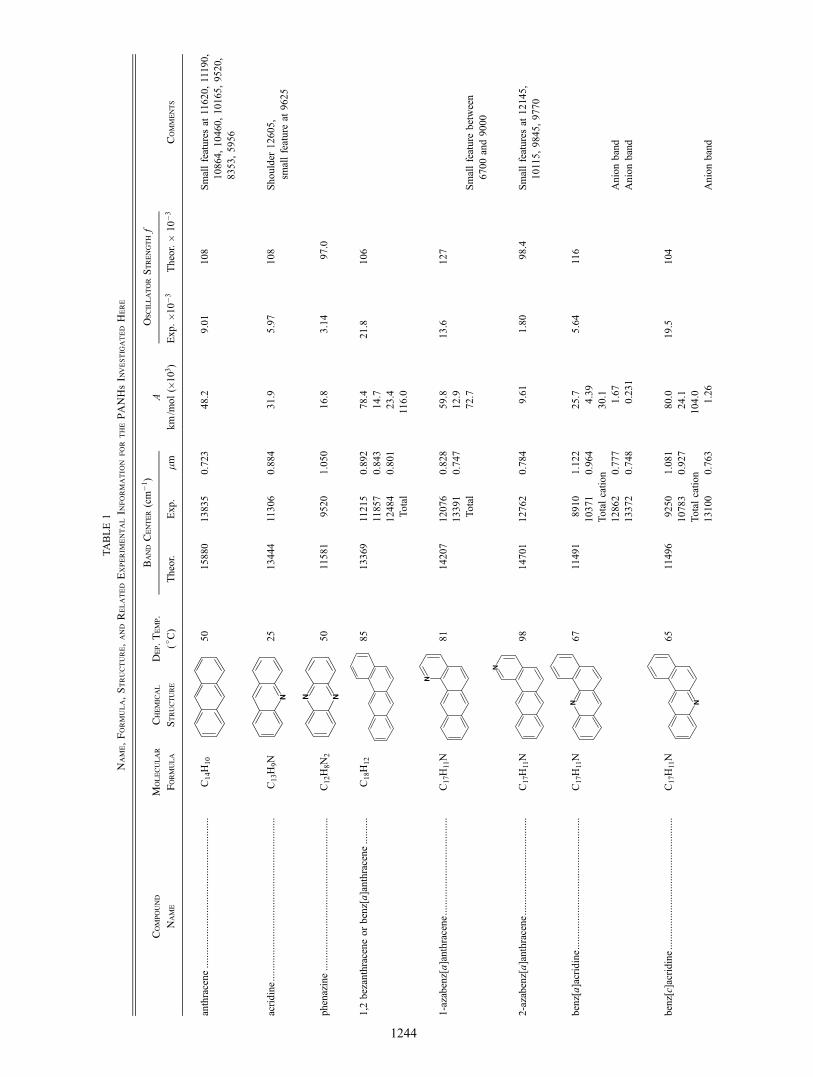
TABLE 1
Name Formula Structure and
Related
Experimental Information
for the PANHs Investigated
Here
Band Center (cm-1)
Oscillator Strength f
Compound
Molecular
Chemical
Dep Temp
A
Name
Formula
Structure
(C)
Theor
Exp
microm
kmm
ol (103)
Exp 10 -3
Theor
10 -3
Comments
anthracene
50
15880
13835
0723
482
901
108
Small features at 11620 11190
10864 10460 10165 9520
8353 5956
C14H10
acridine
25
13444
11306
0884
319
597
108
Shoulder 12605
small feature at 9625
C13H9N
phenazine
50
11581
9520
1050
168
314
970
C12H8N2
12 bezanthracene or benz[a]anthracene
85
13369
11215
0892
784
218
106
11857
0843
147
12484
0801
234
Total
1160
C18H12
1-azabenz[a]anthracene
C17H11N
81
14207
12076
0828
598
136
127
13391
0747
129
Total
727
Small feature between
6700 and 9000
2-azabenz[a]anthracene
C17H11N
98
14701
12762
0784
961
180
984
Small features at 12145
10115 9845 9770
benz[a]acridine
C17H11N
67
11491
8910
1122
257
564
116
10371
0964
439
Total cation
301
12862
0777
167
Anion band
13372
0748
0231
Anion band
benz[c]acridine
C17H11N
65
11496
9250
1081
800
195
104
10783
0927
241
Total cation
1040
13100
0763
126
Anion band
1245
TABLE 1mdashContinued
Band Center (cm-1)
Oscillator Strength f
Compound
Molecular
Chemical
Dep Temp
A
Name
Formula
Structure
( C)
Theor
Exp
microm
kmm
ol (103)
Exp10 -3
Theor
10 -3
Comments
Dibenz[a j
]anthracene
C22H14
135
11964
9773
1023
149
478
151
10188
0982
405
10515
0951
172
very small band at 8460 real
11252
0889
492
Total cation
256
dibenz[a j
]acridine
C21H13N
140
10262
7837
1276
1280
293
152
Side bands 8115 8400
9432
1060
24
Total
1560
dibenz[c h]acridine
110
10382
5844
1711
153
386
138
8016
1248
1460
9878
1012
601
Total wo 5843
2060
C21H13N
dibenz[a h]acridine
160
8724
7044
1420
1700
416
166
8635
1158
527
Total
2220
C21H13N
dibenz[a c]acridine
125
5840 12830
5219
1916
583
128 372
473 709
6613
1512
102
C21H13N
Total
685
11669
0857
153
13097
0764
457
Total
199
N
1246 MATTIODA ET AL Vol 680
(12 benzanthracene) (C18H12) and four of the isomeric nitrogenated benzanthracenes 1-azabenz[a]anthracene 2-azabenz[a]anthracene benz[c]acridine and benz[a]acridine all with formula C17H11N dibenz[ah]anthracene (C22H14) and four isomeric nitroshygenated dibenzanthracenes dibenz[a j]acridine dibenz[ch]acridine dibenz[ah]acridine and dibenz[ac]acridine all with formula C21H13N As with PAHs all the ionized PANHs we have studied have strong broad absorption bands in the NIR arising from electronic transitions The lowest lying electronic transitions for all of these species were computationally determined using time-dependent density functional theory (TDDFT) methods (Dreuw amp Head-Gordon 2005) which are known to be generally reliable for PAH cations (Hirata et al 2003) The computational spectra show that nitrogen plays an important role in determining the nature as well as the trends of the observed transitions We conshyclude this paper by considering the role these PANH spectra play in pumping the mid-IR emission features and the weak broadshyband structure they could superpose on the NIR portion of the interstellar extinction curve
The work is presented as follows The experimental and theoshyretical techniques are summarized in x 2 and the spectroscopic results are presented in x 3 where they are compared with related experimental and computational studies Astrophysical considshyerations are discussed in x 4 and the conclusions are presented in x 5
2 EXPERIMENTAL AND THEORETICAL METHODS
21 Experimental Methods
The matrix isolation infrared spectroscopy techniques emshyployed in these studies have been described in detail previously (Hudgins amp Allamandola 1995a Hudgins amp Sandford 1998) and will be summarized here only briefly Matrix-isolated PANH samples were prepared by vapor codeposition of the species of interest with an overabundance of argon onto a 14 K CsI winshydow suspended in a high-vacuum chamber ( p lt 10 -7 Torr) The samples were vaporized from heated Pyrex tubes while argon was admitted through an adjacent length of copper tubing cooled by liquid nitrogen N2(l ) Deposition temperatures for the individual PANHs are provided in Table 1 Estimates based on the characteristic band intensities of PANHs and the calishybrated argon deposition rate place the Ar PANH ratio in these experiments in excess of 10001 (Mattioda et al 2005a) The PANH samples utilized in this investigation were obtained from a variety of sources Phenazine 1-azabenz[a]anthracene 2-azabenz[a]anthracene and dibenz[a j]anthracene samples were obtained from the National Cancer Institutersquos chemical Carcinshyogen Reference Standard Repository operated by the Midwest Research Institute andwere of unspecified purity Benz[c]acridine benz[a]acridine dibenz[a j ]acridine dibenz[ch]acridine dibenz[ah]acridine and dibenz[ac]acridine were obtained from the Chiron Chemical Company and have a purity greater than 99 Acridine (97) 12 benz[a]anthracene (99) and anthracene (99) were obtained from the Aldrich Chemical Company Although the purity of the samples in this investigashytion varied the absence of any notable discrepant mid-infrared spectral features between the theoretical and experimental specshytra indicates that impurity levels are no more than a few percent (Mattioda et al 2005a)
With the exception of benz[a]anthracene (Mattioda et al 2005b) the near-infrared (NIR) spectra reported here were meashysured at 2 cm -1 or higher resolution by co-adding 500 scans or more on a Digi Lab Excalibur 4000 Fourier transform infrashyred spectrometer The spectra covered the 15000Y3500 cm -1
(066 Y286 microm) range Mid-infrared spectra (4000 Y500 cm -1 25 Y20 microm) were measured for each of these samples as well and will be reported elsewhere (A L Mattioda et al 2008 in preparation) Spectra from 15000 Y9000 cm -1 (067Y111 microm) were collected using the spectrometerrsquos NIR source (Tungsten lamp) quartz beam-splitter and silicon detector Using the same NIR source and quartz beam-splitter PANH spectra between 11000 and 3500 cm -1 (091Y286 microm) were recorded by a liquid nitrogen cooled MCT-B detector Spectra between 7000 and 500 cm -1 (143Y20 microm) were collected using the same MCT-B detector in combination with a KBr beam-splitter and Globar source The number of scans was chosen to optimize both the signal-to-noise ratio and time requirements of each experiment PANH ions were generated by in situ vacuum ultraviolet phoshy
tolysis of the matrix-isolated neutral PANH compound This was accomplished with the combined 120 nm Lya (101 eV) and the 160 nm molecular hydrogen emission bands (centered around 78 eV) from a microwave powered discharge in a flowing H2 gas mixture at a dynamic pressure of 150 mTorr Comparison of the pre- and post-photolysis mid-infrared spectra permits idenshytification of PANH ion features (eg Hudgins amp Allamandola 1995b) and allows for the determination of the ionization percent of the sample (eg Mattioda et al 2003) Assuming that all neushytral PANH molecules that disappear are converted into ions we can derive an upper limit to the ionization efficiency by meashysuring the percent decrease in the integrated areas of the neutral mid-infrared bands that accompany photolysis Ionization effishyciencies for PAHs are typically between 15 and 20 but vary based on PAH size and structure However as noted in previous studies (Mattioda et al 2003 2005a) PANHs typically exhibit ionization efficiencies between 5 and 15 In this inshyvestigation the anthracene sample obtained a 10 ionization acridine 8 phenazine 6 1-azabenz[a]anthracene 19 2-azabenz[a]anthracene 6 benz[a]acridine 5 benz[c]acridine 6 dibenz[a j ]anthracene 4 dibenz[a j ]acridine 7 dibenz[ch]acridine 5 and dibenz[ac]acridine 9 The reshysults of benz[a]anthracene were taken from an earlier investishygation (Mattioda et al 2005b) To confirm the attribution of a photoproduct band in both the mid and near-infrared spectrum to the PANH cation parallel experiments were conducted in which the argon matrix was doped with NO2 an electron accepshytor at a concentration of approximately 1 part in 1200 The presshyence of this electron acceptor quenches the formation of anions and enhances the production of cations As in our PAHNIR specshytroscopic studies we find that in addition to cations PANH anions are also produced in some cases However in the nonshynitrogenated PAH study anions were formed only for the aroshymatics containing more than 10 rings and not for the smaller PAHs This difference in behavior arises because the larger PAHs have electron affinities which are sufficiently high to capture and retain the photoelectrons under these experimental conditions and this is not the case for the smaller PAHs Interestingly alshythough the PANHs studied here are small comprising nomore than 5 rings two (benz[a]acridine and benz[c]acridine) show evidence for some anion formation The bands at 12860 and 13370 cm -1
in benz[a]acridine and 13100 cm -1 in benz[c]acridine (Fig 2) are not present in the NO2 doped experiments Computed adiashybatic electron affinities (using the DFT methods discussed in x 22) are listed in Table 2 It is interesting to note that anion bands were detected in a previous mid-IR study of phenazine (Mattioda et al 2005a) but this investigation revealed no NIR bands that could be attributed to anions The total number of PANH molecules was determined by
taking the ratio of the sum of the experimental integrated band
1247 No 2 2008 PANH CATIONS NEAR-IR SPECTROSCOPY
TABLE 2 Comparison of the Calculated and Experimental Absorption Energies (eV)
Calculated Experimental
Transition Transition CalculatedNeutral
Energy Energy hS 2i Electron Affinity
Cation (eV ) (eV ) ( TDA) (eV )
anthracene 197 17154 07911 0559
Acridine 167 14018 07922 0892
phenazine 144 11803 07945 1312
benz[a]anthracene 166 14701 0783 0599
1-azabenz[a]anthracene 176 14972 0782 0640
2-azabenz[a]anthracene 182 15823 0788 0860
benz[a]acridine 142 11047 07782 0914
benz[a]acridine (anion) 182 15947 07798 benz[a]acridine (anion) 216 16579 07755 benz[c]acridine 143 11468 07737 0880
benz[c]acridine (anion) 185 16242 07796 dibenz[ac]acridine 072 06471 07732 0916
dibenz[a j ]anthracene 148 12632 07774 0628
dibenz[a j ]acridine 127 09717 07761 0926
dibenz[ch]acridine 129 09939 07774 0867
dibenz[ah]acridine 108 08733 07707 0899
dibenz[ac]acridine 159 14468 07769 0916
NotemdashListed hare are the calculated transition energies and electron affinities for the PANHs listed in Table 1 Experimental transition energies are listed for comparison as well as a measure of the quality of the fit (hS 2i)
intensities between 1500 and 500 cm -1 (625 Y20 microm) to the total theoretical sum for the same region This range was chosen to exclude the contributions of (1) the far-infrared bands (v lt 500 cm -1) that were not measured in the experiment (2) the C-H stretching bands whose intensities are substantially overestimated by the calculations (Bauschlicher amp Langhoff 1997 Hudgins amp Sandford 1998) and (3) the overtone combination bands in the 2000 Y1650 cm -1 (5Y61 microm) region whose intensities are not calculated in the theoretical results This method takes advantage of the fact that although there may be significant band-to-band variability in the accuracy of the calculated intensity the total intensity is generally accurate to 10 Y20 excluding the C-H stretching region Based on the total surface density of absorbers (N ) and the upper ionization limit (determined by the percent
accompanying photolysis) one can calculate the number of ions present in each experiment and thus the integrated band strengths (A value in km mol -1) for each band These are presented in Table 1 Using these values the spectra shown in Figures 1 2 and 3 have been normalized to the same number of ions (1 1015) Based on multiple experiments ionization conversion efficienshycies and strong absolute band strengths the uncertainty in band area determination and ultimate absorption strength is less than a factor of 2 for the entries in Table 1
For presentation purposes only the spectra have been baseline corrected and in some instances filtered to lower noise and the gas-phase CO2 purge contaminant features have been removed using theWin-IR Pro Software package No further data reduction
decrease in the integrated areas of the neutral mid-infrared bands
Fig 2mdashArgon matrix-isolated near-IR absorption spectra for the benzan-Fig 1mdashArgon matrix-isolated near-IR absorption spectra for the anthracene thracene 1-azabenz[a]anthracene 2-azabenz[a]anthracene benz[c]acridine and
(C14H10) acridine (C13H9N) and phenazine (C12H8N2) cations Spectra have benz[a]acridine cations All the PANHs are isomers with the formula C17H11N been normalized to an equivalent number of ions (1 1015) Spectra have been normalized to an equivalent number of ions (1 1015)
1248 MATTIODA ET AL Vol 680
Fig 4mdash Correlation of calculated vertical excitation energies with experishymental absorption energies for the molecules considered in this study
Fig 3mdashArgon matrix-isolated near-IR absorption spectra for the dibenshyzanthracene dibenz[a j ]acridine dibenz[ch]acridine dibenz[ah]acridine and dibenz[ac]acridine cations All the PANHs are isomers with the formula C21H13N Spectra have been normalized to an equivalent number of ions (1 1015)
was necessary All numerical values used to derive the informashytion in Table 1 were obtained from the original (unaltered) data
22 Theoretical Methods
All calculations were performed on an Apple XServe Power PC G5 computer cluster using the Q-Chem 30 program package (Shao et al 2006) The ground-state geometry of all ions was opshytimized ignoring any apparent symmetry and vibrational frequenshycies were also computed to characterize the stationary points using unrestricted Kohn-Sham density functional theory with the B3LYPhybrid density exchange functional (Becke 1993Hertwig amp Koch 1997) with the 6-311 G basis set for cations (Frisch et al 1984) Subsequently vertical excitations were calculated using time-dependent density functional theory (TDDFT Dreuw amp Head-Gordon 2005) at the unrestricted UB3LYP6-311 G level Diffuse functions were not required owing to the very comshypact nature of excited states of cations Oscillator strengths and attachment-detachment densities were also computed using full TDDFT Values of the hS2i operator for excited electronic states were calculated using the Tamm-Dancoff approximation (Hirata et al 1999 ) to TDDFT The level of spin contamination in the excited states (the deviation from ideal hS2i values was less than 00445 in all cases which is quite acceptable
3 RESULTS
The near-infrared (NIR) spectra of the PANHs listed in the exshyperimental section are shown in Figures 1 2 and 3 The names formulae structures deposition temperatures individual and total integrated band strengths and oscillator strengths are provided in Table 1 The PANHs are grouped and discussed as members of the corresponding non-nitrogenated parent PAH class The NIR PANH spectra of the anthracene family are shown in Figure 1 the benzanthracene family in Figure 2 and the dibenzanthracene family in Figure 3
31 Theoretical Results
As shown in Figure 4 and Table 2 the calculated vertical excitation energies generally agree well with the experimental data predicting the absolute energies within roughly 025 eV
This level of accuracy is roughly consistent with that seen for a very wide range of PAH cations (Hirata et al 2003) The comshyputational results provide a simple intuitive model for undershystanding the absorption spectra in these related molecules In all but one special case discussed below the low-lying exshy
cited state with significant electronic absorption chiefly resulted from the promotion of an electron in the donor orbital into the lowest unoccupied molecular orbital (the acceptor orbital) The donor molecular orbital was frequently the second-highest ocshycupied beta orbital but not always To understand the effect of nitrogen substitution in terms of the relative stabilization of the donor and acceptor orbitals the electronic excitation can be viewed as a simple single electron transition from the donor to acceptor orbital Due to its greater electronegativity than carbon N substitution stabilizes an orbital that has substantial amplitude (electron density) on the atom where the nitrogen substitution occurs but has relatively little effect on orbitals that have nodes (no electron density) or small amplitude on the C that is subshystituted by N Thus either redshifts or blueshifts are possible for the electronic transition Figure 5 demonstrates how this effect on the molecular orbitals of anthracene and acridine produces a redshift The nitrogen atom in most of the PANHs examined here were
substituted in a position where the acceptor orbital possessed significant electron density but the donor orbital did not leading to an increase in stabilization resulting in a redshift of the elecshytronic transition The calculations also correctly predict the relshyative amount of shift However a caveat must be imposed if the nitrogen substitution introduces a large change in the geometry of the molecule (if for example a hydrogen which was in steric contact with another is replaced with the lone pair of electrons on a nitrogen atom) Of course such a substitution changes the shape of the orbitals in play but it also mixes new excitations into the transition that compromise this simple model
32 Near-Infrared Spectra of the Cations of the Nitrogenated Anthracenes Acridine and Phenazine
Figure 1 shows the 14500 Y4000 cm -1 (0690 Y25 microm) specshytra of the anthracene acridine and phenazine cations Peak posishytions and intensities are listed in Table 1 The NIR spectrum of the acridine cation shows one strong broad band (FWHH gt 500 cm -1) with a prominent shoulder to the blue The spacing between the shoulder and main peak is roughly 1500 cm -1 a value similar to the vibronic spacing found for many PAH cations reported previously (Andrews et al 1985 Mattioda et al 2005b)
1249 No 2 2008 PANH CATIONS NEAR-IR SPECTROSCOPY
Fig 5mdash Molecular orbital diagram depicting the effect of nitrogen substitushytion on the electron donor (top) and acceptor (bottom) orbitals of the anthracene (left) and acridine (right) cations The corresponding energy levels are given in the center The size of the gap between these levels largely determines the transhysition energy In the case shown here the absorption in acridine is redshifted relative to anthracene
Assigning the strongest acridine cation NIR absorption band which peaks near 11300 cm -1 to the 0Y0 transition the 1500 cm -1
spacing corresponds to the first member of the progression inshyvolving the C-C stretching vibration However the NIR specshytrum of the dinitrogenated PANH phenazine does not exhibit such a progression
The shapes of the donor and acceptor orbitals varied slightly with each geometry but transitions of all these molecules can be understood as perturbations on the Au B3g transition of the anthracene cation (as shown in Fig 5) The red and blue surfaces in these diagrams represent the electron density and the magnishytude of the density present in the molecular orbitals respectively As discussed in x 31 the presence of a node falling at the poshysition of nitrogen substitution in the donor orbital and the inshycrease in electron density at that position in the acceptor orbital predict that nitrogen substitution should lower the energy of the acceptor orbital without changing the energy of the donor orbital (see Fig 5) Based on this analysis nitrogen substitution of one of the central carbon atoms in anthracene should decrease the energy gap between the electronic states lowering the excitation energy and resulting in a redshift of the absorption band This is borne out in the experimental results with anthracenersquos main band situated around 13800 cm -1 followed by acridine at 11306 cm -1 and phenazine at 9520 cm -1
33 Near-Infrared Spectra of the Cations of the Nitrogenated Benz[a]anthracenes 1-azabenz[a]anthracene 2-azabenz[a]anthracene Benz[c]acridine
and Benz[a]acridine
Figure 2 shows the 14500 Y4000 cm -1 (0690 Y25 microm) spectra of the benz[a]anthracene 1-azabenz[a]anthracene 2- azabenz[a]anthracene benz[c]acridine and benz[a]acridine catshyions Peak positions and band intensities are listed in Table 1 As with the nitrogenated anthracenes the NIR spectra of these nitrogenated benz[a]anthracene cations are dominated by a single broad band The 1-azabenz[a]anthracene benz[c]acridine and benz[a]acridine cations show clear vibronic structure about 1500 cm -1 to the blue of the strongest band As in the case of acridine discussed above this spacing corresponds to the first member of the progression involving the C-C stretching vibrashytion The spectrum of 2-azabenz[a]anthracene does not appear to show this structure but rather has a prominent blue shoulder with a subpeak roughly 500Y600 cm -1 to the blue TheNIR spec-
Fig 6mdash Donor (bottom) and acceptor (top) molecular orbitals of benz[a]anthracene The positions of nitrogen substitution in 1-azabenz[a]anthracene 2-azabenz[a]anthracene benz[a]acridine and benz[c]acridine are indicated in the bottom (donor orbital) picture
tra of photolyzed benz[c]acridine and benz[a]acridine are the only PANHs we have studied which exhibit anion features For benz[c]acridine a weak anion band peaks near 13100 cm -1 and in the spectrum of benz[a]acridine here two weak anion bands are evident around 12900 and 13400 cm -1
Although both benz[a]acridine and benz[c]acridine exshyhibit redshifts in peak positions similar to those observed for nitrogen insertion in the anthracene series when nitrogen is inserted in the pendant ring in 1-azabenz[a]anthracene and 2-azabenz[a]anthracene the main peak is blueshifted with reshyspect to its position in benz[a]anthracene
Applying the simple one electron orbital analysis developed above to the donor and acceptor orbitals of the parent PAH benz[a]anthracene (Fig 6) explains both the redshift for benz[a]acridine and benz[c]acridine and blueshifts for 1-azabenz[a]anthracene and 2-azabenz[a]anthracene relative to the parent PAH In the first two cases the substitution of a nitrogen atom at a position of low electron density in the donor orbital but high electron density in the acceptor orbital narrows the energy gap resulting in a redshift of the bands (see Figs 2 and 6) The experimental results confirm this effect with 12 benzanthracene exhibiting its main absorption feature at 11215 cm -1 while benz[a]acridine and benz[c]acridine main absorptions occur at 8910 and 9250 cm -1 respectively Howshyever the situation is different for 1-azabenz[a]anthracene and 2-azabenz[a]anthracene where the position of nitrogen substishytution has a greater electron density in the donor orbital relative to the acceptor orbital in the parent PAH (see Fig 6) Thus the energy of the donor orbital decreases more than the energy of the acceptor orbital and so the gap between the two which is
1250 MATTIODA ET AL Vol 680
tied to the excitation energy increases on nitrogen substitushytion resulting in a blueshift This shift is evident in Figure 2 where the absorption feature for 1-azabenz[a]anthracene and 2-azabenz[a]anthracene fall at 12076 and 12762 cm -1
As noted previously the presence of an anion was noted in the spectra of benz[a]acridine and benz[c]acridine The electron affinities of the neutral species considered in this study were also estimated by calculating the difference between the electronic energy of the neutral and the anion at their optimized geometries ( both with the 6-311+G basis set) The calculated electron affinities reproduce trends one would expect increasing with nitrogen substitution and the size of the conjugated system (Table 2) The two species with anion bands had high electron affinities compared to their four-ringed non-nitrogenated peers as expected but are not exceptional with respect to the other nitrogenated PANHs considered here
34 Near-Infrared Spectra of the Cations of the Nitrogenated Dibenzanthracenes Dibenz[a j]acridine Dibenz[ch]acridine
Dibenz[ah]acridine and Dibenz[ac]acridine
Figure 3 shows the 14500 Y4000 cm -1 (069 Y25 microm) cation spectra of dibenz[a j ]anthracene compared to its nitrogen-substituted dibenz[a j]acridine and dibenz[ch]acridine analogs as well as the spectra of dibenz[ah]acridine and dibenz[ac]acridine cations The peak positions and band intensities for all molecules are listed in Table 1 As shown in Figure 7 the donor orbitals for the parent PAH dibenz[a j ]anthracene exhibit very little if any electron density on the central carbon atoms Thus based on the previous discussions one would expect nitrogen substitution in either the [a j ] or [ch] positions to produce a redshift in the band positions Furthermore the small amount of electron density at the [ch] position versus a node at the [a j ] position should result in slightly less of a redshift for dibenz[ch]acridine This matches quite nicelywith the experimental results Dibenz[a j]anthracenersquos main absorption feature is at 9773 cm -1 which becomes red-shifted to 8016 cm -1 on insertion of a nitrogen atom at the [ch] position forming dibenz[ch]acridine Placement of the nitrogen atom in the [a j ] position results in the band center being shifted to 7837 cm -1 (see Table 1 and Fig 3) Dibenz[ah]acridine which is unrelated to dibenz[a j ]anthracene exhibits its main absorpshytion feature at 7044 cm -1
The vibronic structure of the prominent bands in the NIR spectra of all these PANH cations is striking and somewhat unshyusual for the PAHs and PANHs studied to date In all four cases the most prominent transition is blendedwith a band centered apshyproximately 400 cm -1 to the blue and has a separate weaker companion with a spacing of about 1500 cm -1 Mattioda et al (2003) reported that the insertion of nitrogen into a PAH tends to enhance the strength of the C-C and C-H in-plane vibrations similar to the effect observed on ionization Likewise as discussed in Mattioda et al (2003 2008 in preparation) the presence of nitrogen in a position para (opposite) to a C-H group tends to greatly enhance a C-C in-plane vibration around 1400 cm -1 As previously discussed the 1500 cm -1 vibronic spacing is most likely due to the enhanced C-C and C-H in-plane modes Unforshytunately the source of the 400 cm -1 spacing is ambiguous partly due to the limited spectroscopic data below 500 cm -1
Interestingly the NIR spectrum of dibenz[ac]acridine shows evidence for two different electronic transitionswith 0Y0 positions near 5200 and 11700 cm -1 The computed vertical excitation spectrum explains both absorptions and their relative energies The experimental peak near 5200 cm -1 resembles the anthraceneshytype transition in terms of transition dipole orbital contributions and attachment-detachment densities (Head-Gordon et al 1995
Fig 7mdashDonor (bottom) and acceptor (top) molecular orbital for dibenz[a j ]anthracene The nitrogen atom positions for dibenz[ch]acridine and dibenz[a j ]acridine are indicated in the figure
see below) Relative to its parent PAH which is not included in the experimental data set the simple model predicts that it should be redshifted by nitrogen substitution in dibenz[ac]acridine TDDFT calculations on that compound support this conclusion The higher energy transition at 11700 cm-1 results from a state unlike those seen in the other molecules Unlike the single donor molecular orbitals observed for the other PANHs and PAHs disshycussed the TDDFTexcitation for dibenz[ac]acridine contains significant contributions from four donor orbitals one of which is shown in Figure 8 In cases such as this it is useful to examine the attachment-detachment electron densities which schematishycally picture themovement of electron density in a before (ground state) Yand Yafter (excited state) fashion instead of the donor acceptor orbitals As shown in Figure 8 the nitrogen atom is subshystituted in a position of low electron density in the electron detachment density ( ie in lieu of the donor orbital) but high electron density in the electron attachment density (ie in lieu of the acceptor orbital) Thus according to our results one should expect to observe a redshift from the band position in the nonshynitrogenated parent PAH (dibenz[ac]anthracene) Although dibenz[ac]anthracene was not measured experimentally the calshyculations predict this transition to occur at a higher frequency than that observed in the nitrogenated PAH The plots demonshystrate that the high-energy transition is another sort of J J
excitation
35 Near-Infrared Band Intensities
Integrated absorbance values (km mol -1) for the bands in the spectra shown in Figures 1 2 and 3 are listed in Table 1 As in Mattioda et al (2005b) the band strengths of these electronic
1251 No 2 2008 PANH CATIONS NEAR-IR SPECTROSCOPY
Fig 8mdash Electron distributions for the dibenz[ac]acridine 11700 cm -1 excitation The first image is one of the four donor beta orbitals The electron detachment density to be used in lieu of the donor orbital is the second image while the third image represents the electron attachment density to be used in lieu of the acceptor orbital image
transitions are presented in oscillator strength f and in units of km mol -1 to facilitate comparisons with mid-IR band strengths which are normally presented in km mol -1 See Mattioda et al (2005b) for a detailed description of the procedure used to deshytermine these absorption strengths The oscillator strength was determined by multiplying the total integrated absorbance by 187 10 -7 mole km -1 (Kjaergaard et al 2000)
For the transitions of the PANHs considered here the oscilshylator strengths range from 13 10 -3 to 42 10 -2 a range someshywhat similar to that reported for PAHs of approximately the same size in Mattioda et al (2005b)
A comparison can be made between the nitrogenated PAH and its parent molecule For the anthracene series it appears that the insertion of a single nitrogen has little impact on the total osshycillator strength While anthracene exhibits an oscillator strength of 90 10-3 acridine has a value of 60 10 -3 The oscillator strength is lowered to 31 10 -3 for phenazine which contains two nitrogen atoms This is similar to the trend displayed in the calculated values which shows phenazine exhibiting a slightly lower oscillator strength than either anthracene or acridine
TDDFT is often a useful tool for predicting trends in oscillator strengths (Halasinski et al 2003) although they are more prone to error than the transition frequencies themselves (Appel et al 2003) The B3LYP hybrid functional has been used for this purshypose in the past (Zdetsis et al 2001) however in this instance the agreement with experiment is somewhat unsatisfactory alshythough similar to that observed in Mattioda et al (2005b) The neglect of Franck-Condon factors in the calculation of the vershytical excitation spectrum may be partly responsible for the difshyference between calculated and experimental oscillator strengths Likewise the comparison of gas-phase values (theoretical calshyculations) to matrix-isolated experimental values may be responshysible for some of the differences Still some basic things can be inferred from the transition moment The molecules with a C2
symmetry axis perpendicular to the plane of the molecule have a transition moment directed with the long axis Thus the subshystitution of carbon for nitrogen in the center of the molecule should not have a large effect on the transition dipole and by asshysociation the oscillator strength This is in line with the experishymental observations for the three-ringed systems and certainly in agreement with the calculations
For the benz[a]anthracene series it is difficult to tell what influence nitrogen insertion has on the oscillator strength of the NIR transition The total oscillator strengths for 1-azabenz[a]anthracene and benz[c]acridine are similar to that observed in the parent PAH approximately 2 10 -2 However the total oscillator strengths of 2-azabenz[a]anthracene and benz[a]acridine are nearly an order of magnitude lower (see
Table 1) Theoretical calculations display little variation in osshycillator strength between molecules in this series
The total oscillator strength of dibenz[a j ]acridine dibenz[ch]acridine and dibenz[ah]acridine are significantly larger than dibenz[a j ]anthracene while the transitions noted in dibenz[ac]acridine are on the same order This is in contrast to the theoretical values which display little variation between dibenz[a j]anthracene dibenz[a j]acridine dibenz[ch]acridine and dibenz[ah]acridine but a significantly lower value for the oscillator strength of dibenz[ac]acridine (see Table 1)
In spite of its fundamental astrophysical importance detershymining reliable PAH ion oscillator strengths for electronic transishytions experimentally has proven particularly challenging (Hudgins amp Allamandola 1995b Salama amp Allamandola 1991) Due to the inherent difficulty in maintaining a stable isolated PAH ion population the vast majority of spectroscopic studies have been carried out in inert gas matrices Comparisons between gas-phase and matrix-isolation spectroscopic studies with quantum calcushylations have shown that matrix perturbations are minor when studying PAH ion vibrational transitions which give rise to the well-known interstellar infrared emission bands (eg Hudgins amp Allamandola 2004 Mattioda et al 2003) and matrix-isolation studies can be directly applied to the interstellar IR emission bands This is not generally so for electronic transitions which give rise to bands spanning the UV to the NIR spectral range As discussed in Mattioda et al (2005a 2005b 2005c) the PAHNIR band shifts and FWHH variations between argon and neon mashytrices and gas-phase studies show that the matrix environment can severely perturb intrinsic electronic band positions and band shapes Electronic transition band strengths are perturbed as well The matrix influence on band strengths for electronic transitions are not only matrix dependent but are also influenced by other species present in the matrix (Hudgins amp Allamandola 1995a) To make matters worse it also appears to depend on the method of determination For example Salama et al (1994) studied the electronic transition [D2 D0] of the neon matrix isolated phenanthrene cation corresponding to the same transition reshyported in Mattioda et al (2005a 2005b 2005c) for phenanthrene in an argon matrix Salama et al (1994) calculated the number of phenanthrene ions produced from the reduction in the absorshybance of the neutral phenanthrene electronic bands in the UV This is in contrast to the method employed by Mattioda et al (2005a 2005b 2005c) the same method employed here in which the number of phenanthrene ions produced is determined by the reduction in the absorbance of the neutral phenanthrene vibrational bands in the mid-IR The discrepancy is unacceptshyably large Salama et al report an f value of 6 10 -5 for this phenanthrene cation transition in a neon matrix while Mattioda
1252 MATTIODA ET AL Vol 680
et al report f frac14 35 10-3 from the argon matrix data These values are to be compared with theoretical values which range from 0096 to 016 It is also interesting to note that Brechigna amp Pino (1999) measured this transition for the phenanthrene cation in the gas phase They determined an oscillator strength of 0150 which is in good agreement with the theoretical predictions but at odds with the matrix work Another example of a significant discrepancy originating in the method used to determine the numshyber of ions produced is provided by the anthracene cation Our value of 0009 for the oscillator strength of the 13835 cm -1 band of the anthracene cation in an argon matrix is an order of magshynitude lower than the value of 008 measured for the anthracene cation in argon matrix by Szczepanski et al (1993) In this case the value determined by Szczepanski et al (1993) is in better agreement with the theoretical prediction of about 01
To the best of our knowledge the pyrene and coronene cations are the only other PAH cation for which theoretical and experishymental NIR experimental oscillator strengths have been reported In contrast to the theoretical value of 0015 for the [J J-2]0
transition in pyrene (Hirata et al 2003) Vala et al (1994) report f 0005 compared to value of f 00015 (Mattioda et al 2005a 2005b 2005c) For coronene however the agreement is better Hirata et al (2003) predicted a value of 0006 for the [J J-3] transition while Ehrenfreund et al (1995) have meashy0
sured the NIR spectrum for the coronene cation isolated in an argon matrix and determined f 0005 a value that compares favorably with the f 0006 reported by Mattioda et al (2005a 2005b 2005c) In summary there is a large variation in reported PAH ion oscillator strengths regardless of means of determinashytion In those cases for which argon matrix data is available difshyferences of a factor of 2Y10 are encountered Inspection of Table 1 in Mattioda et al (2005a 2005b 2005c) shows that when theoshyretical data are available most of the experimental values are 13Y10 times smaller For the PANH NIR spectra reported here the experimental values vary between 5 and 15 times smaller than the theoretical results The origin of this serious discrepancy beshytween the few available gas-phase oscillator strength and matrix values is unknown but may be related to the evaluation of the density of cations in the matrix
4 ASTROPHYSICAL CONSIDERATIONS
The spectra shown in Figures 1 2 and 3 and corresponding absolute absorption strengths listed in Table 1 illustrate that PANH cations have NIR transitions that should be taken into account when evaluating the effects of PAHs and PANHs on the intershystellar radiation field Following Mattioda et al (2005b) we conshysider two applications that impact observations the role of NIR photons in pumping the mid-IR PAHPANH emission bands and the possibility that PANHs can impose broadband structure on the interstellar extinction curve in addition to contributing to the discrete diffuse interstellar bands (DIBs)
However before proceeding further it is necessary to disshycuss two issues concerning the previous PAH NIR investigation (Mattioda et al 2005b 2005c) which came to light during the course of the PANH NIR investigation Although neither issue impacts the relevant findings of the earlier investigation these items should be addressed The first issue relates to equation (5) of Mattioda et al (2005c) A programming error resulted in incorrect parameters being reported for S1 S2 and S3 of equation (5) in Mattioda et al (2005c) here corrected as our equation (1)
1PAH 2(k) cmabs frac14 35 10 -19-145k=microm thorn S1 thorn S2 - S3 eth1THORN NC C atom
TABLE 3 Corrected Parameters for Mattioda et al 2005c Equation (5)
our Equation (1)
k j Aint j
Drude (microm) 1j (cm2 microm -1 C -1)
S1 105 0055 20 10 -20
S2 126 011 78 10 -21
S3 1905 009 1465 10 -22
Gaussian k0 wj A (microm) (cm2 microm -1 C -1)
G 1185 02985 140 10 -20
where Sj represents Drude profiles given by
2 1jkjAint jSj(k) frac14 eth2THORN
J (k=kj - kj =k)2 thorn 12 j
For this equation 1j is a broadening parameter kj is the central wavelength of a feature in microm and Aint j is the integrated abshysorption strength expressed in cm per C atom (1int j in Draine amp Li 2001) The correct parameters are listed in Table 3 The second issue concerns the impact of this adjustment on
the NIR PAH portion of the graphs presented in Figure 8 of Mattioda et al (2005b) and Figure 1 in Mattioda et al (2005c) which represent the composite spectrum of 27 equally weighted PAH spectra We have improved our spectral averaging routine A comparisonbetween the newPAHcomposite spectrum is shown with the originally published data in Figure 9 As one can see the differences between the old and new composites are minor with the most obvious differences being a narrowing of the 1 microm feashyture and elimination of the small bands at 166 and 175 microm These differences were caused by a transcription error which resulted in the spectrum of one PAH molecule being given more weight in the overall average The overemphasis of this moleshycule was responsible for the 166 and 175 microm features as well as the broadening of the 1 microm band Finally we should also menshytion the dip that occurs around 19 microm in the original composite spectrum Figure 9 shows that CO2 overtone bands from the purge gas produce an artifact at this position Although the changes result in a slightly altered composite
spectrum they do not change the overall conclusion that open-shell PAHs exhibit NIR absorptions which could pump mid-IR emission in areas of low UV flux as well as add detectable strucshyture to the interstellar extinction curve
41 Pumping the Mid-IR PAHPANH Emission Features with NIR Photons
An important long-standing issue concerning the model that IR fluorescence from highly vibrationally excited PAHs is responsible for the interstellar mid-IR emission features involves the excitation mechanism To properly test this aspect of the PAH excitation emission model and put it on as quantitative a footing as possible requires a deeper understanding of the complete UVshyvisual-NIR spectroscopic properties of PAHs and related species (ions hetero-atom substituted etc) than is currently available This NIR spectroscopic study of PANH cations contributes some of this information The experimental NIR spectra for a wide variety of PAH ions
has permitted a revision in the PAH ion optical radiation abshysorption model (Mattioda et al 2005a) A semiempirical model
1253 No 2 2008 PANH CATIONS NEAR-IR SPECTROSCOPY
Fig 9mdash Comparison of initial PAH composite spectrum with the revised PAH composite and the Draine amp Li curve Note the purge CO2 overtones overshylapping the 19 microm feature
which takes into account the significant NIR absorption features of PAH ions has been proposed (Mattioda et al 2005b) After combining these PAH cation NIR spectroscopic properties with the Draine amp Li (2001) PAH UV-visual optical model a comshyparison was made between the energy absorbed by PAH ions in the NIR and that of the UV-visual region for a wide array of stellar classes This comparison reveals that for lower temperashyture stars NIR energy absorption becomes increasingly imporshytant matching the energy absorbed from the UV-visual for late K andM stars Thus even in areas of low UV flux absorption in the NIR could stimulate mid-IR emission from PAH ions In a recent publication Draine amp Li (2007) have incorporated these optical radiative properties as part of a very thorough and comshyplete model of interstellar extinction and dust radiative propershyties that is used to interpret Spitzer observations of a very wide variety of objects
Here we revisit the semiempirical PAH optical property model presented by Mattioda et al (2005b) and incorporate the NIR spectroscopic properties of PANH ions presented here
The upper portion of Figure 10 displays the revised PAH NIR composite spectrum as well as the composite spectrum of the 10 PANH ions that were part of this investigation Although it extends slightly more into the red the composite peak of the PANH spectrum nicely matches that of the PAH spectrum The main difference on averaging the PANH and PAH data (see lower portion of Fig 10) is the slight extension of the composite lsquolsquobumprsquorsquo into the red (by lt01 microm)
Figure 11 displays the composite PAH PANH NIR cation spectrum as well as the fit to this new data This fit is given by
1PAH 2(k)abs cm A -2(k-k0)2 =wfrac14 14 10 -192-134k=microm thorn pffiffiffiffiffiffiffiffi e 2
NC C atom w J=2
eth3THORN
where the wavelengths are in microm k0 is the center of the peak in microm w is twice the standard deviation of the Gaussian distribushytion (2 1) or approximately 0849 the width of the peak at half height in microm and A is the area under the peak The actual values for the Gaussian portion of the curve are provided in Table 3 These
Fig 10mdash Top Comparison of the PAH composite NIR spectrum comprising 27 PAH ions vs the PANH composite spectrum composed of 10 PANH ions with the original Draine amp Li (2001) astronomical PAH spectrum Bottom Comparshyison of the PAH composite and the total PANHPAH composite spectrum with the initial Draine amp Li (2001) astronomical PAH spectrum
parameters are valid for the region between 082 and 182 microm after this point the baseline becomes a nearly constant value of 335 10-22 cm2C atom
Equation (3) and Figure 11 reveal that the overall character of the composite PAH PANH NIR cation spectrum can be fit reasonably well with a single Gaussian curve centered around 1185 micromOf course such a fit neglects the substructure apparent in Figure 11 However each component of the apparent substrucshyture is the result of one or two fairly intense PAHPANH cation bands The intent of this fit is to provide a model for the absorpshytion of a mixture of open-shell PAH and PANH molecules in the interstellar environment The new composite PAH-PANH specshytrum is the result of 38 equally weighted PAH and PANH cation spectra In the interstellar environment one would expect a more complex mixture of PAH species exhibiting different weights for each of the species As Figure 11 demonstrates such a mixture should result in a feature visible around 12 microm not accounting for the matrix shift Such a matrix shift as pointed out inMattioda et al (2005b) may produce a similar band but redshifted by 100 cm -1 aswas the case for the phenanthrene cationOf course
sharper features may be evident on the extinction curve if a few astronomical PAHs or PANHs are particularly strong This is disshycussed in further detail below
1254 MATTIODA ET AL Vol 680
Fig 11mdashFit to the PANH+PAH NIR composite spectrum using eq (3) and the parameters listed in Table 3
42 Interstellar PAHs and the Extinction Curve
There is overwhelming evidence that ionized PAHs are wideshyspread throughout the diffuse ISM (Mattila et al 1996 Onaka et al 1996) As shown in the previous section NIR transitions in these and PAH-related species such as PANHs could impose detectable structure on the extinction curve Here we extend our earlier estimation of the extent to which this is possible (Mattioda et al 2005a) to include PANHs As in the PAH study the cases considered are somewhat contrived as there are likely many hundreds if not hundreds of thousands of different PAHPANH molecular structures that could contribute spectroscopic structure to the extinction curve Knowing neither the different structures nor their corresponding spectra we approximate the situation as follows Using the standard relationship NHE(B - V ) frac14 58
-21021 atoms cm mag -1 (Bohlin et al 1978) where NH is the number of hydrogen atoms per cm2 along the line of sight and E(B-V) is the reddening expressed in magnitudes Taking 3 10 -4 for the cosmic CH ratio the number of carbon atoms per
2cm per E(B-V ) becomes NCE(B - V ) frac14 17 1018 Assumshying 10 of the available cosmic carbon is in the form of free PAHs (eg Allamandola et al 1989 Puget amp Leger 1989) the number of C atoms tied up in free PAHs per cm2 per E(B-V ) is then NC-PAHE(B - V ) frac14 17 1017 This is however a very conservative lower limit for the total amount of cosmic carbon tied up in PAH structures since the 10 value for the amount of available carbon in PAHs holds for those contributing to the mid-IR emission features Larger PAHs PAH clusters and amorphous carbon particles rich in PAH structures that do not contribute to the mid-IR features must also be present and many of these will also have NIR transitions However for the sake of this analyshysis we assume an average of 50 C atoms per PAH In this case
-2NPAH frac14 34 1015E(B - V ) molecules cm Assuming a situation in which 10 of the PAHs in the total
PAH ion population all absorb at nearly the same wavelength the optical depth (T frac14 ln IoI ) of a band in the NIR portion of the extinction curve produced by these PAHs is estimated as follows The spectra and integrated absorbance values presented in x 3 show that PAH cations containing between 40 and 50 C atoms often possess a discrete absorption band near 9000 cm -1 (11 microm)with a FWHH 400 cm -1 ( 004microm) having integrated absorbance values (A) between roughly 16 105 and 69 105 km mol -1
(256 10 -14 and 11 10 -13 cm molecule -1) Since NPAHA
(T)dv the optical depth becomes NPAH Adv Taking A 5 10 -14 -1 cm molecule -1 dv frac14 400 cm and NPAH frac14 34 1014E(B - V ) molecules cm -2 (for 10 of the PAH ion popushylation) yields a T mag frac14 004 for an absorption band produced by these interstellar PAH molecules Thus the data presented here suggest that there should be
weak but detectable broadband structure originating in ionized PAHs and PANHs superposed on the NIR portion of the intershystellar extinction curve
CONCLUSIONS
Since very little near-infrared (NIR) spectroscopic data were available for ionized PANHs a systematic study of the NIR spectroscopic properties of argon matrix-isolated PANH ions has been undertakenHerewe report the NIR spectra and absolute band strengths of 10 nitrogen-containing polycyclic aromatic hydroshycarbon (PAH) cations These include the nitrogenated anthracenes acridine (C13H9N) and phenazine (C12H8N2) the four isoshymeric nitrogenated benzanthracenes 1-azabenz[a]anthracene 2-azabenz[a]anthracene benz[c]acridine and benz[a]acridine all with formula C17H11N and the four isomeric nitrogenated dibenzanthracenes dibenz[a j ]acridine dibenz[ch]acridine dibenz[ah]acridine and dibenz[ac]acridine all with formula C21H13N As with ionized PAHs all the ionized PANHs we have studied have strong broad absorption bands in the NIR arising from electronic transitions Oscillator strengths and integrated abshysorbance values have been determined for these NIR transitions All of these NIR spectra are dominated by a strong broad
(FWHH 500 cm -1) band corresponding to the 0Y0 transition and most show clear weaker vibronic substructure to the blue The vibronic bands correspond to progressions involving the CH out-of-plane bends and C-C stretching vibrations Some PANHs also showvibronic bandswith unusual spacingof about 400 cm -1 consistent with the difference between an unusually strong C-N-C and C-H in-plane vibration (around 1400 cm -1) and that of the C-H out-of-plane modes None of the argon matrix-isolated PANH cation NIR spectra show sharp features as is the case for some PAHs (Mattioda et al 2005a) TDDFT is an appropriate model for the large cations discussed
in this study The theoretical modeling shows that in this series of anthracene derivatives the band shift direction can be predicted by the relative magnitudes of the donor and acceptor molecular orbitals present at the position of the nitrogen substitution in the parent PAH Most of the PANHs examined here were substituted with nitrogen at a position where the acceptor molecular orbital possessed significant electron density but the donor orbital did not leading to redshifts Two astrophysical applications have also been considered
The first has to do with the radiation fields that pump the intershystellar IR emission bands The data presented here show that open-shell PANH ions have significant absorption features in the near-infrared similar to the situation for PAH ions A quantitashytive treatment of PAH and PANH optical properties spanning the UV-visual-NIR spectral is presented The second astrophysical application has to do with interstellar extinction Since the spectra of ionized PANHs show strong NIR transitions and PANHs are very likely to be present and abundant in the interstellar medium they could add detectable structure to the extinction curve A quantitative estimate is made of this potential extinction The band strengths reported here suggest that ionized interstellar PANHs should add weak broadband structure to the NIR portion of the interstellar extinction curve between 1 and 16 microm As with PAHs it is also important to keep in mind that some
structures of neutral PANHs can also have open-shell radical
1255 No 2 2008 PANH CATIONS NEAR-IR SPECTROSCOPY
electronic configurations as do the ions studied here (eg Hudgins et al 2001 2005 Szczepanski et al 2002) and thesewill also posshysess longer wavelength electronic transitions albeit likely having lower cross sections than ionized open-shell species Thus even in regions dominated by non-ionizing radiation it may be possible to detect the emission from neutral open-shell PANH species
The experimental portion of the research presented here was supported through NASArsquos Long Term Space Astrophysics (grant 907524) and Astrobiology (grant 811073) Programs AM
acknowledges the support of the National Research Council and L R acknowledges the support of The SETI Institute Summer Research Experience for Undergraduates (funded by NSF award AST-0552751) The theoretical work by M H-G T J L and J P was supported through NASArsquos Astronomy and Physics Research and Analysis Program (APRA) As always we are deeply indebted to Robert Walker for his outstanding technical support of all phases of the experimental work We also grateshyfully acknowledge earlier insightful discussions with Jan Cami concerning the impact of the NIR transitions on the extinction curve
REFERENCES
Allamandola L J Tielens A G G M amp Barker J R 1989 ApJS 71 733 Andrews L Friedman R S amp Kelsall B J 1985 J Phys Chem 89 4016 Appel H Gross E K U amp Burke K 2003 Phys Rev Lett 90 043005 Bakes E L O Tielens A G G M amp Bauschlicher C W 2001 ApJ 556 501
Bauschlicher C W amp Langhoff S R 1997 Spectrochim Acta Astron 53 1225
Becke A D 1993 J Chem Phys 98 5648 Bohlin R C Savage B D amp Drake J F 1978 ApJ 224 132 Brechignac P amp Pino T 1999 AampA 343 L49 Draine B T amp Li A 2001 ApJ 551 807 mdashmdashmdash 2007 ApJ 657 810 Dreuw A amp Head-Gordon M 2005 Chem Rev 105 4009 Ehrenfreund P et al 1995 AampA 299 213 Frisch M J Pople J A amp Binkley J S 1984 J Chem Phys 80 3265 Halasinski T Weisman J L Ruiterkamp R Lee T J Salama F amp Head-Gordon M J 2003 J Phys Chem 107 3660
Head-Gordon M Grana A Maurice D amp White C 1995 J Phys Chem 99 14261
Hertwig R H amp Koch W 1997 Chem Phys Lett 268 345 Hirata S Head-Gordon M Szczepanski J amp Vala M 2003 J Phys Chem A 107 4940
Hirata S Lee T J amp Head-Gordon M 1999 J Chem Phys 111 8904 Hudgins D M amp Allamandola L J 1995a J Phys Chem 99 3033 mdashmdashmdash 1995b J Phys Chem 99 8978 mdashmdashmdash 2004 in ASP Conf Ser 309 Astrophysics of Dust ed A NWitt G C Clayton amp B T Draine (San Francisco ASP) 665
Hudgins DM Bauschlicher CW Jr ampAllamandola L J 2001 Spectrochem Acta Astron 57 907
mdashmdashmdash 2005 ApJ 632 316 Hudgins D M amp Sandford S A 1998 J Phys Chem 102 329 Kjaergaard H G Robinson T W amp Brooking K A 2000 J Phys Chem A 104 11297
Li A amp Draine B T 2001 ApJ 554 778 mdashmdashmdash 2002 ApJ 572 232 Mattila K et al 1996 AampA 315 L353 Mattioda A L Hudgins D M Bauschlicher Jr C W amp Allamandola L J 2005a Adv Space Res 36 156
mdashmdashmdash 2005b ApJ 629 1188 mdashmdashmdash 2005c ApJ 629 1183 Mattioda A L Hudgins DM Bauschlicher CW Jr RosiM ampAllamandola L J 2003 J Phys Chem A 107 1486
Onaka T Yamamura I Tanabe T Roellig T L amp Yuen L 1996 PASJ 48 L59
Pech C Joblin C Boissel P 2002 AampA 388 639 Peeters E Allamandola L J Hudgins D M Hony S amp Tielens A G G M 2004 in ASP Conf Ser 309 Astrophysics of Dust ed A N Witt G C Clayton amp B T Draine (San Francisco ASP) 141
Peeters E Hony S Van Kerkhoven C Tielens A G G M Allamandola L J Hudgins D M amp Bauschlicher C W 2002 AampA 390 1089
Puget J L amp Leger A 1989 ARAampA 27 161 Salama F amp Allamandola L J 1991 J Chim Phys 94 6964 Salama F Joblin C amp Allamandola L J 1994 J Chem Phys 101 10252 Shao Y et al 2006 Phys Chem Chem Phys 8 3172 Szczepanski J Banisaukas J Vala M Hirata S amp Wiley W R 2002 J Phys Chem A 106 6935
Szczepanski J Vala M Dahbia T amp Ellinger Y J 1993 Chem Phys 98 4494
Vala M Szczepanski J Pauzat F Parisel O Talbi D amp Ellinger Y 1994 J Phys Chem 98 9187
Van Dishoek E F 2004 ARAampA 42 119 Verstraete L Pech C Moutou C Sellgren K Wright C M Giard M Leger A Timmerman R amp Drapatz S 2001 AampA 372 981
Zdetsis A D Garoufalis C S Grimme S 2001 Phys Rev Lett 87 276402
1244
TABLE 1
Name Formula Structure and
Related
Experimental Information
for the PANHs Investigated
Here
Band Center (cm-1)
Oscillator Strength f
Compound
Molecular
Chemical
Dep Temp
A
Name
Formula
Structure
(C)
Theor
Exp
microm
kmm
ol (103)
Exp 10 -3
Theor
10 -3
Comments
anthracene
50
15880
13835
0723
482
901
108
Small features at 11620 11190
10864 10460 10165 9520
8353 5956
C14H10
acridine
25
13444
11306
0884
319
597
108
Shoulder 12605
small feature at 9625
C13H9N
phenazine
50
11581
9520
1050
168
314
970
C12H8N2
12 bezanthracene or benz[a]anthracene
85
13369
11215
0892
784
218
106
11857
0843
147
12484
0801
234
Total
1160
C18H12
1-azabenz[a]anthracene
C17H11N
81
14207
12076
0828
598
136
127
13391
0747
129
Total
727
Small feature between
6700 and 9000
2-azabenz[a]anthracene
C17H11N
98
14701
12762
0784
961
180
984
Small features at 12145
10115 9845 9770
benz[a]acridine
C17H11N
67
11491
8910
1122
257
564
116
10371
0964
439
Total cation
301
12862
0777
167
Anion band
13372
0748
0231
Anion band
benz[c]acridine
C17H11N
65
11496
9250
1081
800
195
104
10783
0927
241
Total cation
1040
13100
0763
126
Anion band
1245
TABLE 1mdashContinued
Band Center (cm-1)
Oscillator Strength f
Compound
Molecular
Chemical
Dep Temp
A
Name
Formula
Structure
( C)
Theor
Exp
microm
kmm
ol (103)
Exp10 -3
Theor
10 -3
Comments
Dibenz[a j
]anthracene
C22H14
135
11964
9773
1023
149
478
151
10188
0982
405
10515
0951
172
very small band at 8460 real
11252
0889
492
Total cation
256
dibenz[a j
]acridine
C21H13N
140
10262
7837
1276
1280
293
152
Side bands 8115 8400
9432
1060
24
Total
1560
dibenz[c h]acridine
110
10382
5844
1711
153
386
138
8016
1248
1460
9878
1012
601
Total wo 5843
2060
C21H13N
dibenz[a h]acridine
160
8724
7044
1420
1700
416
166
8635
1158
527
Total
2220
C21H13N
dibenz[a c]acridine
125
5840 12830
5219
1916
583
128 372
473 709
6613
1512
102
C21H13N
Total
685
11669
0857
153
13097
0764
457
Total
199
N
1246 MATTIODA ET AL Vol 680
(12 benzanthracene) (C18H12) and four of the isomeric nitrogenated benzanthracenes 1-azabenz[a]anthracene 2-azabenz[a]anthracene benz[c]acridine and benz[a]acridine all with formula C17H11N dibenz[ah]anthracene (C22H14) and four isomeric nitroshygenated dibenzanthracenes dibenz[a j]acridine dibenz[ch]acridine dibenz[ah]acridine and dibenz[ac]acridine all with formula C21H13N As with PAHs all the ionized PANHs we have studied have strong broad absorption bands in the NIR arising from electronic transitions The lowest lying electronic transitions for all of these species were computationally determined using time-dependent density functional theory (TDDFT) methods (Dreuw amp Head-Gordon 2005) which are known to be generally reliable for PAH cations (Hirata et al 2003) The computational spectra show that nitrogen plays an important role in determining the nature as well as the trends of the observed transitions We conshyclude this paper by considering the role these PANH spectra play in pumping the mid-IR emission features and the weak broadshyband structure they could superpose on the NIR portion of the interstellar extinction curve
The work is presented as follows The experimental and theoshyretical techniques are summarized in x 2 and the spectroscopic results are presented in x 3 where they are compared with related experimental and computational studies Astrophysical considshyerations are discussed in x 4 and the conclusions are presented in x 5
2 EXPERIMENTAL AND THEORETICAL METHODS
21 Experimental Methods
The matrix isolation infrared spectroscopy techniques emshyployed in these studies have been described in detail previously (Hudgins amp Allamandola 1995a Hudgins amp Sandford 1998) and will be summarized here only briefly Matrix-isolated PANH samples were prepared by vapor codeposition of the species of interest with an overabundance of argon onto a 14 K CsI winshydow suspended in a high-vacuum chamber ( p lt 10 -7 Torr) The samples were vaporized from heated Pyrex tubes while argon was admitted through an adjacent length of copper tubing cooled by liquid nitrogen N2(l ) Deposition temperatures for the individual PANHs are provided in Table 1 Estimates based on the characteristic band intensities of PANHs and the calishybrated argon deposition rate place the Ar PANH ratio in these experiments in excess of 10001 (Mattioda et al 2005a) The PANH samples utilized in this investigation were obtained from a variety of sources Phenazine 1-azabenz[a]anthracene 2-azabenz[a]anthracene and dibenz[a j]anthracene samples were obtained from the National Cancer Institutersquos chemical Carcinshyogen Reference Standard Repository operated by the Midwest Research Institute andwere of unspecified purity Benz[c]acridine benz[a]acridine dibenz[a j ]acridine dibenz[ch]acridine dibenz[ah]acridine and dibenz[ac]acridine were obtained from the Chiron Chemical Company and have a purity greater than 99 Acridine (97) 12 benz[a]anthracene (99) and anthracene (99) were obtained from the Aldrich Chemical Company Although the purity of the samples in this investigashytion varied the absence of any notable discrepant mid-infrared spectral features between the theoretical and experimental specshytra indicates that impurity levels are no more than a few percent (Mattioda et al 2005a)
With the exception of benz[a]anthracene (Mattioda et al 2005b) the near-infrared (NIR) spectra reported here were meashysured at 2 cm -1 or higher resolution by co-adding 500 scans or more on a Digi Lab Excalibur 4000 Fourier transform infrashyred spectrometer The spectra covered the 15000Y3500 cm -1
(066 Y286 microm) range Mid-infrared spectra (4000 Y500 cm -1 25 Y20 microm) were measured for each of these samples as well and will be reported elsewhere (A L Mattioda et al 2008 in preparation) Spectra from 15000 Y9000 cm -1 (067Y111 microm) were collected using the spectrometerrsquos NIR source (Tungsten lamp) quartz beam-splitter and silicon detector Using the same NIR source and quartz beam-splitter PANH spectra between 11000 and 3500 cm -1 (091Y286 microm) were recorded by a liquid nitrogen cooled MCT-B detector Spectra between 7000 and 500 cm -1 (143Y20 microm) were collected using the same MCT-B detector in combination with a KBr beam-splitter and Globar source The number of scans was chosen to optimize both the signal-to-noise ratio and time requirements of each experiment PANH ions were generated by in situ vacuum ultraviolet phoshy
tolysis of the matrix-isolated neutral PANH compound This was accomplished with the combined 120 nm Lya (101 eV) and the 160 nm molecular hydrogen emission bands (centered around 78 eV) from a microwave powered discharge in a flowing H2 gas mixture at a dynamic pressure of 150 mTorr Comparison of the pre- and post-photolysis mid-infrared spectra permits idenshytification of PANH ion features (eg Hudgins amp Allamandola 1995b) and allows for the determination of the ionization percent of the sample (eg Mattioda et al 2003) Assuming that all neushytral PANH molecules that disappear are converted into ions we can derive an upper limit to the ionization efficiency by meashysuring the percent decrease in the integrated areas of the neutral mid-infrared bands that accompany photolysis Ionization effishyciencies for PAHs are typically between 15 and 20 but vary based on PAH size and structure However as noted in previous studies (Mattioda et al 2003 2005a) PANHs typically exhibit ionization efficiencies between 5 and 15 In this inshyvestigation the anthracene sample obtained a 10 ionization acridine 8 phenazine 6 1-azabenz[a]anthracene 19 2-azabenz[a]anthracene 6 benz[a]acridine 5 benz[c]acridine 6 dibenz[a j ]anthracene 4 dibenz[a j ]acridine 7 dibenz[ch]acridine 5 and dibenz[ac]acridine 9 The reshysults of benz[a]anthracene were taken from an earlier investishygation (Mattioda et al 2005b) To confirm the attribution of a photoproduct band in both the mid and near-infrared spectrum to the PANH cation parallel experiments were conducted in which the argon matrix was doped with NO2 an electron accepshytor at a concentration of approximately 1 part in 1200 The presshyence of this electron acceptor quenches the formation of anions and enhances the production of cations As in our PAHNIR specshytroscopic studies we find that in addition to cations PANH anions are also produced in some cases However in the nonshynitrogenated PAH study anions were formed only for the aroshymatics containing more than 10 rings and not for the smaller PAHs This difference in behavior arises because the larger PAHs have electron affinities which are sufficiently high to capture and retain the photoelectrons under these experimental conditions and this is not the case for the smaller PAHs Interestingly alshythough the PANHs studied here are small comprising nomore than 5 rings two (benz[a]acridine and benz[c]acridine) show evidence for some anion formation The bands at 12860 and 13370 cm -1
in benz[a]acridine and 13100 cm -1 in benz[c]acridine (Fig 2) are not present in the NO2 doped experiments Computed adiashybatic electron affinities (using the DFT methods discussed in x 22) are listed in Table 2 It is interesting to note that anion bands were detected in a previous mid-IR study of phenazine (Mattioda et al 2005a) but this investigation revealed no NIR bands that could be attributed to anions The total number of PANH molecules was determined by
taking the ratio of the sum of the experimental integrated band
1247 No 2 2008 PANH CATIONS NEAR-IR SPECTROSCOPY
TABLE 2 Comparison of the Calculated and Experimental Absorption Energies (eV)
Calculated Experimental
Transition Transition CalculatedNeutral
Energy Energy hS 2i Electron Affinity
Cation (eV ) (eV ) ( TDA) (eV )
anthracene 197 17154 07911 0559
Acridine 167 14018 07922 0892
phenazine 144 11803 07945 1312
benz[a]anthracene 166 14701 0783 0599
1-azabenz[a]anthracene 176 14972 0782 0640
2-azabenz[a]anthracene 182 15823 0788 0860
benz[a]acridine 142 11047 07782 0914
benz[a]acridine (anion) 182 15947 07798 benz[a]acridine (anion) 216 16579 07755 benz[c]acridine 143 11468 07737 0880
benz[c]acridine (anion) 185 16242 07796 dibenz[ac]acridine 072 06471 07732 0916
dibenz[a j ]anthracene 148 12632 07774 0628
dibenz[a j ]acridine 127 09717 07761 0926
dibenz[ch]acridine 129 09939 07774 0867
dibenz[ah]acridine 108 08733 07707 0899
dibenz[ac]acridine 159 14468 07769 0916
NotemdashListed hare are the calculated transition energies and electron affinities for the PANHs listed in Table 1 Experimental transition energies are listed for comparison as well as a measure of the quality of the fit (hS 2i)
intensities between 1500 and 500 cm -1 (625 Y20 microm) to the total theoretical sum for the same region This range was chosen to exclude the contributions of (1) the far-infrared bands (v lt 500 cm -1) that were not measured in the experiment (2) the C-H stretching bands whose intensities are substantially overestimated by the calculations (Bauschlicher amp Langhoff 1997 Hudgins amp Sandford 1998) and (3) the overtone combination bands in the 2000 Y1650 cm -1 (5Y61 microm) region whose intensities are not calculated in the theoretical results This method takes advantage of the fact that although there may be significant band-to-band variability in the accuracy of the calculated intensity the total intensity is generally accurate to 10 Y20 excluding the C-H stretching region Based on the total surface density of absorbers (N ) and the upper ionization limit (determined by the percent
accompanying photolysis) one can calculate the number of ions present in each experiment and thus the integrated band strengths (A value in km mol -1) for each band These are presented in Table 1 Using these values the spectra shown in Figures 1 2 and 3 have been normalized to the same number of ions (1 1015) Based on multiple experiments ionization conversion efficienshycies and strong absolute band strengths the uncertainty in band area determination and ultimate absorption strength is less than a factor of 2 for the entries in Table 1
For presentation purposes only the spectra have been baseline corrected and in some instances filtered to lower noise and the gas-phase CO2 purge contaminant features have been removed using theWin-IR Pro Software package No further data reduction
decrease in the integrated areas of the neutral mid-infrared bands
Fig 2mdashArgon matrix-isolated near-IR absorption spectra for the benzan-Fig 1mdashArgon matrix-isolated near-IR absorption spectra for the anthracene thracene 1-azabenz[a]anthracene 2-azabenz[a]anthracene benz[c]acridine and
(C14H10) acridine (C13H9N) and phenazine (C12H8N2) cations Spectra have benz[a]acridine cations All the PANHs are isomers with the formula C17H11N been normalized to an equivalent number of ions (1 1015) Spectra have been normalized to an equivalent number of ions (1 1015)
1248 MATTIODA ET AL Vol 680
Fig 4mdash Correlation of calculated vertical excitation energies with experishymental absorption energies for the molecules considered in this study
Fig 3mdashArgon matrix-isolated near-IR absorption spectra for the dibenshyzanthracene dibenz[a j ]acridine dibenz[ch]acridine dibenz[ah]acridine and dibenz[ac]acridine cations All the PANHs are isomers with the formula C21H13N Spectra have been normalized to an equivalent number of ions (1 1015)
was necessary All numerical values used to derive the informashytion in Table 1 were obtained from the original (unaltered) data
22 Theoretical Methods
All calculations were performed on an Apple XServe Power PC G5 computer cluster using the Q-Chem 30 program package (Shao et al 2006) The ground-state geometry of all ions was opshytimized ignoring any apparent symmetry and vibrational frequenshycies were also computed to characterize the stationary points using unrestricted Kohn-Sham density functional theory with the B3LYPhybrid density exchange functional (Becke 1993Hertwig amp Koch 1997) with the 6-311 G basis set for cations (Frisch et al 1984) Subsequently vertical excitations were calculated using time-dependent density functional theory (TDDFT Dreuw amp Head-Gordon 2005) at the unrestricted UB3LYP6-311 G level Diffuse functions were not required owing to the very comshypact nature of excited states of cations Oscillator strengths and attachment-detachment densities were also computed using full TDDFT Values of the hS2i operator for excited electronic states were calculated using the Tamm-Dancoff approximation (Hirata et al 1999 ) to TDDFT The level of spin contamination in the excited states (the deviation from ideal hS2i values was less than 00445 in all cases which is quite acceptable
3 RESULTS
The near-infrared (NIR) spectra of the PANHs listed in the exshyperimental section are shown in Figures 1 2 and 3 The names formulae structures deposition temperatures individual and total integrated band strengths and oscillator strengths are provided in Table 1 The PANHs are grouped and discussed as members of the corresponding non-nitrogenated parent PAH class The NIR PANH spectra of the anthracene family are shown in Figure 1 the benzanthracene family in Figure 2 and the dibenzanthracene family in Figure 3
31 Theoretical Results
As shown in Figure 4 and Table 2 the calculated vertical excitation energies generally agree well with the experimental data predicting the absolute energies within roughly 025 eV
This level of accuracy is roughly consistent with that seen for a very wide range of PAH cations (Hirata et al 2003) The comshyputational results provide a simple intuitive model for undershystanding the absorption spectra in these related molecules In all but one special case discussed below the low-lying exshy
cited state with significant electronic absorption chiefly resulted from the promotion of an electron in the donor orbital into the lowest unoccupied molecular orbital (the acceptor orbital) The donor molecular orbital was frequently the second-highest ocshycupied beta orbital but not always To understand the effect of nitrogen substitution in terms of the relative stabilization of the donor and acceptor orbitals the electronic excitation can be viewed as a simple single electron transition from the donor to acceptor orbital Due to its greater electronegativity than carbon N substitution stabilizes an orbital that has substantial amplitude (electron density) on the atom where the nitrogen substitution occurs but has relatively little effect on orbitals that have nodes (no electron density) or small amplitude on the C that is subshystituted by N Thus either redshifts or blueshifts are possible for the electronic transition Figure 5 demonstrates how this effect on the molecular orbitals of anthracene and acridine produces a redshift The nitrogen atom in most of the PANHs examined here were
substituted in a position where the acceptor orbital possessed significant electron density but the donor orbital did not leading to an increase in stabilization resulting in a redshift of the elecshytronic transition The calculations also correctly predict the relshyative amount of shift However a caveat must be imposed if the nitrogen substitution introduces a large change in the geometry of the molecule (if for example a hydrogen which was in steric contact with another is replaced with the lone pair of electrons on a nitrogen atom) Of course such a substitution changes the shape of the orbitals in play but it also mixes new excitations into the transition that compromise this simple model
32 Near-Infrared Spectra of the Cations of the Nitrogenated Anthracenes Acridine and Phenazine
Figure 1 shows the 14500 Y4000 cm -1 (0690 Y25 microm) specshytra of the anthracene acridine and phenazine cations Peak posishytions and intensities are listed in Table 1 The NIR spectrum of the acridine cation shows one strong broad band (FWHH gt 500 cm -1) with a prominent shoulder to the blue The spacing between the shoulder and main peak is roughly 1500 cm -1 a value similar to the vibronic spacing found for many PAH cations reported previously (Andrews et al 1985 Mattioda et al 2005b)
1249 No 2 2008 PANH CATIONS NEAR-IR SPECTROSCOPY
Fig 5mdash Molecular orbital diagram depicting the effect of nitrogen substitushytion on the electron donor (top) and acceptor (bottom) orbitals of the anthracene (left) and acridine (right) cations The corresponding energy levels are given in the center The size of the gap between these levels largely determines the transhysition energy In the case shown here the absorption in acridine is redshifted relative to anthracene
Assigning the strongest acridine cation NIR absorption band which peaks near 11300 cm -1 to the 0Y0 transition the 1500 cm -1
spacing corresponds to the first member of the progression inshyvolving the C-C stretching vibration However the NIR specshytrum of the dinitrogenated PANH phenazine does not exhibit such a progression
The shapes of the donor and acceptor orbitals varied slightly with each geometry but transitions of all these molecules can be understood as perturbations on the Au B3g transition of the anthracene cation (as shown in Fig 5) The red and blue surfaces in these diagrams represent the electron density and the magnishytude of the density present in the molecular orbitals respectively As discussed in x 31 the presence of a node falling at the poshysition of nitrogen substitution in the donor orbital and the inshycrease in electron density at that position in the acceptor orbital predict that nitrogen substitution should lower the energy of the acceptor orbital without changing the energy of the donor orbital (see Fig 5) Based on this analysis nitrogen substitution of one of the central carbon atoms in anthracene should decrease the energy gap between the electronic states lowering the excitation energy and resulting in a redshift of the absorption band This is borne out in the experimental results with anthracenersquos main band situated around 13800 cm -1 followed by acridine at 11306 cm -1 and phenazine at 9520 cm -1
33 Near-Infrared Spectra of the Cations of the Nitrogenated Benz[a]anthracenes 1-azabenz[a]anthracene 2-azabenz[a]anthracene Benz[c]acridine
and Benz[a]acridine
Figure 2 shows the 14500 Y4000 cm -1 (0690 Y25 microm) spectra of the benz[a]anthracene 1-azabenz[a]anthracene 2- azabenz[a]anthracene benz[c]acridine and benz[a]acridine catshyions Peak positions and band intensities are listed in Table 1 As with the nitrogenated anthracenes the NIR spectra of these nitrogenated benz[a]anthracene cations are dominated by a single broad band The 1-azabenz[a]anthracene benz[c]acridine and benz[a]acridine cations show clear vibronic structure about 1500 cm -1 to the blue of the strongest band As in the case of acridine discussed above this spacing corresponds to the first member of the progression involving the C-C stretching vibrashytion The spectrum of 2-azabenz[a]anthracene does not appear to show this structure but rather has a prominent blue shoulder with a subpeak roughly 500Y600 cm -1 to the blue TheNIR spec-
Fig 6mdash Donor (bottom) and acceptor (top) molecular orbitals of benz[a]anthracene The positions of nitrogen substitution in 1-azabenz[a]anthracene 2-azabenz[a]anthracene benz[a]acridine and benz[c]acridine are indicated in the bottom (donor orbital) picture
tra of photolyzed benz[c]acridine and benz[a]acridine are the only PANHs we have studied which exhibit anion features For benz[c]acridine a weak anion band peaks near 13100 cm -1 and in the spectrum of benz[a]acridine here two weak anion bands are evident around 12900 and 13400 cm -1
Although both benz[a]acridine and benz[c]acridine exshyhibit redshifts in peak positions similar to those observed for nitrogen insertion in the anthracene series when nitrogen is inserted in the pendant ring in 1-azabenz[a]anthracene and 2-azabenz[a]anthracene the main peak is blueshifted with reshyspect to its position in benz[a]anthracene
Applying the simple one electron orbital analysis developed above to the donor and acceptor orbitals of the parent PAH benz[a]anthracene (Fig 6) explains both the redshift for benz[a]acridine and benz[c]acridine and blueshifts for 1-azabenz[a]anthracene and 2-azabenz[a]anthracene relative to the parent PAH In the first two cases the substitution of a nitrogen atom at a position of low electron density in the donor orbital but high electron density in the acceptor orbital narrows the energy gap resulting in a redshift of the bands (see Figs 2 and 6) The experimental results confirm this effect with 12 benzanthracene exhibiting its main absorption feature at 11215 cm -1 while benz[a]acridine and benz[c]acridine main absorptions occur at 8910 and 9250 cm -1 respectively Howshyever the situation is different for 1-azabenz[a]anthracene and 2-azabenz[a]anthracene where the position of nitrogen substishytution has a greater electron density in the donor orbital relative to the acceptor orbital in the parent PAH (see Fig 6) Thus the energy of the donor orbital decreases more than the energy of the acceptor orbital and so the gap between the two which is
1250 MATTIODA ET AL Vol 680
tied to the excitation energy increases on nitrogen substitushytion resulting in a blueshift This shift is evident in Figure 2 where the absorption feature for 1-azabenz[a]anthracene and 2-azabenz[a]anthracene fall at 12076 and 12762 cm -1
As noted previously the presence of an anion was noted in the spectra of benz[a]acridine and benz[c]acridine The electron affinities of the neutral species considered in this study were also estimated by calculating the difference between the electronic energy of the neutral and the anion at their optimized geometries ( both with the 6-311+G basis set) The calculated electron affinities reproduce trends one would expect increasing with nitrogen substitution and the size of the conjugated system (Table 2) The two species with anion bands had high electron affinities compared to their four-ringed non-nitrogenated peers as expected but are not exceptional with respect to the other nitrogenated PANHs considered here
34 Near-Infrared Spectra of the Cations of the Nitrogenated Dibenzanthracenes Dibenz[a j]acridine Dibenz[ch]acridine
Dibenz[ah]acridine and Dibenz[ac]acridine
Figure 3 shows the 14500 Y4000 cm -1 (069 Y25 microm) cation spectra of dibenz[a j ]anthracene compared to its nitrogen-substituted dibenz[a j]acridine and dibenz[ch]acridine analogs as well as the spectra of dibenz[ah]acridine and dibenz[ac]acridine cations The peak positions and band intensities for all molecules are listed in Table 1 As shown in Figure 7 the donor orbitals for the parent PAH dibenz[a j ]anthracene exhibit very little if any electron density on the central carbon atoms Thus based on the previous discussions one would expect nitrogen substitution in either the [a j ] or [ch] positions to produce a redshift in the band positions Furthermore the small amount of electron density at the [ch] position versus a node at the [a j ] position should result in slightly less of a redshift for dibenz[ch]acridine This matches quite nicelywith the experimental results Dibenz[a j]anthracenersquos main absorption feature is at 9773 cm -1 which becomes red-shifted to 8016 cm -1 on insertion of a nitrogen atom at the [ch] position forming dibenz[ch]acridine Placement of the nitrogen atom in the [a j ] position results in the band center being shifted to 7837 cm -1 (see Table 1 and Fig 3) Dibenz[ah]acridine which is unrelated to dibenz[a j ]anthracene exhibits its main absorpshytion feature at 7044 cm -1
The vibronic structure of the prominent bands in the NIR spectra of all these PANH cations is striking and somewhat unshyusual for the PAHs and PANHs studied to date In all four cases the most prominent transition is blendedwith a band centered apshyproximately 400 cm -1 to the blue and has a separate weaker companion with a spacing of about 1500 cm -1 Mattioda et al (2003) reported that the insertion of nitrogen into a PAH tends to enhance the strength of the C-C and C-H in-plane vibrations similar to the effect observed on ionization Likewise as discussed in Mattioda et al (2003 2008 in preparation) the presence of nitrogen in a position para (opposite) to a C-H group tends to greatly enhance a C-C in-plane vibration around 1400 cm -1 As previously discussed the 1500 cm -1 vibronic spacing is most likely due to the enhanced C-C and C-H in-plane modes Unforshytunately the source of the 400 cm -1 spacing is ambiguous partly due to the limited spectroscopic data below 500 cm -1
Interestingly the NIR spectrum of dibenz[ac]acridine shows evidence for two different electronic transitionswith 0Y0 positions near 5200 and 11700 cm -1 The computed vertical excitation spectrum explains both absorptions and their relative energies The experimental peak near 5200 cm -1 resembles the anthraceneshytype transition in terms of transition dipole orbital contributions and attachment-detachment densities (Head-Gordon et al 1995
Fig 7mdashDonor (bottom) and acceptor (top) molecular orbital for dibenz[a j ]anthracene The nitrogen atom positions for dibenz[ch]acridine and dibenz[a j ]acridine are indicated in the figure
see below) Relative to its parent PAH which is not included in the experimental data set the simple model predicts that it should be redshifted by nitrogen substitution in dibenz[ac]acridine TDDFT calculations on that compound support this conclusion The higher energy transition at 11700 cm-1 results from a state unlike those seen in the other molecules Unlike the single donor molecular orbitals observed for the other PANHs and PAHs disshycussed the TDDFTexcitation for dibenz[ac]acridine contains significant contributions from four donor orbitals one of which is shown in Figure 8 In cases such as this it is useful to examine the attachment-detachment electron densities which schematishycally picture themovement of electron density in a before (ground state) Yand Yafter (excited state) fashion instead of the donor acceptor orbitals As shown in Figure 8 the nitrogen atom is subshystituted in a position of low electron density in the electron detachment density ( ie in lieu of the donor orbital) but high electron density in the electron attachment density (ie in lieu of the acceptor orbital) Thus according to our results one should expect to observe a redshift from the band position in the nonshynitrogenated parent PAH (dibenz[ac]anthracene) Although dibenz[ac]anthracene was not measured experimentally the calshyculations predict this transition to occur at a higher frequency than that observed in the nitrogenated PAH The plots demonshystrate that the high-energy transition is another sort of J J
excitation
35 Near-Infrared Band Intensities
Integrated absorbance values (km mol -1) for the bands in the spectra shown in Figures 1 2 and 3 are listed in Table 1 As in Mattioda et al (2005b) the band strengths of these electronic
1251 No 2 2008 PANH CATIONS NEAR-IR SPECTROSCOPY
Fig 8mdash Electron distributions for the dibenz[ac]acridine 11700 cm -1 excitation The first image is one of the four donor beta orbitals The electron detachment density to be used in lieu of the donor orbital is the second image while the third image represents the electron attachment density to be used in lieu of the acceptor orbital image
transitions are presented in oscillator strength f and in units of km mol -1 to facilitate comparisons with mid-IR band strengths which are normally presented in km mol -1 See Mattioda et al (2005b) for a detailed description of the procedure used to deshytermine these absorption strengths The oscillator strength was determined by multiplying the total integrated absorbance by 187 10 -7 mole km -1 (Kjaergaard et al 2000)
For the transitions of the PANHs considered here the oscilshylator strengths range from 13 10 -3 to 42 10 -2 a range someshywhat similar to that reported for PAHs of approximately the same size in Mattioda et al (2005b)
A comparison can be made between the nitrogenated PAH and its parent molecule For the anthracene series it appears that the insertion of a single nitrogen has little impact on the total osshycillator strength While anthracene exhibits an oscillator strength of 90 10-3 acridine has a value of 60 10 -3 The oscillator strength is lowered to 31 10 -3 for phenazine which contains two nitrogen atoms This is similar to the trend displayed in the calculated values which shows phenazine exhibiting a slightly lower oscillator strength than either anthracene or acridine
TDDFT is often a useful tool for predicting trends in oscillator strengths (Halasinski et al 2003) although they are more prone to error than the transition frequencies themselves (Appel et al 2003) The B3LYP hybrid functional has been used for this purshypose in the past (Zdetsis et al 2001) however in this instance the agreement with experiment is somewhat unsatisfactory alshythough similar to that observed in Mattioda et al (2005b) The neglect of Franck-Condon factors in the calculation of the vershytical excitation spectrum may be partly responsible for the difshyference between calculated and experimental oscillator strengths Likewise the comparison of gas-phase values (theoretical calshyculations) to matrix-isolated experimental values may be responshysible for some of the differences Still some basic things can be inferred from the transition moment The molecules with a C2
symmetry axis perpendicular to the plane of the molecule have a transition moment directed with the long axis Thus the subshystitution of carbon for nitrogen in the center of the molecule should not have a large effect on the transition dipole and by asshysociation the oscillator strength This is in line with the experishymental observations for the three-ringed systems and certainly in agreement with the calculations
For the benz[a]anthracene series it is difficult to tell what influence nitrogen insertion has on the oscillator strength of the NIR transition The total oscillator strengths for 1-azabenz[a]anthracene and benz[c]acridine are similar to that observed in the parent PAH approximately 2 10 -2 However the total oscillator strengths of 2-azabenz[a]anthracene and benz[a]acridine are nearly an order of magnitude lower (see
Table 1) Theoretical calculations display little variation in osshycillator strength between molecules in this series
The total oscillator strength of dibenz[a j ]acridine dibenz[ch]acridine and dibenz[ah]acridine are significantly larger than dibenz[a j ]anthracene while the transitions noted in dibenz[ac]acridine are on the same order This is in contrast to the theoretical values which display little variation between dibenz[a j]anthracene dibenz[a j]acridine dibenz[ch]acridine and dibenz[ah]acridine but a significantly lower value for the oscillator strength of dibenz[ac]acridine (see Table 1)
In spite of its fundamental astrophysical importance detershymining reliable PAH ion oscillator strengths for electronic transishytions experimentally has proven particularly challenging (Hudgins amp Allamandola 1995b Salama amp Allamandola 1991) Due to the inherent difficulty in maintaining a stable isolated PAH ion population the vast majority of spectroscopic studies have been carried out in inert gas matrices Comparisons between gas-phase and matrix-isolation spectroscopic studies with quantum calcushylations have shown that matrix perturbations are minor when studying PAH ion vibrational transitions which give rise to the well-known interstellar infrared emission bands (eg Hudgins amp Allamandola 2004 Mattioda et al 2003) and matrix-isolation studies can be directly applied to the interstellar IR emission bands This is not generally so for electronic transitions which give rise to bands spanning the UV to the NIR spectral range As discussed in Mattioda et al (2005a 2005b 2005c) the PAHNIR band shifts and FWHH variations between argon and neon mashytrices and gas-phase studies show that the matrix environment can severely perturb intrinsic electronic band positions and band shapes Electronic transition band strengths are perturbed as well The matrix influence on band strengths for electronic transitions are not only matrix dependent but are also influenced by other species present in the matrix (Hudgins amp Allamandola 1995a) To make matters worse it also appears to depend on the method of determination For example Salama et al (1994) studied the electronic transition [D2 D0] of the neon matrix isolated phenanthrene cation corresponding to the same transition reshyported in Mattioda et al (2005a 2005b 2005c) for phenanthrene in an argon matrix Salama et al (1994) calculated the number of phenanthrene ions produced from the reduction in the absorshybance of the neutral phenanthrene electronic bands in the UV This is in contrast to the method employed by Mattioda et al (2005a 2005b 2005c) the same method employed here in which the number of phenanthrene ions produced is determined by the reduction in the absorbance of the neutral phenanthrene vibrational bands in the mid-IR The discrepancy is unacceptshyably large Salama et al report an f value of 6 10 -5 for this phenanthrene cation transition in a neon matrix while Mattioda
1252 MATTIODA ET AL Vol 680
et al report f frac14 35 10-3 from the argon matrix data These values are to be compared with theoretical values which range from 0096 to 016 It is also interesting to note that Brechigna amp Pino (1999) measured this transition for the phenanthrene cation in the gas phase They determined an oscillator strength of 0150 which is in good agreement with the theoretical predictions but at odds with the matrix work Another example of a significant discrepancy originating in the method used to determine the numshyber of ions produced is provided by the anthracene cation Our value of 0009 for the oscillator strength of the 13835 cm -1 band of the anthracene cation in an argon matrix is an order of magshynitude lower than the value of 008 measured for the anthracene cation in argon matrix by Szczepanski et al (1993) In this case the value determined by Szczepanski et al (1993) is in better agreement with the theoretical prediction of about 01
To the best of our knowledge the pyrene and coronene cations are the only other PAH cation for which theoretical and experishymental NIR experimental oscillator strengths have been reported In contrast to the theoretical value of 0015 for the [J J-2]0
transition in pyrene (Hirata et al 2003) Vala et al (1994) report f 0005 compared to value of f 00015 (Mattioda et al 2005a 2005b 2005c) For coronene however the agreement is better Hirata et al (2003) predicted a value of 0006 for the [J J-3] transition while Ehrenfreund et al (1995) have meashy0
sured the NIR spectrum for the coronene cation isolated in an argon matrix and determined f 0005 a value that compares favorably with the f 0006 reported by Mattioda et al (2005a 2005b 2005c) In summary there is a large variation in reported PAH ion oscillator strengths regardless of means of determinashytion In those cases for which argon matrix data is available difshyferences of a factor of 2Y10 are encountered Inspection of Table 1 in Mattioda et al (2005a 2005b 2005c) shows that when theoshyretical data are available most of the experimental values are 13Y10 times smaller For the PANH NIR spectra reported here the experimental values vary between 5 and 15 times smaller than the theoretical results The origin of this serious discrepancy beshytween the few available gas-phase oscillator strength and matrix values is unknown but may be related to the evaluation of the density of cations in the matrix
4 ASTROPHYSICAL CONSIDERATIONS
The spectra shown in Figures 1 2 and 3 and corresponding absolute absorption strengths listed in Table 1 illustrate that PANH cations have NIR transitions that should be taken into account when evaluating the effects of PAHs and PANHs on the intershystellar radiation field Following Mattioda et al (2005b) we conshysider two applications that impact observations the role of NIR photons in pumping the mid-IR PAHPANH emission bands and the possibility that PANHs can impose broadband structure on the interstellar extinction curve in addition to contributing to the discrete diffuse interstellar bands (DIBs)
However before proceeding further it is necessary to disshycuss two issues concerning the previous PAH NIR investigation (Mattioda et al 2005b 2005c) which came to light during the course of the PANH NIR investigation Although neither issue impacts the relevant findings of the earlier investigation these items should be addressed The first issue relates to equation (5) of Mattioda et al (2005c) A programming error resulted in incorrect parameters being reported for S1 S2 and S3 of equation (5) in Mattioda et al (2005c) here corrected as our equation (1)
1PAH 2(k) cmabs frac14 35 10 -19-145k=microm thorn S1 thorn S2 - S3 eth1THORN NC C atom
TABLE 3 Corrected Parameters for Mattioda et al 2005c Equation (5)
our Equation (1)
k j Aint j
Drude (microm) 1j (cm2 microm -1 C -1)
S1 105 0055 20 10 -20
S2 126 011 78 10 -21
S3 1905 009 1465 10 -22
Gaussian k0 wj A (microm) (cm2 microm -1 C -1)
G 1185 02985 140 10 -20
where Sj represents Drude profiles given by
2 1jkjAint jSj(k) frac14 eth2THORN
J (k=kj - kj =k)2 thorn 12 j
For this equation 1j is a broadening parameter kj is the central wavelength of a feature in microm and Aint j is the integrated abshysorption strength expressed in cm per C atom (1int j in Draine amp Li 2001) The correct parameters are listed in Table 3 The second issue concerns the impact of this adjustment on
the NIR PAH portion of the graphs presented in Figure 8 of Mattioda et al (2005b) and Figure 1 in Mattioda et al (2005c) which represent the composite spectrum of 27 equally weighted PAH spectra We have improved our spectral averaging routine A comparisonbetween the newPAHcomposite spectrum is shown with the originally published data in Figure 9 As one can see the differences between the old and new composites are minor with the most obvious differences being a narrowing of the 1 microm feashyture and elimination of the small bands at 166 and 175 microm These differences were caused by a transcription error which resulted in the spectrum of one PAH molecule being given more weight in the overall average The overemphasis of this moleshycule was responsible for the 166 and 175 microm features as well as the broadening of the 1 microm band Finally we should also menshytion the dip that occurs around 19 microm in the original composite spectrum Figure 9 shows that CO2 overtone bands from the purge gas produce an artifact at this position Although the changes result in a slightly altered composite
spectrum they do not change the overall conclusion that open-shell PAHs exhibit NIR absorptions which could pump mid-IR emission in areas of low UV flux as well as add detectable strucshyture to the interstellar extinction curve
41 Pumping the Mid-IR PAHPANH Emission Features with NIR Photons
An important long-standing issue concerning the model that IR fluorescence from highly vibrationally excited PAHs is responsible for the interstellar mid-IR emission features involves the excitation mechanism To properly test this aspect of the PAH excitation emission model and put it on as quantitative a footing as possible requires a deeper understanding of the complete UVshyvisual-NIR spectroscopic properties of PAHs and related species (ions hetero-atom substituted etc) than is currently available This NIR spectroscopic study of PANH cations contributes some of this information The experimental NIR spectra for a wide variety of PAH ions
has permitted a revision in the PAH ion optical radiation abshysorption model (Mattioda et al 2005a) A semiempirical model
1253 No 2 2008 PANH CATIONS NEAR-IR SPECTROSCOPY
Fig 9mdash Comparison of initial PAH composite spectrum with the revised PAH composite and the Draine amp Li curve Note the purge CO2 overtones overshylapping the 19 microm feature
which takes into account the significant NIR absorption features of PAH ions has been proposed (Mattioda et al 2005b) After combining these PAH cation NIR spectroscopic properties with the Draine amp Li (2001) PAH UV-visual optical model a comshyparison was made between the energy absorbed by PAH ions in the NIR and that of the UV-visual region for a wide array of stellar classes This comparison reveals that for lower temperashyture stars NIR energy absorption becomes increasingly imporshytant matching the energy absorbed from the UV-visual for late K andM stars Thus even in areas of low UV flux absorption in the NIR could stimulate mid-IR emission from PAH ions In a recent publication Draine amp Li (2007) have incorporated these optical radiative properties as part of a very thorough and comshyplete model of interstellar extinction and dust radiative propershyties that is used to interpret Spitzer observations of a very wide variety of objects
Here we revisit the semiempirical PAH optical property model presented by Mattioda et al (2005b) and incorporate the NIR spectroscopic properties of PANH ions presented here
The upper portion of Figure 10 displays the revised PAH NIR composite spectrum as well as the composite spectrum of the 10 PANH ions that were part of this investigation Although it extends slightly more into the red the composite peak of the PANH spectrum nicely matches that of the PAH spectrum The main difference on averaging the PANH and PAH data (see lower portion of Fig 10) is the slight extension of the composite lsquolsquobumprsquorsquo into the red (by lt01 microm)
Figure 11 displays the composite PAH PANH NIR cation spectrum as well as the fit to this new data This fit is given by
1PAH 2(k)abs cm A -2(k-k0)2 =wfrac14 14 10 -192-134k=microm thorn pffiffiffiffiffiffiffiffi e 2
NC C atom w J=2
eth3THORN
where the wavelengths are in microm k0 is the center of the peak in microm w is twice the standard deviation of the Gaussian distribushytion (2 1) or approximately 0849 the width of the peak at half height in microm and A is the area under the peak The actual values for the Gaussian portion of the curve are provided in Table 3 These
Fig 10mdash Top Comparison of the PAH composite NIR spectrum comprising 27 PAH ions vs the PANH composite spectrum composed of 10 PANH ions with the original Draine amp Li (2001) astronomical PAH spectrum Bottom Comparshyison of the PAH composite and the total PANHPAH composite spectrum with the initial Draine amp Li (2001) astronomical PAH spectrum
parameters are valid for the region between 082 and 182 microm after this point the baseline becomes a nearly constant value of 335 10-22 cm2C atom
Equation (3) and Figure 11 reveal that the overall character of the composite PAH PANH NIR cation spectrum can be fit reasonably well with a single Gaussian curve centered around 1185 micromOf course such a fit neglects the substructure apparent in Figure 11 However each component of the apparent substrucshyture is the result of one or two fairly intense PAHPANH cation bands The intent of this fit is to provide a model for the absorpshytion of a mixture of open-shell PAH and PANH molecules in the interstellar environment The new composite PAH-PANH specshytrum is the result of 38 equally weighted PAH and PANH cation spectra In the interstellar environment one would expect a more complex mixture of PAH species exhibiting different weights for each of the species As Figure 11 demonstrates such a mixture should result in a feature visible around 12 microm not accounting for the matrix shift Such a matrix shift as pointed out inMattioda et al (2005b) may produce a similar band but redshifted by 100 cm -1 aswas the case for the phenanthrene cationOf course
sharper features may be evident on the extinction curve if a few astronomical PAHs or PANHs are particularly strong This is disshycussed in further detail below
1254 MATTIODA ET AL Vol 680
Fig 11mdashFit to the PANH+PAH NIR composite spectrum using eq (3) and the parameters listed in Table 3
42 Interstellar PAHs and the Extinction Curve
There is overwhelming evidence that ionized PAHs are wideshyspread throughout the diffuse ISM (Mattila et al 1996 Onaka et al 1996) As shown in the previous section NIR transitions in these and PAH-related species such as PANHs could impose detectable structure on the extinction curve Here we extend our earlier estimation of the extent to which this is possible (Mattioda et al 2005a) to include PANHs As in the PAH study the cases considered are somewhat contrived as there are likely many hundreds if not hundreds of thousands of different PAHPANH molecular structures that could contribute spectroscopic structure to the extinction curve Knowing neither the different structures nor their corresponding spectra we approximate the situation as follows Using the standard relationship NHE(B - V ) frac14 58
-21021 atoms cm mag -1 (Bohlin et al 1978) where NH is the number of hydrogen atoms per cm2 along the line of sight and E(B-V) is the reddening expressed in magnitudes Taking 3 10 -4 for the cosmic CH ratio the number of carbon atoms per
2cm per E(B-V ) becomes NCE(B - V ) frac14 17 1018 Assumshying 10 of the available cosmic carbon is in the form of free PAHs (eg Allamandola et al 1989 Puget amp Leger 1989) the number of C atoms tied up in free PAHs per cm2 per E(B-V ) is then NC-PAHE(B - V ) frac14 17 1017 This is however a very conservative lower limit for the total amount of cosmic carbon tied up in PAH structures since the 10 value for the amount of available carbon in PAHs holds for those contributing to the mid-IR emission features Larger PAHs PAH clusters and amorphous carbon particles rich in PAH structures that do not contribute to the mid-IR features must also be present and many of these will also have NIR transitions However for the sake of this analyshysis we assume an average of 50 C atoms per PAH In this case
-2NPAH frac14 34 1015E(B - V ) molecules cm Assuming a situation in which 10 of the PAHs in the total
PAH ion population all absorb at nearly the same wavelength the optical depth (T frac14 ln IoI ) of a band in the NIR portion of the extinction curve produced by these PAHs is estimated as follows The spectra and integrated absorbance values presented in x 3 show that PAH cations containing between 40 and 50 C atoms often possess a discrete absorption band near 9000 cm -1 (11 microm)with a FWHH 400 cm -1 ( 004microm) having integrated absorbance values (A) between roughly 16 105 and 69 105 km mol -1
(256 10 -14 and 11 10 -13 cm molecule -1) Since NPAHA
(T)dv the optical depth becomes NPAH Adv Taking A 5 10 -14 -1 cm molecule -1 dv frac14 400 cm and NPAH frac14 34 1014E(B - V ) molecules cm -2 (for 10 of the PAH ion popushylation) yields a T mag frac14 004 for an absorption band produced by these interstellar PAH molecules Thus the data presented here suggest that there should be
weak but detectable broadband structure originating in ionized PAHs and PANHs superposed on the NIR portion of the intershystellar extinction curve
CONCLUSIONS
Since very little near-infrared (NIR) spectroscopic data were available for ionized PANHs a systematic study of the NIR spectroscopic properties of argon matrix-isolated PANH ions has been undertakenHerewe report the NIR spectra and absolute band strengths of 10 nitrogen-containing polycyclic aromatic hydroshycarbon (PAH) cations These include the nitrogenated anthracenes acridine (C13H9N) and phenazine (C12H8N2) the four isoshymeric nitrogenated benzanthracenes 1-azabenz[a]anthracene 2-azabenz[a]anthracene benz[c]acridine and benz[a]acridine all with formula C17H11N and the four isomeric nitrogenated dibenzanthracenes dibenz[a j ]acridine dibenz[ch]acridine dibenz[ah]acridine and dibenz[ac]acridine all with formula C21H13N As with ionized PAHs all the ionized PANHs we have studied have strong broad absorption bands in the NIR arising from electronic transitions Oscillator strengths and integrated abshysorbance values have been determined for these NIR transitions All of these NIR spectra are dominated by a strong broad
(FWHH 500 cm -1) band corresponding to the 0Y0 transition and most show clear weaker vibronic substructure to the blue The vibronic bands correspond to progressions involving the CH out-of-plane bends and C-C stretching vibrations Some PANHs also showvibronic bandswith unusual spacingof about 400 cm -1 consistent with the difference between an unusually strong C-N-C and C-H in-plane vibration (around 1400 cm -1) and that of the C-H out-of-plane modes None of the argon matrix-isolated PANH cation NIR spectra show sharp features as is the case for some PAHs (Mattioda et al 2005a) TDDFT is an appropriate model for the large cations discussed
in this study The theoretical modeling shows that in this series of anthracene derivatives the band shift direction can be predicted by the relative magnitudes of the donor and acceptor molecular orbitals present at the position of the nitrogen substitution in the parent PAH Most of the PANHs examined here were substituted with nitrogen at a position where the acceptor molecular orbital possessed significant electron density but the donor orbital did not leading to redshifts Two astrophysical applications have also been considered
The first has to do with the radiation fields that pump the intershystellar IR emission bands The data presented here show that open-shell PANH ions have significant absorption features in the near-infrared similar to the situation for PAH ions A quantitashytive treatment of PAH and PANH optical properties spanning the UV-visual-NIR spectral is presented The second astrophysical application has to do with interstellar extinction Since the spectra of ionized PANHs show strong NIR transitions and PANHs are very likely to be present and abundant in the interstellar medium they could add detectable structure to the extinction curve A quantitative estimate is made of this potential extinction The band strengths reported here suggest that ionized interstellar PANHs should add weak broadband structure to the NIR portion of the interstellar extinction curve between 1 and 16 microm As with PAHs it is also important to keep in mind that some
structures of neutral PANHs can also have open-shell radical
1255 No 2 2008 PANH CATIONS NEAR-IR SPECTROSCOPY
electronic configurations as do the ions studied here (eg Hudgins et al 2001 2005 Szczepanski et al 2002) and thesewill also posshysess longer wavelength electronic transitions albeit likely having lower cross sections than ionized open-shell species Thus even in regions dominated by non-ionizing radiation it may be possible to detect the emission from neutral open-shell PANH species
The experimental portion of the research presented here was supported through NASArsquos Long Term Space Astrophysics (grant 907524) and Astrobiology (grant 811073) Programs AM
acknowledges the support of the National Research Council and L R acknowledges the support of The SETI Institute Summer Research Experience for Undergraduates (funded by NSF award AST-0552751) The theoretical work by M H-G T J L and J P was supported through NASArsquos Astronomy and Physics Research and Analysis Program (APRA) As always we are deeply indebted to Robert Walker for his outstanding technical support of all phases of the experimental work We also grateshyfully acknowledge earlier insightful discussions with Jan Cami concerning the impact of the NIR transitions on the extinction curve
REFERENCES
Allamandola L J Tielens A G G M amp Barker J R 1989 ApJS 71 733 Andrews L Friedman R S amp Kelsall B J 1985 J Phys Chem 89 4016 Appel H Gross E K U amp Burke K 2003 Phys Rev Lett 90 043005 Bakes E L O Tielens A G G M amp Bauschlicher C W 2001 ApJ 556 501
Bauschlicher C W amp Langhoff S R 1997 Spectrochim Acta Astron 53 1225
Becke A D 1993 J Chem Phys 98 5648 Bohlin R C Savage B D amp Drake J F 1978 ApJ 224 132 Brechignac P amp Pino T 1999 AampA 343 L49 Draine B T amp Li A 2001 ApJ 551 807 mdashmdashmdash 2007 ApJ 657 810 Dreuw A amp Head-Gordon M 2005 Chem Rev 105 4009 Ehrenfreund P et al 1995 AampA 299 213 Frisch M J Pople J A amp Binkley J S 1984 J Chem Phys 80 3265 Halasinski T Weisman J L Ruiterkamp R Lee T J Salama F amp Head-Gordon M J 2003 J Phys Chem 107 3660
Head-Gordon M Grana A Maurice D amp White C 1995 J Phys Chem 99 14261
Hertwig R H amp Koch W 1997 Chem Phys Lett 268 345 Hirata S Head-Gordon M Szczepanski J amp Vala M 2003 J Phys Chem A 107 4940
Hirata S Lee T J amp Head-Gordon M 1999 J Chem Phys 111 8904 Hudgins D M amp Allamandola L J 1995a J Phys Chem 99 3033 mdashmdashmdash 1995b J Phys Chem 99 8978 mdashmdashmdash 2004 in ASP Conf Ser 309 Astrophysics of Dust ed A NWitt G C Clayton amp B T Draine (San Francisco ASP) 665
Hudgins DM Bauschlicher CW Jr ampAllamandola L J 2001 Spectrochem Acta Astron 57 907
mdashmdashmdash 2005 ApJ 632 316 Hudgins D M amp Sandford S A 1998 J Phys Chem 102 329 Kjaergaard H G Robinson T W amp Brooking K A 2000 J Phys Chem A 104 11297
Li A amp Draine B T 2001 ApJ 554 778 mdashmdashmdash 2002 ApJ 572 232 Mattila K et al 1996 AampA 315 L353 Mattioda A L Hudgins D M Bauschlicher Jr C W amp Allamandola L J 2005a Adv Space Res 36 156
mdashmdashmdash 2005b ApJ 629 1188 mdashmdashmdash 2005c ApJ 629 1183 Mattioda A L Hudgins DM Bauschlicher CW Jr RosiM ampAllamandola L J 2003 J Phys Chem A 107 1486
Onaka T Yamamura I Tanabe T Roellig T L amp Yuen L 1996 PASJ 48 L59
Pech C Joblin C Boissel P 2002 AampA 388 639 Peeters E Allamandola L J Hudgins D M Hony S amp Tielens A G G M 2004 in ASP Conf Ser 309 Astrophysics of Dust ed A N Witt G C Clayton amp B T Draine (San Francisco ASP) 141
Peeters E Hony S Van Kerkhoven C Tielens A G G M Allamandola L J Hudgins D M amp Bauschlicher C W 2002 AampA 390 1089
Puget J L amp Leger A 1989 ARAampA 27 161 Salama F amp Allamandola L J 1991 J Chim Phys 94 6964 Salama F Joblin C amp Allamandola L J 1994 J Chem Phys 101 10252 Shao Y et al 2006 Phys Chem Chem Phys 8 3172 Szczepanski J Banisaukas J Vala M Hirata S amp Wiley W R 2002 J Phys Chem A 106 6935
Szczepanski J Vala M Dahbia T amp Ellinger Y J 1993 Chem Phys 98 4494
Vala M Szczepanski J Pauzat F Parisel O Talbi D amp Ellinger Y 1994 J Phys Chem 98 9187
Van Dishoek E F 2004 ARAampA 42 119 Verstraete L Pech C Moutou C Sellgren K Wright C M Giard M Leger A Timmerman R amp Drapatz S 2001 AampA 372 981
Zdetsis A D Garoufalis C S Grimme S 2001 Phys Rev Lett 87 276402
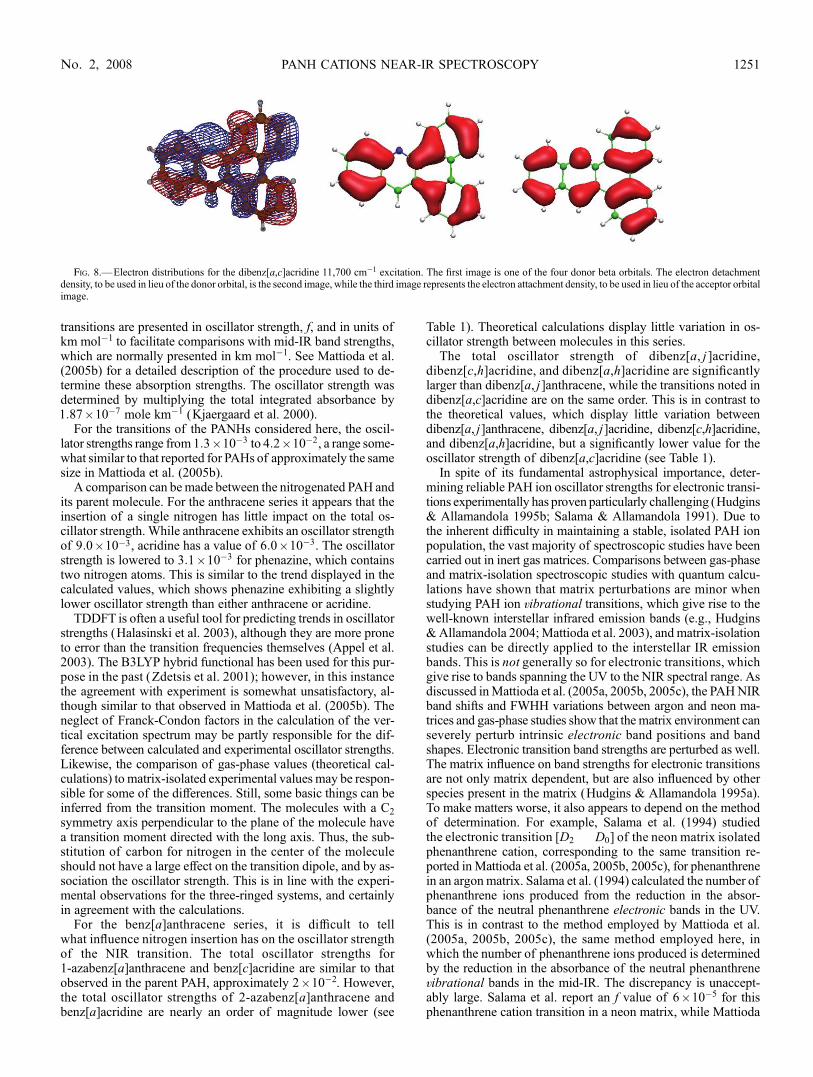