neetika kampani & joachim tan - aemo - aemos's gas statement of opportunities (gsoo) for...
TRANSCRIPT
SLIDE 1
AEMO’S GAS STATEMENT OF
OPPORTUNITIES (GSOO) FOR
AUSTRALIA
2016 WA Power and Gas Conference
15 March 2016
PRESENTED BY
NEETIKA KAPANI, A/MANAGER, SYSTEM CAPACITY (WA)
JOACHIM TAN, SENIOR ANALYST, SYSTEM CAPACITY (WA)
SLIDE 2
AGENDA
• An overview of Australia’s domestic gas markets
• Findings of the November 2015 Western Australia
GSOO
• Findings of the March 2016 GSOO (Eastern and South-
Eastern States)
• Future of gas supply in Australia
SLIDE 3
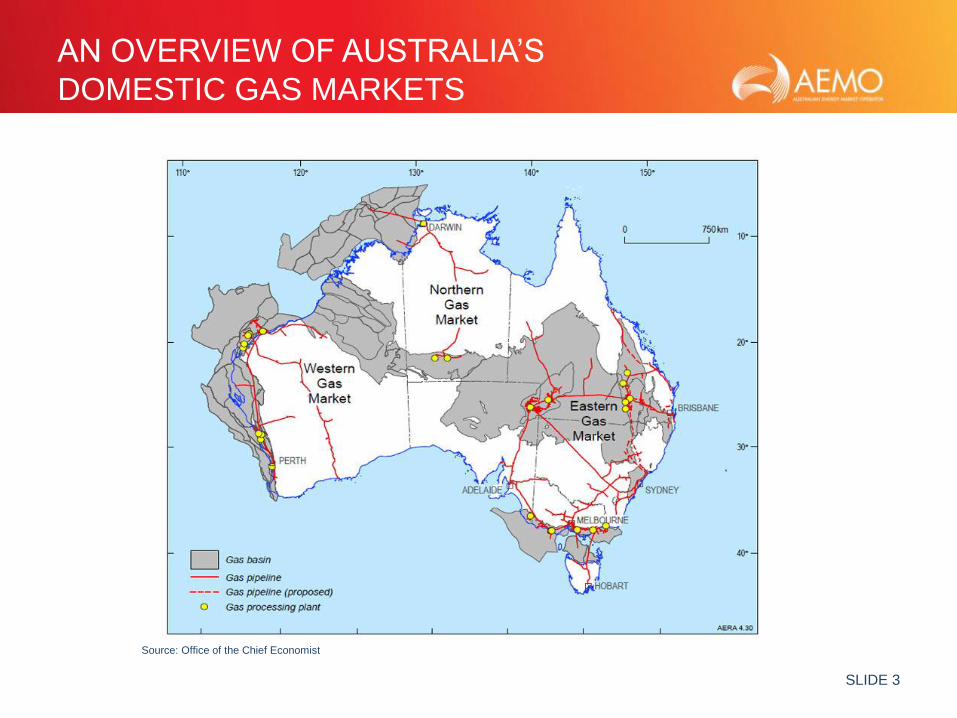
AN OVERVIEW OF AUSTRALIA’S
DOMESTIC GAS MARKETS
Source: Office of the Chief Economist
SLIDE 4
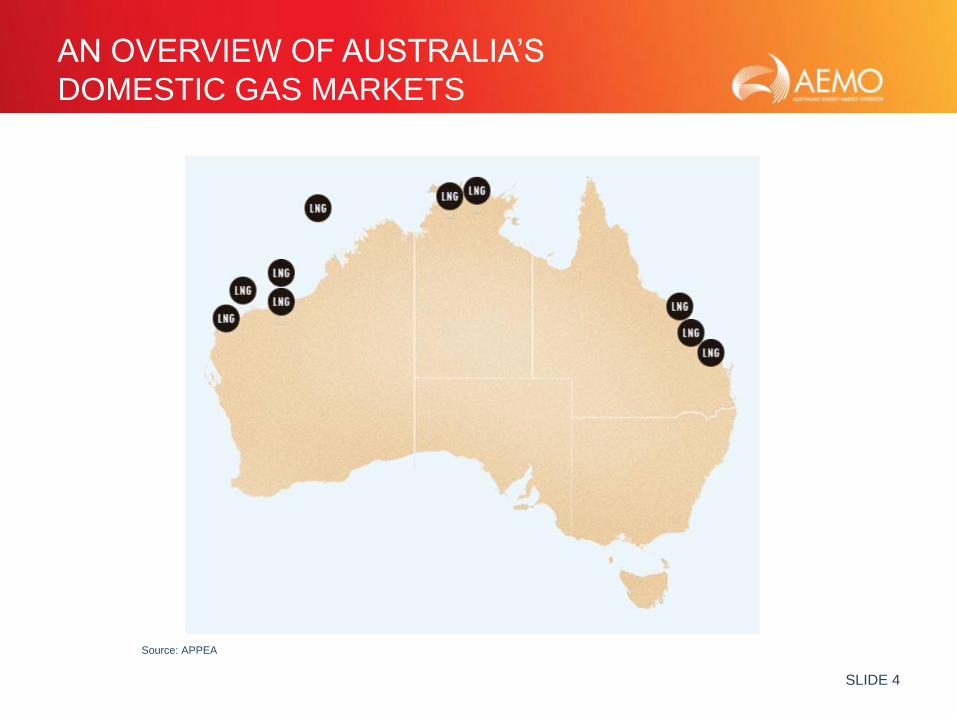
AN OVERVIEW OF AUSTRALIA’S
DOMESTIC GAS MARKETS
Source: APPEA
SLIDE 5
FINDINGS OF THE NOVEMBER 2015
WESTERN AUSTRALIA GSOO
SLIDE 6
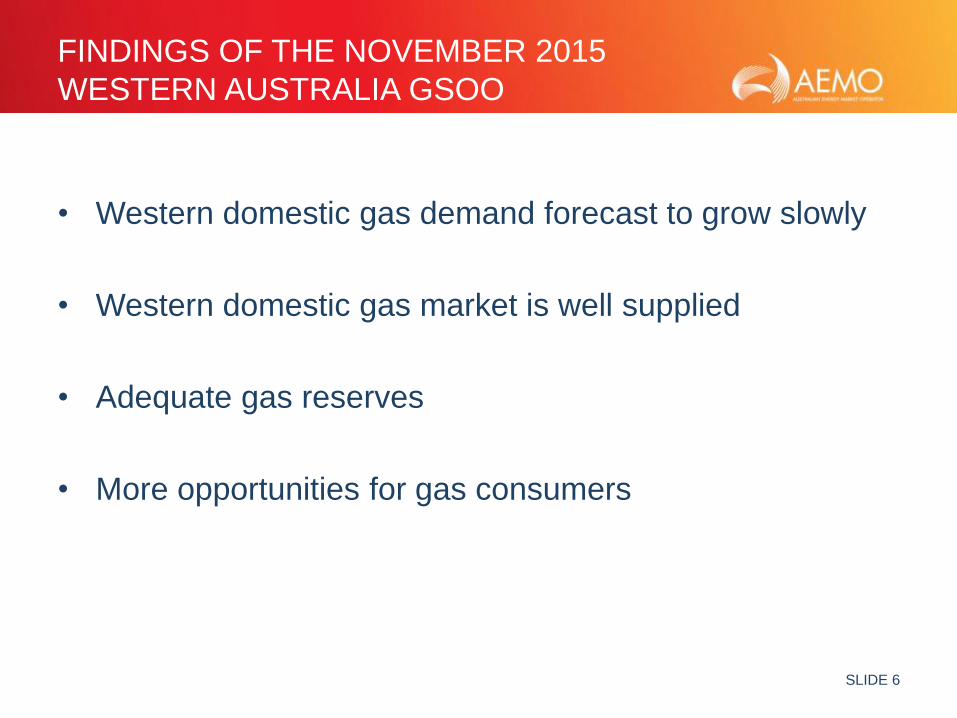
FINDINGS OF THE NOVEMBER 2015
WESTERN AUSTRALIA GSOO
• Western domestic gas demand forecast to grow slowly
• Western domestic gas market is well supplied
• Adequate gas reserves
• More opportunities for gas consumers
SLIDE 8
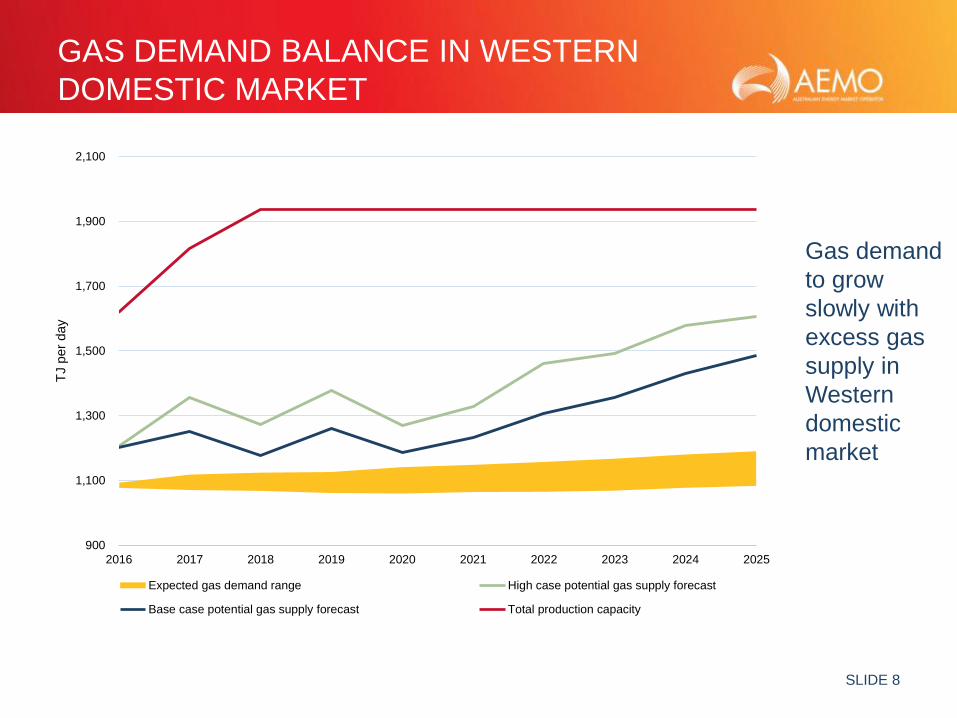
GAS DEMAND BALANCE IN WESTERN
DOMESTIC MARKET
900
1,100
1,300
1,500
1,700
1,900
2,100
2016 2017 2018 2019 2020 2021 2022 2023 2024 2025
TJ p
er
day
Expected gas demand range High case potential gas supply forecast
Base case potential gas supply forecast Total production capacity
Gas demand
to grow
slowly with
excess gas
supply in
Western
domestic
market
SLIDE 9
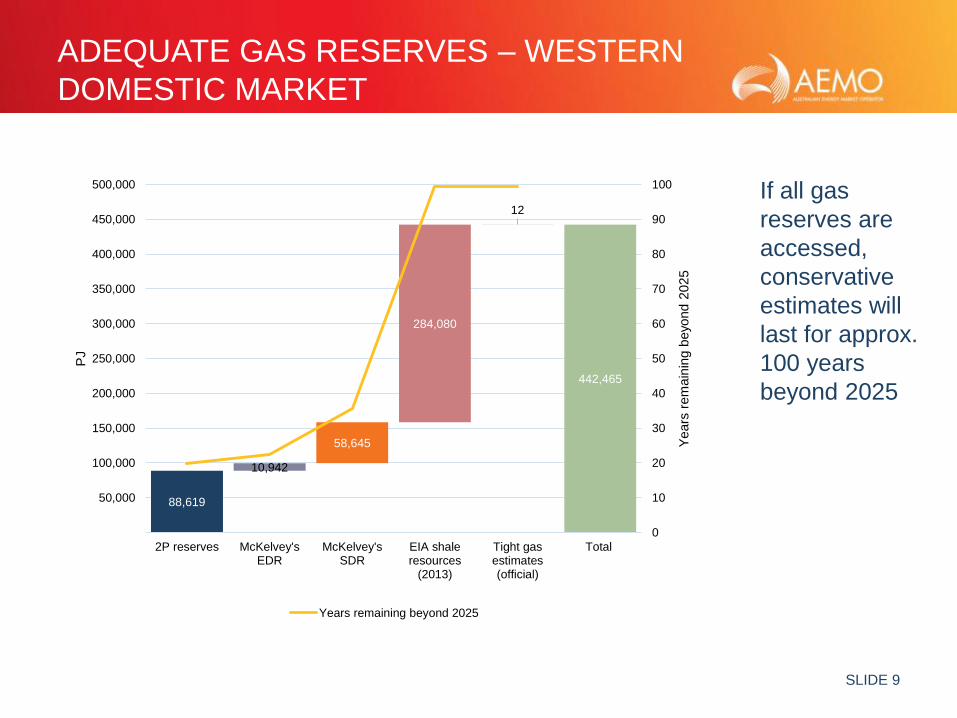
ADEQUATE GAS RESERVES – WESTERN
DOMESTIC MARKET
442,465
10,942
58,645
284,080
12
88,619
0
10
20
30
40
50
60
70
80
90
100
50,000
100,000
150,000
200,000
250,000
300,000
350,000
400,000
450,000
500,000
2P reserves McKelvey'sEDR
McKelvey'sSDR
EIA shaleresources
(2013)
Tight gasestimates(official)
Total
Years
rem
ain
ing b
eyond 2
025
PJ
Years remaining beyond 2025
If all gas
reserves are
accessed,
conservative
estimates will
last for approx.
100 years
beyond 2025
SLIDE 10
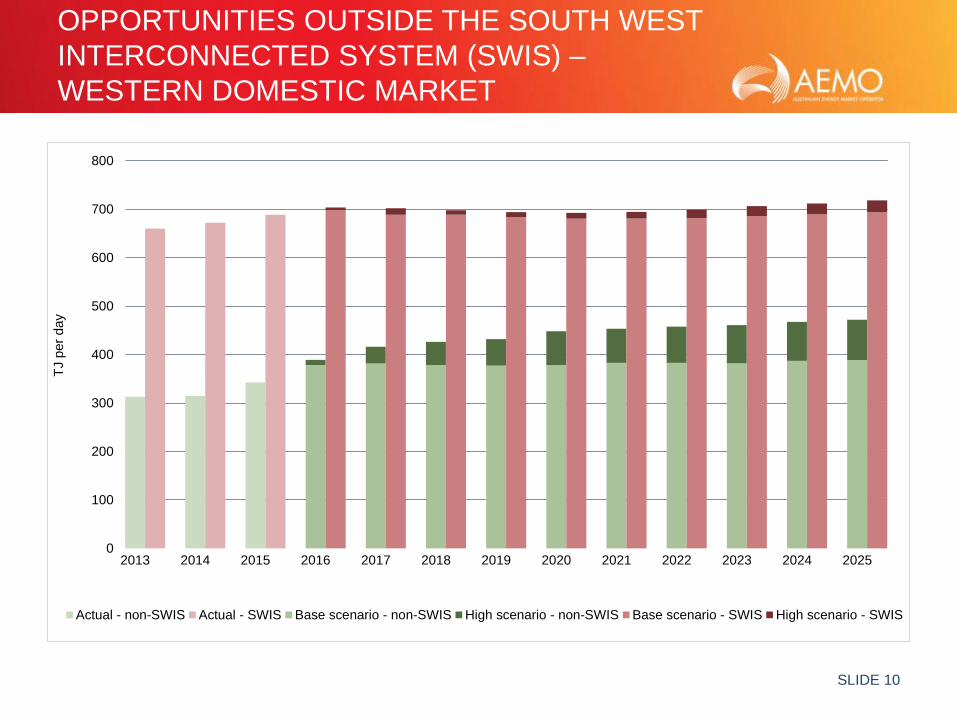
OPPORTUNITIES OUTSIDE THE SOUTH WEST
INTERCONNECTED SYSTEM (SWIS) –
WESTERN DOMESTIC MARKET
0
100
200
300
400
500
600
700
800
2013 2014 2015 2016 2017 2018 2019 2020 2021 2022 2023 2024 2025
TJ p
er
day
Actual - non-SWIS Actual - SWIS Base scenario - non-SWIS High scenario - non-SWIS Base scenario - SWIS High scenario - SWIS
SLIDE 11
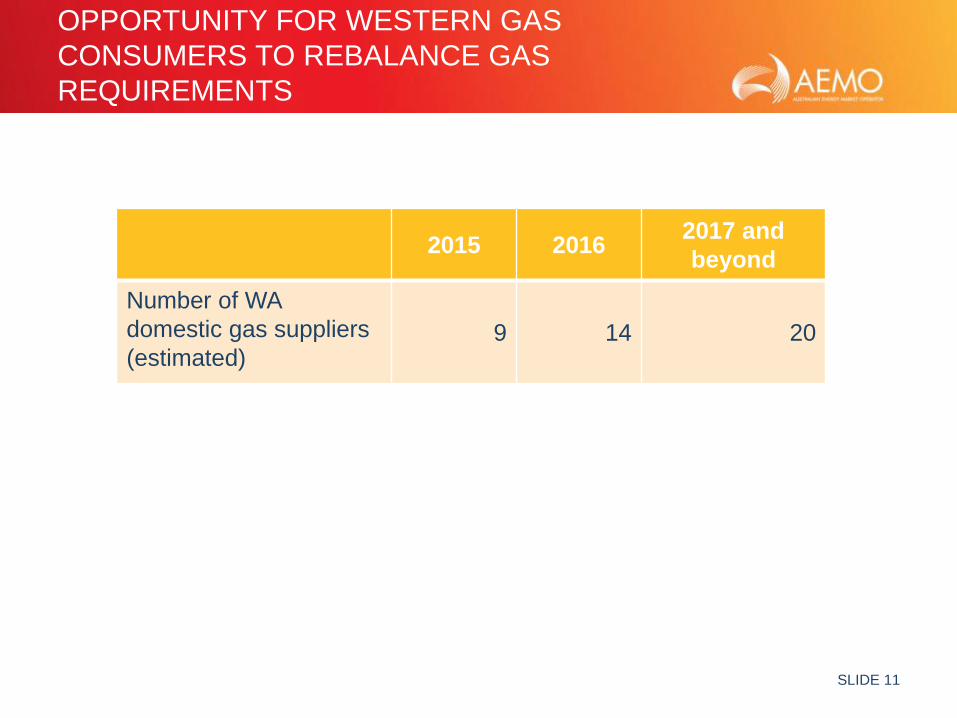
OPPORTUNITY FOR WESTERN GAS
CONSUMERS TO REBALANCE GAS
REQUIREMENTS
2015 20162017 and
beyond
Number of WA
domestic gas suppliers
(estimated)9 14 20
SLIDE 12
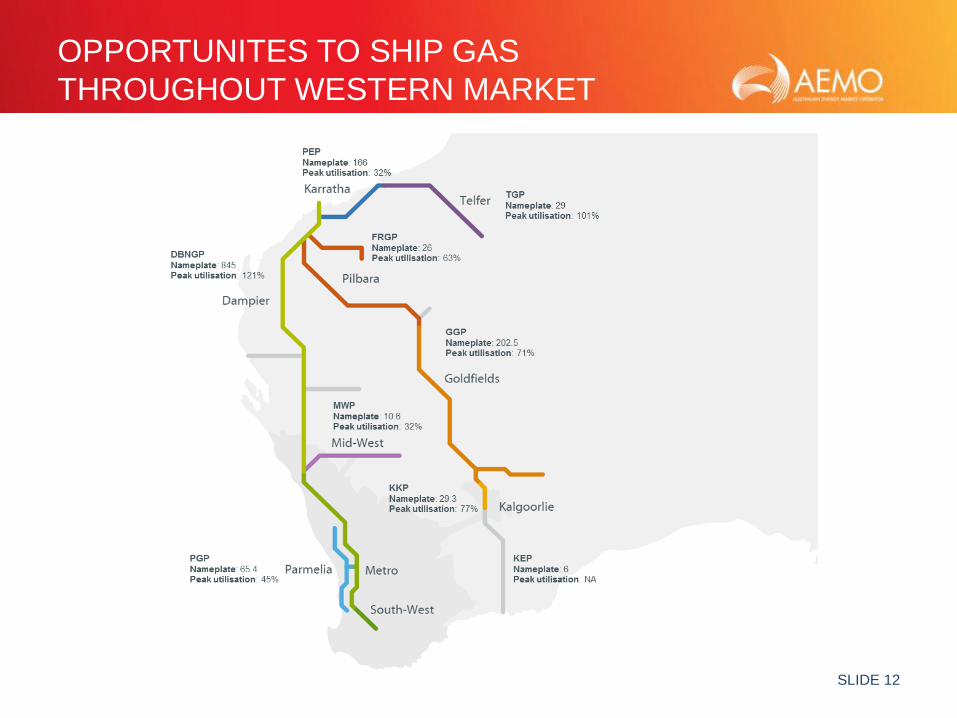
OPPORTUNITES TO SHIP GAS
THROUGHOUT WESTERN MARKET
SLIDE 13
FINDINGS OF THE MARCH 2016 GSOO
(EASTERN AND SOUTH-EASTERN STATES)
SLIDE 14
FINDINGS OF THE MARCH 2016 GSOO
(EASTERN AND SOUTH-EASTERN STATES)
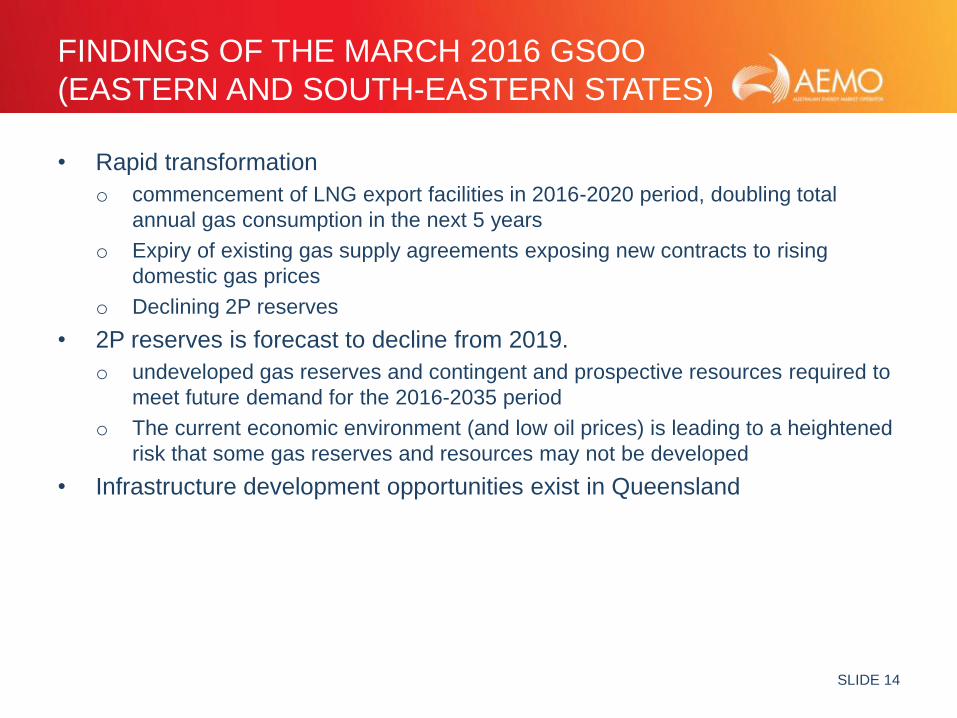
• Rapid transformation
o commencement of LNG export facilities in 2016-2020 period, doubling total
annual gas consumption in the next 5 years
o Expiry of existing gas supply agreements exposing new contracts to rising
domestic gas prices
o Declining 2P reserves
• 2P reserves is forecast to decline from 2019.
o undeveloped gas reserves and contingent and prospective resources required to
meet future demand for the 2016-2035 period
o The current economic environment (and low oil prices) is leading to a heightened
risk that some gas reserves and resources may not be developed
• Infrastructure development opportunities exist in Queensland
SLIDE 15
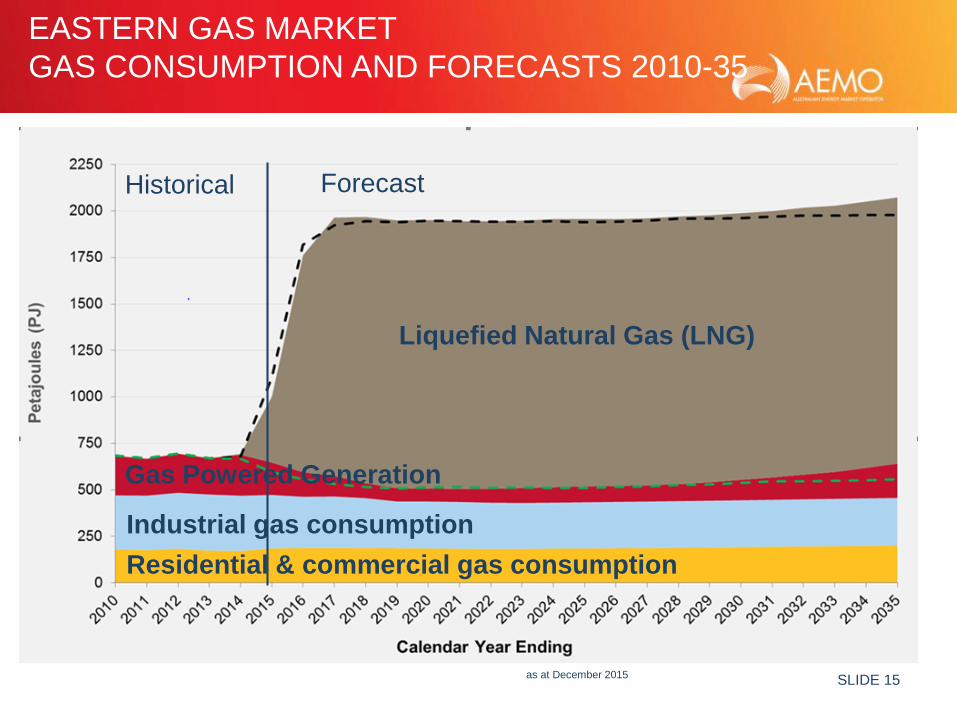
EASTERN GAS MARKET
GAS CONSUMPTION AND FORECASTS 2010-35
Liquefied Natural Gas (LNG)
Gas Powered Generation
Industrial gas consumption
Residential & commercial gas consumption
as at December 2015
Historical Forecast
SLIDE 16
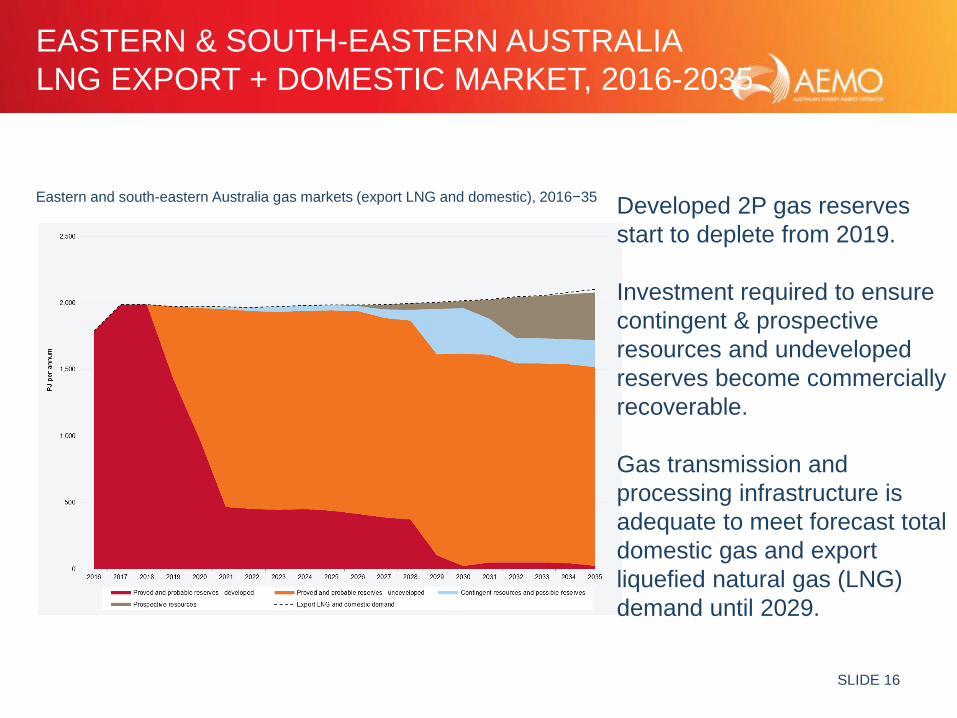
EASTERN & SOUTH-EASTERN AUSTRALIA
LNG EXPORT + DOMESTIC MARKET, 2016-2035
Eastern and south-eastern Australia gas markets (export LNG and domestic), 2016−35Developed 2P gas reserves
start to deplete from 2019.
Investment required to ensure
contingent & prospective
resources and undeveloped
reserves become commercially
recoverable.
Gas transmission and
processing infrastructure is
adequate to meet forecast total
domestic gas and export
liquefied natural gas (LNG)
demand until 2029.
SLIDE 17
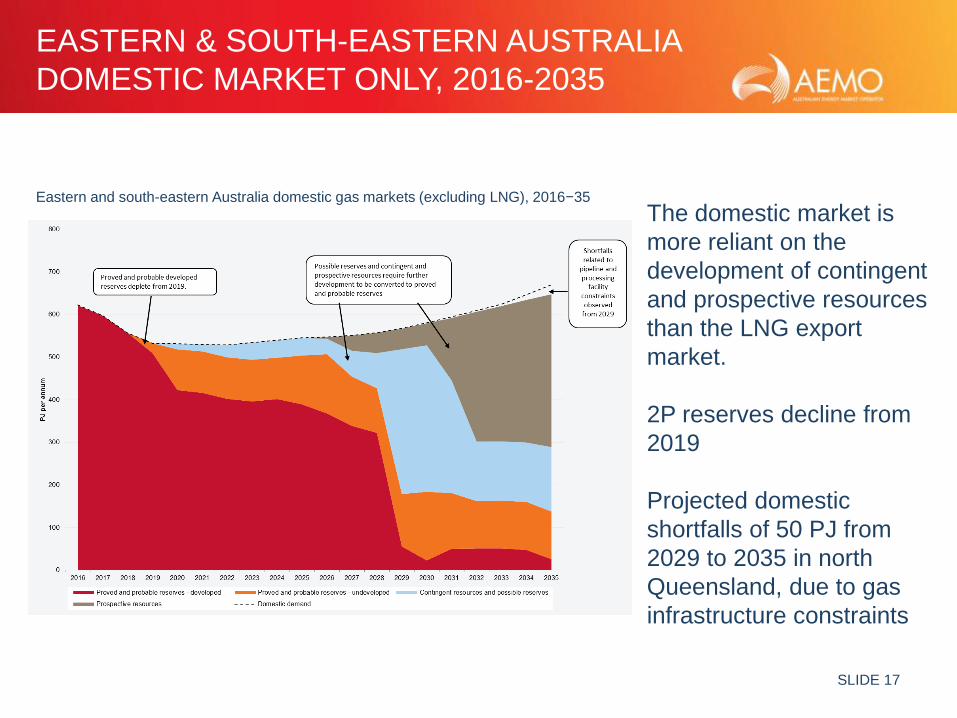
EASTERN & SOUTH-EASTERN AUSTRALIA
DOMESTIC MARKET ONLY, 2016-2035
Eastern and south-eastern Australia domestic gas markets (excluding LNG), 2016−35
The domestic market is
more reliant on the
development of contingent
and prospective resources
than the LNG export
market.
2P reserves decline from
2019
Projected domestic
shortfalls of 50 PJ from
2029 to 2035 in north
Queensland, due to gas
infrastructure constraints
SLIDE 18
THE FUTURE OF GAS SUPPLY IN AUSTRALIA
SLIDE 19
NEW OPPORTUNITIES
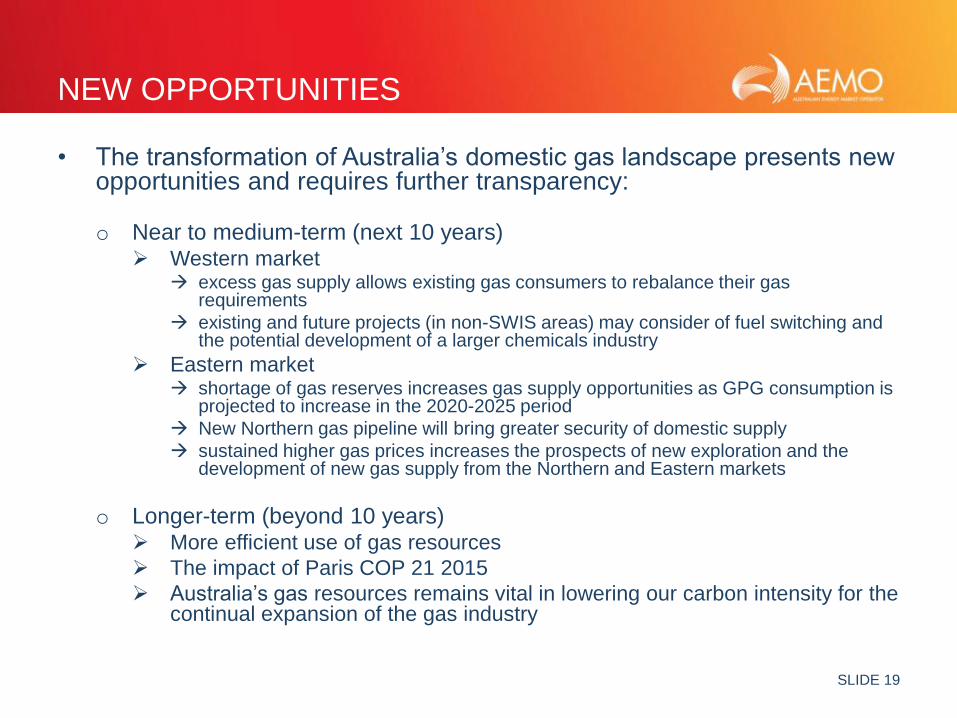
• The transformation of Australia’s domestic gas landscape presents new opportunities and requires further transparency:
o Near to medium-term (next 10 years) Western market
excess gas supply allows existing gas consumers to rebalance their gas requirements
existing and future projects (in non-SWIS areas) may consider of fuel switching and the potential development of a larger chemicals industry
Eastern market shortage of gas reserves increases gas supply opportunities as GPG consumption is
projected to increase in the 2020-2025 period
New Northern gas pipeline will bring greater security of domestic supply
sustained higher gas prices increases the prospects of new exploration and the development of new gas supply from the Northern and Eastern markets
o Longer-term (beyond 10 years) More efficient use of gas resources
The impact of Paris COP 21 2015
Australia’s gas resources remains vital in lowering our carbon intensity for the continual expansion of the gas industry
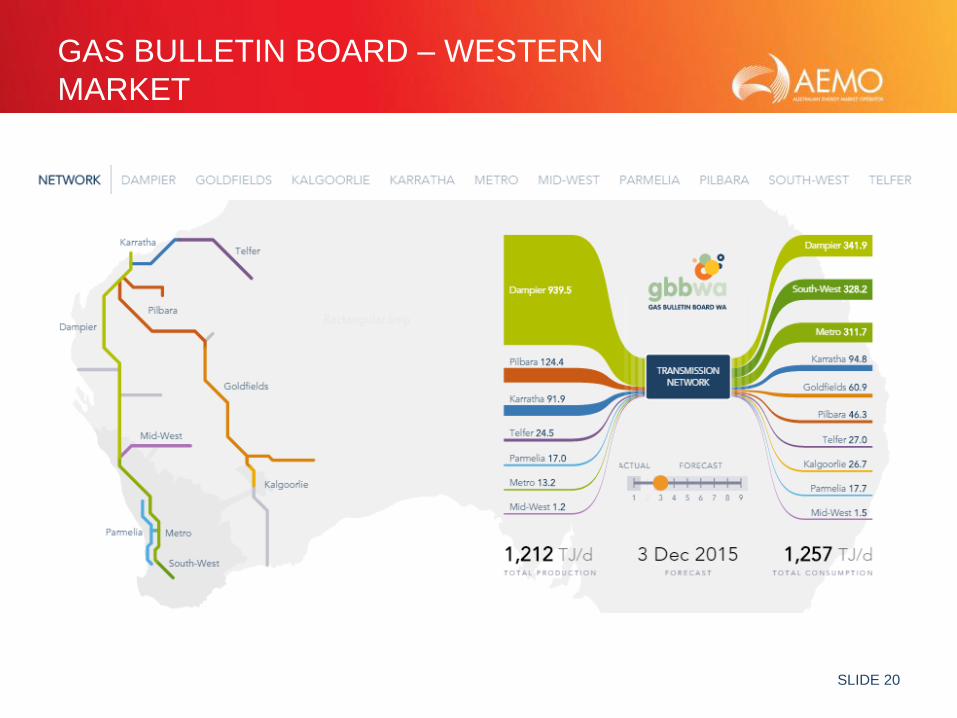
SLIDE 20
GAS BULLETIN BOARD – WESTERN
MARKET
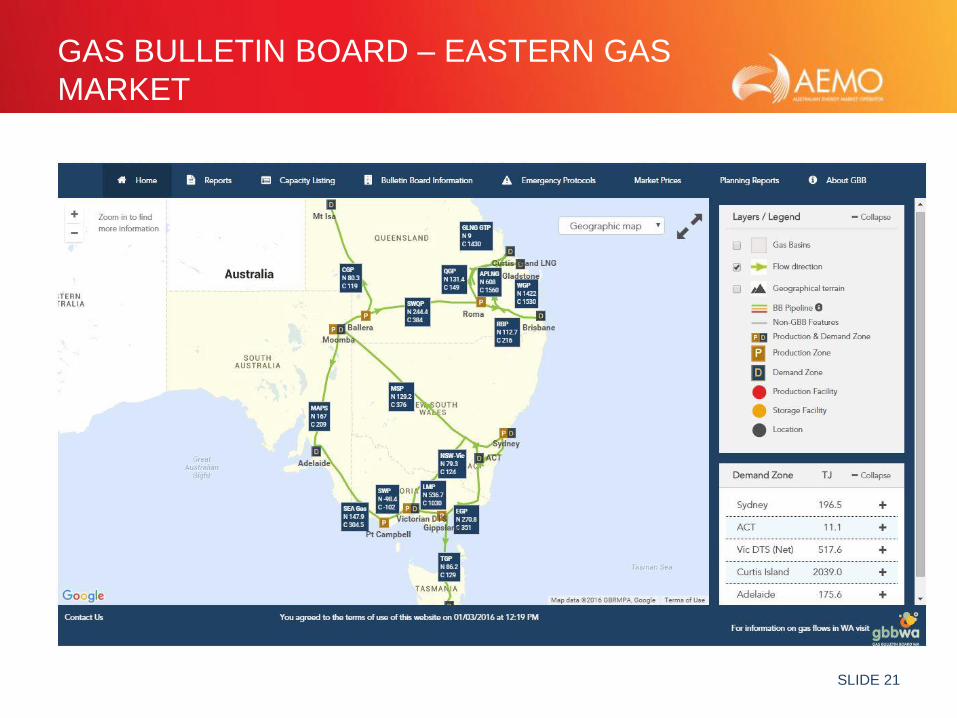
SLIDE 21
GAS BULLETIN BOARD – EASTERN GAS
MARKET

SLIDE 22
THANK YOU