neighborhood satisfaction: a study of user assessments of
TRANSCRIPT

Missouri University of Science and Technology Missouri University of Science and Technology
Scholars' Mine Scholars' Mine
International Symposia on Low Cost Housing Problems
Civil, Architectural and Environmental Engineering Conferences
26 Apr 1972
Neighborhood Satisfaction: A Study of User Assessments of Low Neighborhood Satisfaction: A Study of User Assessments of Low
Income Residential Environment Income Residential Environment
Henry Sanoff
Follow this and additional works at: https://scholarsmine.mst.edu/islchp
Part of the Civil Engineering Commons
Recommended Citation Recommended Citation Sanoff, Henry, "Neighborhood Satisfaction: A Study of User Assessments of Low Income Residential Environment" (1972). International Symposia on Low Cost Housing Problems. 81. https://scholarsmine.mst.edu/islchp/81
This Article - Conference proceedings is brought to you for free and open access by Scholars' Mine. It has been accepted for inclusion in International Symposia on Low Cost Housing Problems by an authorized administrator of Scholars' Mine. This work is protected by U. S. Copyright Law. Unauthorized use including reproduction for redistribution requires the permission of the copyright holder. For more information, please contact [email protected].

NEIGHBORHOOD SATISFACTION: A STUDY OF USER ASSESSMENTS OF LOW INCOME RESIDENTIAL ENVIRONMENT
by
Henry Sanoff*
INTRODUCTION
In August 1971, Secretary Romney issued a statement inid- cating that housing starts are “ up to an annual rate of 2. 2 million units” and further went on to state that “ this administration is already committing billions of budget resources to assist low and moderate-income families into decent housing. ” (1) The statement was a testimony to the success of the Administration’s efforts to meet the nation’s pressing housing needs. Housing needs, however are referred to as the inventory or stock of new or rehabilitated dwelling units. Little mention is ever directed towards the user’ s housing needs or the way in which the assembly of dwelling units and their location have an impact on the social and psychological well being of the residents.
RESEARCH IN NEIGHBORHOOD SATISFACTIONAn early attempt to ascertain the effect of physical aspects of
the immediate neighborhood environment on residents’ behavior was undertaken by Festinger et. al in a study of married students’ housing. (2) They found that the proximity of dwelling unit entrances was directly related to the frequency of casual interaction and subsequent growth of friendships. Residents who were physically more isolated tended to develop fewer friendships within the neighborhood. A parallel study of housing by Caplow and Foreman also found that high interaction rates were heavily influenced by physical accessibility and were associated with “ high morale and a high measure of reported satisfaction. ” (3) While stressing the effect of propinquity in their findings, they also emphasized that the population they studied was exceptionally homogeneous. Gans concludes that propinquity is less important in fostering interaction and suggests that shared attitudes as well as stage in the life cycle are most relevant. (4) In another study Lansing and Hendricks indicate for a Detroit region sample that an evaluation of neighbors as “ friendly” is a better predictor of neighborhood satisfaction than is the frequency of the respondents’ interaction with those neighbors. (5) Other findings reported by Keller (6) and Michelson (7) also suggest that sociability and perceived similarities with neighbors are central to neighborhood interaction and satisfaction.
Although the research cited emphasizes the impact of the social setting on neighborhood satisfaction, the effect of the physical setting has underlying importance. Propinquity, for example, may make an important contribution to social interaction in homogeneous neighborhoods which may then lead to neighborhood satisfaction. Residential satisfaction can be explained by the way in which man perceives his relation to the spatial environment as well as his relation to his physical surroundings. Residential satisfaction deals with the degree of accommodation of man’s spatial environment to his attitudes about his environment and his actual behavior. Michelson (8) suggests that there is not a determinism or a dominance of the environmental system over the social system or vice versa, but one of congruence between certain variables of each system. Congruency is dependent upon people’s accommodation to the environment as well as the fullfillment of their expectations. In other terms the social reality is operationally defined as the individual’s perception of his satisfaction or his attitude, while the physical reality is what he actually does, or his manifest behavior.
It has been argued that residential propinquity brings people together since initial eye contact can turn into casual neighboring and deeper relations if there exists a perceived compatibility.The fam ilies’ stage in the life cycle and child rearing practices can also contribute to the perceived homogeneity of the neighbor
hood. It has also been noted, particularly after people move into new housing, that there is a natural tendency to seek friends from the immediate neighbors. Over time, however, many of the factors contributing to the proximate neighboring cease to be as important, particularly if the mutual aid had resulted from the problems of new occupancy. Gans (9) indicates that of the two years in Levittown less than one-third (31%) of the respondents had the majority of their friendships on the same street, and one- third indicated no friends came from the same street, while the remainder reported that half of their friends were on the same street.
The conditions where spatial proximity contributes to friendship can be described as homogeneity and solidarity. The literature points to public housing or high rise housing where these conditions tend not to exist. There are indications that public housing generally lacks any form of neighboring behavior within their confines, Hartman (10) found that Boston’s West Enders thought that residents of public housing were not at all like themselves. Young and Willmott (11) found that residents of nearby and similar ghetto areas in London consider each other as members of different cultures when placed side by side in a new housing development. Much of the research indicates that there is a decided feeling of heterogeneity among residents of public housing in many places, even if objective data could prove otherwise.
OBJECTIVESThis research investigation aims at the individual’ s percep
tions of whether or not particular spatial patterns will properly accommodate his personal characteristics, values, and style of life within the context of public housing. The framework for studying residential satisfaction is based upon the relationship that certain physical features of the environment have to the residents’ satisfaction and the conceptions of their ideal environment. Responses were sought to two major physical dimensions of the environment; dwelling satisfaction and neighborhood satisfaction.In order to partially explain the nature of the respondents’ satisfaction, three other dimensions were introduced into the study.The first was neighboring behavior, or the frequency and quality of personal contacts. Second was the degree to which the residents work together towards common goals, or neighborhood solidarity. Third, a measure of the respondents’ concern for entering into new situations, i .e . , exploratory behavior and sensation seeking.
It has been asserted that residential density may be related to measures of residential satisfaction, particularly in neighboring behavior and environmental disturbances. This study is , however, am evaluation of one residential setting which does inhibit comparative analysis. While other research studies have explored com parative densities and their differential impact on residential satisfaction, we propose, to the extent possible, to compare our findings with other equivalent studies.
STUDY PLAN
The study consisted of interviews from 90% of the households of a public housing project located in Chapel Hill, North Carolina and occupied by black families. Ridgefield Park is a multi-family, turnkey 1 (rental) housing project located east of Chapel Hill, a university town of 25,000 persons. The residential density of Ridgefield Park is 5 .5 dwelling units per acre, which can be described as medium density within a range of from 2.5 or less to25.0 persons per acre.
DESCRIPTION OF POPULATION♦Associate Professor of Architecture, North Carolina State
University - Raleigh
119
The sample consisted of 40 black respondents, 80% of whom were female who were raised in small towns or rural areas. Most

of the respondents (90.0%) were raised in their own home, while 60% lived in a rented house prior to moving into this rental housing project. Almost all of the respondents (97.5%) would prefer home ownership if the choice were available. Slightly more than half (57.5%) of the respondents were between the ages of 35 and 59 with 37.5% between 18 and 34 years. Their total incomes did not exceed $6500; in fact, only 20.0% of the respondents reported incomes between $5000 and $6500. Over one-half of the group (57.5%) earned less than $3500 and 30.0% indicated that their income was less than $2000.
The average family size of the residents of this project is 5.6 where one-third (33.3%) of the population consists of children under 10 years. Another third of the population (32.3%) are between the ages of 11 and 17 years with the remaining 34.4% comprising those who are 18 years and older. Thus, two-thirds of the total population are of school age or younger.
The majority of the respondents (80.1%) describe Ridgefield Park generally as a good place to live with the exception for the aged, where many (57.5%) feel it is quite poor. Half of the respondents (52.0%) also reported that children’s outdoor recreational facilities were poor, though for 5-10 years old 52.2% indicate that they are “ good, ” while for under 5 years only 40.0% responded favorably and for teenagers only 35.0% had positive impressions.
NEIGHBORHOOD SATISFACTIONThe qualitative assessment of the residential environment is
described as neighborhood satisfaction. Though satisfaction has a multi-dimensional nature, the respondents were asked to judge their environment from the nine statements proposed to them. In addition they were requested to rate the importance of the attributes as they contributed to their “ ideal” neighborhood.
From the figure comparing satisfaction with importance it can be observed that the most important attributes that are least satisfied are convenience to shopping, safety, good place for child rearing, and having nice neighbors. In general two-thirds (67.5%) reported the neighborhood as being satisfactory. In Wilson’s (12) study of Greensboro and Durham, North Carolina 84% and 81%, respectively reported being “ satisfied” with their neighborhood. Similarly Lansing (13) also found high degrees of satisfaction with the communities in his study.
From the group of nine statements of satisfaction, a score of zero was attributed to negative response and one to a positive response. An index was developed where the scores were distributed into three categories, low, medium, and high. Responses from the total sample of 40 respondents indicated that 67.5% scored high, 30.0% medium, and 2.5% scored in the low category of satisfaction.
Percent Giving Area Highest
Rating on N. S. N(Base of Scale_____ Percentages)
A. Outdoor Play for Children Under 5 Years
Good 51.8 27Average 26.0Poor 22.2
B. Outdoor Play for Children 5-10 Years
Good 63.0Average 22.2Poor 14.8
C. Outdoor Privacy From Neighbors
Yes 37.0No 63.0
D. Noise Level in NeighborhoodNoisy Average Quiet
E. Frequency of Casual Neighboring
Every daySeveral times a week Once a week Once a month
F. Caring About Hearing Neighbors
Care very much Indifferent Don’t Care
G. Proportion of Neighbors Known by Name
AllNearly all Half of them A few of them
H. Location of NeighborsOne of the half dozen houses nearest you In another part of Ridgefield Park In the city Out of the city
TABLE 1: NEIGHBORHOOD SATISFACTION FOR RESPONSESRELATED TO SITE ARRANGEMENT
48.122.2 29.7
40.840.8 11.07.4
33.337.029.7
40.8 26.0 18.414.8
55. 6
11.122.211.1
NEIGHBORHOOD SATISFACTION AND SITE PLANNING IMPLICATIONS
The next part of the study compared NS to other neighborhood characteristics, influenced by density and site arrangement. Neighborhood satisfaction has a positive relationship with knowing and interacting with one’s neighbors. Slightly less than half (40.8%) of those who knew all their neighbors gave the neighborhood the highest ratings as did 81.6% who interacted “ several times a week” to “ daily” with their neighbors on a casual basis (Table 1). At the other extreme only 14.8% of those who knew “ just a few of their neighbors” and 18.4% of those interacting with their neighbors once a month or less, gave the neighborhood the highest rating. While those who described the neighborhood as “ noisy” (48.1%) gave the neighborhood a high rating, the awareness of noise increased as their satisfaction decreased. For example 83.3% of those who were less than highly satisfied, described the neighborhood as “ noisy. ” Generally then, the proportion of residents most satisfied with their neighborhood is highest if the outdoor play areas for children 5 to 10 years are good (63.0%) as well as for younger children (51.8%).
NEIGHBORHOOD COMPATIBILITYPrevious research has placed particular emphasis on the
importance of homogeneity in residential areas as well as com
patibility. Gans (14) indicates that little is known about the nature of shared characteristics, whether it is common backgrounds, or shared values or combinations of these. The indicators selected were those described by Lansing (15) et al as “ friendliness” and “ similarity. ” The distribution for these items was as follows:
It appeared that the respondents tended to consider a neighbor “ friendly” more so than “ similar. ” Other measures of homogeneity explored in this study were attitudes about the neighborhood as they are related to compatibility.
The casual neighboring contacts as well as the location of the visits are described below.
When comparing the frequency of neighboring visits and their location, it can be seen that the majority of visits occurring daily or several times a week (78.5% and 53.3% respectively) were within the “ half-dozen houses” nearest to the respondents. The more infrequent visits (50.0%) occurred in the city, a commuting distance away from the neighborhood.
Propinquity, then, results in visual contacts and ultimately produces social contact among neighbors. Homogeneity of the population, however, will determine how intensive the relationships will be. Fried and Gleicher (16) conclude that interpersonal commitments in the area, in the form of close contact, are related to highly positive feelings about the neighborhood as a whole.
When the respondents were asked about their knowledge of neighbors, 67.5% reported knowing nearly all of them by name. This corresponds to Lansing’s (17) findings where 80% of the resi-
120
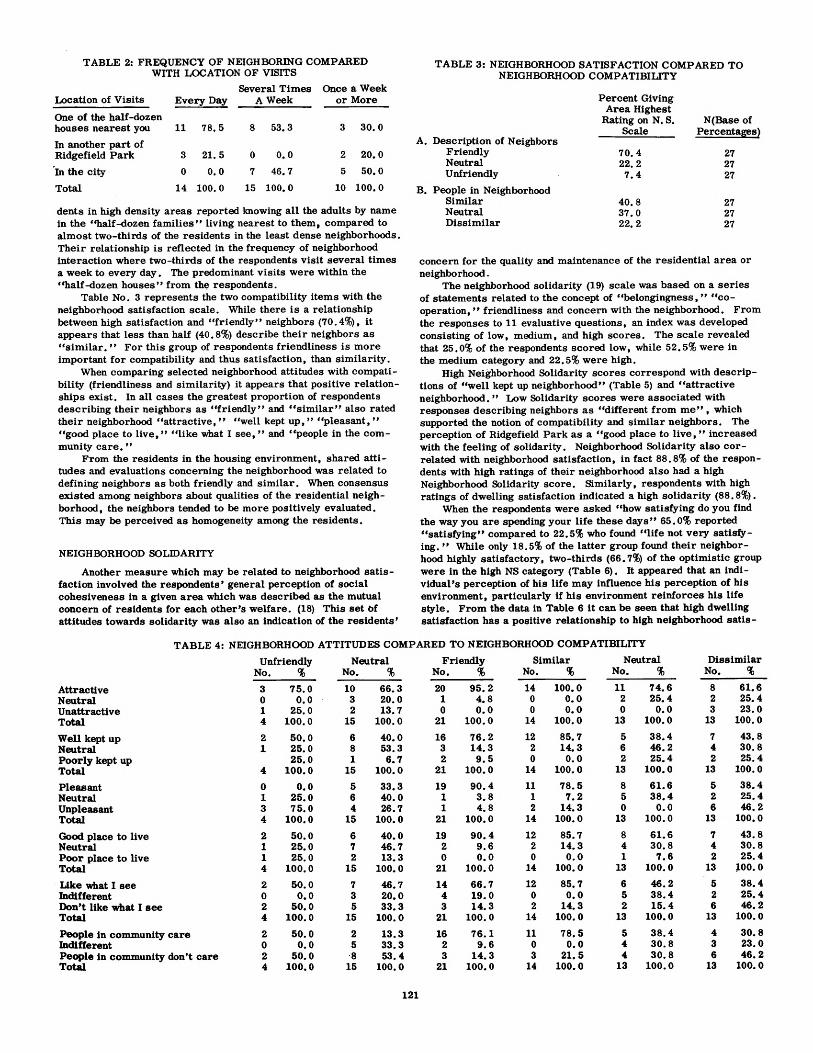
TABLE 2: FREQUENCY OF NEIGHBORING COMPARED WITH LOCATION OF VISITS
Several Times Once a WeekLocation of Visits Every Day A Week or MoreOne of the half-dozenhouses nearest you 11 78.5 8 53.3 3 30.0In another part of Ridgefield Park 3 21.5 0 0.0 2 20.0In the city 0 0.0 7 46.7 5 50.0Total 14 100.0 15 100.0 10 100.0
dents in high density areas reported knowing all the adults by name in the “ half-dozen families” living nearest to them, compared to almost two-thirds of the residents in the least dense neighborhoods. Their relationship is reflected in the frequency of neighborhood interaction where two-thirds of the respondents visit several times a week to every day. The predominant visits were within the “ half-dozen houses” from the respondents.
Table No. 3 represents the two compatibility items with the neighborhood satisfaction scale. While there is a relationship between high satisfaction and “ friendly” neighbors (70.4%), it appears that less than half (40.8%) describe their neighbors as “ similar. ” For this group of respondents friendliness is more important for compatibility and thus satisfaction, than similarity.
When comparing selected neighborhood attitudes with compatibility (friendliness and similarity) it appears that positive relationships exist. In all cases the greatest proportion of respondents describing their neighbors as “ friendly” and “ similar” also rated their neighborhood “ attractive, ” “ well kept up, ” “ pleasant, ” “ good place to live, ” “ like what I see, ” and “ people in the community care. ”
From the residents in the housing environment, shared attitudes and evaluations concerning the neighborhood was related to defining neighbors as both friendly and similar. When consensus existed among neighbors about qualities of the residential neighborhood, the neighbors tended to be more positively evaluated.This may be perceived as homogeneity among the residents.
NEIGHBORHOOD SOLIDARITYAnother measure which may be related to neighborhood satis
faction involved the respondents' general perception of social cohesiveness in a given area which was described as the mutual concern of residents for each other’s welfare. (18) This set Of attitudes towards solidarity was also an indication of the residents’
TABLE 3: NEIGHBORHOOD SATISFACTION COMPARED TO NEIGHBORHOOD COMPATIBILITY
A. Description of Neighbors Friendly
Percent Giving Area Highest
Rating on N. S. Scale
70. 4
N(Base of Percentages)
27Neutral 22. 2 27Unfriendly 7.4 27
B. People in Neighborhood Similar 40.8 27Neutral 37.0 27Dissimilar 22. 2 27
concern for the quality and maintenance of the residential area or neighborhood.
The neighborhood solidarity (19) scale was based on a series of statements related to the concept of “ belongingness, ” “ cooperation, ” friendliness and concern with the neighborhood. From the responses to 11 evaluative questions, an index was developed consisting of low, medium, and high scores. The scale revealed that 25.0% of the respondents scored low, while 52.5% were in the medium category and 22.5% were high.
High Neighborhood Solidarity scores correspond with descriptions of “ well kept up neighborhood” (Table 5) and “ attractive neighborhood. ” Low Solidarity scores were associated with responses describing neighbors as “ different from me” , which supported the notion of compatibility and similar neighbors. The perception of Ridgefield Park as a “ good place to live, ” increased with the feeling of solidarity. Neighborhood Solidarity also correlated with neighborhood satisfaction, in fact 88.8% of the respondents with high ratings of their neighborhood also had a high Neighborhood Solidarity score. Similarly, respondents with high ratings of dwelling satisfaction indicated a high solidarity (88.8%).
When the respondents were asked “ how satisfying do you find the way you are spending your life these days” 65.0% reported “ satisfying” compared to 22.5% who found “ life not very satisfying. ” While only 18.5% of the latter group found their neighborhood highly satisfactory, two-thirds (66.7%) of the optimistic group were in the high NS category (Table 6). It appeared that an individual’s perception of his life may influence his perception of his environment, particularly if his environment reinforces his life style. From the data in Table 6 it can be seen that high dwelling satisfaction has a positive relationship to high neighborhood satis-
TABLE 4: NEIGHBORHOOD ATTITUDES COMPARED TO NEIGHBORHOOD COMPATIBILITYUnfriendly Neutral
No. % No. %Attractive 3 75.0 10 66.3Neutral 0 0.0 3 20.0Unattractive 1 25.0 2 13.7Total 4 100.0 15 100.0Well kept up 2 50.0 6 40.0Neutral 1 25.0 8 53.3Poorly kept up 25.0 1 6.7Total 4 100.0 15 100.0Pleasant 0 0.0 5 33.3Neutral 1 25.0 6 40.0Unpleasant 3 75.0 4 26.7Total 4 100.0 15 100.0Good place to live 2 50.0 6 40.0Neutral 1 25.0 7 46.7Poor place to live 1 25.0 2 13.3Total 4 100.0 15 100.0Like what I see 2 50.0 7 46.7Indifferent 0 0.0 3 20.0Don’t like what I see 2 50.0 5 33.3Total 4 100.0 15 100.0People in community care 2 50.0 2 13.3Indifferent 0 0.0 5 33.3People in community don’t care 2 50.0 8 53.4Total 4 100.0 15 100.0
Friendly No. %
Similar No. %
Neutral No. %
Dissimilar No. %
20 95.2 14 100.0 11 74.6 8 61.61 4.8 0 0.0 2 25.4 2 25.40 0.0 0 0.0 0 0.0 3 23.0
21 100.0 14 100.0 13 100.0 13 100.016 76.2 12 85.7 5 38.4 7 43.83 14.3 2 14.3 6 46.2 4 30.82 9.5 0 0.0 2 25.4 2 25.4
21 100.0 14 100.0 13 100.0 13 100.019 90.4 11 78.5 8 61.6 5 38.41 3.8 1 7.2 5 38.4 2 25.41 4.8 2 14.3 0 0.0 6 46.2
21 100.0 14 100.0 13 100.0 13 100.019 90.4 12 85.7 8 61.6 7 43.82 9.6 2 14.3 4 30.8 4 30.80 0.0 0 0.0 1 7.6 2 25.4
21 100.0 14 100.0 13 100.0 13 100.014 66.7 12 85.7 6 46.2 5 38.44 19.0 0 0.0 5 38.4 2 25.43 14.3 2 14.3 2 15.4 6 46.2
21 100.0 14 100.0 13 100.0 13 100.016 76.1 11 78.5 5 38.4 4 30.82 9.6 0 0.0 4 30.8 3 23.03 14.3 3 21.5 4 30.8 6 46.2
21 100.0 14 100.0 13 100.0 13 100.0
121

T A B L E 5 : N E IG H B O R H O O D S O L ID A R IT Y A N D R E S P O N S E S T O N E IG H B O R H O O D C H A R A C T E R IS T I C S
Low Medium High Lowr Medium HighNo. % No. % No % No. % No. % No. %
A. Visual Assessment E. Spend More Timeof Neighborhood With Neighbors
Attractive 8 80. 0 16 76. 2 9 100. 0 Disagree 3 30. 0 7 33. 3 1 11.1Neutral 0 0. 0 4 19. 0 0 0. 0 Indifferent 4 40. 0 3 11. 3 0 0.0Unattractive 2 20. 0 1 4. 8 0 0. 0 Agree 3 30. 0 11 52. 4 8 88. 9Total 10 100. 0 21 100. 0 9 100. 0 Total 10 100. 0 21 100. 0 9 100. 0
B. Neighborhood F. FriendlyMaintenance Neighbors
Poorly kept up 1 10. 0 3 14. 3 0 0. 0 Unfriendly 2 20. 0 1 4. 8 2 22. 2Neutral 4 50. 0 7 33. 3 0 0. 0 Neutral 8 80. 0 7 33. 2 0 0.0Well kept up 4 40. 0 11 52. 4 9 100. 0 Friendly 0 0. 0 13 62. 0 7 77. 8Total 10 100. 0 21 100. 0 9 100. 0 Total 10 100. 0 21 100. 0 9 100. 0
C. Ridgefield Park as G. Similar Peoplea Place to Live in Neighborhood
Good 2 20. 0 13 62. 0 7 77. 8 Similar 1 10. 0 6 28. 6 7 77. 8Average 4 40. 0 4 19. 0 2 22. 2 Neutral 4 40. 0 8 38. 1 1 11. 1Poor 4 40. 0 4 19. 0 0 0. 0 Different 5 50. 0 7 33.3 1 11.1Total 10 100. 0 21 100. 0 9 100. 0 Total 10 100. 0 21 100. 0 9 100. 0
D. Dwelling H. NeighborhoodSatisfaction Satisfaction
Low 1 10. 0 1 4. 8 0 0. 0 Low 1 10. 0 0 0. 0 0 0. 0Medium 5 50. 0 8 38. 1 1 11. 2 Medium 6 60. 0 5 23. 8 1 11. 2High 4 40. 0 12 67. 1 8 88. 8 High 3 30. 0 16 76. 2 8 88. 8Total 10 100. 0 21 100. 0 9 100. 0 Total 10 100. 0 21 100. 0 9 100. 0
faction (66.7%). Similarly neighboring is regarded as an important contribution to satisfaction (66.7%) as well as having m ore time to spend with neighbors (55.5%).
DWELLING SATISFACTIONDwelling satisfaction is a cumulative measure of the respon
dent’s assessment of his residential environment. Based on the respondents’ answers to 12 statements dealing with various characteristics of a dwelling, such as spatial arrangement, spatial preference, and functionality, they rated each statement as satisfactory or unsatisfactory as well as indicating the degree of im - protance that would contribute to an ideal dwelling.
Assessments of their dwelling revealed that the m ajor areas of dissatisfaction were “ street noise, ” “ children’s play space, ’ ’ “ front p orch ,’ ’ “ outdoor privacy, ’ ’ and “ storage” (Table 7).Their expectations based on importance suggested a primary concern for outdoor privacy particularly in the backyard, as well as internal privacy which was satisfactory to a greater extent.
TABLE 6: NEIGHBORHOOD SATISFACTION FOR OTHER RELATED FACTORS
Percent Giving Area HighestRating on N. S. N(Base of
Scale Percentages)Neighborhood Maintenance
Well kept up 59. 3 27Neutral 29. 6Poorly kept up 11.1
People Like to Spend More Time With Neighbors
Agree 55. 5Indifferent 18. 5Disagree 26. 0
Dwelling SatisfactionHigh 66. 7Medium 33.3Low 0. 0
Importance of Neighboring Behavior
Important 66. 7Indifferent 22. 2Not important 11. 1
Self SatisfactionSatisfied 66.7Indifferent 14. 8Not important 18. 5
TABLE 7: DWELLING SATISFACTION FOR RESPONSES RELATED TO ATTRIBUTES OF THE NEIGHBORHOOD
Neighborhood As a
Percent Giving Dwelling Highest
Rating on D.S. Scale
Place to LiveGood 82. 6Neutral 13. 1Poor 4. 3
Like What I See From Front Door
Agree 78.3Indifferent 13. 0Disagree 8.7
Noise From NeighborsSeldom 60.9Occasionally 34. 8Often 4.3
Neighborhood SatisfactionHigh 78. 3Medium 21.7Low 0. 0
N(Base of Percentages)
23
The 12 statements were indexed into a scale where the respondent’s scores were classified into three categories, low, medium, and high. The distribution of responses indicate that over one- half (57.5%) were high, 37.5% medium, and 5.0% were in the low category of satisfaction. This index was then used to compare with other attitudinal responses to the residential environment.
As dwelling satisfaction increased the concern for private outdoor space decreased. While 60.9% of those with high D.S. described a lack of outdoor privacy, 86.7% with a lower level of D.S. indicated a higher awareness of the lack of private outdoor spaces. Similarly 47.8% of the respondents with a high D.S. indicated that the neighborhood was noisy, while that proportion of respondents increased (73.3%) as their satisfaction decreased.
It is evident however, that there is a positive relationship between high D. S. and neighborhood characteristics. For example respondents with a high D .S . described their neighborhood as a “ good place to live, ” (82.6%) that they liked what they saw from the front door (78.3%) and rated their N .S ., high 78.3%.
ENVIRONMENTAL DISPOSITIONIn addition to preferential responses, an attempt was made to
relate environmental assessment to environmental disposition, a
122

function of an individual’s personality. (20)This set of statements attempted to describe the respondent’s
personality characteristics with respect to his exploratory behavior and preference for new and different environments. From the 12 statements on environmental disposition (ED) an index was developed where 57.5% of the respondents scored high, 37.5% scored medium and 5.0% scored low.
Most of the respondents (74.0%) With high ratings on the ED .scale described their neighborhood as “ attractive. ’ ’ This is particularly revealing since it is the most powerful indicator of visual impact.
Exploratory behavior is associated with seeking new faces continually rather than the comfort of familiar old faces. This is reflected in the perceptions of “ neutral’ ’ or “ unfriendly’ ’ people in the neighborhood by one-half of the high ED respondents (Table 8). The need to explore new social relationships may influence the respondent’s own neighboring relationship. As the individual’s disposition was less oriented towards exploring new relations the greater were his tendencies to perceive his neighbors as “ friendly. ” From our data, low ratings on the ED scale were associated with higher proportions of respondents describing their neighbors as “ friendly. ”
TABLE 8: ENVIRONMENTAL DISPOSITION FOR RESPONSES TO THE NEIGHBORHOOD
Percent Giving Area Highest
Rating on E.D. N(Base of Scale Percentages)
Visual Assessment on Neighborhood
Attractive 74.0Neutral 13.0Unattractive 13.0
Neighborhood as a Place to Live
Good 65. 2Neutral 21. 8Poor 13. 0
Dwelling SatisfactionHigh 65.3Medium 34.7Low 0.0
Neighborhood SatisfactionHigh 60.9Medium 34.7Low 4.4
People in NeighborhoodFriendly 47.8Neutral 43.4Unfriendly 8.8
No. % No. %Friendly People 21 52. 5 Similar 14 35.0Neutral 15 37. 5 Neutral 13 32.5Unfriendly People 4 10.0 Dissimilar 13 32.5Total 40 100.0 Total 40 100.0
Frequency of NeighboringNo. %
Every day 14 35.0Several times a week 15 37. 5Once a week 7 17.5Once a month 4 10.0Total 40 100.0
Location of NeighborsNo. %
Within a half-dozen houses 22 55.0Elsewhere in Ridgefield Park 5 12.5In the city 10 25.0Out o f the city 3 7.5Total 40 100.0
CONCLUSIONAfter six months of occupancy in Ridgefield Park the residents
appeared to be self satisfied and generally pleased with their new environment. Considering the unsatisfactory conditions of their previous habitats these attitudes were plausible. While there were areas of dissatisfaction with the dwelling and the neighborhood, it is clear that the positive attributes far outweigh the negative attributes, at least for a majority of the residents.
Inquiries about the respondents’ expectations of an “ ideal” environment suggest that major importance is associated with all the attributes of the dwelling and neighborhood environment. It is assumed that longterm residency may influence a higher level of discrimination in the importance of environmental attributes, particularly since there may be a heightened awareness of importance due to the contrast in living conditions within a short period of time. There also appears to be a relationship between attributes described as “ unsatisfactory,” in the present environment and responses of “ extremely” important in the ideal setting. The implication is that negative aspects of the present environment may be highly exaggerated in expectations of the ideal environment.
Proximate neighboring, or sociability between neighbors, is a characteristic of many families where there is a perceived homogeneity among the residents. The similarity in value orientations toward neighboring behavior combined with the strong feelings of neighborhood solidarity reinforce the resident’s satisfaction with his neighborhood. Descriptions of “ friendly” neighbors were also associated with high neighborhood satisfaction. It is important to note that the need for mutual aid in neighbors is highest during early occupancy and as families adapt to their new surroundings, new neighboring patterns may emerge if the feelings of friendliness and similarity do not persist. It is clear however that the research findings in this study support the “ compatibility theory. ” Based on the positive relationship between Neighborhood Satisfaction and Neighborhood Solidarity it is hypothesized that attitudes toward solidarity may be a reliable predictor of an individual’s positive feelings about his environment.
The physical attributes of the environment are important as they contribute to or interfere with the resident’s life style. The negative characteristic of this residential setting was the noise factor, where the children’s contribution was substantial. The site planning arrangement featured dwelling clusters where the open public spaces were conducive for children’s play. The relative isolation of the project from other recreational resources restrained the children’s mobility such that a majority of the children who live in the project were observed daily, engaged in various play activities within the project boundaries.
Lansing’s studies in “ Planned Residential Environments” (21) point out that the evaluation of the neighborhood as “ noisy” contributes to the variation in neighborhood satisfaction in both high and low density areas.
While it has been stated that direct access to the outside maximizes control in child rearing, it should be further suggested that the nature of the outdoor areas should include sufficient play objects and play spaces and that easy access in and of itself is insufficient.
The lack of private open space has been described as an important element related to the residents’ dissatisfaction. This restrains the ability for active family pursuits, particularly when outdoor private area was an existing condition prior to the residents’ relocation.
From our findings we can impute that improved housing increases the awareness level of the residents and ultimately may influence their housing aspirations.
These findings generally support the notion of the relatedness of the physical environment and social conditions. While it has been stated that the architect has never systematically evaluated his product, the knowledge gained can be viewed as a positive source for the improvement of the environment.
REFERENCES1. HUD Newsletter, Office of Public Affairs, Washington, D.C.
(Aug. 30, 1971), Vol. 2 No. 3.
123

2. Leon Festinger, Stanley Schacter and Kurt Back, Social Pressures in Informal Groups. New York, Harper Brothers, 1950.
3. Theodore Caplow and Robert Foreman, "Neighborhood Interaction in a Homogeneous Community. ” American Sociological Review, Vol. 15, No. 3 (June 1950), pp. 357-366.
4. Herbert J. Gans, "Urbanism and Suburbanism as Ways of Life. " A Reevaluation of Definitions, Chapter 4 in People and Plans. New York: Basic Books 1968.
5. John B. Lansing and Gary Hendricks, Living Patterns and Attitudes in the Detroit Region. Detroit Regional Transportation and Land Use Study, Detroit, Michigan, 1967.
6. Suzanne Keller, The Urban Neighborhood: A Sociological Perspective, New York, Random House 1968, pp. 106-123, 149-164.
7. William Michelson, Man and His Urban Environment: A Sociological Approach. Reading: Addison -W esley, 1970, pp. 168-190.
8. Michelson9. Herbert J. Gans, The Levittowners, Pantheon Books, N. Y.
1967.10. Chester Hartman, “ The Limitations of Public Housing:
Relocation Choices in a Working Class Com m unity." Journal of the AIP, Vol. 24, pp. 283-96, 1963. —
11. Michael Young and Peter Willmott, Family and Kinship in East London. Baltimore: Pelican Books, 1962, pp. 121.
12. Robert L . Wilson, "Livability of the City: Attitudes and Urban Development, " in Urban Growth Dynamics. F. Stuart Chapin, Jr. and Shirley F. W eiss (eds.). N. Y .: Wiley &Sons 1962, p. 37.
13. John B. Lansing, Robert W. Marans and Robert B. Zehner, Planned Residential Environments. Ann Arbor, Michigan, Institute for Social Research 1970.
14. Herbert J. Gans, "Planning and Social Life: Friendship and Neighbor Relations in Suburban Communities. ” Journal of the AIP, Vol. 27, No. 2, May 1961, pp. 134-140.
15. Lansing16. Marc Fried and Peggy Gleicher, "Some Sources of Residential
Satisfaction in an Urban Slum. " Journal of the AIP, 27 (Nov. 1961), pp. 305-315.
17. Lansing18. M iller, Delbert, Handbook of Research and Social Measurement,
McKay Publishing.19. Shuval, Judith, “ Class and Ethnic Correlates of Casual Neigh
boring" Am erican^ociological_Review, (Aug. 1956) 21: 453-58.20. Zuckerman, M ., E. A. Kolin, I. P rice , I. Zoob, "D evelop
ment of a Sensation Seeking Scale. ” Journal of Consulting Psychology, Vol. 28, No. 6 (Dec. 1964), p. 477-82.
21. Lansing
1 2 4