neogenix oncology, inc
TRANSCRIPT

Neogenix Oncology, Inc. May 3, 2011
Richard C. Nelson (212) 918-0478 [email protected]
Neogenix Oncology, Inc. Neogenix is a biotechnology research company that has engineered specific monoclonal antibodies that in laboratory tests have generated exceptional results in limiting and even eliminating human cancer tumors in mice. Successful clinical trials (the company is in Phase I trials with its antibody NEO-101; Ensituximab [formerly known as NPC-1C]) could greatly impact cancer treatment as we know it today. Highlights
The company’s primary focus markets are pancreatic and colorectal cancer, but its technology has applicability and potential efficacy in treating other related cancers. To date, there is little effective treatment for pancreatic cancer.
It is estimated by the American Cancer Society that in 2008 in the Developed World there will have been 165,100 new cases of pancreatic cancer and 727,400 cases of colorectal cancer.
Neogenix’ technology demonstrated efficacy in treating cancer tumors in the 70’s and 80’s. Limited refinement technology at the time prevented the progression to commercialization. Subsequent and major advances in refining and purification techniques should allow the company to advance to commercial viability once it successfully completes its renewed program of human clinical trials.
Human clinical trials for NEO-101 commenced in December of 2009 and should be concluded in the third quarter of this year. In November of 2010, the company also received patent approval for its third distinct monoclonal antibody, NPC-201.
Major pharmaceutical companies are finding it increasingly difficult to internally develop new blockbuster drugs. Small research companies that successfully develop therapeutic agents that show meaningful efficacy can financially turbo-charge a major pharmaceutical company.
Small research companies in Phase I to Phase III stages of development with one primary drug (and offshoot applications) present a wide range of valuations. The mean for companies in Phase I and/or Phase II stages is about $279 million, and the mean for those companies that are in Phase III is about $1.6 billion. One might argue that given that Neogenix’ technology has already been well tested and its Phase I trial is nearing a close, the company is deserving of a favorable bias.
The company is well along in developing diagnostic products based on its technology, a completely different commercial sphere and one which offers unique economic dynamics in its own right. Furthermore, this segment offers the promise of relatively swift revenue generation.
Based on our projections, the many positive indications realized to date, the proximity to next stage trials, we calculate a value for the company of $96 per share (see Valuation sections).
Neogenix Oncology, Inc.
Consilium Global Research May 3, 2011 2
Company Background: Neogenix specializes in the study and engineering of monoclonal antibodies (mAb). The company’s primary drug candidate, NEO-101 (Ensituximab), has shown remarkable effectiveness in identifying a specific tumor cell surface protein and binding to that protein, thus allowing the body’s immune system (Natural Killer T Cells) to quickly target those very same cancer cells. Remarkably encouraging results to date have been achieved in laboratory tests using specially bred, immune deficient mice. The range of cancers that are being targeted include pancreas, colorectal, prostate, squamous lung, ovarian and other squamous-type cancers. The company has two other “humanized” mAbs, NEO-301 (formerly known as “31.1” or “31.1C”) and NEO-201 (formerly known as NPC-201), that are in various stages of development. The inherent nature of NEO-101 serves as a strong foundation for the development of three distinct business lines – therapeutics, diagnostics and vaccines, each of which might someday be valued in the billions of dollars. Neogenix is well along to achieving commercial reality and since February of 2010 has been in Phase I clinical trials for NEO-101. The company is also in the process of raising another $45.25 million in equity capital (after fees). Background Neogenix was founded in 2003 by, amongst others, Dr. Myron Arlen, one of the leading cancer specialists in the country. However, the origins of the company reach back to the 1970’s and 1980’s. During that time, Dr. Arlen collaborated with Dr. Ariel Hollinshead, a pioneer scientist in tumor immunology at George Washington University Medical Center in Washington, D.C. The nature of their work was to identify Tumor Specific Antigens (TSAs) from a variety of cancer patients’ tumors. In essence, they were looking for a path to a cancer vaccine. TSAs are essentially specific proteins that are emitted on the surface of cancer cells and are unique to those cells. These TSAs were administered to cancer patients and tested in Phase I, II and III clinical trials in the United States. The data showed measurable anti-tumor responses without serious side effects. The Hollinshead initiative hit a roadblock, however. The FDA has certain requirements with regard to vaccine production and does not allow synthesis of vaccines derived from allogenic sources. In addition, it necessitates that a vaccine produced is of good manufacturing practices (GMP) grade and manufactured in a GMP production facility. The TSA vaccines generated 25 years back and tested in tumor patients could not be used for commercialization purposes. Fortunately, Dr. Arlen had the presence of mind to acquire the vast library of TSAs that had been built by Hollinshead at George Washington University and bring that body of work to Neogenix. Neogenix has overcome this commercialization roadblock by adopting a novel approach by using its TSAs as immunogens to develop mAbs. Phase I, II and III Histories The company has already demonstrated a certain level of efficacy in cancer patients in clinical trials that were conducted in the late 1970’s and early 1980’s. These trials used the monoclonal antibodies used in vaccines that were being developed by Hollinshead at the time. These

Neogenix Oncology, Inc.
Consilium Global Research May 3, 2011 3
vaccines now form the basis of the specific mAbs that the company is putting forth as drug therapy candidates and diagnostic tools. The technology at the time proved too limiting to enable Hollinshead to carry her research to commercialization, one of the obstacles being the need to adequately purify the serum that would eventually be used for wide distribution. The technology has since improved to such an extent that purification should no longer be an impediment. The Science Tumor cells exude and shed small pieces of proteins called “Tumor Specific Antigens, or “TSAs” for short. When they break off, they go into the blood stream. TSAs are distinct from TAAs (Tumor Associated Antigens) in that TAAs might also originate from other normal cells. It is the result of 40 years of cumulative research that has allowed Neogenix to identify the antigens that are unique to only a cancer tumor. When there are enough TSAs in the blood, the body might make “antibodies” as a defense - but not always. “Antibodies” are “Y”- shaped proteins made by the immune system. Ideally, the antibodies will go to the cancer cells, attach to the TSAs oozing out of the cell walls, and a TSA/antibody will bind by shape and electrical charge. The bound antibodies then attract the “Natural Killer T Cells” (“NK cells”) that are part of our white blood cell/immune system. The NK cells attach to the antibody/TSA cancer cell and release nitric oxide - the actual killing chemical that breaks down the cancer cell wall. Prior to the antibody binding, the TSA/cancer cell is invisible to the NK cell. When antibodies are not recognizing the cancer TSAs, the cancer cells tend to proliferate uncontrolled. The Hollinshead/Arlen work recognized that there are many different TSAs exuding from cancer cells and, to make it more complicated, different types of cancer cells exude different types of TSAs. This is what makes the Hollingshead data base and work so valuable - it indicates which TSAs of particular cancers are recognizable to particular antibodies. NEO-101 (Ensituximab), the company’s lead mAb, was genetically engineered by the process called chimerization to replace the two-third mouse amino acid sequence of the protein with human sequence to reduce any potential side effects that are caused by native mouse mAb. The genetically engineered chimerized antibody (NEO-101), like its native, does not affect normal cells; it attaches only to the cancer (tumor) that emits the recognizable TAA. Zeroing in on Stem Cells One of the greatest challenges in fighting cancer is dealing with the imbedded stem cells that form the basis of fully mature cancer cells. Many treatments today that are designed to chemically destroy cancer cells directly or the vascular paths that help sustain cancer cells often fail to destroy or contain the stem cells that are neatly tucked away in the body’s deeper recesses. The result tends to be only a delay in the inevitable victory of the cancer. The elegance of the company’s NEO-101 and NPC-201 mAbs is that they ferret out all cancer cells that generate the specific TSAs. Normal cells are unaffected.

Neogenix Oncology, Inc.
Consilium Global Research May 3, 2011 4
Monoclonal Antibodies As mentioned earlier, the study of monoclonal antibodies gained considerable traction in the 1970’s and was pursued by a wide array of educational institutions and private companies. Each monoclonal antibody has a unique structure that interacts with human cells, both cancerous and normal, in specific ways, much of which is determined by the interaction with the proteins of the affected cells. It is very difficult to predict in advance the full affect a monoclonal antibody will have on cell structure, but research has shown varying degrees of success in binding to and impeding the growth of cancerous cells.
The first monoclonal antibody approved for cancer was rituximab (Rituxan®) in 1997. It was initially developed by Ronald Levy at the Stanford School of Medicine to treat follicular lymphoma, the most common type of indolent (slow-growing) non-Hodgkin�’s lymphoma. �“When rituximab was developed, everyone working in the field thought it was going to be a marginal drug that would benefit a small number of patients with relapsed and refractory disease,�” remembered Andrew D. Zelenetz, Chief of Memorial Sloan-Kettering�’s Lymphoma Service. �“But it turned out we were all wrong. For patients with follicular lymphoma, a combination of rituximab with chemotherapy has resulted in improved disease control and prolonged survival. In patients with diffuse large B cell lymphoma, the most common lymphoma subtype worldwide, the addition of rituximab to the standard chemotherapy protocol known as CHOP increased the cure rate by about 15 percent.�” Rituximab, which binds to the protein CD20 on the surface of B cells, has three different mechanisms of action. Its primary way of killing cancer cells is by eliciting an immune response, drawing what are known as effector cells (various types of killer white blood cells) to the tumor and activating them. This process is called antibody-dependent cell-mediated cytotoxicity (ADCC). Another mechanism is directly causing the cells to undergo apoptosis (programmed cell death). The third mechanism is by activation of what are called complement proteins. These proteins form a membrane-attack complex and poke holes in the membranes of cells, killing them. Because CD20 is present on the surface of normal B cells as well as leukemia cells, normal B cells are killed as well. �“We make 10 million B cells a day, and most of them die anyway,�” Dr. Zelenetz said. �“So when we target B cells and knock them out, they are easily replaced. It�’s possible that long-term use of rituximab could lead to an increased risk of some types of infections, but it�’s something we really haven�’t seen as a frequent problem.�” Oral Cancer News, April 2009
Phase I Trial: NEO-101 Neogenix began Phase-I trial for NEO-101 (Ensituximab) in February of 2010 and continues to be conducted at Johns Hopkins Hospital, Duke University Medical Center and North Shore University Hospital in Manhassett, NY . The protocol includes pancreatic cancer patients who have failed first line therapy, as well as metastatic colon cancer patients who are refractory to standard treatment. The inclusion of colon cancer patients has expanded the scope of the Phase I trial and may afford Neogenix with the opportunity to collaborate with a partner in the development of a commercial Neogenix monoclonal antibody against colon cancer. It is hoped that the Phase I clinical trial will be completed by the third quarter of this year. The Phase I trial protocol currently provides that, following completion of the Phase I trial, the company would enroll an additional 10 patients with pancreatic cancer in a Phase IIA component, subject to FDA and Institutional Review Board (IRB) approval. If all goes well, full Phase II trials will commence soon thereafter.

Neogenix Oncology, Inc.
Consilium Global Research May 3, 2011 5
In addition, as part of the process related to clinical trials, the company is developing a companion diagnostic assay (immunohistochemistry) for co-development of the clinical trial. This diagnostic assay will screen for the presence of the NEO-101 antigenic marker and the applicability of the NEO-101 treatment. Importantly, in November of 2010 the U.S. Food and Drug Administration granted orphan drug status to NEO-101 for the treatment of pancreatic cancer. Orphan drug status entitles the company to seven years of marketing exclusivity for NEO-101 for the treatment of pancreatic cancer upon regulatory approval, as well as the opportunity to apply for grant funding from the U.S. government to defray costs of clinical trial expenses, tax credits for clinical research expenses and potential exemption from the FDA’s application user fee. Chimerization As mentioned earlier, one of Neogenix’ keys to a potentially effective result in humans is that it has engineered its NEO-101 and NPC-201 mAbs with human protein sequences, thus greatly diminishing the risk of serious side effects in humans. Chimerization (or “humanization”) is necessary to develop a therapeutic antibody that can be safely injected into humans. Chimerization is performed by splicing together the relevant parts of mouse and human antibody genes (genetic engineering) and producing the hybrid protein. Chimerization diminishes the human anti-mouse antibody response (HAMA) and allows for a greater therapeutic effect of the antibody. Cancer – the Market Cancer is a leading cause of death worldwide: it accounted for 7.6 million deaths (around 13% of all deaths) in 2008. Lung, stomach, liver, colon and breast cancer cause the most cancer deaths each year. By 2030, the global burden is expected to grow to 21.4 million new cancer cases and 13.2 million cancer deaths simply due to the growth and aging of the population, as well as reductions in childhood mortality and deaths from infectious diseases in developing countries. The estimated rise takes into account expected slight declines in death rates for some cancers in high resource countries. Chart 1 - Leading Sites of New Cancer Cases and Deaths in the United States The chart on the following page shows the number of estimated new cases for selected cancers in the U.S. for the year 2010. For Neogenix’ primary target cancers, Pancreatic and Colo-Rectal, approximately 186,500 cases were expected to have occurred with approximately 88,000 deaths taking place. One can look at some global statistics in Appendix VII.

Neogenix Oncology, Inc.
Consilium Global Research May 3, 2011 6
Table 1 - Leading Sites of New Cancer Cases and Deaths in the United States - Est. 2010
Source: American Cancer Society
******************************************** Valuation Background It is difficult to make specific valuation judgments in this sphere because the uniqueness of each company can be profound. It stands to logic, however, that value, on average, does ascend as a company progresses up the human clinical trial ladder. In our selected universe of peer companies (appendix IV), we have calculated the following average market values of companies in different stages of clinical trial development, complicated in many instances by companies having different programs in different stages of development.
Est. New Cases Deaths Est. New Cases Deaths
Prostate 217,730 Lung & bronchus 86,220 Breast 207,090 Lung & bronchus 71,080
Colon & rectum 72,090 Prostate 32,050 Lung & bronchus 105,770 Breast 39,840
Lung & bronchus 116,750 Colon & rectum 26,580 Colon & rectum 70,480 Colon & rectum 24,790
Non-Hodgkin lymphoma 35,380 Pancreas 18,770 Uterine corpus 43,470 Pancreas 18,030
Urinary bladder 52,760 Liver 12,720 Thyroid 33,930 Ovary 13,850
Melanoma of the skin 38,870 Leukemia 12,660 Non-Hodgkin lymphoma 30,160 Non-Hodgkin lymphoma 9,500
Kidney 35,370 Esophagus 11,650 Melanoma of the skin 29,260 Leukemia 9,180
Oralcavity & pharynx 25,420 Non-Hodgkin lymphoma 10,710 Kidney & renal pelvis 22,870 Uterine corpus 7,950
Pancreas 21,370 Urinary bladder 10,410 Ovary 21,880 Liver 6,190
Leukemia 24,690 Kidney 8,210 Pancreas 21,770 Brain 5,720
All sites 789,620 All sites 299,200 All sites 739,940 All sites 270,290
Source: American Cancer Society
Male FemaleUnited States
Est. New Cases Deaths
Colon & rectum 142,570 Colon & rectum 51,370Pancreas 43,140 Pancreas 36,800
Total 185,710 88,170
Total
Neogenix Oncology, Inc.
Consilium Global Research May 3, 2011 7
The difficulty in such a guide, however, is that many proposed therapies are limited in either effectiveness or market potential. The uniqueness of Neogenix is that the history of its science is already one of measured success and the markets it is addressing are substantial.
Table 2 Average Market Statistics
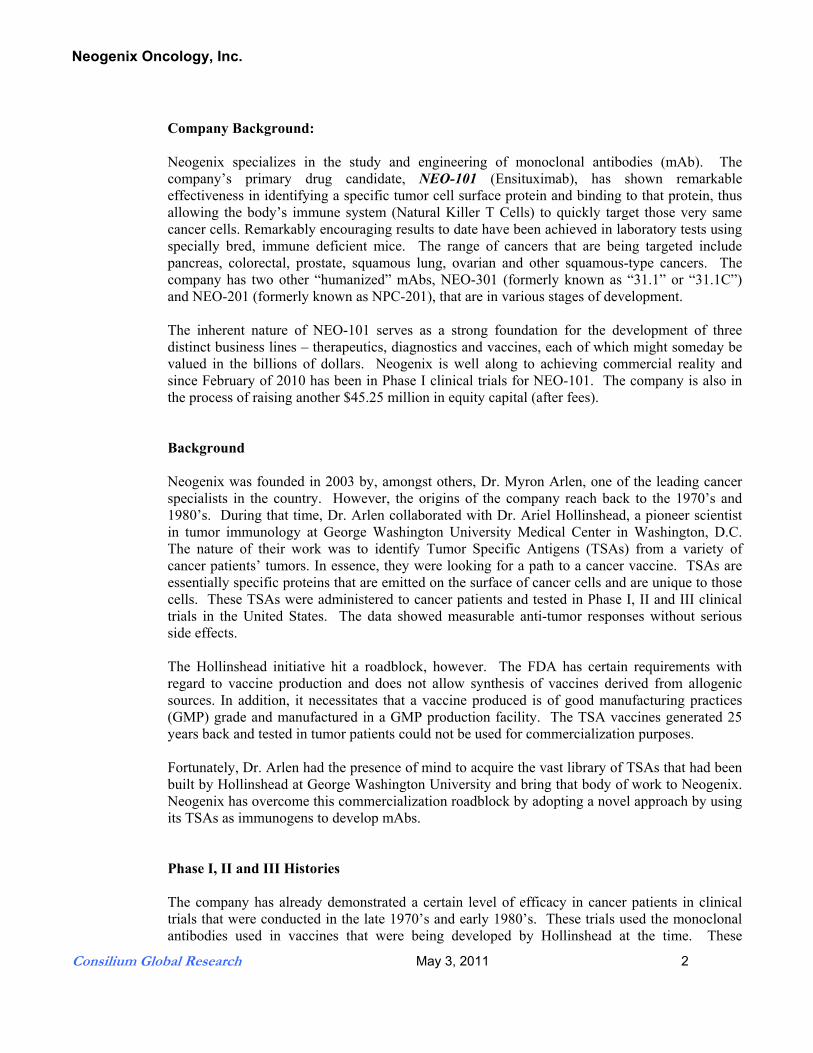
Importantly, the company offers the potential for three separate revenue sources – Therapeutics, Diagnostics and Vaccines. The methodologies we used to determine value were largely based on demographics as well as current statistics on cancer diagnosis and mortality rates. The results we arrived at are at considerable variance to what the above table might suggest, but we believe that the company’s scientific platform - the use of mAbs to help target specific cancer sites - has already generated sufficient anecdotal data to support a favorable bias in valuation. THERAPEUTICS Revenue Potential Related to Pancreatic and Colorectal Cancers
If one looks at the table of selected biotechnology/biopharmaceutical companies that are in human clinical trials, the valuations swing widely depending upon a host of different factors. The sizes of the target markets, the science employed, the degree to which pre-clinical results offer encouragement and the levels of debt and cash burn are just some of the factors that affect a company’s valuation. In the Peer Company table found in Appendix IV, the average market valuation is about $716 million, and that includes an average of about $45 million in debt. As mentioned earlier, Neogenix is somewhat unique in that its mAb technology has already demonstrated meaningful and favorable results in Phase I through Phase III clinical trials in the late 1970s and early 1980s. (The company was unable to carry through on its science because the purification techniques for creating the mAb’s were still inadequate, a problem that has since been solved.) Accordingly, it is logical to argue that Neogenix is deserving of a favorable bias in whatever valuation method is employed. If one looks at the valuation assigned to some of the bigger pharmaceutical companies (Appendix VI) that are involved in mAb research and have products on the market, the average of their total enterprise values (market capitalization + debt) to LTM revenues calculates to about 3.3x. If one uses a valuation of only 2.5x potential revenues, the market value for Neogenix, just for the two therapeutic applications indicated above, would eventually be about $7 billion. On a share base of roughly 43 million shares (warrants and options included), the value per share calculates to $162, but this end-point valuation is not discounted for time or risk, which should be substantial. We apply some fairly hefty discount rates in our valuation methodology.
Mkt Value$mm (Diluted)
Mean $760.5Median $340.0 Mean Phase I / II * $279.2Mean Phase III * $1,566.7* Includes separate, earlier stage programs

Neogenix Oncology, Inc.
Consilium Global Research May 3, 2011 8
[The reason why we have chosen to use the major companies for comparative guidance is that, should NEO-101 prove efficacious in humans, we believe that the value of the company would instantly elevate and approach the valuation of a major pharmaceutical company. In addition, not only should valuation be based on what Neogenix’ revenue capability might be, but what the technology in the hands of a major pharmaceutical company might be.]
Value Potential for the Therapeutics Segment On an international basis, if one focuses on Neogenix’ primary end markets, pancreatic cancer and colorectal cancer, we see that estimated new cases for pancreatic cancer for 2008 total about 165,100 for both men and women in “Developed Countries” and for colorectal cancer the number is about 727,400. If one assumes that Neogenix were to penetrate 20% of the market, that a 25% royalty fee is obtained via licensing with a major pharmaceutical company and that the cost of treatment is approximately $50,000 per patient, the annual revenue potential of pancreatic cancer to Neogenix would total about $1.3 billion per year. For colorectal cancer, the revenue potential would be approximately $5.7 billion. A fully commercial product is still four to six years off, so we employed a 35% annual discount rate to our projected values for that time frame. We also assumed a valuation of only 2.5x revenues, resulting in a 4-6 year average valuation calculation of $37.20 per share. The following table highlights our assumptions: Table 3
Source: American Cancer Society Other Reference Points Erbitux – A Guiding Metric The Holy Grail of drug monetization is exemplified by the recent purchase by Eli Lilly & Co. of Imclone Systems Inc., primarily for that company’s promising cancer drug, Erbitux. The total value of the transaction was $7.1 billion. At the time, Bristol Myers Squibb Company owned 16.63% of Imclone and had earlier made a lower offer for the company. Total sales for Erbitux in 2008 were $1.4 billion.
Therapeutics Revenue Potential (Developed Countries)
TargetMarket
Est. Numberof Cases (1)
25% MarketShare
Potential(mm)
TreatmentPer
Patient
25% Royalty
Fee
ProjectedRevenuePotential
(mm)
Valuation2.5 x
RevenuePer Share
Value
FD SharesOutstdg
(mm)Pancreatic Cancer 165,100 41,275 $50,000 25.0% $515.9 $1,289.8 $29.95 43.06Colorectal Cancer 727,400 181,850 $50,000 25.0% $2,273.1 $5,682.8 $131.97 43.06
(1) Based on 2009 Estimates
Present Value
Year 1 2 3 4 5 6AverageYrs 4-6
Combined Per Share Present Value $119.95 $88.85 $65.81 $48.75 $36.11 $26.75 $37.205
Discount Rate 35.0%Discounted Value 1.350 1.823 2.460 3.322 4.484 6.053

Neogenix Oncology, Inc.
Consilium Global Research May 3, 2011 9
Other examples of M&A activity in the “antibody” space are found in the following table: Table 4
Source: Thomson Reuters (See Appendix II for additional company transactions for 2009-2011. Also, Appendix III shows a listing of the revenue metrics for the top cancer drugs.) Please note that, in our valuation of the Therapeutics segment for Neogenix, we are using only a 2.5x potential revenue valuation, well below the typical experience of other mAB related transactions. DIAGNOSTICS Another Powerful Value Dynamic; A Faster Path to Revenues One of the key attributes of using the company’s mAb technology is that preliminary studies indicate that it shows considerable potential to be used to detect the early stages of colon and pancreatic cancer well before any signs or symptoms of the condition are evident. Currently, there is not a reliable test for pancreatic cancer. By identifying cells that are beginning to emit cancer related proteins even before they have become fully advanced cancer cells is a powerful capability and a considerable improvement over current tools. By the same token, such testing would only take place simply because the individual wishes to take a precautionary step – just in case. Of course, doctors are likely to strongly recommend such a test when a patient reaches a certain age or whose family has demonstrated a propensity for cancerous growth. All of these variables affect the economic metrics of Neogenix’ diagnostic potential. The company is in the intermediate stages of testing its diagnostic protocol with Conemaugh Memorial Hospital in Johnstown, Pennsylvania. The study began in December, 2008 and has produced very interesting results. Studies indicate that both of the company’s NEO-101 and NPC-201 (h16C3) antibodies have demonstrated a high degree of sensitivity1 and specificity2 in identifying the presence of antigens
1 Sensitivity is the probability that the test says a person has the disease when in fact they do have the disease. Sensitivity is a measure of how likely it is for a test to pick up the presence of a disease in a person who has it. 2 Specificity as the probability that the test says a person does not have the disease when in fact they are disease free.
M&A Activity Involving Antibody Companies
Year Acquirer Target CompanyPurchase
Price ($bil)
Target CompanyRevenues
($mm)
Priceto
Revenues
2006 AstraZeneca Cambridge Antibody Technology 1.1 67.0 16.02007 AstraZeneca MedImmune 15.0 1,350.0 11.12007 Amgen Abgenix 2.2 18.3 120.22009 Bristol Myers Squibb Medarex 2.4 61.0 39.32009 Roche (1) Genentech (1) 46.8 5.9 7.92010 Abbot Labs Facet Biotech 0.5 46.0 9.8
(1) Purchase is for 44% remaining shares of Genentech; target company revenues adjusted accordingly and in billions
Neogenix Oncology, Inc.
Consilium Global Research May 3, 2011 10
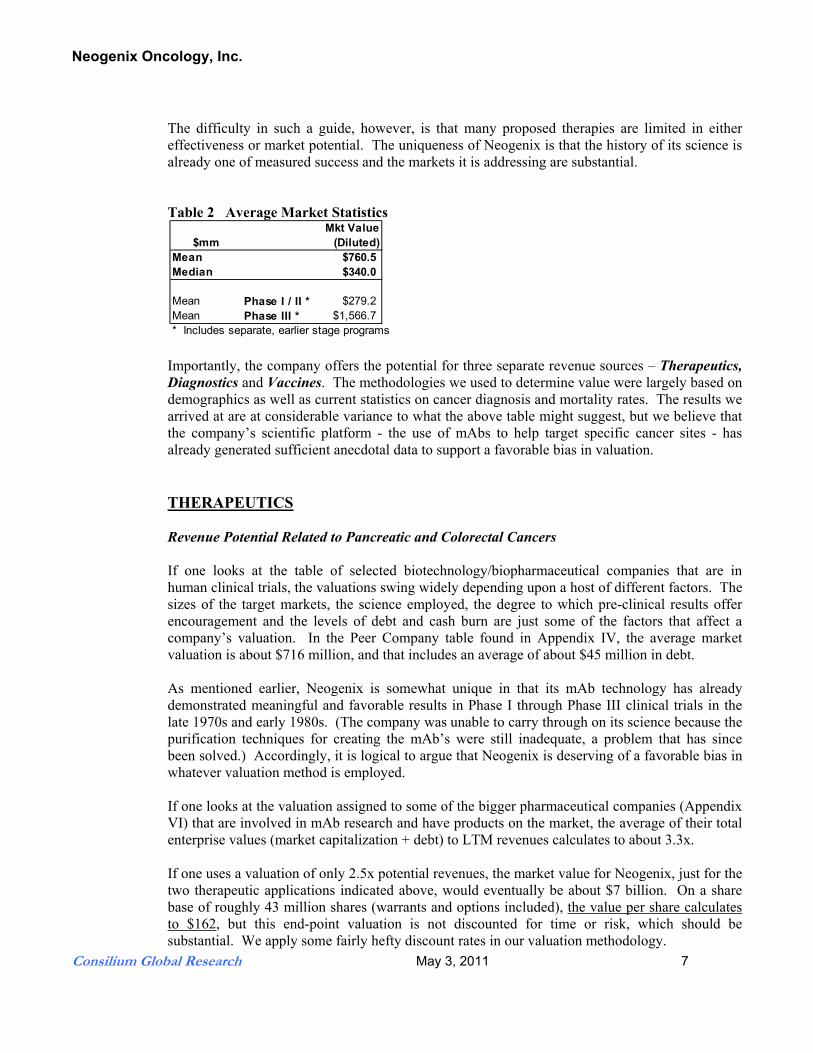
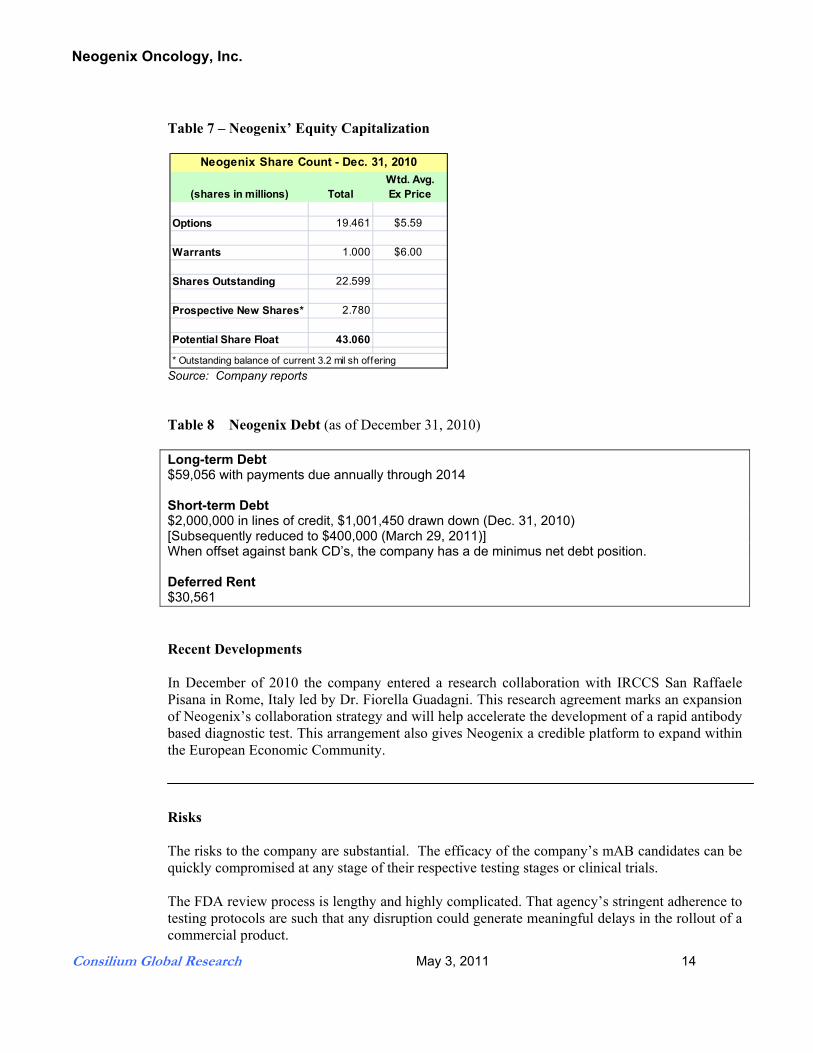
specific to pancreatic and colon cancers. Ideally, a test will have high degrees of sensitivity and specificity. The following table shows the degree to which the NPC-201 results stand out relative to existing and regrettably unreliable tests: Table 5
Source: Company data Almost as important is the fact that NPC-201 does not identify the antigens associated with other cancers such as lung cancer. The following table shows the comparison of NPC-201’s sensitivity to colon cancer (LS 174) and pancreatic cancer (CFPAC-1). H226 is the lung cancer extract. Table 6
Source: Company data (16C3 is now called NEO-201) One can see that the detection correlations with colon cancer (LS 174) and pancreatic cancer (CFPAC-1) are substantial whereas the correlation with lung cancer extract (H226) is extremely low, suggesting a remarkably accurate targeting capability on the part of the company’s NPC-201 antigen. Revenue generation might evolve within only 12 to 18 months as the company pursues a three-pronged approach with the FDA. It is hoped that the company will get CLIA approval expeditiously (Clinical Laboratory Improvement Amendments of 1988). Basically, if the company’s diagnostic tests meet certain levels of efficacy, it can be approved for limited use under the auspices of a fully approved laboratory facility. Such approval, while also adding
ASSAY % SENSITIVITY % SPECIFICITY16C3 (P<0.0001) 90 100CA19-9 (P<0.002) 39 100
CEA (P<0.001) 22 100
CA19-9 and CEA are standard tests that have limited effectiveness.ELISA - Enzyme-linked immunosorbent assay
Sensitivity and Specificity of 16C3 ELISA

Neogenix Oncology, Inc.
Consilium Global Research May 3, 2011 11
further credibility to the company’s science, would pave the way for royalties to be earned within a relatively short period of time. The second approach would be a 510k filing. A 510(k) is a premarketing submission made to the FDA to demonstrate that the “device” to be marketed is as safe and effective, that is, substantially equivalent (SE), to a legally marketed device that is not subject to premarket approval. Such approval would accelerate the commercialization of the company’s technology and logistically expand its reach in the marketplace. The final approach would be to file for a PMA. Premarket Approval (PMA) is the most stringent type of device marketing application required by the FDA. A PMA is an application submitted to the FDA to request approval to market. Unlike premarket notification, PMA approval is to be based on a determination by the FDA that the PMA contains sufficient valid scientific evidence that provides reasonable assurance that the device is safe and effective for its intended use or uses. All in all, though the prospect of therapeutic success provides the prospect of substantial investor returns, such value realization will still take three to five years to achieve given the nature of the FDA’s approval process. The significance of the company’s diagnostic potential is that revenues could well flow to the company much earlier (12 months to three years) and provide the company with needed cash flow and reduce the eventual need for additional capital and possibly greater dilution. In addition, the advent of revenues will boost the overall perceived value of the company. Diagnostic Valuation Potential We thought that a proper valuation would be based on demographics rather than cancer statistics. In a manner similar to the recommendation that every person who reaches the age of 50 should get a colonoscopy, we believe that such a recommendation will probably become standard for Neogenix’ diagnostic technology. Coverage of such a test by insurance companies and approval by Medicare/Medicaid will, of course, be important in determining how many people will elect to get such a test performed. Given the cost of treating cancer, it is highly likely that such testing will be encouraged by insurance companies. According to the U.S. Census Bureau, in July of 2009 there were approximately 90.5 million people aged 50 and older. In Europe, the population is even larger at 128.6 million (based on 2006 estimates). If one assumes that 25% of this combined population elects to have a Neogenix pancreatic cancer test each year, a 25% percentage would roughly translate to roughly 55 million tests per annum. Importantly, it is estimated that only about 60% of this population would meet the criteria to allow for a credible diagnostic test and also needs to be incorporated in the equation. At a per test royalty of $100, annual revenue potential would be $2.9 billion. Using a 2.0x sales multiple for this business line (see Appendix V), a value for this segment calculates to $5.8 billion, or about $135 per share, again not discounted for time value. The length of time it will take for a fully commercialized diagnostic product to reach market is somewhat less than a therapeutic product. By our reckoning, it will likely take three to five years before a full PMA has been awarded. Discounted at a lower 25% rate per annum (we think less risk), an average per share present value for this segment calculates to $56.10. As stated

Neogenix Oncology, Inc.
Consilium Global Research May 3, 2011 12
earlier, however, some revenues are likely to be generated within 12 to 18 months. Partly for this reason we chose to use a lower 25% discount rate. Other Diagnostic Applications If one applies this method to several of the other cancers that the company is looking to develop testing protocols for (Prostate, Lung and Cervical), our calculations would be diminished by a market of reasonably effective and much cheaper testing alternatives. A test for these cancers might bring in only $30 per usage. Approximately 80 million women in the U.S. and another 100 million women worldwide get tested for cervical cancer. Assuming that a Neogenix diagnostic test replaces or complements a pap smear and that the company achieves a 5% overall market share, Neogenix would theoretically realize annual revenues of $270 million. For prostate cancer, there are approximately 90.5 million men in the U.S. between the ages of 50 and 85 and another 128.6 million in Europe (as of 2006). Assuming only a 10% participation rate, a 5% share of such a market would produce revenues of $32.9 million. Finally, lung cancer tends not to be tested until symptoms have appeared, suggesting that a preliminary test will also have a low participation ratio. Assuming a 5% test rate of the population and a 1% market share, annual revenues of only $3.3 million would be generated. Combined, these supplementary tests could generate total annual revenues of $306 million, translating to an additional discounted per share present value to the company of $3.00 per share. Given that these additional testing protocols are likely to take some time to develop, we used an average of the endpoints for years 6 through 8. We used a valuation of only 2x projected revenues. These estimates are highly conjectural. One thing is certain, though. At least one test was likely given in each actual case of detected cancer. It bears mentioning that Thermo Fisher Scientific (NYSE: TMO - $$55.85) is selling Athena Diagnostics to Quest Diagnostics (NYSE: DGX - $57.76) for $740.0 million, or 6.7x revenue. Athena Diagnostics provides diagnostic testing services for neurological diseases with an emphasis on gene testing. Vaccines The original business focus of the Hollinshead project was to develop a cancer vaccine. This is an application that is still very much in the minds of management, but is something that will be addressed at a later time. Management is much more focused on the ongoing clinical trials for NEO-101. The Competition The landscape is broad and deep with companies that offer very different approaches in treating all sorts of cancers. The development and use of protein engineered technology to help the body uncover and fight cancer cells is not unique to Neogenix. However, the unfolding evidence suggests that the specific mAbs that have been and are being developed have different levels of

Neogenix Oncology, Inc.
Consilium Global Research May 3, 2011 13
efficacy, indicating that identifying and understanding the efficacy of specific mAbs can involve a long and arduous process. Neogenix has been fortunate in that its program has advanced very far on what could only be considered a limited budget. The company still keeps a lean staff of 25 employees (as of this writing). Recognition In May of 2010, Neogenix was named the Tech Council of Maryland's 2010 Emerging Company of the Year. In 2007, Neogenix won the prestigious Frost & Sullivan Award. The Frost & Sullivan’s Excellence in Research Award is bestowed upon a company that has carried out new ‘disruptive’ research and has, in general, a strong commitment to research and development. This award recognizes a company’s research and development program that has or is expected to bring significant contributions to the industry in terms of adoption, change and competitive posture. The Upcoming 12 Months The company’s Phase I trial for NEO-101 is drawing to a close. The purpose of a Phase I trial is determine if unexpected and detrimental side effects arise. That the FDA and the company have not stopped the trial suggests that the results so far are encouraging. If NEO-101 does prove highly effective in the early stages of the program, the FDA might be willing to accelerate the approval process because of an “unmet need” presented by pancreatic cancer. If an acceleration of the program is not in the cards, the Phase III trial tends to be comprehensive and extremely expensive. An arrangement, acquisition by or licensing agreement with a major pharmaceutical/biotechnology company could very possibly evolve. Of course, the company should be in a very favorable negotiating position should that stage come to pass. Liquidity Neogenix is in the midst of a funding round that has brought in approximately $12 million. To date, approximately $61 million has been raised for the company. In addition, the company has received $733,437.74 in federal grant money via the Qualifying Therapeutic Discovery Project Program. As of December, 2010, the company had about $1 million outstanding in short-term borrowings (since paid down). The annual cash burn rate is about $13 million, so proceeds from the current capital raise will be needed in due course. Equity Capitalization The table on the following page outlines the number of existing common shares and potential shares should all of the company’s options and warrants be exercised. It is the total tally of shares (assuming full exercise) that we used in calculating our per share prospective valuations.
Neogenix Oncology, Inc.
Consilium Global Research May 3, 2011 14
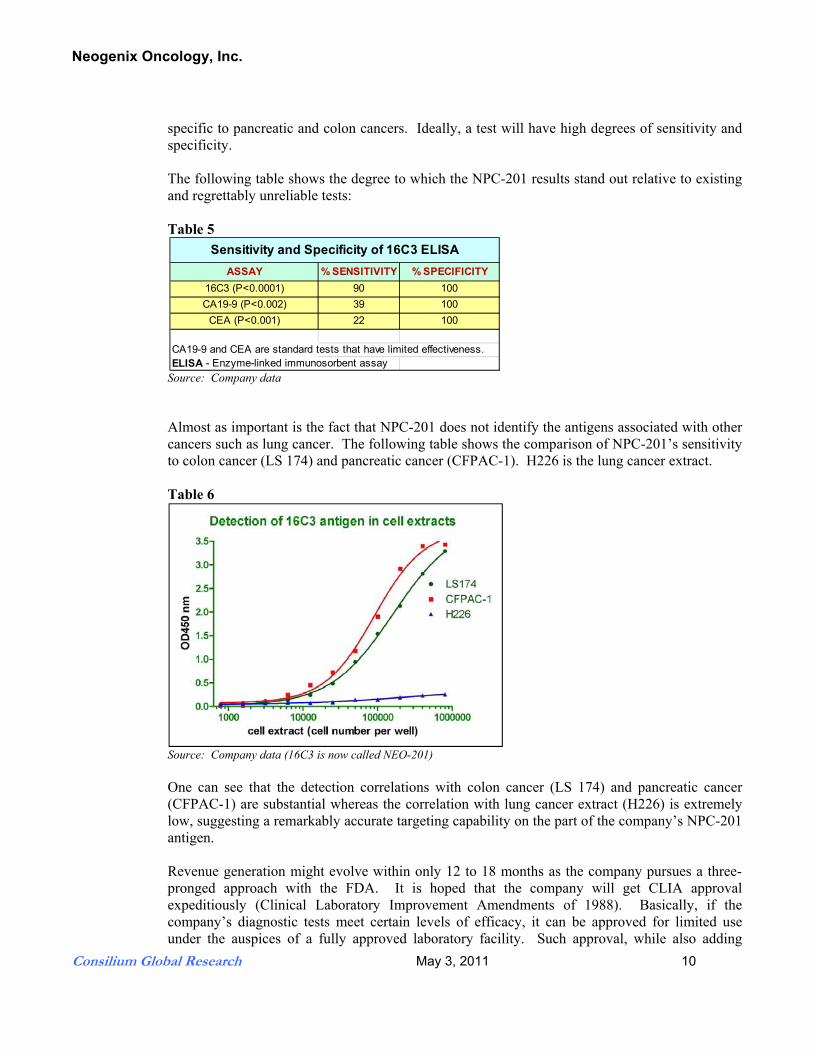
Table 7 – Neogenix’ Equity Capitalization
Source: Company reports Table 8 Neogenix Debt (as of December 31, 2010) Long-term Debt $59,056 with payments due annually through 2014 Short-term Debt $2,000,000 in lines of credit, $1,001,450 drawn down (Dec. 31, 2010) [Subsequently reduced to $400,000 (March 29, 2011)] When offset against bank CD�’s, the company has a de minimus net debt position. Deferred Rent $30,561
Recent Developments In December of 2010 the company entered a research collaboration with IRCCS San Raffaele Pisana in Rome, Italy led by Dr. Fiorella Guadagni. This research agreement marks an expansion of Neogenix’s collaboration strategy and will help accelerate the development of a rapid antibody based diagnostic test. This arrangement also gives Neogenix a credible platform to expand within the European Economic Community.
Risks The risks to the company are substantial. The efficacy of the company’s mAB candidates can be quickly compromised at any stage of their respective testing stages or clinical trials. The FDA review process is lengthy and highly complicated. That agency’s stringent adherence to testing protocols are such that any disruption could generate meaningful delays in the rollout of a commercial product.
(shares in millions) TotalWtd. Avg. Ex Price
Options 19.461 $5.59
Warrants 1.000 $6.00
Shares Outstanding 22.599
Prospective New Shares* 2.780
Potential Share Float 43.060
* Outstanding balance of current 3.2 mil sh offering
Neogenix Share Count - Dec. 31, 2010
Neogenix Oncology, Inc.
Consilium Global Research May 3, 2011 15
Given that the company generates no revenues and that the prospect of revenue generation is indeterminate, capital needs will be of paramount concern for the foreseeable future. Potential legal liabilities, the cost of meeting regulatory requirements and possible conflicts over intellectual property are the natural concerns of a company that hopes to bring new bio-pharmaceutical products to the world. There is never a guarantee that another company will not bring to market a more effective product that competes directly with Neogenix’ own product(s). Most senior executives to the company are extremely important to the company’s overall success. The loss of a key executive could prove disruptive to the company achieving its stated goals. Although the company technically is now considered a “public” company, its stock does not trade on any listed exchange and, as a result, is highly illiquid. Conclusion The disparity between the valuation of companies in pre-clinical and human clinical trials as compared with companies that possess a clearly significant, FDA approved therapeutic agent can be huge. The granting of an NDA permit, the proper structuring of clinical trials, the nature of the science, the competitive landscape and the potential market opportunities are all ingredients that build the valuation of a company. For Neogenix, the empirical evidence to date is very encouraging. If, as expected, the company’s Phase I trials are completed by the third quarter of this year, the subsequent Phase IIa trial is likely to commence a couple of months later. Importantly, the initiation of the Phase II trials opens the door to a wider range of prospective investors and should invariably boost the perceived value of the company. We would also reiterate that the study of mAbs is being pursued by a variety of companies and the general level of success that these companies are experiencing indicate that the research path that they are pursuing – the identification of TSAs and the engineering of antibodies to directly impede or destroy those tumors – is a valid one. There are currently nine mAb drugs on the U.S. market to treat various cancer types (22 mAb drugs have been approved by the FDA in total). Data from the Genentech and ImClone websites reported sales of the top four of these drugs in 2008 approached a combined total of $10.0 billion (Rituxan, Avastin, Herceptin, Erbitux). We believe that much more can be achieved in this field of study and Neogenix appears to be on the verge of becoming one of the next contributors to this still small universe of FDA approved mAbs. Our combined per share present value valuations of $37.20 for the Therapeutics Segment, $56.10 for the Diagnostics Segment and $3.00 for “Other” possibilities over time suggest a per share combined value of $96.30. For the sake of argument, if we used a 50% annual discount rate across the board for our valuations, a per share present value of $51.50 results. Even this lower valuation offers a reasonably appealing risk/reward tradeoff at this stage in the company’s development. ******************************************

Neogenix Oncology, Inc.
Consilium Global Research May 3, 2011 16
Management Dr. Myron Arlen is one of the nation�’s leading oncologists and is the principal founder of the company. Dr. Arlen served as the Company�’s Chief Executive Officer from 2003 until March 2010 when he became Chairman of the Board. He was trained as a cancer surgeon at Memorial Sloan-Kettering where he remained on staff for 20 years and was involved in the surgery of advanced cancer problems and the immunotherapeutic approaches to managing the patients. Dr. Arlen established the Surgical Oncology Division at North Shore University Hospital, and formed a practice group (North Shore Surgical Oncology Associates). He has written two major textbooks and published over 80 journal articles related to cancer treatment. Dr, Philip Arlen became the company�’s CEO in March 2010 and continues to serve as President. Prior to 2008, Dr. Arlen spent 11 years at the National Cancer Institute, USA, most recently as the Director of the Clinical Research Group for the Laboratory of Tumor Immunology and Oncology. At the NCI, Dr. Arlen focused on the development of a programmatic approach to vaccine clinical trials conducted at the NCI as well as at numerous other Cancer Centers throughout the U.S. Dr. Andrew Bristol is a Founder scientist of the company. He has specialized in cancer drug research and has extensive backgrounds in both academia and the private sector, having worked at the National Cancer Institute, Novartis and Genetics Institute (now part of Wyeth). He is currently vice-President of Research and Development. Peter Gordon (MBA) is a Founder of the company and is the company�’s CFO and Secretary. He has over 25 years of experience in management, finance and accounting activities. Mr. Gordon has brought to Neogenix a strong sense of business discipline. Dr. Albine Martin, PhD, brings over twenty years of diversified management and corporate development experience within the biotechnology, diagnostics and life sciences sector. Prior to joining Neogenix, Dr. Martin was a Managing Partner at Adjuvant Global Advisors, a commercial strategy life sciences consulting firm. As Vice President at Compugen (CGEN), a drug and diagnostic product candidate company, she led the commercialization and licensing of novel products and managed diagnostic and therapeutic strategic alliances. Web site: www.neogenix.com
Neogenix Oncology, Inc.
Consilium Global Research May 3, 2011 17
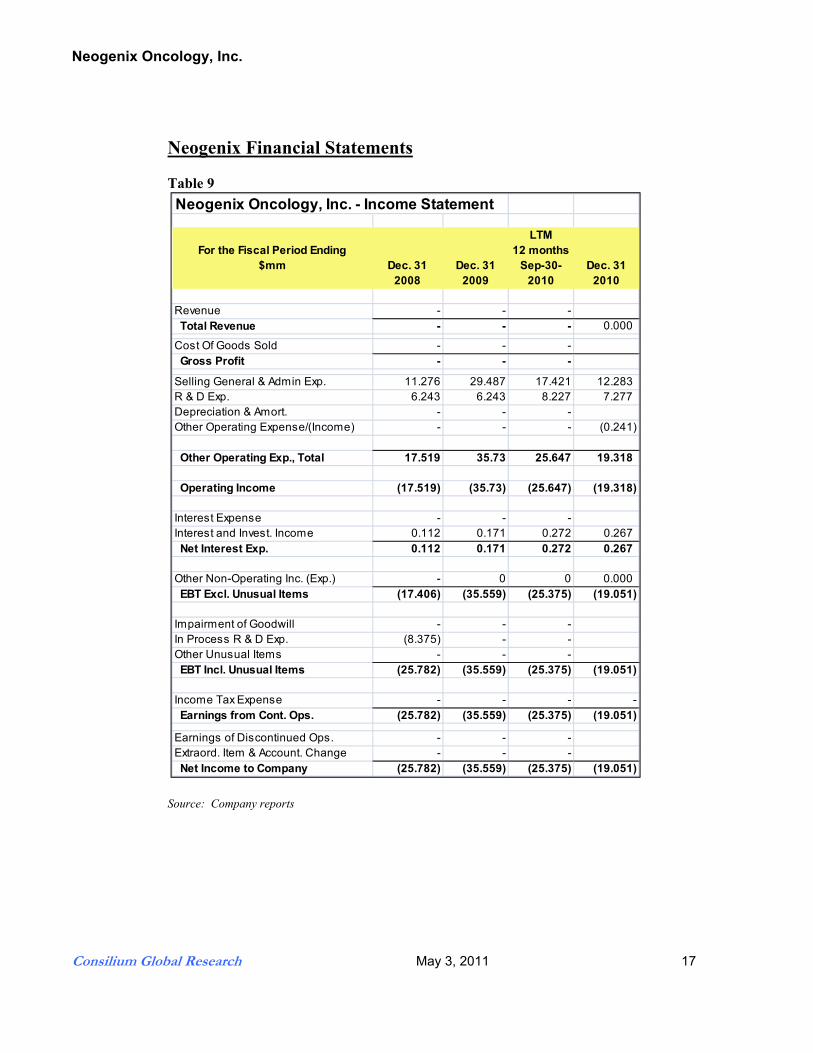
Neogenix Financial Statements Table 9
Source: Company reports
Neogenix Oncology, Inc. - Income Statement
For the Fiscal Period Ending$mm Dec. 31
2008Dec. 31
2009
LTM12 months
Sep-30-2010
Dec. 312010
Revenue - - - Total Revenue - - - 0.000
Cost Of Goods Sold - - - Gross Profit - - -
Selling General & Admin Exp. 11.276 29.487 17.421 12.283R & D Exp. 6.243 6.243 8.227 7.277Depreciation & Amort. - - -Other Operating Expense/(Income) - - - (0.241)
Other Operating Exp., Total 17.519 35.73 25.647 19.318
Operating Income (17.519) (35.73) (25.647) (19.318)
Interest Expense - - -Interest and Invest. Income 0.112 0.171 0.272 0.267 Net Interest Exp. 0.112 0.171 0.272 0.267
Other Non-Operating Inc. (Exp.) - 0 0 0.000 EBT Excl. Unusual Items (17.406) (35.559) (25.375) (19.051)
Impairment of Goodwill - - -In Process R & D Exp. (8.375) - -Other Unusual Items - - - EBT Incl. Unusual Items (25.782) (35.559) (25.375) (19.051)
Income Tax Expense - - - - Earnings from Cont. Ops. (25.782) (35.559) (25.375) (19.051)
Earnings of Discontinued Ops. - - -Extraord. Item & Account. Change - - - Net Income to Company (25.782) (35.559) (25.375) (19.051)

Neogenix Oncology, Inc.
Consilium Global Research May 3, 2011 18
Table 10
Source: Company reports
Neogenix Oncology, Inc. - Balance Sheet
For the Fiscal Period Ending$mm Dec. 31
2008Dec. 31
2009
LTM12 months
Sep-30-2010
Dec. 312010
ASSETSCash And Equivalents 2.763 6.662 1.752 3.221Short Term Investments 0.076 0.21 0.214 0.264 Total Cash & ST Investments 2.839 6.872 1.965 3.486
Accounts Receivable - - - Total Receivables - - -
Prepaid Exp. 0.042 0.066 0.157 0.839Other Current Assets 0.225 0.233 0.237 Total Current Assets 3.106 7.171 2.359 4.325
Gross Property, Plant & Equipment 0.512 1.152 1.496 1.575Accumulated Depreciation (0.168) (0.306) (0.465) -0.553 Net Property, Plant & Equipment 0.344 0.846 1.031 1.022
Long-term Investments 0.203 0.104 - 0.015Other Long-Term Assets 1.013 7.227 7.386 7.536Total Assets 4.665 15.348 10.775 12.898
LIABILITIESAccounts Payable 0.014 0.53 0.348 0.171Accrued Exp. 0.357 0.533 0.269 0.316Short-term Borrowings 0.25 - - 1.001Other Current Liabilities - - - 0.016 Total Current Liabilities 0.621 1.063 0.617 1.504
Long-Term Debt 0.003 - - 0.043Other Non-Current Liabilities 0.004 0.01 0.025 0.031Total Liabilities 0.627 1.072 0.642 0.074
Common Stock 0.0 0.0 0.0 0.000Additional Paid In Capital 46.123 91.765 103.435 107.906Retained Earnings (41.826) (77.384) (93.302) (96.536)Treasury Stock (0.001) - -Comprehensive Inc. and Other (0.259) (0.105) - (0.150) Total Common Equity 4.038 14.276 10.133 11.220
Total Equity 4.038 14.276 10.133 11.321
Total Liabilities And Equity 4.665 15.348 10.775 12.899
Supplemental ItemsTotal Shares Out. on Filing Date 19.016 21.715 22.31 22.600
Neogenix Oncology, Inc.
Consilium Global Research May 3, 2011 19
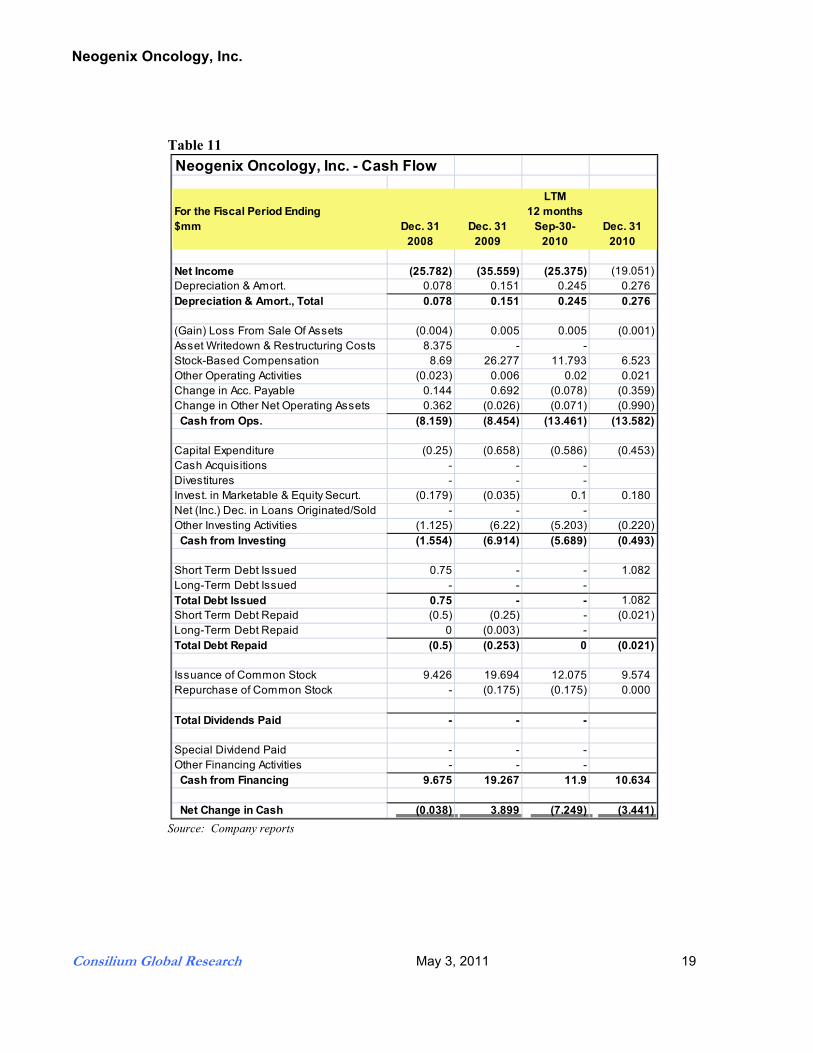
Table 11
Source: Company reports
Neogenix Oncology, Inc. - Cash Flow
For the Fiscal Period Ending$mm Dec. 31
2008Dec. 31
2009
LTM12 months
Sep-30-2010
Dec. 312010
Net Income (25.782) (35.559) (25.375) (19.051)Depreciation & Amort. 0.078 0.151 0.245 0.276Depreciation & Amort., Total 0.078 0.151 0.245 0.276
(Gain) Loss From Sale Of Assets (0.004) 0.005 0.005 (0.001)Asset Writedown & Restructuring Costs 8.375 - -Stock-Based Compensation 8.69 26.277 11.793 6.523Other Operating Activities (0.023) 0.006 0.02 0.021Change in Acc. Payable 0.144 0.692 (0.078) (0.359)Change in Other Net Operating Assets 0.362 (0.026) (0.071) (0.990) Cash from Ops. (8.159) (8.454) (13.461) (13.582)
Capital Expenditure (0.25) (0.658) (0.586) (0.453)Cash Acquisitions - - -Divestitures - - -Invest. in Marketable & Equity Securt. (0.179) (0.035) 0.1 0.180Net (Inc.) Dec. in Loans Originated/Sold - - -Other Investing Activities (1.125) (6.22) (5.203) (0.220) Cash from Investing (1.554) (6.914) (5.689) (0.493)
Short Term Debt Issued 0.75 - - 1.082Long-Term Debt Issued - - -Total Debt Issued 0.75 - - 1.082Short Term Debt Repaid (0.5) (0.25) - (0.021)Long-Term Debt Repaid 0 (0.003) -Total Debt Repaid (0.5) (0.253) 0 (0.021)
Issuance of Common Stock 9.426 19.694 12.075 9.574Repurchase of Common Stock - (0.175) (0.175) 0.000
Total Dividends Paid - - -
Special Dividend Paid - - -Other Financing Activities - - - Cash from Financing 9.675 19.267 11.9 10.634
Net Change in Cash (0.038) 3.899 (7.249) (3.441)
Neogenix Oncology, Inc.
Consilium Global Research May 3, 2011 20
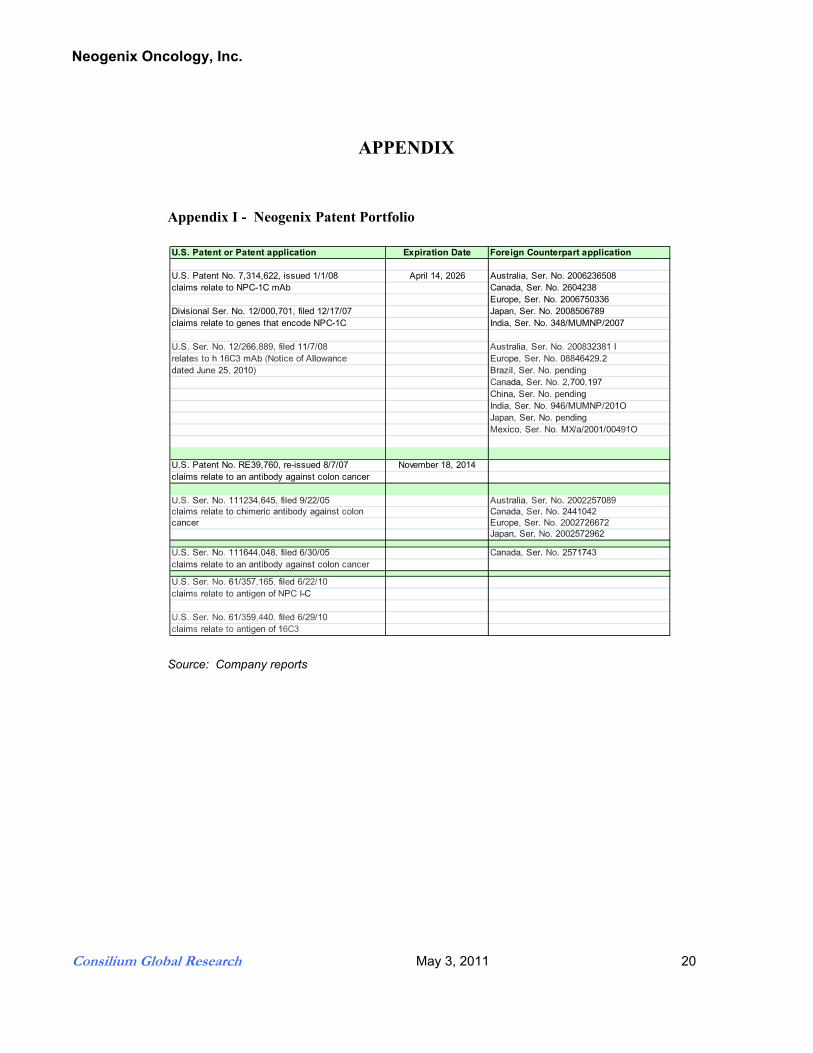
APPENDIX Appendix I - Neogenix Patent Portfolio
Source: Company reports
U.S. Patent or Patent application Expiration Date Foreign Counterpart application
U.S. Patent No. 7,314,622, issued 1/1/08 April 14, 2026 Australia, Ser. No. 2006236508claims relate to NPC-1C mAb Canada, Ser. No. 2604238
Europe, Ser. No. 2006750336Divisional Ser. No. 12/000,701, filed 12/17/07 Japan, Ser. No. 2008506789claims relate to genes that encode NPC-1C India, Ser. No. 348/MUMNP/2007 U.S. Ser. No. 12/266,889, filed 11/7/08 Australia, Ser. No. 200832381 Irelates to h 16C3 mAb (Notice of Allowance Europe, Ser. No. 08846429.2dated June 25, 2010) Brazil, Ser. No. pending Canada, Ser. No. 2,700,197
China, Ser. No. pending India, Ser. No. 946/MUMNP/201OJapan, Ser. No. pending Mexico, Ser. No. MX/a/2001/00491O
U.S. Patent No. RE39,760, re-issued 8/7/07 November 18, 2014claims relate to an antibody against colon cancer
U.S. Ser. No. 111234,645, filed 9/22/05 Australia, Ser. No. 2002257089claims relate to chimeric antibody against colon Canada, Ser. No. 2441042cancer Europe, Ser. No. 2002726672
Japan, Ser. No. 2002572962
U.S. Ser. No. 111644,048, filed 6/30/05 Canada, Ser. No. 2571743 claims relate to an antibody against colon cancer
U.S. Ser. No. 61/357,165, filed 6/22/10 claims relate to antigen of NPC I-C
U.S. Ser. No. 61/359,440, filed 6/29/10 claims relate to antigen of 16C3
Neogenix Oncology, Inc.
Consilium Global Research May 3, 2011 21
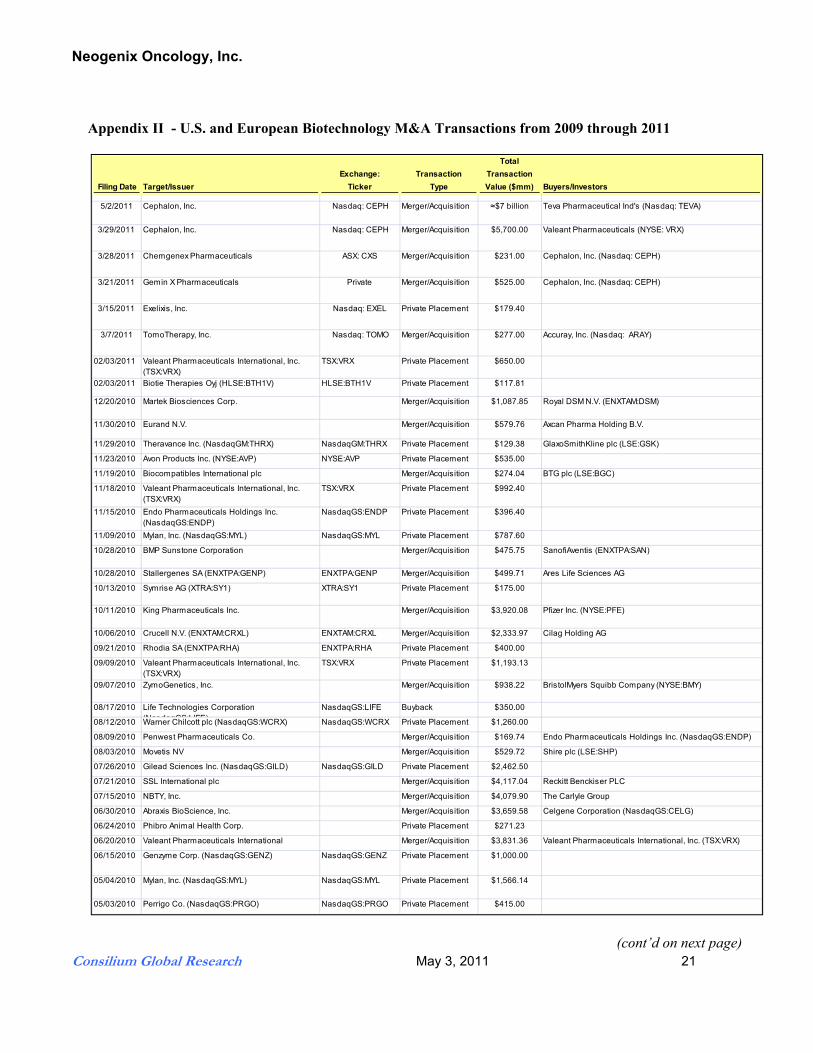
Appendix II - U.S. and European Biotechnology M&A Transactions from 2009 through 2011
(cont’d on next page)
Filing Date Target/IssuerExchange:
TickerTransaction
Type
Total Transaction Value ($mm) Buyers/Investors
5/2/2011 Cephalon, Inc. Nasdaq: CEPH Merger/Acquisition $7 billion Teva Pharmaceutical Ind's (Nasdaq: TEVA)
3/29/2011 Cephalon, Inc. Nasdaq: CEPH Merger/Acquisition $5,700.00 Valeant Pharmaceuticals (NYSE: VRX)
3/28/2011 Chemgenex Pharmaceuticals ASX: CXS Merger/Acquisition $231.00 Cephalon, Inc. (Nasdaq: CEPH)
3/21/2011 Gemin X Pharmaceuticals Private Merger/Acquisition $525.00 Cephalon, Inc. (Nasdaq: CEPH)
3/15/2011 Exelixis, Inc. Nasdaq: EXEL Private Placement $179.40
3/7/2011 TomoTherapy, Inc. Nasdaq: TOMO Merger/Acquisition $277.00 Accuray, Inc. (Nasdaq: ARAY)
02/03/2011 Valeant Pharmaceuticals International, Inc. (TSX:VRX)
TSX:VRX Private Placement $650.00
02/03/2011 Biotie Therapies Oyj (HLSE:BTH1V) HLSE:BTH1V Private Placement $117.81
12/20/2010 Martek Biosciences Corp. Merger/Acquisition $1,087.85 Royal DSM N.V. (ENXTAM:DSM)
11/30/2010 Eurand N.V. Merger/Acquisition $579.76 Axcan Pharma Holding B.V.
11/29/2010 Theravance Inc. (NasdaqGM:THRX) NasdaqGM:THRX Private Placement $129.38 GlaxoSmithKline plc (LSE:GSK)
11/23/2010 Avon Products Inc. (NYSE:AVP) NYSE:AVP Private Placement $535.00
11/19/2010 Biocompatibles International plc Merger/Acquisition $274.04 BTG plc (LSE:BGC)
11/18/2010 Valeant Pharmaceuticals International, Inc. (TSX:VRX)
TSX:VRX Private Placement $992.40
11/15/2010 Endo Pharmaceuticals Holdings Inc. (NasdaqGS:ENDP)
NasdaqGS:ENDP Private Placement $396.40
11/09/2010 Mylan, Inc. (NasdaqGS:MYL) NasdaqGS:MYL Private Placement $787.60
10/28/2010 BMP Sunstone Corporation Merger/Acquisition $475.75 SanofiAventis (ENXTPA:SAN)
10/28/2010 Stallergenes SA (ENXTPA:GENP) ENXTPA:GENP Merger/Acquisition $499.71 Ares Life Sciences AG
10/13/2010 Symrise AG (XTRA:SY1) XTRA:SY1 Private Placement $175.00
10/11/2010 King Pharmaceuticals Inc. Merger/Acquisition $3,920.08 Pfizer Inc. (NYSE:PFE)
10/06/2010 Crucell N.V. (ENXTAM:CRXL) ENXTAM:CRXL Merger/Acquisition $2,333.97 Cilag Holding AG
09/21/2010 Rhodia SA (ENXTPA:RHA) ENXTPA:RHA Private Placement $400.00
09/09/2010 Valeant Pharmaceuticals International, Inc. (TSX:VRX)
TSX:VRX Private Placement $1,193.13
09/07/2010 ZymoGenetics, Inc. Merger/Acquisition $938.22 BristolMyers Squibb Company (NYSE:BMY)
08/17/2010 Life Technologies Corporation (NasdaqGS:LIFE)
NasdaqGS:LIFE Buyback $350.00
08/12/2010 Warner Chilcott plc (NasdaqGS:WCRX) NasdaqGS:WCRX Private Placement $1,260.00
08/09/2010 Penwest Pharmaceuticals Co. Merger/Acquisition $169.74 Endo Pharmaceuticals Holdings Inc. (NasdaqGS:ENDP)
08/03/2010 Movetis NV Merger/Acquisition $529.72 Shire plc (LSE:SHP)
07/26/2010 Gilead Sciences Inc. (NasdaqGS:GILD) NasdaqGS:GILD Private Placement $2,462.50
07/21/2010 SSL International plc Merger/Acquisition $4,117.04 Reckitt Benckiser PLC
07/15/2010 NBTY, Inc. Merger/Acquisition $4,079.90 The Carlyle Group
06/30/2010 Abraxis BioScience, Inc. Merger/Acquisition $3,659.58 Celgene Corporation (NasdaqGS:CELG)
06/24/2010 Phibro Animal Health Corp. Private Placement $271.23
06/20/2010 Valeant Pharmaceuticals International Merger/Acquisition $3,831.36 Valeant Pharmaceuticals International, Inc. (TSX:VRX)
06/15/2010 Genzyme Corp. (NasdaqGS:GENZ) NasdaqGS:GENZ Private Placement $1,000.00
05/04/2010 Mylan, Inc. (NasdaqGS:MYL) NasdaqGS:MYL Private Placement $1,566.14
05/03/2010 Perrigo Co. (NasdaqGS:PRGO) NasdaqGS:PRGO Private Placement $415.00

Neogenix Oncology, Inc.
Consilium Global Research May 3, 2011 22
Appendix II - U.S. and European Biotechnology M&A Transactions from 2009 through 2011 (cont’d)
Source: Capital IQ
Filing Date Target/IssuerExchange:
TickerTransaction
Type
Total Transaction Value ($mm) Buyers/Investors
04/20/2010 Biogen Idec Inc. (NasdaqGS:BIIB) NasdaqGS:BIIB Buyback $1,500.00
04/19/2010 Thermo Fisher Scientific, Inc. (NYSE:TMO) NYSE:TMO Buyback $750.00
04/06/2010 Valeant Pharmaceuticals International Private Placement $393.20
04/05/2010 Patheon Inc. (TSX:PTI) TSX:PTI Private Placement $279.89
03/24/2010 Ipsen S.A. (ENXTPA:IPN) ENXTPA:IPN Merger/Acquisition $185.52
03/09/2010 Facet Biotech Corporation Merger/Acquisition $747.37 Abbott Laboratories (NYSE:ABT)
02/12/2010 OSI Pharmaceuticals Inc. Merger/Acquisition $3,946.35 Astellas US Holding, Inc.
02/02/2010 Novo Nordisk A/S (CPSE:NOVO B) CPSE:NOVO B Buyback $1,709.09
01/29/2010 Gilead Sciences Inc. (NasdaqGS:GILD) NasdaqGS:GILD Buyback $1,000.00
01/04/2010 Alcon Inc. (NYSE:ACL) NYSE:ACL Merger/Acquisition $28,756.73 Novartis AG (SWX:NOVN)
12/31/2009 BioForm Medical, Inc. Merger/Acquisition $253.75 Merz GmbH & Co. KGaA
12/20/2009 Chattem Inc. Merger/Acquisition $2,238.53 SanofiAventis (ENXTPA:SAN)
11/24/2009 Becton, Dickinson and Company (NYSE:BDX) NYSE:BDX Buyback $694.09
11/13/2009 Thermo Fisher Scientific, Inc. (NYSE:TMO) NYSE:TMO Private Placement $749.11
11/09/2009 Arseus NV (ENXTBR:RCUS) ENXTBR:RCUS Merger/Acquisition $126.30 Waterland Private Equity Investments BV
10/20/2009 Biogen Idec Inc. (NasdaqGS:BIIB) NasdaqGS:BIIB Buyback $1,000.00
10/13/2009 Talecris Biotherapeutics Holdings Corp. (NasdaqGS:TLCR)
NasdaqGS:TLCR Private Placement $595.93
09/30/2009 UCB SA (ENXTBR:UCB) ENXTBR:UCB Private Placement $726.90
09/29/2009 Elan Corp. plc (NYSE:ELN) NYSE:ELN Private Placement $625.00
09/28/2009 GenTek Inc. Merger/Acquisition $621.54 American Securities
09/28/2009 Crucell N.V. (ENXTAM:CRXL) ENXTAM:CRXL Private Placement $441.96 JHC Nederland B.V.
09/25/2009 Goldshield Group Limited Merger/Acquisition $244.20 HgCapital
09/22/2009 Incyte Corporation (NasdaqGM:INCY) NasdaqGM:INCY Private Placement $400.00 Baker Brothers Investments
09/03/2009 Sunovion Pharmaceuticals Inc. Merger/Acquisition $2,857.24 Dainippon Sumitomo Pharma America Holdings, Inc.
09/02/2009 Peplin, Inc. Merger/Acquisition $272.38 LEO Pharma A/S
08/05/2009 Cardinal Health, Inc. (NYSE:CAH) NYSE:CAH Buyback $500.00
07/28/2009 Baxter International Inc. (NYSE:BAX) NYSE:BAX Buyback $2,000.00
07/22/2009 Medarex, Inc. Merger/Acquisition $2,325.21 BristolMyers Squibb Company (NYSE:BMY)
07/02/2009 Elan Corp. plc (NYSE:ELN) NYSE:ELN Private Placement $885.00 Janssen Pharmaceutica, Inc.
06/03/2009 Pfizer Inc. (NYSE:PFE) NYSE:PFE Private Placement $10,770.97
06/02/2009 Valeant Pharmaceuticals International, Inc. (TSX:VRX)
TSX:VRX Private Placement $350.00
05/28/2009 Valeant Pharmaceuticals International Private Placement $353.31
05/21/2009 Cougar Biotechnology, Inc. Merger/Acquisition $989.94 Johnson & Johnson (NYSE:JNJ)
04/14/2009 Noven Pharmaceuticals, Inc. Merger/Acquisition $402.33 Hisamitsu Pharmaceutical Co. Inc. (TSE:4530)
03/12/2009 Gilead Palo Alto, Inc Merger/Acquisition $1,651.72 Gilead Sciences Inc. (NasdaqGS:GILD)
03/08/2009 Schering-Plough Corporation Merger/Acquisition $50,743.74 Merck & Co. Inc. (NYSE:MRK)
02/19/2009 Roche Holding AG (SWX:ROG) SWX:ROG Private Placement $16,000.00
01/28/2009 Covidien plc (NYSE:COV) NYSE:COV Buyback $300.00
01/28/2009 SSL International plc Private Placement $125.17
01/25/2009 Wyeth, LLC Merger/Acquisition $78,564.28 Pfizer Inc. (NYSE:PFE)
01/11/2009 Abbott Medical Optics Inc. Merger/Acquisition $2,769.83 Abbott Laboratories (NYSE:ABT)
01/05/2009 Endo Pharmaceuticals Solutions Inc. Merger/Acquisition $825.54 Endo Pharmaceuticals Holdings Inc. (NasdaqGS:ENDP)

Neogenix Oncology, Inc.
Consilium Global Research May 3, 2011 23
Appendix III - Top Selling Anti-cancer Drugs
Source: Knol, "Global Cancer Market Review 2008 (World Top Ten Cancer Drugs)" & Company reports (2009)
Generic Name Brands Companies Indications2006 2007 2008 2009
Bevacizumab Avastin Roche Colon Cancer 2.4 3.9 4.7 5.6Rituximab Rituxan Roche NHL, RA 4.7 5.0 5.6 5.5Trastuzumab Herceptin Roche Breast Cancer 3.1 4.4 4.8 4.8 Imatinib Gleevec Glivec Novartis Chronic 2.5 3.1 3.4 4.0 Docetaxel Taxotere Sanofi Aventis Prostate, Gastric 2.2 2.6 3.2 3.0Erythropoietin Epogen Amgen Anemia 2.5 2.6 2.3 2.6Erythropoietin Procrit Eprex J&J Anemia 3.2 2.9 2.3 2.5 Cetuximab Erbitux BMS, Merck AG Head & Neck 1.1 1.4 2.0 1.7Anastrozole Arimidex Astra Zeneca Breast Cancer 1.5 1.7 2.0 1.3 G-CSF Neulasta Amgen Neutropenia 2.6 2.7 3.2 1.2Papilloma Virus Gardasil Merck Cervical Cancer 1.5 3.0 1.1 Darbepoetin Aranesp Amgen Anemia 4.1 4.2 3.3 0.6
Sales $ billion

Neogenix Oncology, Inc.
Consilium Global Research May 3, 2011 24
Appendix IV - Neogenix Peer Company Comparisons
Source: Capital IQ
$mm except per share data Price Shs. Out Mkt Value Revenues Cash & Total Enterprise Debt/ % Insider % Inst.Company Name Symbol Web Site (prev close) (Diluted) (Diluted) LTM ST. Inv. Debt Value Capital CapitalOwnership Phase Access Pharmaceuticals ACCP www.accesspharma.com $2.30 15.6 36.0 0.5 7.0 5.5 42.9 NM 4.5 4.8 IIaAntigenics Inc. (AGEN) AGEN www.antigenics.com 0.95 102.1 96.5 3.1 19.8 34.2 121.5 175.5 13.2 20.3 I/II/IIIAriad Pharmaceuticals ARIA www.ariad.com 8.62 114.7 989.0 179.0 103.6 9.8 1,033.3 13.2 4.6 57.3 I/II/IIIArQule Inc. (ARQL) ARQL www.arqule.com 6.92 44.5 308.1 29.2 80.7 1.7 288.6 NM 0.6 60.3 I/IIIArray Bio ARRY www.arraybiopharma.co 2.96 53.0 156.9 71.4 88.6 116.1 193.6 NM 7.0 62.1 I/IICEL-SCI Corp. (CVM) CVM www.cel-sci.com 0.67 204.6 137.1 0.8 26.6 1.1 113.3 3.8 2.9 8.5 IIICytokinetics Inc. (CYTK) CYTK www.cytokinetics.com 1.45 65.4 94.8 2.7 59.9 0.0 37.2 0.1 8.6 50.5 IIaDendreon Corp. (DNDN) DNDN www.dendreon.com 42.81 138.2 5,916.6 48.1 254.8 59.3 6,046.8 10.7 0.5 59.9 IIIEntreMed Inc. (ENMD) ENMD www.entremed.com 4.73 9.7 45.8 3.7 4.9 0.8 54.0 12.4 0.3 9.6 I/IIExelixis Inc. (EXEL) EXEL www.exelixis.com 11.82 108.5 1,282.7 185.0 162.7 208.5 1,554.4 NM 2.5 59.2 I/II/IIIForest Laboratories FRX www.clda.com 34.74 34.74 1,206.9 4,390.1 3,734.1 0.0 6,204.7 0.0 1.0 93.3 I / II / IIIGeron Corp. (GERN) GERN www.geron.com 4.85 104.6 507.4 4.2 164.1 0.0 461.5 0.0 3.1 31.2 I/IIHalozyme (HALO) HALO www.halozyme.com 6.50 94.4 613.3 13.6 83.3 0.0 575.9 0.0 12.4 49.5 I/II/IIIHuman Genome Sciences (HGSI) HGSI www.hgsi.com 28.76 188.5 5,422.0 137.4 297.7 629.9 5,786.0 57.5 0.3 91.7 I/II/IIIImmunogen Inc. (IMGN) IMGN www.immunogen.com 13.58 67.0 909.2 17.2 115.8 0.0 808.1 0.0 0.9 73.4 I/IIIImmunomedics Inc. (IMMU) IMMU www.immunomedics.co 3.90 75.3 293.5 19.3 29.9 0.0 263.9 0.0 8.0 33.0 II/IIIKeryx Biopharmaceuticals Inc. (KERX KERX www.keryx.com 5.20 60.2 312.8 0.0 28.5 0.0 293.5 0.0 4.0 29.9 II / IIIMicromet Inc. (MITI) MITI www.micromet.de 6.80 79.7 542.1 28.7 221.0 0.2 401.7 0.1 2.8 79.0 I/IIPharmacyclics Inc. (PCYC) PCYC www.pharmacyclics.com 6.54 55.3 361.8 9.4 61.6 0.0 330.2 0.0 24.2 62.1 I/IISeattle Genetics Inc. (SGEN) SGEN www.seattlegenetics.co 16.84 101.1 1,701.8 107.5 281.8 0.0 1,628.9 0.0 1.2 85.8 II / IIISpectrum Pharmaceuticals, Inc. (SPP SPPI www.spectrumpharm.co 9.67 49.5 478.7 74.1 95.7 0.0 407.4 0.1 12.7 30.3 I / II / IIISunesis Pharmaceuticals SNSS www.sunesis-pharma.co 2.64 24.9 65.6 0.0 53.4 0.0 68.1 0.0 0.8 12.3 I / II / IIITelik Inc. (TELK) TELK www.telik.com 0.88 53.5 47.1 0.0 23.6 0.0 23.9 0.0 22.7 36.3 pre-INDThreshold Pharmaceuticals THLD www.thresholdpharm.co 2.09 33.7 70.3 0.0 14.7 0.0 87.3 0.0 5.0 26.0 I / II
InternationalBavarian Nordic A/S CPSE:BAVA www.bavarian-
di24.46 11.6 284.7 56.5 0.0 19.2 338.3 11.6 I / II
Biotest AG DB:BIO3 www.biotest.com 65.72 11.7 770.8 553.1 24.9 216.0 1,021.5 34.4 I/IIBTG plc LSE:BGC www.btgplc.com 4.15 258.8 1,074.4 151.9 100.4 1.4 1,246.5 0.4 I/II/IIICangene Corp. TSX:CNJ www.cangene.com 2.56 67.8 173.7 143.8 21.9 0.0 148.3 0.0 2.4 43.7 I, IIIEvotec AG XTRA:EVT www.evotecoai.com 4.53 109.1 493.9 74.1 91.9 16.1 440.0 8.3 4.4 5.8 I/II/IIIFuriex Pharmaceuticals, Inc. FURX www.furiex.com 14.89 9.9 147.1 9.1 68.0 0.0 79.2 0.0 6.4 65.3 I/II/IIIMedivir AB OM:MVIR B www.medivir.com 23.32 24.7 576.5 9.2 96.3 0.0 558.7 0.0 I/II/IIIMologen Holding AG DB:MGN www.mologen.com 12.78 10.9 139.1 0.5 6.3 0.0 136.3 0.1 I/IIRepligen Corporation RGEN www.repligen.com 4.05 30.9 125.2 26.3 51.1 0.0 73.6 0.0 11.5 33.8 II/IIISangamo Biosciences Inc. SGMO www.sangamo.com 7.51 45.3 340.0 16.4 60.3 0.0 332.4 0.0 4.8 31.0 I/IISwedish Orphan Biovitrum AB OM:SOBI www.biovitrum.com 4.23 212.2 897.6 309.9 6.0 223.7 1,127.1 24.8 3.8 18.6 III
Source: Capital IQ Shs. Out Mkt Value Revenues Cash & Total Enterprise Debt/ % Insider % Inst.
$mm (Diluted) (Diluted) LTM ST. Inv. Debt Value Capital OwnershipOwnershipMean 76.33 760.55 190.73 186.88 44.10 923.68 11.39 5.90 44.15 Median 60.16 340.01 19.31 61.61 0.03 332.44 0.02 4.19 39.99
Mean Phase I / II * $279Mean Phase III * $1,567
* Includes separate, earlier stage programs
Neogenix Oncology, Inc.
Consilium Global Research May 3, 2011 25
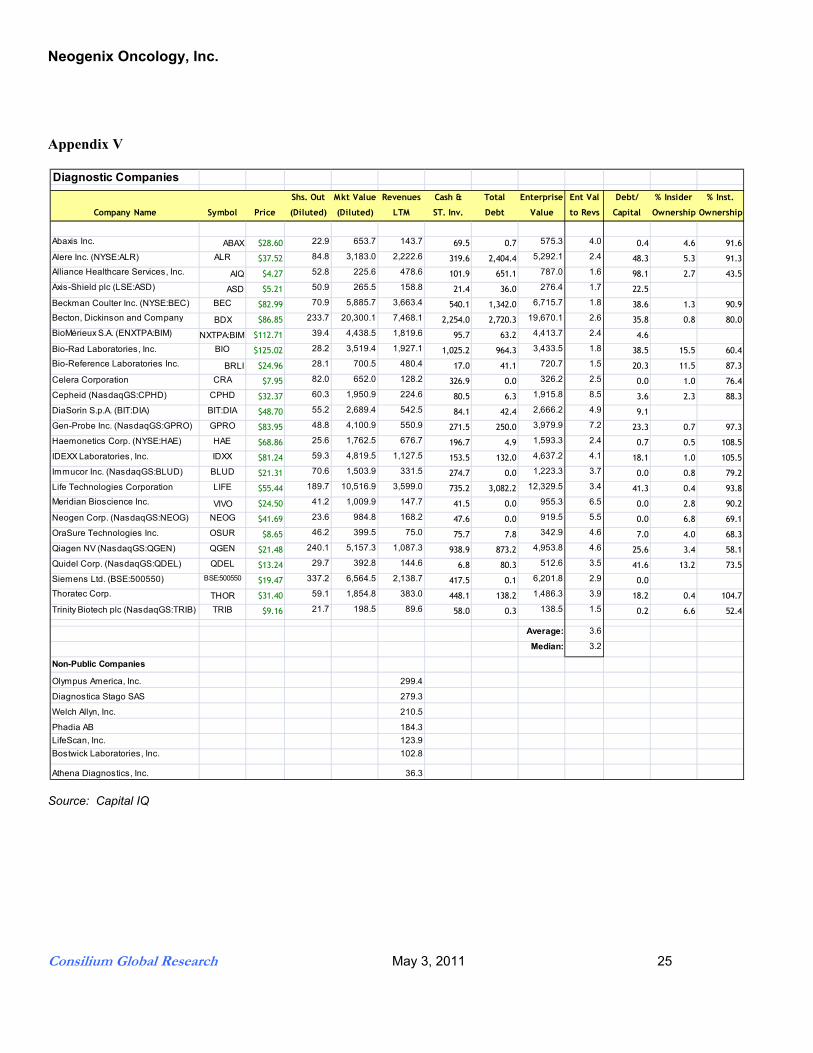
Appendix V
Source: Capital IQ
Diagnostic Companies Shs. Out Mkt Value Revenues Cash & Total Enterprise Ent Val Debt/ % Insider % Inst.
Company Name Symbol Price (Diluted) (Diluted) LTM ST. Inv. Debt Value to Revs Capital Ownership Ownership
Abaxis Inc. ABAX $28.60 22.9 653.7 143.7 69.5 0.7 575.3 4.0 0.4 4.6 91.6
Alere Inc. (NYSE:ALR) ALR $37.52 84.8 3,183.0 2,222.6 319.6 2,404.4 5,292.1 2.4 48.3 5.3 91.3
Alliance Healthcare Services, Inc. AIQ $4.27 52.8 225.6 478.6 101.9 651.1 787.0 1.6 98.1 2.7 43.5
Axis-Shield plc (LSE:ASD) ASD $5.21 50.9 265.5 158.8 21.4 36.0 276.4 1.7 22.5
Beckman Coulter Inc. (NYSE:BEC) BEC $82.99 70.9 5,885.7 3,663.4 540.1 1,342.0 6,715.7 1.8 38.6 1.3 90.9
Becton, Dickinson and Company BDX $86.85 233.7 20,300.1 7,468.1 2,254.0 2,720.3 19,670.1 2.6 35.8 0.8 80.0
BioMérieux S.A. (ENXTPA:BIM) NXTPA:BIM $112.71 39.4 4,438.5 1,819.6 95.7 63.2 4,413.7 2.4 4.6
Bio-Rad Laboratories, Inc. BIO $125.02 28.2 3,519.4 1,927.1 1,025.2 964.3 3,433.5 1.8 38.5 15.5 60.4
Bio-Reference Laboratories Inc. BRLI $24.96 28.1 700.5 480.4 17.0 41.1 720.7 1.5 20.3 11.5 87.3
Celera Corporation CRA $7.95 82.0 652.0 128.2 326.9 0.0 326.2 2.5 0.0 1.0 76.4
Cepheid (NasdaqGS:CPHD) CPHD $32.37 60.3 1,950.9 224.6 80.5 6.3 1,915.8 8.5 3.6 2.3 88.3
DiaSorin S.p.A. (BIT:DIA) BIT:DIA $48.70 55.2 2,689.4 542.5 84.1 42.4 2,666.2 4.9 9.1
Gen-Probe Inc. (NasdaqGS:GPRO) GPRO $83.95 48.8 4,100.9 550.9 271.5 250.0 3,979.9 7.2 23.3 0.7 97.3
Haemonetics Corp. (NYSE:HAE) HAE $68.86 25.6 1,762.5 676.7 196.7 4.9 1,593.3 2.4 0.7 0.5 108.5
IDEXX Laboratories, Inc. IDXX $81.24 59.3 4,819.5 1,127.5 153.5 132.0 4,637.2 4.1 18.1 1.0 105.5
Immucor Inc. (NasdaqGS:BLUD) BLUD $21.31 70.6 1,503.9 331.5 274.7 0.0 1,223.3 3.7 0.0 0.8 79.2
Life Technologies Corporation LIFE $55.44 189.7 10,516.9 3,599.0 735.2 3,082.2 12,329.5 3.4 41.3 0.4 93.8
Meridian Bioscience Inc. VIVO $24.50 41.2 1,009.9 147.7 41.5 0.0 955.3 6.5 0.0 2.8 90.2
Neogen Corp. (NasdaqGS:NEOG) NEOG $41.69 23.6 984.8 168.2 47.6 0.0 919.5 5.5 0.0 6.8 69.1
OraSure Technologies Inc. OSUR $8.65 46.2 399.5 75.0 75.7 7.8 342.9 4.6 7.0 4.0 68.3
Qiagen NV (NasdaqGS:QGEN) QGEN $21.48 240.1 5,157.3 1,087.3 938.9 873.2 4,953.8 4.6 25.6 3.4 58.1
Quidel Corp. (NasdaqGS:QDEL) QDEL $13.24 29.7 392.8 144.6 6.8 80.3 512.6 3.5 41.6 13.2 73.5
Siemens Ltd. (BSE:500550) BSE:500550 $19.47 337.2 6,564.5 2,138.7 417.5 0.1 6,201.8 2.9 0.0
Thoratec Corp. THOR $31.40 59.1 1,854.8 383.0 448.1 138.2 1,486.3 3.9 18.2 0.4 104.7
Trinity Biotech plc (NasdaqGS:TRIB) TRIB $9.16 21.7 198.5 89.6 58.0 0.3 138.5 1.5 0.2 6.6 52.4
Average: 3.6
Median: 3.2
Non-Public Companies
Olympus America, Inc. 299.4
Diagnostica Stago SAS 279.3
Welch Allyn, Inc. 210.5
Phadia AB 184.3LifeScan, Inc. 123.9Bostwick Laboratories, Inc. 102.8
Athena Diagnostics, Inc. 36.3

Neogenix Oncology, Inc.
Consilium Global Research May 3, 2011 26
Appendix VI - Selected Large, Diversified Biotechnology Companies Involved in mAb Production
Source: Capital IQ
Company Name SymbolStockPrice TEV
TEV/LTM Revs
LTMEBITDA
NTMEBITDA
Est.Shares
OutstandingMarket
CapLTM
Revenue Net Debt
LTMDiluted
EPSBefore Extra
NTMEPSEst.
Amgen Inc. AMGN $54.02 45,761.0 3.0 6,495.3 6,770.9 953.3 53,538.6 15,167.0 (4,451.0) $4.81 $5.22
Biogen Idec Inc. BIIB $71.82 17,225.0 3.6 2,030.3 2,119.2 247.8 23,841.8 4,810.9 (28.2) $4.36 $5.97
Bristol-Myers Squibb Co. BMY $26.45 43,822.6 2.2 7,071.0 7,245.0 1,724.3 48,535.4 19,688.0 (1,365.0) $1.93 $2.22
GlaxoSmithKline BSE:500660 $46.84 3,581.7 7.4 174.6 84.7 4,324.3 484.4 (447.9) $1.53
Takeda Pharmaceutical Co. Ltd. (1) TSE:4502 $47.06 28,514.1 1.6 6,175.4 789.5 38,319.4 17,491.2 (9,357.0) $3.97
Roche Holding AG SWX:ROG $141.60 146,441.3 2.8 19,368.5 857.0 142,348.9 52,624.4 19,849.1 $10.82
Pfizer (2) PFE $20.40 179,389.9 2.6 25,690.0 30,915.8 8,074.0 167,975.3 67,809.0 16,025.0 $1.02 $2.20
(1) Owns Millenium Pharmaceuticals Average 3.3
(2) Purchased WyethAll values in US$ mil except per share data

Neogenix Oncology, Inc.
Consilium Global Research May 3, 2011 27
Appendix VII - Global Statistics on Selected Cancer Occurrences and Deaths (2008)
Source: American Cancer Society
Est. New Cases Deaths Est. New Cases Deaths
Lung & bronchus 1,095,200 Lung & bronchus 951,000 Breast 1,383,500 Breast 458,400
Prostate 903,500 Prostate 258,400 Cervix uteri 529,800 Cervix uteri 275,100
Stomach 640,600 Stomach 464,400 Colon & rectum 570,100 Colon & rectum 288,100
Colon & rectum 663,600 Colon & rectum 320,600 Lung & bronchus 513,600 Lung & bronchus 427,400
Liver 522,400 Liver 478,300 Stomach 349,000 Stomach 273,600
Esophagus 326,600 Esophagus 276,100 Ovary 225,500 Ovary 140,200
Urinary bladder 297,300 Urinary bladder 112,300 Corpus uteri 287,100 Pancreas 127,900
Oral cavity 170,900 Pancreas 138,100 Liver 225,900 Liver 217,600
Non-Hodgkin lymphoma 199,600 Non-Hodgkin lymphoma 109,500 Thyroid 163,000 Esophagus 130,700
Leukemia 195,900 Leukemia 143,700 Non-Hodgkin lymphoma 156,300 Leukemia 113,800
All sites but skin 6,629,100 4,225,700 4,334,867 All sites but skin 6,038,400 3,345,800
Source: American Cancer Society
Est. New Cases Deaths Est. New Cases Deaths
Prostate 648,400 Prostate 136,500 Breast 692,200 Breast 189,500
Colon & rectum 389,700 Colon & rectum 166,200 Colon & rectum 337,700 Colon & rectum 153,900
Lung & bronchus 482,600 Lung & bronchus 412,000 Lung & bronchus 241,700 Lung & bronchus 188,400
Stomach 214,534 Stomach 110,900 Stomach 102,000 Stomach 70,800
Urinary bladder 177,800 Urinary bladder 55,000 Ovary 100,300 Ovary 64,500
Kidney 111,100 Kidney 43,000 Cervix Uteri 76,500 Corpus uteri 33,200
Liver 81,700 Liver 75,400 Non-Hodgkin lymphoma 84,800 Non-Hodgkin lymphoma 33,500
Pancreas 84,200 Pancreas 82,700 Pancreas 80,900 Pancreas 79,100
Melanoma of Skin 85,300 Leukemia 48,600 Corpus uteri 142,200 Liver 39,900
Non-Hodgkin lymphoma 95,700 Esophagus 53,100 Skin Melanoma 81,600 Leukemia 38,700
All sites but skin 2,975,200 1,528,200 All sites but skin 2,584,800 1,223,200
Source: American Cancer Society
Male Female
Male FemaleThe World
Developed Countries
Est. New Cases Deaths
Colon & rectum 727,400 Colon & rectum 320,100Pancreas 165,100 Pancreas 161,800
Total 892,500 481,900
Total

Neogenix Oncology, Inc.
Consilium Global Research May 3, 2011 28
Appendix VIII NPC-201 Anti-tumor Efficacy Study
Source: Company reports Disclosures This report was prepared by Consilium Global Research on the basis of information provided by the Company and independent sources considered to be reliable. Consilium Global Research has not independently verified any information contained herein. The opinions expressed are those of CGR and not of the Company, its officers, directors or any affiliate. This report was prepared by Consilium Global Research on the basis of information provided by the Company and independent sources considered to be reliable. Consilium Global Research has not independently verified any information contained herein. The opinions expressed are those of CGR and not of the Company, its officers, directors or any affiliate. The author of this report owns common shares of Neogenix Oncology, Inc. Prices are as of May 2, 2011

Neogenix Oncology, Inc.
Consilium Global Research May 3, 2011 29
CONSILIUM Global Research
735 Arlington Ave. N., Suite 203 St. Petersburg, FL 33701 727.329.8652 www.ConsiliumGlobalResearch.com
Richard C. Nelson Mr. Nelson began his career in financial services as an assistant to the senior technical analyst for White Weld in London, UK. He thereafter joined Arnold Bernhard & Co. (Value Line), a well regarded third party research organization, where he conducted Equity, Options and Convertible Securities Research. For ten years Mr. Nelson developed and expanded Convertible Securities research at Kidder, Peabody & Co., where he was rated #1 by Greenwich Survey, a major institutional rating organization. Kidder, Peabody fielded one of the most effective convertible security departments on the Street, and Mr. Nelson was instrumental in developing several innovative analytical systems for monitoring and assessing convertible and related derivative instruments. Mr. Nelson subsequently joined Lehman Brothers where he again specialized in Convertible Securities Research and received recognition by Institutional Investor (#2 standing) for that category. Lehman was one of the largest underwriters of convertible securities at that time. As a Managing Director of ING Barings Furman Selz LLC and, subsequently ABN AMRO, Inc., Mr. Nelson focused on Special Situations Equity Research, Convertible Securities Research and Convertible Securities Capital Markets Origination. In addition to his varied analytical responsibilities, he oversaw the placement of approximately $350 million in lead managed transactions as well as participation in numerous co-managed transactions. Mr. Nelson continued to apply his expertise in special situations and convertible securities at Morgan Joseph & Co. Inc. and then as Director of Research for J Giordano Securities, an investment banking and trading boutique. His research department specialized in high yield debt, convertible securities and small and mid-cap company equity research. His deep experience in a wide variety of investment securities embracing all industry sectors has provided him with a ready ability to assess most financial structures. Mr. Nelson holds a BA degree from Valparaiso University and an MBA degree in Finance from the Frank Zarb School of Business at Hofstra University. He holds series 62, 63, 79, 86, 87 and 24 licenses.