nepal - international university of japan
TRANSCRIPT

Country Profile 2004
NepalThis Country Profile is a reference work, analysing thecountry's history, politics, infrastructure and economy. It isrevised and updated annually. The Economist IntelligenceUnit's Country Reports analyse current trends and provide atwo-year forecast.
The full publishing schedule for Country Profiles is nowavailable on our website at http://www.eiu.com/schedule
The Economist Intelligence Unit15 Regent St, London SW1Y 4LRUnited Kingdom

The Economist Intelligence Unit
The Economist Intelligence Unit is a specialist publisher serving companies establishing and managingoperations across national borders. For over 50 years it has been a source of information on businessdevelopments, economic and political trends, government regulations and corporate practice worldwide.
The Economist Intelligence Unit delivers its information in four ways: through its digital portfolio, where itslatest analysis is updated daily; through printed subscription products ranging from newsletters to annualreference works; through research reports; and by organising seminars and presentations. The firm is amember of The Economist Group.
LondonThe Economist Intelligence Unit15 Regent StLondonSW1Y 4LRUnited KingdomTel: (44.20) 7830 1007Fax: (44.20) 7830 1023E-mail: [email protected]
New YorkThe Economist Intelligence UnitThe Economist Building111 West 57th StreetNew YorkNY 10019, USTel: (1.212) 554 0600Fax: (1.212) 586 0248E-mail: [email protected]
Hong KongThe Economist Intelligence Unit60/F, Central Plaza18 Harbour RoadWanchaiHong KongTel: (852) 2585 3888Fax: (852) 2802 7638E-mail: [email protected]
Website: www.eiu.com
Electronic deliveryThis publication can be viewed by subscribing online at www.store.eiu.com
Reports are also available in various other electronic formats, such as CD-ROM, Lotus Notes, on-line databasesand as direct feeds to corporate intranets. For further information, please contact your nearest EconomistIntelligence Unit office
Copyright© 2004 The Economist Intelligence Unit Limited. All rights reserved. Neither this publication norany part of it may be reproduced, stored in a retrieval system, or transmitted in any form or by any means,electronic, mechanical, photocopying, recording or otherwise, without the prior permissionof The Economist Intelligence Unit Limited.
All information in this report is verified to the best of the author's and the publisher's ability. However, theEconomist Intelligence Unit does not accept responsibility for any loss arising from reliance on it.
ISSN 1741-0339
Symbols for tables"n/a" means not available; "–" means not applicable
Printed and distributed by Patersons Dartford, Questor Trade Park, 151 Avery Way, Dartford, Kent DA1 1JS, UK.

Country Profile 2004 www.eiu.com © The Economist Intelligence Unit Limited 2004

Nepal 1
© The Economist Intelligence Unit Limited 2004 www.eiu.com Country Profile 2004
Contents
3 Regional overview3 Membership of organisations
4 Basic data
5 Politics5 Political background6 Recent political developments9 Constitution, institutions and administration10 Political forces12 International relations and defence
14 Resources and infrastructure14 Population14 Education16 Health16 Natural resources and the environment17 Transport, communications and the Internet19 Energy provision
20 The economy20 Economic structure21 Economic policy23 Economic performance
24 Economic sectors24 Agriculture25 Mining and semi-processing26 Manufacturing26 Construction26 Financial services28 Other services
29 The external sector29 Trade in goods31 Invisibles and the current account31 Capital flows and foreign debt32 Foreign reserves and the exchange rate
34 Appendices34 Sources of information35 Reference tables35 Population35 Energy consumption36 Government finances36 Gross domestic product at factor cost36 Gross domestic product by expenditure37 Gross domestic product by sector37 Consumer prices, national data37 Consumer prices, IMF data38 Money supply and interest rates

2 Nepal
Country Profile 2004 www.eiu.com © The Economist Intelligence Unit Limited 2004
38 Production index of manufacturing industries39 Tourism39 Foreign trade40 Balance of payments, IMF series40 External debt, World Bank series41 Foreign reserves41 Exchange rates

Nepal 3
© The Economist Intelligence Unit Limited 2004 www.eiu.com Country Profile 2004
Regional overview
Membership of organisations
The South Asian Association for Regional Co-operation (SAARC), whichcomprises India, Pakistan, Sri Lanka, Bangladesh, Nepal, the Maldives andBhutan, was established in 1985 at a meeting in Bangladesh. SAARC's aimsinclude promoting welfare, accelerating economic growth, eradicating povertyand improving relations between member states.
Summit meetings are intended to be held annually and are complemented bytechnical committees, meetings of foreign ministers and a standing committee,which comprises the foreign secretaries (civil servants) of each country. Anunder-resourced secretariat, established in 1987, based in the Nepalese capital,Kathmandu, and led by the secretary-general, Q Rahim, co-ordinates SAARC'sactivities.
In SAARC's early years agreements were made to establish a food securityreserve (which has never been implemented), to establish a meteorologicalcentre, to combat terrorism and to create various cultural exchanges betweenmember states. Along with micro-level issues, SAARC has also proposedcreating a South Asian Free-Trade Area (SAFTA). SAFTA is seen as areplacement for the South Asian Preferential Trading Arrangement, whichwas agreed in 1995 and which had, by 1996, identified more than 2,000products as eligible for preferential treatment. SAFTA was initially to be put inplace by the ambitious target date of 2001. After the 1997 SAARC summit, aneminent-persons group was constituted to plot the way forward for theassociation. The group argued that closer economic ties were the key to thefuture, and proposed that a free-trade area should be in place by 2008 (2010 forthe least-developed member states), a customs union by 2015 and an economicunion by 2020.
Progress on such goals has traditionally been hampered by the tenserelationship between India and Pakistan. India's refusal to participate in theSAARC summit of 1999, in protest at the military coup in Pakistan, led to thecancellation of that summit and the one in 2000, although a summit did takeplace in early 2002. The 2002 summit was overshadowed by a meetingbetween the leaders of India and Pakistan. However, the January 2004 SAARCmeeting saw some improvement in the relationship between India andPakistan, and the South Asian nations agreed to establish SAFTA by January 1st2006, with full implementation by 2015. Pakistan and India agreed to lowertariffs to 0-5% within seven years, Sri Lanka agreed to do so in eight years, andthe less-developed countries—Bangladesh, Nepal, Bhutan and the Maldives—were given ten years to implement SAFTA provisions. Before 2006 lists ofsensitive goods are to be drawn up, rules of origin compiled and ratification ofthe agreement accomplished by all member states. A dispute settlement body isalso to be set up. It remains to be seen how much progress towards SAFTA willbe made over the next two years. Progress within SAARC largely depends on acontinued improvement in the Indian-Pakistani relationship.
South Asian Association forRegional Co-operation
4 Nepal
© The Economist Intelligence Unit Limited 2004 www.eiu.com Country Profile 2004
Basic data
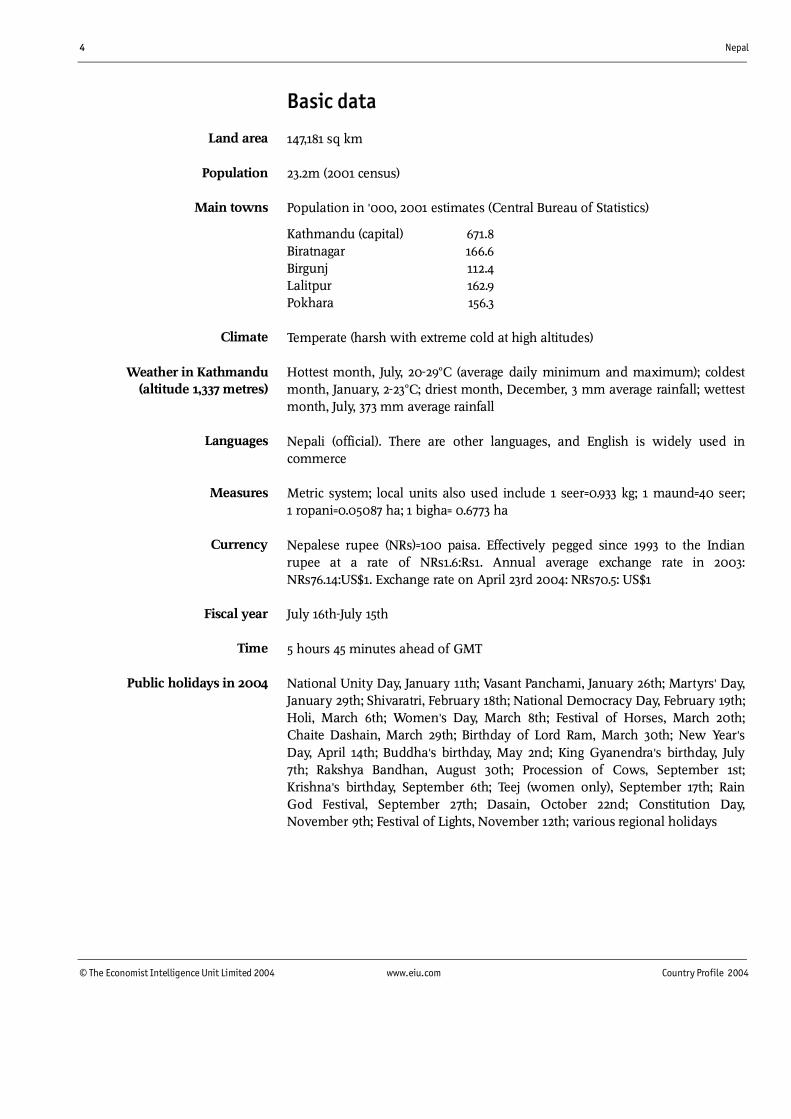
147,181 sq km
23.2m (2001 census)
Population in '000, 2001 estimates (Central Bureau of Statistics)
Kathmandu (capital) 671.8Biratnagar 166.6Birgunj 112.4Lalitpur 162.9Pokhara 156.3
Temperate (harsh with extreme cold at high altitudes)
Hottest month, July, 20-29°C (average daily minimum and maximum); coldestmonth, January, 2-23°C; driest month, December, 3 mm average rainfall; wettestmonth, July, 373 mm average rainfall
Nepali (official). There are other languages, and English is widely used incommerce
Metric system; local units also used include 1 seer=0.933 kg; 1 maund=40 seer;1 ropani=0.05087 ha; 1 bigha= 0.6773 ha
Nepalese rupee (NRs)=100 paisa. Effectively pegged since 1993 to the Indianrupee at a rate of NRs1.6:Rs1. Annual average exchange rate in 2003:NRs76.14:US$1. Exchange rate on April 23rd 2004: NRs70.5: US$1
July 16th-July 15th
5 hours 45 minutes ahead of GMT
National Unity Day, January 11th; Vasant Panchami, January 26th; Martyrs' Day,January 29th; Shivaratri, February 18th; National Democracy Day, February 19th;Holi, March 6th; Women's Day, March 8th; Festival of Horses, March 20th;Chaite Dashain, March 29th; Birthday of Lord Ram, March 30th; New Year'sDay, April 14th; Buddha's birthday, May 2nd; King Gyanendra's birthday, July7th; Rakshya Bandhan, August 30th; Procession of Cows, September 1st;Krishna's birthday, September 6th; Teej (women only), September 17th; RainGod Festival, September 27th; Dasain, October 22nd; Constitution Day,November 9th; Festival of Lights, November 12th; various regional holidays
Land area
Population
Main towns
Climate
Weather in Kathmandu(altitude 1,337 metres)
Languages
Measures
Currency
Fiscal year
Time
Public holidays in 2004

Nepal 5
© The Economist Intelligence Unit Limited 2004 www.eiu.com Country Profile 2004
Politics
Nepal is a constitutional monarchy. King Gyanendra is the head of state, andHinduism is the state religion. A Maoist rebellion has lasted since 1996, andpolitics is characterised by a three-way struggle between the monarchy, theconstitutional parties and the Maoist rebels. The Nepali Congress (NC) won amajority in the May 1999 election, but in-fighting within the NC and Maoistviolence led the elected prime minister, Sher Bahadur Deuba, to seek topostpone the general election planned for November 2002. The king (whoacceded to the throne after many members of the royal family wereassassinated by the crown prince in June 2001) dismissed Mr Deuba onOctober 4th the same year and assumed executive power, appointing LokendraBahadur Chand as prime minister. Mr Chand resigned on May 30th 2003,whereupon the king appointed Surya Bahadur Thapa as prime minister.Tension between the king and the political parties has intensified since theroyal assumption of executive power. Although the government managed toagree a ceasefire with the Maoists on January 29th 2003, negotiations fell aparton August 27th, after the government refused to agree to hold an election for aconstituent assembly to write a new constitution—the main Maoist demand.The constitutional parties continue to demand a return to parliamentarygovernment.
Political background
The modern history of Nepal dates from the second half of the 18th century,when one of the many small hill principalities of the region, Gorkha, began toexpand under the leadership of Prithivi Narayan Shah, conquering Kathmanduin 1768. Before the British halted their expansion in 1814-16, more than75 principalities had succumbed to the Gorkha armies, bringing all of the sub-Himalayan hill areas between Bhutan in the east and the Sutlej river in thewest under Gorkha's control.
The Shah dynasty retained its political prerogatives until Jung Bahadur Ranagained political control in 1846. He extracted a decree from the king that left themonarchy with only nominal power and transferred all sovereign power to theRana family, who ruled as hereditary prime ministers and presided over anisolationist regime that kept most Nepalese in dire poverty. The system lasteduntil 1950 when King Tribhuvan fled to India, sparking a revolt against Ranarule. The king returned to Nepal in January 1951 under an accord brokered bythe Indian prime minister, Jawaharlal Nehru, that recognised the pre-eminentrole of the monarch, legalised political parties and permitted non-Rana primeministers to take office.
Over the subsequent eight years, Nepal was governed by the monarch whilepolitical parties developed and a constitution was drafted. King Mahendra(1953-1972) issued Nepal's first constitution in 1959, and the first democraticelection for a national assembly was held that year, resulting in a victory forthe NC under Bishweshwar Prasad Koirala. In 1961 King Mahendra declared
The Gorkha principalityunites Nepal
A constitutional monarchy
"Party-less panchayatdemocracy"

6 Nepal
Country Profile 2004 www.eiu.com © The Economist Intelligence Unit Limited 2004
democracy a failure and dismissed the government. In 1962 he promulgated anew constitution establishing a new political structure, the "party-lesspanchayat" system. This system banned political parties and created"panchayats", or councils, at the village, district and national levels that advisedthe king, who regained absolute power.
Protests against the panchayat system broke out in 1979, prompting KingBirendra (1972-2001) to hold a referendum in 1980. Voters were asked to decidebetween reform of the panchayat system or the reintroduction of a multipartysystem. A narrow majority voted in favour of a reformed panchayat system.Direct, but still non-party, elections to the 140-member National Panchayat(parliament) were held in 1981 and 1986.
In April 1990 the panchayat system collapsed. Inspired by the downfall ofauthoritarian regimes in eastern Europe, this was largely the result of a year-long economic blockade by India. From February 1990 the Movement for theRestoration of Democracy (MRD)—comprising the NC and the United Left Front(ULF, a coalition of seven leading communist factions)—organised populardemonstrations that brought down the system. The last panchayat primeminister, Mr Chand, resigned on April 15th 1990. On November 9th KingBirendra promulgated a new constitution, under which he became aconstitutional monarch and multiparty democracy was guaranteed.
The NC, led by Girija Prasad Koirala, won a majority in the May 1991 election,but Mr Koirala resigned in July 1994 after losing the support of dissidents withinhis own party. An election in November 1994 returned a hung parliament, inwhich the Communist Party of Nepal (Unified Marxist-Leninist), or CPN (UML),was the largest party. The following five years saw five unstable andunproductive coalition governments. The NC won a majority in the thirdparliamentary election, held in May 1999. Krishna Prasad Bhattarai was primeminister for ten months before being toppled by Mr Koirala, who becameprime minister for the fourth time in March 2000.
Recent political developments
Crown prince Dipendra is believed to have shot dead his father, King Birendra,and nine other members of the royal family, including his mother, sisterand brother, on June 1st 2001. Prince Dipendra became king while in a comaon June 2nd, but died from self-inflicted wounds the following day. KingBirendra's brother, Gyanendra, was crowned on June 4th as the 13th king ofthe Shah dynasty.
Continued factionalism in the NC, including a lack of co-operation fromMr Bhattarai's supporters, led by Mr Deuba, and an uneasy relationship withthe new king caused Mr Koirala to resign on July 19th 2001. The immediateprovocation was a disagreement over the use of the army against the Maoistrebels—Mr Koirala had sent the army to rescue 69 policemen abducted by therebels, but the operation was mysteriously called off before the Maoists wereengaged. Mr Deuba replaced Mr Koirala, and immediately announced atruce with the Maoists and invited them to talks.
A constitutional monarchy isre-established
The massacre of the royalfamily

Nepal 7
© The Economist Intelligence Unit Limited 2004 www.eiu.com Country Profile 2004
Nepal's Maoist insurgency
The Maoists launched their "people's war" to topple Nepal's constitutional monarchy, in order to set up a communistrepublic, on February 13th 1996. According to media reports, the rebels are present in all of Nepal's 75 districts. They arestrongest in the remote districts of mid- and far-west Nepal, where the insurgency was nurtured and where the governmentsecurity presence is minimal. The rebels' extreme left-wing ideology connects with Nepal's widespread poverty andassociated social problems, such as exclusion resulting from entrenched caste- and class-based discrimination, politicalinstability, corruption and poor governance.
The conflict has grown from what was a low-intensity conflict until 2001 into a high-intensity one, with an average of morethan 1,000 deaths every year, to become Nepal's main political and developmental challenge. Nepal's political equationturned into a three-way power tussle between the king, the parliamentary parties and the Maoists in October 2002, whenthe king sacked the elected government and appointed an administration of his own choosing. In a public speech in early2004 the king said that he wanted a democracy where the monarch was "seen" and also "heard". The parties, by contrast,want a real democracy, with the king as titular head of state only. The Maoists, for their part, would like to see both theconstitutional parties and the king out of the way in order to set up a communist republic. The government has twice triedto negotiate a settlement with the Maoists—first in mid-2001, and more recently between January and August 2003. But thetalks have broken down over conflicting positions. The Maoists want a new constitution; the government position has beenthat it is willing to amend the existing constitution to address all the rebel's demands except those that relate to theabolition of the constitutional monarchy and multiparty democracy.
The death toll
In eight years the Maoist-government conflict has cost over 9,000 lives. The Maoists resumed violence immediately afterthe ending of the ceasefire on August 27th 2003. On November 15th they ambushed an army brigadier-general, the highest-ranking soldier killed after the assassination of the inspector-general of the Armed Police Force in the capital, Kathmandu,the previous January. Most of the dead recorded in the statistics are Maoists or "suspected" Maoists. The death toll escalatedduring the state of emergency between November 2001 and August 2002, and rose once more after the collapse of thesecond truce on August 27th 2003. According to a local human rights group, the Informal Sector Service Centre (whichseems to have the most up-to-date statistics on the conflict), up to March 13th 2004 the "state" had killed 6,221 people and"non-state" actors had killed 2,949.
The peacemaking effort
The government and the Maoists met three times for negotiations in 2003. The Maoists tabled their demands at the firstround. The second round became bogged down in a dispute over a point that had supposedly already been agreed: theMaoists said that the government had agreed to restrict troop movements to within five kilometres of barracks. Thegovernment denied this, and resigned before the dispute had been settled. It took considerable effort by the newgovernment team to bring the rebels back to the negotiating table. At the third round of talks, the government presented its"road map" for peace and development—a response to the Maoist manifesto—which was immediately rejected by theMaoists. The main parliamentary parties did not participate in the negotiations; the government had invited them forconsultations, but they declined to attend.
The following are some of the main Maoist demands, and the government's responses.
• The Maoists want a new constitution. The government has agreed to amend the existing statute to change everythingexcept the inalienable sections, which relate to sovereignty, constitutional monarchy and multiparty democracy.
• The government has agreed to the Maoists' demands for an inclusive political system, making the National Assembly(the upper house) a house of nationalities and ethnic groups. It has also agreed to programmes for the uplift ofminorities, and the reservation of 25% of seats in both houses of parliament for women. The government has also

8 Nepal
Country Profile 2004 www.eiu.com © The Economist Intelligence Unit Limited 2004
agreed to greater devolution of power to local governments, but the government's proposal fell short of the"autonomy" that the Maoists have promised to seven ethnic groups and two geographical regions.
• The Maoists want referendums to decide contested national issues—including those that the constitution says areunchangeable. The government will accept referendums, but not on issues that the constitution says are inalienable.
• The Maoists want the army to be brought under government control—the king is now its supreme commander—andNepal declared a secular state. The government has been silent on both issues.
• The two sides also differ on the economic models that they want to implement. The Maoists want to set up a"nationalist", self-reliant economy, whereas the government favours an open, market-based economy.
The truce with the Maoists collapsed in November 2001 following a series oftalks. On November 26th of that year the government declared a state ofemergency and sent the military to disarm the rebels. In February 2002parliament extended the emergency period for a further three months. In-fighting within the ruling NC continued, and Mr Deuba dissolved parliament inMay 2002 after failing to win the support of his own party for another six-month extension of the state of emergency. The government then extended thestate of emergency, which was eventually lifted at end-August. The governmentplanned to hold a general election in November 2002, but in early OctoberMr Deuba asked the king to postpone the election, citing security concerns.Rather than take his advice, King Gyanendra dismissed Mr Deuba and hisgovernment on October 4th and appointed an interim government, which heasked to restore law and order and to hold a general election. On October 11thhe named the leader of the National Democratic Party (NDP), LokendraBahadur Chand, as prime minister.
Since the dismissal of the elected government in 2002, the Maoists haveattempted to lure the disgruntled and sidelined constitutional political partiesinto jointly demanding the formation of an interim government. They wouldlike such a government to conduct an election for a constituent assembly,which would, in turn, write a new (republican) constitution. Although theparties have not aligned themselves with the Maoists, they have launched theirown protests against the king, whom they have charged with violating theconstitution. Despite the political uncertainties, Mr Chand's governmentreached a ceasefire with the Maoists on January 29th 2003 and held tworounds of talks. However, Mr Chand resigned at end-May, having failed tosecure the support of the parliamentary parties. The king eventually appointedMr Thapa as prime minister on June 4th 2003, against the wishes of the fivemain parliamentary parties. The five parties—the NC, the CPN (UML), the NepalSadbhavana Party (NSP), the Nepal Workers' and Peasants' Party (NeWPP) andJana Morcha Nepal—in a joint protest against the king's "absolutist" tendenciesdemanded that Madhav Kumar Nepal of the CPN (UML) be appointed asprime minister. The parties have not co-operated with Mr Thapa's government.The student unions supporting the parties have given a clearly anti-monarchical flavour to protests against the government. In April 2004 KingGyanendra said that a general election would be held by April 2005. OnApril 8th the government banned protests in the capital, Kathmandu.
The parties fail to co-operatewith the government
Parliamentary government issuspended

Nepal 9
© The Economist Intelligence Unit Limited 2004 www.eiu.com Country Profile 2004
Important recent events
May 1999
The Nepali Congress (NC) wins 111 seats (later bolstered to 113) in the 205-seat Houseof Representatives (the lower house of parliament). Krishna Prasad Bhattaraibecomes prime minister.
March 2000
The NC president, Girija Prasad Koirala, ousts Mr Bhattarai to become primeminister.
June-July 2001
A shoot-out at the royal palace on June 1st leaves King Birendra and nine membersof the royal family dead. Crown Prince Dipendra is said to have killed them beforeshooting himself. The late king's brother, Gyanendra, becomes king on June 4th.Mr Koirala resigns on July 19th and Sher Bahadur Deuba becomes prime minister onJuly 22nd.
November 2001
After an escalation of Maoist violence the government asks King Gyanendra todeclare a state of emergency. The government declares the Communist Party ofNepal-Maoist (CPN-M) a terrorist organisation and sends the Royal Nepalese Armyto "disarm" the rebels.
October 2002
King Gyanendra dismisses the elected government after Mr Deuba tries to delay aplanned election, and appoints Lokendra Bahadur Chand as prime minister.
January-May 2003
The Maoists and the government announce a ceasefire and hold two rounds oftalks. Mr Chand resigns at the end of May after failing to secure the co-operation ofthe five main parliamentary parties, which begin protests against the king and thegovernment in the same month.
June 2003
The king appoints Surya Bahadur Thapa as prime minister. The government holds afurther round of negotiations with the Maoists. The Maoists announce the end ofthe ceasefire on August 27th and resume violence.
April 2004
The government bans protests in Kathmandu. The king promises a return todemocratic government within a year.
Constitution, institutions and administration
Nepal's 1990 constitution was suspended in October 2002, when KingGyanendra assumed executive authority, since when he has appointed a seriesof interim governments. The constitution requires the prime minister to be anelected member of parliament (MP), and provides for elected offices to be filledwithin six months. Parliament was dissolved in May 2002, and in July the sameyear the government allowed the terms of local governments to expire, in effect
The constitution remainssuspended

10 Nepal
Country Profile 2004 www.eiu.com © The Economist Intelligence Unit Limited 2004
leaving vacant all local-level elected posts. As a result, it is uncertain how the1990 constitution can be activated again without a general election, pre-parations for which were suspended in November 2002. The Maoist rebels aredemanding the election of a constituent assembly to write a new constitution.
Under the 1990 constitution elections are supposed to be held every five yearsfor the 205-member House of Representatives (the lower house of parliament).The full five-year term of the parliament elected in 1999 would have ended thisyear, had the legislature not been dissolved in May 2002. Under theconstitution, the party with the majority of seats elects a leader, who isappointed prime minister by the king. The prime minister names the council ofministers, who are then appointed by the king. The National Assembly (theupper house of parliament) comprises 60 members, of whom 35 are elected bythe lower house, 15 are elected by the heads of local and regional developmentcommittees (local government units) and ten are appointed by the king.Members serve staggered six-year terms. The upper house has the right toinitiate bills (except finance bills) and to review, amend and reject bills passedby the lower house. The lower house may override, by a simple majority vote,any action taken by the upper house. Under certain conditions the king maydeclare a state of emergency, but the lower house must ratify such a decisionwithin three months.
Since 1990 the judiciary has often been called upon to interpret theconstitution. Despite the extent to which politics pervades public life in Nepal,the judiciary has remained largely outside the political fray, althoughallegations of corruption have been levelled against it. The judiciary comprises75 district, 16 appeals, one special court and a Supreme Court.
Political forces
A handful of major national parties and some regional parties have beenestablished, all of which are plagued by factionalism.
The Nepali Congress (NC) was established in 1947 in India, and many of itsearly leaders, including Bishweshwar Prasad Koirala (the prime minister from1959 to 1961), had close ties with the Indian National Congress. The Koiralafamily still plays a dominant role in the party. The NC opposed rule by theRana family in the late 1940s and the introduction of the "panchayat" system ofparty-less democracy. The NC was the natural party of government followingthe restoration of democracy, despite failing to develop a clear ideologicalidentity. It advocates democratic socialism, but has also championed free-market liberalisation. The party is divided between the supporters of twoseptuagenarians, Girija Prasad Koirala and Krishna Prasad Bhattarai. Thefactions clashed in May 2002, when Sher Bahadur Deuba—the prime ministerand a protégé of Mr Bhattarai—was expelled from the party for disobeying aparty order not to extend the state of emergency. Mr Deuba then tried to wrestthe party from Girija Prasad Koirala (the younger brother of BishweshwarPrasad Koirala, and by this time the NC president), but on September 17th theElection Commission ruled that the NC, led by Mr Koirala, could use the NC
A fairly independent judiciary
The Nepali Congress

Nepal 11
© The Economist Intelligence Unit Limited 2004 www.eiu.com Country Profile 2004
symbol in the election, which was originally due to be held in November 2002.Mr Deuba then set up a new, rival party, the Nepali Congress (Democratic).
The parent Communist Party of Nepal (CPN) was established in the late 1940s,and Nepal now has an array of rival communist parties with similar names.The Communist Party of Nepal (Unified Marxist-Leninist), or CPN (UML), wasformed in 1990 through the merger of the Communist Party of Nepal (Marxist-Leninist) and the Communist Party of Nepal (Marxist). Part of the CPN (UML)broke away in 1998 to form the CPN (Marxist-Leninist), but most of this splintergroup rejoined the CPN (UML) in February 2002 after the new party failed towin any seats in the 1999 election.
Main political figures
Surya Bahadur Thapa
The prime minister is the leader of the National Democratic Party (NDP). He wasappointed prime minister on June 4th 2003. He served as chairman of the council ofministers in 1965 and as prime minister in 1979, 1981, 1998 and 2003.
Lokendra Bahadur Chand
Mr Chand was prime minister from October 11th 2002 to May 30th 2003. He hadpreviously served as prime minister in 1983, 1990 and 1997.
Sher Bahadur Deuba
Mr Deuba was prime minister in 1995-97 and from July 2001 to October 2002. Hesplit from the Nepali Congress (NC) in September 2002 to form a new party, theNepali Congress (Democratic).
Girija Prasad Koirala
The current president of the NC, Mr Koirala was prime minister in 1991-94, 1998-99and from March 2000 to July 2001.
Krishna Prasad Bhattarai
Mr Bhattarai was prime minister in 1990-91 and between May 1999 and March 2000.He has been relatively inactive in politics recently, although he supported Mr Deubain the factional wrangling within the NC that led to the party's split.
Madhav Kumar Nepal
The general secretary of the Communist Party of Nepal (Unified Marxist-Leninist), orCPN (UML), Mr Nepal was deputy prime minister from December 1994 to September1995. He was re-elected as general secretary of the CPN (UML) for five years inFebruary 2002.
King Gyanendra
King Gyanendra has been head of state since June 2001. His assumption of executivepower in late 2002 has led to conflict with the parliamentary parties.
Puspa Kamal Dahal, who goes by the nom de guerre of Prachanda, is thechairman of the Communist Party of Nepal (Maoist), or CPN-M. He becamechairman of the party in February 2001, and also presides over the party'scentral military commission. The party's other influential leader is a formerarchitect, Baburam Bhattarai, who was previously president of the United
The communist parties
The Maoists
12 Nepal
Country Profile 2004 www.eiu.com © The Economist Intelligence Unit Limited 2004
People's Front of Nepal (UPFN), a leftist party that contested elections in 1990.He heads the rebel United Revolutionary People's Council, the Maoists'equivalent of a central government. Estimates of the rebel fighting forces varyfrom 7,000 to 10,000, but the numbers are impossible to verify.
Composed of politicians from the defunct panchayat system, the NationalDemocratic Party (NDP) played the role of kingmaker in the 1994-99 hungparliament. In 1998 it split into two factions, the NDP (Thapa) and the NDP(Chand). The NDP (Thapa) emerged as the third-largest party after the May 1999election, but the NDP (Chand) failed to win a seat. Part of the NDP (Chand)then rejoined the NDP (Thapa). Surya Bahadur Thapa, who had led the NDPsince its inception, stepped down on December 17th 2002, and PashupatiSumsher Rana—a member of the Rana family that ruled Nepal as hereditaryprime ministers before 1950—became its new president. The king has pickedboth of the interim government's prime ministers from the NDP sincedismissing the elected prime minister in October 2002.
Smaller parties in parliament, such as the Nepal Workers' and Peasants' Party(NeWPP), the Jana Morcha Nepal (National People's Front) and the NepalSadbhavana Party (NSP), are more or less irrelevant to the present powerequation, although the NSP has considerable influence in the plains borderingIndia and has been elected to parliament in every election since 1990. Nepalalso has about a dozen minor communist groupings.
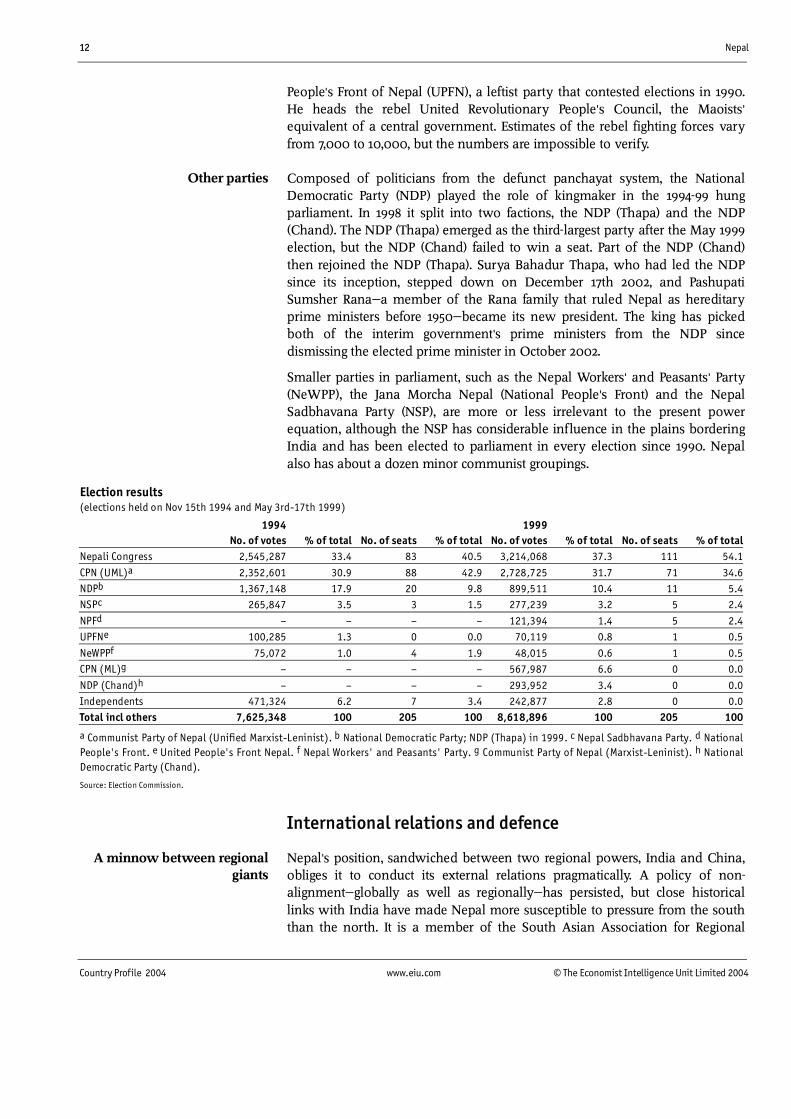
Election results(elections held on Nov 15th 1994 and May 3rd-17th 1999)
1994 1999No. of votes % of total No. of seats % of total No. of votes % of total No. of seats % of total
Nepali Congress 2,545,287 33.4 83 40.5 3,214,068 37.3 111 54.1
CPN (UML)a 2,352,601 30.9 88 42.9 2,728,725 31.7 71 34.6NDPb 1,367,148 17.9 20 9.8 899,511 10.4 11 5.4NSPc 265,847 3.5 3 1.5 277,239 3.2 5 2.4
NPFd – – – – 121,394 1.4 5 2.4UPFNe 100,285 1.3 0 0.0 70,119 0.8 1 0.5
NeWPPf 75,072 1.0 4 1.9 48,015 0.6 1 0.5CPN (ML)g – – – – 567,987 6.6 0 0.0
NDP (Chand)h – – – – 293,952 3.4 0 0.0Independents 471,324 6.2 7 3.4 242,877 2.8 0 0.0Total incl others 7,625,348 100 205 100 8,618,896 100 205 100
a Communist Party of Nepal (Unified Marxist-Leninist). b National Democratic Party; NDP (Thapa) in 1999. c Nepal Sadbhavana Party. d NationalPeople's Front. e United People's Front Nepal. f Nepal Workers' and Peasants' Party. g Communist Party of Nepal (Marxist-Leninist). h NationalDemocratic Party (Chand).
Source: Election Commission.
International relations and defence
Nepal's position, sandwiched between two regional powers, India and China,obliges it to conduct its external relations pragmatically. A policy of non-alignment—globally as well as regionally—has persisted, but close historicallinks with India have made Nepal more susceptible to pressure from the souththan the north. It is a member of the South Asian Association for Regional
A minnow between regionalgiants
Other parties

Nepal 13
© The Economist Intelligence Unit Limited 2004 www.eiu.com Country Profile 2004
Co-operation (SAARC), which has its headquarters in Kathmandu. On February8th 2004 Nepal obtained membership of the Bangladesh, India, Myanmar, SriLanka, Thailand Economic Co-operation (BIMST-EC) group. BIMST-EC was setup in 1997, and Nepal had been an observer at the forum since 1998. Nepalbecame a member of the World Trade Organisation on September 12th 2003.
Relations with India revolve around the 1950 Peace and Friendship Treaty thatgives India an advantageous position in security matters, investment andemployment opportunities. Moreover, because Nepal is landlocked, it is subjectto Indian pressure when bilateral trade and transit agreements come up forrenewal. Several trade and transit treaties have been agreed since 1989, as has amajor treaty providing for joint development of the water resources of theMahakali river. However, disputes over border demarcation have persisted forover 20 years, and there are new disagreements resulting from India'sconstruction of embankments near the border, which have caused inundationand flooding in Nepal. Nepal and India signed a preferential trade treaty inDecember 1996, which was amended in March 2002 (it should have beenrenewed automatically, but India requested a renegotiation of the origin rulesand safeguards). The revised treaty fixed quotas for four Nepalese exports,effectively bringing an end to their preferential treatment beyond a certain level.
China has historically served as a counterweight to Indian influence, albeitwith the severe limitations imposed by topography in the form of theHimalayan mountain range that separates the two countries. China supportedthe royalist regime in the early 1960s, whereas India backed armed raids by NCsupporters from Indian territory. High-level visits in recent years havestrengthened ties, and China has been a substantial aid provider. The Nepalesegovernment upholds the "One China" policy, which states that Taiwan is part ofChina. It also discourages political activity by Tibetan exiles within its territory.
Nepal's defence force numbers about 63,000, comprising three infantrydivisions outside Kathmandu Valley and one within the valley, including nineinfantry brigades. The government approved 5,000 new recruits in fiscal year2001/02 (ending 15th July), since when numbers have grown every year. TheRoyal Nepalese Army and Nepalese police personnel regularly participate inUN peacekeeping operations. The army has a small air force of light aeroplanesand helicopters, but no combat aircraft. The police force is around 40,000-strong and includes an Armed Police Force, which was set up in 2001.
Armed forces, 2003/04Army 63,000 Air wing 320
Paramilitary 40,000
Source: International Institute for Strategic Studies, The Military Balance 2003-2004.
India
China
The military

14 Nepal
Country Profile 2004 www.eiu.com © The Economist Intelligence Unit Limited 2004
Resources and infrastructure
Population
According to the 2001 national census, Nepal's population was 23.2m, andincluded 102 different ethnic and caste groups. Only 3.2m people lived in theurban areas in 43 of Nepal's 75 districts, the population densities of whichvaried from 132 per sq km in Dadeldhura to 11,099 per sq km in the capital,Kathmandu. The average household size was 5.4 persons in 2001. In terms ofgeographical distribution, 7.3% of the population live in the mountain districts,44.3% in the hill districts and 48.4% in the Terai, or plains, in the south. There issteady migration from the impoverished hill and mountain areas to theKathmandu valley and the Terai region abutting India. The population grew atan annual average rate of 2.3% between 1991 and 2001 (the growth rate hasbeen especially high in the Kathmandu valley, at an average of 4.7% a year),despite high rates of infant mortality (64.2 per 1,000 live births at end-2002)and a low life expectancy at birth of just 61.9 years. Nepal's urban populationalmost doubled between 1991 and 2001. According to the census, almost 80.6%of the population are Hindus, 10.7% are Buddhists, 4.2% are Muslims and 3.6%are Kiratis—a population group that previous censuses recorded as Hindus.
Population by age, 2001Age range (years) Population (m) % of total0-14 8.94 39.415-19 2.38 10.5
20-24 2.01 8.825-29 1.72 7.630-34 1.48 6.6
35-39 1.31 5.840-44 1.08 4.8
45-49 0.92 4.150-54 0.76 3.4
55-59 0.60 2.760-64 0.52 2.365-69 0.38 1.7
70-74 0.27 1.2Over 75 0.29 1.3
Total 23.2 100.0
Note. Totals may not sum, owing to rounding.
Source: Central Bureau of Statistics, Census 2001.
Education
In 1951 the literacy rate was just 5%. The government estimated the literacyrate at 53.7% in fiscal year 2002/03 (ending July 15th). Progress in educationhas been agonisingly slow, and the system remains patchy and of poor quality.The government is the major education provider and, according to thegovernment, in 2001 about 84% of primary and secondary school studentswere enrolled in government schools. Nepal had 37,566 schools in 2001, over
Slow progress
Rapid growth

Nepal 15
© The Economist Intelligence Unit Limited 2004 www.eiu.com Country Profile 2004
25,000 of them in the public sector. Private schools educate about 1m pupilsand have higher teacher-student ratios (1:22, compared with 1:44 in publicschools). Total student enrolment in 2001 was 5.3m, of whom more than 72%were attending primary school. Males are more likely to receive an education:female enrolment accounts for around 44% of the total. The governmentintroduced higher secondary education in 1992/93, and in 2002/03 Nepal had789 higher secondary schools.
The Education (Seventh Amendment) Act has been in force since 2001. Schoolswere reclassified as community schools, which receive government grants, andinstitutional schools, which are run by trusts or as private companies. In June2002 the government began handing over school management to village anddistrict development committees in an attempt to increase teacheraccountability. It had handed over such schools to about 700 communities inearly 2004. Since 2001 the education system has faced a new challengefrom the Maoists, who are demanding free universal education and thenationalisation of private schools. The Maoists have also "taxed" teachers. Thepro-Maoist student union, the All Nepal Free Students Union (Revolutionary),has threatened teachers and school authorities, and forced many privateschools in districts to close. By mid-March 2004, 114 school teachers had beenkilled in the armed conflict.
Successive governments have promised to make primary education free andcompulsory for all, but even today about 20% of all school-age children do notgo to school. Many students never make it beyond primary school, anddropout rates are high. The Basic and Primary Education project, funded by agroup of donors including the World Bank, the Asian Development Bank, theEU and bilateral donors, helped to raise overall enrolment from around 69% in1998 to about 80% by 2000 and to reduce the dropout rate from around 19% to15%. The same group of donors are working with the government on a follow-up project. The US$814m Education for All project (2004-09) has six goals:expanding early childhood care, ensuring access to education for all children,meeting the learning needs of all, reducing adult illiteracy, eliminating genderdisparities and improving all aspects of educational quality.
Nepal's largest university, Tribhuvan University (TU), provides for the vastmajority of undergraduates. In 2002/03 its 61 publicly funded campuses and222 privately run affiliated campuses had a student body of 181,038—63,363 inthe private colleges. In 2001/02 TU produced only 163 engineers and 190doctors with education above bachelor level. It also produced 447 graduates atthe Master's level. The TU suffers from administrative chaos, and manystudents never obtain a degree. Nepal's three other regular universities(Kathmandu University, Eastern University and Pokhara University) had a totalof about 14,800 students in 2002/03. The Mahendra Sanskrit University had3,000 students.
Primary-school enrolmentstatistics are overstated
Tribhuvan University

16 Nepal
Country Profile 2004 www.eiu.com © The Economist Intelligence Unit Limited 2004
Health
Nepal scores poorly on virtually every public health indicator. At end-2002 lifeexpectancy at birth was 61.9 years—one of the lowest in South Asia. The officialestimate of infant mortality (64.2 per 1,000 live births at end-2002) representedan improvement from 165 per 1,000 in 1970 and 199 per 1,000 in 1960. Thematernal mortality rate—one of the highest in the world—was 415 per 100,000births. In 2001/02 only 14% of deliveries were assisted by trained healthpersonnel, the coverage of health services to pregnant women was 42%, and16.5% of all children under three years of age were malnourished. According togovernment statistics, 71.6% of the population had access to safe drinking waterat end-2002. In 2001 52% of Nepal's 4.2m households had access to lavatories,only one-half of them to modern toilets. In May 2003 Nepal had 2,883 reportedHIV and 644 AIDS cases, although the government estimates that as many as60,000 adults and children are infected with the HIV virus. About 45% ofNepalese are believed to be infected with tuberculosis (TB), according to a 2002study by the World Bank, and about 44,000 develop "active" TB every year,leading to 8,000-11,000 TB deaths a year. A TB prevention programme has beenunder way since 1996.
The government is the main institutional healthcare provider, but it does awoefully inadequate job. In an efficiency drive in 1995, it closed nearly one-quarter of its hospitals. Since then the number of hospitals has increased again,standing at 83 in 2002/03, and the number of beds in government hospitals hasreached an estimated 5,310. The government was running 83 hospitals, tenhealth centres, 700 health posts, 3,170 sub-health posts and 180 primary healthcentres in 2002/03. Since the early 1980s village clinics have been supposed tosupplement hospitals, by providing preventive and simple curative healthservices. It is unclear how many of these clinics are functional—the Maoistrebels have destroyed many of them and have scared away health workers.Trained medical staff generally avoid working in remote areas. Anotherproblem is financial: hospitals and clinics charge on a fee-for-service basis, andmost Nepalese have neither insurance nor the funds to pay for healthcare. Thegovernment spends about 5% of its budget on healthcare, amounting to aboutUS$5 per head annually. Nepal also has privately run hospitals, but most ofthem are located in urban centres, and the cost of seeking treatment there isbeyond the reach of the majority of the population.
Natural resources and the environment
The topography of Nepal varies greatly. In the south are the plains of the Terai,where about 70% of Nepal's cultivated land lies, and the forest-clad slopes ofthe lower hills, which rise to about 1,200 metres. In the central region there is asuccession of mountains varying in height from 1,200 to 3,000 metres. TheHimalayan region consists of mountains ranging from 3,000 metres to the8,848-metre Mount Everest. Of Nepal's 75 districts, 16 lie in the mountain region,39 in the middle hills and 20 in the Terai. The mountains, hills and the Teraicomprise 35%, 42% and 23% of the country's land area respectively.
A wide range of climates
A multitude of problems
The government is the mainhealthcare provider

Nepal 17
© The Economist Intelligence Unit Limited 2004 www.eiu.com Country Profile 2004
The forested area has declined over the past 30 years because of the extensiveuse of firewood as fuel, uncontrolled grazing, the clearance of land forcultivation and overexploitation of forests for commercial purposes. In 1994,29% of the land area was forested. A 1993 policy giving ownership andmanagement of forests to local communities has helped to slow the rate ofdeforestation. In July 2003, 12,584 community forest user groups owned andmanaged 1.3m ha of forest. Both the number of these groups and the area offorest cover that they have helped to regenerate has increased every year sincethe introduction of the policy. The government is also implementing aprogramme to hand over degraded land to poor communities on long-termleases in 26 districts. In 2002/03 it handed over 7,060 ha of land to leaseholdforestry groups. Nepal has 19 national parks, conservation areas, hunting areasand protected buffer zones, which collectively cover 26,971 sq km.
Transport, communications and the Internet
Of Nepal's 75 districts, 15 do not have roads suitable for motor vehiclesconnecting them with the rest of the country. In March 2001 Nepal had15,985 km of roads, of which only 4,617 km was black-topped. Nepal built only15 km of road between July 2002 and March 2003, largely because of theconflict and insecurity in rural areas. Most of Nepal's roads are frequentlywashed away during the rainy season, and the hill and mountain trails aresuitable only for pedestrians and pack animals. The pace of roadbuildingstagnated in the 1980s, but road mileage more than doubled during the 1990s.Nepal's roadbuilding is reliant on foreign aid. China built the highway linkingKathmandu with Kodari on the Chinese border in 1967, and a second road toChina is also being built with Chinese aid. Much of Nepal's main East-WestHighway in the plains in the country's south was built with Indian assistance.Nepal had 381,547 registered motor vehicles in mid-March 2003, of whichalmost 60% were motorcycles and over 50% were based in the Kathmanduvalley.
A 5.3-km broad gauge railway connecting Nepal's inland container depot inBirgunj with India's rail network was completed in February 2001. Nepal andIndia signed a rail operation agreement on November 8th 2003, but the tracksneed to be repaired before the trains can use them. In April 2004 the containerterminal was still lying idle while Nepal sought a suitable managementcompany. Once operational, the railway will help direct transport of cargo toand from Indian ports. Nepal's other rail line is a 51-km spur (of which 22 kmare in Nepal) connecting Janakpur with Jayanagar in Bihar, India. The line,which was built in 1936, is operated by the Nepal Transport Corporation. Nepalhas asked India to extend rail links to three more points in the country.
Nepal has 44 airfields, most of which are suitable only for small aircraft.Tribhuvan International Airport (TIA) in Kathmandu is the only significantairport. The TIA handles less than a dozen international flights a day. Over 120helipads help to provide access to many of the remote mountain areas. Thenational carrier, Royal Nepal Airlines Corporation (RNAC), is poorly run andoverstaffed, and it has been almost completely displaced from the main
Roads
Air
Railways

18 Nepal
Country Profile 2004 www.eiu.com © The Economist Intelligence Unit Limited 2004
domestic routes by private airlines (allowed since 1992) and by new carriers oninternational routes. The government plans to break up the corporation intoseparate companies handling domestic and international operations before it isprivatised.
The 1998 revision of the bilateral air agreement with India relieved somecongestion and increased the weekly seating capacity on routes to the Indiancapital, New Delhi, from 4,000 to 6,000 and that on routes to Mumbai(Bombay) from 600 to 1,200. In June 2001 Singapore Airlines cancelled itsservices to Nepal. RNAC began flying to Singapore and Malaysia in 2003,catering for the Nepalese who work there. Most international air cargo comesfrom Bangkok or the Persian Gulf; delays are common.
Domestic and international telephone links are reliable but expensive. Much ofthe infrastructure was built with Japanese aid. In April 2002 Nepal signed anagreement with India, whereby India undertook to provide NRs13.4bn(US$175m) to build an "information superhighway" using fibre-optic cable. Thestate-owned Nepal Telecom, formerly Nepal Telecommunications Corporation,had installed 356,323 lines by March 2003, but there was a backlog of 306,028applications. Most lines have been installed in the Kathmandu valley and otherurban centres, but services elsewhere are patchy. In March 2002 only 1,761 ofthe country's 3,915 village development committees had telephone connections.The Maoists have attacked many of the rural telephone systems in thecountry's mid- and far-western regions. The government has been unable toextend telecoms services because of continued violence.
In theory, the telecoms sector has been liberalised, and licences for variousservices are auctioned to both private and government-owned firms. The sectoris regulated by the Nepal Telecommunications Authority (NTA). The monopolyof Nepal Telecom was broken in September 2003 when United TelecomLimited, an Indian-invested company, began offering services in Kathmanduusing wireless local-loop technology. In March 2004 the government said that itplanned the full privatisation of the telecoms sector.
In March 2003 the NTA had licensed 22 Internet service providers, 47 satellitecommunications users and service providers, and eight pager services. The NTAlicensed two companies to operate satellite mobile phone services in mid-April2003, a move largely aimed at regularising the illegal use of the phones. TheNTA licensed another private company to operate rural telephone services ineastern Nepal in 2003.
The government licenses and regulates the broadcast media and also runsnational radio and television stations. About 80% of the population can receiveRadio Nepal, but only 60% of the population are able to receive NepalTelevision (NTV) broadcasts. The government licensed a television company,Space Time Network (STN), to broadcast via satellite in 1993, but denied itpermission to uplink from Nepal in 2001. In September 2002 STN won a courtorder allowing it to uplink from the country. STN is a market leader in cable TVand also runs Channel Nepal, a Nepali-language satellite service that wasinitially beamed from Thailand. In early 2002 the government licensed three
Telecommunications
Broadcast media

Nepal 19
© The Economist Intelligence Unit Limited 2004 www.eiu.com Country Profile 2004
more private television companies, and added a local channel to NTV. The newprivate channels began broadcasting in July 2003. Nepal began licensing privateFM radio in 1997, and had licensed 25 radio stations by December 2003. Most ofthe FM stations are small operations, some of which are run by non-profit andlocal community groups. The Maoists rebels also operate a clandestine radiostation whose broadcasts can be heard on certain days in many districts outsideKathmandu valley.
The Nepalese press is lively, but since November 2001 the government has shutdown several newspapers sympathetic to the Maoists and has arrested severaljournalists. According to a Nepalese human rights group, the Informal SectorService Centre, 204 journalists were detained between 1996 and early 2004, ofwhom 191 were freed after interrogation. The government owns one English-language and one Nepali newspaper, but several daily and weekly publicationsin both languages enjoy a fairly wide circulation. There is a plethora of smallernewspapers and magazines, in Nepali and some local languages, with tinycirculations, many of which are affiliated to political parties.
Energy provision
Most of Nepal is heavily dependent on traditional energy sources, includingfirewood as well as farm and livestock residues. Energy consumption in2002/03 was equivalent to 8.3m tonnes of oil equivalent. Energy fromtraditional sources accounted for 85.8% of consumption in 2002/03. Firewoodsupplies the vast bulk of energy needs, at around 76% of total energyconsumption, and this dependence could devastate Nepal's hill and mountainregions through deforestation and subsequent erosion.
The development of the power sector has been hamstrung by the lack of botha coherent energy policy and investment capital. Total installed capacity in2002/03 was 606 mw. Among the independent power producers (IPPs), aNorwegian joint venture (involving three Norwegian energy companies,Statkraft, Kvaerner Energy and ABB Kraft, and the local Butwal PowerCompany) has a generating capacity of 60 mw, and a US joint venture(between two US energy companies, Panda Energy and Harza Engineering, anda local firm, Himal International Power) has a generating capacity of 36 mw.Together the IPPs supply 21% of the total installed capacity of the NepalElectricity Authority (NEA). A 144-mw government project, Kali Gandaki A,began supplying to the central grid in May 2002. A new private hydropowerproject, Indrawati III, with capacity of 7.5 mw, began operations in October2002. An NEA/public-sector project, Chileme, began generating 20 mw ofelectricity in July 2003. The government is building another 70-mw project (at acost of US$190m) with German assistance. The poor security situation in thecountry has delayed the Middle Marsyangdi project—now expected to come online in 2006—by over a year. Nepal plans to build a further 12 hydropowerplants with private participation under a new World Bank loan that wasapproved in April 2003.
Firewood supplies three-quarters of Nepal's energy
The press

20 Nepal
Country Profile 2004 www.eiu.com © The Economist Intelligence Unit Limited 2004
Hydropower is the main source of electricity. Nepal has the potential togenerate up to 83,000 mw of hydropower, but this remains largely untapped,for both technical and political reasons. Water flows in many rivers are highlyvariable, and there is controversy over Nepal's use of rivers that flow into India.In 1996 Nepal and India agreed on the joint development of the Mahakali river,but progress has been slow.
The greatest obstacles to development of the power sector are economic.Hydropower is more capital-intensive than thermal power generation, andNepal lacks the necessary capital. Nepal's average electricity tariff is alreadyone of the highest in South Asia, mainly because of high—often inflated—construction costs as well as other forms of inefficiency. Foreign investors havenot been convinced of the financial viability of large projects. Some foreigninvestors have become caught up in Nepal's internal politics, and as the onlyviable market for power is Nepal's neighbour, India, they have alsoencountered delays in relation to investments that involve exporting power toIndia. An Australian company, Snowy Mountain Engineering, receivedclearance from Nepal to develop a 750-mw project in 1997. India approved apower purchase agreement with the project, expected to cost US$1bn to build,only in late 2003.
The economy
Economic structureMain economic indicators, 2003GDP growth (%) 2.3a
Consumer price inflation (%) 5.7Current-account balance (US$ m) -339.3b
Foreign debt (US$ m) 2,700c
Exchange rate (NRs:US$; av) 76.14
a Fiscal year ending July 15th; b 2001; c End-2001.
Sources: IMF, International Financial Statistics; World Bank, Global Development Finance 2003.
Around 76% of the economically active population live in rural areas anddepend on subsistence farming. The contribution to GDP of agriculture, forestryand fishing has slipped from about 70% in fiscal year 1974/75 to around 39% infiscal year 2002/03 (ending July 15th), because of growth in public utilities, tradeand hotels, transport and other services. Most agricultural production takesplace in the Terai plains and the fertile valleys of the central hilly regions. About30% of Nepal is unfit for agriculture or forestry. Farming plots are highlyfragmented, and an estimated 11% of cultivated plots are smaller than 0.5 ha.
The manufacturing sector—limited largely to carpets, garments and handicrafts—accounted for 7.9% of GDP in 2002/03. Indian competition, poor infrastructure, alimited local market and the lack of sea access hinders the development of thissector. The largest component of the services sector has traditionally beentourism, although a fall in tourism activity after 2000 caused the finance and
Subsistence farmingpredominates
Manufacturing is limited
Hydropower potential
Investment capital is scarce
Nepal 21
© The Economist Intelligence Unit Limited 2004 www.eiu.com Country Profile 2004
real-estate sector to become the largest component. Trade, restaurants andhotels made up 10.1% of GDP in 2002/03.
The principal structural problem is the extremely low rate of saving andinvestment. Gross fixed investment rose gradually in the early 1990s to peak at27.3% of GDP in 1995/96. Since then, however, it has declined, and in 2002/03 itaccounted for 26.1% of GDP. In 2002/03 the gross national savings rate fell to11.3%, down from the peak of 15.2% in 1999/2000. The total fiscal revenue/GDPratio stood at 12% in 2001/02, and the tax revenue/GDP ratio—which excludesnon-tax revenue such as administrative fees, sales receipts and rents—was 9.7%.The government plans to raise the revenue/GDP ratio to 13.2% in 2003/04.
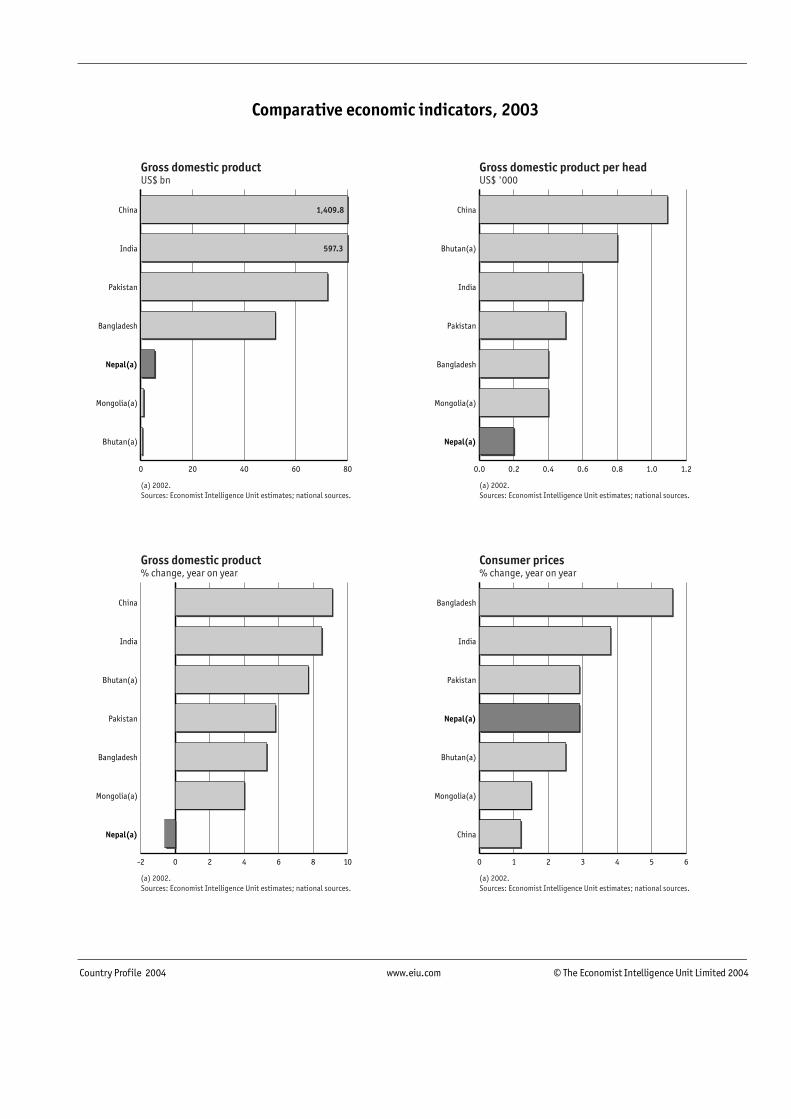
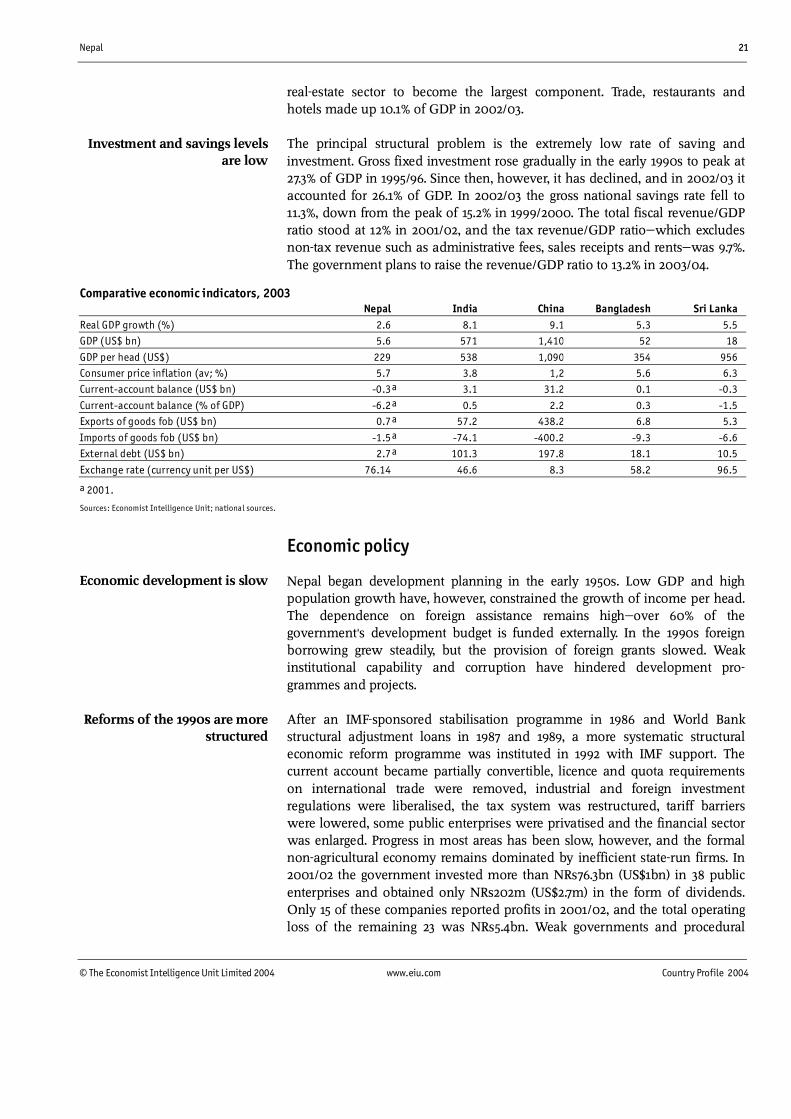
Comparative economic indicators, 2003Nepal India China Bangladesh Sri Lanka
Real GDP growth (%) 2.6 8.1 9.1 5.3 5.5GDP (US$ bn) 5.6 571 1,410 52 18
GDP per head (US$) 229 538 1,090 354 956Consumer price inflation (av; %) 5.7 3.8 1,2 5.6 6.3Current-account balance (US$ bn) -0.3a 3.1 31.2 0.1 -0.3
Current-account balance (% of GDP) -6.2a 0.5 2.2 0.3 -1.5Exports of goods fob (US$ bn) 0.7a 57.2 438.2 6.8 5.3
Imports of goods fob (US$ bn) -1.5a -74.1 -400.2 -9.3 -6.6External debt (US$ bn) 2.7a 101.3 197.8 18.1 10.5
Exchange rate (currency unit per US$) 76.14 46.6 8.3 58.2 96.5
a 2001.
Sources: Economist Intelligence Unit; national sources.
Economic policy
Nepal began development planning in the early 1950s. Low GDP and highpopulation growth have, however, constrained the growth of income per head.The dependence on foreign assistance remains high—over 60% of thegovernment's development budget is funded externally. In the 1990s foreignborrowing grew steadily, but the provision of foreign grants slowed. Weakinstitutional capability and corruption have hindered development pro-grammes and projects.
After an IMF-sponsored stabilisation programme in 1986 and World Bankstructural adjustment loans in 1987 and 1989, a more systematic structuraleconomic reform programme was instituted in 1992 with IMF support. Thecurrent account became partially convertible, licence and quota requirementson international trade were removed, industrial and foreign investmentregulations were liberalised, the tax system was restructured, tariff barrierswere lowered, some public enterprises were privatised and the financial sectorwas enlarged. Progress in most areas has been slow, however, and the formalnon-agricultural economy remains dominated by inefficient state-run firms. In2001/02 the government invested more than NRs76.3bn (US$1bn) in 38 publicenterprises and obtained only NRs202m (US$2.7m) in the form of dividends.Only 15 of these companies reported profits in 2001/02, and the total operatingloss of the remaining 23 was NRs5.4bn. Weak governments and procedural
Investment and savings levelsare low
Economic development is slow
Reforms of the 1990s are morestructured

22 Nepal
Country Profile 2004 www.eiu.com © The Economist Intelligence Unit Limited 2004
problems have been the main impediments to privatisation. The governmentbegan privatising public enterprises in 1992 and had privatised 23 publicenterprises by mid-July 2003. It plans to corporatise one of its largest operations,Nepal Telecom, in 2004 as a first step towards relinquishing control over thetelecommunications sector.
Government finances are in a mess, with budget deficits on a generally risingtrend financed mainly by foreign grants and loans. Virtually every governmenthas tried to buy votes with "pork barrel" spending schemes. In September 2001the Supreme Court prevented a scheme under which each parliamentariancould spend NRs1m (US$13,300) a year on projects of their choosing. The onlysignificant widening of the domestic tax base has been value-added tax (VAT),introduced in 1997 and fully implemented since August 1999. In April 2001 thegovernment began merging the VAT and tax departments to form the InlandRevenue Department, a process that was completed in July 2001.
Value-added tax collection(NRs bn)
Fiscal yeara Total VAT payers (no.)1998/99 7.9 9,0821999/2000 9.9 17,6282000/01 12.0 21,758
2001/02 12.0 n/a2002/03 13.4 n/a
a Ending July 15th.
Source: Inland Revenue Department.
Nepal's continued dependence on foreign aid, and the scant impact that aid hasproduced over the past quarter of a century, has raised the prospect of donorfatigue. Major donors, including Japan, the Asian Development Bank, the UNDevelopment Programme and the World Bank, have called for greateradministrative efficiency, accountability and transparency in the use of aid.Nepal's main donors—grouped in the Nepal Development Forum—met in thecapital, Kathmandu, in February 2002 and told the government that funds tosupport poverty reduction would be made available only if Nepal guaranteedeffective and corruption-free implementation. Nepal launched its tenth five-yearplan (which doubles as its poverty reduction strategy) in December 2002. Inmid-July 2002 it also began implementing the medium-term expenditureframework, a spending formula to make the allocation of funds more equitableby distributing funds to villages based upon poverty levels. The ImmediateAction Plan (IAP) introduced in early 2002 focused on public expendituremanagement, improving service delivery and strengthening anti-corruption andaccountability measures, and managed to complete almost all of the 19 tasksundertaken.
The implementation of the IAP and other signs that reforms were makingprogress prompted the World Bank to approve budgetary support of US$70m tothe government in late 2003. After lending almost nothing to Nepal for aboutthree years, in 2003 the World Bank also upgraded the lending programme toNepal from a "low case" programme to a "base case" programme, allowing the
Chronic budget deficits
Reliance on foreign aid

Nepal 23
© The Economist Intelligence Unit Limited 2004 www.eiu.com Country Profile 2004
country to borrow US$120m-200m every year. Nepal's main donors will meetagain in May 2004. Nepal is expected to lobby for additional programmatic andeven budgetary support.
Summary of government finances, 2002/03a
(NRs m)
Total revenue 63,622 Foreign grants 8,372 Other receipts 55,250Total expenditure 84,572 Current expenditure 56,556 Development expenditure 28,016Balance -20,950 Financed by foreign loans 8,950
a Revised official estimates.
Source: Ministry of Finance, Government budget, 2003/04.
Economic performance
Nepal's economic performance has been poor. GDP growth per year averaged5% between 1996/97 and 2000/01, short of the government's target of 6% peryear under the recently concluded ninth five-year plan for 1997/98-2001/02. In2001/02 the economy contracted by 0.3%. In the same fiscal year the agri-cultural sector, which accounts for about 40% of GDP, grew by 2.2%, whereasthe non-agricultural sector contracted by 2.1%. There was an improvement ineconomic performance in 2002/03, when GDP grew by 2.6%—agricultureexpanded by 2.3% and the non-agricultural sector by 2.7%. The governmentestimates that the number of people in absolute poverty had fallen to 38% ofthe population by 2001, from 42% in 1997, although the ninth plan had aimedto reduce the incidence of poverty to 32%. The government's objective in thetenth five-year plan is to reduce poverty to 30% by 2006/07 under the high GDPgrowth scenario, which envisages average GDP growth of 6.2% a year. Underthe low GDP growth projection, it hopes to bring down the incidence ofabsolute poverty to 33%.
Until 1990 average growth rates in the agricultural and non-agricultural sectorswere roughly comparable. Since then, however, agriculture has generally laggedwell behind. In the first four years of the ninth five-year plan the annualaverage rate of agricultural growth was 3.2% (compared with a target of 4.2%)and non-agricultural growth was 6.3% (against a target of 8%). Non-agriculturalgrowth after 2000/01 averaged around 1.5% a year, partly reflecting the impactof the armed conflict and factors affecting external trade, such as the disruptionof production for export to India.
Consumer price inflation averaged 4.3% in 1999-2003 (according to IMFcalendar-year data), after peaking at 17% in 1991 in response to shocks caused byliberalisation, food shortages caused by poor harvests, and high inflation ratesin India. The long-term drivers for Nepal's inflation are India's inflation rateand domestic liquidity. The latter has in the past been increased by deficitmonetisation. Consumer price inflation has been kept in single digits in recent
GDP growth remains sluggish
Agriculture lags behind
Inflation is low

24 Nepal
Country Profile 2004 www.eiu.com © The Economist Intelligence Unit Limited 2004
years, reflecting anaemic food and beverage price rises. Prices rose by 5.7%in 2003.
Wage data are scanty, although it is generally believed that wages have risenroughly in line with inflation. Similarly, there is little reliable information onurban unemployment. At end-2002 the government estimated that about 5% ofthe labour force of 9.9m was unemployed, a ratio that the government plans tobring down to 4.1% in 2007. The government estimates that the seasonal natureof agricultural work and the lack of alternative employment options mean that32% of the total labour force is "underemployed". The 2001 census showed that66% of the working population was engaged in agriculture, forestry andfisheries, down from 81% in 1991. The number of people employed by industryhad risen from 2% to 8.8%, and the number employed in the services sectorfrom 3.5% to 9.9%. Every year about 300,000 people enter the employmentmarket, although few new jobs are created. The 2001 census found that 762,181people were absent from their homes, most of them having headed for workabroad. Among them, 589,050 had gone to India and 123,285 were in SaudiArabia, Qatar, Kuwait, the UAE and Bahrain. Increasing numbers of Nepaleseare also heading to Malaysia, to work mainly as semi-skilled and unskilledlabourers.
The minimum agricultural daily wage is NRs70 (around 90 US cents), whichprovides a basis for determining the minimum for other sectors. The minimumdaily wage in industry is NRs74 for adults and NRs60 for workers under 18 yearsof age. Nepal prohibits the employment of children under the age of 14. Since1996 Nepal has had a labour court to deal with industrial disputes. In 2000 therewere 2,054 registered trade unions in Nepal, of which 1,759 were active.
Economic sectors
Agriculture
Around two-thirds of Nepal's economically active population work in agri-culture, which contributed 39% of GDP in fiscal year 2002/03 (ending July 15th).Agriculture suffers from several disadvantages: unpredictable weather, the poorperformance of irrigation projects, a dwindling rate of capital formation, and afeudal land tenure system characterised by concentrated ownership andexorbitant rates of rent. The land reform programme carried out in 1964redistributed 1.2% (32,000 ha) of agricultural land. On August 16th 2001 thegovernment announced its plan to implement another round of land reforms.Parliament passed new land ownership ceilings, but redistribution never reallytook off.
Non-subsistence agriculture is mainly practised in the Terai plains, but foodsurpluses there do not compensate for chronic food deficits in the mountainareas. The government imports foodgrains and other foods each year tosupplement supplies in over 30 districts, where there are donor-aidedprojects distributing food. The burgeoning population has extended
Constraints on agriculture
Underemployment is common
The minimum wage

Nepal 25
© The Economist Intelligence Unit Limited 2004 www.eiu.com Country Profile 2004
cultivation to marginal land and steep slopes, leading to deforestation, soilerosion and landslides.
Production of food crops—mainly rice (56% of total cereal output in 2002/03),maize (21%) and wheat (18%)—has grown at an annual average rate of 2.2% overthe past quarter of a century. Cash crops—principally sugarcane, potatoes,oilseeds, jute and tobacco—have fared better, recording annual averageproduction growth of 6.5% over the same period. The planted area, output andyield of jute, formerly the main cash crop, has declined since 1988. Sugarcaneand potatoes have recorded the most substantial gains in production andyields. Despite favourable terrain and climate, Nepal has failed to realise itspotential as a tea-growing nation.
Nepal began using chemical fertilisers in 1952, when it imported its first batchof ammonium sulphate. Most fertilisers that were used initially were heavilysubsidised. The government began removing fertiliser subsidies and liberalisedfertiliser imports in 1997, before removing the urea subsidy in 1999. However,the government continues to subsidise the transport of fertiliser and seeds toremote districts. Inorganic fertiliser use is low. Nepal does not produce fertiliser,and relies on imports. In February 2002 the government introduced a newfertiliser policy under which licences to import fertiliser were not necessary aslong as the chemical composition met specifications laid down by government.The policy also requires the government to hold 20% of the total amount ofchemical fertiliser needed as a buffer stock. In 2000/01 Nepal used 25.3 kg/ha ofnutrients on arable land. Despite the presence of numerous major riversystems, Nepal's crops are largely rain-fed.
Foodgrain production rose by 1.1% to 7.3m tonnes in 2001/02, despite a marginalreduction in the total cultivated area. The government estimated thatproduction increased marginally to 7.3m tonnes in 2002/03. Nepal has beenimplementing a 20-year Agriculture Perspective Plan since 1995, and aims by2015 to raise the annual growth rate of agricultural production to 5% and toincrease food availability per head from 270 kg to 426 kg.
Mining and semi-processing
Mining and quarrying accounted for 0.5% of GDP in 2002/03. The majorknown exploitable mineral reserves include lead, zinc, iron ore, limestone,marble, magnesite and oil. In general, however, known deposits are notconsidered commercially exploitable. Nepal has substantial cement-gradelimestone deposits in Baitadi, Udayapur, Syangja, Dhankuta, Surkhet andArgakhanchi districts. Three large factories produce about 1,950 tonnes ofcement per day from total limestone deposits of around 1,045m tonnes. Nepal'scement industry meets about 40% of total domestic demand. The governmentis studying proposals to tap natural gas in the Kathmandu valley. About 150,000tonnes of high-grade deposits of lead and 700,000 tonnes of zinc exist in theGanesh Himal region, but this is not thought to be commercially viable. Oilreserves are estimated to be between 300m and 700m barrels. The governmenthas been prospecting for petroleum in ten blocks in the plains since 1982, buthas had little success. A US-based oil company, Texana Resources, was awarded
Slow growth in grainproduction
Few mineral reserves

26 Nepal
Country Profile 2004 www.eiu.com © The Economist Intelligence Unit Limited 2004
two blocks for exploration in 1998, and some blocks are still available topotential investors for exploration bidding. Magnesite reserves at Kharidhungaare estimated at 212m tonnes, of which about 32m tonnes is of high grade.
Manufacturing
The manufacturing sector is constrained by the small domestic market, Indiancompetition, the impracticality of import restrictions along the open southernborder and the lack of sea access. A further hindrance to industrial develop-ment is the lack of infrastructure, skills and capital. Although governments havepursued a policy of planned industrialisation since the 1960s, in 2002/03manufacturing accounted for just 7.9% of GDP, down from about 9.2% in1998/99. Since 1991/92 successive governments have tried to encourage privateinvestment in industry, but the industrial sector has yet to attract large amountsof domestic investment (domestic capital is mainly invested in traditionalsources of wealth, such as land, gold and gems, as well as in the servicessector). India is the most important foreign investor, with over 100 jointventures in operation out of a total of 265 that have been approved.Manufacturing grew by just 2% in 2002/03.
Manufacturing firms tend to be small, and are concentrated in the Kathmanduvalley and the eastern Terai plains. Manufacturing activity is largelyconcentrated in three low value added sectors—food and beverages, tobaccoand textiles. The only sector generating significant export earnings is textiles(mostly readymade garments and woollen carpets), but even in this sectorearnings have begun to fall.
Construction
The construction industry is relatively underdeveloped, even though urbancentres have witnessed a surge in building construction in recent years. In2002/03 the sector contributed 10.4% of GDP. Despite high demands on theconstruction industry, domestic production of basic materials has beeninadequate. Laws governing the construction sector mainly focus on the publicrather than the private sector.
Financial services
The financial sector, although theoretically deregulated during the 1990s, is stillsubject to tight state control. The finance and real-estate sector made up 10.9%of GDP in 2002/03. The credit/deposit ratio of commercial banks averaged78.5% in 2001/02, and the average liquidity/deposit ratio was 40%. Nepal had 18insurance companies in 2001/02, which together collected NRs2.8bn (US$35.9m)in premiums, almost 67% of it for non-life insurance.
The government owns the Rastriya Banijya Bank (RBB, a commercial bank) andcontrols about 40% of another commercial bank, Nepal Bank (NBL). Thesebanks account for about 60% of all lending and roughly 50% of deposits in the
Building is constrained by alack of materials
Industrialisation has failed
Production in low value addedsectors
The state still plays a majorrole in banking

Nepal 27
© The Economist Intelligence Unit Limited 2004 www.eiu.com Country Profile 2004
banking system. In practice, therefore, credit remains a state monopoly. In July2003 Nepal had 17 commercial banks, 11 development banks, five ruraldevelopment banks and 57 finance companies. Nepal also had 34 co-operativesocieties providing some banking functions and six institutions offering micro-finance services.
Since 1984 foreign banks have been allowed to establish joint-venture banks,but majority ownership of the ventures was not permitted until 2001. In 2001the government decided to allow foreign banks to own up to two-thirds ofjoint ventures. The decision was aimed at convincing Nepal Indosuez Bank, asubsidiary of a French bank, Indosuez Bank, which set up a joint venture in1986, not to pull out. Nevertheless, in March 2002 Indosuez pulled out,and another joint venture—the Nepal Bank of Ceylon—was divested inSeptember 2002.
In July 2002 the government brought in the consulting division of the ICCBank (Ireland), a member of the Bank of Scotland group, as externalmanagement consultants to run the ailing and technically insolvent NBL.Reforms in the RBB were delayed after the accountancy consultants, DeloitteTouche Tohmatsu (DTT), declined to take up the job because of the securitysituation. On January 16th 2003 the government hired a US chief executive torestructure and reform the RBB. Reforming the two banks was a preconditionfor future borrowing from the World Bank and the IMF. According to theWorld Bank, in 1998 the two banks had a negative net worth of US$450m,equivalent to about 46% of the government budget or 8.6% of GDP. On March10th 2004 the World Bank approved a US$68.5m credit (and a US$7m grant) tohelp the government to continue with the banking reforms, and in particular tomeet the costs of paying off employees opting for voluntary retirement. Themoney followed up an earlier project for which the World Bank had providedUS$16m credit and the UK Department for International Development hadprovided US$10m as a grant. This money was used to pay the managementfees of the foreign consultants brought in to turn the NBL and the RBB around.
The performance of the Nepal Stock Exchange (NEPSE) since 1993 has been poor,because of weak management, the lack of a corporate culture, the poor financialperformance of listed companies (particularly manufacturing companies) andthe lack of understanding by companies of the share market. In 2002/03 only108 companies were listed on NEPSE, down from 115 in 2000/01, according tothe Securities Board of Nepal, while NEPSE's market capitalisation slid fromNRs46.3bn in 2000/01 to NRs35.2bn in 2002/03. Only the shares of financialinstitutions and a few well-performing manufacturing companies are traded.Listed category-A companies are required to have minimum paid-up capital ofNRs20m (US$260,000) and a minimum of 1,000 shareholders owning sharesworth NRs100 (US$1.30) or more.
Foreign joint-venture banksare permitted
A moribund stock exchange

28 Nepal
Country Profile 2004 www.eiu.com © The Economist Intelligence Unit Limited 2004
Other services
The tourism sector has suffered since December 1999, when an Indian Airlinesflight was hijacked after take-off from Kathmandu. Indian Airlines flights werethen suspended for five months. Tourist arrivals fell by about 6% in 2000.Tourism was hit further by a dispute between hotel workers and managementin late 2000, and by anti-Indian riots. The downward trend, especially inarrivals from India, continued in 2001-02 as visitors were deterred by themassacre of many members of the Nepalese royal family and the disintegrationof law and order. The September 11th 2001 terrorist attacks on the US led to afall in arrivals of US tourists, who normally make up about one-tenth all ofvisitors to Nepal. Total arrivals in 2002 fell by a further 25% from the 2001 levelto 270,600. Earnings in 2001/02 were roughly NRs7.8bn, down from NRs12.1bnin 1999/2000, and equivalent to about 16.4% of merchandise exports earnings.In 2000/01 foreign-currency earnings from tourism represented 1.9% of GDP,down from about 3.6% in 1999/2000. There was a slight (2.2%) improvement inarrivals from India in 2002, but fewer tourists arrived from the traditionalsource markets—the US, the UK and Japan. The drop in foreign tourist arrivalslargely reflected security concerns related to Maoist violence. In 2003 touristarrivals by air rose by 23% to 265,600, with sharp increases in arrivals fromboth India and other countries.
Nepal is also trying to attract Chinese tourists. The two countries signed anagreement in November 2001 that makes it possible for Chinese nationals tovisit Nepal, and in June 2002 Nepal and China signed a Bilateral SettlementAgreement allowing tourists to buy and sell the Chinese yuan at Nepalesecommercial banks. In 2003 arrivals from China grew strongly to more than4,000, from around 3,500 in 2002. Nevertheless, Nepal's hope to increasevisitor arrivals from China to more than 100,000 a year do not look likely to beachieved in the near future.
Tourism's declining relative importance as a foreign-exchange earner partlyreflects the growth in other sources of foreign exchange (mainly remittancesand foreign aid), but also reflects—aside from the dire domestic politicalsituation—structural constraints on the sector. Although there is hotelovercapacity in the capital, Kathmandu, and the other main tourist centre,Pokhara, overall the infrastructure is inadequate. Internal air capacity anddomestic transport services are limited, waste and water services in urban areasare poor and trekking routes are increasingly dilapidated. The Maoist conflicthas also deterred tourists. The Maoists have not targeted tourists with violence,but many have been forced to give "donations" when visiting remotedestinations or have had travel plans disrupted by the frequent general strikescalled by the rebels. The government recognises the importance of developingtourism to meet employment and foreign-exchange earning goals, and plans toextend trekking to remote areas to create employment opportunities for therural population and to improve the management of pollution in theKathmandu valley. Lack of investment capital is an obstacle. A major challengeis to achieve rapid tourism growth in mountain areas while minimising theenvironmental damage that high-intensity trekking can cause.
Tourism
Poor infrastructure
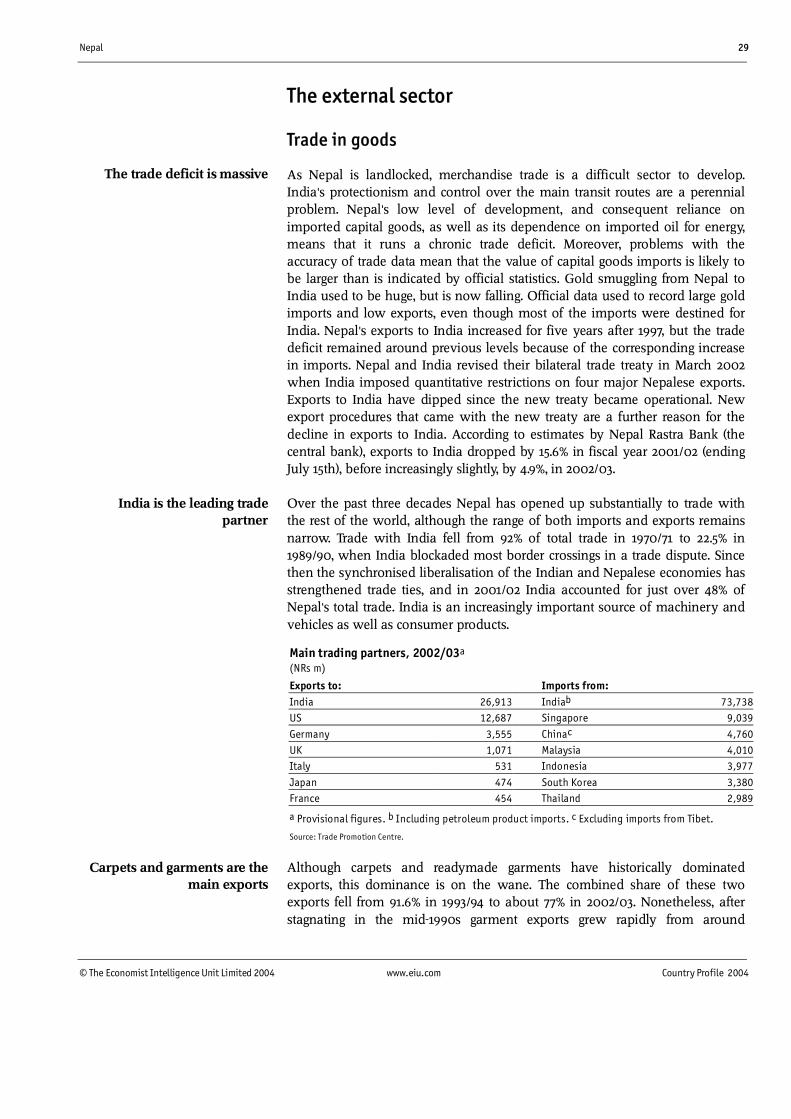
Nepal 29
© The Economist Intelligence Unit Limited 2004 www.eiu.com Country Profile 2004
The external sector
Trade in goods
As Nepal is landlocked, merchandise trade is a difficult sector to develop.India's protectionism and control over the main transit routes are a perennialproblem. Nepal's low level of development, and consequent reliance onimported capital goods, as well as its dependence on imported oil for energy,means that it runs a chronic trade deficit. Moreover, problems with theaccuracy of trade data mean that the value of capital goods imports is likely tobe larger than is indicated by official statistics. Gold smuggling from Nepal toIndia used to be huge, but is now falling. Official data used to record large goldimports and low exports, even though most of the imports were destined forIndia. Nepal's exports to India increased for five years after 1997, but the tradedeficit remained around previous levels because of the corresponding increasein imports. Nepal and India revised their bilateral trade treaty in March 2002when India imposed quantitative restrictions on four major Nepalese exports.Exports to India have dipped since the new treaty became operational. Newexport procedures that came with the new treaty are a further reason for thedecline in exports to India. According to estimates by Nepal Rastra Bank (thecentral bank), exports to India dropped by 15.6% in fiscal year 2001/02 (endingJuly 15th), before increasingly slightly, by 4.9%, in 2002/03.
Over the past three decades Nepal has opened up substantially to trade withthe rest of the world, although the range of both imports and exports remainsnarrow. Trade with India fell from 92% of total trade in 1970/71 to 22.5% in1989/90, when India blockaded most border crossings in a trade dispute. Sincethen the synchronised liberalisation of the Indian and Nepalese economies hasstrengthened trade ties, and in 2001/02 India accounted for just over 48% ofNepal's total trade. India is an increasingly important source of machinery andvehicles as well as consumer products.
Main trading partners, 2002/03a
(NRs m)
Exports to: Imports from:India 26,913 Indiab 73,738US 12,687 Singapore 9,039
Germany 3,555 Chinac 4,760UK 1,071 Malaysia 4,010Italy 531 Indonesia 3,977
Japan 474 South Korea 3,380France 454 Thailand 2,989
a Provisional figures. b Including petroleum product imports. c Excluding imports from Tibet.
Source: Trade Promotion Centre.
Although carpets and readymade garments have historically dominatedexports, this dominance is on the wane. The combined share of these twoexports fell from 91.6% in 1993/94 to about 77% in 2002/03. Nonetheless, afterstagnating in the mid-1990s garment exports grew rapidly from around
The trade deficit is massive
India is the leading tradepartner
Carpets and garments are themain exports

30 Nepal
Country Profile 2004 www.eiu.com © The Economist Intelligence Unit Limited 2004
NRs5.6bn (US$97m) in 1996/97 to NRs13.1bn in 2000/01. Garment exportearnings fell in 2000/01, mainly owing to the opening of the US market to poorAfrican countries, and fell by a further 40% to NRs7.8bn in 2001/02. The sale ofgarments recovered in 2002/03 to NRs11.6bn. In the 1990s carpet exportsaveraged about NRs8.5bn a year, rising to NRs9.8bn in 1999/2000. Salesdropped to NRs6. 1bn in 2001/02 and to NRs5.3bn in 2002/03.
Nepal's dependence on two products and a few markets makes its exportperformance extremely vulnerable to shifts in demand and tastes. In the 1980sand early 1990s Germany was the prime market for Nepal's carpets, but exportsto this market stagnated because of scandals over the use of child labour, thesaturation of the market and a fall in production standards. Similarly, thegarment industry is hostage to external factors. In the early 1990s the garmentindustry grew rapidly as Indian producers shifted production to Nepal to avoidthe Indian floor price system and to use US quotas for Nepal. Later in the 1990sIndia's removal of its floor price system and the Maoist insurgency reducedNepal's attractiveness. Nepal's garment exports nonetheless continued to rise aslocal entrepreneurs moved into the lucrative business of using up Nepal'sexport quotas to the US and the EU. Since 2001 the production of garments andcarpets has also been affected by the transport and production disruptionscaused by political unrest and general strikes.
Pashmina shawls were a significant export item from 1999/2000, worthNRs5.9bn that year and NRs6.8bn in 2000/01, but sales began to fall in late2001 because of oversupply, quality problems and changing fashion trendsabroad. Pashmina exports in 2001/02 fell to NRs1.3bn, dipping further toNRs1.1bn in 2002/03. In mid-July 2000, 1,022 registered pashmina factoriesemployed around 50,000 people, many of whom have since lost their jobs.
Nepal's hydrogenated vegetable oil exports to India almost doubled between1997/98 and 1998/99. However, they fell by 13.8% in 1999/2000, mainly becauseof growing opposition from Indian producers. Indian producers disrupted thesupply of the raw material, palm oil, to Nepalese producers at Indian ports andinstigated transport strikes in districts through which the palm oil travelled toNepal. As a compromise, the Nepalese government imposed an export servicecharge of 3%, and in early 2000 the Indian government placed a specialadditional duty of 4% on all imports, but this was removed later in the year.Indian raw material import duties are high, and Indian traders blamed the lowimport duties in Nepal for their inability to compete with Nepalese exports.Vegetable oil exports almost doubled in 2001/02 to NRs7bn, only to decline toNRs3.8bn in 2002/03, reflecting the impact of the new restrictions.
In March 2002 India agreed to extend the trade treaty between the twocountries only after Nepal agreed to an export ceiling of 100,000 tonnes onNepal's duty-free exports of vegetable oil. India also imposed quotas onNepalese exports of zinc oxide, acrylic yarn and copper wires. Trade with Indiahas also been disrupted by sales restrictions, or local taxes imposed by Indianstates, and by logistical problems arising from quality-control tests andquarantine certification.

Nepal 31
© The Economist Intelligence Unit Limited 2004 www.eiu.com Country Profile 2004
The major variable affecting Nepal's gold imports is India's policy towards theimport of the metal. When India restricted gold imports, smugglers used Nepalas a conduit for illegal imports, and the fluctuations in gold trade wereenormous. In 1996/97 Nepalese gold imports rose by 138% to NRs30.5bn; thefollowing year they fell by 47%. Gold imports fell to NRs5.8bn in 2000/01.Central bank estimates show that gold imports fell to NRs619m (US$7.9m) in2001/02, owing to a change in government policy in 1999/2000 to restrictNepal's own imports of gold as well as the liberalisation of imports in India.Gold imports dropped further in 2002/03, to NRs75m. Among regular imports,the major items are machinery, vehicles (including aircraft spares),manufactured goods, chemicals and drugs.
Invisibles and the current account
The invisibles surplus rose sharply during most of the 1990s. However, tourismreceipts, the main element of the service economy, did not account for thisincrease. Rather, it was the explosive growth in unspecified "other" services thatdrove the growth of the services surplus from NRs2.7bn in 1990/91 toNRs39.4bn in 1996/97. Since then receipts from "other" services have fallen,reflecting an improvement in the compilation of national accounts, and theoverall invisibles surplus has contracted accordingly. Thus, net services receiptswere NRs9.3bn in 2000/01, but only NRs3.9bn in 2001/02. The rebound toNRs7bn in 2002/03 reflects the recovery in the tourism sector.
Despite the strong services surplus and steadily rising net transfers—the result ofthe rising local-currency value of private remittances—the current account waspersistently in deficit in the 1990s, mainly because of the ballooning tradedeficit caused by a liberalised merchandise trade regime. According to the IMF,the current-account deficit more than doubled between 1992 and 1997 fromUS$181m to US$388m. This trend was reversed in 1998, when a reduced tradedeficit and an increase in transfers led to a current-account deficit of justUS$67m. The current-account balance has since widened, to US$257m in 1999,US$299m in 2000 and US$339m in 2001 (the latest year for which IMF current-account data are available).
The World Bank estimates that Nepal received US$400m in remittances fromoverseas workers in 2000/01. The Nepalese abroad have emerged as a majorsource of support for the Nepalese economy. According to central bank balance-of-payments data, workers' remittances grew from NRs47.2bn in 2000/01 toNRs54.2bn in 2002/03.
Capital flows and foreign debt
Despite current-account deficits, Nepal has generally recorded a positive overallbalance of payments, attributable almost entirely to foreign aid in the form ofgrants and concessional (low interest rate) loans from donor governments andmultilateral agencies. Foreign direct investment (FDI) is minimal, averaging justUS$14.7m a year in 1996-99 (national balance-of-payments data show FDI ofNRs961m in 2002/03). The balance of payments recorded a deficit of NRs3.3bn
Foreign aid supports thebalance of payments
India's gold policy
Income from services flattens
The current-accountdeficit widens

32 Nepal
Country Profile 2004 www.eiu.com © The Economist Intelligence Unit Limited 2004
in 2001/02 owing to the widening current-account deficit, but a surplus ofNRs4.3bn was achieved in 2002/03, thanks to higher inflows of workers'remittances.
Foreign aid has had a pervasive influence on Nepal's development. The firstfive-year plan, introduced in 1956, was financed entirely by foreign aid. Theshare of foreign aid in public-sector development expenditure fell to 45% in the1970s, but rose to 65% in the eighth five-year plan (1991/92 to 1996/97). It hasremained around 60% since. There was a surge in foreign assistance in the early1990s as donors sought to support Nepal's new democratic system. Latelydonors have publicly lamented the ineffectiveness of aid in alleviating Nepal'sstructural economic problems and have commented on the need to improvegovernance, but so far this has not led to a major decline in aid. Approvedforeign aid in 2001/02 totalled NRs33.2bn, of which NRs9.8bn was in the formof loans.
During the 1990s about 60% of aid was bilateral, coming mainly from Japan,Germany, the US, the UK and Denmark. India and China have also beensubstantial aid donors. The balance comes from multilateral agencies, mostly inthe form of concessional loans. The main multilateral lenders are the AsianDevelopment Bank and the World Bank. Donor countries and agenciesco-ordinate their aid policies at meetings of the Nepal Development Forum(NDF), which was established in 1976 and was originally called the Nepal AidGroup. The NDF, convened by the World Bank once every two years, includesdonors that together provide almost 90% of foreign aid. The NDF last met inNepal in February 2002, when donors stressed the need for more effective useof aid. As promised to the donors, Nepal has prepared a poverty reductionstrategy and has also pushed thr0ugh financial sector reforms, enacting a newcentral bank law to oversee financial institutions.
The increasing use of foreign loans to finance the government's budget deficitraised the external debt burden dramatically between the mid-1970s and themid-1990s. According to the World Bank, the ratio of external debt to grossnational income rose from 10.4% in 1980 to 57.2% at the end of 1999, althoughthe ratio fell to 46.7% at the end of 2001. Nepal has plans for more infrastructureinvestment, which could increase its external debt further.
Foreign reserves and the exchange rate
Foreign-exchange reserves, minimal until the late 1980s, increased afterstructural adjustment loans from the World Bank began in 1986/87. Foreign aidhas helped to offset the chronic current-account deficit and has enabled Nepalto increase its reserves (excluding gold) from US$571.3m in 1996 to US$1.2bn in2003. Remittances from Nepalese nationals working abroad have also servedto boost reserves.
The US dollar and the Indian rupee are the two main currencies used inNepal's trade transactions. Since 1983 the Nepalese rupee has been tied, inprinciple, to a trade-weighted basket of currencies, with the US dollar as the
Sound foreign-exchangereserves
A de facto peg to theIndian rupee
Bilateral and multilateral aid
High external debt

Nepal 33
© The Economist Intelligence Unit Limited 2004 www.eiu.com Country Profile 2004
intervention currency. In practice, however, the exchange rate is pegged to theIndian rupee—a reflection of the high degree of integration between the Indianand Nepalese economies. Since 1993 the exchange rate against the Indian rupeehas remained constant at NRs1.60:Rs1. In the 1990s the exchange rate againstthe US dollar gradually depreciated in line with the fall of the Indian rupee. Aperiod of volatility followed the deterioration in external sentiment towardsIndia following India's nuclear tests in 1998, causing the Nepalese rupee to fallfrom an annual average of NRs58:US$1 in 1997 to NRs77.9:US$1 in 2002. In2002-03 the Nepalese rupee tracked the Indian rupee, appreciating against theweak US dollar. The Nepalese rupee stood at NRs70.5:US$1 on April 23rd 2004.

34 Nepal
Country Profile 2004 www.eiu.com © The Economist Intelligence Unit Limited 2004
Appendices
Sources of information
Economic data on Nepal have improved in recent years, but still lack fullcredibility. Data provided by Nepal Rastra Bank (the central bank) areconsidered the most accurate. The Ministry of Finance's annual EconomicSurvey provides the fullest range of official data. The Central Bureau of Statisticspublishes a Statistical Year Book of Nepal, which gives information not includedin the Economic Survey. In alternate years it publishes the Statistical Pocket Book.
Other national statistical sources include the following.
Central Bureau of Statistics, National Accounts of Nepal 2003
Central Bureau of Statistics, Population Census 2001
Central Bureau of Statistics, Statistical Year Book of Nepal 2003
Central Bureau of Statistics and International Centre for Integrated MountainDevelopment, Mapping Census Indicators 2001& Trends
Central Bureau of Statistics and the UN Children's Fund (UNICEF), BetweenCensus Household Information, Monitoring and Evaluation System (report) March-May 2000
Gorkhapatra (official daily), Kathmandu
Himal Khabarpatrika (fortnightly), Kathmandu
Nepal (fortnightly), Kathmandu
Ministry of Finance, Budget Speech (annual)
Ministry of Tourism and Culture, Summary of Tourism Statistics (annual)
National Planning Commission, Five Year Plan, various years
Nepal Rastra Bank, Economic Report (annual)
Nepal Rastra Bank, Main Economic Indicators (monthly)
Nepal Anti-Tuberculosis Association, Souvenir, 22nd International UnionAgainst Tuberculosis and Lung Disease Eastern Region Conference, September22nd-25th 2003
The Kathmandu Post (daily newspaper)
Asian Development Bank, Country Report on Nepal (annual), Manila
Asian Development Bank, Key Indicators of Developing Asian and PacificCountries (annual), Manila
IMF, Nepal: Recent Economic Developments, Washington DC, October 2001
IMF, Nepal: 2003 Article IV Consultation, Washington DC, September 2003
UN Development Programme, Human Development Report 2003, New York
National statistical sources
International statistical sources

Nepal 35
© The Economist Intelligence Unit Limited 2004 www.eiu.com Country Profile 2004
World Bank, Economic Update 2002, Kathmandu, February 2002
World Bank, Nepal: Poverty and Incomes, Washington DC, 1991
World Bank, Nepal: Country Assistance Strategy, 2004-07, Kathmandu, 2003
N Manandhar, Labour Relations Problems and Issues in Nepal, the IndustrialRelations Forum, a project funded by the Friedrich Naumann Foundation,Germany, July 2001
Asian Development Bank, Nepal page, with links to Key Indicators andeconomic reports: www.adb.org/Nepal
Election Commission: www.election-commission.org.np
Info-Nepal, a general directory on Nepal: www.info-nepal.com
National Planning Commission (Nepali and English): npc.gov.np
Nepal Rastra Bank (the central bank): www.nrb.org.np
Nepali Times, an English-language daily: www.nepalitimes.com
Trade Promotion Centre, with some trade statistics: www.tpcnepal.org.np
World Bank, Nepal page: lnweb18.worldbank.org/sar/sa.nsf/Nepal
Reference tables
These reference tables provide the most up-to-date statistics available at the time ofpublication.
Population1998 1999 2000 2001 2002
Mid-year estimates (m) 22.5 23.0 23.5 24.1 24.6 % change, year on year 2.3 2.3 2.3 2.3 2.3
Source: IMF, International Financial Statistics.
Energy consumptiona
('000 tonnes oil equivalent)
1998/99 1999/2000 2000/01 2001/02 2002/03b
Traditional 6,458 6,473 6,824 6,996 7,130 Firewood 5,769 6,023 6,068 6,217 6,337 Agri-waste 259 272 299 308 314 Animal dung 430 448 457 471 479
Commercial 892 1,044 1,095 c 1,208c 1,286c
Coal 174 236 246 290 314 Petroleum 635 709 734 758 800 Electricity 83 99 108 121 129
a Fiscal years July 16th-July 15th. b Provisional. c Do not sum in source.
Source: Ministry of Finance, Economic Survey.
Select bibliography andwebsites

36 Nepal
Country Profile 2004 www.eiu.com © The Economist Intelligence Unit Limited 2004
Government financesa
(NRs m)
1998/99 1999/2000 2000/01 2001/02 2002/03 b
Total revenue 41,588 48,606 55,647 57,132 63,622 Foreign grants 4,337 5,712 6,753 6,686 8,372 Other receipts 37,251 42,894 48,894 50,446 55,250Total expenditure 59,579 66,273 79,835 80,072 84,572 Current expenditure 31,048 34,523 42,769 48,590 56,556 Development expenditure 28,531 31,749 37,066 31,482 28,016Fiscal balance -17,991 -17,667 -24,188 -22,941 -20,950Financed by:Foreign loans 11,852 11,812 12,044 7,699 8,950Domestic borrowings 4,710 5,500 7,000 8,000 12,000 Banking system 2,850 3,300 n/a n/a n/a Non-banking system 1,860 2,200 n/a n/a n/aCash balance (- indicates surplus) 1,429 355 5,144 7,242 0
a Fiscal years July 16th-July 15th. b Government estimates.
Sources: Ministry of Finance, Economic Survey; budget speeches.
Gross domestic product at factor cost1998/1999 1999/00 2000/01 2001/02 2002/03
NRs mAt current prices 330,018 366,261 393,556 405,575 434,294At constant (1994/95) prices 251,758 267,096 279,750 278,774 286,073 % change, year on year 4.5 6.1 4.7 -0.3 2.6
Per head (NRs)At current prices 14,693 15,938 16,733 16,857 17,647At constant (1994/95) prices 11,209 11,623 11,894 11,587 11,624 % change, year on year 2.1 3.7 2.3 -2.6 0.3
Sources: Ministry of Finance, Economic Survey; IMF, International Financial Statistics.
Gross domestic product by expenditure(NRs m unless otherwise indicated)
1999 2000 2001 2002 2003Private consumption 264,944 287,947 309,107 329,199 348,780
Government consumption 30,529 34,579 40,973 42,327 46,805Gross fixed capital formation 65,269 73,314 78,017 81,260 85,506
Change in stocks 4,792 18,376 21,679 22,356 30,760Exports of goods & services 78,150 88,360 91,821 67,722 65,243Imports of goods & services -101,648 -123,055 -131,403 -121,531 -130,917
GDP 342,036 379,521 410,194 421,333 446,177
Source: IMF, International Financial Statistics.

Nepal 37
© The Economist Intelligence Unit Limited 2004 www.eiu.com Country Profile 2004
Gross domestic product by sectora
(NRs m at current prices; % of total in brackets)
1998/99 1999/2000 2000/01 2001/02 2002/03Agriculture 132,373 145,131 151,059 160,144 170,073
(40.1) (39.6) (38.4) (39.5) (39.2)
Mining & quarrying 1,685 1,851 1,924 2,056 2,188(0.5) (0.5) (0.5) (0.5) (0.5)
Manufacturing 30,337 33,550 35,495 32,805 34,337(9.2) (9.2) (9.0) (8.1) (7.9)
Electricity, gas & water 4,574 5,942 7,004 8,206 9,345(1.4) (1.6) (1.8) (2.0) (2.2)
Construction 33,262 37,382 39,584 42,290 45,014(10.1) (10.2) (10.1) (10.4) (10.4)
Trade, restaurants & hotels 39,313 42,895 44,572 40,772 44,046(11.9) (11.7) (11.3) (10.1) (10.1)
Transport, communications & storage 24,631 29,336 33,297 34,652 38,030(7.5) (8.0) (8.5) (8.5) (8.8)
Finance & real estate 33,203 36,919 41,634 43,882 47,553(10.1) (10.1) (10.6) (10.8) (10.9)
Community & social services 30,582 33,281 38,997 40,768 43,708(9.3) (9.1) (9.9) (10.1) (10.1)
GDP at factor costb 330,018 366,261 393,566 405,575 434,294
a Fiscal years July 16th-July 15th. b Before deducting imputed value of bank charges.
Source: Ministry of Finance, Economic Survey.
Consumer prices, national data(1995/96=100 unless otherwise indicated; period averages)
1998/99 1999/2000 2000/01 2001/02 2002/03Food & beverages 135.5 136.1 133.0 137.9 n/a % change 16.2 0.4 -2.3 3.7 4.4
Non-food items & services 124.6 133.4 144.2 147.2 n/a % change 5.8 7.1 8.1 2.1 5.0All items 130.4 134.9 138.1 142.1 n/a % change 11.4 3.5 2.4 2.9 4.8
Source: Nepal Rastra Bank, Economic Report 2001/02.
Consumer prices, IMF data(1995=100 unless otherwise indicated; period averages)
1999 2000 2001 2002 2003Consumer price index 135.8 139.2 142.9 147.2 155.6 % change 7.4 2.5 2.7 3.0 5.7
Source: IMF, International Financial Statistics.

38 Nepal
Country Profile 2004 www.eiu.com © The Economist Intelligence Unit Limited 2004
Money supply and interest rates(NRs m unless otherwise indicated)
1999 2000 2001 2002 2003Money (M1) 55,107 63,028 n/a n/a n/aQuasi-money 109,521 132,550 145,946 152,019 171,641
Money supply (M2) 164,628 195,578 n/a n/a n/a % change 21.6 18.8 n/a n/a n/aDiscount rate (end-period; %) 9.0 7.5 6.5 5.5 5.5
Treasury-bill rate (%) 4.30 5.30 5.00 3.80 3.85Lending rate (%) 11.33 9.46 7.67 n/a n/a
Government bond yield (%) 8.75 8.50 8.50 8.25 7.50
Source: IMF, International Financial Statistics.
Production index of manufacturing industriesa
(1986/87=100 unless otherwise indicated; % change year on year in brackets)
Weight (%) 1998/99 1999/2000 2000/01 2001/02 2002/03 b
Food manufacturing 19.3 856.4 896.7 957.1 996.1 777.6(25.1) (4.7) (6.7) (4.1) (-21.9)
Beverage industries 3.9 271.7 305.7 316.7 304.9 322.1 (5.6) (12.5) (3.6) (-3.7) (5.6)
Tobacco manufacturing 20.1 126.1 111.8 118.3 116.2 126.2(-7.8) (-11.3) (5.8) (-1.8) (8.6)
Textiles 18.1 158.2 160.7 164.6 163.9 188.8(-5.1) (1.6) (2.4) (-0.4) (15.2)
Leather & leather products 2.3 79.2 24.2 28.0 25.6 27.9(-13.4) (-69.4) (15.7) (-8.6) (9.0)
Footwear 0.4 500.0 537.2 586.0 614.8 624.8(10.0) (7.4) (9.0) (4.9) (1.6)
Wood & wood products 2.0 19.7 41.6 45.0 45.9 29.8(8.0) (111.2) (8.2) (2.0) (-35.0)
Paper & paper products 0.9 714.6 1,471.4 1,515.5 1,505.7 1,579.5(22.8) (106.0) (3.0) (-0.6) (4.9)
Chemicals 6.1 279.6 316.8 337.8 342.0 379.7(5.5) (13.3) (6.6) (1.2) (11.0)
Rubber products 0.7 131.6 113.7 111.4 115.8 102.6(8.9) (-13.6) (-2.0) (3.9) (-11.4)
Plastic products 1.3 201.7 117.2 119.5 121.9 143.5(5.4) (-41.9) (2.0) (2.0) (17.7)
Non-metallic mineral products 16.9 95.9 104.2 108.1 113.5 146.4(9.6) (8.7) (3.7) (5.0) (28.9)
Iron & steel 3.1 308.7 380.2 393.5 405.2 474.5(16.8) (23.2) (3.5) (3.0) (17.1)
Cutlery & hand tools 3.2 18.4 12.2 12.4 12.8 14.5(-16.7) (-33.7) (1.6) (3.2) (13.2)
Electrical & industrial machinery 1.9 207.4 273.1 294.5 304.3 317.6(-1.0) (31.7) (9.8) (3.3) (4.4)
Overall index 100.0 290.7 308.6 328.0 344.5 310.4(13.8) (6.2) (6.3) (5.0) (-9.8)
a Fiscal years July 16th-July 15th. b Provisional.
Source: Ministry of Finance, Economic Survey.

Nepal 39
© The Economist Intelligence Unit Limited 2004 www.eiu.com Country Profile 2004
Tourism1998 1999 2000 2001 2002
Arrivals by land ('000) 65.7 70.3 86.7 66.8 53.9Arrivals by air ('000) 398.0 421.2 376.9 299.5 216.7
Tourist arrivals ('000) 463.7 491.5 463.6 361.2 270.6 % change 9.9 6.0 -5.7 -22.0 -25.1Average length of stay (days) 10.8 12.8 11.8 11.9 11.9
Tourist expenditure (NRs m)a 9,882 12,168 12,074 11,717 7,799
a Fiscal years July 16th-July 15th.
Source: Ministry of Finance, Economic Survey.
Foreign tradea
(NRs m; current prices)
1998/99 1999/2000 2000/01 2001/02 2002/03Exports 35,676.3 49,822.7 55,654.1 46,944.8 49,245.5 Food & live animals 3,724.5 4,240.4 4,776.6 5,411.0 n/a Tobacco & beverages 50.0 117.2 75.6 160.5 n/a Raw materials & inedible oils 469.9 561.3 751.1 944.3 n/a Mineral fuels & lubricants 0.5 2.2 1.3 0.9 n/a Animal & vegetable oils & fats 3,597.2 3,229.7 4,101.7 7,477.8 n/a Chemicals & drugs 2,804.0 3,933.2 4,041.7 3,228.6 n/a Manufactured goods classified by materials 13,539.6 15,838.7 18,909.3 17,336.6 n/a Machinery & transport equipment 97.8 390.8 343.6 364.4 n/a Miscellaneous manufactured articles 11,392.8 21,509.2 22,650.9 12,616.3 n/aImports 87,525.3 108,504.9 115,687.2 107,389.0 125,853.5 Food & live animals 7,619.5 10,839.0 5,994.4 7,054.0 n/a Tobacco & beverages 846.1 906.5 906.1 848.4 n/a Raw materials & inedible oils 6,246.7 7,012.4 7,559.6 6,890.6 n/a Mineral fuels & lubricants 8,737.5 9,097.9 11,269.2 15,231.3 n/a Animal & vegetable oils & fats 3,329.0 4,446.0 5,589.2 7,887.5 n/a Chemicals & drugs 12,476.4 14,474.2 12,941.9 12,505.0 n/a Manufactured goods classified by materials 25,638.0 34,420.0 41,188.0 32,618.5 n/a Machinery & transport equipment 18,063.7 20,547.9 23,027.8 18,835.2 n/a Miscellaneous manufactured articles 4,302.4 6,682.8 7,210.2 4,798.7 n/a
a Fiscal years July 16th-July 15th.
Source: Ministry of Finance, Economic Survey.

40 Nepal
Country Profile 2004 www.eiu.com © The Economist Intelligence Unit Limited 2004
Balance of payments, IMF series(US$ m)
1997 1998 1999 2000 2001Goods: exports fob 413.8 482.0 612.3 776.1 720.5Goods: imports fob -1,691.9 -1,239.1 -1,494.2 -1,590.1 -1,485.70
Trade balance -1,278.1 -757.1 -881.9 -814.0 -765.2Services: credit 865.7 565.1 655.1 505.9 413.3Services: debit -224.5 -196.2 -212.5 -199.9 -214.7
Income: credit 31.9 45.4 55.8 72.2 70.3Income: debit -28.6 -26.5 -28.4 -35.2 -58.8
Current transfers: credit 267.4 326.0 182.3 189.0 240.2Current transfers: debit -21.8 -24.1 -26.9 -16.7 -24.3Current-account balance -388.1 -67.2 -256.5 -298.7 -339.3Direct investment abroad n/a n/a n/a n/a n/aDirect investment in Nepal 23.1 12.0 n/a n/a n/a
Portfolio investment assets n/a n/a n/a n/a n/aPortfolio investment liabilities n/a n/a n/a n/a n/a
Other investment assets 89.4 90.8 48.2 128.6 11.2Other investment liabilities 227.8 110.0 -72.8 -52.6 -228Financial balance 340.3 212.9 -24.5 76.1 216.9Capital-account balance n/a n/a n/a n/a n/aNet errors & omissions 216.6 134.0 58.3 145.7 256.5
Overall balance 168.8 279.7 -222.7 -77.0 -299.6Memorandum itemTotal change in reserve assets (- indicates inflow) -168.8 -279.7 222.7 77.0 299.6
Source: IMF, International Financial Statistics.
External debt, World Bank series(US$ m unless otherwise indicated)
1997 1998 1999 2000 2001a
Total external debt 2,390 2,646 2,970 2,823 2,700 Long-term debtb 2,332 2,591 2,910 2,784 2,643 Short-term debt 28 31 43 26 50 Use of IMF credit 30 24 18 12 8Public & publicly guaranteed long-term debt 2,332 2,591 2,910 2,784 2,643 Official creditors 2,285 2,555 2,891 2,779 2,638 Multilateral 1,989 2,233 2,541 2,458 2,359 Bilateral 296 322 350 321 279 Private creditors 41 29 13 5 5 Commercial banks 0 0 0 0 0 Other private 47 29 13 5 5
Total debt service 98 88 107 100 89 Principal 63 54 69 66 59 Interest 26 26 30 27 25 Short-term debt 1 2 2 2 1Ratios (%)Total external debt/GNI 47.8 53.5 57.2 49.8 46.7Debt-service ratioc 5.6 5.7 7.3 5.6 4.9Short-term debt/total external debt 1.2 1.2 1.4 0.9 1.8Concessional long-term loans/long-term debt 95.8 96.7 97.5 98.4 97.7
a Figures may not add up due to rounding. b Original maturity of more than one year. c Debt service as a percentage of exports of goods andservices.
Source: World Bank, Global Development Finance.

Nepal 41
© The Economist Intelligence Unit Limited 2004 www.eiu.com Country Profile 2004
Foreign reserves(US$ m unless otherwise indicated)
1999 2000 2001 2002 2003SDRs 0.3 - 0.1 - 0.8
Reserve position at the IMF 7.9 7.5 7.2 7.8 8.6Foreign exchange 836.9 937.9 1,030.4 1,009.8 1,213.1
Total reserves excl gold 845.1 945.4 1,037.7 1,017.6 1,222.5Gold (m troy oz) 0.2 0.2 0.2 0.2 0.2Gold (national valuation) 6.5 6.5 6.5 6.5 6.5
Total reserves incl gold 851.6 951.9 1,044.2 1,024.1 1,229.0
Source: IMF, International Financial Statistics.
Exchange rates1999 2000 2001 2002 2003
NRs:US$ (end-period) 68.73 74.30 76.48 78.30 74.04
NRs:US$ (av) 68.24 71.10 74.95 77.88 76.14NRs:Rs 1.60 1.60 1.60 1.60 1.60
NRs:SDR 94.33 96.80 96.11 106.45 110.02
Source: IMF, International Financial Statistics.
Editors: David Webb (editor); Graham Richardson (consulting editor)Editorial closing date: April 23rd 2004
All queries: Tel: (44.20) 7830 1007 E-mail: [email protected]