netwealth portfolio construction series - why are etfs gaining in popularity and how they can be...
TRANSCRIPT
Netwealth educational webinar series
September 2016
How you canuse ETFs to improveinvestment returns

Housekeeping
• Enter your questions in the question boxWe will get to them during at the end of the webinar.
• This webinar is being recordedSlides will be sent to you after the webinar.
• Posting to social? Make sure to use #netwealthinvest or tweet @netwealthInvest.
Disclaimer
This webinar and information has been prepared and issued by NetwealthInvestments Limited (Netwealth), ABN 85 090 569 109, AFSL 230975. It contains factual information and general financial product advice only and has been prepared without taking into account the objectives, financial situation or needs of any individual. The information provided is not intended to be a substitute for professional financial product advice and you should determine its appropriateness having regard to you or your client’s particular circumstances. The relevant disclosure document should be obtained from Netwealth and considered before deciding whether to acquire, dispose of, or to continue to hold, an investment in any Netwealth product.
While all care has been taken in the preparation of this document (using sources believed to be reliable and accurate), no person, including Netwealth, or any other member of the Netwealth group of companies, accepts responsibility for any loss suffered by any person arising from reliance on this information.
Meet today’s speaker
Vinnie WadheraDirector of Institutional Business & National Accounts BetaShares

Join the ETF revolutionHow exchange traded funds are changing the way we invest
DisclaimerThe information contained in this document is general information only and does not constitute personal financial advice. It does not take into account any person’s financial objectives, situation or needs. It has been prepared with all reasonable care by BetaShares Capital Limited (ABN 78 139 566 868, Australian Financial Services Licence No. 341181) (“BetaShares”). The information is provided for information purposes only and should not be construed as an offer or solicitation. BetaShares assumes no responsibilities for errors, inaccuracies or omissions in this document. Performance and statistical results noted are unaudited. Past performance is not indicative of future performance. Investments in BetaShares Funds are subject to investment risk and investors may not get back the full amount originally invested. Any person wishing to invest in BetaShares Funds should obtain a copy of the relevant PDS from www.betashares.com.au and obtain financial advice in light of their individual circumstances.
6

1. About BetaShares2. What are ETFs / growth story3. Applications of ETFs in Portfolios
– Index/price– Strategy or outcomes based
Contents
7Confidential – may not be distributed without the consent of BetaShares Capital
About BetaShares• A leading manager of fund products that are traded on the Australian Securities
Exchange
• Objective is to expand the universe of investment possibilities open to investors• Provide Funds that empower investors to implement investment strategies with
ease • Products designed with the interests of Australian investors in mind
• A member of the Mirae Asset Global Investment Group, one of the largest asset management firms in Asia.
• Mirae currently manage approx. US$90b
8Confidential – may not be distributed without the consent of BetaShares Capital

BetaShares: Where are we now? • Consistently #1 exchange traded fund
manager in Australia for value traded
• #2 issuer for inflows during 2016 with
40% share of market inflows to April
‘16
• ~$2.9B AUM
• One of the largest dedicated teams in
Australia$0
$500
$1,000
$1,500
$2,000
$2,500
$3,000
Dec-10 May-11 Oct-11 Mar-12 Aug-12 Jan-13 Jun-13 Nov-13 Apr-14 Sep-14 Feb-15 Jul-15 Dec-15 May-16
9Confidential – may not be distributed without the consent of BetaShares Capital
1. About BetaShares2. What are ETFs / growth story3. Applications of ETFs in Portfolios
– Index/price– Strategy or outcomes based
Contents
10Confidential – may not be distributed without the consent of BetaShares Capital
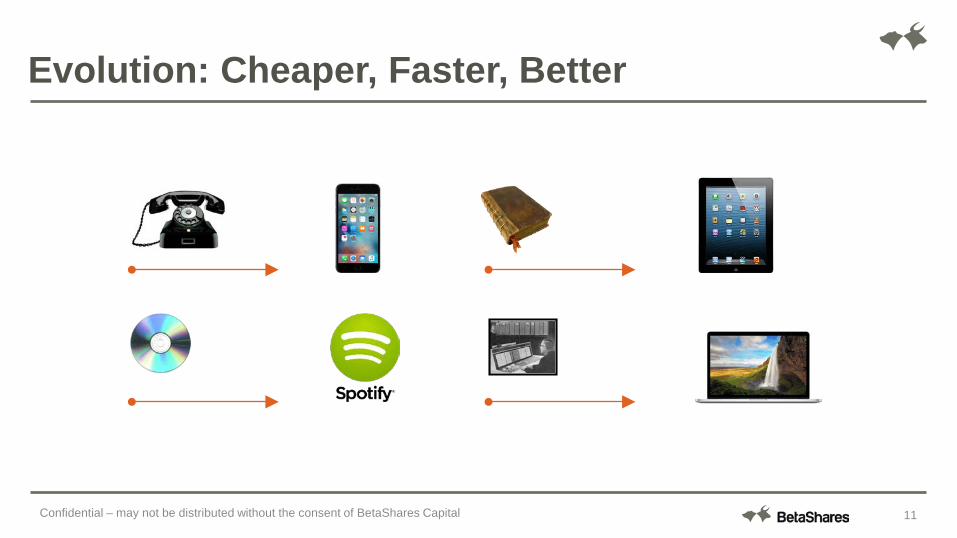
Evolution: Cheaper, Faster, Better
11Confidential – may not be distributed without the consent of BetaShares Capital
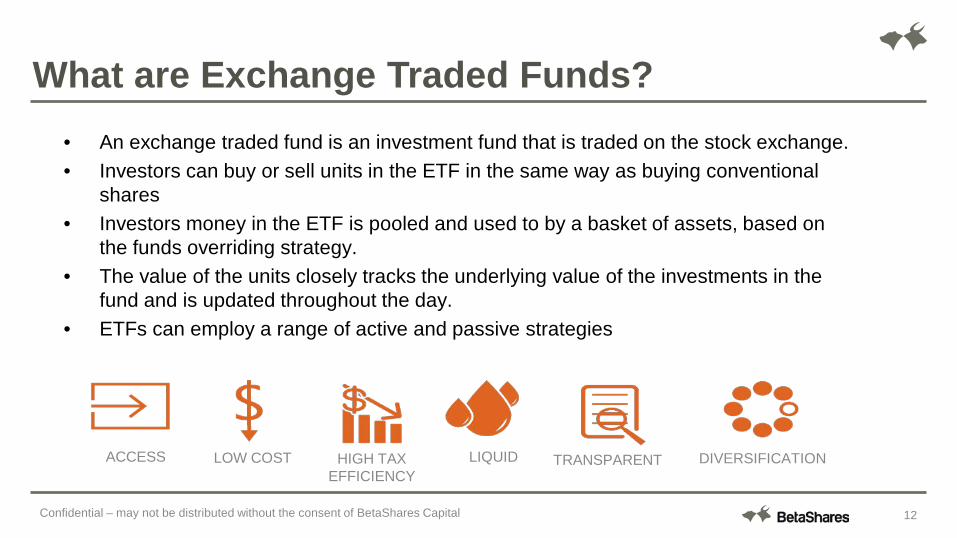
What are Exchange Traded Funds?• An exchange traded fund is an investment fund that is traded on the stock exchange.• Investors can buy or sell units in the ETF in the same way as buying conventional
shares• Investors money in the ETF is pooled and used to by a basket of assets, based on
the funds overriding strategy.• The value of the units closely tracks the underlying value of the investments in the
fund and is updated throughout the day.• ETFs can employ a range of active and passive strategies
LOW COST HIGH TAX EFFICIENCY
TRANSPARENTACCESS LIQUID DIVERSIFICATION
12Confidential – may not be distributed without the consent of BetaShares Capital

Global Growth of the ETF Industry
$428$598
$851 $772
$1,156
$1,483 $1,525
$1,944
$2,396
$2,797$2,959
$0
$500
$1,000
$1,500
$2,000
$2,500
$3,000
$3,500
2005 2006 2007 2008 2009 2010 2011 2012 2013 2014 2015
Global ETF Industry AUM(1)
(US$b)
ETF Products (#) 525 884 1,542 2,211 2,683 3,526 4,221
05 – 15 CAGR 21%
5,0244,221 5,431 5,449
Source: Blackrock
13Confidential – may not be distributed without the consent of BetaShares Capital
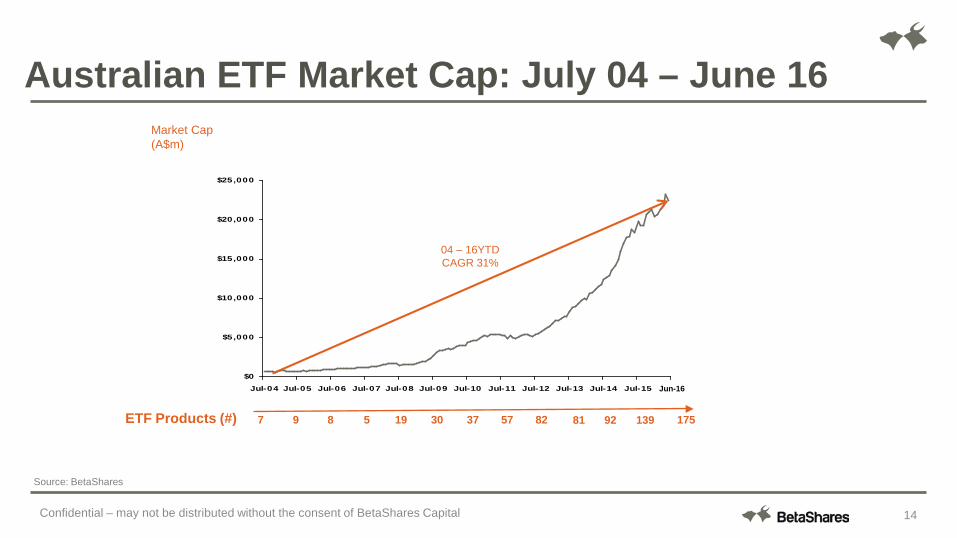
Australian ETF Market Cap: July 04 – June 16
$0
$5,000
$10,000
$15,000
$20,000
$25,000
Jul-04 Jul-05 Jul-06 Jul-07 Jul-08 Jul-09 Jul-10 Jul-11 Jul-12 Jul-13 Jul-14 Jul-15
Market Cap(A$m)
04 – 16YTD CAGR 31%
7 9 8 5 19 30 37 57 82 81 17592
Jun-16
139ETF Products (#)
Source: BetaShares
14Confidential – may not be distributed without the consent of BetaShares Capital
Confidential – may not be distributed without the consent of BetaShares Capital 15
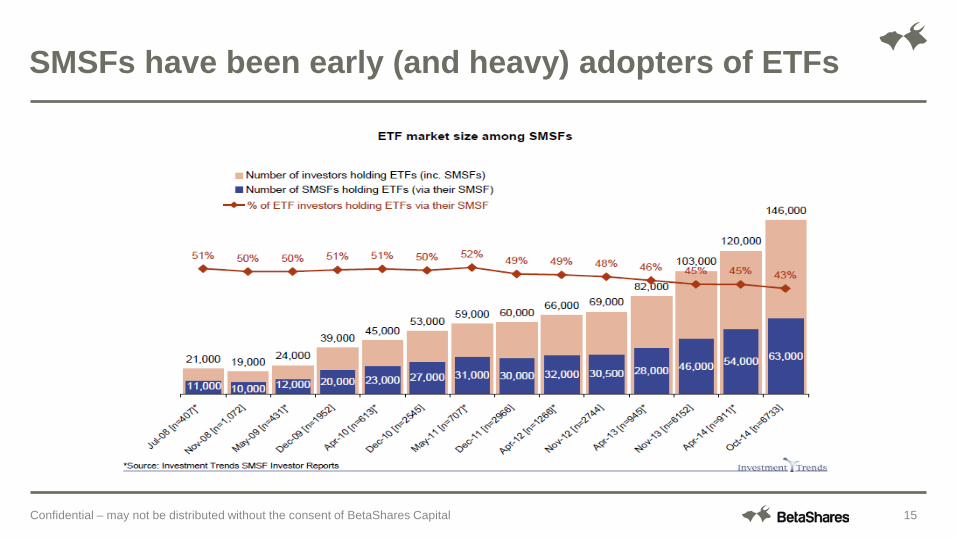
SMSFs have been early (and heavy) adopters of ETFs
Confidential – may not be distributed without the consent of BetaShares C a p ita l 16
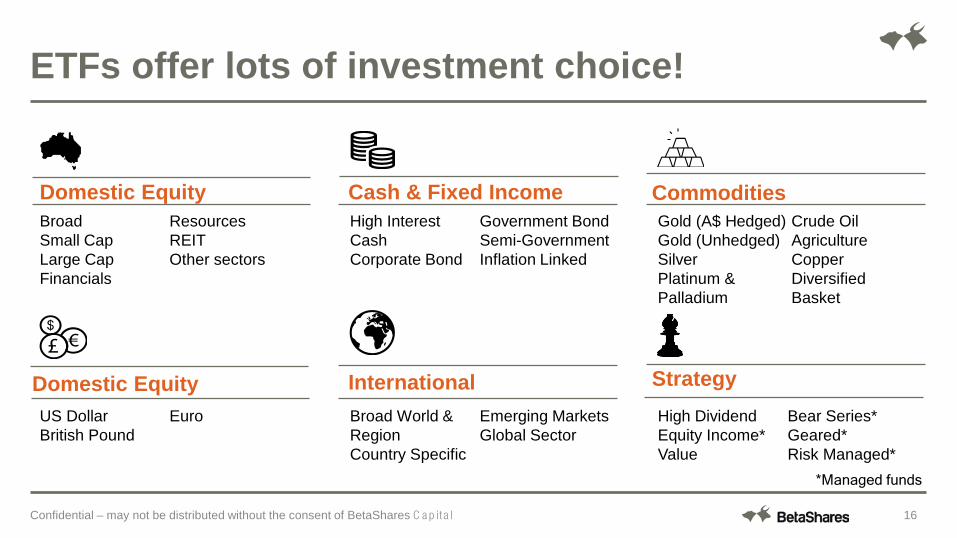
ETFs offer lots of investment choice!
Domestic EquityBroadSmall CapLarge CapFinancials
ResourcesREITOther sectors
Cash & Fixed Income CommoditiesHigh Interest CashCorporate Bond
Government BondSemi-GovernmentInflation Linked
Gold (A$ Hedged)Gold (Unhedged)Silver Platinum & Palladium
Crude OilAgricultureCopperDiversified Basket
Domestic Equity International StrategyUS DollarBritish Pound
Euro Broad World & RegionCountry Specific
Emerging MarketsGlobal Sector
High DividendEquity Income*Value
Bear Series*Geared*Risk Managed*
*Managed funds
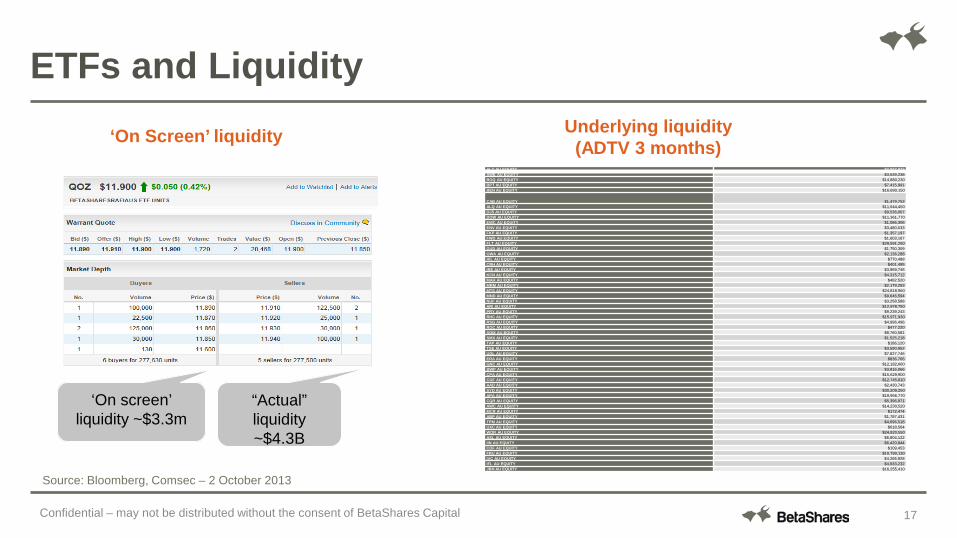
‘On Screen’ liquidity
‘On screen’ liquidity ~$3.3m
Underlying liquidity (ADTV 3 months)
ALZ AU EQUITY $2,922,873AWE AU EQUITY $3,539,238BOQ AU EQUITY $14,880,230BPT AU EQUITY $7,415,991BEN AU EQUITY $16,690,150
CAB AU EQUITY $1,479,753ALQ AU EQUITY $11,644,450DJS AU EQUITY $9,536,007DOW AU EQUITY $11,361,770EWC AU EQUITY $1,086,306ENV AU EQUITY $3,480,533FKP AU EQUITY $1,357,197FWD AU EQUITY $1,603,167FLT AU EQUITY $29,591,250GUD AU EQUITY $1,750,309GWA AU EQUITY $2,136,288HIL AU EQUITY $770,488CRH AU EQUITY $401,495IRE AU EQUITY $3,959,745KCN AU EQUITY $4,315,712MAH AU EQUITY $482,520MRM AU EQUITY $2,179,253MTS AU EQUITY $24,818,560MND AU EQUITY $9,646,594NUF AU EQUITY $3,258,588ARI AU EQUITY $12,978,750PRY AU EQUITY $9,239,243RHC AU EQUITY $15,971,930RSG AU EQUITY $4,996,496ROC AU EQUITY $477,220SGM AU EQUITY $8,760,581SMX AU EQUITY $1,525,218TAP AU EQUITY $186,120TSE AU EQUITY $3,590,952UGL AU EQUITY $7,827,746ERA AU EQUITY $836,766GNC AU EQUITY $12,182,660BWP AU EQUITY $3,816,066CPA AU EQUITY $15,629,900CGF AU EQUITY $12,745,810AAD AU EQUITY $2,430,743SYD AU EQUITY $30,209,250APA AU EQUITY $19,956,770CQR AU EQUITY $5,396,971AWC AU EQUITY $14,230,520MCR AU EQUITY $172,474ABP AU EQUITY $1,787,431TPM AU EQUITY $4,696,518UXC AU EQUITY $618,564WOR AU EQUITY $24,820,550ASL AU EQUITY $6,804,122IIN AU EQUITY $6,420,844COF AU EQUITY $109,453FBU AU EQUITY $10,790,130IVC AU EQUITY $4,265,928IFL AU EQUITY $4,933,232JBH AU EQUITY $16,255,410
“Actual” liquidity ~$4.3B
ETFs and Liquidity
Source: Bloomberg, Comsec – 2 October 2013
17Confidential – may not be distributed without the consent of BetaShares Capital
1. About BetaShares2. What are ETFs / growth story3. Applications of ETFs in Portfolios
– Asset class exposure– Strategy or outcomes based
Contents
18Confidential – may not be distributed without the consent of BetaShares Capital
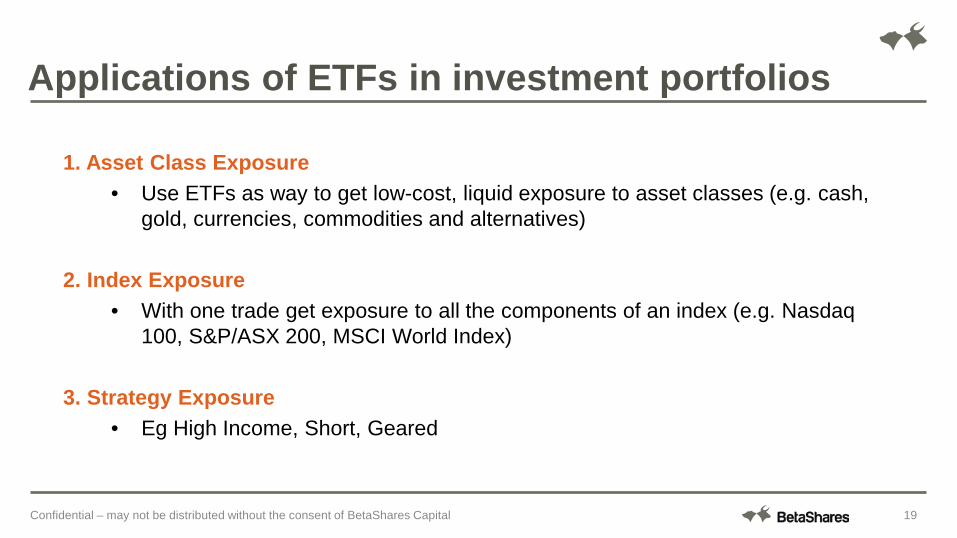
1. Asset Class Exposure • Use ETFs as way to get low-cost, liquid exposure to asset classes (e.g. cash,
gold, currencies, commodities and alternatives)
2. Index Exposure• With one trade get exposure to all the components of an index (e.g. Nasdaq
100, S&P/ASX 200, MSCI World Index)
3. Strategy Exposure• Eg High Income, Short, Geared
Applications of ETFs in investment portfolios
19Confidential – may not be distributed without the consent of BetaShares Capital
Asset class exposures
Confidential – may not be distributed without the consent of BetaShares Capital
Confidential – may not be distributed without the consent of BetaShares Capital 21
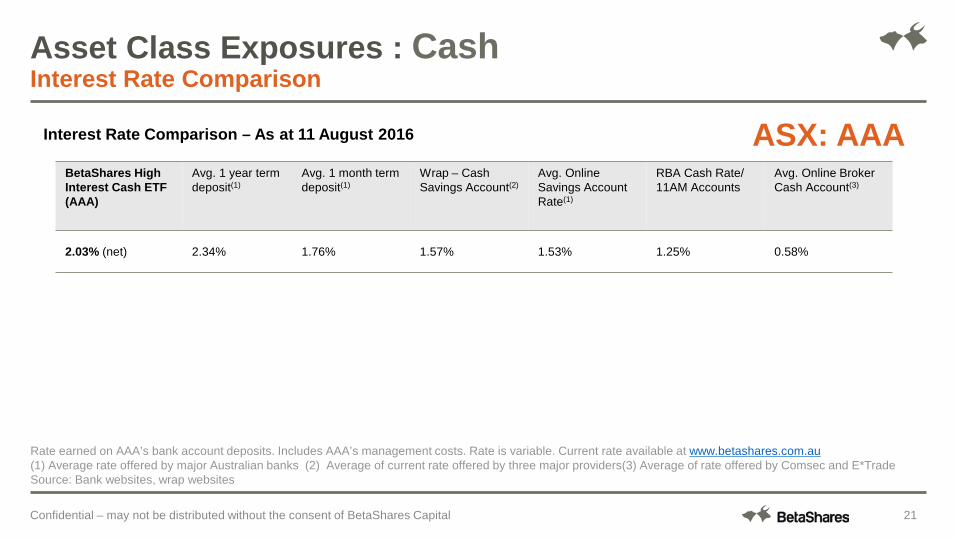
Asset Class Exposures : CashInterest Rate Comparison
BetaShares High Interest Cash ETF (AAA)
Avg. 1 year term deposit(1)
Avg. 1 month term deposit(1)
Wrap – Cash Savings Account(2)
Avg. Online Savings Account Rate(1)
RBA Cash Rate/ 11AM Accounts
Avg. Online Broker Cash Account(3)
2.03% (net) 2.34% 1.76% 1.57% 1.53% 1.25% 0.58%
Interest Rate Comparison – As at 11 August 2016
Rate earned on AAA’s bank account deposits. Includes AAA’s management costs. Rate is variable. Current rate available at www.betashares.com.au(1) Average rate offered by major Australian banks (2) Average of current rate offered by three major providers(3) Average of rate offered by Comsec and E*TradeSource: Bank websites, wrap websites
ASX: AAA
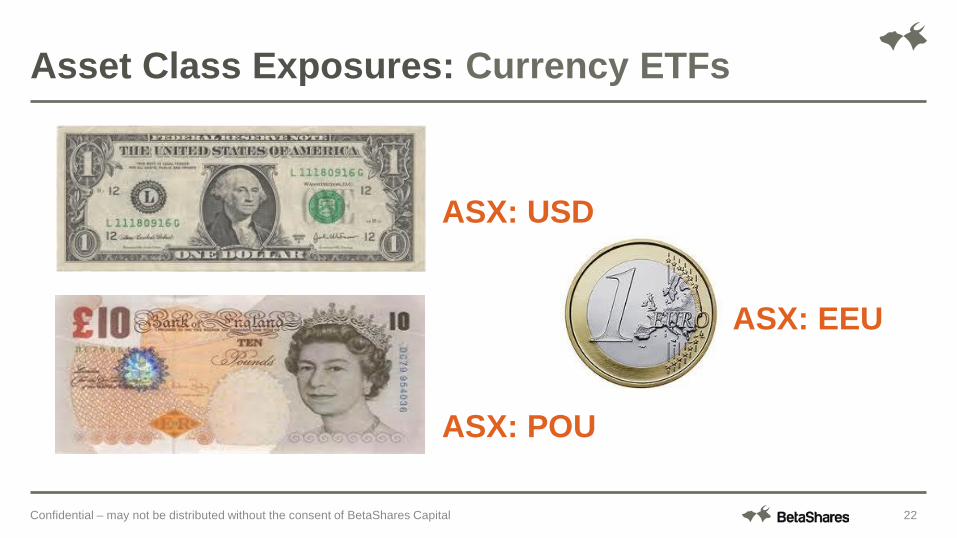
Confidential – may not be distributed without the consent of BetaShares Capital 22
Asset Class Exposures: Currency ETFs
ASX: USD
ASX: EEU
ASX: POU
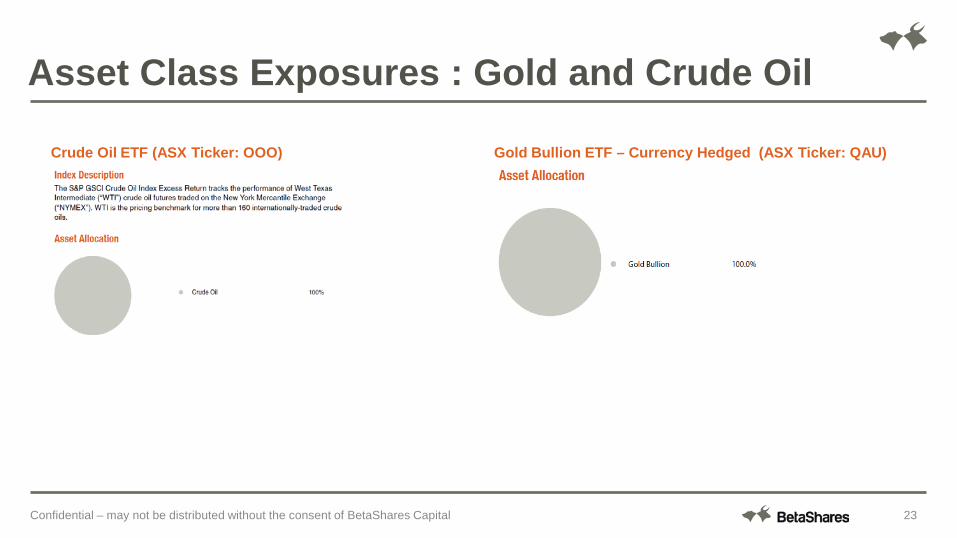
Asset Class Exposures : Gold and Crude Oil
Crude Oil ETF (ASX Ticker: OOO) Gold Bullion ETF – Currency Hedged (ASX Ticker: QAU)
23Confidential – may not be distributed without the consent of BetaShares Capital
Confidential – may not be distributed without the consent of BetaShares Capital 24
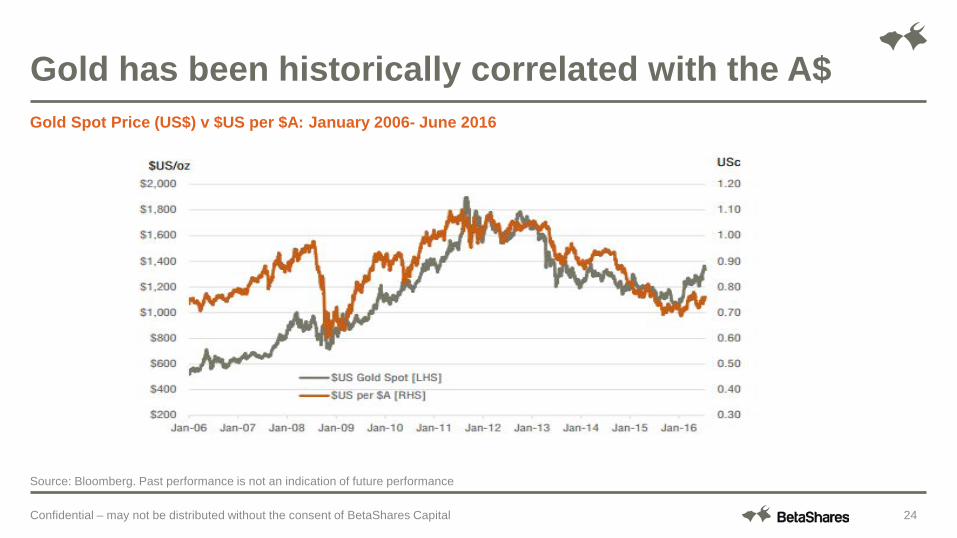
Gold has been historically correlated with the A$Gold Spot Price (US$) v $US per $A: January 2006- June 2016
Source: Bloomberg. Past performance is not an indication of future performance

Confidential – may not be distributed without the consent of BetaShares Capital
Index Exposures

Core Exposures : FTSE RAFI Australia 200 Index
• RAFI = Research Affiliates Fundamental Indexation
• Factors best reflect a company’s ‘economic footprint’ and are not price related
• Factors are equally weighted
• Average of five years of historical data used for all measures except book value
• Methodology is transparent, repeatable and based on measures which have historically proved to be successful in delivering attractive performance outcomes compared to market-cap weighted indices
Cash FlowSales
Book Value Dividends
RAFI Fundamental
Factors
ASX: QOZ26Confidential – may not be distributed without the consent of BetaShares Capital

Confidential – may not be distributed without the consent of BetaShares Capital 27
FTSE RAFI Australia 200 Index has outperformed S&P/ASX 200 Index since inceptionFTSE RAFI Australia 200 Index v S&P/ASX 200 Index: May 1992 – June 2016 (Growth of $100)
Graph shows performance of underlying index relative to S&P/ASX 200 index, not ETF performance and does not take into account ETF management costs. You cannot invest directly in an index. Returns for periods longer than one year are annualised. Past performance is not an indicator of future performance of index or ETF. The FTSE RAFI Australia 200 Index was launched on 10/8/2009. Index returns prior to launch are simulated based on Research Affiliates’ patented non-capitalisation weighted indexing system, method and computer program product. Actual investment results may differ from simulated results. Source: Bloomberg, FTSE
Value add since inception: 2.0% p.a
TOTAL RETURN FTSE RAFI AUSTRALIA 200 S&P/ASX 200
3M 3.5% 3.9%6M 1.0% 1.1%1 YR -2.1% 0.6%3 YR (p.a) 7.2% 7.7%5 YR (p.a) 8.4% 7.4%10 YR (p.a) 6.7% 4.9%20 YR (p.a) 11.1% 8.9%Incept (p.a) 11.2% 9.2%
Volatility (p.a)12.9% 13.2%
Risk - adujstedreturn
0.867 0.696
Ending value of 100 $
$ 1,287.92 $ 825.44
50
250
450
650
850
1,050
1,250
1,450
1,650
May-92 May-94 May-96 May-98 May-00 May-02 May-04 May-06 May-08 May-10 May-12 May-14 May-16
FTSE RAFI Australia 200 TR Index (index BetaShares FTSE RAFI Australia 200 ETFseeks to track)S&P/ ASX 200 TR Index
ASX: QOZ

Confidential – may not be distributed without the consent of BetaShares Capital 28
FTSE RAFI Australia 200 Index has outperformed S&P/ASX 200 Index most years since inceptionFTSE RAFI Australia 200 Index v S&P/ASX 200 Index Total Returns by Calendar Year
Table shows performance of underlying index relative to S&P/ASX 200 index, not ETF performance and does not take into account ETF management costs. You cannot invest directly in an index. Past performance is not an indicator of future performance of index or ETF. The FTSE RAFI Australia 200 Index was launched on 10/8/2009. Index returns prior to launch are simulated based on Research Affiliates' patented non-capitalisation weighted indexing system, method and computer program product. Actual investment results may differ from simulated results. Source: Bloomberg, FTSE
Total Return FTSE RAFI 200 S&P/ASX 200 Difference2015 0.4% 2.6% -2.1%2014 5.6% 5.6% 0.0%2013 25.5% 20.2% 5.3%2012 21.9% 20.3% 1.7%2011 -9.4% -10.5% 1.1%2010 0.6% 1.6% -1.0%2009 48.6% 37.0% 11.5%2008 -36.9% -38.4% 1.5%2007 20.1% 16.1% 4.0%2006 21.8% 24.2% -2.4%2005 23.1% 22.8% 0.3%2004 26.5% 28.0% -1.5%2003 14.4% 14.6% -0.2%2002 -3.0% -8.8% 5.8%2001 17.4% 10.4% 7.0%2000 7.8% 6.4% 1.4%1999 19.1% 18.7% 0.4%1998 20.0% 9.8% 10.2%1997 13.2% 12.7% 0.5%1996 16.4% 14.4% 2.0%1995 20.4% 21.1% -0.7%1994 -7.9% -8.8% 0.8%1993 48.7% 40.0% 8.6%
Confidential – may not be distributed without the consent of BetaShares Capital 29
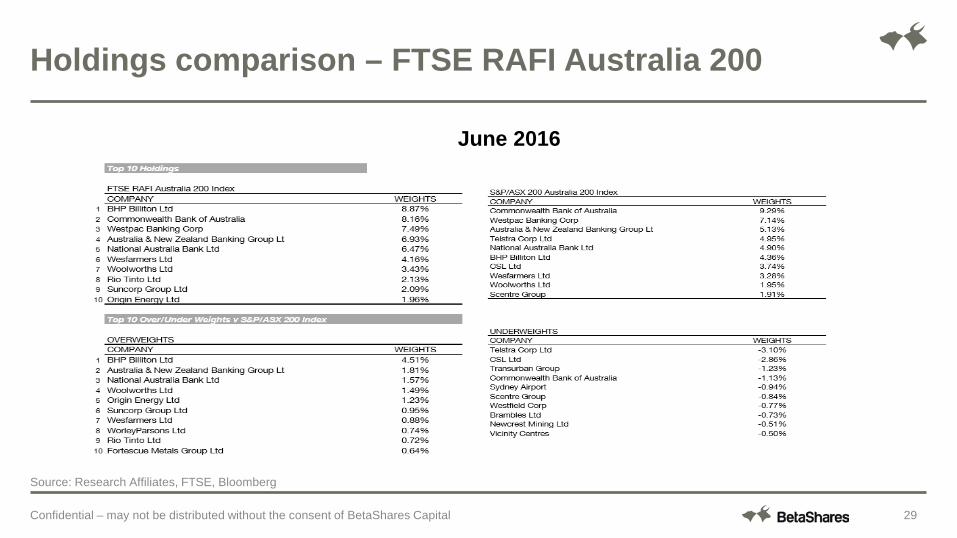
Holdings comparison – FTSE RAFI Australia 200
June 2016
Source: Research Affiliates, FTSE, Bloomberg
ASX: NDQ
Core Exposures : NASDAQ 100 Index
30Confidential – may not be distributed without the consent of BetaShares Capital
Confidential – may not be distributed without the consent of BetaShares Capital 31
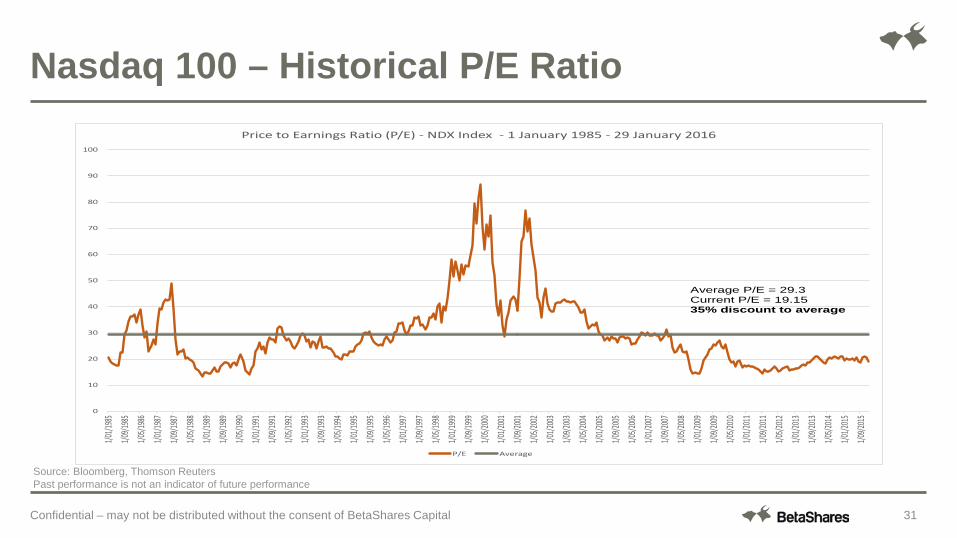
Nasdaq 100 – Historical P/E Ratio
0
10
20
30
40
50
60
70
80
90
100
1/01/1
985
1/09/1
985
1/05/1
986
1/01/1
987
1/09/1
987
1/05/1
988
1/01/1
989
1/09/1
989
1/05/1
990
1/01/1
991
1/09/1
991
1/05/1
992
1/01/1
993
1/09/1
993
1/05/1
994
1/01/1
995
1/09/1
995
1/05/1
996
1/01/1
997
1/09/1
997
1/05/1
998
1/01/1
999
1/09/1
999
1/05/2
000
1/01/2
001
1/09/2
001
1/05/2
002
1/01/2
003
1/09/2
003
1/05/2
004
1/01/2
005
1/09/2
005
1/05/2
006
1/01/2
007
1/09/2
007
1/05/2
008
1/01/2
009
1/09/2
009
1/05/2
010
1/01/2
011
1/09/2
011
1/05/2
012
1/01/2
013
1/09/2
013
1/05/2
014
1/01/2
015
1/09/2
015
Price to Earnings Ratio (P/E) - NDX Index - 1 January 1985 - 29 January 2016
P/E Average
Average P/E = 29.3Current P/E = 19.1535% discount to average
Source: Bloomberg, Thomson Reuters Past performance is not an indicator of future performance
BetaShares Global Sector Series
BetaShares Global Sector Series is currently the most extensive family of global sector products
available on ASX
32Confidential – may not be distributed without the consent of BetaShares Capital
Confidential – may not be distributed without the consent of BetaShares Capital 33
BetaShares Global Energy Companies ETF (ASX: FUEL)
BetaShares Global Healthcare ETF (ASX: DRUG)
34Confidential – may not be distributed without the consent of BetaShares Capital
Strategy or outcome based strategies
Confidential – may not be distributed without the consent of BetaShares Capital
Strategy & Outcome Based ETFs
Growth in ETF industry has led to development of funds that follow a set of rules to provide a particular outcome, such as:
• Ability to “Short” the market• Enhanced dividend Income• Managed Volatility• Options to gear or leverage
36Confidential – may not be distributed without the consent of BetaShares Capital
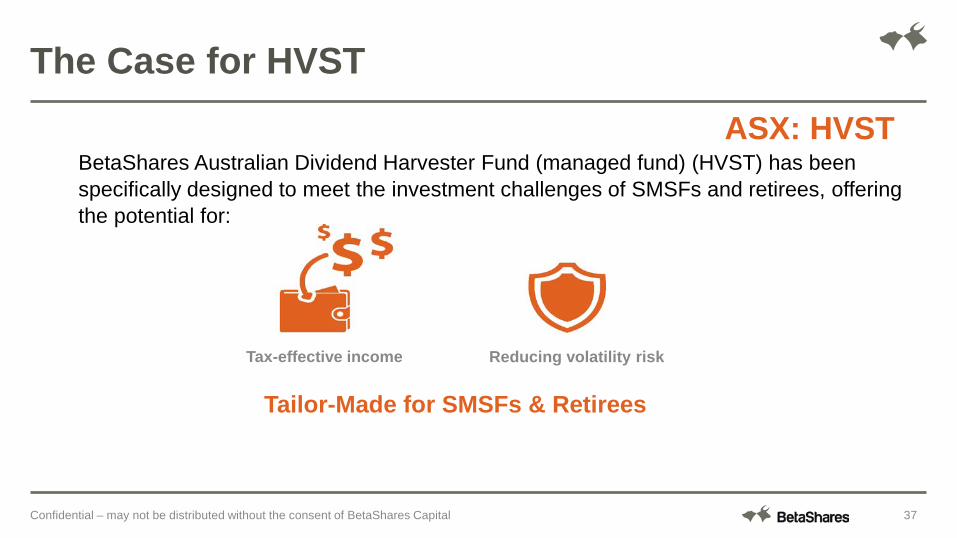
The Case for HVST
BetaShares Australian Dividend Harvester Fund (managed fund) (HVST) has been specifically designed to meet the investment challenges of SMSFs and retirees, offering the potential for:
ASX: HVST
Tailor-Made for SMSFs & Retirees
Tax-effective income Reducing volatility risk
37Confidential – may not be distributed without the consent of BetaShares Capital
Confidential – may not be distributed without the consent of BetaShares Capital 38
The Dividend Harvester Strategy
ASX 50 UNIVERSE
Confidential – may not be distributed without the consent of BetaShares Capital 39
The Dividend Harvester Strategy
Stocks paying dividends this
period

Confidential – may not be distributed without the consent of BetaShares Capital 40
The Dividend Harvester Strategy
Dividend paying stocks
by highest grossing yield
Confidential – may not be distributed without the consent of BetaShares Capital 41
The Dividend Harvester Strategy
14 Stock Portfolio
Confidential – may not be distributed without the consent of BetaShares Capital 42
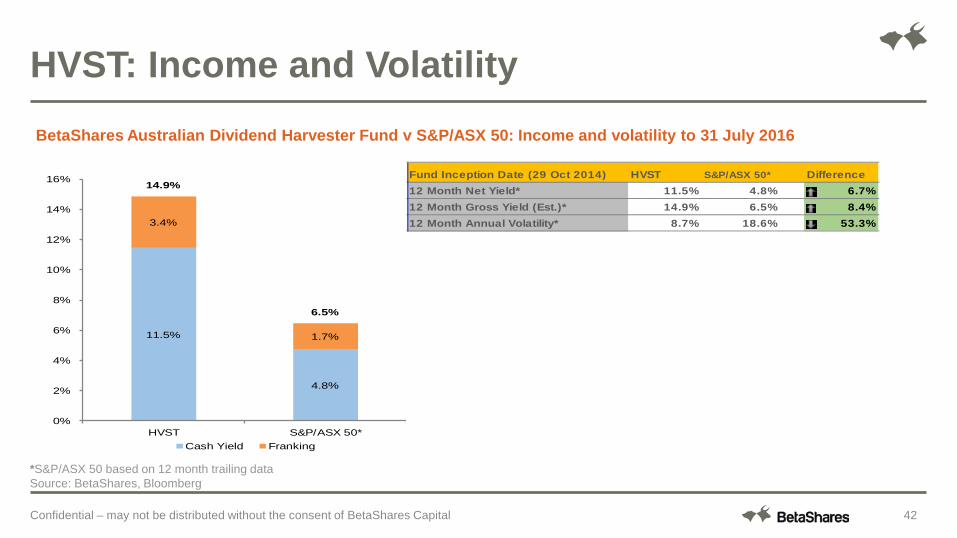
HVST: Income and VolatilityBetaShares Australian Dividend Harvester Fund v S&P/ASX 50: Income and volatility to 31 July 2016
*S&P/ASX 50 based on 12 month trailing dataSource: BetaShares, Bloomberg
11.5%
4.8%
3.4%
1.7%
14.9%
6.5%
0%
2%
4%
6%
8%
10%
12%
14%
16%
HVST S&P/ASX 50*Cash Yield Franking
Fund Inception Date (29 Oct 2014) HVST S&P/ASX 50* Difference12 Month Net Yield* 11.5% 4.8% 6.7%12 Month Gross Yield (Est.)* 14.9% 6.5% 8.4%12 Month Annual Volatility* 8.7% 18.6% 53.3%
Confidential – may not be distributed without the consent of BetaShares Capital 43
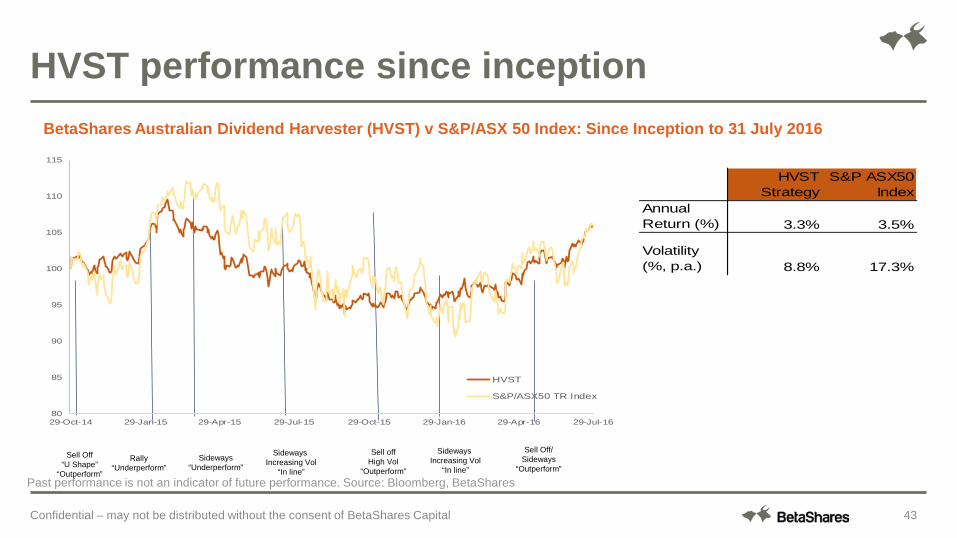
HVST performance since inceptionBetaShares Australian Dividend Harvester (HVST) v S&P/ASX 50 Index: Since Inception to 31 July 2016
Past performance is not an indicator of future performance. Source: Bloomberg, BetaShares
Sell Off“U Shape”
“Outperform”
Sideways“Underperform”
Sideways Increasing Vol
“In line”
Sell offHigh Vol
“Outperform”
Sideways Increasing Vol
“In line”
Sell Off/Sideways
“Outperform”Rally
“Underperform”
HVST Strategy
S&P ASX50 Index
Annual Return (%) 3.3% 3.5%
Volatility (%, p.a.) 8.8% 17.3%
80
85
90
95
100
105
110
115
29-Oct-14 29-Jan-15 29-Apr-15 29-Jul-15 29-Oct-15 29-Jan-16 29-Apr-16 29-Jul-16
HVST
S&P/ASX50 TR Index

S&P/ASX 200 Index (1992-2013): Cumulative equity return and volatility
Source: Milliman Financial Risk Management LLC, 31/12/1991-31/12/2013. The chart above is historical and for illustrative purposes only. It doesnot represent actual performance of any investment. Past performance is no guarantee of future results.
Selected periods when increased market volatility was associated with market declines
Volatility is frequently associated with sharply falling markets
ASX: HVST
44Confidential – may not be distributed without the consent of BetaShares Capital
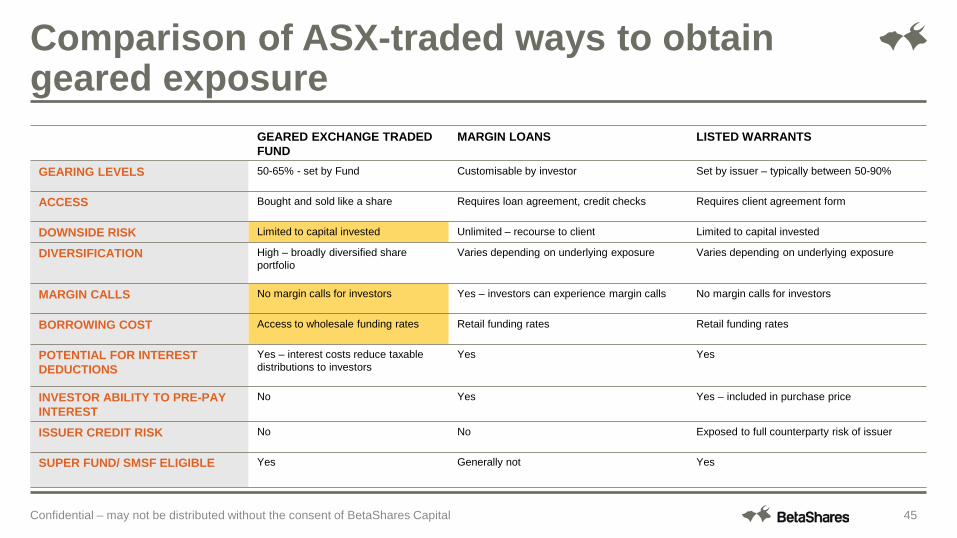
GEARED EXCHANGE TRADED FUND
MARGIN LOANS LISTED WARRANTS
GEARING LEVELS 50-65% - set by Fund Customisable by investor Set by issuer – typically between 50-90%
ACCESS Bought and sold like a share Requires loan agreement, credit checks Requires client agreement form
DOWNSIDE RISK Limited to capital invested Unlimited – recourse to client Limited to capital invested
DIVERSIFICATION High – broadly diversified share portfolio
Varies depending on underlying exposure Varies depending on underlying exposure
MARGIN CALLS No margin calls for investors Yes – investors can experience margin calls No margin calls for investors
BORROWING COST Access to wholesale funding rates Retail funding rates Retail funding rates
POTENTIAL FOR INTEREST DEDUCTIONS
Yes – interest costs reduce taxable distributions to investors
Yes Yes
INVESTOR ABILITY TO PRE-PAY INTEREST
No Yes Yes – included in purchase price
ISSUER CREDIT RISK No No Exposed to full counterparty risk of issuer
SUPER FUND/ SMSF ELIGIBLE Yes Generally not Yes
Confidential – may not be distributed without the consent of BetaShares Capital 45
Comparison of ASX-traded ways to obtain geared exposure
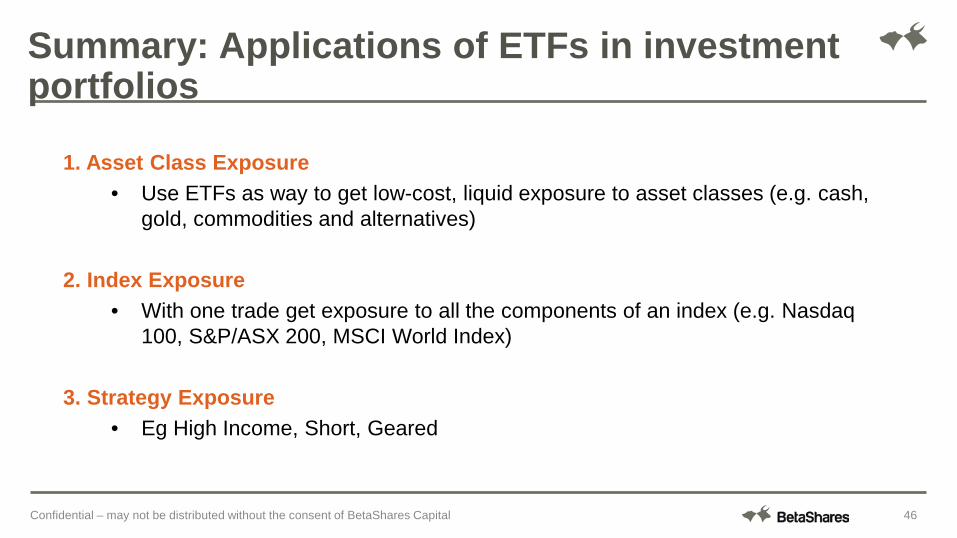
1. Asset Class Exposure • Use ETFs as way to get low-cost, liquid exposure to asset classes (e.g. cash,
gold, commodities and alternatives)
2. Index Exposure• With one trade get exposure to all the components of an index (e.g. Nasdaq
100, S&P/ASX 200, MSCI World Index)
3. Strategy Exposure• Eg High Income, Short, Geared
Summary: Applications of ETFs in investment portfolios
46Confidential – may not be distributed without the consent of BetaShares Capital
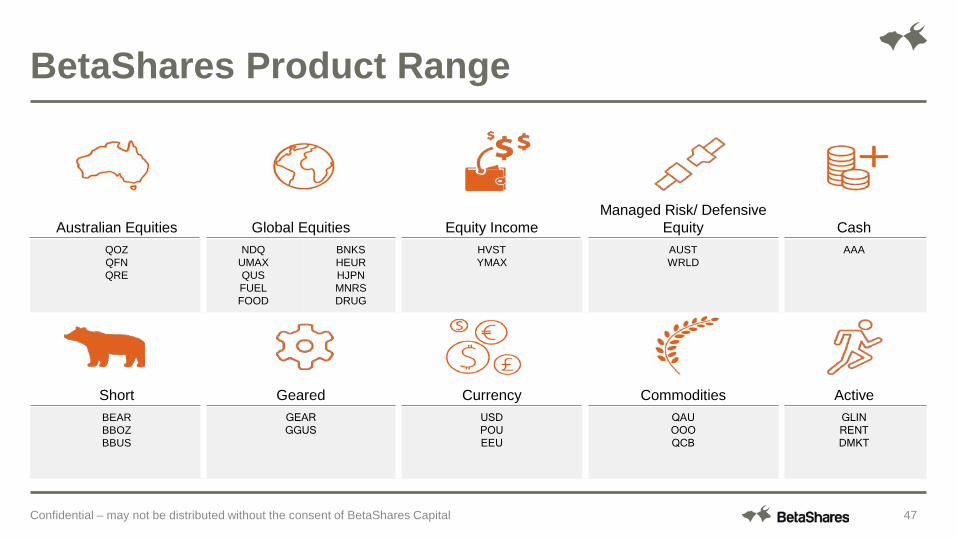
Australian Equities Global Equities Equity Income Managed Risk/ Defensive
Equity CashQOZQFNQRE
NDQUMAXQUSFUELFOOD
BNKSHEURHJPNMNRSDRUG
HVSTYMAX
AUSTWRLD
AAA
Short Geared Currency Commodities Active BEARBBOZBBUS
GEARGGUS
USDPOUEEU
QAUOOOQCB
GLIN RENTDMKT
BetaShares Product Range
47Confidential – may not be distributed without the consent of BetaShares Capital
Questions?
Subscribe to our blog for economic insight and ETF trading ideas –www.betasharesblog.com.au
48Confidential – may not be distributed without the consent of BetaShares Capital
Disclaimer
This webinar and information has been prepared and issued by NetwealthInvestments Limited (Netwealth), ABN 85 090 569 109, AFSL 230975. It contains factual information and general financial product advice only and has been prepared without taking into account the objectives, financial situation or needs of any individual. The information provided is not intended to be a substitute for professional financial product advice and you should determine its appropriateness having regard to you or your client’s particular circumstances. The relevant disclosure document should be obtained from Netwealth and considered before deciding whether to acquire, dispose of, or to continue to hold, an investment in any Netwealth product.
While all care has been taken in the preparation of this document (using sources believed to be reliable and accurate), no person, including Netwealth, or any other member of the Netwealth group of companies, accepts responsibility for any loss suffered by any person arising from reliance on this information.