network 11 quality update chris singer, man, rn, cnn december 4, 2008
TRANSCRIPT

Network 11 Quality Update
Chris Singer, MAN, RN, CNNDecember 4, 2008

What’s Going on in Network 11?
• Fistula First• Lab data collection• MRC Recommended Treatment
Guidelines• Immunization• Involuntary discharge

Fistula First

We are Improving!

Almost there…Final State Approaching
50%

We Are Improving!

What Are We Doing to Improve?
• Facility goals• Surgeon workshops• Data feedback reports• QI action plans• Patient involvement

We Still Have a Ways to Go…
• September 2008 = 49.4%• New Network 11 goal from CMS =
51.3% by 6/30/2009 = 1% per calendar quarter
• CMS national goal = 66%
by 6/30/2009• KDOQI Guideline for prevalent AVFs 65%

Percent of Patients Dialyzing with an AVF12/31/2002
48.3
4238.9
35.7 34.9 34.5 34.4 33.3 32.4 32.1 31.3 31.1 30.3 29.5 29.226.6 26.3 25.7 25.4
0
10
20
30
40
50
60
70
80
90
100
16 1 2 18 17 7 3 10 US 4 11 12 9 15 6 5 8 14 13
The Starting PointWhere We Were

The Target Is Moving –Where We Are

Incredible Improvement in 2007


2008 AVF PrevalenceFacility Goals
• Formula used to calculate goals(66% [CMS program goal]) – (facility
baseline percent [AVF rate in Q4]) x 20%
• Project Design– Baseline: December 2007 – Goal to be achieved by December 2008
data– Progress reports sent out quarterly– Action plans requested after 6 months
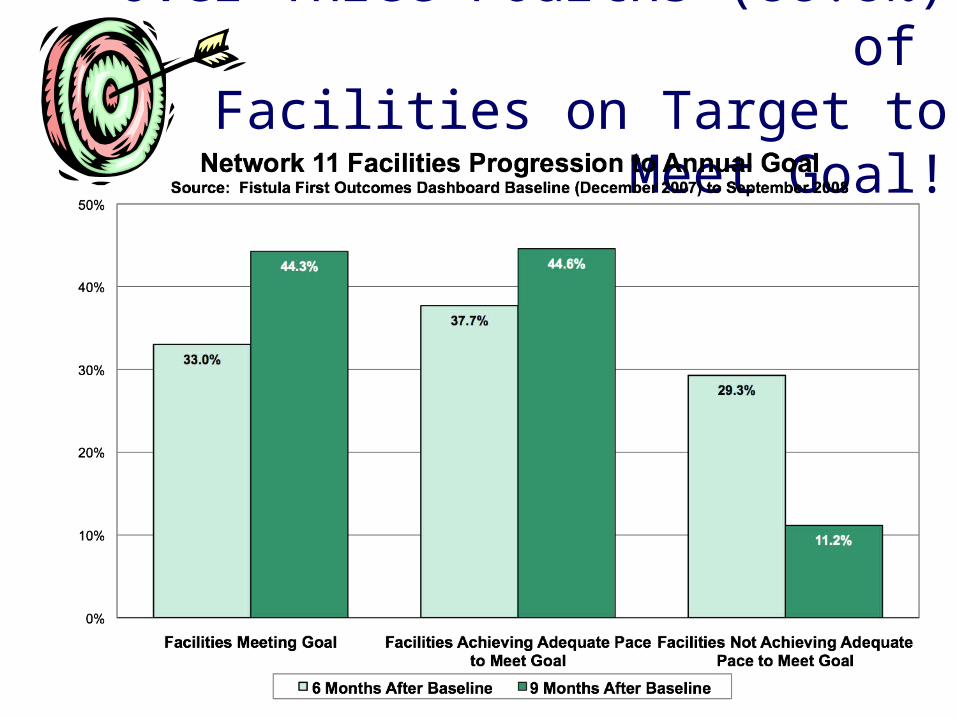
Over Three-Fourths (88.8%) of Facilities on Target to Meet Goal!
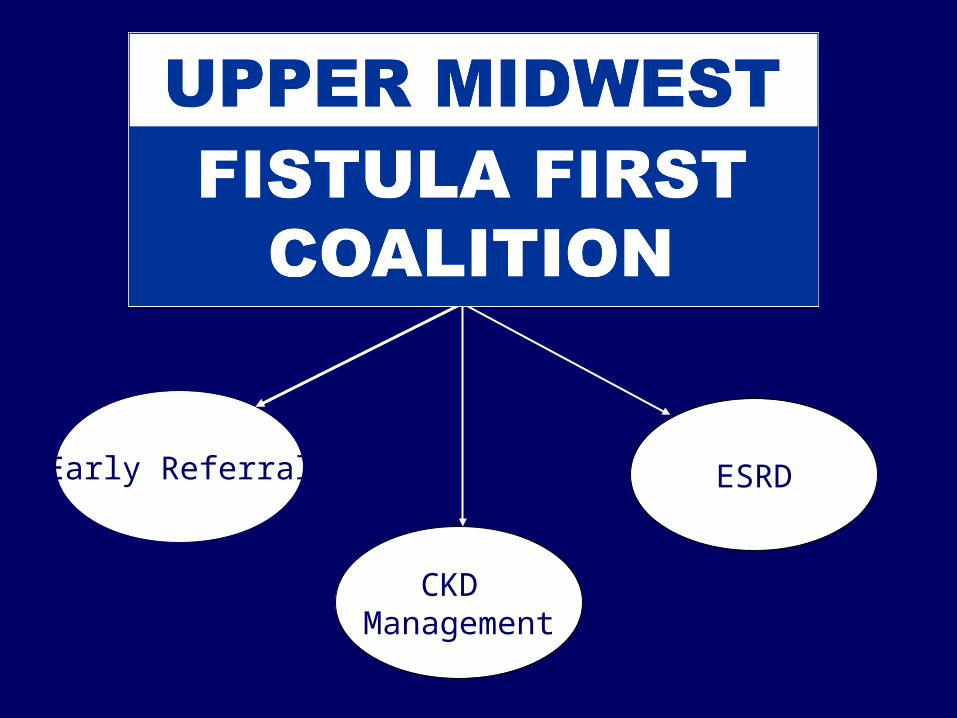
Early Referral
CKD Management
ESRD

Upper Midwest Coalition Workgroups
• CKD Management– Strategy: Educate nephrologists and physician
extenders ways to use CKD care to improve likelihood of AVF placement prior to dialysis start.
• CKD Early Referral– Strategy: Use of automatic lab eGFR reporting to
alert physicians of early CKD identification.– Train primary care physicians to identify CKD and
refer to nephrologist earlier.
• ESRD– Strategy: State Survey Provider Tool– Develop facility and patient education strategies that
will facilitate AVF improvement

Coalition Successes All labs in 5-state region participated in GFR
survey with over 2/3 automatically reporting GFR
CKD WebEx conducted for primary care physicians
Vascular access coordinator questionnaire in all Network 11 facilities—WebEx's now being developed
Patient resistance focus groups conducted—new patient resources coming!
Acute dialysis education questionnaire conducted

Nephrologist Report Card• CMS Form 2728 Patient Data on
Vascular Access• Information collected included:
– Patient population: catheter as sole access for dialysis start
– Pre-dialysis nephrology care– Surgeon referral
• Implemented of model algorithm and education
• Follow-up data collected

Pre-ESRD Care Trends in Network 11Source: 2728 Medical Evidence Reports, 2007
3%
10%
5%4%
5% 6%
34%
21%
16%
27%
23% 24%
28%
41%
47%
34% 34%36%
35%
28%
32%
35%37%
35%
0%
10%
20%
30%
40%
50%
60%
ND WI SD MN MI NW 11
Amount of Pre-ESRD Care in Months
Per
cen
t o
f P
atie
nts
< 6 6-12 > 12 None
Overall, more than 60% of patients in Network 11 are seen by a nephrologist at least 6 months before starting dialysis

Comparison of AVF Use on First DialysisSource: 2728 Medical Evidence Reports, 2007
16.2% 16.4%
7.3%
14.3%
12.3%13.6%
33.7%
31.5%
28.7%27.9%
23.2%
26.6%
0%
10%
20%
30%
40%
50%
ND WI SD MN MI NW 11
Pe
rce
nt
of
Pati
en
ts
AVF Used on First Dialysis AVF in Place on First Dialysis
N = 315 N = 1575 N = 247 N = 1346 N = 3639 N = 7122

Vascular Access Placed by Pre-ESRD Care in Network 11Source: 2728 Medical Evidence Report, 2007
20.2%
31.7%
42.0%
8.4%
4.7%
5.9%
6.2%
2.1%
68.9%
54.0%41.8%
87.5%
6.1% 8.5% 10.0%
2.0%
0%
10%
20%
30%
40%
50%
60%
70%
80%
90%
100%
< 6 6-12 > 12 None
Pre-ESRD Care
Per
cen
t o
f P
atie
nts
AVF Placed AVG Cath Other

Lab Data CollectionElab – 4th Quarter 2007
(nearly 100% patient sample)

Network 11 and the Lab Data Collection Project
• For Q4 2007 all 18 Networks participated in the project
• Lab Data Collection project was completely done in house by Network 11
• Network 11 has been awarded a contract from CMS to officially conduct this project for Q4 2008

National Overall Results

Hemodialysis AdequacyPercent of Patients with URR => 65
Network 11 Lab Data Collection Project - Q4 DataTrend Over Time
78.4
83.486 87.3
85.489.2
86.9 86 87.1
0
10
20
30
40
50
60
70
80
90
100
1999 2000 2001 2002 2003 2004 2005 2006 2007

Percent of Patients with URR => 65%Network Comparison
National Lab Data Collection Project - Q4 2007
92.1 90.4 90.4 90.0 89.9 89.6 89.3 89.1 89.1 88.8 88.7 88.7 88.3 87.5 87.1 87.1 86.9 86.884.5
0.0
10.0
20.0
30.0
40.0
50.0
60.0
70.0
80.0
90.0
100.0
14 1 15 4 3 8 16 2 9 7 6 US 10 12 5 11 13 18 17
Networks
Hemodialysis Adequacy

Anemia ManagementPercent of Patients with Hgb => 11
Network 11 Lab Data Collection Project - Q4 DataTrend Over Time
64.6
73.576.9 78
81.585.4 83.6 83.7 82.1
0
10
20
30
40
50
60
70
80
90
100
1999 2000 2001 2002 2003 2004 2005 2006 2007

Anemia ManagementPercent of Patients with Hemoglobin => 11 gm/dL
Network ComparisonNational Lab Data Collection - Q4 2007
83.0 82.8 82.6 82.5 82.3 82.2 82.1 82.0 81.8 81.6 81.4 81.2 81.1 81.0 80.8 80.2 80.2 80.175.9
0.0
10.0
20.0
30.0
40.0
50.0
60.0
70.0
80.0
90.0
100.0
7 18 14 6 15 17 11 4 5 1 US 3 8 13 10 12 16 9 2
Networks

Phosphorus ControlPercent of Patients with Phosphorus =< 5.5
Network 11 Lab Data Collection Project - Q4 DataTrend Over Time
54 53.1 53.156.9
61.1 61.7 62.7 63.3
0
10
20
30
40
50
60
70
80
90
100
1999 2000 2001 2002 2003 2004 2005 2006 2007
Unable to collect data for Q4
2004

Percent of Patients with Phosphorus =< 5.5 mg/dLNetwork Comparison
National Lab Data Collection - Q4 2007
63.6 63.3 63.1 62.7 61.1 60.9 60.7 60.4 59.8 59.8 59.7 59.5 59.4 59.2 57.6 57.0 56.8 55.5 54.5
0.0
10.0
20.0
30.0
40.0
50.0
60.0
70.0
80.0
90.0
100.0
3 11 4 2 12 1 18 10 9 15 17 US 5 16 7 6 14 13 8
Networks
Phosphorus Control
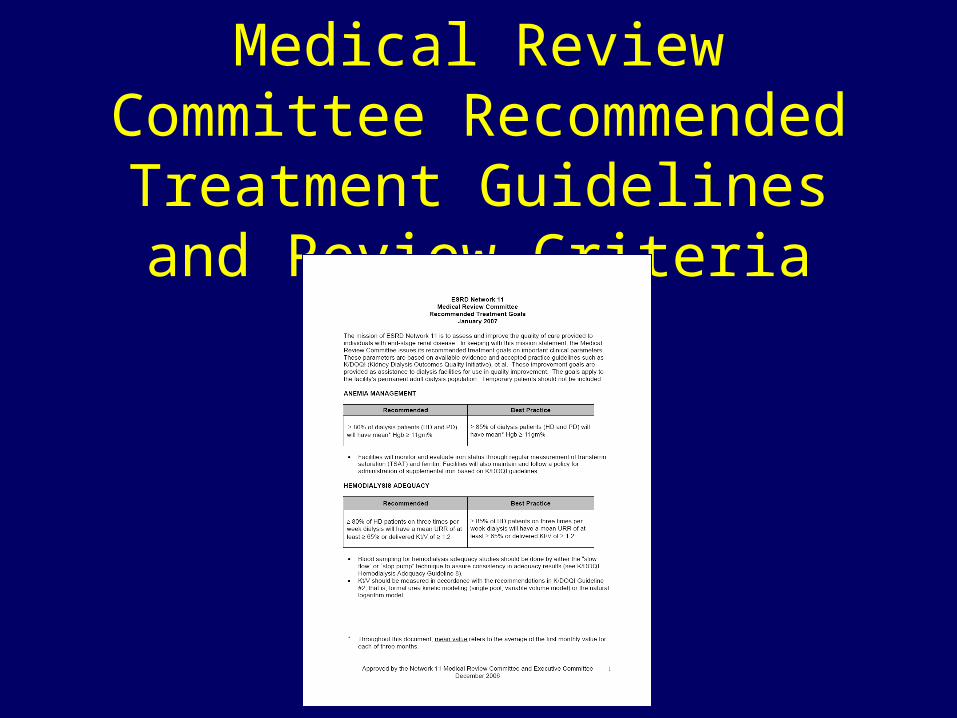
Medical Review Committee Recommended Treatment Guidelines and
Review Criteria

2008 Clinical Indicators with no changes
Recommended Best PracticeHD ADEQUACY: 80% of HD patients on three times per week dialysis will have a mean URR of at least 65% or delivered Kt/V of 1.2
> 85% of HD patients on three times per week dialysis will have a mean URR of at least 65% or delivered Kt/V of 1.2
PD ADEQUACY: 80% of PD patients will have a weekly Kt/V of 1.7
> 85% of PD patients will have a weekly Kt/V of 1.7
NUTRITION: 80% of dialysis patients (HD and PD) will have mean serum albumin the lower limit of normal (LLN), and no more than 10% of patients will have mean serum albumin < 0.9 LLN
> 85% of dialysis patients (HD and PD) will have serum albumin the lower limit of normal (LLN), and no more than 10% of patients will have mean serum albumin < 0.9 LLN
BONE/MINERAL: 70% of dialysis patients (HD and PD) will have a mean serum phosphorus of 5.5 mg/dL< 10% of patients will have mean serum phosphorus of > 8 mg/dL
> 80% of dialysis patients (HD and PD) will have a mean serum phosphorus of 5.5 mg/dL< 5% of patients will have mean serum phosphorus of > 8 mg/dL
BONE/MINERAL: 80% of dialysis patients (HD and PD) will have a mean corrected serum calcium concentration of 10.2 mg/dL.
> 85% of dialysis patients (HD and PD) will have a mean corrected serum calcium concentration of 10.2 mg/dL.> 75% of dialysis patients (HD and PD) will have a mean corrected serum calcium concentration of 9.5 mg/dL.
IMMUNIZATIONS: 90% of patients will receive immunization for influenza 80% of patients will receive immunization for pneumonia 80% of patients without natural immunity will receive immunization for hepatitis B
95% of patients will receive immunization for influenza 85% of patients will receive immunization for pneumonia 90% of patients without natural immunity will receive immunization for hepatitis B
ADVANCE CARE PLANNING: 80% of patients will have documentation that advance care planning discussions were conducted within 6 months of initiating dialysis
85% of patients will have documentation that advance care planning discussions were conducted within 3 months of initiating dialysis
TRANSPLANT REFERRAL 85% of patients will be assessed by the nephrologist for transplant candidacy or referral within 6 months of initiating dialysis as demonstrated by documentation in the medical record
95% of patients will be assessed by the nephrologist for transplant candidacy or referral within 3 months of initiating dialysis as evidenced by documentation in the medical record

Changes for 2008Recommended Best Practice
ANEMIA MANAGEMENTFacilities should target hemoglobin levels between 11-12 gm/dL. A normal distribution of Hgb levels centered around this target will include: 10% of patients with mean Hgb 10 gm/dL, AND 10% of patients with mean Hgb 13 gm/dL.
To be determined following analysis of the Q4 2007 hemoglobin data
VASCULAR ACCESSFacility AVF rate will achieve an annual increase that equals at least the specific goal set for that facility*.
65% of prevalent patients dialyze with an AV fistula
10% of prevalent patients are dialyzing with a catheter as sole access > 90 days
5% of prevalent patients are dialyzing with a catheter as sole access > 90 days

Elab 2007 Review Process

Review ResultsQ4, 2007
Option Number Percent
#1 – Best Practice 0 0%
#2 – Doing Well 42 12.1%
#3 – Needs some improvement
271 78.3%
#4 – QI plan required 32 9.2%
#5 – On site visit by NW
1 0.02%

Network 11 Involuntary Discharges

Involuntary DischargeInvoluntary Discharge
Network 11 Data - Discharges as a Percent of Prevalent Patient PopulationTrend Over Time
0.33
0.37
0.29
0.34
0.22
0.27 0.27
0
0.05
0.1
0.15
0.2
0.25
0.3
0.35
0.4
2001 2002 2003 2004 2005 2006 2007
Pe
rce
nt
of
Pre
va
len
t P
op
ula
tio
n
Decreasing Dialysis Patient-Provider Conflict toolboxes distributed in
2005

Involuntary DischargeReasons for Involuntary Discharge
Network 11 Data Trend Data 2006-2007
0%
10%
20%
30%
40%
50%
Threat Abusive Non-compliant Disruptive Nonpayment Other Neph. D/ced
Pe
rce
nt
of
Dis
ch
arg
es
2006 N=54
2007 N=60

What’s Coming in 2009
• QI Projects– Fistula First– Catheter Reduction– Anemia Management– Unused AVF– QAPI
• CrownWEB

2008 – 09 Projects: Fistula First Goals
• December 2007 Baseline• All facilities with < 65% AVF Used
participating• Based on CMS formula for
Networks• Re-measurement using December
2008 data

2008 – 09 Projects: AVF Placed vs. Used
• Collaborative project with 10 facilities• Voluntary participation• Baseline data: Fistula First September
2008• Facility-specific goals to reduce unused AVF• Interventions include education, quality
improvement plans, and data feedback• Re-measurement March 2009

2008 – 09 Projects: Catheter Reduction
• Collaborative project with mentor regional chain of 9 mentor facilities and regional chain of 9 intervention facilities
• Baseline data: Fistula First September 2008• Facility-specific goals to reduce catheters >
90 days• Interventions include education, quality
improvement plans, and data feedback• Re-measurement March 2009

2008 – 09 Projects: Anemia Management
• Collaborative project with 8 facilities in MI• Baseline data collected September 2008• Facility-specific goals to reduce Hgb <10
and Hgb>13 (Target range 11 – 12)• Voluntary participation• Interventions include education, quality
improvement plans, and data feedback• Re-measurement March 2009

2008 – 09 Projects: Quality Assessment &
Performance Improvement
• Collaborative project with 11 facilities• Voluntary participation• Based on CFC 8 components of effective
QAPI program• Interventions include education, quality
improvement program assessment, and QI program feedback
• Baseline QI program assessment October 2008; re-measurement March 2009

CrownWEB
• Patient ESRD data
• Clinical data
• Fistula First
WNWebCRConsolidated Renal Operations in a Web Enabled Network
The mission of the Renal Network of the Upper Midwest is to assess and improve the
quality of care provided to patients with end stage renal
disease.
In Conclusion