network community structure detection for directional
TRANSCRIPT

IEEE TRANSACTIONS ON BIOMEDICAL ENGINEERING, VOL. 61, NO. 7, JULY 2014 1919
Network Community Structure Detection forDirectional Neural Networks Inferred From
Multichannel Multisubject EEG DataYing Liu∗, Jason Moser, and Selin Aviyente, Member, IEEE
Abstract—In many neuroscience applications, one is interestedin identifying the functional brain modules from multichannel,multiple subject neuroimaging data. However, most of the existingnetwork community structure detection algorithms are limited tosingle undirected networks and cannot reveal the common commu-nity structure for a collection of directed networks. In this paper,we propose a community detection algorithm for weighted asym-metric (directed) networks representing the effective connectivityin the brain. Moreover, the issue of finding a common commu-nity structure across subjects is addressed by maximizing the totalmodularity of the group. Finally, the proposed community detec-tion algorithm is applied to multichannel multisubject electroen-cephalogram data.
Index Terms—Community detection, directed information, ef-fective connectivity, electroencephalogram(EEG), group analysis.
I. INTRODUCTION
W ITH the advances in functional neuroimaging modalitiessuch as electroencephalography (EEG) and functional
magnetic resonance imaging (fMRI), it is now possible to mea-sure human brain activity with increasing temporal and spatialresolution [1]–[3]. This vast amount of spatiotemporal data re-quires the development of computational methods, e.g., connec-tivity analysis, capable of quantifying the functional integrationin the brain for a better understanding of the healthy and dis-eased brain [4]. Currently, three types of brain connectivity areconsidered: anatomic (description of the physical connections),functional (temporal correlation between distant neurophysio-logical events), and effective (causal influence that a neural sys-tem may exert over another). Anatomic connectivity has been
Manuscript received September 15, 2012; revised January 10, 2013 andNovember 13, 2013; accepted December 21, 2013. Date of publication January2, 2014; date of current version June 14, 2014. This work was in part sup-ported by the National Science Foundation under Grant CCF-0728984, GrantCAREER CCF-0746971. This paper was presented in part at the Annual Inter-national Conference of the IEEE Engineering in Medicine and Biology Society(EMBC) [1]. Asterisk indicates corresponding author.
∗Y. Liu is with the Department of Electrical and Computer Engineering,Michigan State University, East Lansing, MI 48824 USA (e-mail: [email protected]).
J. Moser is with the Department of Psychology, Michigan State University,East Lansing, MI 48824 USA (e-mail: [email protected]).
S. Aviyente is with the Department of Electrical and Computer Engi-neering, Michigan State University, East Lansing, MI 48824 USA (e-mail:[email protected]).
Color versions of one or more of the figures in this paper are available onlineat http://ieeexplore.ieee.org.
Digital Object Identifier 10.1109/TBME.2013.2296778
assessed using both in vitro and in vivo methods such as diffusiontensor imaging [5] and molecular probes. Functional and effec-tive connectivity, on the other hand, are based on the functionalproperties of the various cortical regions rather than the analy-sis of specific physical connections between them. Functionalconnectivity is defined as statistical dependences among remoteneurophysiological events and is usually inferred on the basis ofcorrelations between measurements of neuronal activity [6]–[8].However, correlations can arise from stimulus-locked transientsevoked by a common input or can reflect stimulus-induced oscil-lations mediated by synaptic connections [9]. Integration withina distributed system is usually better understood in terms ofeffective connectivity, which is defined as the influence thatone neural system exerts over another, either at a synaptic orpopulation level.
The relationships between multiple regions quantified by ef-fective connectivity can be better characterized using complexnetwork methods. In recent years, complex network tools havebeen applied to neuroscience and neuroimaging studies andhave resulted in a better understanding of the brain at a sys-tem level [10]–[12]. Most of the work in the area of complexnetwork analysis of the human brain has focused on quanti-fying brain networks with a small number of neurobiologi-cally meaningful and easily computable graph theoretic mea-sures [11]–[14]. These measures include the small-world pa-rameter, efficiency [15], hierarchy [16], [17], centrality [18],and the distribution of network hubs [19]. Although these mea-sures summarize the key aspects of complex networks at boththe global (the whole network) and the local (each node to-gether with its most immediate neighbors) levels, they do notprovide any information about the intermediate scale of networkorganization which is more accurately described by the commu-nity structure or modularity of the network [10], [20]–[22]. Themodules of a complex network are subsets of vertices such thatconnections within a module are denser than connections withthe rest of the network. Module detection also allows one toobtain simplified reduced representations of complex networksin terms of subgraphs or communities [23].
In recent years, a lot of work has been done on applyingcommunity detection algorithms from graph theory to the studyof functional brain networks [10], [21], [24]–[26]. Functionalbrain networks are usually described by undirected graphs withcorresponding symmetric association matrices, where each en-try indicates the pairwise functional connectivity between tworegions. Therefore, most of the work on community detec-tion for the study of brain networks has focused on undirected
0018-9294 © 2014 IEEE. Personal use is permitted, but republication/redistribution requires IEEE permission.See http://www.ieee.org/publications standards/publications/rights/index.html for more information.

1920 IEEE TRANSACTIONS ON BIOMEDICAL ENGINEERING, VOL. 61, NO. 7, JULY 2014
networks [24]. However, as Friston points out the functional in-tegration of the brain can be better understood through effectiveconnectivity since it reflects the dynamic (activity dependent andtime dependent) characteristics of a system [6]. In this sense, thebrain network can be better described by an effective connec-tivity network, where the edges of the graph have direction andthe corresponding association matrix is no longer symmetric.As Leicht et al. claims, approaches which ignore the directionof links may fail to understand the dynamics of the system,and similarly any community detection method developed forundirected networks may fail to reveal the actual communitystructure [27]. Therefore, we expect that using effective con-nectivity would reveal new topological characteristics of thebrain network that were not available by functional connectivitynetworks.
In this paper, we propose a multisubject hierarchical commu-nity detection algorithm for describing the modular structure ofeffective brain networks involved in cognitive control. The ap-proach outlined in this paper advances the current study of brainnetworks in several key ways. First, the directed information(DI) measure is employed to quantify the effective connectiv-ity in the brain. DI is a model free and directional measurethat can quantify both the linear and nonlinear relationshipsbetween remote neurophysiological events [28]–[33]. Second,we employ recent work in the area of community detection indirected networks to infer functional modules. In this paper,we extend the state-of-the-art technique for network modularityoptimization, Louvain method, to weighted directed networksto find the functional modules [34]. Third, we extend commu-nity detection algorithms developed for a single network to agroup of networks in order to find a modular structure that bestdescribes all of the subjects in a group. Finally, the algorithmproposed in this paper is applied to multichannel EEG record-ings which provide a higher temporal resolution representationof the community structures in the brain compared to fMRI.
II. BACKGROUND
A. Overview of Community Detection Methods
Many networks of interest in the sciences are found to di-vide naturally into communities or modules. The problem ofdetecting and characterizing this community structure is a keystep for understanding complex networks [35]–[37]. The ideaof community detection is closely related to data clustering,graph partitioning, and hierarchical clustering. Therefore, tradi-tional approaches in these areas can be employed for communitydetection [38]. Two key approaches that have been widely inves-tigated in community detection are: 1) spectral clustering-basedtechniques and 2) network modularity optimization strategies.Spectral clustering-based approaches rely on the optimizationof the process of cutting the graph representing the given net-work. Since this problem is NP-hard, different approximatetechniques such as the normalized cuts algorithm and ratio cutsalgorithm have been proposed [39]. The main problem withspectral clustering-based techniques is that one has to know inadvance the number and the size of communities in the network.Network modularity-based methods, on the other hand, rely on
the modularity function Q to determine the optimal number ofclusters in the network. A good partitioning of a network is ex-pected to have high modularity Q with Q=(fraction of edgeswithin communities)-(expected fraction of such edges) [20],where the expected fraction of edges is evaluated for a randomgraph. For a directed weighted network represented by a graphG = (V,E) with N nodes and an association matrix A, themodularity function is given as [40]:
Q =1W
N∑
i,j=1
[Aij −
souti sin
j
W
]δci ,cj
(1)
where Ai,j is the weight of edge ei→j , sini =
∑j Aji
(souti =
∑j Aij ) is the inflow (outflow) of node i,W =∑
i,j Ai,j , ci(cj ) is the community that node i(j) belongs to; andδci ,cj
is equal to 1 when i and j are in the same community andis equal to 0 otherwise. The problem of maximizing the networkmodularity has been proven to be NP complete. For this reason,several heuristic strategies to maximize the network modular-ity such as Girvan–Newman algorithm [20], the fast clusteringalgorithm [41], the extremal optimization method [37] and theNewman–Leicht mixture model-based approach [42] have beenproposed.
Although most of the modularity-based community detectionalgorithms have focused on binary and undirected networks,in recent years there have been some extensions to weightedand directed networks [38], [43]. However, these approachesare limited to networks with a small number of clusters. Re-cently, Blondel et al. introduced an alternative greedy algorithm,which is known as the Louvain method, to find the hierarchi-cal structure of undirected weighted graphs [34]. Compared toother methods, this method performs better in terms of the com-putation time especially for networks with a large number ofnodes [34]. In this paper, we extend this algorithm to directedweighted graphs for community detection.
B. Group Analysis Approaches
In many neuroimaging studies, extracting a common set offeatures or a representation, e.g., the common community struc-ture for a group of subjects, is important for understanding groupbehavior [44]. This common structure usually gives us an overallunderstanding of the group, while individual subject level rep-resentations show the subject-specific features. There are threemajor group analysis strategies that can be employed for com-munity detection: the “virtual-typical-subject” (VTS) approach,the “individual structure” (IS) approach, and the algorithm-based approach [45], [46]. The VTS approach assumes that datafrom each subject follow the same distribution. It constructsa virtual subject by pooling or averaging the group data andobtains one community structure for the whole group. How-ever, this approach does not consider the intersubject variabilityand may fail when the behavior from subject to subject is notconsistent [45], [46]. The IS approach applies a communitydetection algorithm to each individual subject and extracts acommon community structure from these individual structures.This subject-specific strategy considers diversity across subjects

LIU et al.: NETWORK COMMUNITY STRUCTURE DETECTION FOR DIRECTIONAL NEURAL NETWORKS 1921
and integrates the individual structures by averaging, applyingvoting/consensus algorithms, or finding the most representativesubject [44], [47], [48]. The IS approach is usually computation-ally expensive since it requires the extraction of the communitystructure for each subject before obtaining a common structure.Both the VTS and IS approaches focus on either preprocessingthe data or postprocessing the community structures obtainedfrom each subject. However, neither of these approaches offersa direct extension of the community detection algorithm fromthe single subject to the multiple subject case [49]. In this paper,we propose a group analysis method by optimizing a com-mon modularity function for directed networks from multiplesubjects.
C. Directed Information
Model-based methods and information-theoretic measuresare two main approaches to quantifying the effective connec-tivity between two time series. Model-based methods suchas Granger-casuality-based methods, dynamic causal model-ing (DCM), and linear non-Gaussian acyclic model, usuallyare limited to capturing linear relations or requires a prioriknowledge about the underlying signal models [50]–[53]. How-ever, EEG data are known to have nonlinear dependences, thusinformation-theoretic measures which are model-free and ca-pable of detecting both linear and nonlinear relationships aresuitable for capturing these dependences. Information-theoreticmeasures [30], [54], [55], such as transfer entropy [54] and di-rected transinformation, have found numerous applications inneuroscience [31]. However, the implementation of these mea-sures requires the assumption of certain stochastic models, e.g.,transfer entropy requires order selection based on a Markovassumption for the system [56]. Recently, directed informa-tion has attracted attention for quantifying directional depen-dences [30], [57]. DI theory was originally developed for thestudy of communication channels with feedback [30]. In re-cent years, there has been a growing interest in applying thismeasure to applications in signal processing, neuroscience andbioinformatics, such as inferring effective connectivity in thebrain based on multivariate time series [33], [56]. New theo-retical developments have also motivated the use of this mea-sure in quantifying causality between multivariate time seriesdata [29]. In particular, Amblard et al. [56] showed how DI andGranger causality are equivalent for linear Gaussian processesand proved key relationships between transfer entropy and thedirected information.
The definition of DI for two length n sequences X = Xn =(X1 , . . . , Xn ) and Y = Y n = (Y1 , . . . , Yn ) is as follows:
DI(Xn → Y n ) =n∑
k=1
I(Xk ;Yk |Y k−1) (2)
where I(X;Y |Z) is the conditional mutual information be-tween two random variables X and Y with respect to Z. Thecomputation of DI requires the estimation of joint probabilitiesof high-dimensional random variables over time. If X and Y arenormally distributed, the joint entropy can be estimated based onthe covariance matrices. However, for EEG data, the distribution
is usually not Gaussian. Therefore, nonparametric entropy andmutual information estimators have to be employed [58], [59].In this paper, DI estimation based on mutual information is usedto estimate the DI directly from EEG data by using the adaptivepartitioning method discussed in [59]. However, as the length ofthe random process increases, the computational complexity, thebias, and variance of these estimators increase immensely withfixed number of realizations for each random process. Recently,we have introduced time-lagged DI for every two samples ofXn and Y n with different time lags, and have shown that thismeasure can capture the causality relationship while reducingthe computational complexity [60]. DI for every two samplesof Xn and Y n at the kth time sample with a time delay of d(k > d) is defined as
DIk (Xk -dXk−d+1 → YkYk+1)
= I(Xk -d ;Yk ) + I(Xk -dXk−d+1; Yk+1 |Yk ) (3)
where Xk -d refers to the (k − d)th time sample of the randomprocess X, k = d + 1, . . . , n − 1, d = 0, . . . , p, p < k, p is themaximum lag considered, and n is the length of the signal. Fora single-order model with d equal to the actual model order, thesum of time-lagged DI over all time points is equivalent to theactual DI [29]. In practice, for a model with multiple orders,at each time point k, the time-lagged DIs over a certain timewindow are averaged, i.e., DIk =
∑d2d=d1
DIk (Xk -dXk−d+1 →YkYk+1)/(d2 − d1 + 1). If X and Y are normally distributed,the complexity of using the original definition of DI is O(n4)(using LU decomposition [61]), while the complexity of com-puting DI for two time samples is O(n).
Since 0 ≤ DI(Xn → Y n ) ≤ I(Xn ;Y n ) < ∞, a normalizedversion of DI,
ρDI(Xn → Y n ) =DI(Xn → Y n )
I(Xn ;Y n )(4)
is used for comparing different interactions. For a unidirectionalsystem X → Y with no instantaneous interaction between Xand Y, ρDI(Xn → Y n ) = 1 and ρDI(Y n → Xn ) = 0.
III. ALGORITHM FOR COMMUNITY DETECTION
In this section, we first extend the method proposed by Blon-del et al. to weighted directed networks [34] and then propose anextension for group analysis. The algorithm proposed by Blon-del et al. is for undirected weighted networks and maximizesthe modularity through greedy search. The computation time ofthis method is O(N log N), where N is the number of nodesin the network. Compared to other modularity maximization-based clustering methods, this method performs better in termsof computation time and maximizing the modularity for net-works with various sizes [34], [38], i.e., higher efficiency andaccuracy when partitioning a network into communities.
A. Algorithm for Community Detection in WeightedDirected Networks
In this section, in order to determine the hierarchical commu-nity structure of the effective connectivity networks, we propose

1922 IEEE TRANSACTIONS ON BIOMEDICAL ENGINEERING, VOL. 61, NO. 7, JULY 2014
to extend Blondel’s approach to directed weighted networks. Ini-tially, all nodes of the network are assigned to different commu-nities. The algorithm for determining the community structure ofa directed weighted network consists of two steps. First, for eachnode i, the gain in the modularity ΔQj is computed when nodei is assigned to the communities of all other nodes j (Cj ), wherej = 1, . . . , N, j �= i. The original algorithm only evaluates thechange of modularity when node i is assigned to the commu-nities of its neighbors j, where j is defined as the neighbor ofi when Ai,j �= 0, which may be inaccurate and yield spuriouspartitions in practical cases [38]. For this reason, we considerthe change of modularity with respect to all other nodes in thenetwork. Once ΔQj is obtained, where j = 1, . . . , N, j �= i, thecommunity for which ΔQj is positive and largest is chosen asthe new community for node i. ΔQj , which partly determinesthe efficiency of the algorithm, can be computed as follows:
ΔQj =1W
Nj∑
p=1
(Ai,jp
−sout
i sinjp
W+ Ajp ,i −
sini sout
jp
W
)
− 1W
Ni −1∑
p=1
(Ai,ip
−sout
i sinip
W+ Aip ,i −
sini sout
ip
W
)(5)
where jp ∈ Cj , ip ∈ Ci , and ip �= i,Nj (Ni) is the number ofnodes in community Cj (Ci), sin
i (souti ) is the inflow (outflow)
of node i, and W =∑
i,j Ai,j . The first term on the right-handside of (5) is the modularity contributed by node i when it isassigned to the community of node j, Cj , while the second termis the modularity contributed by node i when it stays in its orig-inal community Ci . This process is sequentially and repeatedlyapplied to all nodes until there is no gain in modularity. At thisstage, the first-level partition of the network is obtained. Next,nodes in the same community after the first level partition areused to form metanodes. The number of metanodes is equal tothe number of current communities, and the weights betweentwo metanodes are given by the sum of the weights of edgesbetween nodes in the corresponding communities [34]
Anew (k, l) =∑
i∈Ck
∑
j∈Cl
Ai,j (6)
where k, l = 1, . . . , tN with tN being the current number ofmetanodes, and Ck ,Cl are the kth and lth communities, respec-tively. Note that since the network is directed, Anew (k, l) �=Anew (l, k). These two steps, assigning community labels andforming metanodes, are iterated until the modularity cannot in-crease anymore, and several levels of partitions are obtained atdifferent resolutions. A low-resolution partition refers to the casewhere the number of nodes (metanodes) is small. The first-levelpartition (before the formation of metanodes) has the highestresolution. The modularity is always computed with respect tothe initial graph topology such that the two-step iterative pro-cedure is not trapped at a local maximum. This algorithm issummarized in Algorithm 1.
B. Algorithm for Community Detection for Multiple Subjects
In neuroscience, one of the challenging problems is groupanalysis when information from multiple subjects needs to bemerged. The standard approach to group analysis is to eitheraverage the data without considering the intersubject variabilityor average the detected community structures from all subjects.However, neither of these approaches integrates the informationfrom each subject at the algorithm level, which can take boththe intersubject variability and commonality into account. Inthe algorithm presented above, we only take into account thechange of modularity for moving one node to the communityof another node for each subject. However, this operation leadsto the change of modularity for all subjects. Therefore, in theproposed approach for multiple subjects, we compute the changeof modularity ΔQk
j for subject k when node i is assigned tothe communities of all other nodes j, where j = 1, . . . , N, j �=i, and k = 1, . . . , L with L being the number of subjects. Toimprove the robustness of the clusters across subjects, for afixed j, we exclude any change in the modularity that is outsidethe 25th and 75th percentiles of ΔQk
j , where k = 1, . . . , L.1
We then compute the average of the gain in modularity forthe remaining L′ subjects, ΔQj =
∑L ′
k=1 ΔQkj /L′, where L′
is the number of subjects that are between the 25th and 75thpercentiles of ΔQk
j , k = 1, . . . , L. We then assign node i to the
1These percentiles were selected empirically based on real and simulated dataand can be easily modified for different applications.

LIU et al.: NETWORK COMMUNITY STRUCTURE DETECTION FOR DIRECTIONAL NEURAL NETWORKS 1923
community of node j which maximizes ΔQj . In this way, theeffect of outliers is directly decreased at the algorithm level. Thedetails are shown in Algorithm 2
C. Validation
Once the community structure is determined by the proposedalgorithm, we test the agreement of the observed communi-ties with the actual community structure using Cohen’s Kappascore [62]. Cohen’s Kappa (κ) adjusts the observed propor-tional agreement by taking into account the amount of agree-ment which would be expected by chance:
κ =p − pe
1 − pe(7)
where p is the proportion of units where there is agreement andpe is the proportion of units expected to agree by chance, de-termined by Chi-square tests. More specifically, in evaluatingour algorithms, suppose that there is a network with N nodes;
TABLE IOBSERVATION TABLE FOR EVALUATING COMMUNITY DETECTION ALGORITHMS
where O is the actual cluster assignment matrix with Oi,j = 1if nodes i and j are in the same cluster and 0 otherwise; M isthe measured cluster assignment matrix with Mi,j = 1 if nodesi and j are identified in the same cluster by the algorithm and0 otherwise. Then, in Table I, TP refers to the number of nodepairs which are correctly identified as being in the same clus-ter by the algorithm; FP refers to the number of node pairswhich are falsely identified as being in the same cluster by thealgorithm; FN refers to the number of node pairs which arefalsely identified as not being in the same cluster by the algo-rithm; and TN refers to the number of node pairs which arecorrectly identified as not being in the same cluster by the al-gorithm. Based on these parameters p = TP+TN
TP+FP+FN+TN , pe =(TP+FP)(TP+FN)(TP+FP+FN+TN)2 + (FN+TN)(FP+TN)
(TP+FP+FN+TN)2 .Compared to other conventional and robust statistics like re-
ceiver operating characteristic (ROC) analysis, one additionaladvantage of using Cohen’s Kappa is that the standard errorfor this statistic is known and the confidence level can be ob-tained [63]. The standard error of κ is given by
SE(κ) =
√p(1 − p)
n(1 − pe)2 (8)
where n = (N −1)N2 is the total number of node pairs. The 95%
confidence interval for κ is κ − 1.96 ∗ SE(κ) to κ + 1.96 ∗SE(κ).
IV. MATERIALS
In this section, we briefly explain the datasets used in thispaper. We first present the details of EEG data and the compu-tation of effective connectivity for this data. We then describethe two simulated data sets generated for the evaluation of thealgorithms presented in this paper. The first dataset is gener-ated to illustrate the importance of edge direction informationfor revealing the real structure of a directed network. The sec-ond dataset is generated for verifying the effectiveness of theproposed group analysis method.
A. EEG Data
Participants: EEG data from ten undergraduates at MichiganState University were drawn from an ongoing study of relation-ships between the error-related negativity (ERN) and individualdifferences.2 All participants retained for analysis made at leastsix errors since the ERN becomes stable and reliable at six er-rors [65]. No participants discontinued their involvement oncethe experiment had begun.
2Participants for the present analysis were drawn from samples reportedin [64].
1924 IEEE TRANSACTIONS ON BIOMEDICAL ENGINEERING, VOL. 61, NO. 7, JULY 2014
Task: Participants completed a letters version of the EriksenFlanker task [66]. Stimuli were presented on a Pentium R DualCore computer, using Presentation software (Neurobehavioralsystems, Inc.) to control the presentation and timing of stimuli,the determination of response accuracy, and the measurementof reaction times. During the task, participants were presentedwith a string of five letters. Each five-letter string was eithercongruent (e.g., FFFFF) or incongruent (e.g., EEFEE) and par-ticipants were required to respond to the center letter (target)via the left or right mouse button. Trial types were varied ran-domly such that 50% of the trials were congruent. Letters weredisplayed in a standard white font on a black background andsubtended 1.3◦ of visual angle vertically and 9.2◦ horizontally.A standard fixation mark (+) was presented during the inter-trial interval (ITI). Each trial began with the presentation of theflanking letters (i.e., EE EE). Flanking letters remained on thescreen for 35 ms and were followed by the target (i.e., EEFEE),which remained for 100 ms (135 ms total presentation time).Each trial was followed by a variable ITI (1200 − 1700 ms).The entire experimental session consisted of 480 trials groupedinto six blocks of 80 trials each. The letters constituting eachstring were varied between blocks (e.g., M and N in block 1 andE and F in block 2) and response-mappings were reversed atthe midpoint of each block (e.g., left mouse-button click for Mthrough 40 trials of block 1, then right-mouse button click forM for the last 40 trials of block 1) in order to elicit a sufficientnumber of errors for ERN calculation.
Psychophysiological data recording, reduction, andanalysis: Continuous electroencephalographic (EEG) activitywas recorded by 64 Ag–AgCl electrodes placed in accordancewith the 10/20 system. Electrodes were fitted in a BioSemi(BioSemi, Amsterdam, The Netherlands) stretch-lycra cap.In addition, two electrodes were placed on the left and rightmastoids. The electro-oculogram generated by eye-movementsand blinks were recorded by FP1, as well as by electrodesplaced below the right eye and on the left and right outer canthi,all approximately 1 cm from the pupil. During data acquisition,the common mode sense active electrode and driven right legpassive electrode formed the ground, as per BioSemi’s designspecifications [67]. These two electrodes serve a groundingfunction in place of a typical ground electrode. They providea feedback loop to keep the subject’s average voltage as closeto zero as possible. All bioelectric signals were digitized at512 Hz using ActiView software (BioSemi). Offline analysiswas performed using BrainVision Analyzer 2 (BrainProducts,Gilching, Germany). Scalp electrode recordings were reref-erenced to the numeric mean of the mastoids and band-passfiltered with cutoffs of 0.1 and 30 Hz (12 dB/oct rolloff). Ocularartifacts were then corrected using the regression methoddeveloped by Gratton et al. [68]. Response-locked data weresegmented into individual epochs beginning 200 ms prior tothe response and continued for 1000 ms. Individual trials wererejected on the basis of excessive physiological activity: avoltage step exceeding 50μV between contiguous samplingpoints, a voltage difference of more than 200μV within a trial,or a maximum voltage difference less than 0.5 mV within atrial. The average correct response negativity (CRN) and ERN
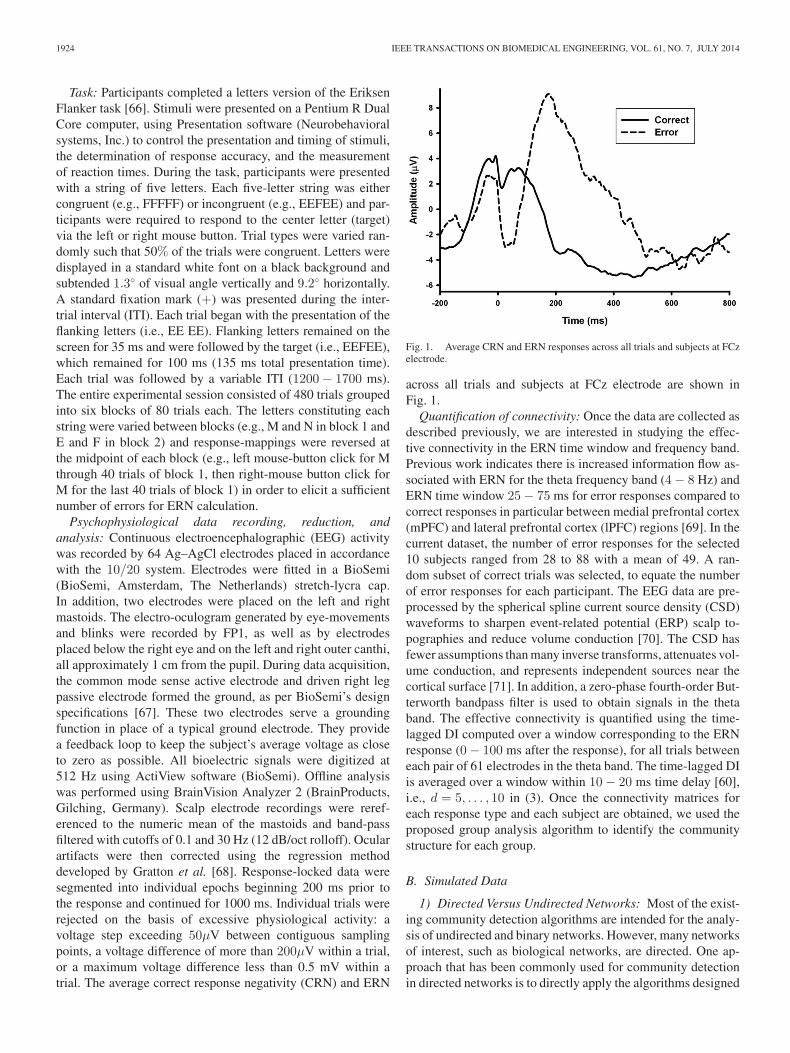
Fig. 1. Average CRN and ERN responses across all trials and subjects at FCzelectrode.
across all trials and subjects at FCz electrode are shown inFig. 1.
Quantification of connectivity: Once the data are collected asdescribed previously, we are interested in studying the effec-tive connectivity in the ERN time window and frequency band.Previous work indicates there is increased information flow as-sociated with ERN for the theta frequency band (4 − 8 Hz) andERN time window 25 − 75 ms for error responses compared tocorrect responses in particular between medial prefrontal cortex(mPFC) and lateral prefrontal cortex (lPFC) regions [69]. In thecurrent dataset, the number of error responses for the selected10 subjects ranged from 28 to 88 with a mean of 49. A ran-dom subset of correct trials was selected, to equate the numberof error responses for each participant. The EEG data are pre-processed by the spherical spline current source density (CSD)waveforms to sharpen event-related potential (ERP) scalp to-pographies and reduce volume conduction [70]. The CSD hasfewer assumptions than many inverse transforms, attenuates vol-ume conduction, and represents independent sources near thecortical surface [71]. In addition, a zero-phase fourth-order But-terworth bandpass filter is used to obtain signals in the thetaband. The effective connectivity is quantified using the time-lagged DI computed over a window corresponding to the ERNresponse (0 − 100 ms after the response), for all trials betweeneach pair of 61 electrodes in the theta band. The time-lagged DIis averaged over a window within 10 − 20 ms time delay [60],i.e., d = 5, . . . , 10 in (3). Once the connectivity matrices foreach response type and each subject are obtained, we used theproposed group analysis algorithm to identify the communitystructure for each group.
B. Simulated Data
1) Directed Versus Undirected Networks: Most of the exist-ing community detection algorithms are intended for the analy-sis of undirected and binary networks. However, many networksof interest, such as biological networks, are directed. One ap-proach that has been commonly used for community detectionin directed networks is to directly apply the algorithms designed

LIU et al.: NETWORK COMMUNITY STRUCTURE DETECTION FOR DIRECTIONAL NEURAL NETWORKS 1925
for undirected networks without considering the edge directioninformation [27]. To illustrate the importance of edge directioninformation for community detection, we generated a simulateddirected network and compared the performance of two ap-proaches for detecting the community structure of this network.The first approach is to apply the proposed algorithm to theassociation matrix of the directed network A directly and thesecond approach is to ignore the edge direction information andapply the original Blondel’s algorithm to the association matrixof the undirected network 1
2 (A + AT ), where AT is the trans-pose of A. The simulated network consisted of 24 nodes and2 clusters, each cluster with 12 nodes. Nodes 1 to 12 were inthe same cluster, while the rest were in the other cluster. Theedges within each cluster were generated from a uniform distri-bution in the interval [0.3, 0.7], while the intercluster edges fromcluster 1 to 2 were uniformly distributed in the interval [0, 0.3]and the inter-cluster edges from cluster 2 to 1 were uniformlydistributed in the interval [0.7, 1.0]. In this case, all of the en-tries of A were in the [0, 1] interval, and A was not symmetric.Without loss of generality, we generated this network 100 timesand the average Cohen’s Kappa score for both approaches wereobtained.
2) Simulated Networks for Group Analysis: To compare theeffectiveness of the proposed group analysis method to existingmethods, we generated a group of ten directed networks with thesame community structure. Each network consisted of 64 nodesand 4 clusters, each cluster with 16 nodes. In order to reflectthe statistical properties of the connectivity networks obtainedfrom the EEG data, we used the empirical directed informationdata from the 10 subjects to select the inter- and intracluster edgevalues of the simulated networks. Moreover, in order to get well-defined clusters, the intracluster edges should have low variancewhereas the intercluster edges should have high variance. Foreach simulated network, we sorted all of the DI values from thecorresponding subject and split them into ten deciles. All edgeswithin one cluster, i.e., intracluster connections, were uniformlysampled with replacement from one of the four highest deciles.The edges between clusters, on the other hand, were sampledwith replacement from the whole population of DI values wherethe sampling weights were generated from a normal distribution.The mean of the normal distribution is equal to the mean ofDI values in the lowest decile, which increases the probabilityof choosing lower edge values. This procedure ensures thatthe intercluster edges simultaneously have a low mean and ahigh variance. Without loss of generality, we generated 100simulations of the networks to compute the average Cohen’sKappa score.
We also compared the performance of the proposed algorithmwith VTS and IS for a case with outliers. For this purpose, wegenerated a group of ten directed networks with eight of themhaving the same community structure as described above. Theother two networks each consisted of a single cluster, where allof the edge values in each network were uniformly sampled withreplacement across the 4th and 5th deciles of the correspondingsubject’s DI values. Without loss of generality, we generated300 simulations of the networks to compute the average Cohen’sKappa score.
Fig. 2. Community membership matrices for (a) actual community structure,(b) community structure obtained from the proposed algorithm which considersedge direction information, and (c) community structure obtained from Blon-del’s original algorithm which does not consider edge direction. Ivory indicatesthat the corresponding node pairs are not in the same cluster (cluster N/A). Grayindicates that the corresponding node pairs are in cluster 1. Brown indicates thatthe corresponding node pairs are in cluster 2.
V. RESULTS
A. Directed Versus Undirected Networks
To verify the importance of edge direction information, theproposed algorithm is applied to the directed network describedin Section IV-B1. The community detection results are shownin Fig. 2. We observe that the proposed algorithm can detect thecommunity structure of the network if we use the edge direc-tion information [see Fig. 2(b)], whereas the original algorithm(Blondel’s algorithm) designed for undirected networks fails tocapture the actual community structure [see Fig. 2(c)]. Cohen’sKappa score is used to evaluate the performance of these two ap-proaches. If the edge direction is taken into account, the mean ofκ is 1 and 0.0011 otherwise. The average standard error SE(κ) is0 for the proposed algorithm and 0.0417 otherwise. Therefore,our algorithm can reveal the real structure of the directed net-work better than conventional clustering algorithms designedfor undirected networks. In fact, when the association matrixof a network is strongly asymmetric, the community detectionresults between directed and undirected representations of thenetwork will be quite different. In these situations, the com-munity detection algorithms based on the directed weightedgraphs can reveal the real community structure of the network,whereas conventional community detection algorithms, whichdetect communities without considering the edge direction, blurthe underlying community structure.
B. Group Analysis on Synthetic Data
Three different group analysis strategies, Algorithm 2 (withand without excluding the outliers), VTS, and IS, are appliedon the simulated data described in Section IV-B2 with the re-sults presented in Tables II and III. The proposed algorithm isapplied in two different ways: excluding the changes in modu-larity outside the 25%th and 75%th percentiles (as described inSection III-B) and including all of the networks in the compu-tation of change in modularity.
Table II presents the performance of the different algorithmswhen applied to the group of ten networks with the same struc-ture. We observe that the proposed algorithm and the VTS bothoutperform the IS approach with a higher mean Cohen’s Kappascore and a lower standard error, which indicates that the pro-posed method can provide more robust solutions to the groupanalysis problem. Moreover, the proposed algorithm without

1926 IEEE TRANSACTIONS ON BIOMEDICAL ENGINEERING, VOL. 61, NO. 7, JULY 2014
TABLE IIAVERAGE COHEN’S KAPPA FOR GROUP ANALYSIS (NO OUTLIERS IN THE DATA)
TABLE IIIAVERAGE COHEN’S KAPPA FOR GROUP ANALYSIS METHODS WITH TWO OUTLIERS IN THE GROUP
excluding any of the networks performs the best, since in thiscase the community structure is stable across the group andincluding more samples in the computation of change in modu-larity improves the accuracy of the community detection algo-rithm. In addition, a two-sided Wilcoxon rank sum test is usedto test the null hypothesis that the distributions of the Cohen’sKappa values across 100 simulations using Algorithm 2 and thatusing VTS or IS are from the same continuous distributions withequal medians. The p-values for these two comparisons are 1and 9.2924 × 10−45 , respectively, which indicates that the nullhypothesis cannot be rejected for the comparison between Algo-rithm 2 and VTS at 5% significance level. Conversely, the nullhypothesis that the distributions of Cohen’s Kappa values fromAlgorithm 2 and IS are the same is rejected at 5% significancelevel.
For the case with two outliers in a group of ten networks,the results are presented in Table III. We observe that the pro-posed algorithm, with and without excluding the outliers, hasthe highest mean Cohen’s Kappa score and the lowest standarderror. In addition, Algorithm 2 with the outliers outside of the25%th and 75%th percentiles excluded performs the best, sincethe removal of the outliers impacts the change of the modularityfunction for the whole group and reveals a common communitystructure that is more consistent across networks. These resultsindicate that Algorithm 2 reduces the effect of outliers withoutmaking any assumptions about the data. Since all of our data aregenerated from empirical DI values, this finding also suggeststhat our method is the most suitable for group analysis of EEGdata. The increased performance of our method can be attributedto two key factors. First, in VTS, averaging the data may reducethe variance of modularity across subjects and blur the commu-nity structure. On the other hand, IS may easily be affected byoutliers or networks with nondistinct community structure. Sec-ond, our method maximizes the modularity at the algorithmiclevel at each step and thus reduces the effect of outliers.
Similar to the previous analysis, a two-sided Wilcoxon ranksum test is used to test the null hypothesis that Cohen’s Kappavalues across 300 simulations using Algorithm 2 and that us-ing VTS or IS are from the same continuous distributions withequal medians. The obtained p-values are 7.1711 × 10⁻¹⁵ and1.7886 × 10−124 , respectively, which indicates that the null hy-pothesis that the distribution of the Cohen’s Kappa values fromAlgorithm 2 and VTS(IS) are the same can be rejected at 5%significance level for both comparisons.
C. Group Analysis on EEG Data
Previous work indicates that there is increased informationflow associated with ERN for the theta frequency band (4−8Hz) and ERN time window (25−75) ms for error responsescompared to correct responses in particular between mPFC andlPFC regions [69]. We applied Algorithm 2 to the associationmatrices quantified by DI for the ten subjects for error andcorrect responses. The clustering results at all levels for eachgroup are presented in Fig. 3. The number of partition levelsfor both CRN and ERN are 3. Since the modularity function foreach response type achieves its maximum at the top (final) level,we interpret the partitions at the top (final) level for each group.The third level of partition for CRN has four large clusters, i.e.,anterior-central, left-posterior, right posterior, and some nodes inthe central region. The third level of partition for ERN has threelarge modules, i.e., left anterior-central region, right anterior-central region, and the posterior region. Compared to CRN,central nodes and anterior nodes are more closely connectedfor ERN, which indicates that the medial cortex and right lPFCregions work together when an error occurs. In addition, forERN the left and right lateral nodes are assigned to separateclusters indicating functional specialization. We also notice thatthe clusters in the posterior region for the two response typesare different. For ERN, the posterior nodes are more tightlyconnected resulting in a single cluster compared to CRN, whichindicates close cooperation among nodes in this region.
In addition, we investigate the significance of the direction-ality of the interactions within clusters for the final level ofpartitioning for each response type. We use Y -bootstrapping,which is a stationary bootstrap method proposed in [72] andused for assessing the significance of causality in EEG stud-ies [73]. In order to test the null hypothesis of nondirectionalinformation flow, the causal structure between time series X andY is destroyed. To be specific, for each electrode pair with timeseries X and Y, if the significance of the directionality X → Yis tested, the time series X is resampled on a block basis 100times to generate new observations X∗
m ,m = 1, . . . , 100. Theblock-based resampling is performed as follows. First, blocksof length Li are randomly drawn with replacement from theoriginal time series. The length of each block is drawn froma geometric distribution. Data are wrapped in a circular waysuch that at the end of a time series a block can be drawnby adding observations from the beginning of the time series.The p-value of DI(X → Y) is computed from the bootstrap

LIU et al.: NETWORK COMMUNITY STRUCTURE DETECTION FOR DIRECTIONAL NEURAL NETWORKS 1927
Fig. 3. Results of the hierarchical multisubject community detection algorithmfor ten subjects in each group (CRN (b), (d), and (f) and ERN (c), (e), and (g)).(a) EEG 10–20 system. (b) CRN: level 1. (c) ERN: level 1. (d) CRN: level 2.(e) ERN: level 2. (f) CRN: level 3. (g) ERN: level 3.
distribution, DI(X∗m → Y),m = 1, . . . , 100. In order to con-
trol the error rates for multiple hypothesis testing for all pairsof electrodes within a cluster, the method proposed by Gen-ovese et al. is used [74]. To implement this procedure, for elec-trode pairs in the same cluster, their p-values across subjects arepooled and sorted from smallest to largest, p1 ≤ p2 · · · ≤ pV ,where V is the total number of electrode pairs in that clustertimes the number of subjects. To control the false discovery ratebound q at 0.05, the largest i for which pi ≤ i
V q is computed
Fig. 4. Directionality of information flow within clusters. (a) Directional infor-mation flow for the last level of partitioning for CRN. (b) Directional informationflow for the last level of partitioning for ERN.
and is selected as the threshold, pr , for this sequence of p-values.For each subject, if the p-value for DI(X → Y) is less than pr ,then the directed information flow from X to Y is significant;otherwise, it is not significant. Electrode pairs between whichthe information flow is significant in all ten subjects are shownin Fig. 4. We observe that the information flow is directional for
1928 IEEE TRANSACTIONS ON BIOMEDICAL ENGINEERING, VOL. 61, NO. 7, JULY 2014
both CRN and ERN. For ERN, there is a clear directional flowfrom the central to the frontal electrodes in the anterior-centralregion.
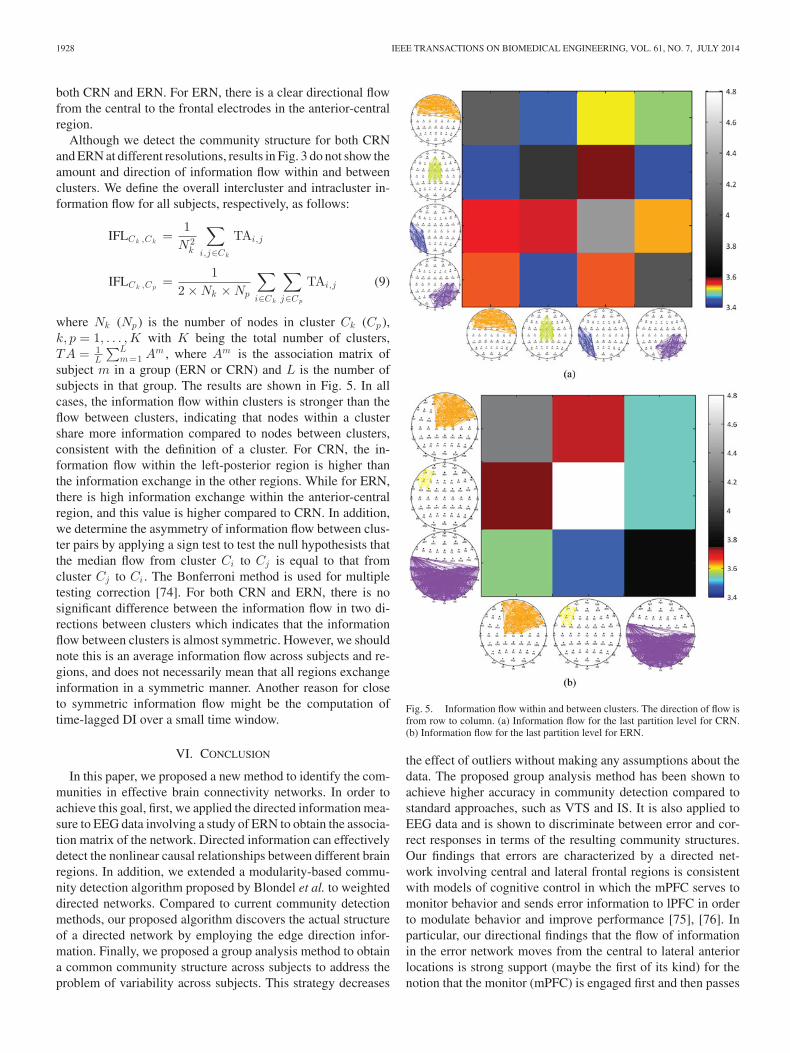
Although we detect the community structure for both CRNand ERN at different resolutions, results in Fig. 3 do not show theamount and direction of information flow within and betweenclusters. We define the overall intercluster and intracluster in-formation flow for all subjects, respectively, as follows:
IFLCk ,Ck=
1N 2
k
∑
i,j∈Ck
TAi,j
IFLCk ,Cp=
12 × Nk × Np
∑
i∈Ck
∑
j∈Cp
TAi,j (9)
where Nk (Np ) is the number of nodes in cluster Ck (Cp ),k, p = 1, . . . ,K with K being the total number of clusters,TA = 1
L
∑Lm=1 Am , where Am is the association matrix of
subject m in a group (ERN or CRN) and L is the number ofsubjects in that group. The results are shown in Fig. 5. In allcases, the information flow within clusters is stronger than theflow between clusters, indicating that nodes within a clustershare more information compared to nodes between clusters,consistent with the definition of a cluster. For CRN, the in-formation flow within the left-posterior region is higher thanthe information exchange in the other regions. While for ERN,there is high information exchange within the anterior-centralregion, and this value is higher compared to CRN. In addition,we determine the asymmetry of information flow between clus-ter pairs by applying a sign test to test the null hypothesists thatthe median flow from cluster Ci to Cj is equal to that fromcluster Cj to Ci . The Bonferroni method is used for multipletesting correction [74]. For both CRN and ERN, there is nosignificant difference between the information flow in two di-rections between clusters which indicates that the informationflow between clusters is almost symmetric. However, we shouldnote this is an average information flow across subjects and re-gions, and does not necessarily mean that all regions exchangeinformation in a symmetric manner. Another reason for closeto symmetric information flow might be the computation oftime-lagged DI over a small time window.
VI. CONCLUSION
In this paper, we proposed a new method to identify the com-munities in effective brain connectivity networks. In order toachieve this goal, first, we applied the directed information mea-sure to EEG data involving a study of ERN to obtain the associa-tion matrix of the network. Directed information can effectivelydetect the nonlinear causal relationships between different brainregions. In addition, we extended a modularity-based commu-nity detection algorithm proposed by Blondel et al. to weighteddirected networks. Compared to current community detectionmethods, our proposed algorithm discovers the actual structureof a directed network by employing the edge direction infor-mation. Finally, we proposed a group analysis method to obtaina common community structure across subjects to address theproblem of variability across subjects. This strategy decreases
Fig. 5. Information flow within and between clusters. The direction of flow isfrom row to column. (a) Information flow for the last partition level for CRN.(b) Information flow for the last partition level for ERN.
the effect of outliers without making any assumptions about thedata. The proposed group analysis method has been shown toachieve higher accuracy in community detection compared tostandard approaches, such as VTS and IS. It is also applied toEEG data and is shown to discriminate between error and cor-rect responses in terms of the resulting community structures.Our findings that errors are characterized by a directed net-work involving central and lateral frontal regions is consistentwith models of cognitive control in which the mPFC serves tomonitor behavior and sends error information to lPFC in orderto modulate behavior and improve performance [75], [76]. Inparticular, our directional findings that the flow of informationin the error network moves from the central to lateral anteriorlocations is strong support (maybe the first of its kind) for thenotion that the monitor (mPFC) is engaged first and then passes
LIU et al.: NETWORK COMMUNITY STRUCTURE DETECTION FOR DIRECTIONAL NEURAL NETWORKS 1929
critical performance information on to the controller (lPFC) thatimplements the control.
Future work will focus on improvements to the implementa-tion of the proposed community detection algorithm. The pro-posed algorithm is based on the optimization of modularity.However, modularity optimization encounters the problem ofresolution limit, which indicates that it may miss detecting clus-ters whose size is comparatively small to the whole graph [38].Therefore, it would be of interest to investigate and extend meth-ods that do not depend on modularity optimization, e.g., theMarkov Clustering algorithm based on the dynamical evolutionof walkers moving on the graph [77], to find the common com-munities across a group of weighted directed networks. In ad-dition, one can consider overlapping communities by extendingthe current framework to consider multiple community mem-berships. The proposed community detection framework foreffective connectivity networks can also be applied to networksobtained through other measures of causality such as Grangercausality-based measures or phase slope index [78]. This workcan also be extended to dynamic networks and detect the changeof modules across time and frequency [79]. Finally, the proposedmethods are applied to signals obtained through a CSD trans-formation of the scalp EEG data, and thus the inferred effectiveconnectivity patterns are limited in terms of spatial localiza-tion. This problem can be addressed by estimating the corticalcurrent density distribution from the scalp EEG [80], and thenapplying DI which would allow for a stronger inference of theinter-regional connectivity in the source domain.
REFERENCES
[1] Y. Liu, J. Moser, and S. Aviyente, “Community detection for directionalneural networks inferred from EEG data,” in Proc. Annu. Int. Conf. IEEEEng. Med. Biol. Soc., 2011, pp. 7155–7158.
[2] B. He, L. Yang, C. Wilke, and H. Yuan, “Electrophysiological imaging ofbrain activity and connectivity challenges and opportunities,” IEEE Trans.Biomed. Eng., vol. 58, no. 7, pp. 1918–1931, Jul. 2011.
[3] K. J. Friston, “Modalities, modes, and models in functional neuroimag-ing,” Science, vol. 326, no. 5951, pp. 399–403, 2009.
[4] B. He, T. Coleman, G. M. Genin, G. Glover, X. Hu, N. Johnson, T. Liu,S. Makeig, P. Sajda, and K. Ye, “Grand challenges in mapping the humanbrain: NSF workshop report,” IEEE Trans. Biomed. Eng., vol. 60, no. 11,pp. 2983–2992, 2013.
[5] S. Mori, K. Oishi, and A. V. Faria, “White matter atlases based on diffusiontensor imaging,” Curr. Opin. Neurol., vol. 22, no. 4, pp. 362–369, 2009.
[6] K. Friston, “Functional and effective connectivity: A review,” Brain Con-nect., vol. 1, no. 1, pp. 13–36, 2011.
[7] E. Pereda, R. Q. Quiroga, and J. Bhattacharya, “Nonlinear multivariateanalysis of neurophysiological signals,” Progr. Neurobiol., vol. 77, pp. 1–37, 2005.
[8] O. David, D. Cosmelli, and K. J. Friston, “Evaluation of different mea-sures of functional connectivity using a neural mass model,” Neuroimage,vol. 21, no. 2, pp. 659–673, 2004.
[9] G. L. Gerstein and D. H. Perkel, “Simultaneously recorded trains of ac-tion potentials: analysis and functional interpretation,” Science, vol. 164,no. 3881, pp. 828–830, 1969.
[10] E. Bullmore and O. Sporns, “Complex brain networks: graph theoreticalanalysis of structural and functional systems,” Nat. Rev. Neurosci., vol. 10,no. 3, pp. 186–198, 2009.
[11] M. Rubinov and O. Sporns, “Complex network measures of brain connec-tivity: Uses and interpretations,” Neuroimage, vol. 52, no. 3, pp. 1059–1069, 2010.
[12] D. Bassett and E. Bullmore, “Small-world brain networks,” Neuroscien-tist, vol. 12, no. 6, pp. 512–523, 2006.
[13] O. Sporns and J. D. Zwi, “The small world of the cerebral cortex,” Neu-roinformatics, vol. 2, no. 2, pp. 145–162, 2004.
[14] S. Achard, R. Salvador, B. Whitcher, J. Suckling, and E. Bullmore, “Aresilient, low-frequency, small-world human brain functional network withhighly connected association cortical hubs,” J. Neurosci., vol. 26, no. 1,pp. 63–72, 2006.
[15] S. Achard and E. Bullmore, “Efficiency and cost of economical brainfunctional networks,” PLoS Computat. Biol., vol. 3, no. 2, e17,2007. doi:10.1371/journal.pcbi.0030017.
[16] E. Ravasz and A.-L. Barabasi, “Hierarchical organization in complexnetworks,” Phys. Rev. E, vol. 67, no. 2, pp. 026112-1–026112-12, 2003.doi: 10.1103/PhysRevE.67.026112.
[17] C. Zhou, L. Zemanova, G. Zamora, C. C. Hilgetag, and J. Kurths, “Hierar-chical organization unveiled by functional connectivity in complex brainnetworks,” Phys. Rev. Lett., vol. 97, no. 23, pp. 238103-1–238103-4, 2006.doi: 10.1103/PhysRevLett.97.238103.
[18] M. Barthelemy, “Betweenness centrality in large complex networks,” Eur.Phys. J. B-Condens. Matter Complex Syst., vol. 38, no. 2, pp. 163–168,2004.
[19] O. Sporns, C. J. Honey, and R. Kotter, “Identification and classifica-tion of hubs in brain networks,” PloS one, vol. 2, no. 10, e1049, 2007,doi:10.1371/journal.pone.0001049.
[20] M. Girvan and M. E. J. Newman, “Community structure in social andbiological networks,” Proc. Nat. Acad. Sci. USA, vol. 99, no. 12, pp. 7821–7826, 2002.
[21] M. Chavez, M. Valencia, V. Navarro, V. Latora, and J. Martinerie, “Func-tional modularity of background activities in normal and epileptic brainnetworks,” Phys. Rev. Lett., vol. 104, no. 11, 118701, 4 pp., 2010. doi:10.1103/PhysRevLett.104.118701.
[22] A. J. Schwarz, A. Gozzi, and A. Bifone, “Community structure and mod-ularity in networks of correlated brain activity,” Magnet. Reson. Imag.,vol. 26, no. 7, pp. 914–920, 2008.
[23] M. E. J. Newman, “Detecting community structure in networks,” Eur.Phys. J. B-Condens. Matter Complex Syst., vol. 38, no. 2, pp. 321–330,2004.
[24] L. Ferrarini, I. M. Veer, E. Baerends, M.-J. van Tol, R. J. Renken, N.J.A. van der Wee, D. J. Veltman, A. Aleman, F. G. Zitman, B. W. J. H.Penninx, M. A. van Buchem, J. H. C. Reiber, S. A. R. B. Rombouts, andJ. Milles, “Hierarchical functional modularity in the resting-state humanbrain,” Human Brain Mapp., vol. 30, no. 7, pp. 2220–2231, 2009.
[25] D. A. Fair, A. L. Cohen, J. D. Power, N. U. Dosenbach, J. A. Church,F. M. Miezin, B. L. Schlaggar, and S. E. Petersen, “Functional brain net-works develop from a “local to distributed” organization,” PLoS Computat.Biol., vol. 5, no. 5, pp. 1–14, 2009.
[26] D. Meunier, S. Achard, A. Morcom, and E. Bullmore, “Age-relatedchanges in modular organization of human brain functional networks,”Neuroimage, vol. 44, no. 3, pp. 715–723, 2009.
[27] E. A. Leicht and M. E. J. Newman, “Community structure in directednetworks,” Phys. Rev. Lett., vol. 100, no. 11, 118703, 4 pp., 2008. doi:10.1103/PhysRevLett.100.118703.
[28] Y. Liu and S. Aviyente, “Directed information measure for quantifyingthe information flow in the brain,” in Proc. Int. Conf. IEEE, Eng. Med.Biol. Soc., 2009, pp. 2188–2191.
[29] Y. Liu and S. Aviyente, “Quantification of effective connectivity in thebrain using a measure of directed information,” Computat. Math. MethodsMed., vol. 2012, pp. 1–16, 2012.
[30] J. Massey, “Causality, feedback, and directed information,” in Proc. Symp.Inf. Theory Appl., 1990, pp. 27–30.
[31] H. Hinrichs, T. Noesselt, and H. J. Heinze, “Directed information flowmodel free measure to analyze causal interactions in event related EEG-MEG-experiments,” Human Brain Mapp., vol. 29, no. 2, pp. 193–206,2008.
[32] A. Rao, A. O. Hero, III, D. J. States, and J. D. Engel, “Using directedinformation to build biologically relevant influence networks,” in Proc.Computat. Syst. Bioinformat., 2007, pp. 145–156.
[33] C. J. Quinn, T. P. Coleman, N. Kiyavash, and N. G. Hatsopoulos, “Esti-mating the directed information to infer causal relationships in ensembleneural spike train recordings,” J. Comput. Neurosci., vol. 30, no. 1, pp. 17–44, 2011.
[34] V. D. Blondel, J. L. Guillaume, R. Lambiotte, and E. Lefebvre, “Fastunfolding of communities in large networks,” J. Statist. Mech., TheoryExp., vol. 2008, P10008, 12 pp., 2008.
[35] M. E. J. Newman, “Modularity and community structure in networks,”Proc. Nat. Acad. Sci., vol. 103, no. 23, pp. 8577–8582, 2006.
[36] C. Dorso and A. Medus, “Community detection in networks,” Int. J.Bifurcat. Chaos, vol. 20, no. 02, pp. 361–367, 2010.
[37] J. Duch and A. Arenas, “Community detection in complex networks usingextremal optimization,” Phys. Rev. E, vol. 72, no. 2, 027104, 4 pp., 2005.doi: 10.1103/PhysRevE.72.027104.
1930 IEEE TRANSACTIONS ON BIOMEDICAL ENGINEERING, VOL. 61, NO. 7, JULY 2014
[38] S. Fortunato, “Community detection in graphs,” Phys. Rep., vol. 486,no. 3-5, pp. 75–174, 2010.
[39] U. Von Luxburg, “A tutorial on spectral clustering,” Statist. Comput.,vol. 17, no. 4, pp. 395–416, 2007.
[40] A. Arenas, J. Duch, A. Fernandez, and S. Gomez, “Size reduction ofcomplex networks preserving modularity,” New J. Phys., vol. 9, 176, 15pp., 2007.
[41] M. E. J. Newman, “Fast algorithm for detecting community structurein networks,” Phys. Rev. E, vol. 69, no. 6, 066133, 5 pp., 2004. doi:10.1103/PhysRevE.69.066133.
[42] M. E. Newman and E. A. Leicht, “Mixture models and exploratory anal-ysis in networks,” Proc. Nat. Acad. Sci., vol. 104, no. 23, pp. 9564–9569,2007.
[43] R. Guimera, M. Sales-Pardo, and L. A. N. Amaral, “Module identificationin bipartite and directed networks,” Phys. Rev. E, vol. 76, no. 3, 036102,8 pp., 2007. doi: 10.1103/PhysRevE.76.036102.
[44] D. Meunier, R. Lambiotte, A. Fornito, K. D. Ersche, and E. T. Bullmore,“Hierarchical modularity in human brain functional networks,” Front.Neuroinformat., vol. 3, pp. 1–12, 2009.
[45] J. Li, Z. J. Wang, S. J. Palmer, and M. J. McKeown, “Dynamic Bayesiannetwork modeling of fMRI: A comparison of group-analysis methods,”NeuroImage, vol. 41, no. 2, pp. 398–407, 2008.
[46] A. Mechelli, W. D. Penny, C. J. Price, D. R. Gitelman, and K. J. Friston,“Effective connectivity and intersubject variability: Using a multisubjectnetwork to test differences and commonalities,” Neuroimage, vol. 17,no. 3, pp. 1459–1469, 2002.
[47] G. Karypis and V. Kumar, “A fast and high quality multilevel scheme forpartitioning irregular graphs,” SIAM J. Scientif. Comput., vol. 20, no. 1,pp. 359–392, 1998.
[48] A. Strehl and J. Ghosh, “Cluster ensembles—A knowledge reuse frame-work for combining multiple partitions,” J. Mach. Learn. Res., vol. 3,pp. 583–617, 2003.
[49] N. M. Correa, T. Adali, Y. O. Li, and V. D. Calhoun, “Canonical correla-tion analysis for data fusion and group inferences,” IEEE Signal Process.Mag., vol. 27, no. 4, pp. 39–50, 2010.
[50] C. W. J. Granger, “Testing for causality: A personal viewpoint,” J. Econ.Dyn. Control, vol. 2, pp. 329–352, 1980.
[51] L. A. Baccala and K. Sameshima, “Partial directed coherence: A newconcept in neural structure determination,” Biolog. Cybern., vol. 84, no. 6,pp. 463–474, 2001.
[52] K. Friston, L. Harrison, and W. Penny, “Dynamic causal modelling,”Neuroimage, vol. 19, no. 4, pp. 1273–1302, 2003.
[53] S. Shimizu, P. Hoyer, A. Hyvarinen, and A. Kerminen, “A linear non-gaussian acyclic model for causal discovery,” J. Mach. Learn. Res., vol. 7,pp. 2003–2030, 2006.
[54] T. Schreiber, “Measuring information transfer,” Phys. Rev. Lett., vol. 85,no. 2, pp. 461–464, 2000.
[55] Y. Saito and H. Harashima, Recent Advances in EEG and EMG DataProcessing. Amsterdam, The Netherlands: Elsevier, 1981.
[56] P. O. Amblard and O. J. Michel, “On directed information theory andgranger causality graphs,” J. Computat. Neurosci., vol. 30, no. 1, pp. 7–16, 2010.
[57] G. Kramer, “Capacity results for the discrete memoryless network,” IEEETrans. Inf. Theory, vol. 49, no. 1, pp. 4–21, Jan. 2003.
[58] E. G. Miller, “A new class of entropy estimators for multi-dimensionaldensities,” in Proc. IEEE Int. Conf. Acoust., Speech, Signal Process., 2003,vol. 3, pp. 297–300.
[59] G. A. Darbellay and I. Vajda, “Estimation of the information by an adaptivepartitioning of the observation space,” IEEE Trans. Inf. Theory, vol. 45,no. 4, pp. 1315–1321, May 1999.
[60] Y. Liu and S. Aviyente, “Time-lagged directed information,” in Proc. IEEEIntl. Conf. Acoust., Speech Signal Process., 2011, pp. 3864–3867.
[61] W. H. Press, B. P. Flannery, S. A. Teukolsky, and W. T. Vettering, Nu-merical recipes: The art of scientific computing, 3rd ed. ed. Cambridge,U.K.: Cambridge Univ. Press, 2007.
[62] J. Cohen, “Weighted kappa: Nominal scale agreement provision for scaleddisagreement or partial credit.,” Psycholog. Bull., vol. 70, no. 4, pp. 213–220, 1968.
[63] J. Garner, “The standard error of cohen’s kappa,” Statist. Med., vol. 10,no. 5, pp. 767–775, 2006.
[64] J. S. Moser, H. S. Schroder, C. Heeter, T. P. Moran, and Y.-H. Lee, “Mindyour errors: Evidence for a neural mechanism linking growth mindsetto adaptive post-error adjustments,” Psycholog. Sci., vol. 22, no. 12, pp.1484–1489, 2011.
[65] D. M. Olvet and G. Hajcak, “The stability of error-related brain activitywith increasing trials,” Psychophysiology, vol. 46, no. 5, pp. 957–961,2009.
[66] B. A. Eriksen and C. W. Eriksen, “Effects of noise letters upon the identifi-cation of a target letter in a nonsearch task,” Percept. Psychophys., vol. 16,no. 1, pp. 143–149, 1974.
[67] [Online]. Available:http://www.biosemi.com/faq/cms&drl.htm[68] G. Gratton, M. G. H. Coles, and E. Donchin, “A new method for off-
line removal of ocular artifact,” Electroencephalogr. Clin. Neurophysiol.,vol. 55, no. 4, pp. 468–484, 1983.
[69] S. Aviyente, E. Bernat, W. Evans, and S. Sponheim, “A phase synchronymeasure for quantifying dynamic functional integration in the brain,”Human Brain Mapp., vol. 32, no. 1, pp. 80–93, 2011.
[70] J. Kayser and C. E. Tenke, “Principal components analysis of Laplacianwaveforms as a generic method for identifying ERP generator patterns—Part I: Evaluation with auditory oddball tasks,” Clin. Neurophysiol.,vol. 117, no. 2, pp. 348–368, 2006.
[71] C. Tenke and J. Kayser, “Generator localization by current source density(CSD): Implications of volume conduction and field closure at intracranialand scalp resolutions,” Clin. Neurophysiol., vol. 123, no. 12, pp. 2328–2345, 2012.
[72] D. N. Politis and J. P. Romano, “The stationary bootstrap,” J. Amer. Statist.Assoc., vol. 89, no. 428, pp. 1303–1313, 1994.
[73] M. Chavez, J. Martinerie, and M. Le Van Quyen, “Statistical assessmentof nonlinear causality: Application to epileptic EEG signals,” J. Neurosci.Methods, vol. 124, no. 2, pp. 113–128, 2003.
[74] C. R. Genovese, N. A. Lazar, and T. Nichols, “Thresholding of statisticalmaps in functional neuroimaging using the false discovery rate,” Neu-roimage, vol. 15, no. 4, pp. 870–878, 2002.
[75] E. K. Miller and J. D. Cohen, “An integrative theory of prefrontal cortexfunction,” Annu. Rev. Neurosci., vol. 24, pp. 167–202, 2001.
[76] M. Botvinick, T. Braver, D. Barch, C. Carter, and J. Cohen, “Conflict mon-itoring and cognitive control,” Psycholog. Rev., vol. 108, no. 3, pp. 624–652, 2001.
[77] R. Sinatra, F. de Vico Fallani, L. Astolfi, F. Babiloni, F. Cincotti, D. Mattia,and V. Latora, “Cluster structure of functional networks estimated fromhigh-resolution EEG data,” Intl. J. Bifurcat. Chaos, vol. 19, no. 2, pp. 665–676, 2009.
[78] S. Haufe, V. Nikulin, K. Muller, and G. Nolte, “A critical assessment ofconnectivity measures for EEG data: A simulation study,” NeuroImage,vol. 64, pp. 120–133, 2012.
[79] S. Boccaletti, M. Ivanchenko, V. Latora, A. Pluchino, and A. Rapisarda,“Detecting complex network modularity by dynamical clustering,” Phys.Rev. E, vol. 75, no. 4, 045102, 4 pp., 2007, doi: 10.1103/Phys-RevE.75.045102.
[80] Z. Liu and B. He, “fMRI-EEG integrated cortical source imaging by useof time-variant spatial constraints,” NeuroImage, vol. 39, no. 3, pp. 1198–1214, 2008.
Authors’ photographs and biographies not available at the time of publication.