network discovery and fault detectionutdallas.edu/~bhd130030/network discovery and fault...
TRANSCRIPT
“NETWORK DISCOVERY AND FAULT DETECTION”
A PROJECT REPORT
Submitted by
Suhrud Thakkar (090420107021)
Chintan Choksi (090420107052)
Bijon Desai (090420107010)
Bhavin Shah (090420107062)
In fulfillment for the award of the degree
Of
BACHELOR OF ENGINEERING
In
COMPUTER ENGINEERING
Sarvajanik College of Engineering and Technology,
Surat.
Gujarat Technological University, Ahmedabad.
May, 2013

SARVAJANIK COLLEGE OF ENGINEERING AND TECHNOLOGY
Dr. R.K.DESAI MARG, ATHWALINES,
SURAT-395001
DEPARTMENT OF COMPUTER ENGINEERING
CERTIFICATE
Date : 21 / 05 / 2013
This is to certify that the project entitled Network Discovery and Fault
Detection has been carried out by Suhrud Thakkar (090420107021),
Chintan Choksi (090420107052), Bijon Desai (090420107010), Bhavin
Shah (090420107062), students of B.E.IV (CO), Semester-VIII, under my
guidance in fulfillment of the degree of Bachelor of Engineering in Computer
Engineering of Gujarat Technological University, Ahmedabad for the
academic year May-2013.
Signature of
Guide
-------------------------------------
Signature of
Head of the Department
-------------------------------------
(Prof. Keyur Rana)
Signature of Jury Members
------------------------------- , -------------------------------- , --------------------------------

I
Acknowledgement
Any person without practical knowledge is incomplete. He is just like “Diamond without
Polish”. To bring the spark out of the diamond it is necessary to polish it properly. Likewise to
make a Person perfect technically, it becomes necessary to polish him.
We would like to take this opportunity to bestow are acknowledgements to all the people who
have directly or indirectly been involved with us in making our project feasible and to run it up
into a successful piece of work.
We take a rather special privilege of thanking Mr. Alpesh Tank of SSM Infotech Pvt. Ltd.
who guided us throughout the project.
We also forward our special thanks to Prof. Vaikhari Deodhar for making this project a
success.
Finally, we thank to our entire friend and other people who were continuous source of inspiration
throughout the project development.
Thanking you,
Suhrud Thakkar
Chintan Choksi
Bijon Desai
Bhavin Shah
II
Abstract
In commercial industries data networks are deployed on a very large scale. The manual
management of these networks is not at all feasible. To tackle this issue, the network
management software (NMS) comes into the picture. These types of software have efficiently
managed a large-scale network and handle the problems that regularly arise in such networks.
However, the current NMS are too complex to be understood and configured by an operator level
person. Moreover, in these industries, specifically in automation industries, the data is displayed
on a SCADA screen which is present in the control room. But, the network management
software represents the error-data in SNMP protocol which the SCADA screen is not able to
interpret. Hence, the industries need to deploy an additional converter to convert data from
SNMP protocol to OPC protocol data.
Our Network Discovery and Fault Detection (NDFD) software represents the network-devices
and their characteristics in a simplistic way and is also easy to configure and operate.
Also, our network management software will include the facility of SNMP to OPC conversion so
that the industries will not need to deploy an additional converter in order to convert and display
the data on the SCADA screen.

III
LIST OF TABLES
Table No. Table Description Page No. Table 1 Comparison of NMS 6 Table 2 SNMP Trap Packets 11

IV
LIST OF FIGURES
Figure No. Figure Description Page No. Figure 1 NMS Topology 2 Figure 2 Summary of faults detected by current NMS 5 Figure 3 Computer Network Map 8 Figure 4 OPC Alert Format 11 Figure 5 Level 0 DFD 18 Figure 6 Level 1 DFD 18 Figure 7 Level 2 DFD 19 Figure 8 Level 3 DFD 19 Figure 9 Use case Diagram 20 Figure 10 Activity Diagram 21 Figure 11 Sequence Diagram 22 Figure 12 SNMP API 26 Figure 13 Main Page 28 Figure 14 Device Discovery 28 Figure 15 List of devices in the network 29 Figure 16 List of properties for device “Computer2” 29 Figure 17 Fault Detection 30

V
TABLE OF CONTENTS
Acknowledgement I
Abstract II
List of Tables III
List of Figures IV
Chapter 1 Introduction 1
1.1 introduction to Network Management 1
1.2 Introduction to Network Management System (NMS) 1
1.3 Flaws in NMS 5
1.4 What is NDFD? 7
Chapter 2 Literature Survey 13
Chapter 3 Design and Analysis 15
3.1. Database <ndfd>
3.2. Data Flow Diagram
3.3. Use case Diagram
3.4. Activity diagram
3.5. Sequence Diagram
15
18
20
21
22
Chapter 4 Technologies Used 23
4.1 Software 23
4.2 WebNMS.NET SNMP API 25
4.3 Language 26
Chapter 5 Result Analysis 27
Chapter 6 Conclusion 30
Chapter 7 Future Enhancements 31
References 32

VI

1 | P a g e
CHAPTER 1: INTRODUCTION
1.1. Introduction to Network Management: - Refers to the activities, methods,
procedures, and tools that pertain to the operation, administration, maintenance, and
provisioning of networked systems.
Operation deals with keeping the network (and the services that the network
provides) up and running smoothly. It includes monitoring the network to spot
problems as soon as possible, ideally before users are affected.
Administration deals with keeping track of resources in the network and how they
are assigned. It includes all the "housekeeping" that is necessary to keep the network
under control.
Maintenance is concerned with performing repairs and upgrades—for example,
when equipment must be replaced, when a router needs a patch for an operating
system image, when a new switch is added to a network. Maintenance also involves
corrective and preventive measures to make the managed network run "better", such
as adjusting device configuration parameters.
Provisioning is concerned with configuring resources in the network to support a
given service. For example, this might include setting up the network so that a new
customer can receive voice service.
1.2. Introduction to Network Management System (NMS): - Commercial
industries deploy their local area networks on a very large scale. Hence, monitoring the
devices connected in the local area network, manually, becomes infeasible. To tackle
this issue, the Network Management System (NMS) comes into picture. Now the
question arises what does NMS mean? So, NMS i.e. Network Management System is
combination of hardware and software used to monitor and administer a computer
network deployed on a large scale. It is responsible for monitoring, alerting and
reporting for the global network infrastructure. To understand what NMS is, network
management needs to be understood thoroughly. Network management is a service that
employs a variety of tools, applications and devices to assist human network managers
in monitoring and maintaining nodes. In simpler terms, network management means
monitoring the activities carried out in a network using some protocols or tools.
So basically, an NMS manages the network elements also known as managed devices.
Device management includes faults, configuration, accounting, performance and
security management. Management tasks include discovering network inventory,
monitoring device health and status, providing alerts to conditions that impact system
performance, and identification of problems, their source(s) and possible solutions.
2 | P a g e
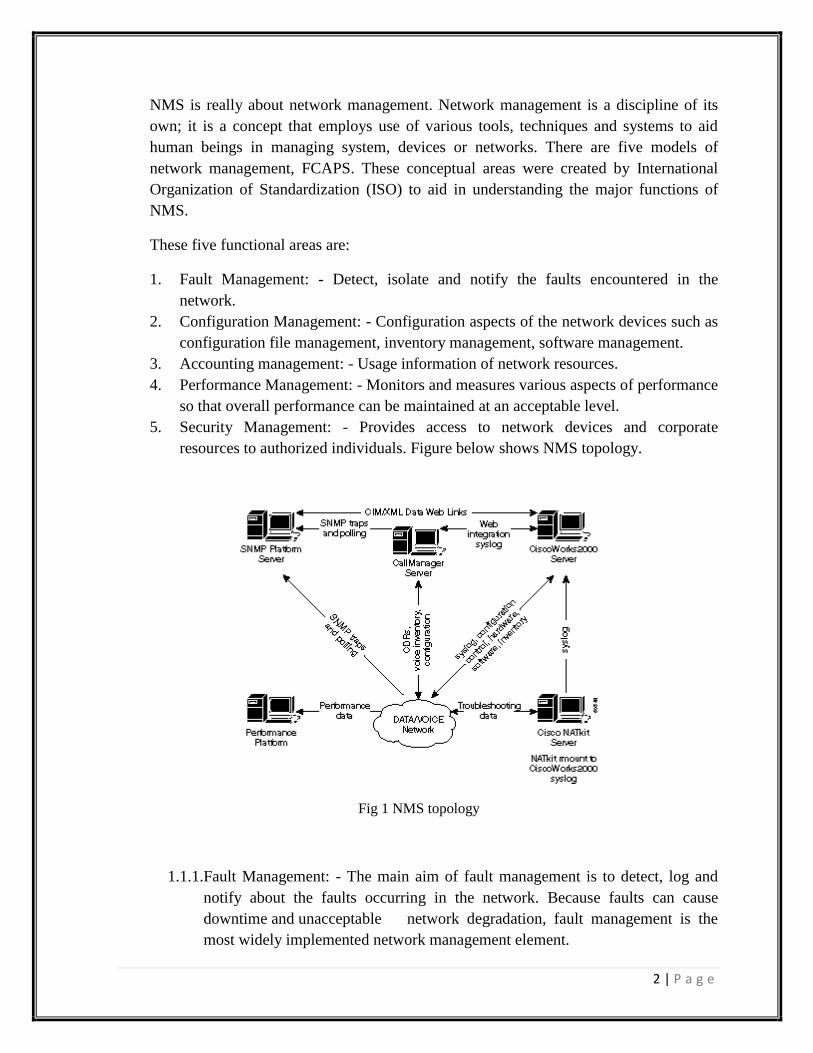
NMS is really about network management. Network management is a discipline of its
own; it is a concept that employs use of various tools, techniques and systems to aid
human beings in managing system, devices or networks. There are five models of
network management, FCAPS. These conceptual areas were created by International
Organization of Standardization (ISO) to aid in understanding the major functions of
NMS.
These five functional areas are:
1. Fault Management: - Detect, isolate and notify the faults encountered in the
network.
2. Configuration Management: - Configuration aspects of the network devices such as
configuration file management, inventory management, software management.
3. Accounting management: - Usage information of network resources.
4. Performance Management: - Monitors and measures various aspects of performance
so that overall performance can be maintained at an acceptable level.
5. Security Management: - Provides access to network devices and corporate
resources to authorized individuals. Figure below shows NMS topology.
Fig 1 NMS topology
1.1.1.Fault Management: - The main aim of fault management is to detect, log and
notify about the faults occurring in the network. Because faults can cause
downtime and unacceptable network degradation, fault management is the
most widely implemented network management element.
3 | P a g e
1. Network Management Platform: - The network manager platform deployed in
the network, manages the infrastructure consisting the network elements. The
platform receives the events from the network elements. The commonly
available functions in the standard management platform are:
Network Discovery
Topology management of network elements
Event handler
Performance Data Collector
Management Data Browser
The network management platform can be considered as one the major
console for detecting faults in the network infrastructure, because detecting
faults quickly in a network is very critical in corporate industries. The
network operational personnel can rely on the graphical display of the
operational states of the crucial network elements like devices, routers,
switches, etc.
Network management platforms such HP OpenView, Computer Associates
Unicenter, and SUN Solstice can perform a discovery of network devices.
Each network device is represented by a graphical element on the
management platform's console. Different colors on the graphical elements
represent the current operational status of network devices. Network devices
can be configured to send notifications, called SNMP traps, to network
management platforms. Upon receiving the notifications, the graphical
element representing the network device changes to a different color
depending on the severity of the notification received. The notification,
usually called an event, is placed in a log file. It is particularly important that
the most current Management Information Base (MIB) files be loaded on the
SNMP platform to ensure that the various alerts from network elements are
interpreted correctly.
2. Fault Detection and Notification: - The purpose of fault management is to
detect, isolate and notify the faults encountered in the network elements.
Network elements are capable of alerting the main or management stations
whenever fault occurs in their system through alerts.
Fault detection module is completed when the network devices send SNMP
trap messages when faults occur, SNMP polling, remote monitoring (RMON)
and syslog messages in the log file. A management system alerts the end
user when a fault is reported and corrective actions can be taken.
The error messages generated by SNMP version 1 (SNMPv1) are:
1) noError(0)- request was executed successfully.
2) tooBig(1)- request to response was too big to fit into one response.
3) noSuchName(2)- agent was unable to find the OID.

4 | P a g e
4) badValue(3)- read-write or write-only object was set to an
inconsistent value.
5) genErr(4)- if an error occurs which does not satisfy any of the
messages occur, genErr() is generated.
Fault detection and monitoring of the network devices can be expanded from
the device level to the protocol and interface level. For a network
environment, fault monitoring can include Virtual Local Area Network
(VLAN), asynchronous transfer mode (ATM), fault indications on physical
interfaces, and so forth. Protocol-level fault management implementation is
available using an element management system such as the CiscoWorks2000
Campus Manager. The TrafficDirector application in Campus Manager
focuses on switch management utilizing mini-RMON support on Catalyst
switches.
5 | P a g e
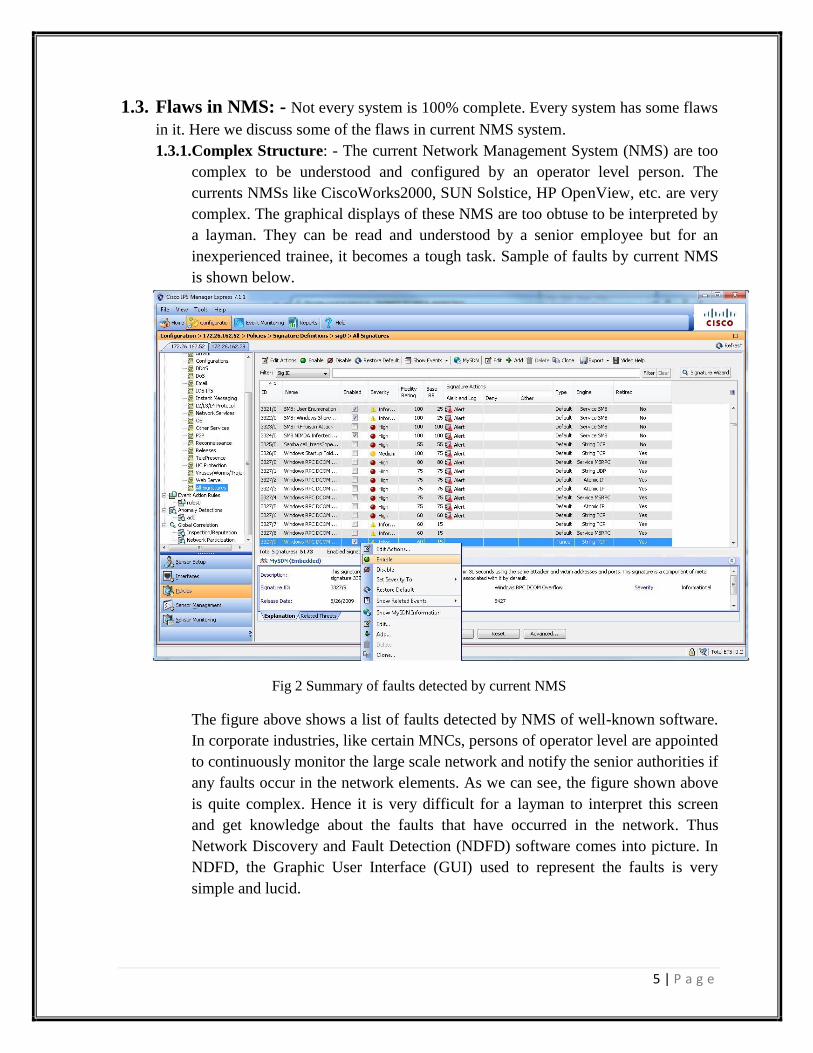
1.3. Flaws in NMS: - Not every system is 100% complete. Every system has some flaws
in it. Here we discuss some of the flaws in current NMS system.
1.3.1.Complex Structure: - The current Network Management System (NMS) are too
complex to be understood and configured by an operator level person. The
currents NMSs like CiscoWorks2000, SUN Solstice, HP OpenView, etc. are very
complex. The graphical displays of these NMS are too obtuse to be interpreted by
a layman. They can be read and understood by a senior employee but for an
inexperienced trainee, it becomes a tough task. Sample of faults by current NMS
is shown below.
Fig 2 Summary of faults detected by current NMS
The figure above shows a list of faults detected by NMS of well-known software.
In corporate industries, like certain MNCs, persons of operator level are appointed
to continuously monitor the large scale network and notify the senior authorities if
any faults occur in the network elements. As we can see, the figure shown above
is quite complex. Hence it is very difficult for a layman to interpret this screen
and get knowledge about the faults that have occurred in the network. Thus
Network Discovery and Fault Detection (NDFD) software comes into picture. In
NDFD, the Graphic User Interface (GUI) used to represent the faults is very
simple and lucid.

6 | P a g e
1.3.2.High Cost: - There are many NMSs available in the market but they are not open
source. They cost thousands of dollars for installation and maintenance
henceforth. The table below shows a comparison of different proprietary NMS.
Table 1: Comparison of NMS
As seen from the above table, the licensed versions of NMS are very costly. Also
the company needs to bear additional costs for the regular maintenance of these
software systems.
1.3.3.SNMP to OPC Conversion: - In the commercial industries (mostly automation
industries), the data is viewed on a Supervisory Control And Data Acquisition
(SCADA) screen. But the NMS generates data in SNMP format which cannot be
interpreted by the SCADA screen. SCADA screen can only interpret data which
is OPC protocol format. Hence an additional converter needs to be installed which
converts SNMP packets into OPC format, which can then be displayed by the
SCADA screen.
Product Name Version Company Business Size License Price
Orion Network
Performance Monitor
10.3 SolarWinds, Inc. Small to
Medium(1-500)
Proprietary $2475
ManageEngineOpManager 9.2 Zoho Corporation Small to
Medium(1-500)
Proprietary $1995
Whatsup Gold v15 Ipswitch, Inc. Small to
Medium(1-500)
Proprietary $4995
Spicework 8.6 Spiceworks, Inc. Small to
Medium(1-500)
Proprietary $495/yr
Lansweeper 4.0.2.68 Hemoco BVBA Small to
Medium(1-500)
Proprietary $1495
7 | P a g e
1.4. What is NDFD? The Network Discovery and Fault Detection (NDFD) software will
do the job of discovering the devices on the network, continuously monitoring them for
fault detection and generate an alert whenever any fault occurs in any of the network
devices. It will also convert the error-data which are received in the form of SNMP
packets to OPC format, so that the errors could be displayed on the SCADA screen.
NDFD will discover and represent the network-devices and their characteristics in a
simplistic way. It would also be easy to configure various properties of the devices
using NDFD. The NDFD would allow the user to monitor the network 24x7 in order to
check for faults and errors in the network system. The NDFD system would allow both
active and passive fault detection. Also, the NDFD software will include the facility of
SNMP to OPC conversion so that the industries will not need to deploy an additional
converter (OPC Server) in order to convert and display the data on the SCADA screen.
The NDFD software is divided into the following modules:
1. Network Mapper:
As the name suggests, the main work of network mapper is simply to map the
network i.e. it finds out any and every device that is connected to a particular
network.
It searches along the length and breadth of the network and finds out all the
different types of connected devices like switches, routers and hubs among others
and enumerates these devices in a list form.
This module even offers customized search. It can search the network only within
the IP range specified by the user and find out the connected devices whose IP-
addresses are within that specified IP range.
Additionally, it also provides pictorial (graphical) view of the entire network
which helps in simplifying the understanding of the network. Using graphical
view of the network, the entire network-map could be represented in a more
simplified way which helps in clear and easy understanding of it.
This module is only for the ADMINISTRATOR.
List & Description of sub-modules:
1 Device discovery: This module takes care of finding the devices available in the
network. It takes parameters from administrator to decide the searching criteria
& finds out the devices from network.
Parameters are: 1) IP Address Range (Admin Defined)
2)Community String (Generated while enabling SNMP in
devices)
2 Device Listing: It lists the found devices and basic characteristics to identify
them on network.
Characteristics/Parameters/Properties:

8 | P a g e
Example
Parameters of Windows PC:
1) Device Name: Name of Device
2) Device Description: version identification, hardware type, operating-system,
networking software, textual description
3) CPU LOAD: Processor Load
4) Hard Drive Status: How much free space is there
5) RAM status: Current allocation of RAM
6) Services Running: List of running services on device
7) Up Time: Uptime since device has started
3 Device Mapping: This sub-module allows administrator to see the graphical
representation of whole network at large. This module also lets you choose any
device and see its detailed properties on one click. It represents interconnections
between the devices of network along with their properties.
Fig 3 Computer Network Map
9 | P a g e
2. Device Configuration :
The network mapper module identifies the devices connected in the network.
Once these devices are mapped, the device configuration module identifies the
respective properties associated with all the connected network devices.
It allows administrator to configure the devices and their properties as per his/her
requirement.
It allows administrator to create and maintain profiles for individual devices.
To allow secure access to these profiles of network devices, it also provides the
functionality of setting-up of passwords.
Using device configuration module, the administrator can also set the threshold
values for different properties of different devices, so that if a parameter-value of
a certain device goes beyond the threshold-value then an alert could be generated
and the preventive measures could be rapidly taken.
This module is for the ADMINISTRATOR and Users with access to
Configuration level.
List & Description of sub-modules:
1 Data fetcher: It brings device properties from 1st module (Network Mapping) &
utilizes it for further settings & profile generations. Brings all the parameters
selected by users also it dumps data in database. Database consists of static and
dynamic data regarding devices.(Every time polling is done in 3rd
module, data
is updated)
2 Configuration: It basically manages device profile level control. Here you can
set parameters like. Changing the services from the list of running services.
Shutting down or checking the status of services. Stores personalized profile for
every device & also the threshold value for different parameters
E.g. You can set Threshold value for CPU Usage property to alert you if usage
goes above threshold
3. Fault Detection and Notification (alerting) :
This software module monitors the network 24*7.
Whenever any fault occurs in the network like a device stops working or any
device property goes beyond the restricted value or any device mis-performs, then
this module will immediately notice that error and will generate an alert to notify
the user about the network-fault.
It will immediately give the detailed information regarding the error to the
software administrator. This module detects the errors using two types:
1) Using traps.
2) Using periodic scan on user-defined intervals.
In the first method, it is the network device that notifies the module about any
error that occurs in the device. Whenever, any network device experiences any
10 | P a g e
fault, then using trap it will immediately notify the software about the fault and
in-turn the software will immediately generate an alert with respect to that fault.
Whereas, in the second method, this software module does periodic scan of the
network, and if some fault occurs in the network, then it is captured by the
software during this scan and an alert is generated.
Output of this module can be seen by ADMINISTRATOR, OPERATOR and
NETWORK MAINTENANCE STAFF.
List & Description of sub-modules:
1. Configuration Fetcher: This module fetches the profile data of different devices
from configurations module.
2. Event Handler: This module responds to SNMP traps generated by different
devices as per the threshold & parameters settings. It uses the concept of
Passive fault detection. The types of generic traps to which it responds are as
follows:
Coldstart or Warmstart: The agent reinitialized its configuration tables.
Linkup or Linkdown: A network interface card (NIC) on the agent either fails
or reinitializes.
Authentication fails: This happens when an SNMP agent gets a request from
an unrecognized community name.
EGP Neighborloss: Agent cannot communicate with its EGP (Exterior
Gateway Protocol) peer.
Enterprise specific: Vendor specific error conditions and error codes.
3. Interval Scanner: This sub-module on the basis of user defined interval scans
the entire network. It uses the concept of Active fault detection.
4. Conversion (from SNMP to OPC Protocol):
The fault detection and notification module represents the collected error-data in
SNMP protocol.
However, the SCADA screen present in the control room cannot interpret the data
which is in SNMP protocol format; it can only understand the data which is
represented in OPC format.
Hence, in order to display the collected error-data on SCADA screen, we need to
convert it from SNMP to OPC protocol.
This conversion is carried out in the ―conversion‖ module; and after performing
the conversion the error-data is transferred to SCADA screen in order to get
displayed.
This module is only for the ADMINISTRATOR.
11 | P a g e
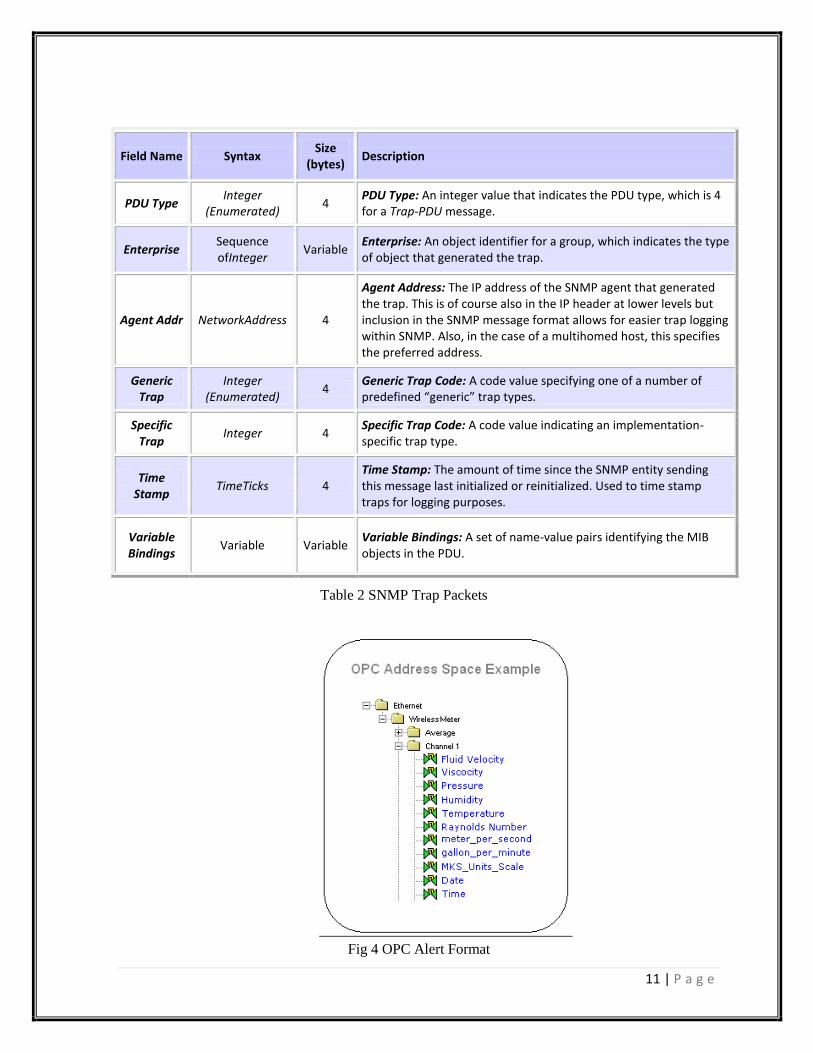
Fig 4 OPC Alert Format
Field Name Syntax Size
(bytes) Description
PDU Type Integer
(Enumerated) 4
PDU Type: An integer value that indicates the PDU type, which is 4 for a Trap-PDU message.
Enterprise Sequence ofInteger
Variable Enterprise: An object identifier for a group, which indicates the type of object that generated the trap.
Agent Addr NetworkAddress 4
Agent Address: The IP address of the SNMP agent that generated the trap. This is of course also in the IP header at lower levels but inclusion in the SNMP message format allows for easier trap logging within SNMP. Also, in the case of a multihomed host, this specifies the preferred address.
Generic Trap
Integer (Enumerated)
4 Generic Trap Code: A code value specifying one of a number of predefined “generic” trap types.
Specific Trap
Integer 4 Specific Trap Code: A code value indicating an implementation-specific trap type.
Time Stamp
TimeTicks 4
Time Stamp: The amount of time since the SNMP entity sending this message last initialized or reinitialized. Used to time stamp traps for logging purposes.
Variable Bindings
Variable Variable Variable Bindings: A set of name-value pairs identifying the MIB objects in the PDU.
Table 2 SNMP Trap Packets

12 | P a g e
5. Network Logger and Report Generation:
This module firstly generates the error-reports of the faults detected in the fault
detection module; and it then stores these reports in a database for future
reference.
These reports contain the detailed information about the faults that occurred in the
network like
1. Fault description,
2. Fault type,
An error-log is also created by this module for recording these faults in a file.
This error-log gives the complete list of the errors that occurred in the network in
a particular duration along with the time at which these errors occurred.
This module also facilitates the monitoring of crucial parameters of a device like:
1. IP Address,
2. System Name,
3. CPU load,
4. Hardware Configuration,
5. RAM, etc.
This is done by generating report for these monitored parameters and based on
these detailed reports, the user can study and analyze the changing pattern in their
values and can arrive at an appropriate inference. The report would contain:
1. Error Name,
2. Error Type,
3. Error Description.
This module is for the ADMINISTRATOR & NETWORK MAINTENANCE
STAFF.

13 | P a g e
CHAPTER 2: LITERATURE SURVEY
SNMP management began in the 1970s. Internet Control Message Protocol (ICMP) was
developed to manage Advanced Research Project Agency NETwork (ARPANET). It is a
mechanism to transfer control messages between nodes. A popular example of this is
Packet Internet Groper (PING), which is part of the TCP/IP suite now. PING is a very
simple tool that is used to investigate the health of a node and the robustness of
communication with it from the source node. It started as an early form of network-
monitoring tool.
ARPANET, which started in 1969, developed into the Internet in the 1980s with the
advent of UNIX and the popularization of client–server architecture. Data were
transmitted in packet form using routers and gateways. TCP/IP-based networks grew
rapidly, mostly in defense and academic communities and in small entrepreneurial
companies taking advantage of the electronic medium for information exchange. National
Science Foundation officially dropped the name ARPANET in 1984 and adopted the
name Internet. Note that the Internet is spelled with a capital I and is limited to a TCP/IP-
based network. An Internet Advisory Board (IAB) was formed to administer Internet
activities, which are covered in the next section.
SNMP standards are defined in a series of documents, called request for comments or
RFCs, proposed by the Internet Engineering Task Force (IETF). A list of RFCs for
SNMPv1, SNMPv2, and SNMPv3 are available on http://www.snmp.com. The IETF
has changed the recommended status of SNMPv1 and SNMPv2c to historic. The IETF
now recommends using SNMPv3 for internet management.
There is also printed literature available on SNMP management. Few noteworthy books
on SNMP management which we have referred are as follows:
1. Building Network Management Tools with Tcl/Tk
Dave Zeltserman and Gerard Puoplo
The stated target audience for this book is the systems administrator or network
consultant who needs to develop network management software. While feature-rich
third-party network management tools (for example, HP's Openview) are widely
available, there may be times when an administrator or network consultant will find
that the tools at his/her disposal are not flexible enough to solve a particular
problem. In addition, the costs of purchasing third-party tools can often be
prohibitive; it may be impractical to spend thousands of dollars on a package,
especially if one's network status monitoring needs tend to be modest. This is when
this book comes to the rescue.
2. Essential SNMP
Douglas R Mauro, Kevin J Schmidt
Essential SNMP is a practical introduction to SNMP for network and system
administrators. It starts with the basics of SNMP and how it works, along with the

14 | P a g e
technical background to use it effectively. The book covers OIDs, MIBs,
community strings, traps, and other technical elements. But the main focus is on
practical network administration: how to configure SNMP agents and network
management stations, how to use SNMP to retrieve and modify variables on
network devices, how to configure management software to react to traps sent by
managed devices.
Essential SNMP explores both commercial and open source packages, including
HP's OpenView, Castle Rock's SNMPc, the Net-SNMP tools, Simon Leinen's Perl
SNMP support, and MRTG. Administrators will come away with ideas for writing
scripts to help them manage their networks, create managed objects, and extend the
operation of SNMP agents. In addition to SNMPv1 and v2, the book covers
SNMPv3, which has just started to appear in commercial products as of this
printing.
3. How to Manage Your Network Using SNMP: The Networking Management
Practicum
The SNMP — the Simple Network Management Protocol — is the standard for
open, interoperable network management — defining 2000 items of management
information. Written by the authors of the SNMP, this exceptionally practical
reference goes beyond the standards by explaining which of those 2000 items are
important and how to make use of them in order to improve the efficiency of real
networks.
15 | P a g e
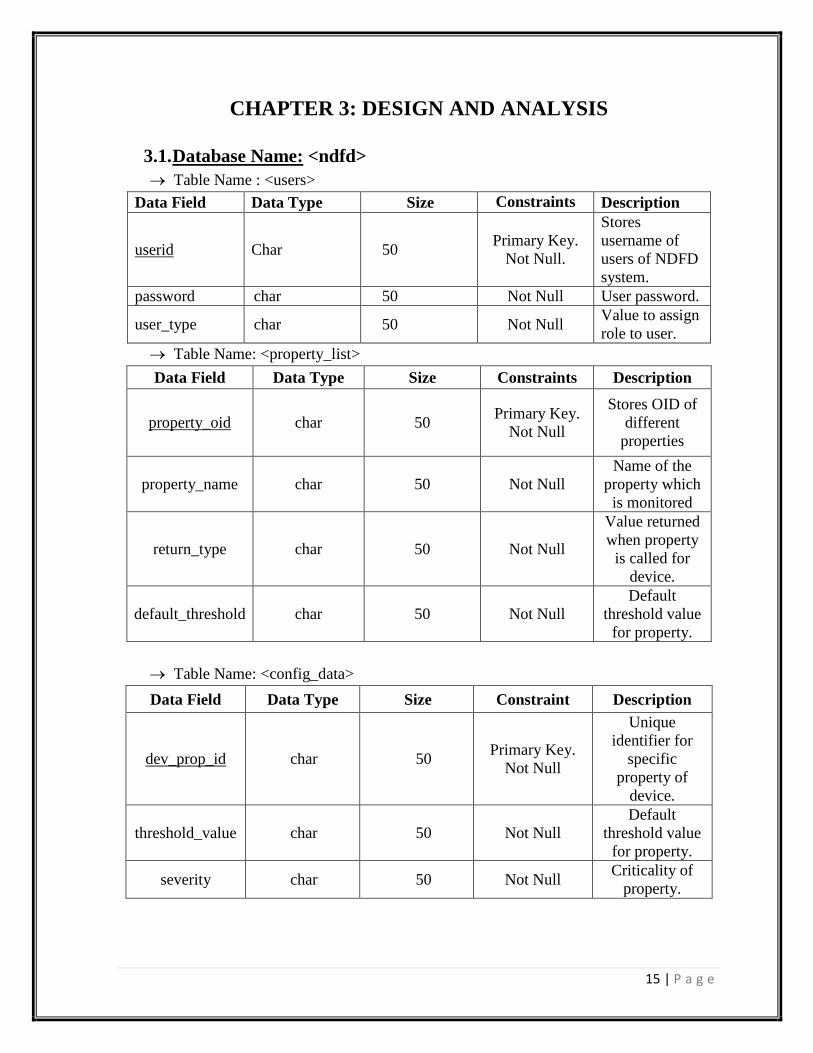
CHAPTER 3: DESIGN AND ANALYSIS
3.1. Database Name: <ndfd>
Table Name : <users>
Data Field Data Type Size Constraints Description
userid Char 50 Primary Key.
Not Null.
Stores
username of
users of NDFD
system.
password char 50 Not Null User password.
user_type char 50 Not Null Value to assign
role to user.
Table Name: <property_list>
Data Field Data Type Size Constraints Description
property_oid char 50 Primary Key.
Not Null
Stores OID of
different
properties
property_name char 50 Not Null
Name of the
property which
is monitored
return_type char 50 Not Null
Value returned
when property
is called for
device.
default_threshold char 50 Not Null
Default
threshold value
for property.
Table Name: <config_data>
Data Field Data Type Size Constraint Description
dev_prop_id char 50 Primary Key.
Not Null
Unique
identifier for
specific
property of
device.
threshold_value char 50 Not Null
Default
threshold value
for property.
severity char 50 Not Null Criticality of
property.

16 | P a g e
Table Name: <device_data1>
Data Field Data Type Size Constraints Description
device_id char 50 Primary Key.
Not Null
Unique
identifier for
device in
network.
ip_addr char 50 Not Null IP address of
device.
device_name char 50 Not Null Name of device.
val_change int 10 Not Null
Count
indicating
number of times
device
discovered.
Table Name:<discovery_selection_data>
Data Field Data Type Size Constraints Description
dev_prop_id char 50 Primary Key.
Not Null
Unique
identifier for
specific
property of
device.
device_id char 50 Foreign Key.
Not Null.
Unique
identifier for
device in
network.
sel_prop_OID char 50 Foreign Key.
Not Null.
Stores OID of
different
properties
live_value char 50 Not Null.
Returns current
value generated
when device
was monitored.
1 device_data table would be updated on daily basis to check if IP address of particular devices were modified
or not.

17 | P a g e
Table Name:<error_msg>
Data Field Data Type Size Constraint Description
property_oid char 50 Foreign Key.
Not Null.
Stores OID of
different
properties
error_msg char 50 Not Null.
Desrcption of
the error
generated.
Table Name: <error_data2>
Data Field Data Type Size Constraints Description
error_id char 50 Primary Key.
Not Null
Unique
identifier for
error.
error_msg char 50 Message of
error generated
dev_prop_id char 50 Foreign Key.
Not Null
Unique
identifier for
specific
property of
device.
date_time datetime NA Current Date
and Time
Date and time
at which error
was generated.
error_type char 50 Not Null Type of error.
marked_status integer 11 Not Null.
Shows that
errors have
been notified.
2 error_data would be backed up on regular interval for the sake of data storage and error notification.
18 | P a g e
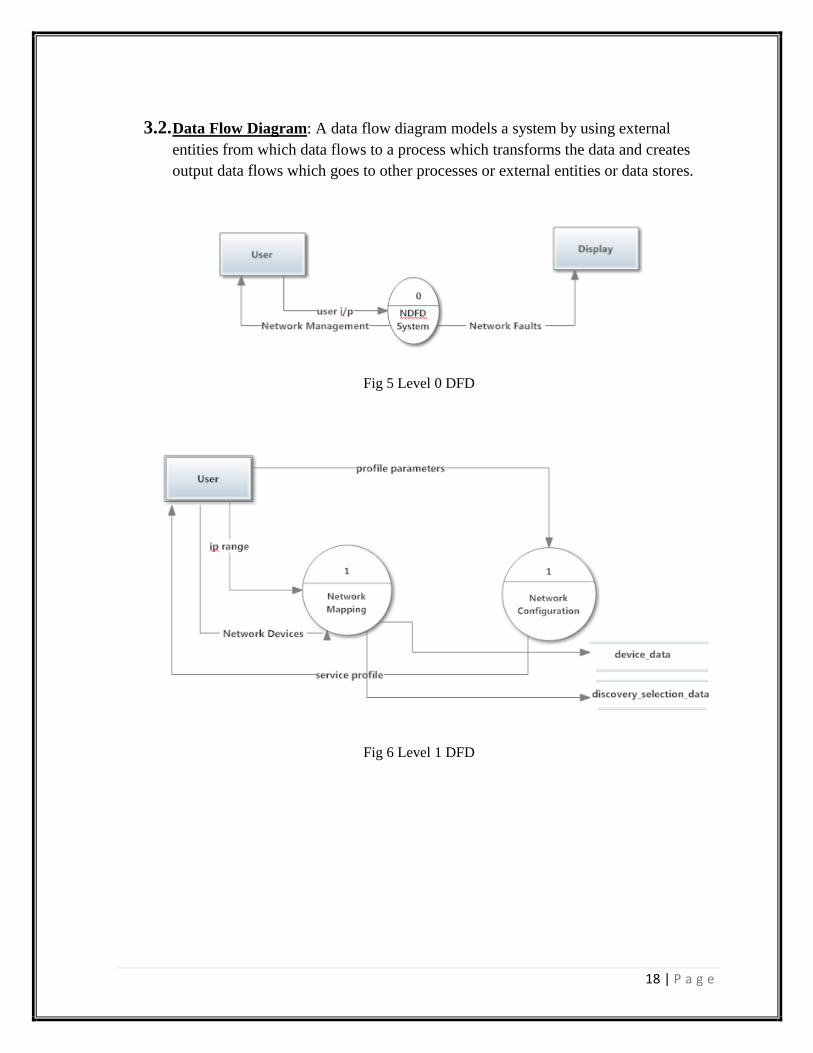
3.2. Data Flow Diagram: A data flow diagram models a system by using external
entities from which data flows to a process which transforms the data and creates
output data flows which goes to other processes or external entities or data stores.
Fig 5 Level 0 DFD
Fig 6 Level 1 DFD
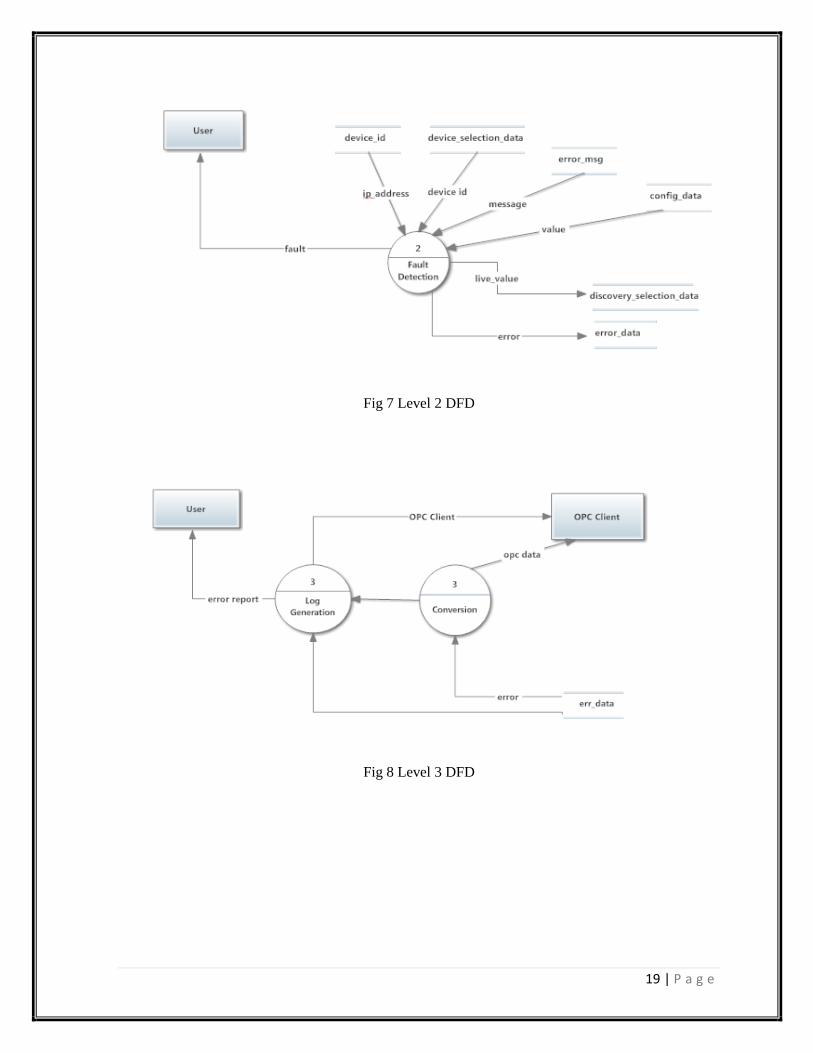
19 | P a g e
Fig 7 Level 2 DFD
Fig 8 Level 3 DFD
20 | P a g e
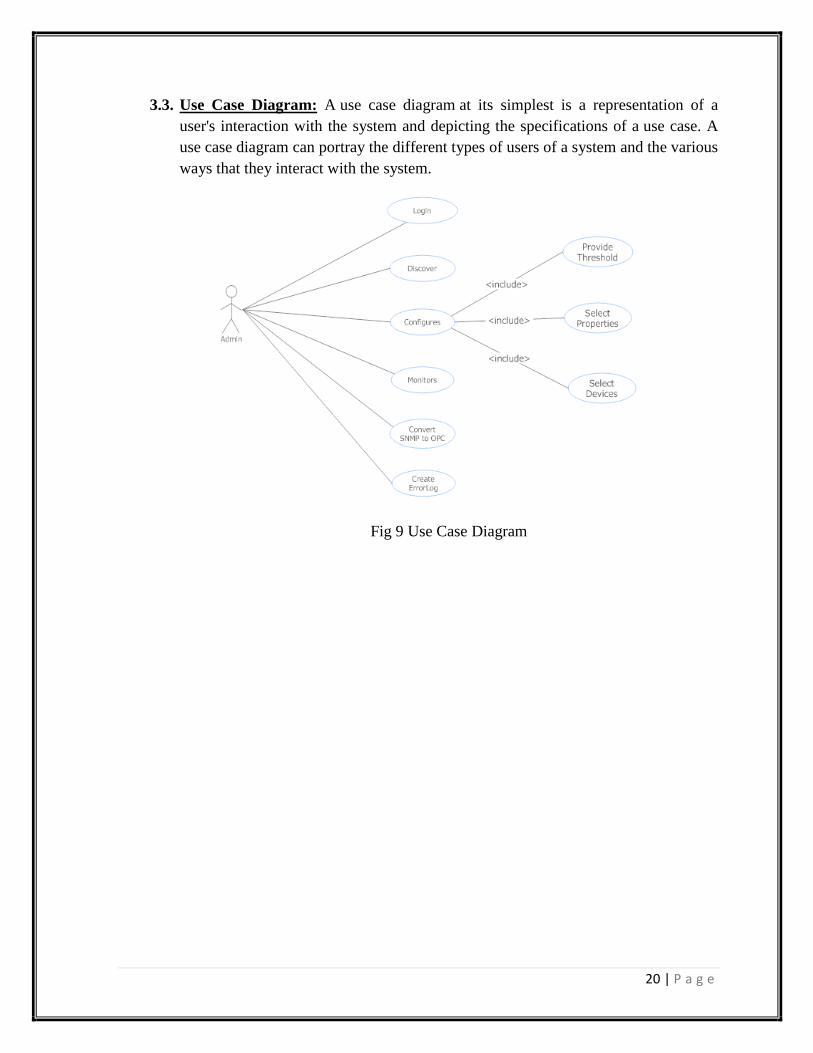
3.3. Use Case Diagram: A use case diagram at its simplest is a representation of a
user's interaction with the system and depicting the specifications of a use case. A
use case diagram can portray the different types of users of a system and the various
ways that they interact with the system.
Fig 9 Use Case Diagram
21 | P a g e
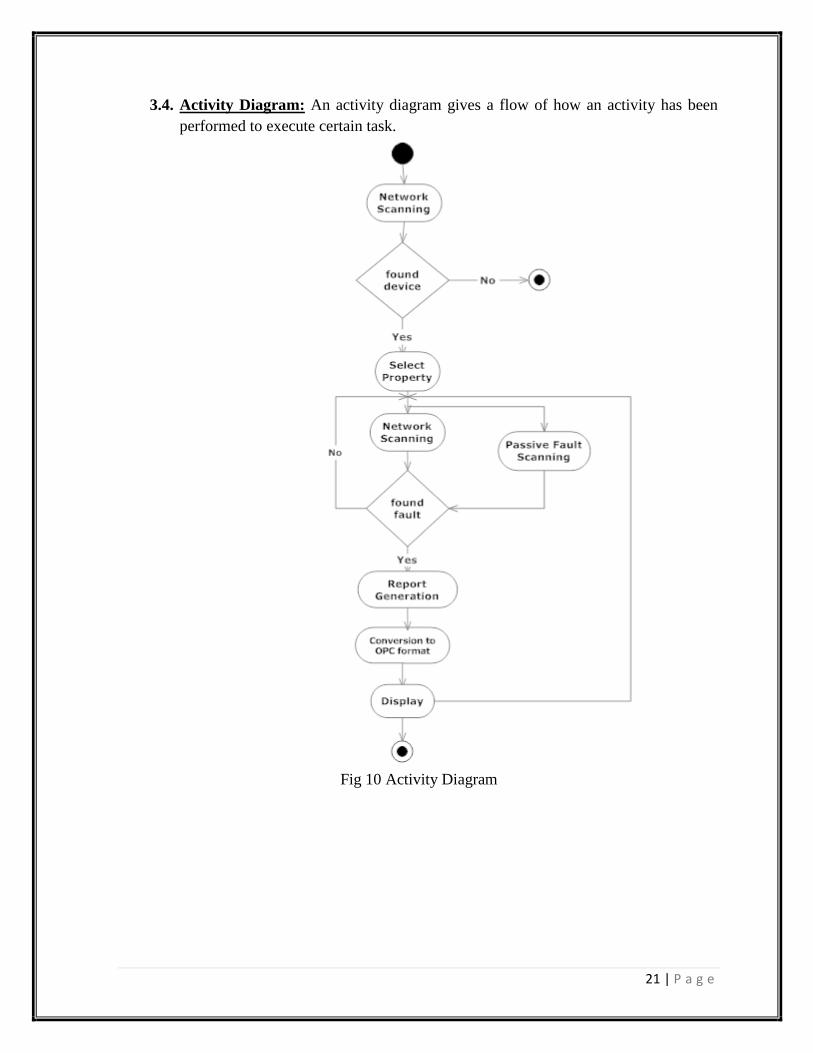
3.4. Activity Diagram: An activity diagram gives a flow of how an activity has been
performed to execute certain task.
Fig 10 Activity Diagram
22 | P a g e
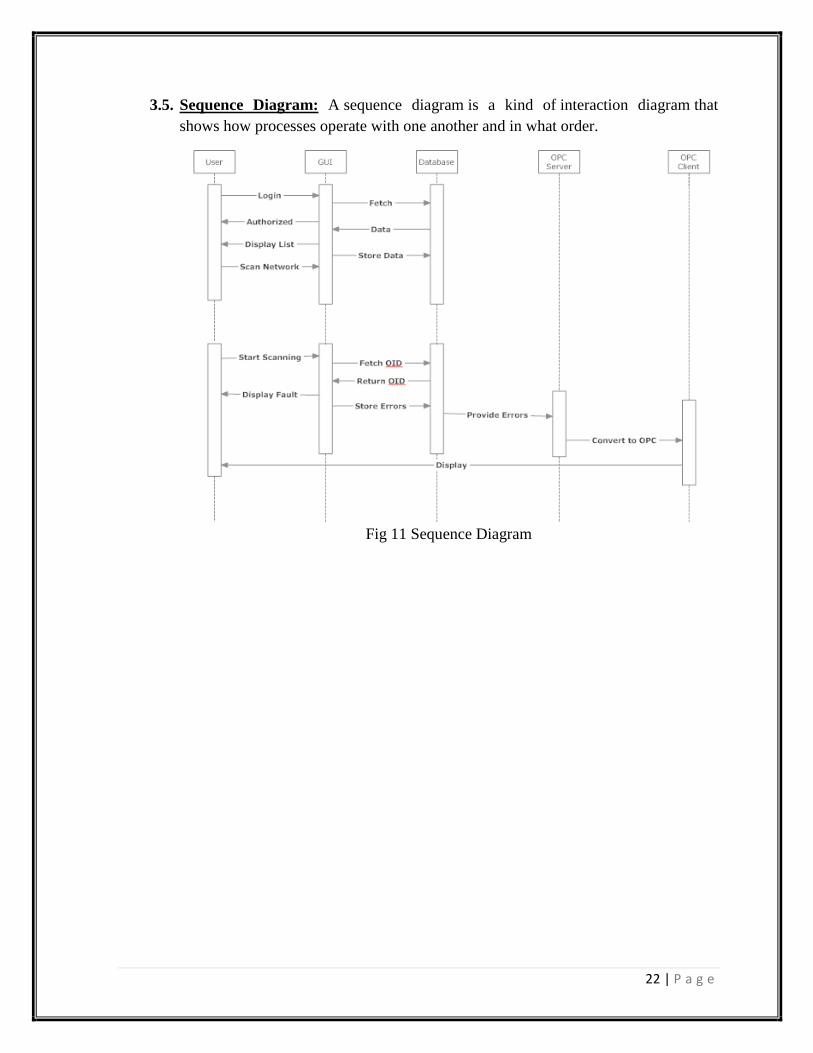
3.5. Sequence Diagram: A sequence diagram is a kind of interaction diagram that
shows how processes operate with one another and in what order.
Fig 11 Sequence Diagram

23 | P a g e
CHAPTER 4: TECHNOLOGY USED
4.1. Software:
1. Microsoft Visual Studio: - Visual Studio is used to develop graphical user interface
applications, console applications, desktop applications, web sites, web applications,
and web services in both native code as well as managed code for all platforms
supported by Microsoft. It should be noted that this is a programmer's tool, or a suite
of programmer's tools, and not a user application.
The Visual Studio Integrated Development Environment (IDE) consists of various
tools such as form designer, an editor, a compiler, a debugger, etc. to visually create
forms, modify the programming codes, for translating visual basic statements into
intermediate machine code, to locate and correct errors, etc.
Various components of Visual Studio IDE can be stated as below:
Solution Explorer: The Solution Explorer uses different icons to distinguish
between source code files that define forms and those that don’t.
Each form is defined by two Visual Basic source files where each file contains
a partial class. The file with the .vb extension contains the code that’s entered
by the programmer; The file with the Designer.vb extension contains the code
that’s generated when the programmer works with the Form Designer. When
the project is compiled, these partial classes are combined into a single class
that determines the appearance and operation of the form.
A source code file that doesn’t define a form is usually stored in a single
Visual Basic source file that contains a single class.
The References folder contains references to the assemblies for the
namespaces that the application can use. These namespaces contain the
classes that the project requires. In most cases, all the references that you need
are included when the project is created.
Toolbox: The toolbox holds the tools you use to place controls on a form. You may
have more or different tools in your toolbox, depending on the edition of Visual
Basic you are using (Express, Standard, Professional, or Team System).Various
tools categorized in Common Controls, Containers, Menus & toolbars , Data ,
Components etc. One can drag and drop tools as per requirements in design window
of application.
Server Explorer: The Server Explorer tool is used to manage database connections
on an accessible computer. It is also used to browse running Windows Services,
performance counters, and Windows Event Log and message queues and use them
as a data source.
24 | P a g e
Properties Editor: The Properties Editor tool is used to edit properties in a GUI pane
inside Visual Studio. It lists all available properties (both read-only and those which
can be set) for all objects including classes, forms, web pages and other items. It
also contains the events associated with tools by which one can handle the various
events.
2. SQL server 2008: - SQL Server 2008 aims to make data management self-tuning, self
organizing, and self maintaining with the development of SOLServerAlwaysOn
technologies, to provide near-zero downtime. SQL Server 2008 also includes support
for structured and semi-structured data, including digital media formats for pictures,
audio, video and other multimedia data. In current versions, such multimedia data can
be stored as BLOBs (binary large objects), but they are generic bitstreams. Intrinsic
awareness of multimedia data will allow specialized functions to be performed on
them. SQL Server 2008 can be a data storage backend for different varieties of data:
XML, email, time/calendar, file, document, spatial, etc as well as perform search,
query, analysis, sharing, and synchronization across all data types.
SQL Server includes better compression features, which also helps in improving
scalability. It enhances the indexing algorithms and introduces the notion of filtered
indexes. It also includes Resource governer that allows reserving resources for certain
users or workflows. It also includes capabilities for transparent encryption of data
(TDE) as well as compression of backups. SQL Server 2008 supports the ADO.NET
Entity Framework and the reporting tools, replication, and data definition will be built
around the Entity Data Model. SQL Server Reporting Services will gain charting
capabilities from the integration of the data visualization products from Dundas Data
Visualization, Inc., which was acquired by Microsoft. On the management side, SQL
Server 2008 includes the Declarative Management Framework which allows
configuring policies and constraints, on the entire database or certain tables,
declaratively. The version of SQL Server Management Studio included with SQL
Server 2008 supports IntelliSense for SQL queries against a SQL Server 2008
Database Engine. SQL Server 2008 also makes the databases available via Windows
PowerShell providers and management functionality available as Cmdlets, so that the
server and all the running instances can be managed from WindowsPowerShell.

25 | P a g e
4.2. WebNMS.NET SNMP API: WebNMS SNMP API .NET Edition is a
comprehensive development toolkit for SNMP-based network management
applications. WebNMS's SNMP stack comprises a set of powerful .NET SNMP
library to build real-time applications for monitoring and tracking network elements
that are reliable and scalable.
4.2.1.Key Features of WebNMS SNMP API .NET Edition Multi-lingual support: Complete support for SNMPv1 and SNMPv2c versions. Robust SMIv1 and SMIv2 MIB Parser: Seamlessly parses the MIB definitions
from any OEM vendor. Offers various modes of parsing based on the MIB
definitions. SNMP Broadcasting: Broadcasts SNMP packets across the network to auto-
discover SNMP devices in the network. Command line utilities: Perform SNMP operations such as, SNMP GET, SNMP
GETNEXT, SNMP SET, SNMP BULK, SNMP WALK, etc. on remote agents. 4.2.2. WebNMS SNMP API Architecture WebNMS SNMP API consists of a hierarchy of .NET packages that enables rapid
development of element and network management applications for a wide variety
of domains.
It is built upon a layered architecture, which contains the SNMP Package and the
Transport Provider Framework, and the MIBs API.
Fig 12 SNMP API
26 | P a g e
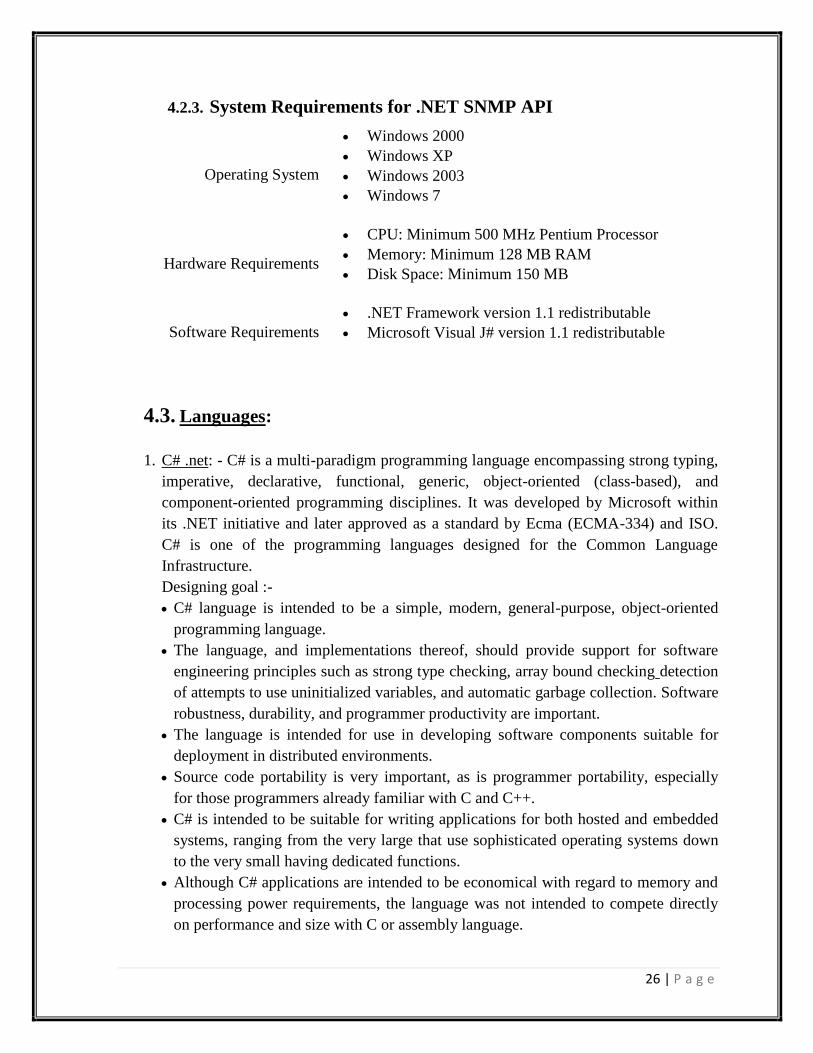
4.2.3. System Requirements for .NET SNMP API
Operating System
Windows 2000
Windows XP
Windows 2003
Windows 7
Hardware Requirements
CPU: Minimum 500 MHz Pentium Processor
Memory: Minimum 128 MB RAM
Disk Space: Minimum 150 MB
Software Requirements
.NET Framework version 1.1 redistributable
Microsoft Visual J# version 1.1 redistributable
4.3. Languages:
1. C# .net: - C# is a multi-paradigm programming language encompassing strong typing,
imperative, declarative, functional, generic, object-oriented (class-based), and
component-oriented programming disciplines. It was developed by Microsoft within
its .NET initiative and later approved as a standard by Ecma (ECMA-334) and ISO.
C# is one of the programming languages designed for the Common Language
Infrastructure.
Designing goal :-
C# language is intended to be a simple, modern, general-purpose, object-oriented
programming language.
The language, and implementations thereof, should provide support for software
engineering principles such as strong type checking, array bound checking detection
of attempts to use uninitialized variables, and automatic garbage collection. Software
robustness, durability, and programmer productivity are important.
The language is intended for use in developing software components suitable for
deployment in distributed environments.
Source code portability is very important, as is programmer portability, especially
for those programmers already familiar with C and C++.
C# is intended to be suitable for writing applications for both hosted and embedded
systems, ranging from the very large that use sophisticated operating systems down
to the very small having dedicated functions.
Although C# applications are intended to be economical with regard to memory and
processing power requirements, the language was not intended to compete directly
on performance and size with C or assembly language.
27 | P a g e
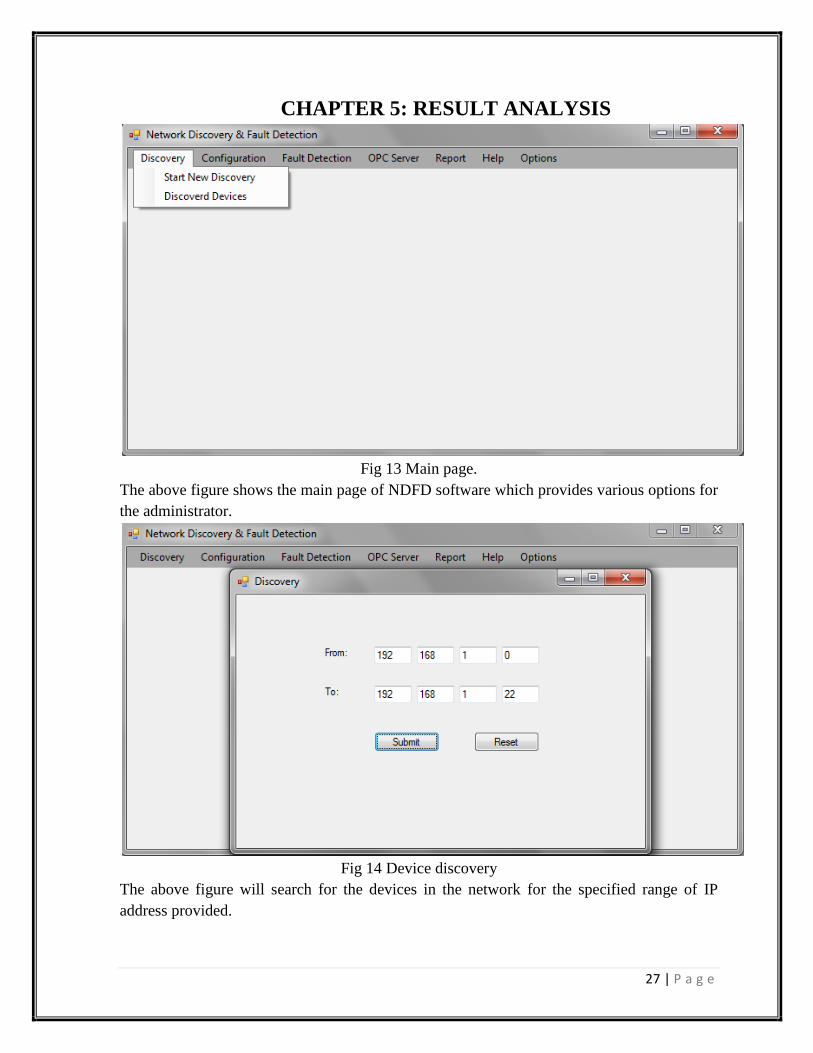
CHAPTER 5: RESULT ANALYSIS
Fig 13 Main page.
The above figure shows the main page of NDFD software which provides various options for
the administrator.
Fig 14 Device discovery
The above figure will search for the devices in the network for the specified range of IP
address provided.

28 | P a g e
Fig 15 List of devices in network.
The list of all the devices connected in the network is displayed along with their ID address.
This list is provided so that admin can view device specific properties.
Fig 16 List of properties for device ―Computer2‖.

29 | P a g e
Fig 17 Fault Detection.
The above figure shows the detection of fault generated by a router while starting its services.
This kind of fault is called ―Cold Start‖. The quality indicates that the router started without
any problem.
30 | P a g e
CHAPTER 6: CONCLUSION
In today’s world, networks play an important role everywhere. Even in instrumentation and
automation industries, critical devices are connected by a network. Hence, network
management becomes a critical and tedious task to perform. The NDFD software helps in
performing network management activities easily and keeping the industry up and running.
The NDFD software performs activities like Network Discovery, Device Configuration,
Fault Detection OPC conversion and Error Logging. The NDFD software is unique as
compared to other NMS available in market, because it includes the facility of OPC server
within it, relieving the industry from purchasing additional costly OPC servers in order to
display the data on screen.
Moreover, the user-interface of NDFD software is simple and user-friendly. Hence, it is easy,
even for a layman, to operate the software. It is also cheap as compared to other NMS
softwares available in the market. Hence, the NDFD software is tailor-made for automation
industries providing them the efficient network management and improving the industry’s
overall production efficiency.
31 | P a g e
Chapter 7: FUTURE ENHANCEMENTS
Although, the NDFD software is an improved and customized version of NMS software
available in the markets, there is still scope for future improvements.
In future, we can include the facility of fault correction in the software. We can provide
software with the corrective actions to be taken if some generic faults occur. Moreover,
network efficiency can be improved by decreasing the frequency of message exchanges and
providing data compression. Security measures like data encryption, user authentication and
authorization can also be provided.
Lastly, error logging facility can also be improved by providing customized report
generation. This report could help the other user in interpreting the performance trends of the
devices and extrapolating it to predict future performance.

32 | P a g e
References [1] http://www.itc22.com/fileadmin/ITC22_files/dc-caves-yoshizawa-camera-
ready.pdf
[2] http://cisco.sitecelerate.com/en/US/i/200001-300000/290001-300000/291001-
292000/291484.jpg
[3] http://network-management.findthebest.com/compare/2-6-13-18-34/Orion-
Network-Perfomance-Monitor-vs-ManageEngine-OpManager-vs-Whatsup-Gold-
vs-Spiceworks-vs-Lansweeper
[4] http://www.cisco.com/en/US/tech/tk869/tk769/technologies_white_paper09186a0
0800aea9c.shtml
[5] http://www.cisco.com/E-
Learning/public/shared/pdf/DFM2_0_Tutorial_Final_March2005.pdf
[6] http://www.solarwinds.com/it-management-glossary/what-is-network-
management-system.aspx
[7] http://www.sce.carleton.ca/netmanage/NetMngmnt/NetMngmnt.html
[8] http://www.technibble.com/forums/showthread.php?t=19884
[9] http://avcinfotech.blogspot.in/2007/06/what-is-nms.html
[10] Building Network Management Tools with Tcl/Tk by Dave Zeltserman and
Gerard Puoplo
[11] Essential SNMP by Douglas R Mauro, Kevin J Schmidt
[12] How to Manage Your Network Using SNMP: The Networking Management
Practicum