neural oscillations and the decoding of sensory information
TRANSCRIPT

Neural Oscillations
and the Decoding of Sensory Information
Thesis by
Javier Perez-Orive
In Partial Fulfillment of the Requirements
for the Degree of
Doctor of Philosophy
California Institute of Technology
Pasadena, California
2004
(Defended May 7, 2004)

ii
© 2004
Javier Perez-Orive
All Rights Reserved

iii
This dissertation is dedicated
to my daughters Claudia and Daniela,
for the infinite love and happiness they make me feel
iv
Acknowledgments
I would like to thank my advisor Gilles Laurent, for his ideas and for introducing me into
this fascinating area of science. I would also like to thank my Thesis Committee
Members: John Allman, Mark Konishi, Pietro Perona and Thanos Siapas, for all their
time and interest in this project. I am also grateful to the Alfred P. Sloan Foundation and
the Swartz Foundation, who provided me with financial support for my Ph.D.
I also need to thank all the past and present members of the Laurent Lab, and particularly
Stijn Cassenaer, Sarah Farivar, Vivek Jayaraman, Roni Jortner, Ofer Mazor and Ben
Rubin, for all those discussions, scientific and otherwise, and for making my Ph.D.
experience a very enriching and enjoyable one. Thanks also to my fellow CNS-1st-year
classmates, for making my first year at Caltech a really interesting and exciting one.
I would also like to acknowledge here great teachers I have had the good fortune of
learning from throughout my life and who have had decisive influences in shaping my
academic path to Caltech: Angelica Takahashi de Mestre and Asdrubal Ayala (each of
whom inspired in me the great love of biology and mathematics, respectively, that led me
to study Biomedical Engineering), Raul Ulloa, Alejandro Navarrete, Ruth Mayagoitia
(who introduced me into the fascinating field of Neural Prostheses that led to my M.S.
degree) and Hillel Chiel (whose outstanding course on Computational Neuroscience
sparked the interest which ultimately led to my Ph.D. at Caltech).
Of course I need to thank my mother, my father and my brother Joaquin, to whom I owe
all that I am. And finally, I need to give the biggest ‘thank you’ of all to my wife Claudia,
my teammate in life, who not only provided me with the emotional and intellectual
support that made possible this Ph.D., but who also gave me Claudia and Daniela, the
biggest joys one could possible have. Las amo a las tres con todo mi corazón.

v
Abstract
An important problem in neuroscience is to understand how the brain encodes
information. A hypothesis is that differences in the timing of action potentials, reflecting
synchronization changes among neuronal ensembles —often occurring in the context of
oscillations— can be meaningful to downstream neurons detecting coincident input.
Several properties, such as active conductances, feedforward inhibition and oscillatory
input, could potentially influence whether a neuron acts as a coincidence detector.
Although different neural circuits in various animal groups will use different strategies to
solve somewhat varying problems, there will also be many powerful solutions to coding
problems that will be used repeatedly across diverse processing stages and animal phyla.
The insect olfactory system, sharing many design similarities with other systems while
having a reduced complexity, provides an excellent model in which to study the
functional interactions of all these coding features.
This dissertation focuses on the decoding of olfactory information by the mushroom body
(MB), the second relay of the insect olfactory system, which receives oscillating input
from the antennal lobe (the first relay, analogous to the vertebrate olfactory bulb).
Kenyon cells (KCs), the intrinsic neurons of the MB, are found to respond very
specifically to odors. These responses typically consist of one or two reliable action
potentials, phase-locked to the global oscillations, over extremely low baseline firing
rates. This leads to a dramatic sparsening of the olfactory representation in the MB.
Several circuit and intrinsic properties are found to take part in this transformation.

vi
Feedforward inhibition contributes to odor specificity and sparseness: blocking inhibitory
input to the KCs broadened their odor tuning and abolished their phase-locking,
supporting the idea that feedforward inhibition limits the temporal window over which
KCs integrate their inputs. Voltage-dependent conductances contribute to a supralinear
summation of coincident postsynaptic potentials and a reduction of their half-widths,
indicating that KC intrinsic properties further contribute to coincidence detection. Taken
together, these results indicate that oscillations serve as a framework on which KCs act as
coincidence detectors and sparsen the olfactory representation. Abolishing the input
oscillations disrupts KC odor responses, decreasing their specificity and the sparseness in
the MB.
The work in this dissertation describes a mechanism for decoding timing information and
indicates that not all spikes are equally relevant to downstream neurons, their specific
relevance depending on whether they are correlated, within a specific phase of an
oscillation cycle, with other input spikes. These general features can also provide useful
insights into neural coding in more complex neural systems, where all the mechanisms
described here have been separately observed. This work illustrates how these
mechanisms can interact to code sensory information and bring about drastic
transformations of neural representations, increasing our understanding of how nervous
systems can process information.

vii
Table of Contents
ACKNOWLEDGMENTS IV
ABSTRACT V
TABLE OF CONTENTS VII
ABBREVIATIONS IX
1 INTRODUCTION 1
1.1 NEURAL CODING 1
1.2 INSECT OLFACTORY SYSTEM 6
1.3 SPECIFIC ISSUES TO BE ADDRESSED 19
2 OSCILLATIONS AND SPARSENING OF ODOR REPRESENTATIONS IN
THE MUSHROOM BODY 21
2.1 INTRODUCTION 21
2.2 RESULTS 24
2.3 DISCUSSION 43
2.4 METHODS 46
2.5 ACKNOWLEDGMENTS 57
3 COINCIDENCE DETECTION AND OSCILLATIONS IN
KENYON CELLS 59
3.1 INTRODUCTION 59

viii
3.2 RESULTS 61
3.3 DISCUSSION 83
3.4 METHODS 88
3.5 ACKNOWLEDGMENTS 95
4 KENYON CELL ELECTROPHYSIOLOGY:
ADDITIONAL PROPERTIES 97
4.1 INTRODUCTION 97
4.2 CONDUCTION VELOCITY OF KENYON CELL AXONS 98
4.3 CHEMICAL OR SPATIAL CLUSTERING OF KENYON CELL RESPONSES 107
4.4 LOCAL FIELD POTENTIAL SPECTROGRAMS AND KENYON CELL ACTIVITY 114
5 CONCLUDING REMARKS 124
5.1 SUMMARY OF MAIN RESULTS 124
5.2 OPEN QUESTIONS FOR FUTURE WORK 126
5.3 RELEVANCE OF DISSERTATION 132
REFERENCES 137
ix
Abbreviations
AL antennal lobe
AN antennal nerve
ATP adenosine triphosphate
cAMP cyclic adenosine monophosphate
CAP compound action potential
CBL cell body layer
EEG electroencephalogram
EPSP excitatory postsynaptic potential
FFT fast Fourier transform
GABA γ-aminobutyric acid
GTP guanosine triphosphate
IPSP inhibitory postsynaptic potential
KC Kenyon cell
LFP local field potential
LH lateral horn
LHI lateral horn interneuron
LN local neuron
LP lateral protocerebrum
MB mushroom body
MC mitral cell

x
OB olfactory bulb
OR olfactory receptor
ORN olfactory receptor neuron
PC pyramidal cell
PCT picrotoxin
Ped pedunculus
PN projection neuron
PSTH peristimulus time histogram
SA electrical stimulus amplitude
shits1 temperature-sensitive shibire transgene

1
1 Introduction
1.1 Neural Coding
An important issue concerning neuroscience today is to understand the way in which the
brain encodes, processes and transforms sensory information. A way of approaching this
problem is to study what aspects of a train of action potentials sent from a given neuron
to another convey information about a particular sensory stimulus. In other words, how
do neurons communicate? And what information do they select or filter out of their
communications? In all likelihood, the answers to these questions will be somewhat
different for different sensory modalities, stages in the processing of the information and
animal groups. However, there will also be many powerful solutions to coding problems
that will be used repeatedly by nervous systems across diverse information processing
tasks and animal phyla.
Several studies of sensory systems have found that the mean firing rate of neurons
contains information about the stimulus [e.g., (Adrian, 1926; Hubel and Wiesel, 1962;
Britten et al., 1992; Parker and Newsome, 1998)]. An underlying assumption in these
studies is that a downstream neuron receiving this information conducts simple spatial or
temporal averaging of its inputs, disregarding any precise correlations between them
(Shadlen and Newsome, 1994). On the other hand, as will be discussed below, there is
evidence from different systems and sensory modalities suggesting that relevant
information can be conveyed by the synchronized firing of neuronal ensembles, and that

Introduction 2
small differences in the timing of action potentials can be meaningful to downstream
neurons.
Local field potential (LFP) and electroencephalogram (EEG) measurements reflect the
summed activity of populations of neurons. Oscillatory activity has been observed in LFP
and EEG recordings obtained under different conditions in a wide variety of animal
groups and reveals the ubiquitous existence of synchronization in groups of neurons
(Adrian, 1942; Steriade et al., 1993; Laurent and Naraghi, 1994; Bragin et al., 1995;
Siapas and Wilson, 1998; Rodriguez et al., 1999; Csibra et al., 2000; Lam et al., 2000;
Fries et al., 2001; Buzsaki, 2002). Although correlated neural activity is not necessarily
periodic, most cases of neural synchronization that have been studied involve oscillations
(possibly because this oscillatory activity is easier to detect than non oscillatory
synchronizations).
A number of roles have been proposed for neuronal synchronization. For example,
gamma oscillations (typically considered to be in the 30-90 Hz frequency band) have
been linked to attention (Fries et al., 2001) and processes involved in managing
expectations and predictions about coming sensory stimuli (Engel et al., 2001; Salinas
and Sejnowski, 2001), binding of distributed representations of perceptual objects (von
der Malsburg and Schneider, 1986; Gray et al., 1989; Engel et al., 1991; Singer and Gray,
1995; Rodriguez et al., 1999; Csibra et al., 2000), episodic (Sederberg et al., 2003) and
working (Pesaran et al., 2002; Howard et al., 2003) memories; hippocampal place cells
are known to phase-lock to theta oscillations (O'Keefe and Recce, 1993), and internally

Introduction 3
generated synchronized spikes have been linked to cognitive motor processes (Riehle et
al., 1997) and specific behavioral events (Abeles et al., 1993; Vaadia et al., 1995; Prut et
al., 1998). However, a thorough understanding of the functional role of oscillatory
synchronization has remained lacking due to the immense complexity of the mammalian
nervous systems in which the previous studies have been performed.
Several studies have focused on studying the emergence of larger increases in
synchronization than would be expected by chance, and correlating those synchronous
episodes with cognitive or behavioral events [e.g., (Vaadia et al., 1995; Riehle et al.,
1997; Steinmetz et al., 2000)]. Yet in order to fully understand how information is
transmitted and processed by neurons it is necessary to study the downstream neurons
which are using that information. Only by establishing how downstream neurons decode
their inputs, that is, what are the specific properties of the incoming signal that they are
responsive to, can we know where the relevant information is actually contained. (Just as
the width of an action potential contains information about the temperature of the brain,
this feature is apparently not used to decode temperature by neurons. Thus, it is important
to distinguish information that is actually relevant to the downstream decoders from that
available to an ideal observer.)
In this sense, a critical question to determine is the temporal window in which a neuron
integrates its inputs. Neurons that have a strong preference for responding only to inputs
that are received during a relatively short interval [for instance, compared to their average
interspike interval (Konig et al., 1996)], will act as “coincidence detectors.” Conversely,

Introduction 4
“temporal integrator” neurons are insensitive to precise coincidences, integrating their
inputs during longer intervals. Whether a neuron acts as a coincidence detector or a
temporal integrator will have important implications on the nature of the code that it uses.
Neurons integrating over long intervals will be insensitive to correlated inputs, and will
only respond to the firing rate averaged over their integration window. On the other hand,
if neurons respond selectively to coincident input, it implies that the relevant conveyor of
information will be the correlated firing of its inputs. Several theoretical studies have
proposed that cortical neurons act as coincidence detectors (Abeles, 1982; Softky and
Koch, 1993; Konig et al., 1996), whereas others have argued that they effectively behave
as temporal integrators (Shadlen and Newsome, 1994, 1998). Yet, in large part due to the
complexity of mammalian cortex, there is still a lack of experimental evidence to
conclusively settle this issue. More realistically, one can imagine that all possibilities
exist and that specific neural circuits, under specific conditions, can behave as either
coincidence detectors or integrators. In this sense, what is important to determine is how
each coding-decoding mode actually works, and what computation it accomplishes.
Different intrinsic and circuit properties can potentially determine whether a neuron is
sensitive to coincident input. Theoretical studies have demonstrated that the membrane
time constant of a neuron can have a critical influence on its preference for coincident
input, specifically relating the half-width of an excitatory postsynaptic potential (EPSP)
to the minimal temporal structure it can resolve in its input [(Kempter et al., 1998); see
also (Abeles, 1982; Softky and Koch, 1993; Konig et al., 1996)]. Active dendritic
depolarizing and repolarizing conductances can greatly reduce the duration of EPSPs,

Introduction 5
limiting the temporal window over which inputs are integrated [(Laurent, 1990; Fricker
and Miles, 2000; Galarreta and Hestrin, 2001; Ariav et al., 2003); see also (Johnston et
al., 1996; Fricker and Miles, 2001)] and provoking a supralinear summation of coincident
input (Margulis and Tang, 1998). The circuit that a neuron belongs to can also have a
strong influence on its integrative properties. For instance, feedforward inhibitory input
can limit the window available for temporal summation, as has been shown
experimentally in hippocampal and medial superior olive brain slices (Grothe and Sanes,
1994; Pouille and Scanziani, 2001), and suggested for other auditory systems (Fujita and
Konishi, 1991; Wehr and Zador, 2003).
Although several of the coding issues mentioned above (oscillatory activity, sensitivity to
correlated spiking through coincidence detection, intrinsic and circuit integrative
properties) have been considered in isolation in the past, the way in which all of them
may act in concert to convey a neural system with important functional properties has not
been studied. As will be discussed below, the insect olfactory system provides an
excellent model to address these issues: its reduced complexity affords greater
opportunities of achieving a thorough understanding of the way it encodes and processes
sensory information, making possible a mechanistic comprehension of neural
computation within and between local circuits.

Introduction 6
1.2 Insect Olfactory System
Olfactory system designs share many characteristics across phyla: odor-evoked
oscillatory activity has been observed in mollusks (Gelperin and Tank, 1990), arthropods
(Laurent and Naraghi, 1994), and chordates (Adrian, 1942; Ottoson, 1959; Satou, 1990;
Lam et al., 2000), including primates (Hughes and Mazurowski, 1962); olfactory receptor
neurons (ORNs) exhibit remarkably precise and convergent projection patterns to the
olfactory bulb (OB) in vertebrates (Mombaerts et al., 1996) and to the antennal lobe (AL)
in insects (Gao et al., 2000; Vosshall et al., 2000); in both animal groups there is
significant convergence and divergence around this relay (OB or AL), which contains
many fewer neurons than its input (ORNs from nose or antenna) or its output (piriform
cortex or mushroom body, MB) (see Table 1-1). These important commonalities imply
that olfactory circuits have been either conserved or, alternatively, that strong functional
constraints have forced them to converge to a common design. In either case this suggests
similar coding mechanisms of olfactory information across animal phyla.
What makes insect olfaction very attractive as a model system is that it presents
researchers with the important advantage of having a significantly reduced complexity, in
terms of the fewer types and smaller number of cells it contains (for instance compared
with the mammalian olfactory system, Table 1-1). Within insects, the locust Schistocerca
americana has several additional advantages, particularly the fact that it is a relatively
large and robust insect, which greatly facilitates conducting electrophysiological
experiments. Studying this model system presents the opportunity to gain a more
complete understanding of how information is processed, and of the mechanisms

Introduction 7
underlying this processing, than would be possible by tackling more complex systems.
Considering the apparent similarity in design principles of olfactory systems, it seems
likely that some or many of the coding rules uncovered in insect olfaction will apply to
most animal groups, including mammals.
Fruit fly Locust Mouse (*Rat)
OR genes ca. 41 ? ca. 1000
ORNs 1,000-1,200 50,000-90,000 ca. 5,000,000
Glomeruli ca. 43 ca. 1,000 ca. 1,800
PNs / MCs 200 830 50,000*
KCs / PCs 2,500 50,000 >1,000,000*
Table 1-1. Current estimates for the number of components of different model olfactory systems. For
mouse (*rat): MCs, mitral cells, PCs pyramidal cells in piriform cortex. References: fruit fly (Technau and
Heisenberg, 1982; Stocker et al., 1990; Vosshall et al., 2000); locust (Ernst et al., 1977; Leitch and Laurent,
1996); mouse (*rat) (Mombaerts et al., 1996; Haberly, 1997; Zou et al., 2001).
1.2.1 Anatomy of the insect olfactory system
The antennae are the olfactory organs of insects. ORNs are found in small groups within
sensilla, cuticular structures existing in different forms and sizes on the antennae (Lee
and Strausfeld, 1990; Masson and Mustaparta, 1990). Each sensillum typically contains
two or more ORNs, surrounded by three auxiliary cells (Keil, 1989). The outer branches
of ORN dendrites penetrate the lumen of the sensillum, where they are reached by
odorants through pores or spoke channels in the sensillum walls (Steinbrecht, 1980; Keil,

Introduction 8
1982) [for reviews of insect peripheral olfaction see (Masson and Mustaparta, 1990;
Hildebrand and Shepherd, 1997)]. Genetic work in fruit flies has discovered a family of
genes encoding the complete repertoire of olfactory receptor proteins (Clyne et al., 1999;
Vosshall et al., 1999). Each ORN seems to express only a single OR gene, whose spatial
expression patterns in the antennae are conserved among individuals (Vosshall et al.,
1999; Vosshall et al., 2000). A receptor from this gene family has been shown to localize
to the dendritic membrane of ORNs and to be required for olfactory function in vivo
(Dobritsa et al., 2003). In the fruit fly, all ORNs expressing a given OR send axons via
the antennal nerve that project, bilaterally, onto one or two spatially invariant glomeruli
in the AL (Gao et al., 2000; Vosshall et al., 2000). In the locust, ORNs appear to project
to a few ipsilateral glomeruli (Ernst et al., 1977; Hansson and Anton, 2000).
There are two types of AL neurons: inhibitory local neurons (LNs) and excitatory
projection neurons (PNs). Both LNs and PNs receive direct synaptic input from ORNs
(Hansson and Anton, 2000). In the locust there are about 300 LNs, which are axonless
nonspiking neurons with dense arborizations throughout the AL making dendrodendritic
GABAergic synapses onto PNs (Leitch and Laurent, 1996; MacLeod and Laurent, 1996).
While there are some differences in LN morphology and physiology among insect
species1, LNs have shown GABA-like immunoreactivity throughout all species studied,
1 For instance, in bees (Flanagan and Mercer, 1989), moths (Anton and Hansson, 1995), and fruit flies
(Wilson et al., 2004) LNs do produce action potentials, and while branching patterns of LNs in locusts
(MacLeod and Laurent, 1996), fruit flies (Stocker et al., 1990) and moths (Anton and Hansson, 1994) are

Introduction 9
consistently supporting their inhibitory role [e.g., (Schafer and Bicker, 1986; Distler,
1989; Hansson and Anton, 2000)].
Locust PNs are multiglomerular cholinergic spiking cells, sending axons via the
antennoglomerular tract into the MBs and the lateral protocerebrum (Ernst et al., 1977;
Oleskevich, 1999; Hansson and Anton, 2000). There is, however, some variability across
insect species in the branching patterns of PN dendrites. For instance, in moths (Homberg
et al., 1988), ants (Masson and Mustaparta, 1990) and fruit flies (Stocker et al., 1990),
PNs are uniglomerular, while bees seem to have both uniglomerular and multiglomerular
PNs (Fonta et al., 1993). Furthermore, a careful anatomical study of the cockroach has
identified six classes of PNs: two of them are uniglomerular, two are sex-specific
macroglomerular and yet another two are multiglomerular (Strausfeld and Li, 1999a). In
the fruit fly, genetical tools have revealed that the targeting of PN dendritic projections to
a specific glomerulus appears to be determined early in development before contact with
ORN axons is established, or OR genes expressed (Jefferis et al., 2001), suggesting PNs
are predetermined to carry specific olfactory information.
The next stage in the olfactory pathway is the MB. The intrinsic cells of the MB are the
Kenyon cells (KCs). As can be seen in Figure 1-1, KCs have stereotyped branching
patterns that give MB neuropils their characteristic shape: their somas are clustered above
the calyx in a cell body layer; a primary neurite extends from the soma and sends
homogeneously distributed throughout the AL, in other species, such as bees (Flanagan and Mercer, 1989;
Fonta et al., 1993) and cockroaches (Ernst and Boeckh, 1983), LNs arborize in only some glomeruli.

Introduction 10
dendritic arborizations into the calyx neuropil and an axon which travels down the
pedunculus and bifurcates into the α- and β-lobes [(Kenyon, 1896); see also (Mobbs,
1982; Laurent and Naraghi, 1994; Strausfeld, 2002)]. While KCs and MBs throughout
insect species share this general structure, some variability in the number of calyces and
lobes exists2 [for a review of MB comparative anatomy see (Strausfeld et al., 1998)].
Studies on cultured honey bee KCs have identified several K+ (delayed rectifier, rapidly
inactivating A-type, Ca2+-dependent), Na+ (rapidly activating and inactivating, persistent)
and Ca2+ (voltage-dependent) conductances (Schafer et al., 1994; Grunewald, 2003). As
PN axons reach the MB calyx, they send collaterals which synapse onto KC dendrites.
The main PN axon then proceeds to the lateral protocerebrum. Molecular biology work in
fruit flies suggests that axonal projections from PNs innervating the same AL glomerulus
have similar patterns of spatial branching in the lateral protocerebrum, and that these
patterns are conserved throughout individuals (Marin et al., 2002; Wong et al., 2002). In
the fruit fly MB, PN axons have been described to project to one of three stereotyped
calycal zones, while the dendrites of an individual KC can project to all of these zones,
thus receiving convergent input from all groups of PNs (Tanaka et al., 2004).
2 For instance, while locusts and fruit flies have only one calyx per MB, bees, wasps and cockroaches have
two calyces per MB, and some anosmic insects such as dragonflies have no calyx at all. Locusts, bees and
cockroaches have two lobes, α and β, but fruit flies have five: α, α’, β, β’ and γ (Mobbs, 1982; Laurent and
Naraghi, 1994; Strausfeld et al., 1998; Strausfeld and Li, 1999b; Ehmer and Hoy, 2000; Rein et al., 2002;
Tanaka et al., 2004).

Introduction 11
Figure 1-1. Locust olfactory system. (A) Main structures: AN, antennal nerve; AL, antennal lobe; MB,
mushroom body; LP, lateral protocerebrum. MB substructures: CBL, cell body layer; calyx; Ped,
pedunculus; α, α-lobe; β, β-lobe. Within the lateral protocerebrum: LH, lateral horn. (B) Close-up of KC
showing the soma, the primary neurite, the spiny dendritic branches in the calyx and the relatively
unbranched axonal terminals in the α- and β- lobes. Figures adapted from (Laurent and Naraghi, 1994;
Wehr and Laurent, 1999).
The axons of KCs project down the pedunculus of the MB, where they are tightly packed
and make axoaxonic synapses with other KCs (Leitch and Laurent, 1996). In the
pedunculus and lobes, KC axons synapse onto dendrites of MB extrinsic neurons, which
are typically considered to be the output of the MB. These extrinsic neurons often
arborize profusely across specific cross-sections of the pedunculus or lobes and send
projections to the protocerebrum or back into the calyx (MacLeod et al., 1998; Mizunami

Introduction 12
et al., 1998b; Grunewald, 1999a; Li and Strausfeld, 1999). Very little is known about the
neural processing of information in the lateral protocerebrum; it is generally assumed that
this brain area is linked to descending pathways supplying motor neuron circuits in the
thoracic and abdominal ganglia (Li and Strausfeld, 1999), but evidence is scarce and
circumstantial.
1.2.2 Coding of information in the locust olfactory system
Electrophysiological experiments during the past several years have increased our
understanding of the way olfactory information is processed in the insect brain. LFP
recordings from the MB calyx reveal the appearance of 20-30 Hz oscillations upon
presentations of olfactory stimuli to the antennae (Laurent and Naraghi, 1994). These
LFP oscillations in the MB are driven by oscillatory input from the AL (Laurent and
Davidowitz, 1994; MacLeod and Laurent, 1996; Wehr and Laurent, 1999) and are
thought to be generated by E- and IPSPs in the KCs. Intracellular recordings of PNs and
LNs reveal that their subthreshold membrane potentials oscillate upon odor presentations,
and that both these oscillations and the action potentials of the PNs (locust LNs do not
spike) become correlated to the LFP oscillations during specific epochs of the response
(Laurent and Davidowitz, 1994; Laurent et al., 1996). Furthermore, these transient
synchronization episodes were shown to be cell- and odor-specific. In parallel with these
fast synchronization events, occurring in the time frame of an oscillation cycle (30-50
ms), the odor responses of PNs were shown to present slower temporal patterns of
excitation and inhibition, evolving throughout several hundreds of milliseconds (Laurent

Introduction 13
et al., 1996). Taken together, these results suggested that oscillatory synchronization
allows olfactory information to be represented in a spatio-temporal code in which both
time and space are used as coding dimensions in a combinatorial manner (Laurent, 1996;
Laurent et al., 1996; Wehr and Laurent, 1996).
To test the effects that oscillatory synchronization may have on this system, it was
necessary to uncover a way of abolishing these oscillations without disrupting other
components of the odor response. It was therefore very important to discover that fast
GABAergic inhibition from the LNs is required for the oscillatory activity to emerge in
the AL: injecting picrotoxin (PCT), an antagonist of ionotropic GABA-receptor-gated
chloride channels, into the AL blocks fast GABAergic inhibition from the LNs, and this
inhibition proved to be required for the emergence of odor-evoked oscillatory dynamics
in the AL circuit (MacLeod and Laurent, 1996). Furthermore, this intervention does not
have a significant effect on PN average firing rate during the response, on odor-evoked
slow temporal patterns or on response tuning. The fact that the slow temporal patterns
(together with their longer periods of inhibition) persist after PCT injection indicates that
PCT does not block slower inhibitory receptors, which seem to be involved in
maintaining the response profiles and average firing rates of PNs (MacLeod and Laurent,
1996; MacLeod et al., 1998; Bazhenov et al., 2001a).
This intervention made it possible to test the physiological and behavioral effects of
abolishing oscillatory synchronization. Honey bee experiments demonstrated that there is
a behavioral impairment of odor discrimination under PCT-induced desynchronization

Introduction 14
(Stopfer et al., 1997). Specifically, bees could not discriminate anymore between similar
odors (1-hexanol and 1-octanol), even though they could still discriminate between
dissimilar odors (geraniol and either alcohol). These experiments were significant
because they provided a first demonstration that oscillatory synchronization is
functionally relevant. At the same time, they raised the issue of identifying the
physiological correlates of this behavioral deficit, in other words, of identifying the
cellular and circuit processes which require oscillatory synchronization.
β-lobe neurons, which have dendritic processes in the β-lobe of the MB and are
postsynaptic to KC axons, are a likely output of the early olfactory system.
Electrophysiological recordings from these MB extrinsic neurons revealed that they lose
specificity in their responses when oscillatory synchronization is abolished with PCT
(MacLeod et al., 1998). This loss of specificity was caused both by the appearance of
new responses (a broadening of the response profile of individual β-lobe neurons), and by
the fact that spike trains evoked by different odors were more similar, indicating a further
loss in the information carried by each response. These results are consistent with the loss
of discriminability of similar odors observed behaviorally under PCT (Stopfer et al.,
1997). Interestingly, however, there was no loss of specificity observed in the PN
responses under these conditions (MacLeod et al., 1998). This raises the possibility that
the loss of specificity observed behaviorally involves the KCs, and that it is at this
intermediate stage of processing (between PNs and β-lobe neurons), that oscillatory
synchronization is required for the proper decoding of olfactory information. It thus
becomes important to record the electrophysiological responses of KCs before and after

Introduction 15
oscillatory synchronization is blocked by PCT (motivating some of the experiments
presented in Chapter 3 of this dissertation).
1.2.3 Mushroom bodies
Given that the MBs, and specifically their intrinsic cells, the KCs, will be the focus of the
work presented in this dissertation, I will now present a brief background of what is
known about their connectivity, inputs and presumed functional roles.
A current estimate of PN to KC divergence is 1:2000 (on the order of 100 synaptic
varicosities per PN axon, with each varicosity contacting approximately 20 distinct KCs;
S. Farivar and G. Laurent, personal communication). Assuming the PN to KC synapses
are uniformly distributed among the 50,000 KCs, this would give an approximate
convergence ratio of 30 PNs onto each KC. If only half of the KCs receive olfactory
input, the mean convergence would be 60:1. There is no data yet on the variance of this
ratio but it seems unlikely that it varies by more than a few fold across the population.
Comparative evolutionary analyses suggest that the MB calyces evolved mainly as a
means to process olfactory information coming from the ALs: the MBs of primitive
anosmic insects which lack ALs (e.g., odonates: dragonflies, damselflies, etc.) have
greatly reduced or no calyces at all (Strausfeld et al., 1998). However, there is also
evidence for inputs from other sensory modalities converging onto the MB calyces: direct
connections from the optic lobes to the calyx have been observed in crickets (Honegger

Introduction 16
and Schurmann, 1975), bees (Mobbs, 1982), and ants (Gronenberg, 1999). In
cockroaches there is some evidence as well for mechanosensory and auditory afferents
(in addition to olfactory and visual) supplying the calyces (Strausfeld and Li, 1999a). In
some insect species, the inputs from these sensory modalities tend to be segregated into
discrete calycal zones. For example, calyces in bees and ants are subdivided into three
zones, each apparently receiving a specific modality of sensory input: the lip receives
olfactory input from the AL, the collar visual input from the optic lobe and the basal ring
receives input from both areas (Mobbs, 1982; Gronenberg, 1999). In the locust, however,
branches from PN axons seem to branch uniformly throughout the main calyx (S. Farivar,
personal communication). It is not yet understood how these different sensory modalities
interact in the MB, but the fact that MBs receive this type of multimodal input has led
researchers to hypothesize that a possible role of the MBs could be to place olfactory
information in a wider multimodal context (Strausfeld, 2002).
Some experimental attempts to assign specific functional roles to MBs have implicated
them in place memory (Mizunami et al., 1998a) and in making choices with conflicting
cues (Tang and Guo, 2001) but so far the most evidence that has accumulated indicates
that MBs are required for olfactory learning and memory [for a review, see (Heisenberg,
2003)]. Initial experiments in mutant flies lacking complete MBs (mushroom bodies
deranged and mushroom bodies miniature) showed that these flies were deficient in
olfactory learning (Heisenberg et al., 1985). Further experiments testing olfactory
classical conditioning in a T-maze (Tully and Quinn, 1985) on wild-type flies whose

Introduction 17
MBs were ablated (by feeding them hydroxyurea when the MB neuroblasts are dividing)
also show that olfactory learning is impaired (de Belle and Heisenberg, 1994).
Several lines of evidence have implicated the cAMP signaling pathway in these MB-
related learning deficits. For instance, a constitutively activated G-protein targeted to the
MB abolished olfactory learning (Connolly et al., 1996). Rescue experiments involving
genes whose products are involved in the cAMP pathway also support this idea (Waddell
et al., 2000; Zars et al., 2000). Rutabaga is a mutant fly with impaired olfactory learning.
The rutabaga gene encodes a Ca2+/calmodulin-dependent adenylyl cyclase and restoring
rutabaga expression specifically to the MBs rescues olfactory learning in these mutants
(Zars et al., 2000). The product of the amnesiac gene has been linked to cAMP synthesis
and amnesiac mutants show impaired olfactory memory. Restoring amnesiac expression
in two cells which express it strongly in wild-type flies and project profusely to the MB
lobes rescues olfactory memory (Waddell et al., 2000). A common problem with these
experiments, however, is that the promoters are often less specific than advertised,
leading to some doubt about the causal link between the deficit and the neural locus of
genetic intervention.
Further experiments using a temperature-sensitive shibire transgene (shits1) have focused
on distinguishing between the role of KCs in three different stages of olfactory
conditioning: acquisition, storage and retrieval (Dubnau et al., 2001; McGuire et al.,
2001; Schwaerzel et al., 2002; McGuire et al., 2003). The shibire gene encodes a
dynamin GTPase thought to be essential for synaptic vesicle recycling and thus, for

Introduction 18
synaptic transmission; the temperature-sensitive transgene renders dynamin inactive
when temperatures are raised above 29oC. By expressing shits1 exclusively in KCs, and
raising the temperature at different stages of the conditioning trials, experimenters are
able to evaluate whether KC synaptic transmission is required for these stages. Although
some of these results are not totally clear (e.g., regarding secondary effects the expression
of shits1 may be having on the flies performance, both at and above the permissive
temperature; and whether shits1 expression is truly specific to the KCs in some of the fly
lines), they all seem to suggest that KC output is required for retrieval of olfactory
memories, but not for their acquisition or storage.
As can be seen from the above descriptions, there have been numerous genetic and
anatomical studies of MBs [starting with the accounts of Dujardin and Kenyon in the
XIX century (Dujardin, 1850; Kenyon, 1896)]. However, even though it is an area that
has elicited so much interest, there is little physiological data on its intrinsic cells, the
KCs (Laurent and Naraghi, 1994). This is partly explained because KCs are very small
and fragile cells and have proven difficult to record from. Several important questions
remain unanswered, for instance: how do KCs respond to odors? how are odors
represented in the MB? what components of PN odor-evoked firing are relevant for KC
decoding of olfactory information?
Questions like these are not only important for understanding the specific function of
KCs and MBs within the insect nervous system, but can also provide valuable insights
into other neurobiological issues of wider relevance such as oscillations and correlated

Introduction 19
neuronal activity, as discussed in Section 1.1. Insect olfaction, and specifically the
transfer of information from the AL to the MB, is an ideal model system in which to
approach these broader neural coding questions because in this system, which seems to
be a nearly pure feedforward network (for there is no evidence of feedback projections
from the MB neurons back to the AL), we already know who does the encoding of
information (the AL), who does the decoding (the MB), and a significant amount about
the code that seems to be used (Laurent, 1996, 1999; Laurent et al., 2001).
1.3 Specific Issues to Be Addressed
In this dissertation I will focus on addressing two related questions: 1. How is olfactory
information decoded by the KCs, the intrinsic neurons of the MBs? 2. What is the role
served by neural oscillations in the transfer of information between the AL and MB?
With respect to MB decoding, the work in this dissertation will study the following
questions: Which are the relevant components in the AL activity that influence or
modulate KC responses? What are the mechanisms that make KCs selective to these
components? What is the time frame in which KCs integrate their inputs? In other words,
do they act as “temporal integrators” or “coincidence detectors”? Which is the
representation of olfactory information in the MBs that arises from these decoding
properties?

Introduction 20
The other important issue this dissertation will focus on (and one which is intimately
related to the decoding questions mentioned above) will be to understand how the
oscillations generated in the AL underlie the processing of information by downstream
components. We believe this is particularly important because understanding the role that
oscillations play in the processing of information in this system might shed light on their
role in other, more complex, systems. Identifying the transformation of representations
between AL and MB circuits can provide insights on the potential computational
advantages that oscillatory synchronization can serve for the representation, perception
and memory processes performed by various nervous systems.

21
2 Oscillations and Sparsening of Odor Representations
in the Mushroom Body
2.1 Introduction
Electroencephalogram (EEG) and local field potential (LFP) oscillations generally
indicate periodic coherent synchronization of neuronal assemblies (Adrian, 1942;
Steriade et al., 1993; Bragin et al., 1995; Gelperin, 1999; Rodriguez et al., 1999; Csibra et
al., 2000). Although the occurrence of macroscopic oscillations has now been correlated
with various sensory, behavioral or cognitive states in mammals (Eckhorn et al., 1988;
Gray et al., 1989; Patel and Balaban, 2000; Fries et al., 2001), the functional significance
of such observations is debated (Abbott and Dayan, 1999; Shadlen and Movshon, 1999).
Many hypotheses based on temporal correlations have been proposed (von der Malsburg
and Schneider, 1986; Abbott and Dayan, 1999; Diesmann et al., 1999; Engel et al., 2001;
Brody and Hopfield, 2003); among others, one proposes that cortical neurons might act
as coincidence detectors instead of integrators and thus select for correlated input
(Abeles, 1982; Konig et al., 1996). Most hypotheses, however, remain tentative for lack
of a direct experimental test. The olfactory nervous system, in which molecular design
(Mombaerts et al., 1996; Clyne et al., 1999; Gao et al., 2000; Vosshall et al., 2000),
circuit architecture (Mombaerts et al., 1996; Vosshall et al., 2000) and oscillatory
dynamics (Adrian, 1942; Hughes and Mazurowski, 1962; Laurent and Naraghi, 1994;
Gelperin, 1999; Lam et al., 2000) appear common across phyla, offers a rare opportunity
to study some of these coding issues.

Oscillations and Sparsening of Odor Representations in the Mushroom Body 22
The insect antennal lobe (AL) is the analog of the vertebrate olfactory bulb. In locusts,
each AL receives input from about 50,000 olfactory receptor neurons (ORNs) and
contains about 1,130 densely interconnected neurons (300 local inhibitory neurons, LNs;
830 excitatory, multiglomerular projection neurons, PNs) (Leitch and Laurent, 1996;
MacLeod and Laurent, 1996). Each AL sends distributed projections to the ipsilateral
mushroom body (MB), an area involved in olfactory memory (Heisenberg et al., 1985; de
Belle and Heisenberg, 1994; Zars et al., 2000; McGuire et al., 2001) (Figure 2-1). PNs
are the only channel for olfactory input to the MB. Conversely, there is no evidence for
feedback from the MB to the AL. Each locust MB contains about 50,000 small neurons
(Kenyon cells, KCs) (Kenyon, 1896; Laurent and Naraghi, 1994; Leitch and Laurent,
1996), whose spiny dendrites receive direct input from PNs (Laurent and Naraghi, 1994).
Odor-evoked PN responses exhibit globally coherent 20-30 Hz oscillations and stimulus-
and PN-specific slow modulation of firing rate, both shaped in great part by LN-mediated
inhibition (Laurent and Davidowitz, 1994; Laurent et al., 1996; MacLeod and Laurent,
1996; Wehr and Laurent, 1996). Hence, during a stimulus, the AL output consists of
barrages of spikes from an evolving PN assembly. Although individual PN spike timing
during one oscillation cycle can be phase-locked, this locking does not occur for all PNs
active during that cycle. At what time(s) a PN locks to others depends on both the odor
and the PN. To understand the decoding of PN output by KCs, we examine the firing
behavior of both populations at rest and in response to odors.

Oscillations and Sparsening of Odor Representations in the Mushroom Body 23
Figure 2-1. Olfactory circuits: Transverse section of the locust brain (left half, Bodian stain).
Olfactory input originates from ORNs on the antenna. ORN axons terminate in the AL, where PNs act as
relays, with projections to the MB and the lateral horn (LH). OL: optic lobe. Calibration: 80 µm.

Oscillations and Sparsening of Odor Representations in the Mushroom Body 24
2.2 Results
2.2.1 Resting activity
Baseline activity profiles of PNs and KCs were measured over several-minute-long
stretches of uninterrupted recording in naïve animals, with multiple tetrode recordings
(see Methods Sections 2.4.1, 2.4.2, 2.4.3). At rest, the PN population fired at a mean rate
of 3.87 ± 2.23 spikes/s per PN (range: 0.49 to 10.4; n = 35 PNs). Baseline firing was
>100 times lower in KCs (median: 0.025 spike/s; interquartile range: 0.088 spike/s; n =
23 KCs) (Figure 2-2). Hence, despite a constant excitatory drive from PNs, KCs at rest
remained remarkably inactive.
Figure 2-2. PN and KC baseline firing in the absence of odor stimulation. Thirty second rasters of 20
PNs (A) and 20 KCs (B) recorded with tetrodes. Note the exceedingly low baseline activity of KCs. Empty
rasters denote absence of action potentials during the randomly selected segment chosen for display. These

Oscillations and Sparsening of Odor Representations in the Mushroom Body 25
rasters, however, of course originate from identified KCs, whose action potentials occurred at other times
during the recording period. [PN data (A): O. Mazor & S. Cassenaer; KC data (B): J. Perez-Orive.]
2.2.2 Response selectivity
PNs and KCs were challenged in awake animals with a panel of odors (typically 17;
range: 5-24; 5-25 trials per odor; 1s pulses; 20-30 s between trials). Experimental
conditions were identical for PN and KC recordings.
Spiking response probability. The probability of observing a stimulus-evoked change in
firing behavior was different across the two populations (Figure 2-3). Most PNs exhibited
a reliable change in firing behavior within the first few seconds after stimulus onset. They
showed complex temporal patterning (with increases and decreases in instantaneous
firing rate) that often greatly outlasted the stimulus itself (Figure 2-3 A). Many of these
responses were inhibitory, and many of these inhibitory periods were followed by a
period of increased firing, up to five seconds after stimulus offset. We analyzed
excitatory response probabilities across PNs (and KCs) quantitatively, by a variety of
methods and analysis windows. We show here the results obtained with Method A (see
Methods Section 2.4.4; results obtained with the other methods are nearly identical Table
2-1, Figure 2-10). The distribution of response probabilities for PNs was broad (Figure
2-4 A), with a mean over all cells of 0.64 (median: 0.74; interquartile range: 0.57; n = 58
PNs, 1,140 PN-odor pairs). KC responses to these same odors were extremely rare: over
all KCs (n = 74 KCs, 1,101 KC-odor pairs), 58% failed to show any detectable response
to any of the odors presented (Figure 2-4 A). The distribution of response probabilities

Oscillations and Sparsening of Odor Representations in the Mushroom Body 26
was heavily skewed towards low values (Figure 2-4 A), even when only those KCs that
produced at least one response were considered. The mean response probability, after
averaging all the individual response probabilities of the KCs (Figure 2-4 A) (median:
0.00; interquartile range: 0.12) was 0.11. Figure 2-3 B shows three typical responsive
KCs. Among all recorded KCs, only two responded to all odors presented (8 and 10
odors, respectively). To avoid possible sampling bias, recordings were made from all
regions and depths of the KC cell body layers. Responsive and unresponsive KCs were
found everywhere, which is consistent with the anatomy of PN axonal projections in the
MB (Laurent and Naraghi, 1994). Similarly, no selection bias toward strong responses
existed, for the great majority of them were extremely brief and were rarely detected
during the recording. Selective and promiscuous KCs could occur simultaneously on the
same tetrode, which indicates that differences in tuning width were not caused by global
modulation of excitability over time.

Oscillations and Sparsening of Odor Representations in the Mushroom Body 27
Figure 2-3. In vivo tetrode recordings of odor responses in PNs (A and C) and KCs (B, D, and E).
Shaded area, odor puff (1 s). (A) Responses of three simultaneously recorded PNs (PN1 to PN3) to 16

Oscillations and Sparsening of Odor Representations in the Mushroom Body 28
different odors (first 10 trials with each stimulus displayed, top to bottom). Odors from top, left column:
hpo, don, che, hx3, unn, min, oca, pnn; right column: chx, oco, nnn, thx, 2hp, nna, 3hp, hxo. Abbreviations
are as follows: 1-hexen-3-ol (hx3), trans-2-hexen-1-ol (thx), cis-3- hexen-1-ol (chx), 1-hexanol (hxo), 1-
heptanol (hpo), 1-octanol (oco), hexanal (hxa), heptanal (hpa), octanal (oca), nonanal (nna), 3,7- dimethyl-
2,6-octadiene-nitrile (don), 3-pentanone ( pnn), 2-heptanone (2hp), 3-heptanone (3hp), 5-nonanone (nnn),
6-undecanone (unn), cherry (che), mint (min), geraniol (ger), vanilla (van), citral (cit), apple (app),
strawberry (str), amyl acetate (ama), benzaldehyde (bnh), methyl salicylate (mts), eugenol (eug), L-carvone
(lca), D-carvone (dca), dihydro-myrcenol (dhm). (B) Responses of 3 KCs to the same 16 odors. Conditions
are the same as in (A) with the following exceptions: for six of the odors, KC1 and KC2 have only five
trials; in KC2, the seventh odor in the right column is hxa. (C) Expanded view of PN1 rasters in response to
hxo (trials 3 to 15). Note alignment of spikes. (D) Response of a fourth KC to hx3 (trials 3 to 15). Note low
baseline activity and alignment of first spike in the response across trials. (E) Response of a fifth KC with
superimposed LFP, recorded in the MB (10-55 Hz bandpass). Note phase-locking of KC spikes. LFP = 400
µV. [PN data (A and C): O. Mazor & S. Cassenaer; KC data (B, D and E): J. Perez-Orive.]
Response intensity. Response patterns and intensities differed in PNs and KCs. Whereas
PN responses often lasted several seconds (Figure 2-3 A), KC responses were brief and
lacked the slow temporal patterning typical of PNs (Figure 2-3 B). Using responsive cell-
odor pairs, we counted action potentials produced by PNs and KCs over the 3 s window
after stimulus onset. The distribution of PN spike counts over that period was broad, with
a mean of 19.53 ± 10.67 spikes. KCs responded with 2.32 ± 2.68 spikes (Figure 2-4 A)3.
We found a negative correlation between KC spike count and response selectivity
(Spearman ranked correlation coefficient: -0.567, p < 0.05).
3 Most KC spikes occurred in the beginning of the response: response intensity was 2.33 ± 2.02 spikes over
the first 1.4 s; PNs produced 12.84 ± 7.29 spikes on average in that period.

Oscillations and Sparsening of Odor Representations in the Mushroom Body 29
Figure 2-4. Statistics and sparseness of PN and KC odor responses (see Methods Sections 2.4.4, 2.4.5).
(A) (Left) Frequency distribution of cell response probabilities; note opposite skew in PN and KC
distributions. (Right) Frequency distributions of response intensities (1 spike per bin, measured over a 3 s
window). Spike counts were computed only from cell-odor pairs with a detected excitatory response. (B)
Excitatory responses (filled squares) of individual PNs and KCs (columns) (n = 58 PNs, 74 KCs) to 17
different odors (rows: hx3, thx, chx, hxo, hpo, oco, nna, nnn, don, pnn, 2hp, 3hp, oca, unn, che, min, hxa).
Abbreviations are as in Figure 2-3. Open squares denote inhibition (PNs only) or absence of a response.
Gray squares indicate not tested. (C) Distributions of lifetime (left) and population (right) sparseness,
computed across all cells and all tested odors. SL and SP are significantly different across PNs and KCs (p <
0.001, t test for SP, z statistic for SL). [PN data: O. Mazor & S. Cassenaer; KC data: J. Perez-Orive.]

Oscillations and Sparsening of Odor Representations in the Mushroom Body 30
Temporal precision. PN spike probability and precision is PN-, odor- and time-specific
(Laurent and Davidowitz, 1994; Laurent et al., 1996; Wehr and Laurent, 1996). Time-
locked PN spikes were easily detected when they occurred in isolation (e.g., Figure 2-3
C), but they were also found within sustained responses, which is consistent with
previous intracellular results. In KCs, individual responses typically contained about two
spikes (Figure 2-4 A), at least one of which could be precisely locked to stimulus onset
with a fixed delay. Stimulus-locked spikes were often the first ones in the response of the
KCs but could occur at any cycle. The first spike in the response of KC4 (Figure 2-3 D),
for example, had a jitter of only ± 4 ms relative to stimulus onset. Stimulus-locked spikes
with such small jitter, however, were not commonly observed. Another measure of
precision, more relevant to this system, is the timing of each action potential relative to
its LFP oscillation cycle (phase) (Figure 2-3 E). The mean phase of KC spikes was 83o ±
77o (n = 18 KCs; 0o is oscillation peak, Figure 2-6 F). Mean spike phase was the same in
the most and in the least specific KCs (90o ± 67o vs. 86o ± 81o; n = 5 cells each). The
spikes within a doublet (or triplet) were typically separated by one to a few oscillation
cycles (e.g., Figure 2-3 E). This indicates that appropriate PN drive to individual KCs
lasted several oscillation cycles and that, when a KC spike was fired, it occurred
preferentially at the same phase of its oscillation cycle.

Oscillations and Sparsening of Odor Representations in the Mushroom Body 31
2.2.3 Sparseness of odor representations across PNs and KCs
Figure 2-4 B compresses the responses of 58 PNs and 74 KCs to the same 17 odors and
illustrates the contrast between the two population representations4. A simple estimate of
population sparseness (SP) is the proportion of cells unresponsive to each stimulus,
averaged over all stimuli. It thus represents the sparseness of the representation of each
odor across the population, averaged over all odors, but ignores the strength of each
response. SP was 0.90 in KCs and 0.33 in PNs. SP can also be calculated without relying
on how a response is defined by using firing rate distributions for each tested stimulus,
whether we detected a response or not (Rolls and Tovee, 1995)5 (see Methods Section
2.4.5). Applied to PNs and KCs, this measure of SP was again always greater in KCs
(Figure 2-4 C). Finally, sparseness can be calculated for each cell across all the stimuli it
has experienced. This measure, called lifetime sparseness, SL, approximates the mean
tuning width of each neuron averaged over all neurons. Again, SL was significantly
higher in KCs than in PNs (p < 0.001, t' test, Figure 2-4 C). SL and SP were also
calculated by using the other response analysis windows, or by using only the odor
responsive cells. By all measures, odor representations were always significantly sparser
across KCs than across PNs (Table 2-1 and Figure 2-10).
4 Responses were determined here according to Method A (see Methods Section 2.4.4). Nearly identical
results were obtained if responses were assessed by different criteria adapted to each population (Table 2-1
and Figure 2-10). 5 This sparseness measure had its origin in (Treves and Rolls, 1991). The measure was developed from this
idea to its current form in (Rolls and Tovee, 1995) and the normalizations we use here were those applied
by (Vinje and Gallant, 2000). (Willmore and Tolhurst, 2001) discuss these and other lifetime and
population sparseness measures.

Oscillations and Sparsening of Odor Representations in the Mushroom Body 32
2.2.4 Mechanisms underlying sparsening
Subthreshold KC activity during odor stimulation. Sharp electrode recordings (see
Methods Section 2.4.6) from KCs (n = 29) revealed odor-evoked, subthreshold activity
made up of periodic synaptic potentials (Figure 2-5 A). These were locked to the LFP
(Figure 2-5 B) and superimposed on a noisy and irregular synaptic background, away
from the firing threshold. Appropriate odor-KC combinations revealed reliable and time-
specific EPSPs and/or action potentials. The response of the KC in Figure 2-5 C, for
example, contained a train of prominent EPSPs late within the stimulus. One of these
EPSPs led to an action potential in half of all trials with that odor. A different KC
responded to the same odor with at least two reliable action potentials, at cycles 1 and 3
of the response, whether the neuron was at rest (Figure 2-5 D) or was held depolarized by
current injection. In all tested KCs, the existence, timing and reliability of these firing
events were odor specific. We noted that a large component of the odor-evoked activity
in KCs was inhibitory: if the KC was held depolarized by current injection, periodic
hyperpolarizing potentials could be seen during a response; if the KC was held above
firing threshold, odor-evoked inhibition interrupted this tonic firing (Figure 2-5 A and C).
Thus, odor stimulation also causes synaptic inhibition of KCs. Finally, the amplitude of
odor-evoked EPSPs paradoxically increased when the KC was held in a depolarized state
(Figure 2-5 A), which suggests active membrane properties. We examined the possibility
that synaptic inhibition and KC active conductances work together to make KCs
coincidence detectors of PN input.

Oscillations and Sparsening of Odor Representations in the Mushroom Body 33
Figure 2-5. In vivo sharp electrode intracellular records from different KCs during odor
stimulations. All action potentials are clipped. (A) Responses obtained while resting voltage was set by
holding currents between -10 and +80 pA. Horizontal bar, odor (cherry) delivery (800 ms). This KC never
produced any action potential in response to this odor at resting potential. Note oscillating membrane
potential at rest (0 pA), interruption of direct current-evoked firing by odor delivery (+20 to +80 pA traces),
and amplification of many discrete depolarizing potentials at most depolarized holding potentials. (B)
Sliding crosscorrelation of KC Vm and simultaneous LFP during hexanol odor puff [different KC from that
in (A)]. Red, maxima; blue, minima. y axis: time, 0.5 s. Note locking of signals during odor puff. (C) Third
KC recording, showing interruption of current-evoked firing by cherry odor response and prominent, late
EPSPs (•); 800 ms odor delivery (i). Repeated trials (1 to 4) show precise reoccurrence of these EPSPs
during the same epoch of the response; time calibration, 500 ms (ii). (D) Fourth KC and its spiking
response to cherry odor at cycles 1 and 3; 800 ms odor pulse. Vertical calibrations: KC, 10 mV (A and D),
8 mV (Ci), 6 mV (Cii); LFP, 300 µV, 1-40 Hz bandpass (C). [Intracellular traces of KC odor responses (A,
C and D): G. Laurent; cross-correlogram (B): G. C. Turner.]

Oscillations and Sparsening of Odor Representations in the Mushroom Body 34
Source of masked odor-evoked inhibition. Because direct effects of PNs are excitatory
and because locust PNs do not contain GABA (Leitch and Laurent, 1996), the source of
odor-evoked KC inhibition should be downstream of PNs. In addition to sending
collaterals into the MB, PN axons terminate in the lateral horn (LH) (Ernst et al., 1977;
Hansson and Anton, 2000). We identified among their targets there a cluster of about 60
GABA-immunoreactive neurons (lateral horn interneurons, LHIs), with direct axonal
projections to the MB (see Methods Section 2.4.7; Figure 2-6 A). Intracellular staining of
individual LHIs showed profuse axonal collaterals, overlapping with KC dendrites
(Figure 2-6 B). KC dendrites receive GABAergic input (Leitch and Laurent, 1996). LHIs
thus are well suited to be a source of the odor-evoked inhibitory inputs.

Oscillations and Sparsening of Odor Representations in the Mushroom Body 35
Figure 2-6. Feedforward inhibition of KCs by LHIs. (A) Immunolabeling by antibody to GABA (see
Methods Section 2.4.7). Cluster of about 60 reactive somata (LHI) and tract of LHI axons running to the
MB (stipples) are shown. The terminals of one of these axons in the MB are shown in (B). Bar, 100 µm.

Oscillations and Sparsening of Odor Representations in the Mushroom Body 36
(B) PN axon (black) projects to the MB calyx (orange) and to the LH (Ernst et al., 1977; Hansson and
Anton, 2000). LHI axon (green) projects to the calyx (this study). PN and LHI axons terminate on KC
dendrites (red). Neurons were stained by iontophoresis of cobalt hexamine (KC, PN) or neurobiotin (LHI)
in separate preparations and were drawn with a camera lucida. Note varicosities in LHI and PN axon
collaterals. Asterisk, KC axon. Bar, 50 µm. (C) Representative odor-evoked responses of two LHIs and
simultaneously recorded LFPs (5-40 Hz bandpass). Note membrane potential oscillations, locked to the
LFP. Identity and delivery (1 s long) of stimulus indicated by black bar. LHI, 20 mV; LFP, 400 µV; 200
ms. (D) Instantaneous firing rate of LHI1 [in (C)] in response to various odors. Lower edge of profile
shows mean instantaneous rate averaged across trials; profile thickness, SD. All LHIs responded to all
odors tested, with response profiles that varied little across different odors. (E) Sliding cross-correlation
between LFP and LHI2 traces (spikes clipped). Red, maxima; blue, minima. Strong locking is present
throughout the response (odor delivery, vertical bar). Lower edge of correlation stripes just precedes
stimulus onset due to width of the correlation window (200 ms). (F) Phase relationships between PN, KC,
and LHI action potentials, and LFP. (Upper) Polar plots. LFP cycle maxima defined as 0 rad, minima as π
rad (PNs: 3 cell-odor pairs, 388 spikes; LHIs: 17 cell-odor pairs, 2632 spikes; KCs: 18 cells, 862spikes).
Mean phases are shown in red. Gridlines are scaled in intervals of 0.10 (probability per bin). (Lower)
Schematic diagram showing LFP and mean firing phases. (G) Circuit diagram. [LHI anatomy and
physiology (A to F): G. C. Turner; PN recording (F): M. Westman; KC phase-locking (F): J. Perez-Orive.]
LHI responses to odors. LHIs responded vigorously and reliably to odors (Figure 2-6 C
and D). LHI membrane potential oscillated in phase with the LFP (Figure 2-6 E), and,
when sufficiently excited, LHIs fired one or a short burst of action potentials at each
oscillation cycle (Figure 2-6 C). In each cycle, LHI mean firing time lagged 173o behind
that of PNs (Figure 2-6 F). LHI firing phase was independent of odor identity. Synaptic
drive to KCs thus likely consists of EPSPs from PNs alternating with IPSPs from LHIs,
occurring preferentially in opposite halves of each oscillation cycle (Figure 2-6 F and G).
PN and LHI inputs to KCs differ in one important respect: because each KC on average
receives inputs from a very small fraction of the PNs and because the firing probability
and phase-locking of each PN typically evolves during a response, the probability that

Oscillations and Sparsening of Odor Representations in the Mushroom Body 37
many of the PNs presynaptic to a given KC fire together within the same half of one
oscillation cycle is low. By contrast, individual LHIs showed sustained responses to all
odors presented (Figure 2-6 D), consistent with the fact that 830 PNs converge onto only
about 60 LHIs. Because LHI axons diverge profusely in the MB (Figure 2-6 B),
individual KCs should receive periodic input composed of consistent IPSPs, alternating
with EPSPs whose total strength strongly depends on the stimulus.
Sharpening of KC response to direct PN stimulation. We next tested more directly
whether both synaptic inhibition and intrinsic active conductances assist coincidence
detection in KCs. To study single EPSP-IPSP cycles in isolation, we used direct electrical
stimulation of PNs instead of odors. Evoked postsynaptic potentials in KCs dramatically
changed shape and duration when we varied stimulus strength (Figure 2-7 A). At high
stimulus intensities, a sharp “spikelet” rode atop the depolarizing potential, suggesting
active conductances (Figure 2-7 A, top trace). This spikelet was not an artifact of
unusually strong stimuli: when a weak stimulus was used to elicit a smaller EPSP and
holding current was adjusted so that the KC was near firing threshold, spikelets could
also be observed (see Methods Section 2.4.8; Figure 2-7 B)6 (Schafer et al., 1994). Next,
we tested the idea that GABAergic feedforward inhibition also shapes PN-evoked
postsynaptic potentials. At voltages below spikelet threshold, EPSP shape remained
strongly voltage-dependent (Figure 2-7 C). Local injection of picrotoxin (PCT), a
6 Although we have not characterized this spikelet pharmacologically its shape and all-or-none waveform
suggest the involvement of voltage-dependent conductances (possibly Na+ or Ca2+ for depolarization and
K+ for repolarization), consistent with previous patch-clamp studies in vitro (Schafer et al., 1994).

Oscillations and Sparsening of Odor Representations in the Mushroom Body 38
GABAA-like chloride channel blocker, into the MB calyx (see Methods Section 2.4.9)
broadened the EPSP and decreased the voltage-dependence of EPSP shape (Figure 2-7
C). This indicates that the LHI-mediated IPSP normally contributes to the shape and
duration of PN-evoked EPSPs. Blocking inhibition in the calyx increased the scatter of
KC spike times after PN stimulation (Figure 2-7 D). LHI-mediated IPSPs thus contribute
to shortening the epoch during which a KC remains depolarized after each volley of PN
excitation; it could also explain why KC action potentials are so precisely phase-locked
during responses to odors (Figure 2-6 F). Hence, the tendency of each KC to convert its
excitatory input from PNs into an action potential can be facilitated in the early phase of
the compound EPSP by voltage-dependent depolarizing nonlinearities, and it can be
antagonized shortly thereafter by feedforward inhibition. The remaining voltage
dependence of the EPSP after PCT injection (Figure 2-7 C) suggests the existence of an
active repolarizing conductance. Thus, both active and synaptic properties probably
contribute to making KCs prefer coincident input, on a cycle by cycle basis.

Oscillations and Sparsening of Odor Representations in the Mushroom Body 39
Figure 2-7. KC responses to electrical stimulation of PNs. (A) PNs were stimulated directly with an
electrode placed in the AL and evoked EPSPs were recorded with a sharp electrode intracellularly from
KCs. Three traces show EPSPs recorded at progressively stronger stimulus intensities (bottom to top). Note
positive inflexion during rising phase of the top EPSP and sharp repolarization. Bar graph compares EPSP
half-width at the maximum stimulus intensity that was still below action potential threshold versus
halfwidth at 70% (± 5%) of this maximum intensity. EPSP half-width was significantly different at these
two stimulus intensities (P < 0.001, paired t test, n = 11 KCs). (B) Intrinsic active conductance amplifies
and sharpens EPSPs near threshold. KC was held near threshold with a constant holding current; PN
stimulus amplitude was constant. Successive trials elicited full-blown sodium spikes (light gray),
subthreshold EPSPs (black), or intermediate spikelets. Sample traces were collected in PCT; similar

Oscillations and Sparsening of Odor Representations in the Mushroom Body 40
spikelets were observed in control conditions (A). (C) Synaptic inhibition shortens KC EPSP. At
progressively depolarized holding potentials, EPSP half-width significantly decreased (half-width at -40
mV was significantly smaller than half-width at -60 mV; P < 0.0005, paired t test, n = 10 KCs); all
analyzed data were below threshold for spikelet activation. After PCT injection in MB, EPSPs became
broader (-60 mV half-width significantly increased in PCT; P < 0.05, t test, n = 9). EPSP shape was less
dependent on postsynaptic voltage (-40 mV half-width as percent of -60 mV half-width significantly
increased in PCT; P < 0.05, t test, n = 9) but was still voltage dependent (P < 0.05, t test, n = 9). Sample
traces are shown from two KCs in the same brain. (D) Synaptic inhibition narrows the window in which
KCs can fire after PN stimulation. Stimulus intensity was adjusted to elicit an EPSP of 5 to 10 mV (when
KC is held at -60 mV), and then holding current was adjusted so that this EPSP elicited a spike on 30% to
60% of trials. Representative traces (left) show those sweeps where spikes were elicited (arrows mark
stimulus, bars mark interquartile range of spike times). Sample traces are shown from two KCs in the same
brain. Group data (right) show the interquartile range for each cell. PCT significantly increased the
magnitude of the interquartile ranges (P < 0.05, t test, n = 6 control KCs, 6 KCs in PCT ). [Sharp
microelectrode recordings (A): J. Perez-Orive; whole-cell recordings (B to D): R. I. Wilson.]
2.2.5 Influence of feedforward inhibition on KC responses to odors
If feedforward inhibition competes with and resets the periodic excitation of KCs by PNs,
antagonizing LHI-mediated inhibition should decrease KC specificity to odors. KCs
recorded in vivo with tetrodes were tested with up to 17 odors (ten trials per odor) and
retested immediately after PCT injection (see Methods Section 2.4.9) into the MB (Figure
2-8). PCT caused no significant change in the KC baseline firing rate (medians: 0.018
spikes/sec after PCT vs. 0.005 before, n = 12 KCs, p = 0.19, nonparametric sign test).
PCT caused a broadening of KC tuning, characterized by greatly reduced odor selectivity
(Figure 2-8 A to C). Even in KCs that responded to none of the odors presented in
controls, responses to these same odors appeared after PCT (Figure 2-8 A to C).
Individual KCs did not become responsive to all odors but rather to a larger subset of all
tested odors. The mean population and lifetime sparseness calculated over this KC subset

Oscillations and Sparsening of Odor Representations in the Mushroom Body 41
was significantly decreased after PCT (SP = 0.70 to 0.41, n = 11 odors, p < 0.001, paired t
test; SL = 0.47 to 0.30, n = 12 KCs, p < 0.05, nonparametric Wilcoxon signed-rank test).
Individual KC response intensity after PCT treatment was not significantly different from
control (control: 1.96 ± 0.81 spikes; PCT: 1.82 ± 0.47 spikes), but KC action potentials
after PCT lost their locking to the LFP7 (PCT: Figure 2-8 D; controls: Figure 2-6 F). This
confirms earlier experiments (Figure 2-7 C and D) which suggest that LHI-mediated
IPSPs normally constrain KC integration and spike timing.
7 PCT application to the MB did not abolish the LFP oscillations recorded there, for the principal source of
these oscillations —synchronized, periodic synaptic input drive from PNs— was excitatory and cholinergic
(nicotinic) (MacLeod and Laurent, 1996; Oleskevich, 1999).
Oscillations and Sparsening of Odor Representations in the Mushroom Body 42
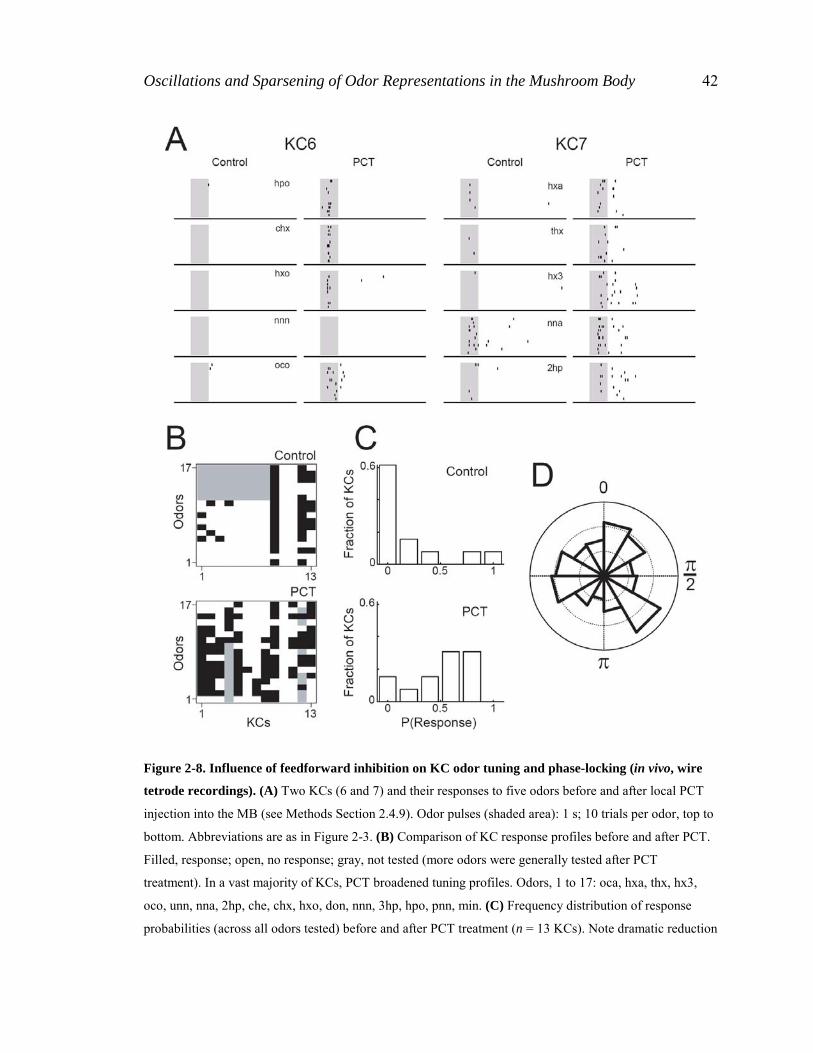
Figure 2-8. Influence of feedforward inhibition on KC odor tuning and phase-locking (in vivo, wire
tetrode recordings). (A) Two KCs (6 and 7) and their responses to five odors before and after local PCT
injection into the MB (see Methods Section 2.4.9). Odor pulses (shaded area): 1 s; 10 trials per odor, top to
bottom. Abbreviations are as in Figure 2-3. (B) Comparison of KC response profiles before and after PCT.
Filled, response; open, no response; gray, not tested (more odors were generally tested after PCT
treatment). In a vast majority of KCs, PCT broadened tuning profiles. Odors, 1 to 17: oca, hxa, thx, hx3,
oco, unn, nna, 2hp, che, chx, hxo, don, nnn, 3hp, hpo, pnn, min. (C) Frequency distribution of response
probabilities (across all odors tested) before and after PCT treatment (n = 13 KCs). Note dramatic reduction

Oscillations and Sparsening of Odor Representations in the Mushroom Body 43
of proportion of specific KCs (leftmost bin) after PCT treatment. Median response probabilities: 0.09
(control), 0.59 (PCT). (D) Phases of KC spikes relative to LFP during odor-evoked responses (0 rad, max;
π, min of LFP voltage). Vector strengths: 0.03 (PCT) versus 0.41 (Figure 2-6 F, control). Gridlines are in
intervals of 0.05 (probability per bin). [J. Perez-Orive.]
2.3 Discussion
In the AL, individual odors are represented by a large fraction of the 830 PNs: baseline
activity is high, sparseness is low and individual PN responses are sustained. In the MB,
the same odors activate a small proportion of neurons in a larger population (50,000
KCs): baseline activity is close to 0, sparseness is high and individual KC responses are
rare and typically contain only two action potentials. KC action potentials thus each carry
much more information than those of PNs.
2.3.1 How does sparsening arise?
We propose that KCs act as selective coincidence detectors on periodic PN input:
because individual KCs receive inputs from only a small fraction of PNs, because the
patterned responses of individual PNs are staggered in time and because EPSP
summation by KCs occurs best within a fraction of each oscillation cycle, the conditions
appropriate for bringing a KC to threshold are rarely met. During odor stimulation, each
oscillation cycle contains both locked and unlocked PN spikes (Laurent et al., 1996).
Periodic IPSPs, caused in KCs by LHIs whose mean firing is in antiphase with the
discharge of the synchronized PNs, antagonize the action of inappropriately timed PN
action potentials. When LHI-mediated inhibition is blocked, this normally antagonized

Oscillations and Sparsening of Odor Representations in the Mushroom Body 44
excitatory drive to KCs can now summate over a longer time window: KCs lose much of
their specificity. Time-locked feedforward inhibition thus helps define very short but
renewed (once per oscillation cycle) integration windows for each KC, akin to a periodic
reset, with critical consequences for KC specificity.
None of the features uncovered so far (oscillatory patterning, feedforward inhibition, fan-
in and fan-out, active properties) are unusual ones (Contreras et al., 1997; Haberly, 1997;
Fricker and Miles, 2000; Galarreta and Hestrin, 2001; Pouille and Scanziani, 2001). In
particular, distributed and partly overlapping projection patterns of mitral cells have been
seen in rodent prepiriform cortex (Zou et al., 2001) and local feedforward inhibitory
circuits are common (Contreras et al., 1997; Pouille and Scanziani, 2001; Brand et al.,
2002). Nonlinear intrinsic properties have been seen in some cortical and hippocampal
cells among others and hypothesized to underlie coincidence detection (Margulis and
Tang, 1998; Fricker and Miles, 2000; Galarreta and Hestrin, 2001). We show here that all
these properties exist together in the same circuit and that their concerted use in the
context of oscillatory activity results in a major transformation of sensory codes.
2.3.2 How could sparsening be useful?
Because the MB is a likely site for formation and retrieval of olfactory memories
(Heisenberg et al., 1985; de Belle and Heisenberg, 1994; Zars et al., 2000; McGuire et al.,
2001), we must ask why sparse codes might be advantageous there. Although it is clear
that extremely sparse codes [“grandmother” schemes, (Barlow, 1969)] may be

Oscillations and Sparsening of Odor Representations in the Mushroom Body 45
undesirable because they confer sensitivity to damage and low capacity, representations
carried by small subsets of neurons offer many theoretical advantages. First, overlaps
between individual representations are less likely than if each representation used a large
proportion of the available neurons, limiting interference between memories. This
system’s memory capacity can still be very high, because the total population size is large
and sparseness is not extreme. Second, comparisons between stimulus-evoked patterns
and stored memories are simpler if they invoke fewer elements. Similarly, associations
(for example, between odors and images) are facilitated. Third, representations become
more synthetic or “high level.” Every KC action potential compresses the signals carried
by several PNs that are each potentially more informative about stimulus composition.
Sparsened representations thus contain less explicit detail. This conclusion agrees with
behavioral and psychophysical observations in humans, rats and insects that odor
perception has a prevalent synthetic quality (Cain and Potts, 1996; Livermore and Laing,
1996; Linster and Smith, 1999).
2.3.3 Significance for neural coding
Our results have implications for understanding neural codes. First, single-neuron
responses can be exquisitely specific, extremely short (one or two spikes only), and
temporally precise (both within and across oscillation cycles). Studies of frontal, motor
and olfactory cortices show rare and very brief firing events, consistent with some of our
results (Tanabe et al., 1975; Nemitz and Goldberg, 1983; Vaadia et al., 1995; Duchamp-
Viret et al., 1996; Riehle et al., 1997). Second, subtle yet highly relevant activity patterns

Oscillations and Sparsening of Odor Representations in the Mushroom Body 46
may go undetected with many large-scale brain activity monitoring techniques: sparse
and brief activity is unlikely to be reflected in most macroscopic signals. Yet, as we show
here, this may sometimes be all there is. Lastly, to measure the relevant information
content of an action potential, one must know how downstream targets interpret it. For
example, we showed previously that PN action potentials typically phase lock to the LFP
only during certain (stimulus- and PN-specific) epochs of a response (Laurent et al.,
1996). Our results indicate that KCs will be more sensitive to phase-locked PN action
potentials than to those that occur closer to each LHI-mediated IPSP, whose timing is
itself determined by the locked PN population. PN spikes, therefore, are not all equally
meaningful to a KC. Even in cases in which firing rates are high, many spikes may be of
minimal significance to a target, because they are improperly timed. Here, relevance is
determined by interneuronal correlation. Hence, deciphering brain codes requires
evaluating these correlations and their consequences on the channeling of information.
Conversely, macroscopic oscillations may indicate the existence of neural filters, whose
properties will determine the interpretation one should make of a spike train.
2.4 Methods
2.4.1 Preparation and stimuli
Results were obtained from locusts (Schistocerca americana) in an established, crowded
colony. Young adults of either sex were immobilized, with one or two antennae intact for
olfactory stimulation. The brain was exposed, desheathed and superfused with locust
saline, as previously described (Laurent and Naraghi, 1994). Odors were delivered by

Oscillations and Sparsening of Odor Representations in the Mushroom Body 47
injection of a controlled volume of odorized air within a constant stream of dessicated air.
Teflon tubing was used at and downstream from the mixing point to prevent odor
lingering and cross-contamination. Odors were used at 10% vapor pressure (all PNs, 85%
of KCs) or 100% vapor pressure (15% of KCs, all LHIs), further diluted in the dessicated
air stream. Electrical stimulation of PNs was performed in the AL: typical stimulus
amplitudes 20-100 µA; 300 µs pulses; 25 µm tungsten wire bipolar electrodes; WPI
A360 stimulus isolator.
2.4.2 Tetrodes
Two types of tetrodes were used for extracellular recordings: silicon probes for PNs and
wire tetrodes for KCs. Silicon probes were generously provided by the University of
Michigan Center for Neural Communication Technology
(www.engin.umich.edu/facility/cnct/). Wire tetrodes were constructed with 0.0005” and
0.0004” (12.7 and 10.2 µm, respectively) insulated nichrome wire (REDIOHM wire with
PAC insulation, H.P. Reid). Four strands of wire were twisted together and heated to
partially melt the insulation. The tip was cut with fine scissors and each channel tip was
electroplated with gold solution to reduce the impedance to between 200 and 350 kΩ at
1kHz. The same custom-built 16-channel preamplifier (unitary gain) and amplifier
(10,000X) were used for both types of tetrodes. Data from each tetrode were filtered (in
custom-built amplifiers, bandpass 300-6,000 Hz) acquired continuously (15 kHz/channel,
12 bits) and stored. Two to four tetrodes were used simultaneously. Because of low
baseline activity and low response probability in KCs (see results), fewer KCs than PNs

Oscillations and Sparsening of Odor Representations in the Mushroom Body 48
were usually isolated in a typical recording session. Tetrodes were placed within the AL
or MB soma clusters, peripheral to the neuropils at depths less than 200 µm. Cell
identification was unambiguous because PNs are the only spiking neurons in the locust
AL, (LNs do not produce sodium action potentials) (Laurent and Davidowitz, 1994), and
because all the somata located above the MB calyx belong to KCs.
2.4.3 Extracellular data analysis
Tetrode recordings were analyzed as described in (Pouzat et al., 2002). Briefly, events
were detected on all channels as voltage peaks above a pre-set threshold (usually 2.5-3.5
times each channel’s signal SD). For any detected event on any channel, the same 3 ms
window (each containing 45 samples) centered on that peak was extracted from each one
of the four channels in a tetrode. Each event was then represented as a 180-D vector (4 x
45 samples). Noise properties for the recording were estimated from all the recording
segments between detected events, by computing the auto- and cross- correlations of all
four channels. A noise covariance matrix was computed and used for noise whitening.
Events were then clustered using a modification of the expectation maximization
algorithm. Because of noise whitening, clusters consisting of, and only of, all the spikes
from a single source should form a Gaussian (SD = 1) distribution in 180-D space. This
property enabled us to perform several statistical tests to select only units that met
rigorous quantitative criteria of isolation (Figure 2-9).

Oscillations and Sparsening of Odor Representations in the Mushroom Body 49
Figure 2-9. Extracellular tetrode recordings and spike sorting. (A) Raw data traces with PN action
potentials recorded in the AL (left), and KC action potentials recorded in the cell body layer of the MB
(right). Calibrations: 50 µV, 3 s (top traces), 3 ms (bottom traces). (B) Examples of two clusters: PN (left
panel) and KC (right panel). In each panel the traces on the left show the superimposed events classified for
that cluster (black) for each of the four tetrode channels, together with the average waveform (red).
Calibration: 100 µV, 1 ms. Two of the statistical tests used to evaluate the isolation of the cells in the model
are shown in (B) and in (C): on the right side of each panel in (B) is the variance around the mean for each

Oscillations and Sparsening of Odor Representations in the Mushroom Body 50
of the four channels, together with 95% confidence intervals which are based on the noise model. (C)
Projection tests in which each pair of clusters in the model in 180-D space is projected onto the line
connecting the cluster centers so as to evaluate their degree of isolation. All cluster centers are separated by
at least 5 times the noise SD. All analyzed data were selected on these separation criteria. [PN data: O.
Mazor & S. Cassenaer; KC data: J. Perez-Orive.]
2.4.4 Response definitions
Defining what constitutes a response quantitatively and equally accurately for PNs and
KCs requires careful consideration. For example, a conventional mean firing rate
measure applied to the entire “response period” is not appropriate, because PN responses
are patterned; a typical PN response, such as one composed of subsequent excitatory and
inhibitory epochs, often produces a mean rate no different from baseline, yet clearly
constitutes an odor-specific response; reliability across trials thus needs to be taken into
account. In addition, PNs and KCs have very different baseline firing statistics, implying
that response criteria based on a change from baseline might not apply equally well to
both populations.
We thus analyzed the data using a variety of methods and display, in our paper, the
results of one (Method A), applied identically to KCs and PNs. The analyses using other
methods, summarized in Table 2-1, yielded nearly identical results. Our methods go as
follows. First, for all methods, we used one of two response windows: short (0-1.4 s) and
long (0-3 s after stimulus onset), with stimulus on for 1 s in all cases. Method A used a 3
s window. Second (Method A), a PN or KC was classified as responding if its firing
behavior during the window met two independent criteria of response amplitude and

Oscillations and Sparsening of Odor Representations in the Mushroom Body 51
reliability: a. Amplitude: the neuron’s firing rate (measured in successive 200 ms bins,
averaged across all trials) had to exceed n SDs of the mean baseline rate in at least one
bin within the response window. Baseline rate was measured for each cell-odor pair over
a period of 3 to 5 s preceding stimulus onset and over all trials with that odor. We
explored values of n from 2 to 4. If n was low (e.g., n = 2 SDs) the rate of false responses
detected in PNs prior to stimulation was unacceptably high (> 35%). If n was high (n = 4
SDs), the proportion of missed responses (as judged by visual inspection of PN rasters
and peristimulus time histogram, PSTHs) during odor presentation was unacceptably
high (> 10%). Values of n of 3 or 3.5 gave low rates of both false positives (during
baseline) and false negatives (during stimulation) in PNs. Values of n between (and
including) 2 and 4 made no significant difference with KCs. We show the results with n =
3.5 (Method A, Figure 2-4); those obtained with other values of n are summarized in
Table 2-1. b. Reliability: to ensure that responses detected were reliable even at low firing
rates (characteristic of KCs), we required that more than half of all trials with each odor
contain at least one spike during the response window. We also analyzed the same data
sets using different criteria for PNs and KCs, each adapted to each population’s baseline
firing statistics. Despite this difference, the results (Table 2-1 and Figure 2-10) are nearly
identical to those shown in Figure 2-4.

Oscillations and Sparsening of Odor Representations in the Mushroom Body 52
Method A B C D E F G H
Threshold 3.5SD 2SD 3SD 4SD 3.5SD
Window 3s 3s 3s 3s 1.4s 3s 3s 3s
PN P(R) 0.64 0.73 0.68 0.61 0.51 0.64 0.65 −
False Pos. (%) 2.23 35.98 6.16 0.80 0.89 2.14 3.57 −
Overlap (%) − 90.71 96.34 96.79 87.41 99.73 99.55 −
KC P(R) 0.11 0.12 0.12 0.11 0.09 0.11 − 0.11
False Pos. (%) 0.09 1.46 0.18 0.00 0.00 0.09 − 0.00
Overlap (%) − 99.27 99.82 99.91 97.46 100.00 − 99.46
Table 2-1. Quantitative comparison of different methods of response detection. For each method, three
statistics are computed for PNs and KCs. Response probability (P(R)) indicates the probability of a
detected response, computed over all cell-odor pairs. The false positives value (False Pos.) is the
percentage of responses detected when the method was applied to a window of baseline activity prior to
odor onset (computed for all cell-odor pairs). The final statistic (Overlap), is a measure of similarity
between a particular method and Method A (see Section 2.4.4), defined as the percentage of cell-odor pairs
for which the two methods either both detected or both did not detect a response. Methods B-D are
identical to Method A, but use a different response amplitude threshold, ranging from 2 SDs to 4 SDs
above baseline. Method E is the same as Method A, but uses only a 1.4 s response window (0-1.4 s after
odor onset). Method F is based on Method A, but it uses a different reliability criterion that adapts to the
baseline statistics of the cell (as opposed to using one action potential as in Method A). In this method, an
odor response was deemed reliable if more than half of all trials contained at least one 200 ms bin with a
spike count higher than a threshold, specified as 1 SD above the mean baseline rate. Methods G and H are
the methods of response detection for PNs and KCs, respectively, described in Figure 2-10. [PN data: O.
Mazor & S. Cassenaer; KC data: J. Perez-Orive.]
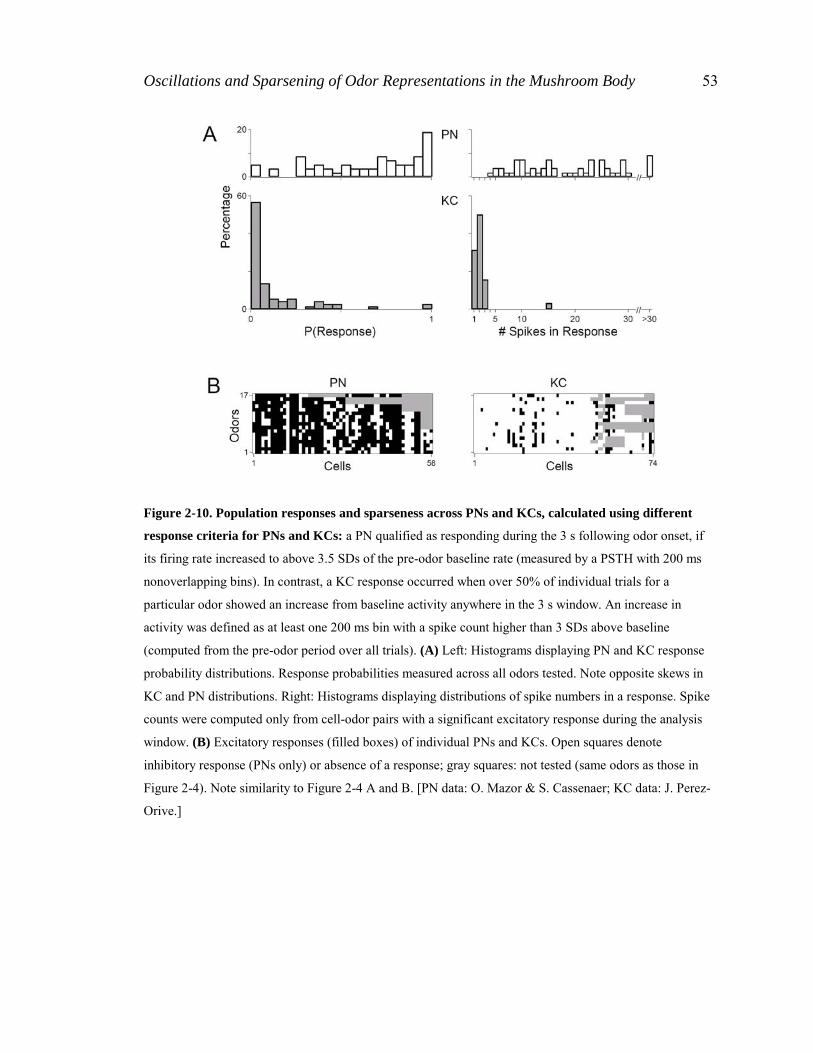
Oscillations and Sparsening of Odor Representations in the Mushroom Body 53
Figure 2-10. Population responses and sparseness across PNs and KCs, calculated using different
response criteria for PNs and KCs: a PN qualified as responding during the 3 s following odor onset, if
its firing rate increased to above 3.5 SDs of the pre-odor baseline rate (measured by a PSTH with 200 ms
nonoverlapping bins). In contrast, a KC response occurred when over 50% of individual trials for a
particular odor showed an increase from baseline activity anywhere in the 3 s window. An increase in
activity was defined as at least one 200 ms bin with a spike count higher than 3 SDs above baseline
(computed from the pre-odor period over all trials). (A) Left: Histograms displaying PN and KC response
probability distributions. Response probabilities measured across all odors tested. Note opposite skews in
KC and PN distributions. Right: Histograms displaying distributions of spike numbers in a response. Spike
counts were computed only from cell-odor pairs with a significant excitatory response during the analysis
window. (B) Excitatory responses (filled boxes) of individual PNs and KCs. Open squares denote
inhibitory response (PNs only) or absence of a response; gray squares: not tested (same odors as those in
Figure 2-4). Note similarity to Figure 2-4 A and B. [PN data: O. Mazor & S. Cassenaer; KC data: J. Perez-
Orive.]

Oscillations and Sparsening of Odor Representations in the Mushroom Body 54
2.4.5 Sparseness
Data were analyzed using Matlab (The Mathworks) and Igor Pro (Wavemetrics, Inc.).
The sparseness measures are taken from (Treves and Rolls, 1991; Rolls and Tovee, 1995;
Vinje and Gallant, 2000; Willmore and Tolhurst, 2001). In brief:
SP = (1 – [ [ΣNj=1 rj/N]2 / ΣN
j=1 [rj2/N] ] ) / (1-1/N),
where N is the number of units and rj is the response of unit j. Lifetime sparseness, SL, is
calculated in the same way, except that index j now corresponds to each odor and N to the
total number of odors tested with each cell. Analog response intensities for a given cell-
odor pair were computed by first segmenting the recording into 200 ms bins and
computing the mean spike count in each bin, averaged over all trials with that odor. We
then subtracted from all bin measures within the analysis window (1.4 or 3 s), the mean
baseline rate. All values calculated in this way greater than 0 over the window (7 or 15
bins) were then added. SP and SL vary between 0 and 1 (1 = sparsest).
2.4.6 Sharp pipette recordings and staining
Sharp electrode recordings of KCs (Figure 2-5, Figure 2-7 A) were made with
borosilicate glass micropipettes (DC R > 300 MΩ) filled with 0.2 or 0.5 M K-acetate or
patch electrode solution (see Section 2.4.8). KC input resistance at the soma was usually
around 1 GΩ. Signals were recorded with an Axoclamp–2B (Axon Instruments) and
acquired (10 kHz, 12 bits) with a PCI-MIO-16E-4 data acquisition board and LabVIEW
software (National Instruments). Intracellular recordings of LHIs (soma or dendritic
impalement, Figure 2-6) were made with borosilicate glass micropipettes filled with 0.5

Oscillations and Sparsening of Odor Representations in the Mushroom Body 55
M K-acetate (DC R:100-300 MΩ). Intracellular staining of LHIs (Figure 2-6 B) was
carried out by iontophoretic injection of 2% neurobiotin in 0.5 M K-acetate (0.5 s current
pulses of -2.5 to -3.5 nA at 1 Hz for 30-60 min). Injected neurons were visualized in
whole mounts using a diaminobenzidine-based chromogenic reaction (Wicklein and
Strausfeld, 2000). LFPs were always recorded in the MB calyx, using saline-filled patch
pipettes (DC R: 2-15 MΩ) or wire tetrodes (see Section 2.4.2).
2.4.7 Immunocytochemistry
Anti-GABA immunostaining (Figure 2-6 A) was carried out in whole locust brains using
the following protocol [modified from (Power, 1997)]. Partially desheathed locust brains
were fixed for 1 h in 5% formaldehyde, desheathed and washed for 20 h in phosphate
buffered saline (PBS). Brains were then dehydrated through an ethanol series, placed in
propylene oxide for 20 min, rehydrated and then agitated for 5 h in PBS containing 5%
Triton X-100 and 0.5% bovine serum albumin (PBS 5% T 0.5% BSA). They were then
washed for 30 min in PBS 0.5% T 0.5% BSA, and transferred to fresh PBS 0.5% T 0.5%
BSA containing anti-GABA at 1:100 dilution, or, for negative control, to PBS 0.5% T
0.5% BSA lacking primary antibody. After incubation at 4ºC for 6 days, brains were
washed for 2 h in PBS at room temperature and transferred to PBS 0.5% T 0.5% BSA
containing fluorescein isothiocyanate-conjugated goat anti-rabbit IgG at 1:20 dilution and
incubated at 4ºC for 4 days. They were then washed for 30 min in PBS, dehydrated
through ethanol series, cleared in methyl salicylate and examined by confocal laser
scanning microscopy. Figure 2-6 A is a projection along the z-axis of a stack of 30

Oscillations and Sparsening of Odor Representations in the Mushroom Body 56
optical slices each 2.7 µm thick, constructed using the public domain ImageJ program
(http://rsb.info.nih.gov/ij/). Negative control brains showed diffuse background staining.
2.4.8 Patch-clamp recordings
Whole-cell patch-clamp recordings from KCs (Figure 2-7 B to D) were obtained in a
semi-reduced preparation. After the brain was exposed, it was removed from the head
with antenna and eyes still attached, placed on a glass cover slip in a custom-built
chamber, and immobilized using insect pins placed in the eyes. The brain was then
desheathed as previously described (Laurent and Naraghi, 1994). Recordings were
obtained from KC somata under visual control using a microscope with IR-DIC imaging.
Patch pipettes (5 to 6 MΩ) were filled with a solution of (in mM): K gluconate 185,
HEPES 10, EGTA 1, MgATP 4, Na3GTP 0.5 (335 mOsm, pH 7.2). Glucose (10 mM)
was substituted for an equimolar amount of sucrose in the external saline solution, and
the saline was bubbled continuously with O2. Hyperpolarizing current injections (10 pA)
were used to continually measure intrinsic membrane properties, and the cell was
accepted for recording as long as Rinput > 1 GΩ and Raccess < 40 MΩ. Data was acquired
on an Axopatch 1D (Axon Instruments) amplifier at 10 kHz and lowpass filtered at 5
kHz. Note: In whole-cell current-clamp mode, typical EPSP duration in controls at -60
mV (Figure 2-7 B) was about twice that observed with sharp electrodes (Figure 2-7 A).
Oscillations and Sparsening of Odor Representations in the Mushroom Body 57
2.4.9 Picrotoxin injections
Patch pipettes were back-filled with a solution containing 1.67 mM PCT and 0.3% Fast
Green. After the pipette was introduced into the MB calyx (dendritic region of the MB,
see Figure 1-1), a pneumatic picopump (WPI) was used to apply a series of four to nine
100 ms, 10 psi pressure pulses. Each pulse injected approximately 1 pl of solution (as
measured by previous injection into a drop of oil). Injected solution remained exclusively
localized to calyx, as verified by dispersal of Fast Green.
2.5 Acknowledgments
The work presented in this chapter was previously published in (Perez-Orive et al., 2002).
This work is the product of a highly collaborative project between Javier Perez-Orive,
Ofer Mazor, Stijn Cassenaer, Glenn C. Turner, Rachel I. Wilson and Gilles Laurent: J.
Perez-Orive conducted the extracellular KC recordings (Figure 2-2, Figure 2-3, Figure
2-9), the measurement of KC phase-locking (Figure 2-6 F), the intracellular sharp
electrode recordings of KCs with PN electrical stimulation (Figure 2-7 A) and the
experiments testing the effect of feedforward inhibition on KC odor responses (Figure
2-8); the comparative analysis of PN vs. KC odor responses was conducted between J.
Perez-Orive, O. Mazor and S. Cassenaer (Figure 2-4, Figure 2-10 and Table 2-1). O.
Mazor and S. Cassenaer conducted the extracellular PN recordings (Figure 2-2, Figure
2-3, Figure 2-9). G. C. Turner discovered the LHIs, characterized their anatomical and
physiological properties (Figure 2-6) and provided the KC-LFP cross-correlogram
(Figure 2-5 B). R. I. Wilson provided the whole-cell patch-clamp recordings of KCs

Oscillations and Sparsening of Odor Representations in the Mushroom Body 58
(Figure 2-7 B to D). G. Laurent conducted the intracellular sharp electrode recordings of
KCs under olfactory stimulation (Figure 2-5).

59
3 Coincidence Detection and Oscillations in Kenyon
Cells
3.1 Introduction
In many sensory systems the mean firing rate of neurons contains information about the
stimulus (Adrian, 1926; Hubel and Wiesel, 1962; Britten et al., 1992; Parker and
Newsome, 1998). For this information to be “read,” downstream neurons must integrate
their inputs over time, in effect averaging any temporal patterns occurring in time scales
shorter than their integration window. Neurons however, could act as coincidence
detectors integrating their inputs over much shorter time frames, therefore responding
selectively to correlated input (Abeles, 1982; Carr and Konishi, 1990; Softky and Koch,
1993; Konig et al., 1996). In many different systems, selectivity for coincident inputs has
been linked to different intrinsic and circuit neuronal properties, including active
dendritic conductances (Margulis and Tang, 1998; Larkum et al., 1999; Galarreta and
Hestrin, 2001; Schiller and Schiller, 2001; Williams and Stuart, 2002; Ariav et al., 2003),
feedforward inhibition (Grothe and Sanes, 1994; Pouille and Scanziani, 2001; Brand et
al., 2002), and oscillatory activity (Singer and Gray, 1995; Engel et al., 2001; Lucke and
von der Malsburg, 2004). In the locust olfactory system all of these properties act
together, conveying coincidence detection attributes to the decoders of olfactory
information (Perez-Orive et al., 2002). To better understand how information is decoded
in this system we further explore its intrinsic and circuit properties, both in control
conditions and after oscillatory synchronization has been abolished.

Coincidence Detection and Oscillations in Kenyon Cells 60
Each locust antennal lobe (AL) has 830 excitatory projection neurons (PNs) which
synapse onto the dendrites of the intrinsic cells of the ipsilateral mushroom body (MB),
called Kenyon cells (KCs) (Laurent and Naraghi, 1994; Leitch and Laurent, 1996). Odor-
evoked PN responses exhibit coherent 20-30 Hz oscillations and slow modulations of
firing rate which are odor- and PN-specific (Laurent and Davidowitz, 1994; Laurent et
al., 1996; Wehr and Laurent, 1996). Information contained in the oscillatory
synchronization of PNs has been shown to be functionally and behaviorally relevant
(Stopfer et al., 1997; MacLeod et al., 1998). This odor representation becomes drastically
sparsened in the MB (Perez-Orive et al., 2002), a brain area involved in the formation,
retrieval and extinction of olfactory memories (Heisenberg et al., 1985; McGuire et al.,
2001; Schwaerzel et al., 2002; Heisenberg, 2003).
Previous intracellular recordings of KCs have indicated that these cells can generate
sharp spikelets suggestive of active conductances which could summate coincident input
supralinearly (Laurent and Naraghi, 1994; Perez-Orive et al., 2002). By using both
intracellular recordings and computer simulations, we wished to further explore these
subthreshold properties and their potential role in the detection of coincident inputs. To
examine circuit behavior, we developed a network model which takes into account KC
intrinsic and circuit properties, and is capable of reproducing the olfactory representation
observed experimentally in the MB (Perez-Orive et al., 2002). We used this MB model to
gain insight into the possible advantages of a decoding system based on coincidence
detection. To test the role of oscillatory synchronization in the decoding of olfactory

Coincidence Detection and Oscillations in Kenyon Cells 61
information, we abolished AL oscillations pharmacologically [as in (MacLeod and
Laurent, 1996)] and used experiments and models to understand the effect of disrupted
AL temporal dynamics on KC odor tuning.
3.2 Results
3.2.1 KC subthreshold properties in vivo
We performed intracellular recordings on KC somata in vivo to study their subthreshold
responses to PN input. Monosynaptic excitatory postsynaptic potentials (EPSPs) were
evoked in the KCs by applying single pulse electrical stimulation to the AL, whose PNs
send axons to the MB calyx, where they make direct excitatory connections with KC
dendrites (Leitch and Laurent, 1996; Hansson and Anton, 2000). As more PNs were
recruited by increasing the electrical stimulus amplitude (SA), the EPSPs recorded from a
KC increased in amplitude indicating that several PNs converge on individual KCs.
Eventually an action potential was evoked (not shown). Very often, particularly if the KC
was held slightly hyperpolarized by DC current injection, we observed sharp “spikelets”
with a SA threshold smaller than that required to evoke a full-blown action potential
(Figure 3-1 A).

Coincidence Detection and Oscillations in Kenyon Cells 62
Figure 3-1. Subthreshold nonlinearities in KCs observed with intracellular recordings from KC
somata in vivo. (A) Influence on KC EPSP shape of increasing SA to PNs. Examples for three different
KCs. Increasing SA causes appearance of spikelet with distinct change in the waveform of the EPSPs (top
traces). Calibrations: 50 ms, 5 mV. Stimulus artifacts of different sizes (caused by different SAs which
varied across experiments because of slight differences in the placement of the stimulating electrode within
the AL) can be observed before the EPSPs in all raw data traces. (B) Shape metric capturing transition in

Coincidence Detection and Oscillations in Kenyon Cells 63
EPSP waveform by measuring rate of voltage change. Inset: Voltage trace (upper) and its time derivative,
Vdot (lower); calibrations: 30 ms, 3 mV, 3 mV/ms. The shape metric, ∆Vdot, is defined as the maximal
difference in Vdot. Main plot: ∆Vdot as a function of SA (always below action potential threshold) for
KC1 from (A). Gray arrow indicates abrupt nonlinear transition in shape metric as spikelet occurs. Smaller
black arrow indicates smaller change in EPSP waveform that can be observed in the middle traces in (A).
(C) Nonlinear behavior in KC EPSPs. Shape metric (mean ± SEM) measured for 17 KCs. Because each
KC had a different SA sensitivity (due to positioning of PN stimulating electrode) SAs are normalized
(arbitrary units, AU) at two points: SA = 3 is 100% of the SA before action potential threshold, and SA = 2
is 79±8% (mean ± SD) of this maximum, at which the largest stepwise increase in DVdot occurred in each
series. Inset: histogram showing the point in which this largest stepwise increase occurred for all 17 KCs;
the nonlinearity (SA = 2) occurs within a limited range of SA percentage values throughout the population
of recorded KCs. (D) Influence of holding current on EPSP shape. Examples for three different KCs.
EPSPs for each KC evoked by the same SA. Spikelets appear in a voltage dependent manner at more
depolarized potentials (top traces). Calibrations: 50 ms, 5 mV.
To characterize this property across all recorded KCs we used a metric of postsynaptic
potential shape, ∆Vdot, that can be thought of as quantifying its “sharpness”, taking into
account both rising and falling phases of an EPSP (Figure 3-1 B). When EPSPs are slow,
∆Vdot will be small, regardless of EPSP amplitude. ∆Vdot increases as the EPSP rises or
decays faster. ∆Vdot for a KC recorded with a series of increasing SAs is shown in
Figure 3-1 B. As the kinetics of the EPSP begin to change, ∆Vdot increases slightly
(middle traces in Figure 3-1 A; smaller black arrow, Figure 3-1 B), until an abrupt
nonlinearity occurs (gray arrow). At this SA, the cell receives enough PN inputs to
generate a spikelet. This nonlinear sub-spike-threshold behavior appears consistently
across the population of intracellularly recorded KCs (Figure 3-1 C). The value of SA at
which this nonlinearity occurs (expressed as a percentage of the maximum SA before
action potential generation) lies within a relatively narrow range (Figure 3-1 C, inset).
Spikelets could also be elicited by holding the KC at more depolarized potentials while

Coincidence Detection and Oscillations in Kenyon Cells 64
applying a constant SA, recruiting a fixed number of PNs (Figure 3-1 D). This supports
the idea that the nonlinear behavior is due to the recruitment of voltage-dependent
conductances by depolarization.
3.2.2 Single KC and network models
We explored the functional significance of this coincidence detection behavior in a
simplified model of a KC with realistic “active” conductances (see Methods Sections
3.4.5, 3.4.6) tuned to replicate the EPSP waveforms recorded in vivo (Figure 3-2 A). At
small stimulus amplitudes, EPSPs were not sufficient to depolarize the membrane
potential to potentials where the Ca2+ current could be activated; only passive responses
are exposed. When the EPSP amplitude was increased twofold, ICa activation, followed
by IK,A and IK(Ca), sharpened the EPSP (activation of the calcium current increasing the
speed of depolarization, the potassium currents ensuring fast repolarization). The sharp
“peak” riding on the otherwise smooth EPSP became more obvious at larger stimulus
amplitudes. At a stimulation amplitude just below Na+ action potential threshold, the
EPSP contained a sharp spikelet whose return to baseline was accelerated, and whose
half-width was similar to those observed in vivo [Figure 3-1, see also (Perez-Orive et al.,
2002)]. Besides sharpening the EPSP, the interaction between active depolarizing and
hyperpolarizing conductances increased the firing threshold, and reduced the delay
between EPSP onset and spike.
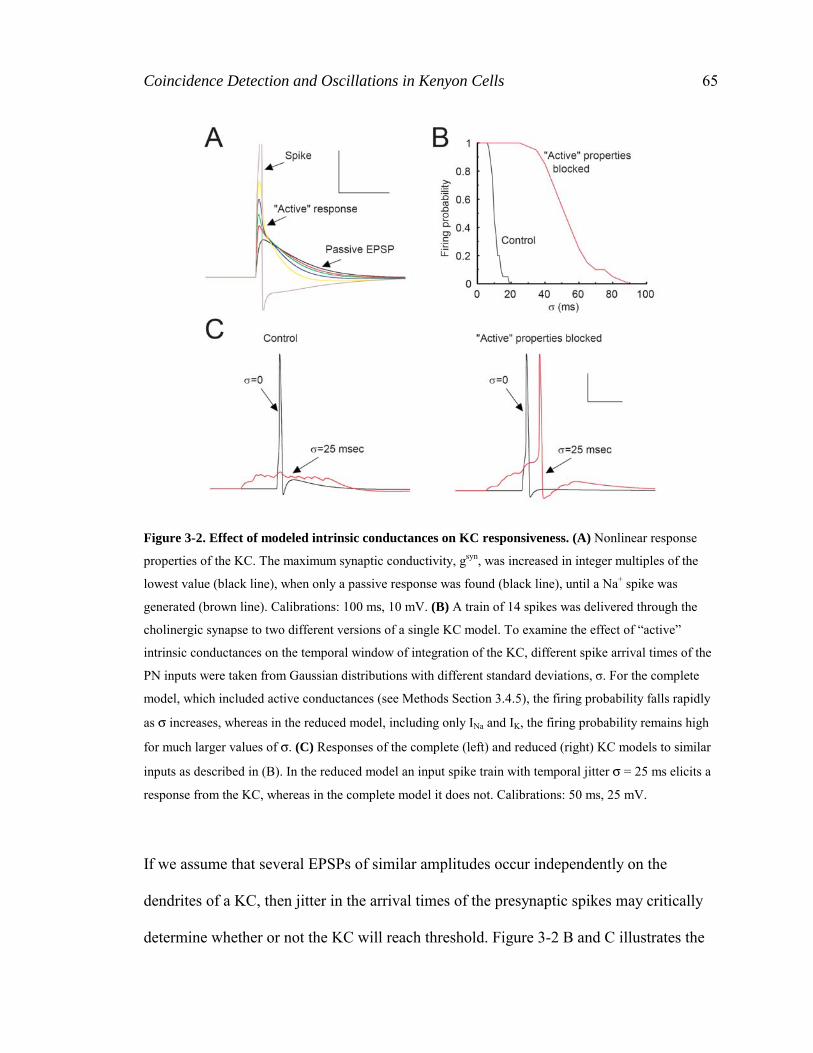
Coincidence Detection and Oscillations in Kenyon Cells 65
Figure 3-2. Effect of modeled intrinsic conductances on KC responsiveness. (A) Nonlinear response
properties of the KC. The maximum synaptic conductivity, gsyn, was increased in integer multiples of the
lowest value (black line), when only a passive response was found (black line), until a Na+ spike was
generated (brown line). Calibrations: 100 ms, 10 mV. (B) A train of 14 spikes was delivered through the
cholinergic synapse to two different versions of a single KC model. To examine the effect of “active”
intrinsic conductances on the temporal window of integration of the KC, different spike arrival times of the
PN inputs were taken from Gaussian distributions with different standard deviations, σ. For the complete
model, which included active conductances (see Methods Section 3.4.5), the firing probability falls rapidly
as σ increases, whereas in the reduced model, including only INa and IK, the firing probability remains high
for much larger values of σ. (C) Responses of the complete (left) and reduced (right) KC models to similar
inputs as described in (B). In the reduced model an input spike train with temporal jitter σ = 25 ms elicits a
response from the KC, whereas in the complete model it does not. Calibrations: 50 ms, 25 mV.
If we assume that several EPSPs of similar amplitudes occur independently on the
dendrites of a KC, then jitter in the arrival times of the presynaptic spikes may critically
determine whether or not the KC will reach threshold. Figure 3-2 B and C illustrates the

Coincidence Detection and Oscillations in Kenyon Cells 66
responses of two different KC models: one with active properties as described above
(control), the other without any active conductances other than INa and IK. A train of 14
spikes was delivered to each model with arrival times taken from a Gaussian distribution
with standard deviation σ. The synaptic weights from the PNs to the KCs were adjusted
so that the same minimal number of coincident EPSPs (with σ = 0 ms) was necessary to
trigger a KC spike (reducing them by 37% in the model without active conductances).
Thus, both models displayed a Na+ spike when all input spikes were synchronized (σ = 0
ms). As the jitter of spike arrival times increased (Figure 3-2 B), the model with the
complete set of active conductances failed to generate a spike starting at σ~12 ms, while
the reduced model showed reliable spiking up to σ~35 ms. For the reduced model the
window of integration was determined solely by the membrane time constant and was
much larger than in the complete model, which was more sensitive to coincident inputs.
The KC units were used to construct a network model consisting of 20 KCs receiving
excitatory input from 210 PNs and feedforward inhibition from 20 lateral horn
interneurons (LHIs) (Figure 3-3 A). The PN activity of the model (Figure 3-3 B, see
Methods Section 3.4.7) includes dynamic ensembles of synchronized neurons replicating
the behavior of PNs recorded in vivo (Laurent et al., 1996; Wehr and Laurent, 1996;
Perez-Orive et al., 2002) as well as of PNs in a complete AL model (Bazhenov et al.,
2001a; Bazhenov et al., 2001b). Figure 3-3 C shows the responses of the KCs to four
different “odors”, each represented by a unique input PN pattern. For each stimulus, one
to four KCs responded reliably with a Na+ spike on most trials in spite of small variations
in the inputs (in spike number and timing) from one trial to the next. Different KCs

Coincidence Detection and Oscillations in Kenyon Cells 67
spiked at different times (e.g., compare responses of KC6 and KC10 to odor 1),
depending on the timing of transient correlations between their respective PN inputs [see
(Stopfer et al., 2003)]. In the majority of cases, KCs were silent or fired only very few
action potentials, which occurred when a few input spikes coincided. In this model, KC
responses depended both on their intrinsic properties (active conductances) and on a
feedforward inhibitory circuit (Perez-Orive et al., 2002) whose effect is to reduce the
integration window of KCs. When LHI-mediated feedforward inhibition was removed,
many KCs responded with 1-3 spikes for each odor (Figure 3-3 D), consistent with
experimental findings (Perez-Orive et al., 2002). These results indicate that a network of
KCs with a simple set of active conductances and realistic circuit connectivity can
respond with high specificity to different inputs, decoding the correlation structure
contained in the input spike trains.

Coincidence Detection and Oscillations in Kenyon Cells 68
Figure 3-3. Odor specificity of KC responses in network model. (A) Network model geometry. Each
KC received 20 PN inputs from the AL; inputs were partially shared with neighboring KCs in the network
Coincidence Detection and Oscillations in Kenyon Cells 69
(input indexes are shown in the boxes). A network of 20 LHIs, each cell receiving all 210 inputs from the
AL and contacting all 20 KCs, provided feedforward inhibition to the KCs (see Methods Section 3.4.7). (B)
Firing patterns of 20 representative PNs are shown for 2 different odors. Each box represents activity for
one PN. Each stimulus (1 s, horizontal bars) was presented 20 times and included small variations between
trials. About half of the inputs were synchronized at each oscillation cycle and identities of the
synchronized inputs changed slowly over the stimulus duration (see Methods Section 3.4.7). (C) KC
responses to 4 different stimuli (1 s, horizontal bars). Each box represents one KC with 20 trials. Twenty
cells are shown for each odor. Two to four KCs fired reliably in response to each stimulus. (D) Removing
LHI mediated inhibitory input significantly reduced KC odor specificity. More than half of the KCs in the
network responded reliably for each stimulus (20 trials; 1 s, horizontal bars).
3.2.3 Odor responses of KCs in vivo with disrupted AL dynamics
To test the effect of AL dynamics on KC tuning, we performed in vivo experiments in
which picrotoxin (PCT), a GABAA-like chloride channel blocker, was injected into the
AL. Extracellular single unit tetrode recordings of KCs were made before and after PCT
treatment. Blocking of fast GABA mediated inhibition in the AL has been shown to
abolish PN oscillatory synchronization without significantly affecting mean PN firing
rate or slow response patterning (on a time scale of hundreds of ms) (MacLeod and
Laurent, 1996; MacLeod et al., 1998).
We tested KCs with a panel of odors (on average 12 odors per cell; range for each cell 5
to 17; 10 trials with 1 s odor pulses; 20 s inter-stimulus interval; n = 16 KCs) before and
immediately after PCT injection into the AL. Figure 3-4 A shows representative
examples of two cells and five odors. While neither cell showed a strong odor response in
the control condition, both cells respond consistently to many odors after PCT treatment.
Even though most KCs responded to zero or one odor in control conditions [as in (Perez-

Coincidence Detection and Oscillations in Kenyon Cells 70
Orive et al., 2002)], disrupting AL oscillatory dynamics with PCT in the AL increased
the probability of odor response of KCs (median probability of response: control, 0.00;
PCT, 0.42; Figure 3-4 B). Response intensity however (measured as the number of spikes
produced during an odor response), did not increase significantly with PCT treatment
(Figure 3-4 C). Because we observed few odor responses in control condition in the cells
recorded both before and after PCT (n = 16 KCs), this comparison includes additional
KCs that were each recorded in only one of the two conditions (control: n = 53 KCs with
responses; PCT: n = 17 KCs with responses).

Coincidence Detection and Oscillations in Kenyon Cells 71
Figure 3-4. Extracellular recordings of KC odor responses in vivo while blocking fast inhibition in the
AL. (A) Responses of two different KCs to five different odors, recorded both before and after local PCT
injection into the AL. Odor pulses (shaded area): 1 s; 10 trials per odor, top to bottom. Abbreviations are as
follows: 1-hexen-3-ol (hx3), trans-2-hexen-1-ol (thx), 1-octanol (oco), hexanal (hxa), octanal (oca), 3-
pentanone (pnn), 5-nonanone (nnn), cherry (che). (B) Frequency distribution of KC response probabilities
(across all odors tested) before and after PCT injection into AL (n = 16 KCs recorded both before and after
PCT treatment). Most KCs decrease their odor specificity after PCT injection. (C) Frequency distribution
of KC response intensities, as measured by number of spikes in a 3 s window, after PCT treatment (n = 17
KCs). Spike counts were only computed for cell-odor pairs with a detected response. Top gray bars depict
median, 25th and 75th percentiles for KC populations (control: n = 53 KCs with responses; PCT: n = 17
KCs with responses). Response intensity does not change significantly after PCT treatment.

Coincidence Detection and Oscillations in Kenyon Cells 72
Given that KCs appear to act as coincidence detectors, this result is counterintuitive, for it
suggests that KCs fire more easily if their input is desynchronized. It can be explained,
however, by considering the change in the instantaneous firing properties of PNs induced
by PCT, and the contribution of LHIs to KC firing. The intrinsic and circuit properties of
KCs confer upon them a preference for coincident input [Figure 3-1 - Figure 3-3; see also
(Perez-Orive et al., 2002)]. Under control conditions this input arises in the form of
periodic waves of excitation (from PNs) interspersed with periodic waves of inhibition
(from LHIs). The local field potential (LFP) recorded in the MB reflects the overall
influence of the PN population onto KCs. LFPs recorded during odor responses exhibit
prominent 20-30 Hz oscillations reflecting the oscillatory synchronization of PN
ensembles (Laurent and Davidowitz, 1994; Laurent and Naraghi, 1994; MacLeod and
Laurent, 1996) (Figure 3-5 A). Disruption of AL dynamics with PCT abolishes this
oscillatory synchronization (MacLeod and Laurent, 1996; Stopfer et al., 1997; MacLeod
et al., 1998) and causes an increase, at odor onset, of LFP power in the 3-9 Hz frequency
band (Figure 3-5 A and B). This increase in low frequency power at odor onset upon
block of fast inhibition was also observed in an AL model (Bazhenov et al., 2001a) and
reflects an excess of PN activity at odor onset but not later in the response (MacLeod and
Laurent, 1996; Bazhenov et al., 2001a) which is explained by the loss of fast inhibition,
but not slow inhibition, whose effect contributes to the sculpting of PN responses
occurring in the presence of PCT (MacLeod and Laurent, 1996; MacLeod et al., 1998).

Coincidence Detection and Oscillations in Kenyon Cells 73
Figure 3-5. Changes to LFP and KC response latency in vivo while blocking fast inhibition in the AL.
(A) Examples of four pairs of LFP recordings (3-55 Hz bandpass filtered) from four different animals, each
pair recorded with the same odor before and after PCT injection into the AL. Top bar indicates 1 s long

Coincidence Detection and Oscillations in Kenyon Cells 74
odor presentation; calibration bars 80 mV. Insets: power spectrum for each LFP recording, calculated from
a 1 s window starting 300 ms after the odor stimulus trigger (300 ms is the approximate time it takes for the
odor to reach the animal). Odor abbreviations: 5-nonanone (nnn), cis-3-hexen-1-ol (chx), 1-hexanol (hxo),
trans-2-hexen-ol (thx). (B) Power spectrum averages for all recorded traces (same odors before and after
PCT treatment; each condition: n = 468 trials, from 52 animal-odor pairs). Insets: mean ± SEM for 3-9 Hz
and 15-35 Hz frequency bands in each condition. After PCT treatment power in the 15-35 Hz band is
greatly reduced [due to abolishing of PN synchrony as described in (MacLeod and Laurent, 1996)] while
power in the 3-9 Hz band increases (p<0.02, n = 52, two-sided paired t test). (C) KC odor response
latencies. From top: PSTHs (smoothed with 10 ms Gaussian) of odor responses; examples of two KCs for
each condition (arrows indicate latencies for each response measured at the time of PSTH maxima),
population average, and frequency distribution of response latencies (control: n = 53 KCs with responses;
PCT: n = 17 KCs with responses). In control condition response latencies are more widely distributed,
while after PCT treatment all latencies occur close to odor onset, corresponding to the time of the low
frequency LFP activity. All panels in (A) and (C) use the same temporal scale on abscissa.
We examined if this small change in PN response profile could explain the change in KC
response probability induced by PCT. Our prediction was that the slight shift in PN
activity towards the early phases of odor response might cause the excess KC responses
seen in PCT conditions. If so, KC responses after PCT treatment would tend to occur at
odor onset, while those in control conditions would be more widely distributed in time.
This is indeed what we observed. The top three traces in Figure 3-5 C show smoothed
PSTHs (two examples and group data) of KC odor responses before (left) and after
(right) PCT treatment. The latencies of all recorded responses in both conditions (control:
n = 53 KCs with responses out of 122 KCs recorded without treatment; PCT: n = 17 KCs
with responses out of 22 KCs recorded after PCT treatment; different populations of KCs
had to be used here given that among the population of 16 KCs recorded both before and
after PCT treatment, there were too few responses in the control condition for a
significant comparison to be made) are shown in the bottom panels of Figure 3-5 C.

Coincidence Detection and Oscillations in Kenyon Cells 75
While responses in the control condition occurred throughout the stimulus period and
even beyond it, all responses under PCT conditions occurred at the time of the low
frequency power increase in the LFP (compare Figure 3-5 A and C).
3.2.4 Model of KC responses with desynchronized AL input
We next used our network model to examine the possible contribution of different circuit
effects on KC odor responses in PCT. To reproduce the effect of injecting PCT into the
AL, odor-evoked PN firing activity was modified in two ways: a) oscillatory
synchronization was eliminated, and b) the probability of PN firing at odor onset was
increased (see Methods Section 3.4.7) so that the simulated LFP (obtained by summating
all PN activity) displayed the early low frequency peak observed experimentally (Figure
3-5 A) and predicted by the full AL model when fast inhibition is blocked (Bazhenov et
al., 2001a). The PNs maintained their overall slow temporal patterns (Figure 3-6 A) , as
observed experimentally (MacLeod and Laurent, 1996; MacLeod et al., 1998) and the 20
Hz oscillations disappeared from the LFP (Figure 3-6 B).

Coincidence Detection and Oscillations in Kenyon Cells 76
Figure 3-6. Effects of abolishing PN oscillatory synchronization in the network model. (A) Firing
patterns of 20 representative PNs simulating PCT treatment of AL (20 trials for each PN). Horizontal bars:
1 s odor stimulus. Oscillatory synchronization has been abolished but slow temporal patterns remain. (B)
LFP presents oscillations in the control condition (left), and a flatter pattern with a low frequency onset
wave after blocking PN oscillatory synchrony (right). (C) Ratio of inhibitory (g–) to excitatory (g+)
instantaneous synaptic conductances (gsyn[O], see Methods Section 3.4.6) of an average KC under control
conditions (thin) and abolished oscillatory synchronization (thick). 1 s odor stimulus starts at time = 0 ms.

Coincidence Detection and Oscillations in Kenyon Cells 77
(D) PSTHs of all LHIs in the intact model (top; 0 ms, LFP maxima), and after abolishing PN oscillatory
synchronization (bottom; 0 ms, odor onset). When synchronization is disrupted, LHI activity is more
broadly distributed in time. (E) KCs exhibit a loss of odor specificity when AL oscillatory synchronization
is abolished (20 trials for each KC). Horizontal bars: 1 s odor stimulus.
One effect of disrupting AL oscillatory dynamics is that the LHIs, which are driven by
PNs, also lose their oscillatory synchronization. Figure 3-6 C shows the instantaneous
ratio of inhibitory (LHI-mediated) to excitatory (PN-mediated) synaptic conductance on
an average KC as a function of time during an odor stimulation. Given the observed
phase-lag between feedforward inhibition and PN excitation in control conditions (Perez-
Orive et al., 2002), this ratio directly reflected the 20 Hz periodicity of the excitatory PN
drive. Most LHIs fired at a similar phase of the oscillation cycle, providing strong
inhibitory input to their postsynaptic KCs (Figure 3-6 D) in antiphase with PN excitation.
After blocking oscillatory synchronization in the AL, LHI firing times were broadly
distributed (Figure 3-6 D) and the instantaneous contribution to KCs of inhibition relative
to excitation was reduced (Figure 3-6 C, red). Because LHI inhibition normally limits the
temporal window over which a KC can integrate its PN inputs (Perez-Orive et al., 2002),
this relative reduction of feedforward inhibition will lengthen this integration window
across oscillation cycles, reducing the preference of KCs for coincident input. Indeed,
under these conditions, the model KCs lost much of their odor specificity (Figure 3-6 E).
Furthermore, these responses occurred at odor onset (Figure 3-6 E), as observed
experimentally (Figure 3-5 C). If, however, PNs were desynchronized without a slight
increase in PN firing probability at odor onset (see Methods Section 3.4.7), KCs
remained silent (not shown). This suggests that the active properties of KCs alone could

Coincidence Detection and Oscillations in Kenyon Cells 78
limit the duration of the integration window and that an increase in random correlated PN
spikes is required. When KC active conductances were also blocked under these
conditions (and EPSP size properly adjusted as described above), no other mechanisms
remained in the model to select for coincident input and odor specificity was further
reduced (not shown).
3.2.5 Coincidence detection vs. temporal integration (modeling)
Theoretically, the high specificity of KCs to odors (Perez-Orive et al., 2002) might result
not from their ability to detect coincident input, but from appropriately tuned integrative
properties. We wished to test whether there is an intrinsic advantage to using coincidence
detection instead of classical integration over longer time windows to generate sparse
response patterns. Past behavioral work indicated that disrupting oscillatory
synchronization of PNs impairs the discrimination of molecularly similar odors (Stopfer
et al., 1997). A set of similar input vectors (simulated odors), which differed only in the
fast temporal structure of evoked PN activity (see Methods Section 3.4.7), was tested on
two versions of our network model: a complete “coincidence detector” model, as in
Figure 3-3 A, and an “integrator” model, in which the KCs’ active conductances (other
than those for Na+ spike generation) and feedforward inhibition were removed. The
synaptic weights from the PNs to the KCs were adjusted so that the same minimal
number of EPSPs was necessary to trigger a KC spike in both models. The coincidence
detector model responded to these odors in a highly specific way, with distinct KCs
responding to different odors (Figure 3-7 A, top). Conversely, in the integrator model, the

Coincidence Detection and Oscillations in Kenyon Cells 79
same set of KCs responded to all similar odors, losing their ability to discriminate
between them (Figure 3-7 A, bottom).
In another set of tests we used very dissimilar input vectors, differing by the identities of
the PNs that fired at different epochs of the odor responses. That is, not only the fast
temporal structure (as in Figure 3-7 A), but also the slower temporal structure varied
among odors. In our model this corresponds to molecularly diverse odors, belonging to
distinct chemical groups. In this case we observed that different KCs responded to
different odors in both the coincidence detector and the integrator models (not shown).
The fact that “integrator” KCs retain their specificity for these odors is a reflection of
their long time windows of integration, which are able to distinguish between input
vectors that differed in these longer time scales. Conversely, when the differences
between the input vectors consist only in changes in their fast temporal structure (i.e.,
whether they synchronize with each other at certain oscillation cycles or not), only the
coincidence detector models (with short temporal windows of integration) will be able to
discriminate between them.

Coincidence Detection and Oscillations in Kenyon Cells 80
Figure 3-7. Effects of coincidence detection vs. temporal integration in the network model. (A) Sets of
“similar” inputs (differing only in the fine temporal structure of PN firing) were presented to the models.

Coincidence Detection and Oscillations in Kenyon Cells 81
The control network (“coincidence detector”, top) responded with specific response patterns for each of
these odors (2 representative examples are shown). The model network with neither active conductances
nor feedforward inhibition (“integrator”, bottom) responded with the same pattern of active KCs for each of
these odors (same 2 odors as in top panels are shown). (B) Effect of additional PN “noise” spikes on KC
responses. Left, control input. Right, 25% extra spikes were added randomly to the input spike trains.
Coincidence detection model (top) responded with minor changes in firing patterns after adding the extra
spikes. In contrast, the response of the integrator model (bottom) changed dramatically and odor specificity
was lost. (C) Frequency distribution of KC response probabilities in both models after adding the extra
spikes. The coincidence detector model shows only a slight increase in response probabilities, while the
integrator model exhibits a drastic reduction in response specificity.
To explore the sensitivity to noise of these two types of models, we used two modeled
stimuli: a pure one and a “noisy” one, presented them with normal PN inputs representing
odor responses, and “noisy” inputs in which 25% extra PN action potentials were added
randomly. The coincidence detector model responded with minor differences to the
control and noisy inputs, while the integrator model was drastically affected by the extra
spikes, losing most of its odor specificity (Figure 3-7 B). Figure 3-7 C shows the
distribution of the probabilities of odor responses for KCs from the two models. After
adding extra spikes to the input, KCs from the coincidence detector model retained their
odor specificity, while those from the integrator model responded to most odors tested. In
the coincidence detector model an additional PN spike can potentially impact the KC
response only if it is placed within a small time window, which is a rare event if the extra
spikes come from uncorrelated noise. Conversely, in the integrator model, additional
spikes occurring in much larger time windows can contribute to the KC responses. These
modeling results suggest that the preference of KCs for coincident input confers upon

Coincidence Detection and Oscillations in Kenyon Cells 82
them the ability to discriminate between similar odors, as well as an increased robustness
to input noise.
3.2.6 KC tuning specificity and phase-locking (experiments)
Some of the mechanisms conferring coincidence detection properties to KCs (oscillatory
drive, subthreshold active properties, phase-delayed feedforward inhibition) also
contribute to the phase-locking of their action potentials to the cycles of LFP oscillations
(Perez-Orive et al., 2002). However, the precision of phase-locking varies among KCs, as
does their degree of odor specificity. We analyzed the relationship between odor
responsiveness and phase-locking in individual KCs, and found that the more odor
specific KCs display tighter phase-locking than the more promiscuous KCs. Figure 3-8
illustrates the degree of phase-locking for the 10 most specific KCs (having
P(Response)<0.06, which is typical for KCs), compared to 10 promiscuous KCs (having
0.35<P(Response)<0.48, which was less common). These KCs were the 10 most
promiscuous KCs with the exception of a few KCs with P(Response)≥0.7; these had
similarly poor phase-locking, but might be considered outliers because they were very
rare. Even though the average phase of KC spikes was the same in both groups, the
degree of phase-locking, as reflected by the polar histograms and vector magnitudes, was
stronger in the specific than in the promiscuous KCs (Figure 3-8). Throughout the
population of recorded responses in KCs, we found a significant negative correlation
between the probability of odor response and the phase vector magnitude of individual

Coincidence Detection and Oscillations in Kenyon Cells 83
KCs (r = -0.43, p<0.005, n = 42 KCs with responses and simultaneously recorded LFPs,
two-sided correlation t test).
Figure 3-8. Relationship between degree of KC phase-locking and odor specificity. Polar phase plots of
10 specific and 10 promiscuous KCs. LFP cycle maxima defined as 0 rad, minima as π rad. Red bar
indicates average phase and vector magnitude for each group. While average phases are similar, vector
magnitude for the promiscuous cells is 48% of that for the specific cells. Gridlines represent 0.10
(probability per bin).
3.3 Discussion
Active dendritic conductances have been shown, in culture and slices, to contribute to
coincidence detection by nonlinear summation of synchronized input in hippocampal and
neocortical pyramidal cells (Margulis and Tang, 1998; Williams and Stuart, 2002; Ariav
et al., 2003). Our in vivo experiments show that KCs in the locust exhibit highly
nonlinear subthreshold properties. In particular, they indicate that coincident EPSPs can
summate supralinearly, favoring coincidence detection. Many of these observed

Coincidence Detection and Oscillations in Kenyon Cells 84
subthreshold nonlinearities are likely due to the active conductances observed in KCs in
culture (Schafer et al., 1994; Grunewald, 2003). These nonlinearities can amplify
coincident EPSPs (as in the case of spikelets). Other nonlinear properties appear to be
caused by feedforward inhibition (e.g., middle traces in Figure 3-1 A and smaller black
arrow in Figure 3-1 B), as suggested by whole-cell patch-clamp recordings in which
inhibition to KCs was blocked (Perez-Orive et al., 2002). In this sense, both intrinsic and
inhibitory mechanisms appear to act together at the subthreshold level to confer KCs with
a preference for coincident input.
The active conductances which have been observed in cultured KCs (Schafer et al., 1994;
Grunewald, 2003) were included in a Hodgkin-Huxley type KC model (see Methods
Section 3.4.5). This simple model of a KC with realistic active conductances can produce
EPSP waveforms similar to those observed in vivo and demonstrates the important effect
that these active properties have on the temporal window in which a neuron integrates its
input. In particular, the active repolarizing currents decrease the width of postsynaptic
potentials, narrowing the temporal window in which the active depolarizing currents can
summate inputs supralinearly (Johnston et al., 1996; Fricker and Miles, 2000; Galarreta
and Hestrin, 2001). In agreement with these results, theoretical studies have found that
the temporal duration of EPSPs is a critical factor determining whether neurons
selectively detect coincident input (Abeles, 1982; Gerstner et al., 1996; Kempter et al.,
1998). When realistic PN activity is injected into a network model that includes these
active KC conductances and feedforward inhibition, KCs are silent most of the time and
their responses are highly specific and brief, indicating that these mechanisms are

Coincidence Detection and Oscillations in Kenyon Cells 85
sufficient to explain the sparsening of the odor representation observed in vivo (Perez-
Orive et al., 2002).
Disruption of PN oscillatory synchronization has been shown to decrease odor
discriminability behaviorally (Stopfer et al., 1997) and physiologically at the output
neurons of the MB (β-lobe neurons, directly downstream of KCs), but interestingly, not
at the level of PNs themselves (MacLeod et al., 1998). The present results shed light on
the location and possible mechanisms involved in this loss of discriminability. Our in
vivo recordings indicate that the loss of specificity exists first at the level of KCs. A loss
of information under these conditions must therefore occur in the decoding of PN output
by KCs. The increase in LFP low frequency power at odor onset, together with the fact
that all KC responses occur at this time, suggest that an increase in instantaneous PN
firing at odor onset contributes to the loss of specificity. A complete AL model in which
fast inhibition is blocked without disrupting slow inhibition, predicted similar changes in
the LFP as those observed here in vivo (Bazhenov et al., 2001a). In the AL model these
LFP changes reflect a small increase in PN activity exclusively at odor onset, before slow
inhibition has been activated (Bazhenov et al., 2001a).
Our network model supports the idea that a slight increase in PN activity that is time-
locked to odor onset is important for generating the observed KC loss of specificity.
Furthermore, the model predicts that a disruption of LHI feedforward inhibition
contributes as well to the observed increase in KC responsiveness: this inhibition is
driven by PN activity and when PN oscillatory synchronization disappears, the net

Coincidence Detection and Oscillations in Kenyon Cells 86
inhibitory drive on KCs is reduced (Figure 3-6 C), disrupting the periodic resetting of KC
postsynaptic potentials. Under control conditions KCs respond selectively to coincident
PN input that is synchronized within an oscillation cycle (Perez-Orive et al., 2002). When
oscillatory synchronization is abolished by blocking fast inhibition in the AL, this
coincident input can arise from spurious correlations caused by a small (and non odor-
specific) increase in PN activity which is time-locked to odor onset. Furthermore, if the
net effect of feedforward inhibition is weakened as suggested by the model, the
selectivity for coincident input is reduced, allowing KCs to integrate over larger temporal
windows. Experimental findings in the hippocampus (Pouille and Scanziani, 2001) and
auditory systems (Grothe and Sanes, 1994; Brand et al., 2002; Wehr and Zador, 2003)
support the idea that feedforward inhibition can be critical for allowing a neuron to detect
temporal differences in its inputs.
We found a significant correlation between the degree of phase-locking of individual
KCs and their odor specificity: the more odor-specific a KC is, the tighter its phase-
locking tends to be. Given that in this system phase-locking and coincidence detection
share common mechanisms —PN oscillatory drive, KC active properties, feedforward
inhibition— (Perez-Orive et al., 2002) and are therefore likely to be correlated, our
current results suggest a possible link between the sensitivity of individual KCs to
coincidence detection and their odor specificity.
The sparsening of the olfactory representation in the MB arises as a result of the
selectivity of KCs for input that is coincident within an oscillation cycle (Perez-Orive et

Coincidence Detection and Oscillations in Kenyon Cells 87
al., 2002). Given that theoretically the sparsening could have resulted from different
mechanisms relying on integration of inputs over longer time windows, it is important to
consider what are the possible computational advantages that can arise from coincidence
detection over classical integration strategies [e.g., (Sherrington, 1906; Adrian, 1926;
Eccles, 1957; Shadlen and Newsome, 1998)]. Two difficult problems an olfactory system
must solve are the discrimination between similar odors and robustness of odor
classification in a highly noisy environment (Cain and Potts, 1996; Laurent, 2002); other
sensory modalities need to solve analogous problems [e.g., (Dusenbery, 1992)], and to
the extent that they face comparable constraints, it is possible that they use similar
strategies. Our modeling results indicate that a coincidence detector strategy presents
important advantages in both of these problems over a classical integrator model. By
being sensitive to the timing of incoming action potentials on a fine time scale, a
coincidence detector allows for an extra coding dimension with which to solve these
complex problems (Laurent, 1999). Our modeling results show that this extra dimension
can allow an olfactory system to discriminate between similar odors, which only differ in
the fine temporal structure of the AL input, in a manner beyond the capabilities of a
decoding system integrating over longer time scales. Moreover, our current experimental
results indicate that oscillatory synchronization is required for the sparsening of the
olfactory representation that occurs in the MB. Abolishing these oscillations has been
shown to affect behavioral odor discriminability (Stopfer et al., 1997) supporting the idea
that a decrease in sparseness implies a reduced capacity of the system to represent distinct
odors (Marr, 1969; Kanerva, 1988; Laurent, 2002). In addition to this, by focusing on
specific time windows within an oscillation cycle, the coincidence detector model is less

Coincidence Detection and Oscillations in Kenyon Cells 88
sensitive to uncorrelated noise in its input, in agreement with theoretical studies in other
systems (Konig et al., 1996; Salinas and Sejnowski, 2000). In the locust, these
coincidence detection mechanisms provide a powerful strategy with which to solve
complex problems every olfactory system encounters.
3.4 Methods
3.4.1 Experimental preparation and stimuli
Electrophysiological experiments were conducted on locusts (Schistocerca americana)
from an established, crowded colony. Young adults of either sex were immobilized, with
one antenna left intact for olfactory stimulation. The brain was exposed, desheathed and
superfused with locust saline, as previously described (Laurent and Naraghi, 1994).
Odors were delivered by injection of a controlled volume of odorized air within a
constant stream of desiccated air. Teflon tubing was used at and downstream from the
mixing point to prevent odor lingering and cross-contamination. Several compounds
commonly associated in nature with green plants were used as odor stimuli. The complete
set of odors that were used are: 1-hexen-3-ol, trans-2-hexen-1-ol, cis-3-hexen-1-ol, 1-
hexanol, 1-heptanol, 1-octanol, hexanal, octanal, nonanal, 3,7-dimethyl-2,6-octadiene-
nitrile, 3-pentanone, 2-heptanone, 3-heptanone, 5-nonanone, 6-undecanone (Sigma
Chemical, St. Louis, MO), cherry, mint and geraniol (LorAnn Oils, Lansing, MI). Odors
were used at 10% vapor pressure (90% of KCs) or 100% vapor pressure (10% of KCs),
further diluted (approximately 1:10) in the desiccated air stream. Electrical stimulation of
PN axons was performed in the AL using 25 µm tungsten wire bipolar electrodes and a

Coincidence Detection and Oscillations in Kenyon Cells 89
WPI A360 stimulus isolator (World Precision Instruments, Sarasota, FL): 300 µs pulses;
typical stimulus amplitudes 20-100 µA.
3.4.2 Electrophysiology
Intracellular sharp electrode recordings of KCs (Figure 3-1) were made with borosilicate
glass micropipettes (World Precision Instruments, Sarasota, FL) filled with 0.2 M K-
acetate (DC R>200 MΩ). KC input resistance at the soma was usually around 1 GΩ.
Signals were recorded with an Axoclamp–2B (Axon Instruments, Union City, CA) and
acquired (10 kHz, 12 bits) with a PCI-MIO-16E-4 data acquisition board and LabVIEW
software (National Instruments, Austin, TX). For extracellular recordings (Figure 3-4,
Figure 3-5 and Figure 3-8), wire tetrodes were constructed with 0.0005” and 0.0004”
(12.7 and 10.2 µm, respectively) insulated nichrome wire (REDIOHM wire with PAC
insulation; Kanthal Palm Coast, Palm Coast, FL). Four strands of wire were twisted
together and heated to partially melt the insulation. The tip was cut with fine scissors and
each channel tip was electroplated with gold solution (SIFCO, Cleveland, OH) to reduce
the impedance to between 200 and 350 kΩ at 1 kHz. Tetrode recordings were made with
a custom-built 16-channel preamplifiers (unitary gain) and amplifiers (10,000X). Data
from each tetrode were filtered (in custom-built amplifiers, bandpass 300-6000 Hz)
acquired continuously (15 kHz/channel, 12 bits) and stored. Electrodes (either sharp glass
or one to three simultaneous tetrodes) were placed within the MB cell body layer, dorsal
to the neuropils, at depths less than 200 µm. Cell identification was unambiguous because
all the somata located in the layer above the MB calyx belong to KCs. Local field

Coincidence Detection and Oscillations in Kenyon Cells 90
potentials (LFPs) were recorded in the MB calyx, using wire tetrodes (bandpass filtered
1-6000 or 3-6000 Hz).
3.4.3 Picrotoxin microinjections
Patch pipettes were backfilled with a solution containing 5 mM (PCT) and 0.3% Fast
Green (Sigma Chemical, St. Louis, MO). The pipette was introduced into the AL and a
pneumatic picopump (World Precision Instruments, Sarasota, FL) was used to apply a
series of three or four 100 ms, 10 psi pressure pulses. Each pulse injected ca. 1 pl of
solution (as measured by previous injection into a drop of oil). Injected solution remained
exclusively localized to the AL, as verified by dispersal of Fast Green.
3.4.4 Analysis of experimental data
Data were analyzed using Matlab (The Mathworks, Natick, MA) and Igor Pro
(WaveMetrics, Lake Oswego, OR). Single unit activity was obtained from extracellular
data by using a modified expectation maximization algorithm and an empirically
characterized noise model (Pouzat et al., 2002), which allowed us to perform several
statistical tests so as to select only well isolated units meeting rigorous quantitative
criteria (Pouzat et al., 2002). A KC was classified as responding (e.g., in Figure 3-4) if its
firing behavior during a 3 s window starting at odor onset met two independent criteria of
response amplitude and reliability (Perez-Orive et al., 2002). The amplitude criterion was
satisfied in a given trial if at least one 200 ms bin had a firing rate which exceeded by 3
SDs the mean baseline rate. Baseline rate was measured for each cell-odor pair over a

Coincidence Detection and Oscillations in Kenyon Cells 91
period of 3 s preceding stimulus onset over all trials with that odor. To ensure that
detected responses were reliable even at low firing rates, the reliability criterion required
that the amplitude criterion be satisfied in more than half of all trials with each odor.
Several variations of this response definition were tested and yielded nearly identical
results (Perez-Orive et al., 2002). Phases of KC spikes with respect to LFP oscillations
were measured by linearly interpolating the time between the maximum (0° or 360°) and
minimum (180°) of the bandpass filtered (15-45 Hz) LFP.
3.4.5 Computational model; intrinsic currents
KCs and lateral horn interneurons [LHIs, (Perez-Orive et al., 2002)] were modeled as a
single compartment with channels governed by Hodgkin-Huxley kinetics: CmdV/dt = -
gL(V - EL) - Iint - Isyn, where Cm is the membrane capacitance, gL is the leakage
conductance, EL is the leak reversal potential, V is the membrane potential, Iint is the sum
of active intrinsic currents and Isyn is the sum of synaptic currents. The KC model
included a transient Ca2+ current, ICa (Laurent et al., 1993), a Ca2+ dependent K+ current,
IK(Ca) (Sloper and Powell, 1979), a transient (A-type) K+ current, IK,A (Grunewald, 2003);
fast Na+, INa, and delayed rectified K+, IK, currents were included to account for spike
generation (Traub, 1982). Current kinetics were adjusted to 23oC. The LHI model
included only INa and IK. The intrinsic currents were described as follows: Iintj = gj
mMhN(V-Ej), where gj is the maximal conductance for current ‘j’, Ej is its reversal
potential, m(t) and h(t) are activation and inactivation variables. In most of the
simulations, the maximal conductances and passive properties were Cm = 2.9·10-4 µF, gL

Coincidence Detection and Oscillations in Kenyon Cells 92
= 2.9·10-3 µS, EL = -65 mV, gKL = 1.16·10-3 µS (K+ component of the leak current), gNa =
26.1 µS, gK = 2.9 µS, gCa = 0.029 µS, gK(Ca) = 0.29 µS, gK,A = 0.0145 µS for KCs; and Cm
= 1.43·10-4 µF, gL = 7.15·10-3 µS, gKL = 7.15·10-4 µS, gNa = 14.3 µS, gK = 1.43 µS for
LHIs. EL values for LHIs were taken from a random distribution with 10 mV variability
(EL = -70 ± 5 mV) which led to variability in resting membrane potential across them.
Many of the maximal conductances indicated above were systematically varied in our
study to find the limits of observed phenomena.
The ICa current used for KCs had M = 2, N = 1, m∞ = 1/(1+exp(-(v+40)/10.0)), τm = 0, h∞
= 1/(1+exp((v+50)/4)), τh = (30.8+(211.4+exp((v+115.2)/5))/(1+exp((v+86)/3.2)))/18.
The IK,A current used for KCs had M = 1, N = 0, m∞ = 1/(1+exp(-(v+60)/1)), τm =
(1/(exp((v+35.82)/19.69)+exp(-(v+79.69)/12.7))+0.37)/3.74. The IK(Ca) current used for
KCs had M = 2, N = 0, m∞ = 3333[Ca]2/(3333[Ca]2+1), τm = 0. INa and IK were modeled
as in (Traub, 1982). For all cells ENa = 50 mV, EK = -95 mV, ECa = 12.8 log([Ca]O/[Ca]),
[Ca]O = 2 mM. For KCs, intracellular Ca2+ dynamics were described by a simple first-
order model: d[Ca]/dt = - A ICa - ([Ca]-[Ca]∞)/τ, where [Ca]∞ = 2.4 ·10-4 mM is the
equilibrium intracellular Ca2+ concentration, A = 1.7862 mM/(ms·µA) and τ = 100 ms.
3.4.6 Computational model; synaptic currents
All synaptic currents were calculated according to Isyn = gsyn [O] (V - Esyn), where gsyn is
the maximal conductivity, [O](t) is the fraction of open channels and Esyn is the reversal
potential. EsynnACh = 0 mV for cholinergic receptors, Esyn
GABA-A = -74 mV for GABAA

Coincidence Detection and Oscillations in Kenyon Cells 93
receptors. Synaptic currents were modeled by first-order activation schemes (Destexhe et
al., 1994): d[O]/dt = α(1-[O])[T] - β[O], where [T] represents the concentration of
transmitter (Bazhenov et al., 2001b). The rate constants, α and β, were α = 10 ms-1 and β
= 0.12 ms-1 for GABAA synapses and α = 0.94 ms-1 and β = 0.18 ms-1 for cholinergic
synapses. The maximal conductances were gnACh(KC) = 0.044 µS for AL afferents into
KCs, gnACh(LHI) = 0.0044 µS for AL afferents into LHIs, gGABA-A = 0.05 µS for synapses
from LHIs to KCs.
3.4.7 Network geometry and stimulation
The MB model consisted of populations of 20 KCs and 20 LHIs. Each KC received 20
inputs from the AL, with an overlap of 10 inputs between neighboring KCs (Figure 3-3
A). Thus a total of 210 afferents from the AL (PNs) were modeled. Each LHI received
the sum of all AL afferents. Random time delays (mean = 15 ms; S.D. = 7 ms) were
introduced to the LHI inputs to provide a response delay and some variability across LHI
firing (Perez-Orive et al., 2002). GABAergic synapses from all 20 LHIs projected then to
each KC. Each “odor” stimulus was represented by an input vector characterized by a
unique spatio-temporal pattern of activity across the 210 PNs. Typically about half of the
PNs were active at each instant of a given odor presentation. Additionally, about 50% of
the active PNs were synchronized with each other, producing 20 Hz oscillations in the
population average (representing the LFP). The identities of the active PNs changed
slowly over the stimulus duration to model the slow temporal structure of PN responses.
Similarly, the identities of the PNs that were synchronized at each oscillation cycle varied

Coincidence Detection and Oscillations in Kenyon Cells 94
to model transient spike synchronization. More specifically, we assumed that about 50%
of all PNs are active at the first cycle of odor-induced oscillations. Any active PN could
then become silent at the next cycle and vice versa. However, to maintain a realistic
correlation between PN activity patterns in successive cycles (Stopfer et al., 2003), a
higher probability (p = 0.6) was assigned for PNs to stay in their current activation state.
This created a temporal structure with excitatory and inhibitory epochs lasting on average
150 – 200 ms, consistent with experimental findings (Laurent et al., 1996; Stopfer et al.,
2003) and our previous results of AL modeling (Bazhenov et al., 2001a). The specific
spike timing of active PNs at different trials was calculated from Gaussian distributions
whose standard deviations, σ, were a function of PN and cycle numbers. Narrow
distributions (small σ) characterized PN spikes locked to the same phase of the LFP
oscillation across trials. Wide distributions characterized non-synchronized spikes (for a
given PN and time during the response). For a given neuron σ changed from one
oscillation cycle to the next to model transient patterns of spike synchronization (Wehr
and Laurent, 1996). To avoid abrupt transitions between synchronous and asynchronous
states, we gave higher probabilities for PN spikes to maintain their assigned σ from one
cycle to the next. In this way, approximately 50% of all active neurons were
synchronized at each oscillation cycle. Finally, to simulate multiple trials with the same
odor, small variations (from one trial to another) were included in the identities and
synchronization patterns of active PNs. Random low frequency spiking (4 ± 2 Hz) was
modeled to simulate baseline AL activity between odor presentations. “Different” odors
were modeled by completely different spatio-temporal patterns of PN activation, while
“similar” odors were represented by inputs having the same slow temporal structure (the

Coincidence Detection and Oscillations in Kenyon Cells 95
same PNs were active at each cycle of oscillations) but different patterns of
synchronization (i.e., even though the same PNs were activated at a given cycle, the
identities of those that were synchronized to the LFP was different). This choice of
“similar” versus “different” odors was motivated by experiments showing that PCT
application to the locust AL eliminated PN oscillatory synchronization, while preserving
the slow temporal structure of PN firing (MacLeod and Laurent, 1996; MacLeod et al.,
1998), and that this intervention disrupts the behavioral ability of the animal to
discriminate between odors belonging to the same chemical group (“similar” odors), but
preserves the ability to discriminate between chemically different odors (Stopfer et al.,
1997). To model the effect of PCT application to the AL, oscillatory synchrony across
PNs was eliminated and the probability of PN firing at odor onset was increased so that
the simulated LFP displayed the early low-frequency peak observed experimentally and
predicted by a full AL model when fast inhibition is blocked (Bazhenov et al., 2001a). To
accomplish this we assumed that within the first 50 ms of odor presentation each PN can
produce up to 4 spikes (vs. 1 spike in control conditions) with a probability P = P0+0.6(1-
P0), where P0 is the probability of spiking in control conditions. In order to maintain a
similar number of total PN spikes during the complete odor presentation, the probability
of spiking during the rest of the stimulus (after the first 50 ms) was reduced to P = 0.5P0.
3.5 Acknowledgments
The work presented in this chapter has been submitted for publication (Perez-Orive et al.,
2004) and reflects a collaboration with Maxim Bazhenov from The Salk Institute for

Coincidence Detection and Oscillations in Kenyon Cells 96
Biological Studies. J. Perez-Orive performed the intracellular (Figure 3-1) and
extracellular (Figure 3-4, Figure 3-5 and Figure 3-8) electrophysiological experiments.
M. Bazhenov performed the KC (Figure 3-2) and network (Figure 3-3, Figure 3-6 and
Figure 3-7) modeling work.
97
4 Kenyon Cell Electrophysiology: Additional Properties
4.1 Introduction
As described in Section 1.2 of this dissertation, the mushroom bodies (MBs) are
important model systems which offer valuable advantages for the study of several critical
neuroscientific issues, such as learning and memory (Hammer and Menzel, 1995;
McGuire et al., 2001; Pascual and Preat, 2001; Heisenberg, 2003), olfactory and other
sensory physiology (Strausfeld et al., 1998; Gronenberg and Holldobler, 1999; Laurent et
al., 2001; Laurent, 2002; Marin et al., 2002), and neural coding (Laurent, 1996;
Grunewald, 1999a; Laurent, 1999; Strausfeld and Li, 1999b; Perez-Orive et al., 2002). A
significant amount of genetic and anatomical work has been conducted on the intrinsic
cells of the MB, the Kenyon cells (KCs). However, there are very limited
electrophysiological descriptions of these important neurons (Laurent and Naraghi,
1994).
This chapter will provide further descriptions of electrophysiological properties of KCs,
and how these may be related to some important neural coding issues. It is comprised of
three parts which characterize different aspects of KC physiology, odor responses and
relationship to local field potential (LFP) oscillations. Specifically, in Section 4.2 the
conduction velocity of their axons is measured; in Section 4.3 I will study whether their
olfactory responses are clustered by chemical structure of odorants (within a given KC),
or by spatial location of their cell bodies (for a given odor); finally, in Section 4.4 the

Kenyon Cell Electrophysiology: Additional Properties 98
temporal evolution of LFP power will be characterized, and the relationship between this
population phenomenon and KC activity will be analyzed.
4.2 Conduction Velocity of Kenyon Cell Axons
4.2.1 Methods
In vivo electrophysiological experiments were conducted in locusts (Schistocerca
americana) (n = 6 locusts) from an established, crowded colony, as described in Section
3.4.1 and (Laurent and Naraghi, 1994). In vitro experiments were also carried out in
which the MB was dissected out of the head capsule (n = 2 locusts). Similar results were
obtained in both conditions.
A 25 µm tungsten wire bipolar electrode was used for electrical stimulation, applied with
a WPI A360 stimulus isolator (World Precision Instruments). Typical stimulation
parameters were 500 µs pulse width and 30-400 µA stimulus amplitudes. Extracellular
compound action potentials (CAPs) were recorded using saline-filled patch pipettes (DC
R: 1-3 MΩ). Recording electrodes were often covered with Sylgard (Dow Corning) in
order to reduce the transmural capacitance of the electrode, and therefore minimize the
effects of the preparation saline level on the recording (Purves, 1981). Signals were
recorded with an Axoclamp–2B (Axon Instruments). For projection neuron (PN)
conduction velocity measurements, the stimulating electrode was placed in the center of
the AL, and the recording electrode was placed in the MB calyx, where the PN axons

Kenyon Cell Electrophysiology: Additional Properties 99
contact KC dendrites. For KC conduction velocity measurements, the stimulating
electrode was placed in the KC cell body layer of the MB, and the recording electrode
was placed at different points along the MB pedunculus and β-lobe (Figure 4-1; see also
Figure 1-1).
Figure 4-1. Schematic of experimental setup for KC conduction velocity measurements. Bipolar
stimulating electrodes were placed in the KC cell body layer. Field electrodes were placed at different sites
along the MB pedunculus and β-lobe in order to record CAPs from KC axons [figure adapted from
(MacLeod et al., 1998)].

Kenyon Cell Electrophysiology: Additional Properties 100
Data were analyzed using Matlab (The Mathworks). The distances from the stimulating
to the recording electrodes were obtained using a measurement grid on the microscope
eyepiece, which was calibrated with a stage micrometer standard (AO Scientific
Instruments). The calibrated eyepiece grid was found to have a resolution of 41 ± 1 µm.
In order to estimate the actual distance traversed by the axons which are not rectilinear
(as in the case of KC axons recorded in the β-lobe and PN axons), the measured distances
were adjusted using a normalizing coefficient, K (Figure 4-2). The values for the K
coefficient were obtained by taking measurements from locust Bodian-stained whole
brains in which the straight line distance (“measured distance” in the electrophysiological
experiments) was compared to the actual distances traversed by the axons (broken down
into three segments). Two different values of K were obtained in this way, one for PN
axons going from the AL to the MB calyx, and another for KC axons from the MB calyx
to the β-lobe. In KC recordings obtained from the pedunculus, this adjustment was not
performed because the path of KC axons at this stage does not include significant
deviations from a straight line.

Kenyon Cell Electrophysiology: Additional Properties 101
Figure 4-2. Schematic illustrating the correction for distance measurements conducted in the β-lobe. The
measured distance corresponds to the straight line measurement between stimulating and recording
electrodes. A more accurate value of the “real” distance was estimated by adjusting the measured distance
with a normalizing coefficient, K (see Methods Section 4.2.1). A similar correction was applied to PN axon
measurements.
4.2.2 Results
The conduction velocity, v, of action potentials propagating along an axon can be
obtained by measuring the time of propagation, t, along a given distance, d, and
calculating v = d/t. I conducted electrophysiological experiments in which CAPs were
evoked by stimulating extracellularly a population of KCs or PNs and measuring the time

Kenyon Cell Electrophysiology: Additional Properties 102
it took the CAP to reach a recording electrode placed a known distance away along the
axon (see Methods Section 4.2.1).
The distance was measured during the experiment along a straight line from the
stimulating to the recording electrode. In order to estimate the actual distance traversed
by the axon, a normalizing coefficient was used (see Methods Section 4.2.1 and Figure
4-2). The values obtained for these coefficients were: KKC = 1.09 ± 0.01, KPN = 1.23 ±
0.05 (mean ± S.E.M.; n = 4 Bodian stain measurements). Measured distances were
multiplied by K in order to obtain a more accurate estimate of the actual distance traveled
by the CAPs (Figure 4-2).
CAPs were elicited in order to measure their time of propagation along the axon.
Examples of recorded waveforms are shown in Figure 4-3. Previous work studied the
components of the PN-evoked waveform recorded in the calyx and determined that the
initial downward deflection corresponds to PN action potentials, the positive peak
succeeding it to KC EPSPs and the large negative deflection to synaptically evoked KC
action potentials (Oleskevich et al., 1997). Given that the KC-evoked waveform shown in
Figure 4-3 was recorded in the pedunculus, an area with fewer axodendritic synaptic
connections (Leitch and Laurent, 1996), the postsynaptic potential component is much
smaller and the larger biphasic deflections dominating the waveform are assumed to be
caused by the electrical stimulus-evoked KC action potentials.

Kenyon Cell Electrophysiology: Additional Properties 103
Figure 4-3. CAPs evoked by KC and PN electrical stimulations (top and bottom, respectively). Individual
traces are superimposed on the left column (n = 29, for KCs; n = 7 for PNs) and the same traces are
averaged on the right column. Arrows indicate the phases of the waveforms at which time measurements
were taken.
Figure 4-4 shows the grouped results for KC and PN conduction velocities. When
conduction velocity is measured as the average of the individual measurements (Figure
4-4 B) we obtain vKC = 0.19 ± 0.01 m/s and vPN = 0.22 ± 0.02 m/s. The conduction
velocity of KCs is slightly slower than that of PNs, but it is not significantly different
(Figure 4-4 B). Since KC CAPs were recorded at different distances along the pedunculus
and β-lobe, we can also estimate their conduction velocity from the inverse of the slope

Kenyon Cell Electrophysiology: Additional Properties 104
of the linear regression line (Figure 4-4 A): slope-1 = 0.23 m/s. The results obtained in
these two ways are similar.
Figure 4-4. Conduction velocity results for KCs and PNs. (A) Distance vs. time measurements for KC-
evoked CAPs, recorded at different locations along the KC axon path in the pedunculus and β-lobe (top)
and PN-evoked CAPs recorded at the MB calyx (bottom). Time error bars correspond to S.E.M. Distance
error bars were calculated by considering the error introduced by changes in microscope focusing distance

Kenyon Cell Electrophysiology: Additional Properties 105
(±1 µm), the grid resolution (±20 µm) and the scaling effects of the multiplicative coefficients (KKC = 1.09
± 0.01, KPN = 1.23 ± 0.05; F2) (Pentz and Shott, 1988). The linear regression line is shown for the KCs
(correlation coefficient, r = 0.84). (B) Average conduction velocity (± S.E.M.) for KC (n = 9) and PN (n =
7) v = d/t measurements. Symbols represent individual measurements.
4.2.3 Discussion
The work presented here measures the conduction velocity of KC and PN axons. The
result obtained here for locust PN conduction velocity, 0.22 ± 0.02 m/s is similar to that
previously found for honey bee PNs, 0.25 m/s (Oleskevich et al., 1997). The result for
KC conduction velocity, 0.23 m/s (from the slope of the linear regression), is new to the
best of our knowledge.
Measurements of conduction velocity in unmyelinated axons have suggested a
relationship with the axon diameter of the form: v = d n [where v is measured in m/s and d
in µm; (Ritchie, 1995)]. Previous estimates of n have yielded, n = 0.61 ± 0.03 in squid
and cuttlefish (Pumphrey and Young, 1938), 0.5 < n < 1.0 in crab (Abbott et al., 1958)
and n = 1 in mammalian dorsal root ganglion C fibers (Gasser, 1950). Given that KC
axons are about 200-300 nm in diameter (Leitch and Laurent, 1996), our current
conduction velocity result yields a value for KCs of 0.91 < n < 1.22, which is consistent
with the previously reported findings.
The conduction velocity observed here for KCs does not support the hypothesis that the
MBs play a role in sequence detection of PN inputs. This idea stems from the fact that PN

Kenyon Cell Electrophysiology: Additional Properties 106
axons continue into the lateral protocerebrum (Ernst et al., 1977; Hansson and Anton,
2000) after contacting KC dendrites (see Figure 1-1). In the lateral protocerebrum they
can contact MB efferent neurons which also receive inputs from the KC axons in the MB
lobes (Li and Strausfeld, 1997, 1999) (Figure 4-5). Thus, MB efferent neurons could
receive PN olfactory input via two different pathways: one through a direct monosynaptic
connection from PNs in the lateral protocerebrum, and a longer pathway through the KCs
(Figure 4-5). In this idea, KC axons could be acting as delay lines which would cause
signals occurring in sequential LFP oscillation cycles to coincide in the efferent neurons.
In this way, efferent neurons could selectively respond to specific sequences of PN
activation. For this hypothesis to work, the conduction velocity of KC axons should be
such that they delay the signals from one cycle long enough to coincide with the signals
from the next. Considering LFP oscillation cycles of 30-50 ms, 5-10 ms synaptic delays
and a distance of 800 µm from the calyx to the β-lobe, KC conduction velocity should be
about 0.02-0.04 m/s for this hypothesis to work. Our KC conduction velocity
measurements result in values approximately an order of magnitude greater than these,
and therefore rule out this possibility.

Kenyon Cell Electrophysiology: Additional Properties 107
Figure 4-5. Schematic circuit of two convergent pathways of olfactory information onto MB efferent
neurons: a short monosynaptic pathway via PNs (orange), and a long disynaptic pathway via PNs and KCs
(blue).
4.3 Chemical or Spatial Clustering of Kenyon Cell Responses
4.3.1 Methods
In vivo electrophysiological experiments were conducted on locusts. Extracellular KC
and LFP recordings were made with wire tetrode electrodes placed in the MB cell body
layer, while presenting a panel of odors. Details of these electrophysiological
experiments are the same as those described in Sections 3.4.1 and 3.4.2.
Responses were defined with separate amplitude and reliability criteria, as described in
Section 3.4.4. Given the very low baseline firing rate of KCs, the amplitude criterion was

Kenyon Cell Electrophysiology: Additional Properties 108
satisfied in the majority of cases with a single action potential per trial. The reliability
criterion is satisfied if this amplitude is exceeded in more than half of the trials (black
squares in Figure 4-6). In Figure 4-6 B, a “weak” response (gray squares) is defined with
the same amplitude criterion but with a relaxed reliability criterion, in which only a
response in more than a quarter of the trials is required. For calculating Hamming
distances (Figure 4-8), binary vectors are formed by taking all the odors that a KC is
presented with (i.e., each column in Figure 4-6 A will be a vector) and assigning ones to
responses and zeros to non-responses. The Hamming distance between two such vectors
provides a measure of their similarity making no assumptions about odor groupings.
4.3.2 Results
In this section I will explore whether KC responses can be grouped by either chemical
similarities of odors or by spatial location of KC somas. That is, will KCs that respond to
a given odor tend to respond as well to odors of similar chemical composition? and, do
KCs whose cell bodies are in spatial proximity to each other share similar odor response
profiles? Figure 4-6 presents an initial approach to these issues. It shows in matrix format
all cell-odor pairs for 64 KCs (out of a total of 122 KCs recorded with odor presentations)
that were presented with a complete panel of the same 17 odors. There does not seem to
be any obvious clustering of responses by either chemical group (rows within horizontal
arrows separating chemical families) or spatial location (columns within vertical arrows
separating tetrodes). Similarly, there are no obvious clusters that emerge by including
“weak” responses (gray squares in Figure 4-6 B).

Kenyon Cell Electrophysiology: Additional Properties 109
Figure 4-6. Response matrices for 64 KCs (columns) which were all presented with the same 17 odors
(rows). (A) Black and white squares denote odor response or lack thereof, respectively. Vertical arrows
(both solid and dashed) separate cells recorded with different tetrodes; dashed arrows separate simultaneous
tetrode recordings. Horizontal arrows separate chemical families of odors (Solomons, 1988), from top to
bottom: alkene alcohols (1-hexen-3-ol, trans-2-hexen-1-ol, cis-3-hexen-1-ol), alkane alcohols (1-hexanol,
1-heptanol, 1-octanol), aldehydes (hexanal, octanal, nonanal), dimethyl-2,6-octadiene-nitrile (this odor does
not belong to any of the chemical groups used here), ketones (3-pentanone, 2-heptanone, 3-heptanone, 5-
nonanone, 6-undecanone) and mixtures (cherry, mint). (B) Same as (A), except that “weak” responses (see
Methods Section 4.3.1) are also included (gray squares). No clusters are clearly apparent, either by odor or
by tetrode.
In order to address whether KCs respond to odors with similar chemical properties, odors
are grouped into four standard organic chemistry families: alkene alcohols, alkane
alcohols, aldehydes and ketones (Solomons, 1988). In addition to these four groups, I
used a fifth one which included odors composed of a mixture of several different

Kenyon Cell Electrophysiology: Additional Properties 110
molecules (cherry, mint). Figure 4-7 addresses whether the odor responses of a given KC
tend to be clustered by chemical family. Strictly speaking, once a KC has responded to an
odor, Xi, I tested whether the conditional probability to respond to odors from the same
chemical group P(Xj|Xi) is greater than to odors from different chemical groups P(Y|Xi).
Out of the five groups studied, only one, alkane alcohols, showed a significant grouping
of responses (Figure 4-7).
Figure 4-7. Clustering of KC responses by chemical family of odorant. Odors are grouped into one of five
groups: four distinct chemical families (Solomons, 1988) plus a group of odor mixtures (individual odors
used are those listed for Figure 4-6). The conditional probabilities of KCs responding to odors within the
same group (gray bars), P(Xj|Xi), or across different groups (white bars), P(Y|Xi), are compared (mean ±
S.E.M.). KCs that respond to an alkane alcohol are more likely to respond to other odors from this chemical
family than to odors from other groups (p = 0.01, two-sided paired t test). However, no significant
preference for a specific chemical family appears in the four other groups studied here (p>0.05 for all of
them, two-sided paired t test).

Kenyon Cell Electrophysiology: Additional Properties 111
Assuming that KCs recorded in the same tetrode have their somas in spatial proximity,
one can test whether nearby KCs respond to the same odors. Figure 4-8 compares the
conditional probabilities that given a KC recorded from a specific tetrode responds to an
odor, Ti, other KCs recorded from the same tetrode, P(Tj|Ti), versus different tetrodes,
P(U|Ti), will respond to that odor. The probabilities that a KC recorded in another tetrode
responds to a given odor (white bars), are all about 0.1, which agrees with the overall
probability of response of KCs to odors (Perez-Orive et al., 2002). The probabilities that
KCs in the same tetrode respond to the same odor (gray bars) vary greatly from one
tetrode to another (from 0.0 to 0.6), with no clear pattern becoming apparent. Thus, there
does not seem to be a strong clustering of similar responses throughout tetrode recordings
(six tetrodes showed P(Tj|Ti) > P(U|Ti), while 4 showed the opposite relationship).
Measuring the Hamming distances between response profiles recorded from KCs within
the same tetrode and across tetrodes does not show a significant difference based on the
spatial location of KCs (Figure 4-8, inset), supporting the result obtained from the
conditional probabilities.

Kenyon Cell Electrophysiology: Additional Properties 112
Figure 4-8. Clustering of similar odor responses by KCs recorded from the same tetrode. The conditional
probabilities of responses to the same odors by KCs recorded simultaneously from the same tetrode (gray
bars), P(Tj|Ti), or from different tetrodes (white bars), P(U|Ti), are compared (mean ± S.E.M.). In these
experiments, between 2 and 7 KCs were recorded simultaneously from each tetrode. Of the 18 different
tetrode recordings presented with the panel of 17 odors, 10 satisfy the criteria necessary for this analysis:
having at least two KCs and at least one odor response (Figure 4-6). Inset: Hamming distances (i.e., the
number of bits that are different among two binary numbers) for odor response profiles from KCs recorded
in the same tetrode, compared to KCs from a simultaneous recording with another tetrode (see Methods
Section 4.3.1 for details). Response profiles measured in this way are not significantly more similar for
KCs within the same tetrode.
4.3.3 Discussion
The present results do not support a view for either chemical or spatial grouping of KC
odor responses. With respect to chemical grouping, the data only show evidence of
grouping for one chemical family (alkane alcohols) out of the five included. It could be
that this reflects a difference in the way alkane alcohols are represented in the MB,

Kenyon Cell Electrophysiology: Additional Properties 113
however it is not possible to conclude this from the presents results. The other four
families show no significant grouping of responses. Of course, odors might be grouped
along a different dimension that does not correspond to the conventional chemical
families used here. It is not clear what this alternative dimension might be, so most
previous studies have looked at broad chemical categories (Amoore, 1967; Amoore et al.,
1969; Friedrich and Korsching, 1997; Uchida et al., 2000).
The current approach to the question of whether spatially grouped KCs have similar
response profiles rests on the assumption that KCs recorded in the same tetrode have their
somas in spatial proximity to each other, and to the tetrode. All KC somas have similar
sizes (Leitch and Laurent, 1996) and it is likely that their action potentials will elicit
currents of similar amplitudes in the extracellular medium. Thus, there is no reason to
believe that for similar firing rates, KCs from distant locations will evoke larger signals
in a tetrode than KCs proximal to it.
The present results support the idea that there is no strong spatial ordering at the level of
KC somas, but do not address the question of spatial ordering in the calyx or lobes.
However, studies of the relationship between the locations of KC somas and those of
their dendrites and axons [in honey bees (Mobbs, 1982; Strausfeld, 2002) and
cockroaches (Strausfeld and Li, 1999b)] have found that somas with specific locations in
the cell body layer have dendrites with distinct projection patterns in the calyx, and that
their axons maintain their relative positions to each other as they travel down the
pedunculus and lobes. The results presented here do not show a clear grouping of odor

Kenyon Cell Electrophysiology: Additional Properties 114
profiles by KC location, and therefore argue against a topographical ordering [e.g.,
(Belluscio and Katz, 2001; Marin et al., 2002; Wong et al., 2002)] of odor representation
in the MB, in agreement with results in mammals studying projections from the olfactory
bulb into the piriform cortex (Haberly, 1997; Zou et al., 2001).
4.4 Local Field Potential Spectrograms and Kenyon Cell Activity
4.4.1 Methods
In vivo electrophysiological experiments were conducted on locusts. Extracellular KC
and LFP recordings were made with wire tetrode electrodes placed in the MB cell body
layer, while presenting a panel of odors. Details of these electrophysiological
experiments are the same as those described in Sections 3.4.1 and 3.4.2. Data analysis
and response definitions were carried out as described in 3.4.4.
The spectrograms were calculated using the ‘specgram.m’ function from the Signal
Processing Toolbox in Matlab (The Mathworks). This function calculates the fast Fourier
transform (FFT) for overlapping windows across the signal. For the higher temporal
resolution analysis (Figure 4-9, Figure 4-10), the LFP signal was split into windows of
size 213 data points (i.e., 8,192 points / 14,881 Hz sampling frequency = 551 ms window),
with 213-29 data point overlaps between windows (i.e., 7,680 / 14,881 Hz = 516 ms
overlap). The temporal resolution of the spectrogram will be the difference between the
window size and the overlap between windows, 29/14,881 = 34 ms.

Kenyon Cell Electrophysiology: Additional Properties 115
In order to analyze the lower frequency components of the LFP (e.g., 3 Hz) in Figure
4-12, larger windows need to be used for computing the FFT, which causes a loss of
temporal resolution in the spectrogram. For Figure 4-12, window size is 215 (i.e., 32,768
points / 14,881 Hz = 2,202 ms window), with 215-211 overlaps between windows (i.e.,
30,720 points / 14,881 Hz = 2,064 ms overlap). This yields a temporal resolution of
211/14,881 = 137 ms. However, given that power spectra are calculated on the overall
window (2.2 s in this case), individual time bins are not independent of each other, and
therefore this temporal resolution is only approximate. This explains the reason why the
LFP power is observed to increase before stimulus onset in Figure 4-12.
4.4.2 Results
Odor presentations elicit oscillatory synchronization of AL neurons reflected in LFP
oscillations (Laurent and Naraghi, 1994; MacLeod and Laurent, 1996). A useful way to
look at how the power at different frequencies evolves over time is by plotting a
spectrogram of the signal. Figure 4-9 shows the average spectrogram of the LFP evoked
by 18 different odors. The odor delivery system has about 300 ms of delay from the
moment the trigger occurs until the odor reaches the locust, and physiological responses
in the AL or MB are never observed before this time. Thus, the first 300 ms after odor
onset display baseline activity (both in terms of LFP and single cell responses). The
spectrogram shows that, on average, a slightly higher frequency (centered between 30-35
Hz) predominates during approximately the first 400-500 ms of the response.

Kenyon Cell Electrophysiology: Additional Properties 116
Subsequently the predominant LFP frequency is 20-30 Hz, on average, and an increase in
power in this band over baseline can still be observed more than 1 s after odor offset.
Figure 4-9. Average spectrogram of LFP over 1,300 odor presentations (using 18 different odors on 14
locusts). Frequency resolution, 1 Hz. Temporal resolution, 34 ms (see Methods Section 4.4.1). Horizontal
bar, 1 s odor delivery (odor presentation is delayed by about 300 ms, see text Section 4.4.2). Warm/red
colors: high power; cold/blue colors: low power.
The oscillations evoked by different odors are found to vary to some extent in frequency
and temporal structure (Figure 4-10 A). Similarly, KC responses can vary somewhat in
latency, duration and intensity (Perez-Orive et al., 2002; Perez-Orive et al., 2004). In the
particular KC shown in Figure 4-10 C, the responses have similar temporal structure than
the LFP power of the specific odor evoking the response. Occurrences of LFPs with such
large latencies were not common, and so examples with such clear latency covariability
as this are infrequent. To study the relationship between LFP oscillatory power and KC
odor responses in a systematic way, smoothed PSTHs from KCs were compared to the

Kenyon Cell Electrophysiology: Additional Properties 117
LFP power evolving over time (Figure 4-10 B), and the correlations between both
waveforms were calculated.
Figure 4-10. Examples of LFP spectrograms and KC responses for different odors. (A) Spectrograms for
10 different odors recorded from two locusts (10 trials for each odor). Spectrogram parameters and
resolution as in Figure 4-9. Horizontal bars: 1 s odor stimulus. Odor abbreviations are: hexanal (hxa), 5-
nonanone (nnn), nonanal (nna), 1-heptanol (hpo), 3-heptanone (3hp), 1-hexen-3-ol (hx3), 1-octanol (oco),
2-heptanone (2hp), trans-2-hexen-1-ol (thx), cis-3-hexen-1-ol (chx). (B) LFP oscillatory power (summated
across the 19-31 Hz frequency band) plotted as a function of time for the five odors in the right-hand
column of (A). (C) Responses from a single KC recorded simultaneously as the five odors in the right-hand
column of (A). Shaded area: 1 s odor stimulus. 10 trials for each stimulus displayed top to bottom [this
particular KC had a larger than average number of spikes per response, which is related to the fact that it
responds to many odors (Perez-Orive et al., 2002)]. Note similar delays of KC responses and LFP power
increase, specially noticeable for ‘2hp’.

Kenyon Cell Electrophysiology: Additional Properties 118
Figure 4-11 A shows the distribution of correlation values calculated for all cell-odor
response pairs (mean correlation coefficient of the distribution, r = 0.42; n = 130 cell-
odor pairs with responses). The null hypothesis that the two waveforms are not correlated
was rejected (p<0.05, two-sided t test) in 60% of these cell-odor pairs. However, it should
be remembered that the LFP reflects the degree of synchrony of the total PN population,
while KC firing only requires a relatively small subset of PNs to become synchronized
(Perez-Orive et al., 2002), and this subset may or may not be reflected in the overall LFP
power. Therefore, it is to be expected that some cell-odor pairs do not show significant
correlations between KC firing and LFP power, as shown in Figure 4-11 A. A useful way
of assessing the significance of these correlations is to calculate the likelihood that the
experimentally observed degree of correlation is due to global similarities between KC
responses and LFP power (i.e., that they are caused by global, as opposed to cell- and
odor-specific, correlations). This was assessed as follows: a) the members of the 130 cell-
odor pairs were randomly shuffled so that new pairs were formed in which the KC
responses did not correspond to the LFP for the odor evoking the response, b) the
correlation coefficients of the shuffled pairs were computed, c) the mean correlation of
the new distribution is calculated. This procedure was repeated 1,000 times (Figure 4-11
B). The results indicate that the probability that the average correlation found
experimentally could be generated with random pairings is p = 0.01. This suggests that
there is a cell-odor pair specific correlation between LFP power and KC firing.

Kenyon Cell Electrophysiology: Additional Properties 119
Figure 4-11. Correlation coefficients (r) between LFP power in the 19-31 Hz frequency band (as in Figure
4-10 B) and KC response PSTH (smoothed by convolving rasters with a 50 ms S.D. Gaussian). (A)
Distribution of correlations for 130 cell-odor pairs (mean r = 0.42). (B) KC responses and LFP power were
randomly shuffled into 130 new pairs, correlation coefficients were calculated for each pair and the mean r
of the distribution was calculated (see text Section 4.4.2). Distribution of 1,000 mean r’s calculated in this
way is shown here. Red vertical bar shows mean r = 0.42 of the experimentally observed distribution. The
randomly shuffled distributions yielded mean r values as large as the experimental one with p = 0.01.
An interesting question would be to examine the degree of correlation between the
response of a given KC and the overall PN firing rate, and then compare these
correlations to those between KC firing and LFP power described above (Figure 4-11).
Addressing this directly would require experiments with simultaneous PN and KC
recordings, which currently present important technical challenges. An alternative
possibility is to use information contained in the LFP as an indirect measure of average
PN activity. LFP power in a lower frequency band (3-6 Hz) is a possible candidate to
reflect overall PN activity (Perez-Orive et al., 2004). I therefore compared the degrees of
correlations between PN and KC firing with LFP power at two different frequency bands:
a higher band (19-31 Hz) reflecting oscillatory synchronization (Laurent and Davidowitz,
1994; MacLeod and Laurent, 1996), and a lower band (3-6 Hz), which would putatively

Kenyon Cell Electrophysiology: Additional Properties 120
reveal overall PN activity. If the lower frequency band indeed reflects average PN
activity, PNs should have stronger correlations with the lower than with the higher
frequency band. Assuming KCs respond preferentially to synchronized PN input (Perez-
Orive et al., 2002), one would then expect their responses to correlate more strongly with
the higher than the lower frequency bands. The average odor-evoked spectrograms for
these two frequency bands and the time course of the LFP power are shown in Figure
4-12 A and B. KC response activity is indeed more strongly correlated with the higher
than the lower frequency band (Figure 4-12 C, left panel; p<0.01, two-sided t test).
Conversely, PN activity is more strongly correlated with the lower than the higher
frequency band (Figure 4-12 C, right panel; p<0.01, two-sided t test). Despite this
significance however, the correlation between the PN PSTHs and the lower frequency
band is relatively small (Figure 4-12 C, right panel), which casts doubt on whether LFP
power at this band can be used as an appropriate measure of PN overall activity.

Kenyon Cell Electrophysiology: Additional Properties 121
Figure 4-12. Comparison of high (19-31 Hz) and low (3-6 Hz) frequency bands of the LFP. (A) Average
spectrograms of LFP over 1,300 odor presentations for both frequency bands (using 18 different odors on
14 locusts). Frequency resolution: 2 Hz, high band; 0.5 Hz, low band. Temporal resolution (the same for
both frequency bands), 137 ms (see Methods Section 4.4.1). Horizontal band, 1 s odor stimulus. (B) LFP
power summated over high (red) and low (black) frequency bands and plotted as a function of time. In
order to compare time courses, amplitudes are normalized to maximum for each band. Note later onset and
longer duration of power increase for higher band. (C) Comparison of correlations between KC / PN
response PSTHs and LFP power for high and low frequency bands. Bars show mean ± S.E.M. of

Kenyon Cell Electrophysiology: Additional Properties 122
correlations calculated for 130 responsive cell-odor pairs (KCs; left panel) and 249 cell-odor pairs (PNs;
right panel), as described in Figure 4-11. KC responses are more strongly correlated with the high than the
low frequency band (p<0.01, two-sided t test), whereas PN responses are more correlated with the low
frequency band (p<0.01, two-sided t test). [PN tetrode recordings used for the right panel in (C) generously
provided by S. Cassenaer and O. Mazor.]
4.4.3 Discussion
The work in this section describes the temporal evolution of odor-evoked LFP oscillatory
power, and how it correlates to KC firing. The evidence presented here supports the idea
that KCs respond preferentially when there is strong PN synchrony (Perez-Orive et al.,
2002), as reflected by LFP power in the 20-30 Hz band.
However there are several reasons why these correlations are not stronger, and therefore
this measure is suboptimal. On the one hand, as mentioned above, the LFP reflects the
activity of the PN population, while KC firing does not depend explicitly on this measure,
but rather on whether the specific subset of PNs converging onto it synchronize or not
(Perez-Orive et al., 2002; Stopfer et al., 2003). Very often the synchronization of this PN
subset will be reflected in the LFP, which is manifested in the statistically significant
degree of correlation found here (Figure 4-11). Additionally, LFP power and KC PSTHs
follow very different temporal dynamics: whereas the increase in LFP power lasts from
several hundred milliseconds up to a few seconds (Figure 4-9, Figure 4-10), KC
responses are typically brief and transient (Perez-Orive et al., 2002). Therefore, several
different KCs might respond at different times within an epoch of sustained LFP power
increase.

Kenyon Cell Electrophysiology: Additional Properties 123
Taking these caveats into account, it is interesting that KC odor-evoked activity is more
strongly correlated with LFP power in the 20-30 Hz band than with the lower, 3-6 Hz
band, with which PN activity is more correlated. In spite of this, the correlation between
the lower frequency band and overall PN activity is small, and the mechanistic
explanation of LFP power at this band remains to be determined. Additionally, direct
experimental comparison between the activity of a KC and the degree of synchrony
among its converging PNs remains to be done, and could provide important supporting
evidence for these ideas.
4.4.4 Acknowledgments
The PN data used for the right panel in Figure 4-12 C were generously provided by Stijn
Cassenaer and Ofer Mazor.

124
5 Concluding Remarks
I will now conclude by briefly recapitulating the main results of my Ph.D. work,
discussing their overall significance and some open questions that remain to be answered.
5.1 Summary of Main Results
Kenyon cells (KCs) were found to have extremely low baseline activity, firing typically
only one action potential every 10-40 seconds. They have highly specific odor responses
and when they do respond, they tend to do so with a small number of action potentials
(one or two, typically) which are phase-locked to local field potential (LFP) oscillations.
This leads to a dramatic sparsening of the olfactory representation in the mushroom body
(MB) [as assessed with binary response definitions, population sparseness and lifetime
sparseness measures (Willmore and Tolhurst, 2001)]8.
8 Given that these results are obtained with extracellular recordings, the only neurons that are counted are
those that fire action potentials. Thus, it is possible that this misses KCs that do not spike at all during the
recording period, or spike only such a small number of action potentials that they cannot be isolated with
the spike-sorting procedure (Pouzat et al., 2002). This implies that the results presented here with respect to
baseline activity, odor specificity and sparseness are conservative. It would be interesting to calculate
precisely the volume that the tetrodes can record from. However, this depends on the properties of a
complicated anisotropic, non-uniform volume conductor, which are not trivial to calculate (Perez-Orive and
Durand, 2000). In any case, the fact that our measure is conservative only reinforces the main results,
namely, that KCs have a low baseline firing rate, high specificity and that their odor representation in the
MB is sparse.

Concluding Remarks 125
Feedforward inhibition contributes to odor specificity and the sparse representation found
in the MB. Blocking inhibitory input specifically to the KC dendrites was found to
broaden KC odor tuning. Furthermore, KCs become desynchronized, as indicated by the
fact that they lose their phase-locking to the LFP oscillations. This loss of phase-locking
when lateral horn interneuron (LHI) inhibition is blocked strongly supports the idea that
feedforward inhibition limits, on a cycle by cycle basis, the temporal window during
which KCs can integrate their inputs (Pouille and Scanziani, 2001).
Together with feedforward inhibition, the intrinsic properties of KCs favor coincident
input detection. Coincident EPSPs were found to summate supralinearly. In addition,
both coincident EPSPs and superimposed DC depolarizations can lead to the production
of active EPSPs and sharp spikelets (below action potential threshold), signifying the
contribution of intrinsic voltage-dependent conductances to this nonlinear behavior.
Compared to “passive” EPSPs, the half-width of these spikelets is significantly reduced,
partly due to active repolarizing conductances [e.g., (Fricker and Miles, 2000)], which
further contribute to the selectivity of KCs for coincident input (Kempter et al., 1998).
Taken together, these results indicate that oscillations serve as a framework on which
KCs act as coincidence detectors: not all projection neuron (PN) spikes will be equally
relevant to KCs, their specific relevance depending on whether they are correlated, within
a specific phase of an oscillation cycle, with other PN spikes. Abolishing oscillations by
blocking fast Cl--mediated inhibition in the antennal lobe (AL) (MacLeod and Laurent,
1996) disrupts KC odor responses, decreasing their specificity and the sparseness of the

Concluding Remarks 126
olfactory representation in the MB. This disruption appears to be caused by a shift of PN
activity towards odor onset and by a weakening of the net effect on KCs of feedforward
inhibition.
5.2 Open Questions for Future Work
These results have advanced our understanding of the processing of information in the
insect olfactory system, and specifically in the MBs. However, several open questions
remain to be answered by future work.
More information on the specific roles played by the MBs —and by the transformation of
the olfactory representation that takes place in them— would be important. The work
presented in this dissertation has shown that odor representations are transformed as they
progress from the AL to the MB, where there is a sparse and highly synthesized
representation available to downstream neurons. Thus, for elucidating the possible roles
the MBs might perform, it can be useful to consider what might be the potential
advantages of having such a representation.
The energy consumption of the brain constitutes a large percentage of the total resting
metabolic energy of various organisms (Howard et al., 1987; Nilsson, 1996; Clarke and
Sokoloff, 1999) and presents an important evolutionary constraint (Aiello and Wheeler,
1995; Martin, 1996; Allman, 1999). This constraint is likely to influence the anatomical
and physiological properties of nervous systems, favoring energy efficient codes in which

Concluding Remarks 127
the information contained in a given number of spikes is maximized (Laughlin, 2001;
Laughlin and Sejnowski, 2003). In this sense, an important advantage of the very brief
and specific KC responses —as well as their extremely low baseline firing rate— could
be a high metabolic efficiency for representing olfactory information.
However, there are also significant metabolic costs associated with maintaining a large
number of silent neurons. Levy and Baxter (1996) calculated the optimal proportion of
active neurons as a function of the ratio, re, of the energy costs of firing action potentials
compared to the costs of maintaining the resting potential of a silent neuron. Assuming re
values close to 10, they determined that a code that minimizes energy expenditure, while
maximizing representational capacity, would activate approximately 16% of the total
number of neurons for any given stimulus (Levy and Baxter, 1996). Our current results,
indicating that approximately 10% of KCs respond to a given odor, are close to this
prediction and thus consistent with this optimization. A comprehensive breakdown of
metabolic energy costs has been computed for rat neocortical gray matter (Attwell and
Laughlin, 2001). This method uses biophysical and biochemical measurements of
neuronal properties such as ionic conductances and neurotransmitter release to calculate
the numbers of ions and molecules involved in firing spikes and maintaining the resting
potential. The amount of ATP required to restore the required gradients is then
calculated. In this way, the metabolic costs of signaling through action potentials were
calculated to be 84% of the total energy consumed by neurons, whereas the maintenance
of resting potential was found to be only 13% (Attwell and Laughlin, 2001). These results
predict that a sparse code, in which fewer than 15% of neurons are simultaneously active,

Concluding Remarks 128
will optimize energy efficiency, in agreement with the predictions of (Levy and Baxter,
1996) and our current results for KCs. Similar calculations adjusted to account for
differences between human and rat neocortex found that about 1% of neurons in human
cortex should be “substantially” active (i.e., firing at about 50 Hz for a short time) at any
given time (Lennie, 2003). It would be interesting to calculate re for KCs in order to
evaluate whether the sparse representation discovered in the MB is actually optimal in
terms of energy efficiency. But in any case, the previously cited work indicates that
metabolic constraints are likely to favor sparse representations, similar to those described
here for the MB, in other neural systems including neocortex.
Other possible advantages of a sparse code involve increasing the capacity and
discriminability of odor representations. Theoretical works focusing on cerebellar circuits
—with similar convergence and divergence properties as those that exist in the insect
olfactory system— (Marr, 1969), the insect AL (Holub et al., 2002), and artificial neural
networks (Okada, 1996; Dominguez and Bolle, 1998) suggest possible advantages of a
sparse and distributed representation, such as reducing overlap between input patterns,
improving memory capacity and decreasing spurious memories [(see also Discussions on
Sections 2.3 and 3.3 and (Laurent, 2002)]. Having odor patterns be more separated in
coding space could facilitate the discrimination between similar odors in the MB, and the
matching of noisy stimuli to patterns stored in memory. Furthermore, modeling work
performed by Maxim Bazhenov indicates that coincidence detection —the mechanism
producing the sparse representation in the MB—has important advantages over temporal

Concluding Remarks 129
integration with respect to improving the discriminability of similar odors and making the
representation more robust to uncorrelated noise (Perez-Orive et al., 2004).
As described in Section 1.2.3, the role of the MB in learning and memory has received
ample attention, particularly in the fruit fly [e.g., (Zars et al., 2000; McGuire et al., 2001);
see (Heisenberg, 2003) for review]. These investigations routinely mention that MB
interventions do not affect spontaneous (usually aversive) odor responses [e.g.,
(Heisenberg et al., 1985; de Belle and Heisenberg, 1994; Dubnau et al., 2001; McGuire et
al., 2001)]. Thus, the claim has been made that MBs are not involved in olfactory
discrimination. However, this claim does not seem well grounded given that those tests
are admittedly “very crude” (Heisenberg et al., 1985) and only address whether the MBs
are required to detect the presence or absence of an odor, not whether they are involved
in discriminating between two, potentially similar, odors. Results obtained in the locust
suggest that in fact odor discrimination is likely to involve the MBs (Stopfer et al., 1997;
MacLeod et al., 1998; Perez-Orive et al., 2002; Perez-Orive et al., 2004). In agreement
with this, preliminary experiments in flies indicate that the spontaneous discrimination of
complex odors requires the MBs (Heisenberg, 2003).
The simpler representation available in the MB might also make possible further
processing of the olfactory information (in addition to olfactory discrimination and
memory), such as that required for deciding between different behaviors based on
contradictory cues (Tang and Guo, 2001), controlling motor output (Heisenberg, 1998;
Mizunami et al., 1998b), or integrating olfactory information with other sensory

Concluding Remarks 130
modalities. Work in several insect species has shown that, in addition to olfactory input,
the MB calyces receive visual (Honegger and Schurmann, 1975; Mobbs, 1982;
Gronenberg, 1999), mechanosensory and auditory afferents (Strausfeld and Li, 1999a).
There is also evidence of multimodal responses in the MB efferent neurons that have
dendritic processes in the lobes (Li and Strausfeld, 1999), suggesting that at least some
KCs respond to different sensory modalities. Furthermore, morphometric analysis of
different ant species has revealed a correlation between the sizes of the antennal and optic
lobes, and the calycal zones where they project, the lip and the collar, respectively
(Gronenberg and Holldobler, 1999). The fact that the MBs are an area of convergence for
several different modalities, has led researchers to hypothesize that one of their functions
might be to carry out multimodal sensory integration [for a review, see (Strausfeld et al.,
1998)]. It will be interesting to determine whether all of these sensory modalities
converge on the same KCs, perhaps modulating olfactory information, or if different
subsets of KCs process different modalities in parallel, with multimodal integration
occurring downstream. Future experimental and theoretical work to determine the
specific advantages that the sparse representation provides to this system (e.g., in terms of
metabolic energy, coding capacity, readout by MB efferents) will help clarify the
potential role of the MBs in learning and memory, odor discrimination, multimodal
integration and motor responses.
Another important issue that remains to be conclusively established is the quantitative
pattern of connectivity between PNs and KCs (see Section 1.2.3 for current estimates of
PN-KC convergence/divergence ratios). This could be addressed with anatomical and

Concluding Remarks 131
electrophysiological techniques. For instance, simultaneous intracellular KC and
extracellular PN recordings could potentially uncover directly connected PN-KC pairs
(although recent developments in tetrode recording techniques are important for this, it
still remains a highly challenging experiment). Analyzing correlations between PN spikes
and KC EPSPs and spikes could provide valuable information for estimating the number
of PNs converging onto a KC, and the number of coincident PNs needed for a KC to
respond.
An additional important area for future investigations concerns the understanding of how
signals from KCs are decoded by their downstream targets. Extrinsic MB neurons which
send dense dendritic projections to the α- and β-lobes (often perpendicularly to KC
axons, thus making cross-sections of the lobes) are generally considered to be the output
of the MB [e.g., (MacLeod et al., 1998; Li and Strausfeld, 1999); see also Section 1.2.1].
Some of these neurons can be uniquely identified between individuals, often respond to
stimuli from multiple sensory modalities and seem to receive convergent input from a
large number of KCs (Rybak and Menzel, 1998; Li and Strausfeld, 1999; Strausfeld,
2002). Some extrinsic MB neurons send feedback projections back into the MB calyx
[many of these feedback neurons are GABAergic (Leitch and Laurent, 1996; Grunewald,
1999a, b)] and others project to the lateral protocerebrum, a brain area about which very
little is known and which also receives olfactory information through direct PN
projections from the AL (Ernst et al., 1977; Hansson and Anton, 2000). Establishing the
roles that different extrinsic MB neurons play, how they decode KC activity, and how
this information —coming from the MB— might be integrated in the lateral

Concluding Remarks 132
protocerebrum with olfactory information coming directly from the AL, are challenging
but important problems that need to be tackled in the future.
5.3 Relevance of Dissertation
The work described in this dissertation has significantly expanded our knowledge of the
decoding of neural information by the MB. Gaining a better comprehension of how
information is decoded by downstream neurons provides useful knowledge which
supports and enhances our previous understanding of the neural code used by the insect
olfactory system (Laurent et al., 1996; Wehr and Laurent, 1996; Stopfer et al., 1997;
MacLeod et al., 1998; Laurent, 1999). Furthermore, the work presented here provides a
mechanism for decoding precise timing information and indicates that not all spikes are
equally relevant for downstream neurons.
These general principles need not apply only to the insect olfactory system, but might
also provide useful insights into neural coding and decoding in other, more complex,
neural systems.
The different phenomena whose interactions have been studied here have been observed
in many other systems. For instance: sparse codes have been described in primate
temporal (Rolls and Tovee, 1995) and primary (Olshausen and Field, 1996; Vinje and
Gallant, 2000) visual cortices; furthermore, recordings from monkey prefrontal and
premotor cortices reveal highly reliable neuronal firing events —consisting of only one or

Concluding Remarks 133
two action potentials— correlated with behavior (Abeles et al., 1993; Prut et al., 1998),
likewise, complex natural sounds can elicit reliable responses consisting of a single spike
in rat auditory cortex (DeWeese et al., 2003) [similarly brief and specific responses have
been observed in olfactory cortex, as will be discussed below]; oscillations are ubiquitous
across different systems and animal groups [e.g., (Ottoson, 1959; Gelperin and Tank,
1990; Rodriguez et al., 1999; Buzsaki, 2002; van Swinderen and Greenspan, 2003)] and
have been linked to a wide range of sensory and cognitive processes, such as olfaction
(Adrian, 1942; Lam et al., 2000; Neville and Haberly, 2003; Martin et al., 2004), binding
of perceptual objects (Gray et al., 1989; Engel et al., 1991; Csibra et al., 2000), attention
(Fries et al., 2001) and memory formation (Howard et al., 2003; Sederberg et al., 2003),
to name a few; coincidence detection plays an important role in the auditory system (Carr
and Konishi, 1990; Joris et al., 1998) and spike-timing dependent plasticity (Markram et
al., 1997); feedforward inhibition has been described in vitro in the hippocampus (Pouille
and Scanziani, 2001) and medial superior olive (Grothe and Sanes, 1994).
Different active dendritic conductances have also been observed in vitro in various
contexts in mammalian hippocampus and neocortex: action potentials can backpropagate
into dendrites (Stuart and Sakmann, 1994), voltage-dependent conductances can reduce
the time course of EPSPs (Fricker and Miles, 2000; Galarreta and Hestrin, 2001; Ariav et
al., 2003), and coincident EPSPs can elicit dendritic spike generation (Williams and
Stuart, 2002; Ariav et al., 2003). In a particularly relevant experiment, temporal
summation was studied in cultured rat hippocampal neurons, in which photolysis of
caged glutamate was used to simulate dendritic excitation and evoke miniature EPSPs

Concluding Remarks 134
(Margulis and Tang, 1998). Under these conditions, temporal summation was studied as a
function of interpulse interval. With intervals of 10 ms or less, the summation of EPSPs
was observed to be supralinear, an effect partly caused by tetrodotoxin-sensitive Na+
channels.
The previous examples illustrate that the mechanisms involved in the decoding of
olfactory information by the KCs are ubiquitous throughout different nervous systems.
However, they have been typically studied in isolation, with a limited understanding of
the functional interactions between all of them. A great advantage of the model system
used in this dissertation is that its relative simplicity has allowed a more thorough
understanding of how all of these features can interact in vivo.
For example, one of the most common functional roles attributed to synchronized
neuronal firing states that synchrony can be used to group distributed responses in order
to bind perceptual objects [(von der Malsburg and Schneider, 1986), for reviews see
(Singer and Gray, 1995; Singer, 1999)]. Evidence in support of this idea has come from
recordings in cat visual cortex from sites with overlapping orientation preferences,
finding that the synchronization between cell assemblies is modulated by whether the
stimulus consists of one continuous bar or two separate bars [(Engel et al., 1991), see also
(Gray et al., 1989)]. Coincidence detection has been suggested as the mechanism that
could distinguish synchronous events (Singer and Gray, 1995). However, it has not been
determined in this system how specific components of cortical circuits might bring about

Concluding Remarks 135
this selectivity, and thus important insights can be gained from the work in this
dissertation.
Theoretical studies have established the relationship between the time constant of EPSPs
—modified by active dendritic conductances— and coincidence detection, and
determined that the briefer the EPSP half-width is, the stronger the preference for
coincidence detection will be [(Kempter et al., 1998); see also (Abeles, 1982; Konig et
al., 1996)]. Research in rat hippocampus (Pouille and Scanziani, 2001) and auditory
cortex (Wehr and Zador, 2003) has found that precisely timed inhibition limits the
temporal window in which these neurons integrate their inputs, favoring their detection of
coincident input. Additionally, theoretical models of cortical macrocolumns (Lucke and
von der Malsburg, 2004) have found that oscillatory inhibition can define phases within
an oscillatory cycle at which the activity of individual minicolumns is evaluated, lending
theoretical insights into how the results obtained for the MBs may apply in more complex
systems.
Particularly in the vertebrate olfactory cortex, an area downstream of the olfactory bulb
(OB) and analogous to the arthropod MB, several features similar to those studied here
have been described. Work conducted in frog olfactory cortex (Duchamp-Viret et al.,
1996), as well as in rat (McCollum et al., 1991) and monkey (Tanabe et al., 1975)
piriform cortices, has found very sparse odor representations in these areas, with neurons
responding specifically to very few odors. Furthermore, some of these responses reliably
consist of only one or two action potentials (Nemitz and Goldberg, 1983; Duchamp-Viret

Concluding Remarks 136
et al., 1996) over extremely low baseline firing rates (Biedenbach and Stevens, 1969). It
has been hypothesized that these specific and brief responses may result from detection
of coincident input (Duchamp-Viret et al., 1998). Additionally, several of the
mechanisms involved in the sparsening of the representation in the MB are known to
exist in mammalian piriform cortex: there is evidence for feedforward inhibition (Tseng
and Haberly, 1988; Ekstrand et al., 2001); spatially distributed and overlapping
projections of mitral cells onto pyramidal cells with no apparent topographical ordering,
as described in Section 4.3 (Haberly, 1997; Zou et al., 2001), and OB-generated
oscillatory activity (Ketchum and Haberly, 1993; Neville and Haberly, 2003).
Specifically, it has been hypothesized that phase-locked inhibition limits the window in
which piriform cortex pyramidal cells integrate their input (Ketchum and Haberly, 1993),
in agreement with our results. Our current work, combining all of these features, provides
information and insights that can be highly relevant for enhancing our understanding of
these cortical olfactory areas.
The work described in this dissertation shows that in the insect olfactory system all of
these features (oscillatory population activity, coincidence detection, feedforward
inhibition, active dendritic properties, sparse coding) occur together, and illustrates
mechanisms through which they can interact to bring about a drastic transformation of
sensory representations, increasing our understanding of how nervous systems can
process information.

137
References
Abbott BC, Hill AV, Howarth JV (1958) The positive and negative heat production
associated with a nerve impulse. Proc R Soc Lond Ser B-Biol Sci 148:149-187.
Abbott LF, Dayan P (1999) The effect of correlated variability on the accuracy of a
population code. Neural Comput 11:91-101.
Abeles M (1982) Role of the cortical neuron: Integrator or coincidence detector? Isr J
Med Sci 18:83-92.
Abeles M, Bergman H, Margalit E, Vaadia E (1993) Spatiotemporal firing patterns in the
frontal-cortex of behaving monkeys. J Neurophysiol 70:1629-1638.
Adrian E (1926) The impulses produced by sensory nerve endings. J Physiol (Lond)
61:49-72.
Adrian E (1942) Olfactory reactions in the brain of a hedgehog. J Physiol (Lond)
100:459-473.
Aiello LC, Wheeler P (1995) The expensive tissue hypothesis: The brain and the
digestive system in human and primate evolution. Curr Anthropol 36:199-221.
Allman JM (1999) Evolving brains. New York: Scientific American Library.
Amoore JE (1967) Specific anosmia - a clue to olfactory code. Nature 214:1095-&.
Amoore JE, Palmieri G, Wanke E, Blum MS (1969) Ant alarm pheromone activity -
correlation with molecular shape by scanning computer. Science 165:1266-&.
Anton S, Hansson BS (1994) Central processing of sex-pheromone, host odor, and
oviposition deterrent information by interneurons in the antennal lobe of female
Spodoptera-littoralis (Lepidoptera, Noctuidae). J Comp Neurol 350:199-214.
Anton S, Hansson BS (1995) Sex-pheromone and plant-associated odor processing in
antennal lobe interneurons of male Spodoptera-littoralis (Lepidoptera,
Noctuidae). J Comp Physiol A-Sens Neural Behav Physiol 176:773-789.
Ariav G, Polsky A, Schiller J (2003) Submillisecond precision of the input-output
transformation function mediated by fast sodium dendritic spikes in basal
dendrites of CA1 pyramidal neurons. J Neurosci 23:7750-7758.

References 138
Attwell D, Laughlin SB (2001) An energy budget for signaling in the grey matter of the
brain. J Cereb Blood Flow Metab 21:1133-1145.
Barlow H (1969) Pattern recognition and the responses of sensory neurones. Ann NY
Acad Sci 156:872-881.
Bazhenov M, Stopfer M, Rabinovich M, Abarbanel HD, Sejnowski TJ, Laurent G
(2001a) Model of cellular and network mechanisms for odor-evoked temporal
patterning in the locust antennal lobe. Neuron 30:569-581.
Bazhenov M, Stopfer M, Rabinovich M, Huerta R, Abarbanel HD, Sejnowski TJ, Laurent
G (2001b) Model of transient oscillatory synchronization in the locust antennal
lobe. Neuron 30:553-567.
Belluscio L, Katz LC (2001) Symmetry, stereotypy, and topography of odorant
representations in mouse olfactory bulbs. J Neurosci 21:2113-2122.
Biedenbach MA, Stevens CF (1969) Electrical activity in cat olfactory cortex produced
by synchronous orthodromic volleys. J Neurophysiol 32:193-203.
Bragin A, Jando G, Nadasdy Z, Hetke J, Wise K, Buzsaki G (1995) Gamma (40-100 Hz)
oscillation in the hippocampus of the behaving rat. J Neurosci 15:47-60.
Brand A, Behrend O, Marquardt T, McAlpine D, Grothe B (2002) Precise inhibition is
essential for microsecond interaural time difference coding. Nature 417:543-
547.
Britten KH, Shadlen MN, Newsome WT, Movshon JA (1992) The analysis of visual
motion: A comparison of neuronal and psychophysical performance. J Neurosci
12:4745-4765.
Brody CD, Hopfield JJ (2003) Simple networks for spike-timing-based computation, with
application to olfactory processing. Neuron 37:843-852.
Buzsaki G (2002) Theta oscillations in the hippocampus. Neuron 33:325-340.
Cain WS, Potts BC (1996) Switch and bait: Probing the discriminative basis of odor
identification via recognition memory. Chem Senses 21:35-44.
Carr CE, Konishi M (1990) A circuit for detection of interaural time differences in the
brain-stem of the barn owl. J Neurosci 10:3227-3246.

References 139
Clarke DD, Sokoloff L (1999) Circulation and energy metabolism of the brain. In: Basic
neurochemistry: Molecular, cellular and medical aspects (Siegel GJ, Agranoff
BW, Albers RW, Fisher SK, Uhler MD, eds), pp 637-669. Philadelphia:
Lippincott-Raven.
Clyne PJ, Warr CG, Freeman MR, Lessing D, Kim JH, Carlson JR (1999) A novel family
of divergent seven-transmembrane proteins: Candidate odorant receptors in
Drosophila. Neuron 22:327-338.
Connolly JB, Roberts IJ, Armstrong JD, Kaiser K, Forte M, Tully T, O'Kane CJ (1996)
Associative learning disrupted by impaired Gs signaling in Drosophila
mushroom bodies. Science 274:2104-2107.
Contreras D, Destexhe A, Steriade M (1997) Intracellular and computational
characterization of the intracortical inhibitory control of synchronized thalamic
inputs in vivo. J Neurophysiol 78:335-350.
Csibra G, Davis G, Spratling MW, Johnson MH (2000) Gamma oscillations and object
processing in the infant brain. Science 290:1582-1585.
de Belle JS, Heisenberg M (1994) Associative odor learning in Drosophila abolished by
chemical ablation of mushroom bodies. Science 263:692-695.
Destexhe A, Mainen ZF, Sejnowski TJ (1994) Synthesis of models for excitable
membranes, synaptic transmission and neuromodulation using a common kinetic
formalism. J Comput Neurosci 1:195-230.
DeWeese MR, Wehr M, Zador AM (2003) Binary spiking in auditory cortex. J Neurosci
23:7940-7949.
Diesmann M, Gewaltig MO, Aertsen A (1999) Stable propagation of synchronous
spiking in cortical neural networks. Nature 402:529-533.
Distler P (1989) Histochemical-demonstration of GABA-like immunoreactivity in cobalt
labeled neuron individuals in the insect olfactory pathway. Histochemistry
91:245-249.
Dobritsa AA, van der Goes van Naters W, Warr CG, Steinbrecht RA, Carlson JR (2003)
Integrating the molecular and cellular basis of odor coding in the Drosophila
antenna. Neuron 37:827-841.

References 140
Dominguez DRC, Bolle D (1998) Self-control in sparsely coded networks. Phys Rev Lett
80:2961-2964.
Dubnau J, Grady L, Kitamoto T, Tully T (2001) Disruption of neurotransmission in
Drosophila mushroom body blocks retrieval but not acquisition of memory.
Nature 411:476-480.
Duchamp-Viret P, Palouzier-Paulignan B, Duchamp A (1996) Odor coding properties of
frog olfactory cortical neurons. Neuroscience 74:885-895.
Duchamp-Viret P, Palouzier-Paulignan B, Duchamp A (1998) Sensory information
processing in the frog olfactory pathways. Experimental basis for modeling
studies. Biosystems 48:37-45.
Dujardin F (1850) Memoire sur le systeme nerveux des insectes. Annales des Sciences
Naturelles-Zoologie et biologie animale 14:195-206.
Dusenbery DB (1992) Sensory ecology. New York: W. H. Freeman and Company.
Eccles JC (1957) The physiology of nerve cells. Baltimore, MD: Johns Hopkins Press.
Eckhorn R, Bauer R, Jordan W, Brosch M, Kruse W, Munk M, Reitboeck HJ (1988)
Coherent oscillations - a mechanism of feature linking in the visual-cortex -
multiple electrode and correlation analyses in the cat. Biol Cybern 60:121-130.
Ehmer B, Hoy R (2000) Mushroom bodies of vespid wasps. J Comp Neurol 416:93-100.
Ekstrand JJ, Domroese ME, Feig SL, Illig KR, Haberly LB (2001) Immunocytochemical
analysis of basket cells in rat piriform cortex. J Comp Neurol 434:308-328.
Engel AK, Konig P, Singer W (1991) Direct physiological evidence for scene
segmentation by temporal coding. Proc Natl Acad Sci U S A 88:9136-9140.
Engel AK, Fries P, Singer W (2001) Dynamic predictions: Oscillations and synchrony in
top-down processing. Nat Rev Neurosci 2:704-716.
Ernst KD, Boeckh J (1983) A neuroanatomical study on the organization of the central
antennal pathways in insects .3. Neuroanatomical characterization of
physiologically defined response types of deutocerebral neurons in Periplaneta-
americana. Cell Tissue Res 229:1-22.

References 141
Ernst KD, Boeckh J, Boeckh V (1977) Neuroanatomical study on organization of central
antennal pathways in insects .2. Deutocerebral connections in Locusta-
migratoria and Periplaneta-americana. Cell Tissue Res 176:285-308.
Flanagan D, Mercer AR (1989) Morphology and response characteristics of neurons in
the deutocerebrum of the brain in the honeybee Apis-mellifera. J Comp Physiol
A-Sens Neural Behav Physiol 164:483-494.
Fonta C, Sun XJ, Masson C (1993) Morphology and spatial-distribution of bee antennal
lobe interneurons responsive to odors. Chem Senses 18:101-119.
Fricker D, Miles R (2000) EPSP amplification and the precision of spike timing in
hippocampal neurons. Neuron 28:559-569.
Fricker D, Miles R (2001) Interneurons, spike timing, and perception. Neuron 32:771-
774.
Friedrich RW, Korsching SI (1997) Combinatorial and chemotopic odorant coding in the
zebrafish olfactory bulb visualized by optical imaging. Neuron 18:737-752.
Fries P, Reynolds JH, Rorie AE, Desimone R (2001) Modulation of oscillatory neuronal
synchronization by selective visual attention. Science 291:1560-1563.
Fujita I, Konishi M (1991) The role of GABAergic inhibition in processing of interaural
time difference in the owls auditory-system. J Neurosci 11:722-739.
Galarreta M, Hestrin S (2001) Spike transmission and synchrony detection in networks of
GABAergic interneurons. Science 292:2295-2299.
Gao Q, Yuan BB, Chess A (2000) Convergent projections of Drosophila olfactory
neurons to specific glomeruli in the antennal lobe. Nat Neurosci 3:780-785.
Gasser HS (1950) Unmedullated fibers originating in dorsal root ganglia. J Gen Physiol
33:651-690.
Gelperin A (1999) Oscillatory dynamics and information processing in olfactory systems.
J Exp Biol 202 (Pt 14):1855-1864.
Gelperin A, Tank DW (1990) Odor-modulated collective network oscillations of
olfactory interneurons in a terrestrial mollusk. Nature 345:437-440.
Gerstner W, Kempter R, van Hemmen JL, Wagner H (1996) A neuronal learning rule for
sub-millisecond temporal coding. Nature 383:76-81.
References 142
Gray CM, Konig P, Engel AK, Singer W (1989) Oscillatory responses in cat visual
cortex exhibit inter-columnar synchronization which reflects global stimulus
properties. Nature 338:334-337.
Gronenberg W (1999) Modality-specific segregation of input to ant mushroom bodies.
Brain Behav Evol 54:85-95.
Gronenberg W, Holldobler B (1999) Morphologic representation of visual and antennal
information in the ant brain. J Comp Neurol 412:229-240.
Grothe B, Sanes DH (1994) Synaptic inhibition influences the temporal coding properties
of medial superior olivary neurons: An in vitro study. J Neurosci 14:1701-1709.
Grunewald B (1999a) Morphology of feedback neurons in the mushroom body of the
honeybee, Apis mellifera. J Comp Neurol 404:114-126.
Grunewald B (1999b) Physiological properties and response modulations of mushroom
body feedback neurons during olfactory learning in the honeybee, Apis
mellifera. J Comp Physiol 185:565-576.
Grunewald B (2003) Differential expression of voltage-sensitive K(+) and Ca(2+)
currents in neurons of the honeybee olfactory pathway. J Exp Biol 206:117-129.
Haberly LB (1997) Olfactory cortex. In: The synaptic organization of the brain, 4th
Edition (Shepherd GM, ed). New York: Oxford University Press.
Hammer M, Menzel R (1995) Learning and memory in the honeybee. J Neurosci
15:1617-1630.
Hansson BS, Anton S (2000) Function and morphology of the antennal lobe: New
developments. Annu Rev Entomol 45:203-231.
Heisenberg M (1998) What do the mushroom bodies do for the insect brain? An
introduction. Learn Mem 5:1-10.
Heisenberg M (2003) Mushroom body memoir: From maps to models. Nat Rev Neurosci
4:266-275.
Heisenberg M, Borst A, Wagner S, Byers D (1985) Drosophila mushroom body mutants
are deficient in olfactory learning. J Neurogenet 2:1-30.

References 143
Hildebrand JG, Shepherd GM (1997) Mechanisms of olfactory discrimination:
Converging evidence for common principles across phyla. Annu Rev Neurosci
20:595-631.
Holub A, Laurent G, Perona P (2002) A digital antennal lobe for pattern equalization:
Analysis and design. In: Advances in Neural Information Processing Systems
15. Vancouver, Canada.
Homberg U, Montague RA, Hildebrand JG (1988) Anatomy of antenno-cerebral
pathways in the brain of the sphinx moth Manduca-sexta. Cell Tissue Res
254:255-281.
Honegger HW, Schurmann FW (1975) Cobalt sulfide staining of optic fibers in brain of
cricket, Gryllus-campestris. Cell Tissue Res 159:213-225.
Howard J, Blakeslee B, Laughlin SB (1987) The intracellular pupil mechanism and
photoreceptor signal - noise ratios in the fly Lucilia-cuprina. Proc R Soc Lond
Ser B-Biol Sci 231:415-435.
Howard MW, Rizzuto DS, Caplan JB, Madsen JR, Lisman J, Aschenbrenner-Scheibe R,
Schulze-Bonhage A, Kahana MJ (2003) Gamma oscillations correlate with
working memory load in humans. Cereb Cortex 13:1369-1374.
Hubel DH, Wiesel TN (1962) Receptive fields, binocular interaction and functional
architecture in the cat's visual cortex. J Physiol 160:106-154.
Hughes JR, Mazurowski JA (1962) Studies on supracallosal mesial cortex of
unanesthetized, conscious mammals .2. Monkey B responses from olfactory
bulb. Electroencephalogr Clin Neurophysiol 14:635-645.
Jefferis G, Marin EC, Stocker RF, Luo LQ (2001) Target neuron prespecification in the
olfactory map of Drosophila. Nature 414:204-208.
Johnston D, Magee JC, Colbert CM, Christie BR (1996) Active properties of neuronal
dendrites. Annu Rev Neurosci 19:165-186.
Joris PX, Smith PH, Yin TCT (1998) Coincidence detection in the auditory system: 50
years after Jeffress. Neuron 21:1235-1238.
Kanerva P (1988) Sparse distributed memory. Cambridge, MA: MIT Press.

References 144
Keil TA (1982) Contacts of pore tubules and sensory dendrites in antennal chemosensilla
of a silkmoth - demonstration of a possible pathway for olfactory molecules.
Tissue Cell 14:451-462.
Keil TA (1989) Fine-structure of the pheromone-sensitive sensilla on the antenna of the
hawkmoth, Manduca-sexta. Tissue Cell 21:139-151.
Kempter R, Gerstner W, van Hemmen JL, Wagner H (1998) Extracting oscillations.
Neuronal coincidence detection with noisy periodic spike input. Neural Comput
10:1987-2017.
Kenyon FC (1896) The brain of the bee. J Comp Neurol 6:133-210.
Ketchum KL, Haberly LB (1993) Synaptic events that generate fast oscillations in
piriform cortex. J Neurosci 13:3980-3985.
Konig P, Engel AK, Singer W (1996) Integrator or coincidence detector? The role of the
cortical neuron revisited. Trends Neurosci 19:130-137.
Lam YW, Cohen LB, Wachowiak M, Zochowski MR (2000) Odors elicit three different
oscillations in the turtle olfactory bulb. J Neurosci 20:749-762.
Larkum ME, Zhu JJ, Sakmann B (1999) A new cellular mechanism for coupling inputs
arriving at different cortical layers. Nature 398:338-341.
Laughlin SB (2001) Energy as a constraint on the coding and processing of sensory
information. Curr Opin Neurobiol 11:475-480.
Laughlin SB, Sejnowski TJ (2003) Communication in neuronal networks. Science
301:1870-1874.
Laurent G (1990) Voltage-dependent nonlinearities in the membrane of locust nonspiking
local interneurons, and their significance for synaptic integration. J Neurosci
10:2268-2280.
Laurent G (1996) Dynamical representation of odors by oscillating and evolving neural
assemblies. Trends Neurosci 19:489-496.
Laurent G (1999) A systems perspective on early olfactory coding. Science 286:723-728.
Laurent G (2002) Olfactory network dynamics and the coding of multidimensional
signals. Nat Rev Neurosci 3:884-895.

References 145
Laurent G, Naraghi M (1994) Odorant-induced oscillations in the mushroom bodies of
the locust. J Neurosci 14:2993-3004.
Laurent G, Davidowitz H (1994) Encoding of olfactory information with oscillating
neural assemblies. Science 265:1872-1875.
Laurent G, Seymour-Laurent KJ, Johnson K (1993) Dendritic excitability and a voltage-
gated calcium current in locust nonspiking local interneurons. J Neurophysiol
69:1484-1498.
Laurent G, Wehr M, Davidowitz H (1996) Temporal representations of odors in an
olfactory network. J Neurosci 16:3837-3847.
Laurent G, Stopfer M, Friedrich RW, Rabinovich MI, Volkovskii A, Abarbanel HD
(2001) Odor encoding as an active, dynamical process: Experiments,
computation, and theory. Annu Rev Neurosci 24:263-297.
Lee JK, Strausfeld NJ (1990) Structure, distribution and number of surface sensilla and
their receptor-cells on the olfactory appendage of the male moth Manduca-sexta.
J Neurocytol 19:519-538.
Leitch B, Laurent G (1996) GABAergic synapses in the antennal lobe and mushroom
body of the locust olfactory system. J Comp Neurol 372:487-514.
Lennie P (2003) The cost of cortical computation. Curr Biol 13:493-497.
Levy WB, Baxter RA (1996) Energy efficient neural codes. Neural Comput 8:531-543.
Li Y, Strausfeld NJ (1997) Morphology and sensory modality of mushroom body
extrinsic neurons in the brain of the cockroach, Periplaneta americana. J Comp
Neurol 387:631-650.
Li Y, Strausfeld NJ (1999) Multimodal efferent and recurrent neurons in the medial lobes
of cockroach mushroom bodies. J Comp Neurol 409:647-663.
Linster C, Smith BH (1999) Generalization between binary odor mixtures and their
components in the rat. Physiol Behav 66:701-707.
Livermore A, Laing DG (1996) Influence of training and experience on the perception of
multicomponent odor mixtures. J Exp Psychol-Hum Percept Perform 22:267-
277.

References 146
Lucke J, von der Malsburg C (2004) Rapid processing and unsupervised learning in a
model of the cortical macrocolumn. Neural Comput 16:501-533.
MacLeod K, Laurent G (1996) Distinct mechanisms for synchronization and temporal
patterning of odor-encoding neural assemblies. Science 274:976-979.
MacLeod K, Backer A, Laurent G (1998) Who reads temporal information contained
across synchronized and oscillatory spike trains? Nature 395:693-698.
Margulis M, Tang CM (1998) Temporal integration can readily switch between sublinear
and supralinear summation. J Neurophysiol 79:2809-2813.
Marin EC, Jefferis GS, Komiyama T, Zhu H, Luo L (2002) Representation of the
glomerular olfactory map in the Drosophila brain. Cell 109:243-255.
Markram H, Lubke J, Frotscher M, Sakmann B (1997) Regulation of synaptic efficacy by
coincidence of postsynaptic APs and EPSPs. Science 275:213-215.
Marr D (1969) A theory of cerebellar cortex. J Physiol-London 202:437-470.
Martin C, Gervais R, Hugues E, Messaoudi B, Ravel N (2004) Learning modulation of
odor-induced oscillatory responses in the rat olfactory bulb: A correlate of odor
recognition? J Neurosci 24:389-397.
Martin RD (1996) Scaling of the mammalian brain: The maternal energy hypothesis.
News Physiol Sci 11:149-156.
Masson C, Mustaparta H (1990) Chemical information-processing in the olfactory system
of insects. Physiol Rev 70:199-245.
McCollum J, Larson J, Otto T, Schottler F, Granger R, Lynch G (1991) Short-latency
single unit processing in olfactory cortex. J Cogn Neurosci 3:293-299.
McGuire SE, Le PT, Davis RL (2001) The role of Drosophila mushroom body signaling
in olfactory memory. Science 293:1330-1333.
McGuire SE, Le PT, Osborn AJ, Matsumoto K, Davis RL (2003) Spatiotemporal rescue
of memory dysfunction in Drosophila. Science 302:1765-1768.
Mizunami M, Weibrecht JM, Strausfeld NJ (1998a) Mushroom bodies of the cockroach:
Their participation in place memory. J Comp Neurol 402:520-537.

References 147
Mizunami M, Okada R, Li Y, Strausfeld NJ (1998b) Mushroom bodies of the cockroach:
Activity and identities of neurons recorded in freely moving animals. J Comp
Neurol 402:501-519.
Mobbs PG (1982) The brain of the honeybee Apis mellifera. 1. The connections and
spatial organization of the mushroom bodies. Phil Trans R Soc Lond B 298:309-
354.
Mombaerts P, Wang F, Dulac C, Chao SK, Nemes A, Mendelsohn M, Edmondson J,
Axel R (1996) Visualizing an olfactory sensory map. Cell 87:675-686.
Nemitz JW, Goldberg SJ (1983) Neuronal responses of rat pyriform cortex to odor
stimulation: An extracellular and intracellular study. J Neurophysiol 49:188-203.
Neville KR, Haberly LB (2003) Beta and gamma oscillations in the olfactory system of
the urethane-anesthetized rat. J Neurophysiol 90:3921-3930.
Nilsson GE (1996) Brain and body oxygen requirements of Gnathonemus petersii, a fish
with an exceptionally large brain. J Exp Biol 199:603-607.
Okada M (1996) Notions of associative memory and sparse coding. Neural Netw 9:1429-
1458.
O'Keefe J, Recce ML (1993) Phase relationship between hippocampal place units and the
EEG theta-rhythm. Hippocampus 3:317-330.
Oleskevich S (1999) Cholinergic synaptic transmission in insect mushroom bodies in
vitro. J Neurophysiol 82:1091-1096.
Oleskevich S, Clements JD, Srinivasan MV (1997) Long-term synaptic plasticity in the
honeybee. J Neurophysiol 78:528-532.
Olshausen BA, Field DJ (1996) Emergence of simple-cell receptive field properties by
learning a sparse code for natural images. Nature 381:607-609.
Ottoson D (1959) Comparison of slow potentials evoked in the frogs nasal mucosa and
olfactory bulb by natural stimulation. Acta Physiol Scand 47:149-159.
Parker AJ, Newsome WT (1998) Sense and the single neuron: Probing the physiology of
perception. Annu Rev Neurosci 21:227-277.
Pascual A, Preat T (2001) Localization of long-term memory within the Drosophila
mushroom body. Science 294:1115-1117.

References 148
Patel AD, Balaban E (2000) Temporal patterns of human cortical activity reflect tone
sequence structure. Nature 404:80-84.
Pentz M, Shott M (1988) Handling experimental data. Philadelphia: Open University
Press.
Perez-Orive J, Durand DM (2000) Modeling study of peripheral nerve recording
selectivity. IEEE Trans Rehabil Eng 8:320-329.
Perez-Orive J, Bazhenov M, Laurent G (2004) Intrinsic and circuit properties favor
coincidence detection for decoding oscillatory input. J Neurosci. In press.
Perez-Orive J, Mazor O, Turner GC, Cassenaer S, Wilson RI, Laurent G (2002)
Oscillations and sparsening of odor representations in the mushroom body.
Science 297:359-365.
Pesaran B, Pezaris JS, Sahani M, Mitra PP, Andersen RA (2002) Temporal structure in
neuronal activity during working memory in macaque parietal cortex. Nat
Neurosci 5:805-811.
Pouille F, Scanziani M (2001) Enforcement of temporal fidelity in pyramidal cells by
somatic feed-forward inhibition. Science 293:1159-1163.
Pouzat C, Mazor O, Laurent G (2002) Using noise signature to optimize spike-sorting
and to assess neuronal classification quality. J Neurosci Methods 122:43-57.
Power DV (1997) Immunocytochemical detection of amino acid neurotransmitters in
paraformaldehyde-fixed tissues. In: Neurotransmitter methods (Rayne RC, ed).
Totowa, NJ: Humana Press.
Prut Y, Vaadia E, Bergman H, Haalman I, Slovin H, Abeles M (1998) Spatiotemporal
structure of cortical activity: Properties and behavioral relevance. J
Neurophysiol 79:2857-2874.
Pumphrey RJ, Young JZ (1938) The rates of conduction of nerve fibers of various
diameters in cephalopods. J Exp Biol 15:453-466.
Purves RD (1981) Microelectrode methods for intracellular recording and ionophoresis.
London: Academic Press.
Rein K, Zockler M, Mader MT, Grubel C, Heisenberg M (2002) The Drosophila standard
brain. Curr Biol 12:227-231.
References 149
Riehle A, Grun S, Diesmann M, Aertsen A (1997) Spike synchronization and rate
modulation differentially involved in motor cortical function. Science 278:1950-
1953.
Ritchie JM (1995) Physiology of axons. In: The axon; structure, function and
pathophysiology (Waxman SG, Kocsis JD, Stys PK, eds). New York: Oxford
University Press.
Rodriguez E, George N, Lachaux JP, Martinerie J, Renault B, Varela FJ (1999)
Perception's shadow: Long-distance synchronization of human brain activity.
Nature 397:430-433.
Rolls ET, Tovee MJ (1995) Sparseness of the neuronal representation of stimuli in the
primate temporal visual cortex. J Neurophysiol 73:713-726.
Rybak J, Menzel R (1998) Integrative properties of the Pe1 neuron, a unique mushroom
body output neuron. Learn Mem 5:133-145.
Salinas E, Sejnowski TJ (2000) Impact of correlated synaptic input on output firing rate
and variability in simple neuronal models. J Neurosci 20:6193-6209.
Salinas E, Sejnowski TJ (2001) Correlated neuronal activity and the flow of neural
information. Nat Rev Neurosci 2:539-550.
Satou M (1990) Synaptic organization, local neuronal circuitry, and functional
segregation of the teleost olfactory-bulb. Prog Neurobiol 34:115-142.
Schafer S, Bicker G (1986) Distribution of GABA-like immunoreactivity in the brain of
the honeybee. J Comp Neurol 246:287-300.
Schafer S, Rosenboom H, Menzel R (1994) Ionic currents of Kenyon cells from the
mushroom body of the honeybee. J Neurosci 14:4600-4612.
Schiller J, Schiller Y (2001) NMDA receptor-mediated dendritic spikes and coincident
signal amplification. Curr Opin Neurobiol 11:343-348.
Schwaerzel M, Heisenberg M, Zars T (2002) Extinction antagonizes olfactory memory at
the subcellular level. Neuron 35:951-960.
Sederberg PB, Kahana MJ, Howard MW, Donner EJ, Madsen JR (2003) Theta and
gamma oscillations during encoding predict subsequent recall. J Neurosci
23:10809-10814.

References 150
Shadlen MN, Newsome WT (1994) Noise, neural codes and cortical organization. Curr
Opin Neurobiol 4:569-579.
Shadlen MN, Newsome WT (1998) The variable discharge of cortical neurons:
Implications for connectivity, computation, and information coding. J Neurosci
18:3870-3896.
Shadlen MN, Movshon JA (1999) Synchrony unbound: A critical evaluation of the
temporal binding hypothesis. Neuron 24:67-77.
Sherrington CS (1906) Integrative action of the nervous system. New Haven, CT: Yale
University Press.
Siapas AG, Wilson MA (1998) Coordinated interactions between hippocampal ripples
and cortical spindles during slow-wave sleep. Neuron 21:1123-1128.
Singer W (1999) Time as coding space? Curr Opin Neurobiol 9:189-194.
Singer W, Gray CM (1995) Visual feature integration and the temporal correlation
hypothesis. Annu Rev Neurosci 18:555-586.
Sloper JJ, Powell TP (1979) Ultrastructural features of the sensori-motor cortex of the
primate. Philos Trans R Soc Lond B Biol Sci 285:124-139.
Softky WR, Koch C (1993) The highly irregular firing of cortical cells is inconsistent
with temporal integration of random EPSPs. J Neurosci 13:334-350.
Solomons TWG (1988) Organic chemistry, Fourth Edition. New York: John Wiley &
Sons.
Steinbrecht RA (1980) Cryofixation without cryoprotectants - freeze substitution and
freeze-etching of an insect olfactory receptor. Tissue Cell 12:73-100.
Steinmetz PN, Roy A, Fitzgerald PJ, Hsiao SS, Johnson KO, Niebur E (2000) Attention
modulates synchronized neuronal firing in primate somatosensory cortex. Nature
404:187-190.
Steriade M, McCormick DA, Sejnowski TJ (1993) Thalamocortical oscillations in the
sleeping and aroused brain. Science 262:679-685.
Stocker RF, Lienhard MC, Borst A, Fischbach KF (1990) Neuronal architecture of the
antennal lobe in Drosophila- melanogaster. Cell Tissue Res 262:9-34.

References 151
Stopfer M, Jayaraman V, Laurent G (2003) Intensity versus identity coding in an
olfactory system. Neuron 39:991-1004.
Stopfer M, Bhagavan S, Smith BH, Laurent G (1997) Impaired odour discrimination on
desynchronization of odour-encoding neural assemblies. Nature 390:70-74.
Strausfeld NJ (2002) Organization of the honey bee mushroom body: Representation of
the calyx within the vertical and gamma lobes. J Comp Neurol 450:4-33.
Strausfeld NJ, Li Y (1999a) Organization of olfactory and multimodal afferent neurons
supplying the calyx and pedunculus of the cockroach mushroom bodies. J Comp
Neurol 409:603-625.
Strausfeld NJ, Li Y (1999b) Representation of the calyces in the medial and vertical lobes
of cockroach mushroom bodies. J Comp Neurol 409:626-646.
Strausfeld NJ, Hansen L, Li Y, Gomez RS, Ito K (1998) Evolution, discovery, and
interpretations of arthropod mushroom bodies. Learn Mem 5:11-37.
Stuart GJ, Sakmann B (1994) Active propagation of somatic action potentials into
neocortical pyramidal cell dendrites. Nature 367:69-72.
Tanabe T, Iino M, Takagi SF (1975) Discrimination of odors in olfactory bulb, pyriform-
amygdaloid areas, and orbitofrontal cortex of the monkey. J Neurophysiol
38:1284-1296.
Tanaka N, Awasaki T, Shimada T, Ito K (2004) Integration of chemosensory pathways in
the Drosophila second-order olfactory centers. Curr Biol 14:449 - 457.
Tang S, Guo A (2001) Choice behavior of Drosophila facing contradictory visual cues.
Science 294:1543-1547.
Technau G, Heisenberg M (1982) Neural reorganization during metamorphosis of the
corpora pedunculata in Drosophila-melanogaster. Nature 295:405-407.
Traub RD (1982) Simulation of intrinsic bursting in CA3 hippocampal neurons.
Neuroscience 7:1233-1242.
Treves A, Rolls ET (1991) What determines the capacity of autoassociative memories in
the brain. Netw-Comput Neural Syst 2:371-397.

References 152
Tseng GF, Haberly LB (1988) Characterization of synaptically mediated fast and slow
inhibitory processes in piriform cortex in an in vitro slice preparation. J
Neurophysiol 59:1352-1376.
Tully T, Quinn WG (1985) Classical conditioning and retention in normal and mutant
Drosophila melanogaster. J Comp Physiol [A] 157:263-277.
Uchida N, Takahashi YK, Tanifuji M, Mori K (2000) Odor maps in the mammalian
olfactory bulb: Domain organization and odorant structural features. Nat
Neurosci 3:1035-1043.
Vaadia E, Haalman I, Abeles M, Bergman H, Prut Y, Slovin H, Aertsen A (1995)
Dynamics of neuronal interactions in monkey cortex in relation to behavioural
events. Nature 373:515-518.
van Swinderen B, Greenspan RJ (2003) Salience modulates 20-30 Hz brain activity in
Drosophila. Nat Neurosci 6:579-586.
Vinje WE, Gallant JL (2000) Sparse coding and decorrelation in primary visual cortex
during natural vision. Science 287:1273-1276.
von der Malsburg C, Schneider W (1986) A neural cocktail-party processor. Biol Cybern
54:29-40.
Vosshall LB, Wong AM, Axel R (2000) An olfactory sensory map in the fly brain. Cell
102:147-159.
Vosshall LB, Amrein H, Morozov PS, Rzhetsky A, Axel R (1999) A spatial map of
olfactory receptor expression in the Drosophila antenna. Cell 96:725-736.
Waddell S, Armstrong JD, Kitamoto T, Kaiser K, Quinn WG (2000) The amnesiac gene
product is expressed in two neurons in the Drosophila brain that are critical for
memory. Cell 103:805-813.
Wehr M, Laurent G (1996) Odour encoding by temporal sequences of firing in oscillating
neural assemblies. Nature 384:162-166.
Wehr M, Laurent G (1999) Relationship between afferent and central temporal patterns
in the locust olfactory system. J Neurosci 19:381-390.
Wehr M, Zador AM (2003) Balanced inhibition underlies tuning and sharpens spike
timing in auditory cortex. Nature 426:442-446.

References 153
Wicklein M, Strausfeld NJ (2000) Organization and significance of neurons that detect
change of visual depth in the hawk moth Manduca sexta. J Comp Neurol
424:356-376.
Williams SR, Stuart GJ (2002) Dependence of EPSP efficacy on synapse location in
neocortical pyramidal neurons. Science 295:1907-1910.
Willmore B, Tolhurst DJ (2001) Characterizing the sparseness of neural codes. Network
12:255-270.
Wilson RI, Turner GC, Laurent G (2004) Transformation of olfactory representations in
the Drosophila antennal lobe. Science 303:366-370.
Wong AM, Wang JW, Axel R (2002) Spatial representation of the glomerular map in the
Drosophila protocerebrum. Cell 109:229-241.
Zars T, Fischer M, Schulz R, Heisenberg M (2000) Localization of a short-term memory
in Drosophila. Science 288:672-675.
Zou Z, Horowitz LF, Montmayeur JP, Snapper S, Buck LB (2001) Genetic tracing
reveals a stereotyped sensory map in the olfactory cortex. Nature 414:173-179.