neuroimaging in the adrc and mcsa - alz. · pdf filemayo clinic study of aging (mcsa) (pi: ron...
TRANSCRIPT

3/2/2017
1
David T. Jones, M.D.
Associate Consultant, Department of Neurology, Mayo Clinic
Assistant Professor of Neurology and Radiology, Mayo Clinic College of Medicine
NEUROIMAGING IN ALZHEIMER’S DISEASE:
MEASURING MINDS AND MOLECULES
IMAGING BIOMARKERS
• A biological marker of some state.
• National Institutes of Health Biomarkers Definitions Working Group:
• “[A] characteristic that is objectively measured and evaluated as an indicator of normal biological processes, pathogenic processes, or pharmacologic
responses to a therapeutic intervention.”
• How can we use biomarkers?
• Diagnosis
• Prognosis
• Monitor progression
• Monitor disease response to therapeutic interventions
• Understand pathophysiology (i.e. the cause of the disease)
WHAT DO GOOD BIOMARKERS LOOK LIKE
3/2/2017
2
Exactness Precision Accuracy
Brain Aging and Neurodegenerative Physiology
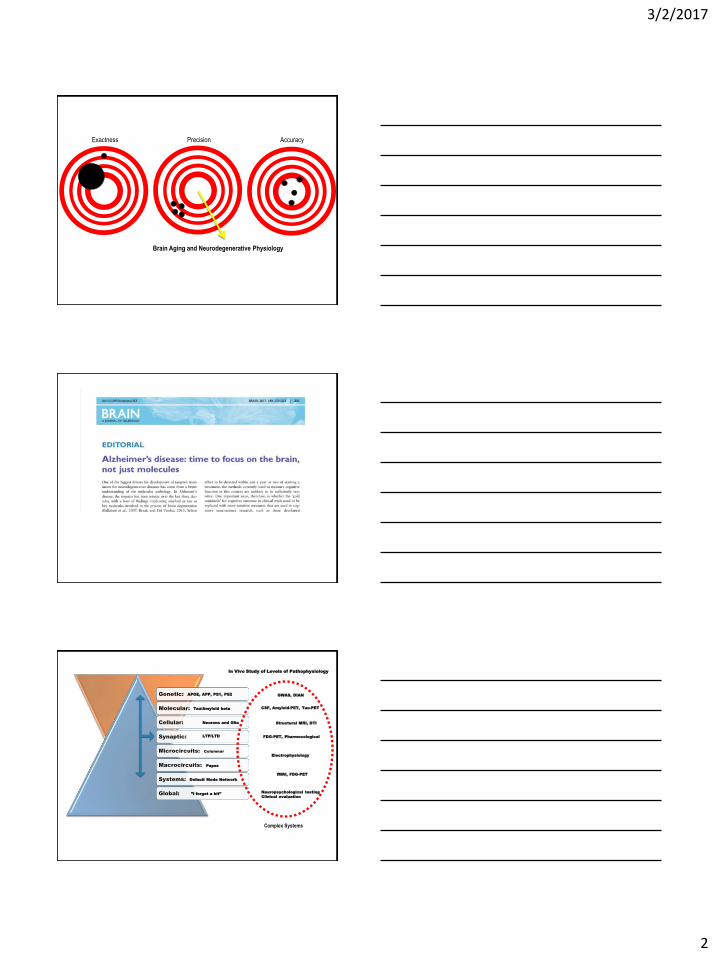
In Vivo Study of Levels of Pathophysiology
Genetic:
Molecular:
Cellular:
Synaptic:
Microcircuits:
Macrocircuits:
Systems:
Global: ”I forget a bit”
Default Mode Network
Tau/Amyloid beta
Neurons and Glia
LTP/LTD
APOE, APP, PS1, PS2
Columnar
Papez
GWAS, DIAN
CSF, Amyloid-PET, Tau-PET
Structural MRI, DTI
FDG-PET, Pharmocological
Electrophysiology
fMRI, FDG-PET
Neuropsychological testing
Clinical evaluation
Complex Systems

3/2/2017
3
OPUS ADVANCED IMAGING RESEARCH BUILDING
TOMOGRAPHY: VOLUME BY SLICES
http://upload.wikimedia.org/wikipedia/commons/2/25/Tom
ographyPrinciple_Illustration.png
Radiologic
Convention R = L
Neurologic
Convention R = R
MAGNETIC RESONANCE IMAGING (MRI)

3/2/2017
4
TYPES OF IMAGES: POSITRON EMISSION
TOMOGRAPHY (PET)
Plaque Image courtesy of the National Institute on Aging/National Institutes of Health
Structural MRI
Brain Slices Image courtesy of the National Institute on Aging/National Institutes of Health

3/2/2017
5
Structural MRI:
Gray Matter
Structural MRI:
Gray Matter
White Matter
Cerebral Spinal Fluid
FDG (glucose) PET
Mitochondria Image courtesy of the National Institute on Aging/National Institutes of Health

3/2/2017
6
Tau PET
(not FDA Approved)
EMERGING MRI TECHNIQUES:
DIFFUSION TENSOR IMAGING (DTI) AND TASK-
FREE FUNCTIONAL MRI (TF-FMRI)
3/2/2017
7
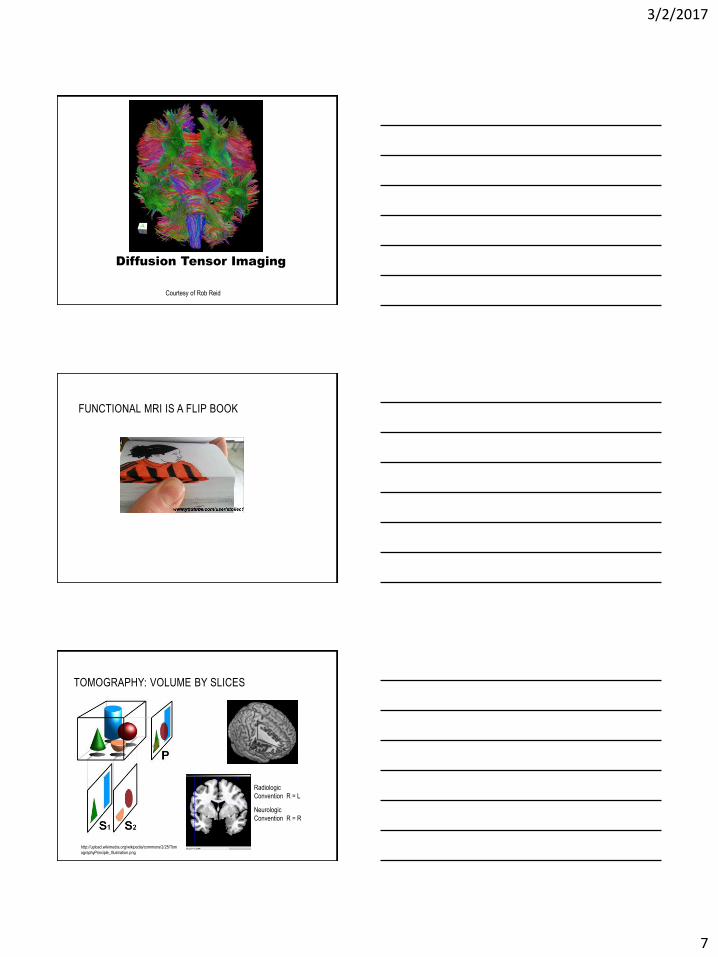
Courtesy of Rob Reid
Diffusion Tensor Imaging
FUNCTIONAL MRI IS A FLIP BOOK
TOMOGRAPHY: VOLUME BY SLICES
http://upload.wikimedia.org/wikipedia/commons/2/25/Tom
ographyPrinciple_Illustration.png
Radiologic
Convention R = L
Neurologic
Convention R = R

3/2/2017
8
FUNCTIONAL MRI IS 4 DIMENSIONAL
-3.00E+01
-2.00E+01
-1.00E+01
0.00E+00
1.00E+01
2.00E+01
3.00E+01
TR
BLOOD OXYGENATION LEVEL DEPENDENT
FROM THE FOLLOWING ARTICLE:
What does fMRI tell us about neuronal activity?
David J. Heeger & David Ress
Nature Reviews Neuroscience 3, 142-151 (February 2002)

3/2/2017
9
METHODS: SEED-TO-BRAIN
METHODS: SEED-TO-SEED
R² = 0.633
N V
oxe
l T
ime
Ser
ies
Seed Time Series
0.633
METHODS: ROI-TO-ROI USING THE MCSA
FUNCTIONAL BRAIN ATLAS
Jones DT, Vemuri P, Murphy MC, Gunter JL, et al. (2012) Non-Stationarity in the “Resting Brain’s” Modular Architecture. PLoS ONE 7(6): e39731.
doi:10.1371/journal.pone.0039731
http://www.plosone.org/article/info:doi/10.1371/journal.pone.0039731

3/2/2017
10
METHODS: GRAPH THEORY
Euler (1735)
0
0.1
0.2
0.3
0 0.5 1
Glo
ba
l
Effic
ie
ncy
Network Density (p)
CN
AD
0
0.5
1
1.5
Un
ba
la
nc
ed
P
ath
s
(N
FQ
)
CN AD
*p = 3.6x10⁻⁷
Cognition
ADL
Stage 1 Stage 2 Stage 3 MCI Mild AD Moderate AD Severe AD
Aβ
Degeneration
Tau-PET
Amyloid-PET
PART

3/2/2017
11
MEASURING MINDS AND MOLECULES
Clifford R Jack Jr , David S Knopman , William J Jagust , Ronald C Petersen , Michael W Weiner , et al. Tracking pathophysiological processes in Alzheimer's disease: an updated hypothetical model of dynamic biomarkers The Lancet Neurology Volume 12, Issue 2 2013 207 - 216

3/2/2017
12
Age-related Brain Network Stress
Compensation
Amyloid
Tau-related Neurodegeneration
Normal Aging
Alz
hei
mer
’s D
isea
se
Mild
Cog
nitiv
e Im
pairm
ent
Dem
entia
HOW DO WE ROBUSTLY MEASURES AN
INDIVIDUALS LARGE-SCALE BRAIN PATTERNS?
http://www.humanconnectome.org/
This individual spent 7% of 20 minute resting task-free functional MRI brain
scanning session in a large-scale brain configuration that looks like this.

3/2/2017
13
IMAGING BIOMARKERS: MEASURING MINDS AND
MOLECULES
• A biological marker of some state.
• National Institutes of Health Biomarkers Definitions Working Group:
• “[A] characteristic that is objectively measured and evaluated as an indicator of normal biological processes, pathogenic processes, or pharmacologic
responses to a therapeutic intervention.”
• How can we use biomarkers?
• Diagnosis
• Prognosis
• Monitor progression
• Monitor disease response to therapeutic interventions
• Understand pathophysiology (i.e. the cause of the disease)
Mayo Clinic Alzheimer’s Disease Research Center (ADRC)
Mayo Clinic Study of Aging (MCSA) (PI: Ron Petersen)
Aging and Dementia Imaging Research Laboratory (PI: Cliff Jack)