new asymmetric mixed matrix membranes of cellulose … goncalo mendes.pdfnew asymmetric mixed matrix...
TRANSCRIPT

1
Instituto Superior Técnico (December 2016)
Extended Abstract to obtain the Master of Science Degree in Integrated Master in Chemical Engineering
New Asymmetric Mixed Matrix Membranes of Cellulose Acetate and Silica
Gonçalo Diogo Gomes Mendes
Keywords
Cellulose acetate
Silica
Mixed matrix membranes
Sol-Gel
Abstract
The industrial growth of the membrane processes has led to an intense investigation
and optimization of these processes and synthesis of new membranes. Thus,
traditional membranes, such as cellulose acetate membranes, prepared by the
phase inversion method, are subjected to structural modifications, such as the mixed
matrix membranes of cellulose acetate and silica obtained by condensation, in acidic
medium and in the polymer solution, of silanol groups and hydroxyl groups of
cellulose acetate. In this work, amorphous silica contents of 0%, 5%, 10%, 15%,
20%, 30% and 40% were tested. It was observed a linear decrease in the hydraulic
permeability with the silica content, as evidenced by the increased membrane
density observed in FESEM analysis. In the assays of the molecular weight cut-off
and salt rejections the rejection coefficient increases with the silica content.
The characterization by ATR-FTIR and EDS proves the presence of silica in the
active layer of the membrane through the band, at 1080 cm-1, attributed SI-O-C.
1 INTRODUCTION
The last century has witnessed a much higher population
growth than the recorded in previous centuries, about 4,6
billion people in a total of 7 billion [1]. This excessive growth
led to an increase in consumption, which in turn resulted in
an increase of waste released and exaggerated use of
natural resources. To solve this problem, technology has
been developed to separate and treat the waste produced by
human beings, such as deodorization, distillation and
filtration. In the last 50 years, it is in this field that the use of
membranes, using a pressure gradient as driving force for
transport, has been gaining emphasis. This type of
membranes is characterized by separation mechanism or
application.
The conventional membranes can be produced from organic
or inorganic materials and may be structurally divided into
four groups: microporous, integral asymmetric, composite or
homogenous asymmetric [2]. The study of these structures is
extremely important nowadays since these membranes have
gained a strong interest due to the development of new
technologies, as is the case of nanotechnology, which have
improved their performance and removed unwanted
characteristics to the industry. In the last decade,
nanotechnology passed quickly from an academic concept to
a commercial reality. Nowadays, technology at nanoscale is
already available and being used in membranes to modify
and improve the performance, permeability, catalytic
reactivity and fouling resistance. This area of study allowed
the appearance of different types of membranes, such as
ceramic nano-structured membranes, biological membranes
and the organic-inorganic membranes [3]. Mixed matrix
membranes (MMM), included in the last group, were first
introduced in 1990 by Zimmerman et al., where the
characteristics of the polymeric membrane are
complemented with the benefits of inorganic compounds, in
particular the increase in selectivity, targeted functionalities,
and improvement in thermal, chemical and mechanical
stability [4]. These membranes have a huge area of
application, from gas permeation to pervaporation, and more
recently the health care industry (brest cancer treatment and
artificial kidney) [5,6].
2 EXPERIMENTAL PROCEDURE
2.1 MATERIALS
The casting solutions were prepared using cellulose acetate
(CA) from Sigma-Aldrich (~30.000 g/mol) as the polymer for
the membranes, acetone from LabChem and formamide

2
from Sigma-Aldrich as the solvents system, tetraethyl
orthosilicate (TEOS) from Sigma-Aldrich as the silica
precursor of silica and HNO3 from Panreac to obtain an
acidic pH. To obtain the rejection coefficients, four solutions
were prepared using sodium chloride (VWR), sodium
sulphate (Scharlau), magnesium chloride (Riedel-de Haën)
and magnesium sulphate (Merck). To obtain the molecular
weight cut-off, polymers with different molecular weights
were used: anhydrous glucose D(+) from Panreac, PEG
1.000 and PEG 10.000 from Merck, Dextran 70.000 and
Dextran 110.000 from Pharmacia. To dry the membranes, 2-
propanol and n-hexane from Prolabo were used.
2.2 MANUFACTURING OF THE MEMBRANES
2.2.1 PREPARATION OF THE CASTING SOLUTIONS
In this work, two types of membranes were prepared:
asymmetric pure cellulose acetate membrane and mixed
matrix membranes with cellulose acetate and silica. To
manufacture the membranes, a casting solution consisting of
a polymer (cellulose acetate) and a solvent system
(formamide as the weak solvent and acetone as the strong
solvent) had to be prepared. The preparation followed the
experimental protocol of the research group of Professor
Maria Norberta de Pinho [7]. In the casting solutions of the
membranes with silica, the previous method was modified,
with the addition of TEOS (silica precursor), distilled water
and HNO3 to the starting mixture. The proportions are shown
in
Table 2-2. The quantities of cellulose acetate, acetone and
formamide were kept so that the pore size did not change.
The homogenization of the mixtures was performed in a P
Selecta Vibromatic mechanical stirrer at 550 rpm for 24
hours.
2.2.2 CASTING OF THE MEMBRANES
The membranes were fabricated by the wet phase inversion
method described by Kunst and Sourirajan [8]. The
homogeneous casting solution mixture is placed in a glass
dish and, with the aid of a casting knife, spread evenly over
the plate. During the evaporation time (30 seconds), the
acetone evaporates from the surface of the membrane,
increasing the concentration of polymer and giving rise to the
active layer, located in the contact area with the air. After
this, the glass support with the membrane is placed in a
coagulation bath (deionized water and ice) that will promote
the exchange of non-solvent between the membrane matrix
and the bath.
Table 2-1 – Abbreviations used for each membrane with
different content in silica.
Membrane Silica content (%)
A0 0
A1 5
A2 10
A3 15
A4 20
A5 30
A6 40
2.3 CHARACTERIZATION
2.3.1 MORPHOLOGICAL STUDIES
To study the behaviour of silica in cellulose acetate
membranes, FESEM (Field Emission Scanning Electron
Microscopy) was used to assess the morphology and size of
the membrane. Before conducting the analysis, the
membranes were dried and then placed in liquid nitrogen so
that the cross section was uniform throughout the
membrane. Finally, a gold and palladium film was deposited
on the sample so that it conducts electricity due to the use of
the SEM electron beam. The experiments were made using
a JE-7001F FEG-SEM (JEOL), operating at 15,0kV with a
magnification of 750×, 5.000× and 10.000×.
2.3.2 SURFACE CHARACTERIZATION
To characterize both surfaces of the membranes, two types
of analysis were used: ATR/FTIR spectroscopy and Energy-
Dispersive X-ray Spectroscopy (EDS). The ATR/FTIR
spectroscopy was performed in a Nicolet 5700 FT-IR,
running two analyses per membrane. The spectra were
obtained with 256 scans between 4.000 and 650 cm-1, with a
0,5 cm-1 resolution and a gain of 8. The EDS analyses were
made using an equipment adjacent to the one used for
FESEM, a signal processing unit from Bruker. This
equipment allowed an analysis up to 15 μm in depth.
2.3.3 ZETA POTENTIAL
To obtain the zeta potential of the membranes, an Electro
Kinetic Analyser from Anton Paar was used. The zeta
potential was determined in a pH range of 4 to 9 using a
0,001 M KCl electrolyte and a pressure of 500 mbar. The pH
value was changed manually using HCl and NaOH 0,1 M
solutions. Initially the equipment circulates the fluid through
the cell for 60 seconds at 300 mbar and then a bypass is
done for 30 seconds at 300 mbar. After this process the zeta
potential measurement began and the pressure was raised

3
Table 2-2 – Composition of the casting solutions.
Chemical
% w/w A0 A1 A2 A3 A4 A5 A6
Cellulose Acetate 17,0 16,4 15,8 15,2 14,5 13,1 11,6
Formamide 30,0 29,1 27,9 26,7 25,6 23,1 20,5
Acetone 53,0 51,1 51,1 47,2 45,2 40,9 36,3
TEOS - 3,0 6,1 9,3 12,6 19,5 26,9
H2O - 0,5 1,0 1,6 2,1 3,4 4,7
HNO3 4 drops (pH~2)
From 0 to 500mbar for 120 seconds, two times in each
direction. The potential is given by the Equation 2.1 and is
automatically obtained by the software (𝐸𝑠 – streaming
potential; Δp – pressure variation along the capillary; η –
viscosity of the liquid; κ – conductivity of the liquid; 𝜀𝑅 and 𝜀0
– permittivity of the liquid and the empty space, respectively;
𝜆𝑠 – surface conductivity; r – radius of the capillary) [9].
𝜁 =𝐸𝑠∆𝑝
×𝜂
𝜀𝑅 × 𝜀0× (𝜅 +
2 × 𝜆𝑠𝑟
) (2.1)
2.4 EVALUATION OF THE PERMEATION PERFORMANCE
Since the permeation characteristics of the manufactured
membranes were unknown, the characterization was carried
out in ultrafiltration and nanofiltration installations.
2.4.1 NF AND UF CHARACTERIZATION
The nanofiltration installation is composed by six permeation
cells in series, a pump, a pressure control valve, a flow meter
and two pressure gauges. A Hydra-Cell G-03 diaphragm
pump was used to feed the cells. This pump was used up to
40 bar and has a maximum pressure of 70 bar. For the
pressure and flow control, a valve was used at the exit of the
installation, which was monitored with a manometer and a
flowmeter.
The membranes were also characterized in the ultrafiltration
plant, with a pressure gradient of less than 4 bar. The
ultrafiltration plant consists of an ISGEV AS71B4 pump,
which was placed at a maximum pressure of 6 bar, pressure
and flow control are performed using a throttle valve, placed
at the outlet of the concentrate. The pressure and flow
readings are carried out, respectively, on the pressure gauge
and the rotameter, placed near the outlet of the concentrate.
The cells, in which the membranes are found, are the same
as the cells used in the nanofiltration installation and have a
permeation area of 13.2 cm2. These cells were developed at
IST following the original drawing by Dr. Matsuura and Dr.
Souririjan of the National Council of Research in Ottawa,
Canada.
2.4.2 COMPACTION OF MEMBRANES
In order to reach the steady state in the permeation tests, the
membranes were compacted for 2 hours at a pressure 20%
higher than the maximum used in the experiments (40 bar
and 6 bar, respectively, in the nano and ultrafiltration
installations).
2.4.3 HYDRAULIC PERMEABILITY
The hydraulic permeability (Lp), quotient between the pure
water permeate flow of the membrane (Jpw) and the imposed
pressure difference (ΔP) (Equation 2.2), was measured for
the manufactured membranes in both facilities. In
ultrafiltration conditions, the experiment was performed at 1,
1,5, 2, 2,5, 3, 3,5 and 4 bar at a flow rate of 180 L/h. In
nanofiltration conditions, the experiment was performed at
2,5, 5, 7, 10, 15, 20, 25 and 30 bar at a flow rate of 6 L/min.
𝐿𝑝 =𝐽𝑝𝑤
∆𝑃 (2.2)
2.4.4 REJECTION COEFFICIENTS
The rejection coefficient (R) to the salts was calculated from
the concentration differences presented in the feed (𝐶𝑎) and
in the permeates (𝐶𝑝). The measurement of the salt
concentration in the permeate was performed by conductivity
measurement in a Crinson GLP 32 conductimeter, which has
a reproducibility of ± 0,1% and a reading error of ≤0,5% [10].
𝑅 =𝐶𝑎 − 𝐶𝑝
𝐶𝑎 (2.3)
2.4.5 MOLECULAR WEIGHT CUT-OFF
In the case of the ultrafiltration plant, the molecular cut-off
was also studied in order to observe at what particle size the
membrane can effectively separate the polymers.
3 RESULTS AND DISCUSSION
3.1 MORPHOLOGICAL STUDIES
As seen in the figures below (Figure 3-1 – Figure 3-8),
increasing the amount of silica in the cellulose acetate

4
membranes does not cause a significant difference in
membrane structure, in visual terms. The most visible
difference is the compression of the membranes with silica
compared with the membrane with pure cellulose acetate,
where the structure appears to be less dense. That is, in
pure cellulose acetate membranes there appears to be a
greater free space between the polymer chains, which has
effect in the permeation tests which are further forward.
Another important parameter observed is the good
dispersion of silica on the membrane proved by the shown
structure that does not differ in different places of the
membrane. Finally, when compared for each membrane, the
two surfaces present a different appearance proving that
these membranes are asymmetric (Figure 3-7 and Figure
3-8).
The following figures are presented in a crescent order of
silica, starting by the one with no silica and ending in the
membrane with 40% of silica (Figure 3-1–Figure 3-6). The
first three represent an active layer magnification and the last
three the surface of the membranes. Only for the membrane
with no silica was possible to measure the active layer. So,
five measures of the active layer were taken in five different
spots. The results are presented in Table 3-1.
Figure 3-1 – Cross section of the active layer (A0; ×10.000).
Figure 3-2 – Cross section of the active layer (A4; ×10.000).
Figure 3-3 – Cross section of the active layer (A6; ×10.000).
Figure 3-4 – Surface of the active layer (A0; ×15.000).
Figure 3-5 – Surface of the active layer (A4; ×15.000).
Figure 3-6 – Surface of the active layer (A6; ×15.000).
5
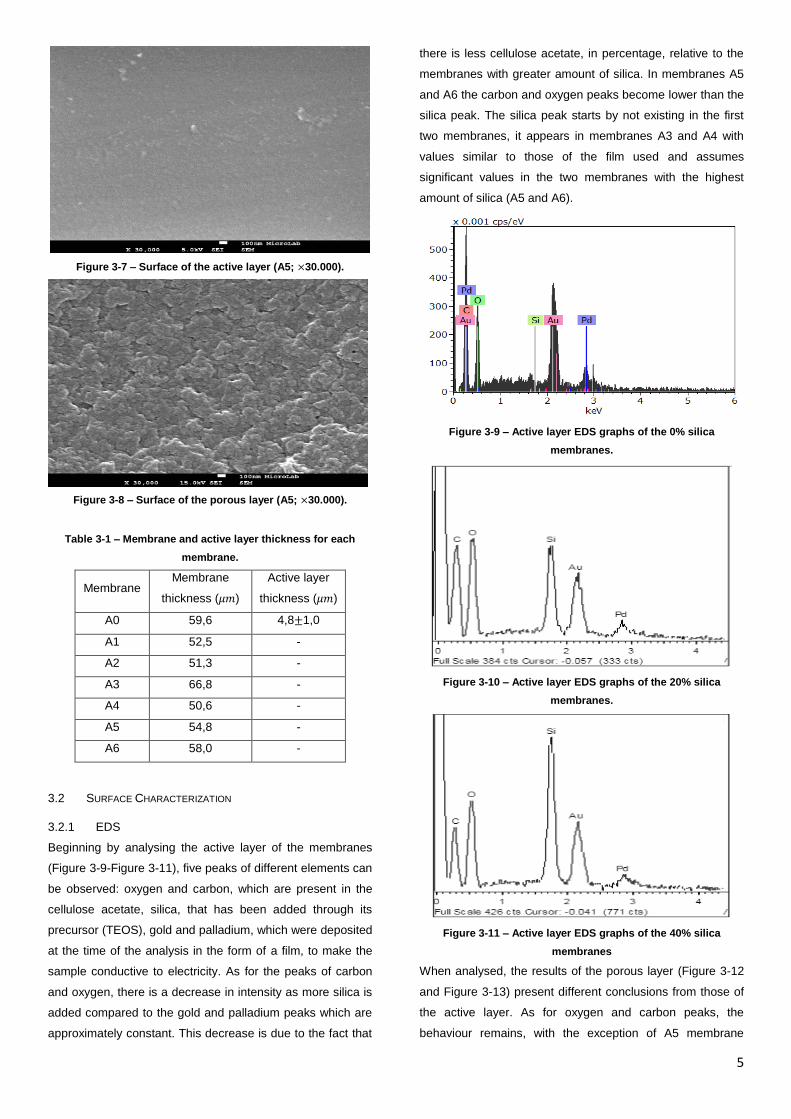
Figure 3-7 – Surface of the active layer (A5; ×30.000).
Figure 3-8 – Surface of the porous layer (A5; ×30.000).
Table 3-1 – Membrane and active layer thickness for each
membrane.
Membrane Membrane
thickness (𝜇𝑚)
Active layer
thickness (𝜇𝑚)
A0 59,6 4,8±1,0
A1 52,5 -
A2 51,3 -
A3 66,8 -
A4 50,6 -
A5 54,8 -
A6 58,0 -
3.2 SURFACE CHARACTERIZATION
3.2.1 EDS
Beginning by analysing the active layer of the membranes
(Figure 3-9-Figure 3-11), five peaks of different elements can
be observed: oxygen and carbon, which are present in the
cellulose acetate, silica, that has been added through its
precursor (TEOS), gold and palladium, which were deposited
at the time of the analysis in the form of a film, to make the
sample conductive to electricity. As for the peaks of carbon
and oxygen, there is a decrease in intensity as more silica is
added compared to the gold and palladium peaks which are
approximately constant. This decrease is due to the fact that
there is less cellulose acetate, in percentage, relative to the
membranes with greater amount of silica. In membranes A5
and A6 the carbon and oxygen peaks become lower than the
silica peak. The silica peak starts by not existing in the first
two membranes, it appears in membranes A3 and A4 with
values similar to those of the film used and assumes
significant values in the two membranes with the highest
amount of silica (A5 and A6).
Figure 3-9 – Active layer EDS graphs of the 0% silica
membranes.
Figure 3-10 – Active layer EDS graphs of the 20% silica
membranes.
Figure 3-11 – Active layer EDS graphs of the 40% silica
membranes
When analysed, the results of the porous layer (Figure 3-12
and Figure 3-13) present different conclusions from those of
the active layer. As for oxygen and carbon peaks, the
behaviour remains, with the exception of A5 membrane

6
which has the highest values. However, the peaks of silica
exhibit a different behaviour than that of the active layer,
since increasing the amount of silica does not correspond to
an increase of the silica peak in the results, except for the
membrane A6 which has the highest peak. This result
indicates that the silica that is placed in the casting solution
migrates mostly to the active layer, which is responsible for
the permeation.
Figure 3-12 – Porous layer EDS graphs of the 20% silica
membranes.
Figure 3-13 – Porous layer EDS graphs of the 40% silica
membranes.
3.2.2 ATR/FTIR
The spectra were read with the membranes wet, removing
only the surface water. By analysing the spectrum in parts
and using the peaks already described in the literature, the
main peaks of the spectrum (Figure 3-14) were identified
according to known connections in the structure of cellulose
acetate. Starting at the highest wavelengths, between the
3000-3800 cm-1 is the -OH band (stretching) composed of all
the connections established between these two elements, in
which water is included. Since the stronger bonds are
observed at smaller wavelengths, it can be concluded from
spectrum analysis that there is a greater number of -OH to
establish hydrogen bonds than to establish another type of
bond, given the higher intensity of the band for shorter
wavelengths.
At 2960 cm-1 and between 2850-2910 cm-1 are the
characteristic stretching bands of the C-H bond, for -CH3 and
-CH2 present in the molecule, respectively. In the case of the
band identified at 2400 cm-1, it identifies the connection of
CO2 and is often missing from the spectrum since it is at any
reading due to the CO2 existing in the air. The carbonyl band
(C=O) is found at 1740 cm-1 and at 1635 cm-1 the band
relative to the bending of the H-O-H bond from water. At
1368 cm-1 lies the bending band of the -CH group. In the
zone of smaller wavelengths, it is found one of the most
important bands in the characterization of the manufactured
membranes. Between 1030-1260 cm-1 there are two bands
presented: the first, at 1225 cm-1, related to the stretching of
the C-O-C bond of cellulose acetate, and the second
between the 1000-1100 cm-1 (Figure 3-15) composed of
several bonds. The behaviour of the previous band was
observed with increasing silica. It was concluded that the
shape and intensity of that band depended on the increase
of silica, so the band was de-convulsed in order to better
understand its behaviour.
Figure 3-14 – Full spectrum of the fabricated membranes.
Figure 3-15 – ATR/FTIR band between 1000 and 1100 cm-1.
3.2.3 DECONVOLUTION OF BAND 1000-1100 CM-1
Using the Origin® program, it was possible to de-convolute
the band between 1000 and 1100 cm-1, consisting of several
peaks as shown in Figure 3-16 and Figure 3-17. In this

7
program the most significant peaks are found through the
second derivative of the points obtained in the spectrum
between 1000-1100 cm-1 and then added these points so
that the sum corresponds to the value of the initial band. In
this case three peaks were identified and marked with three
different colours. The areas of each peak were obtained so
that, with increasing silica, it could be established a
comparison between the values for the area of each of the
identified peaks. The deconvolution shows the difference
between the membrane with no silica and the membrane
with 40% of silica.
Figure 3-16 – Deconvolution of the band between 1000-1100
cm-1 for membrane A0.
Figure 3-17 – Deconvolution of the band between 1000-1100
cm-1 for membrane A6.
By observing the graphs it can be seen that as the silica
content increases, there is a decrease in the dark blue peak
and an increase in the pink peak. It is concluded that the
dark blue peak corresponds to the C-O-C bond of the
cellulose acetate [7] and that the pink peak corresponds to
the Si-O-C and Si-H bonds [11]. In this way it was possible to
confirm the existence of the connection between silica and
the polymeric structure of the cellulose acetate membrane.
3.3 ZETA-POTENTIAL
Observing the Figure 3-18, it can be concluded that as the
pH increases, the zeta potential becomes more negative.
There is a greater dependence of zeta potential on pH in the
range of 4 and 6,5, where the greatest variations occur. Also
in this range, membranes with a silica content higher than
20% (A4, A5, A6) are those with the greatest variation in zeta
potential (between 3 and 5 mV), with a similar slope,
whereas membranes with a lower or no content of silica (A0,
A2, A3) are less dependent on pH variation. In the pH range
between 6,5 and 9,5 there is less dependence of the zeta
potential on pH, where there is a stabilization and the value
does not vary more than 1 mV. It can also be seen that
increasing the silica content in the membrane makes the
zeta potential value even more negative. This value would be
expected for the cellulose acetate membrane (without silica),
since the zeta potential is already negative and silica is
negatively charged (due to oxygen). This behaviour makes
the membrane more reactive with water, which in turn will
increase the bonding by hydrogen bonds near the surface of
the membrane and thus increase the amount of gel formed
by the bonds that are established as more water circulates
through the membrane. This behaviour will reinforce the
conclusion already established by the analysis of the -OH
band, in which the increase of silica in the membrane
increases the amount of gel formed at the surface, which
acts as a barrier to the passage of water, resulting in a
reduction of the hydraulic permeability.
Figure 3-18 – Zeta potential in function of pH.
-10
-9
-8
-7
-6
-5
-4
-3
-2
3,5 4,5 5,5 6,5 7,5 8,5 9,5 10,5
Ze
ta p
ote
nti
al (m
V)
pH
A0
A2
A3
A4
A5
A6

8
3.4 HYDRAULIC PERMEABILITY
3.4.1 NANOFILTRATION
By observing the pure water flows as function of the pressure
difference it is concluded that there is a linear behaviour up
to the pressure of 7 bar. At this point there is a stabilization
of the flow value with the increase of pressure. The values
obtained for the hydraulic permeability show no tendency:
the membranes with the lowest and the highest Lp are the
membrane A3 with 15% silica (Figure 3-19) and A2 with 10%
silica, respectively (Figure 3-20). This inconsistent behaviour
may be due to the fact that the membranes do not have
nanofiltration characteristics and/or the results obtained are
withdrawn at a pressure of less than 10 bar at which the
pump damper cannot stabilize.
Figure 3-19 – Hydraulic permeability of the 15% silica
membrane in nanofiltration.
Figure 3-20 – Hydraulic permeability of the membranes in
nanofiltration.
3.4.2 ULTRAFILTRATION
For ultrafiltration, a decrease in the hydraulic permeability
with the increase of silica is observed, with a similar value for
the membranes A3 and A4. A probable cause for this
behaviour may be that silica is introduced into the membrane
structure, decreasing the free space which, in turn,
decreases the flow of pure water through the membrane.
When compared to the cellulose acetate membrane without
silica prepared by Figueiredo [7], with a Lp of 32,1
kg/(h.m2.bar), it was verified that for the membranes with
smaller amounts of silica (A2, A3, A4) the displayed values
of hydraulic permeability are much higher. As for membranes
with higher silica contents, an opposite behaviour can be
observed, in which the hydraulic permeability of the A5
membrane (with 30% silica) is the one that most resembles
Figueiredo's membrane.
Figure 3-21 – Hydraulic permeability of the 15% silica
membrane in ultrafiltration.
Figure 3-22 – Hydraulic permeability of the membranes in
ultrafiltration.
3.5 REJECTION COEFFICIENTS
3.5.1 NANOFILTRATION
For nanofiltration conditions, the salt rejection coefficients
present values lower than 7% for all the membranes used.
This value is low and indicates that under these conditions
the salt rejection is negligible.
3.5.2 ULTRAFILTRATION
The A2 membrane is the membrane with the lowest salt
rejection value, with a maximum rejection of 34,1% for NaCl
and a minimum rejection of 13,3% for Na2SO4. The
membrane A6 is the membrane with the highest salt
rejection value, between two and three times higher than
those presented by the membrane with less silica (A2). In
this membrane the maximum rejection value is 75,8% and
corresponds to NaCl, while a minimum rejection value of
0
50
100
150
200
250
300
350
400
0 5 10 15 20 25 30
Flu
x [
kg
/(h
. m2)]
ΔP (bar)
A3
30,330,9
26,9
28,7
29,8
26,9
24
25
26
27
28
29
30
31
32
A1 A2 A3 A4 A5 A6
Lp
[kg
/(h
. m2. b
ar)
]
y = 56,554xR² = 0,9829
0
50
100
150
200
250
300
0 1 2 3 4 5
Flu
x [
kg
/(h
. m2)]
ΔP (bar)
A4
80,8
58,8 56,6
33,0
9,9
0
10
20
30
40
50
60
70
80
90
A2 A3 A4 A5 A6
Lp
[kg
/(h
. m2
. ba
r)]

9
45% to Na2SO4. In ultrafiltration there is an increase in the
salts rejection, with the increase of the incorporated silica.
This behaviour can be explained since the increase in silica
implies a decrease in flux, followed by an increase
membrane selectivity [12]. With a difference of 30% in silica
content, from the membrane with the least amount to the
membrane with most silica, the rejection of NaCl, Na2SO4,
MgCl2 and MgSO4 increased 122%, 238%, 193% and 212%,
respectively. By comparing the rejection coefficients to the
salts for the different membranes, the following trend can be
verified: 𝑅𝑁𝑎𝐶𝑙 > 𝑅𝑀𝑔𝐶𝑙2 > 𝑅𝑀𝑔𝑆𝑂4 > 𝑅𝑁𝑎2𝑆𝑂4.
Figure 3-23 – Salt rejection of the membranes for the different
salts.
3.6 MOLECULAR WEIGHT CUF-OFF
It can be concluded that for compounds with molecular
weights less than 1.000 Da the rejection rates are reduced
for any of the membranes. The minimum rejection obtained
for PEG 1.000 was for the membrane A4, with a rejection of
7,7% and the maximum for the membrane A6 with 63,9%
rejection. For the molecular weight of 10.000 Da the rejection
increases considerably, reaching minimum value of 50,2%
for the A2 membrane and maximum value of 94,5% for the
A6 membrane. The highest molecular weights present
results close to 100%, with rejection rates varying between
90-96,1% and 95-99,3% for PEG 70.000 and Dextran
110.000, respectively. As molecular weights increase,
rejection rates also increase, as would be expected
since in ultrafiltration the separation is done also by size
exclusion. On the other hand, it is observable that with
increasing silica content, the rejection rate increases for
almost all the polymers analysed, except for the A4
membrane where, for polymers with molecular weights less
than 10 kDa, the rate of rejection value is lower relative to
the membrane with a lower content of silica (A3, 15% silica)
4 CONCLUSIONS
When compared to the results obtained in ultrafiltration for
the 0% silica membrane, the permeability increased in the
lowest silica added membranes (10%, 15% and 20%)
respectively 152%, 84% and 77%. The membrane with 30%
silica has a membrane permeability similar to the A0
membrane, with a deviation of 3%, while in the membrane
with 40% of silica content the hydraulic permeability
decreased by 69%. In nanofiltration, the values obtained for
permeability were not explanatory of the increase of silica,
with variations without an observable tendency. It can be
explained by the collection of data being carried at the
stabilization pressures of the installation.
The most rejected salt was NaCl followed by MgCl2, MgSO4
and Na2SO4, which indicates that the size of the salt is not
preponderant in its rejection, since the NaCl is the salt that
presents the smaller size, however presenting the highest
rejection coefficient. In nanofiltration conditions, the rejection
to the salts presented results lower than 8%, which indicates
that in this range of work the permeation to the salts is
negligible.
In the molecular cut-off there is a trend identified in the
assays. Once silica content is increased there is a decrease
in the minimum molecular weight rejection to a 95%
confidence level. However, there is an exception: in the
membrane with 15% silica and with a confidence interval of
95%, the minimum molecular weight rejected was higher
than the one rejected by the membrane with 10% silica,
contrary to the trend observed previously.
Through the morphological analysis by FESEM it was
concluded that increasing the silica content in the membrane
causes an increase in the density of the structure, since the
silica bound to the cellulose acetate decreases the free
space around the polymer. As regards to the membrane
surfaces, it is also possible to conclude that the increase in
silica content makes it difficult to distinguish between the
active membrane layer and porous layer when observed in
cross section. On the other hand, when the same
membranes are observed, attending on the surfaces, it is
concluded that the active layer has a different structure of the
porous layer. The active layer has a denser surface while in
the porous layer one can easily distinguish the pores of the
polymer, which proves the asymmetry of the membranes.
By the EDS analysis it was possible to confirm the presence
of silica in the membranes and to study its dispersion at the
same time. It was found that the increase of the silica content
in the active layer corresponded, with the exception of the
membrane A4, to the increase of the silica peak, thus
proving its existence in the membrane structure. On the
0,0
10,0
20,0
30,0
40,0
50,0
60,0
70,0
80,0
90,0
100,0
A2 A3 A4 A5 A6
Reje
cti
on
co
eff
icie
nt
(%)
NaCl Na2SO4 MgCl2.6H2O MgSO4.7H2O

10
other hand, once the two surfaces of the membrane were
analysed, it was possible to conclude that there is a
preference of migration of silica to the active layer, since in
the porous layer an increase in the content of silica did not
correspond to an increase in its peak.
About the ATR/FTIR spectroscopy, the binding between
silica and cellulose acetate was detected through the band
identified at 1080 cm-1, characteristic of the Si-O-C bond,
after the de-convulsion. By analysing the previous band, and
once those analyses were performed on both surfaces, it
was possible to observe the different distribution of silica in
the two layers of the membrane, where there is a preferential
migration to the active layer.
Analysing the result obtained for the zeta potential it can be
concluded that the addition of silica to the membrane matrix
decreases the value of the zeta potential, making it more
negative and increasing the reactivity with water. So, the
increasing silica content increases the affinity with water,
promoting the formation of a gel, characteristic of the
hydrogen bonds established by the oxygen groups of silica
and water.
5 BIBLIOGRAPHY
[1] M. Kremer, Q. J. Econ. 108 (1993) 681–716.
[2] M. Mudler, Basic Principles of Membrane
Technology, 1996.
[3] M.M. Pendergast, E.M. V Hoek, Energy Environ. Sci.
4 (2011) 1946.
[4] C. Brinker, G. Scherer, Adv. Mater. 3 (1990) 912.
[5] P. Tavolaro, G. Martino, S. Andò, A. Tavolaro, Mater.
Sci. Eng. C 68 (2016) 474–481.
[6] M.S.L. Tijink, M. Wester, G. Glorieux, K.G.F.
Gerritsen, J. Sun, P.C. Swart, Z. Borneman, M.
Wessling, R. Vanholder, J.A. Joles, D. Stamatialis,
Biomaterials 34 (2013) 7819–7828.
[7] A.S. Figueiredo, (2016).
[8] B. Kunst, S. Sourirajan, J. Appl. Polym. Sci. 18
(1974) 3423–3434.
[9] A.P. GmbH, (2003).
[10] Crison, Manual Del Usuario, Alella, 2001.
[11] R. Al-Oweini, H. El-Rassy, J. Mol. Struct. 919 (2009)
140–145.
[12] G. Arthanareeswaran, T. Sriyamuna Devi, M.
Raajenthiren, Sep. Purif. Technol. 64 (2008) 38–47.