new findings on key factors influencing the uk’s ... · new findings on key factors influencing...
TRANSCRIPT

1
New Findings on Key Factors Influencing the UK’s Referendum on Leaving the EU
Aihua Zhang1
Department of Mathematics
University of Leicester
1. Abstract
In this research, we apply Multivariate Regression Analysis and a Logit Model to real data to identify
statistically significant factors influencing the EU referendum voting preference simultaneously.
We find that higher education is the predominant factor dividing the nation, with a marginal effect on the
referendum decision being stronger than any other factors particularly in England and Wales, where most
Leave voters reside.
We also find that areas in England and Wales with a lower unemployment rate tend to have a higher
turnout to support Leave while areas in Scotland and Northern Ireland with a higher proportion of
university-educated British adults have a higher turnout to support Remain.
Further we find that areas with high proportions of British male adults show a higher percentage of Leave
votes. Higher proportions of elderly British contribute to higher percentages of Leave votes, but do not
lead to Leave outcomes on their own.
Keywords: EU Referendum; Turnout; Higher Education; Multivariate Regression; Logit Model; Odds
Ratio
JEL: C8; C1; C3; H8; J6; J1
1 Address: University of Leicester, University Road, Leicester, LE1 7RH, UK Email: [email protected]

2
2. Introduction
The UK’s referendum on whether to remain as a member state of the European Union (EU) (Brexit)
caused much debate and speculation at the time of the plebiscite and even more since the results became
evident in favour of Leave. High on this list of conjectures was the motivations of the electorate and the
voting patterns that this would produce.
There had been significant speculation on the characteristics of people who would either vote to Leave or
Remain in the referendum of 23rd June 2016 (see, for example the media articles in the Economist and
Telegraph, [4] and [10]). Characteristically, it was concluded that the more affluent and better-educated
voter would support Remain; whilst the less affluent and those with lower educational opportunities
would support Leave; young people were more likely than the old to vote for Remain; old people were
more likely to turn out to vote than the young, which was taken to favour Leave. Much of the debate, up
to and during the referendum, was informed by simple data analysis examining individual factors, in
isolation, and using opinion polling data (such as YouGov polling data) and sampling from social media
(such as BBC, Facebook). Moreover, there has been an absence of formal academic assessment along this
line, although Stolz, Harrington and Porter [17] have recently conducted research on Brexit but this
principally examines the topological ‘shape’ of it.
The referendum data is now available (thanks to The Electoral Commission’s work) and it is therefore,
possible to use the actual data to conduct a systematic analysis and provide a more definitive assessment
of the key factors that have influenced the British people’s decision to leave the EU. However, the
referendum data does not contain the voters’ personal information, such as sex, education, social grade,
income etc., which is required to provide a complete assessment; consequently, we need to use 2011
census2 data to calculate the corresponding percentages.
Although some studies, in the media, of the voting results have been attempted following the EU
referendum (see [1], [3] and [8]), the conclusions drawn on voting patterns appear, mainly, to be based on
graphically comparisons of the voting data against each single individual demographic factor. These
comparisons for each individual factor in isolation, without rigorous statistical analysis, can lead to
misinterpretation of the data in the situations typified by the EU referendum, where multiple factors
influence a decision simultaneously. In such cases, in order to draw more meaningful conclusions
advanced statistical analysis techniques are required. Consequently, we adopt both Multivariate
Regression and Logit Model techniques, coupled with Tableau Public Tool to visualize our main findings,
determining the dominant factors that have influenced the Brexit outcome.
2 The 2011 census is the extant definitive census of the UK population.

3
The remainder of the article is organised as follows: Section 3 provides the details of data collections, the
research methodologies, as well as the data analysis and outputs using both Multivariate Regressions and
the Logit Model; The key findings within the analysis are concluded in Section 4, where some
commentary on policy implications is also made.
3. Research Design
To capture the joint impact of various potential demographic factors on the UK’s decision to leave the
EU, we use two separate methodologies to determine the significant factors.
First, multivariate regressions using Stata are carried out to identify statistically significant factors that
have influenced voting preference. We then use a Logit Model to confirm such findings as well as the odd
ratios in favour of Leave. Before that we need to collect valid and confirmed data sets from reputable
sources.
3.1 Data Collection
For these assessments data has been obtained from: The Electoral Commission [5]; The Office for
National Statistics (ONS) ([14] and [15]); National Records of Scotland [12] and; Northern Ireland
Statistics & Research Agency [13].
The EU referendum results from the Electoral Commission contain data for Electorate and voting return
results, from which the following independent variable of Turnout is derived. And it is defined as:
Turnout = Ratio of both Remain and Leave votes to Electorate.
The referendum results cover 382 voting areas, including 348 local authority areas in England and Wales,
32 council areas in Scotland and 1 aggregate area in Northern Ireland as well as the British Overseas
Territory of Gibraltar3.
Average annual pay is obtained from the ONS for the independent variable of Income for all 3814 areas in
the UK and is defined as.
Income = Average annual pay (£000)
3 As this research is focus on the UK, the voting area in Gibraltar is not considered, although it is counted for the purposes of overall turnout and Brexit vote as the MEP for SW England also represents Gibraltar in the European Parliament. 4 Among the 381 areas, income data for 7 areas are missing.

4
The 2011 census data derived from Nomis [14] contains 348 local authority areas in England and Wales
and furnishes the following independent variables:5
Male = percentage of British males.
NoQ = percentage of British with no qualifications.
Educ = percentage of British with Level 4 qualification and above (i.e. higher education).
Unem = percentage of unemployed British (excluding full-time students)6.
ABC1 = percentage of estimated Social Grades AB and C1 aged 16 to 64.
Older = percentage of British aged 65 and above.
UKborn = percentage of British born in the UK (as % of whole local population).7
Differ = difference between electorate (in 2016) and total British aged 16+ (2011
census), as a percentage.
The 2011 census data for Scottish council areas and Northern Ireland have been obtained from the
National Record of Scotland and Northern Ireland Statistics & Research Agency separately.
3.2 Multivariate Regression Analysis
As shown in the Figure 3.1, all of the 32 Scottish council areas and Northern Ireland voted for Remain,
and only England and Wales voted for Leave. The population densities are different (or lower, to be more
precise) in Scotland and Northern Ireland than those in England and Wales. So the voting patterns may be
different across these two groups. Bearing this in mind, we have carried out the multivariate regression
analysis for these two groups separately. In the first instance we have analysed the data for England and
Wales before moving to Scotland and Northern Ireland.
5 We use the population data of Britons aged 16 (unless otherwise stated) and above who hold a passport or with no passport held as a proxy, due to the fact that the census data does not divide age groups by age 18, a cut-off age for being eligible for voting. On the other hand, the aged 16+ population in 2011 have grown to aged 20+ by the EU referendum in 2016, thus providing a good approximation to the EU referendum electorate. 6 The unemployed excludes economically inactive people (that are the retired, students, people looking after home or family, long-term sick/disabled). 7 This factor is different from other percentage variables, which use British aged 16+ population as a base. This variable, UKborn, uses the entire population of all age groups and all nationals as a base. This can be justified as the effect of overseas born population on UK voters’ opinion, in individual areas, is independent of age and nationality.

5
Figure 3.1: Leave, as % of Total Votes in each Voting Area
Sources: produced from the referendum voting data
3.2.1 England and Wales
In the multivariate regression model, the dependent variable is chosen as the proportion of Leave votes
across areas and is defined by Leave as
Leave = the ratio of Leave votes to total votes.
We have assumed that the dependant variable, Leave, depends on specific local area characteristics (as
reported by public media such as the Guardian [8]), including place of birth, age, income, sex, social
grades, education, unemployment and turnout. In addition, we also take into account the change in British
adult population over the period of 2011 (when last census was conducted) and 2016 (when the plebiscite
took place); this is captured by the variable Differ. The multivariate regression model then reads:
𝐿𝑒𝑎𝑣𝑒𝑖 = 𝛼 + 𝛽1𝐷𝑖𝑓𝑓𝑒𝑟𝑖 + 𝛽2𝑇𝑢𝑟𝑛𝑜𝑢𝑡𝑖 + 𝛽3𝑀𝑎𝑙𝑒𝑖 + 𝛽4𝑁𝑜𝑄𝑖 + 𝛽5𝐸𝑑𝑢𝑐𝑖 + 𝛽6𝑈𝑛𝑒𝑚𝑖 + 𝛽7𝐸𝑙𝑑𝑒𝑟𝑙𝑦𝑖
+ 𝛽8𝐴𝐵𝐶1𝑖 + 𝛽9𝑈𝐾𝑏𝑜𝑟𝑛𝑖 + 𝛽10𝐼𝑛𝑐𝑜𝑚𝑒𝑖 + 𝜀𝑖
(1)
Where the subscript i stands for each voting area; 𝜀 is the error term; the coefficient 𝛼 is the intercept (or
constant); while each 𝛽𝑖 measures the sensitivity of the dependent variable Leave to the corresponding

6
independent variable. The coefficients 𝛼 and 𝛽𝑖s are to be estimated from the actual data we collect (see
3.1 Data Collection).
To estimate the coefficients, we run various regressions using ordinary least squares (OLS) in Stata. As
some of the 2011 census data is provided separately for England and Wales, Scotland and Northern
Ireland we first run the regressions for England and Wales to identify the key significant factors (or
independent variables). We then focus on the identified significant factors and run the reduced regressions
for Scotland and Northern Ireland. It is also reasonable to consider England and Wales separately from
Scotland and Northern Ireland when examining the voting patterns, as the population densities in
Scotland and Northern Ireland are significantly lower than those in England and Wales. Indeed, the
estimated coefficients do differ across the two groups as presented below (compare (2) and (4)).
Table 3.1: Regression Result for England and Wales
Note: the stars in parentheses indicate statistical significance at 0.1 level (*), 0.05 level (**) and 0.01
(***) level, respectively.
Table 3.2: Correlation Matrix for the Independent Variables in (1)
Independent
Variables
Estimated
coefficient βt-statistics
p-value for testing
β=0R-squared
p-value for testing
R-squared = 0
Differ 0.21 3.96 0.00 (***)
Turnout 0.71 8.7 0.00 (***)
Male 1.36 4.8 0.00 (***)
NoQ 0.35 2.95 0.00 (***)
Educ -1.32 -19.51 0.00 (***)
Unem 0.39 1.07 0.28
Elderly 0.29 3.19 0.00(***)
ABC1 0.16 1.96 0.051 (*)
UKborn -0.01 -0.34 0.74
Income 0.001 1.11 0.27
intercept α -0.53 -3.00 0.00 (***)
0.87 0.00 (***)
Correlation Differ Turnout Male NoQ Educ Unem Elderly ABC1 Ukborn Income
Differ 1.00
Turnout 0.15 1.00
Male 0.17 -0.20 1.00
NoQ -0.55 -0.50 -0.24 1.00
Educ 0.59 0.31 0.30 -0.87 1.00
Unem -0.12 -0.85 0.12 0.53 -0.33 1.00
Elderly -0.30 0.52 -0.38 0.07 -0.13 -0.59 1.00
ABC1 0.62 0.30 0.29 -0.87 0.87 -0.28 -0.37 1.00
UKborn -0.28 0.18 -0.21 0.23 -0.29 -0.17 0.36 -0.35 1.00
Income 0.51 -0.09 0.52 -0.46 0.57 0.08 -0.43 0.61 -0.27 1.00

7
Figure 3.2: Turnout vs Unemployment in England and Wales
Sources: produced from the referendum voting data and 2011 census data
As can be seen in Table 3.1, factors Unem, UKborn and Income appear to be insignificant. However, the
correlation matrix in Table 3.2 shows high correlations (greater than 0.75) between Unem with Turnout,
ABC1 with both NoQ and Educ, and Educ with NoQ. A negative high correlation of -0.85 between
Turnout and Unem implies that areas with a lower unemployment rate tend to have a higher turnout (see
Figure 3.2). This phenomenon supports Radcliff’s argument that a poor economy discourages voters’
participation by those most adversely affected (see [15]). The high correlations of ABC1 and Educ are
obvious because the social grades are estimated from information collected in the 2011 Census and based
primarily on their occupation which also includes information about their qualifications gained etc. Thus
a higher percentage of higher education qualification is associated to a higher percentage of social grades
ABC1 (a correlation of 0.87) and a lower percentage of no qualifications (a correlation of -0.87). Areas
with a higher proportion of university educated people have a lower proportion of people with no
qualifications, thus a negative correlation of -0.87 between Educ and NoQ. All these show problems of
multicollinearity in the regression model (1). To remedy such problems, we remove those highly
The size of
the shapes
indicates
the relative
size of the
electorate.

8
correlated independent variables (Unem, NoQ and ABC1) as well as the insignificant variables (UKborn
and Income)8 and rerun the regression, the results are presented in Table 3.3.
Table 3.3: Regression Result with a constant for England and Wales
Table 3.4: Regression Result without a constant for England and Wales
As can be seen in Table 3.3, the intercept α now becomes insignificant while the overall explanatory
power (𝑅2 = 0.86) of the model remains almost the same as that in Table 3.1, indicating that the
independent variables (Differ, Turnout, Male, Educ, and Elderly) jointly account for 86% of the
variability in the referendum vote across areas in England and Wales. For comparison, let us further drop
the insignificant constant α and then rerun the regression. The result is presented in Table 3.4, from which
we see that all the independent variables remain statistically significant and that all the estimated
coefficients are similar to those in Table 3.3, expect the coefficient for Male. However, the 𝑅2 becomes
nearly 100%, which could be considered artificial due to the regression without a constant.9 Keeping this
in mind, we therefore use the regression model with a constant to study the marginal effects of the
significant variables (factors) on the referendum vote by examining each of the estimated coefficients βis
in Table 3.3. The fitted equation of the regression with a constant is given by
8 Several regressions have been run in background to check the insignificant variables after removing the multicollinearity problem. 9 An interesting discussion about why 𝑅2are so large for models without a constant is discussed here http://www.ats.ucla.edu/stat/mult_pkg/faq/general/noconstant.htm.
Independent
Variables
Estimated
coefficient βt-statistics
p-value for testing
β=0R-squared
p-value for testing
R-squared = 0
Differ 0.22 4.31 0.00 (***)
Turnout 0.59 10.84 0.00 (***)
Male 1.18 4.91 0.00 (***)
Educ -1.35 -38.46 0.00 (***)
Elderly 0.16 2.55 0.011 (**)
intercept α -0.14 -1.11 0.27
0.86 0.00 (***)
Independent
Variables
Estimated
coefficient βt-statistics
p-value for testing
β=0R-squared
p-value for testing
R-squared = 0
Differ 0.22 4.26 0.00 (***)
Turnout 0.57 11.21 0.00 (***)
Male 0.92 15.11 0.00 (***)
Educ -1.34 -40.27 0.00 (***)
Elderly 0.15 2.46 0.014 (**)
0.996 0.00 (***)

9
𝐿𝑒𝑎𝑣�̂�𝑖10 = −0.14 + 0.22 × 𝐷𝑖𝑓𝑓𝑒𝑟𝑖 + 0.59 × 𝑇𝑢𝑟𝑛𝑜𝑢𝑡𝑖 + 1.18 × 𝑀𝑎𝑙𝑒𝑖 − 1.35 × 𝐸𝑑𝑢𝑐𝑖
+0.16 × 𝐸𝑙𝑑𝑒𝑟𝑙𝑦𝑖
(2)
First, we can see that all factors, except Educ, have a positive sign, implying that there is a positive
relationship between each of them and the dependent variable Leave. For example, a higher percentage of
turnout drives the proportion of Leave votes higher across areas. And the marginal effects are given by
the estimated numbers in absolute value. Thus a coefficient of 0.59 indicates that one extra percentage of
turnout can push the percentage of Leave votes in an area higher by 0.59%, keeping all other factors
unchanged. Similarly, keeping other things equal, an extra percentage of male population in an area can
push the percentage of its Leave votes higher by 1.18%; an extra percentage of elderly population (aged
65+) in an area can push the Leave votes higher by 0.16%; a 1% increase of British adults, who now
reside in an area, can push the area’s Leave result higher by 0.22%, this increase being explained by
either inward migration (over the last 5 years) and/or those British teenagers (aged 13-18 in 2011) who
have grown eligible for the referendum vote, by the passage of time since last census11. The university
educated people tend to vote for Remain and an extra percentage of university educated people in an area
will push the Remain votes higher by 1.35% (due to the negative coefficient of -1.35), keeping other
things equal. This negative relationship between Educ and Leave is clearly shown in Figure 3.3. The
Boxplot in Figure 3.4 further shows that most of the Remain areas have a higher proportion of British
population with higher education than the national average of 26% (see also Figure 3.5) while about half
of the Leave areas below the national average. And about half of the Remain areas have a higher
percentage of British population with higher education than the highest percentage of 36% of the Leave
areas.
It is also interesting to note that, by simple calculations using (2), a decrease of about 7%12 in turnout in
England and Wales could reduce the Leave votes by circa 4%. This could result in a Remain victory in
the UK.13 Similarly, an about 3% increase in the proportion of British adults accessing to higher
education in England and Wales could also reverse the referendum result. Predominantly, the higher
10 The hat (^) sign indicates the estimated value of Leave. 11 Recall that Differ is defined as the percentage difference in the number of British who are eligible for the Referendum vote in 2016 and the number of British aged 16+ recorded in 2011 census. 12 A 7% decrease in turnout in England and Wales could bring the overall turnout in the UK back to the 2015 general election turnout of about 66%. 13 A decrease in the Leave votes by 4% in England and Wales reduces the total Leave votes in England and Wales by 641,686 of the total Leave votes of 16,042,155 in these two Brexit regions. This reduction of Leave votes counts for 2% of the total Leave votes in the UK. Adding this 2% to the Remain votes will result in Remain winning by about 0.1% (because the referendum result is 51.9% / 48.1% for Leave/Remain).

10
education factor alone explains about 77% of the total variation in the referendum vote across areas in
England and Wales.14
Figure 3.3: Higher Education vs Leave in England and Wales, UK mean 26%
Sources: produced from the referendum voting data and 2011 census data
14 The simple regression is run in the background but not presented here for the sake of being concise.
The size of
the shape
indicates
the relative
size of the
electorate.

11
Figure 3.4: Boxplot of Higher Education in England and Wales, UK mean 26%
Sources: produced from the referendum voting data and 2011 census data
Figure 3.5: Higher Education in England and Wales, as %, UK mean 26%
Sources: produced from the referendum voting data and 2011 census data

12
3.2.2 Scotland and Northern Ireland
For the analysis of Scotland and Northern Ireland, we add a subscript ‘_S’ to each variable to denote the
corresponding variable for Scotland and Northern Ireland. Following the arguments for England and
Wales above, we restrict ourselves on the significant independent variables only, namely, DifferS,
TurnoutS, MaleS, EdlderlyS and EducS, and then estimate the coefficients βis using OLS as before.
𝐿𝑒𝑎𝑣𝑒𝑆𝑖= 𝛼𝑖 + 𝛽1 × 𝐷𝑖𝑓𝑓𝑒𝑟𝑆𝑖
+ 𝛽2 × 𝑇𝑢𝑟𝑛𝑜𝑢𝑡𝑆𝑖+ 𝛽3 × 𝑀𝑎𝑙𝑒𝑆𝑖
+ 𝛽4 × 𝐸𝑑𝑢𝑐𝑆𝑖
+𝛽5 × 𝐸𝑙𝑑𝑒𝑟𝑙𝑦𝑆𝑖+ 𝜀𝑖
(3)
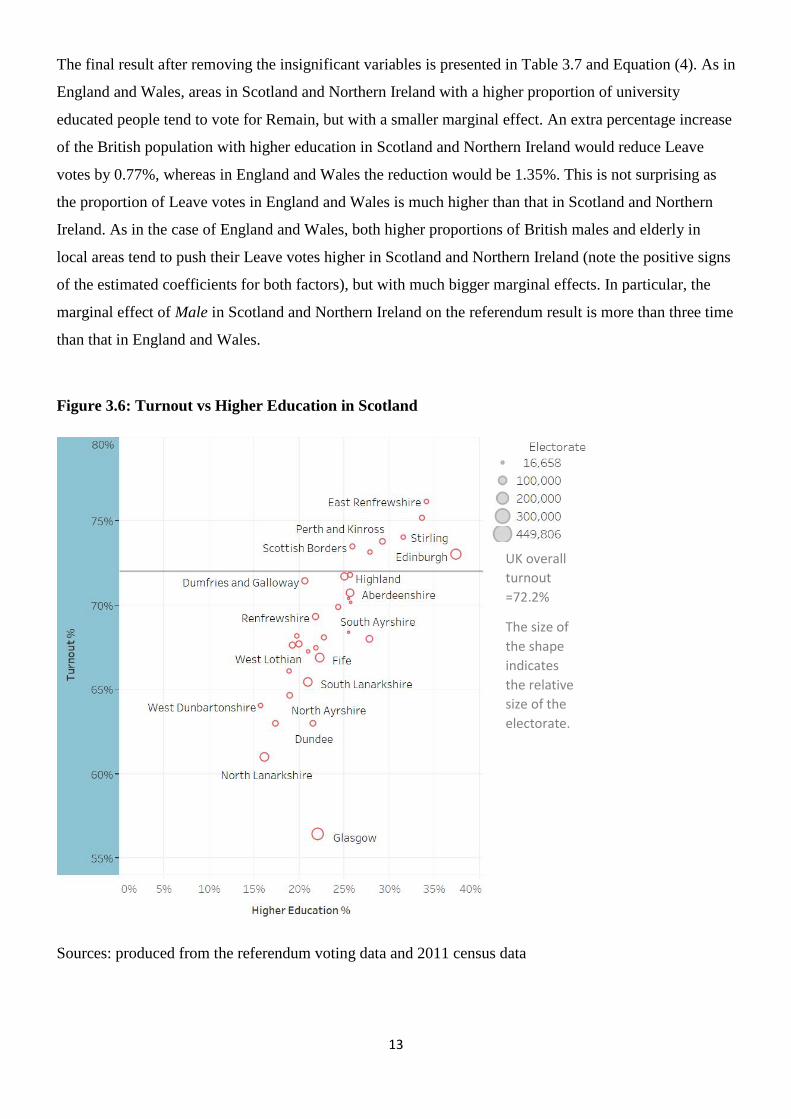
The estimation result of (3) is summarized in Table 3.5. Variables DifferS and TurnoutS are insignificant
while the overall explanatory power measured by 𝑅2 is 76%. From the correlation matrix Table 3.6, we
see that TurnoutS is highly correlated with EducS with a correlation coefficient of 0.74, indicating that
areas in Scotland and Northern Ireland with a higher proportion of university educated people tend to
have a higher turnout to support Remain (see Figure 3.6).15
Table 3.5: Regression Result for Scotland and Northern Ireland
Table 3.6: Correlation Matrix for the Independent Variables in Table 3.5
15 Note that Northern Ireland is not shown on Figure 3.6 due to the aggregated electorate size of it.
Independent
Variables
Estimated
coefficient βt-statistics
p-value for testing
β=0R-squared
p-value for testing
R-squared = 0
Differ_S -0.21 -1.46 0.16
Turnout_S 0.07 0.31 0.76
Male_S 3.89 5.8 0.00 (***)
Educ_S -0.73 -4.17 0.00 (***)
Elderly_S 0.55 2.2 0.04 (**)
intercept α -1.47 -4.53 0.00 (***)
0.76 0.00 (***)
Correlation Differ_S Turnout_S Male_S Educ_S Elderly_S
Differ_S 1.00
Turnout_S 0.16 1.00
Male_S -0.07 0.16 1.00
Educ_S 0.41 0.74 0.13 1.00
Elderly_S -0.05 0.58 0.07 0.28 1.00
13
The final result after removing the insignificant variables is presented in Table 3.7 and Equation (4). As in
England and Wales, areas in Scotland and Northern Ireland with a higher proportion of university
educated people tend to vote for Remain, but with a smaller marginal effect. An extra percentage increase
of the British population with higher education in Scotland and Northern Ireland would reduce Leave
votes by 0.77%, whereas in England and Wales the reduction would be 1.35%. This is not surprising as
the proportion of Leave votes in England and Wales is much higher than that in Scotland and Northern
Ireland. As in the case of England and Wales, both higher proportions of British males and elderly in
local areas tend to push their Leave votes higher in Scotland and Northern Ireland (note the positive signs
of the estimated coefficients for both factors), but with much bigger marginal effects. In particular, the
marginal effect of Male in Scotland and Northern Ireland on the referendum result is more than three time
than that in England and Wales.
Figure 3.6: Turnout vs Higher Education in Scotland
Sources: produced from the referendum voting data and 2011 census data
UK overall
turnout
=72.2%
The size of
the shape
indicates
the relative
size of the
electorate.

14
Table 3.7: Regression Result for Scotland and Northern Ireland
𝐿𝑒𝑎𝑣𝑒𝑆̂
𝑖= −1.5 + 4.04 × 𝑀𝑎𝑙𝑒𝑆𝑖
− 0.77 × 𝐸𝑑𝑢𝑐𝑆𝑖+ 0.65 × 𝐸𝑙𝑑𝑒𝑟𝑙𝑦𝑆𝑖
(4)
3.3 The Logit Model
In the case where individuals are making a choice between Leave and Remain, we can formalise the
situation by specifying a utility function (e.g. a log utility function)16 to say that the individuals will make
the choice generating a higher utility (or higher satisfaction).
Let Di denote the difference in overall utility (or net utility) that individuals in area i obtained between
voting Leave and Remain. The area i votes for Leave (overall) if the utility difference is positive (that is
Di > 0), and vote for Remain otherwise.17 Note that the utility across the two choices is unobservable.
However, we can observe the choices that individuals in each voting area have actually made, thanks to
the electoral data collected by the Electoral Commission. Now we can define a binary variable Y and
relating it to D by the following equations for each area:
Yi = 1 if Di > 0
Yi = 0 if Di ≤ 0,
Where, i denotes area i.
Thus Yi = 1 if the number of Leave votes is greater than the number of remain votes in area i (and 0
otherwise). Let pi denote the probability that area i votes for Leave, then the probability it votes for
Remain is 1 - pi. We know that area i will vote for Leave if the utility difference is positive. So we have
the following equation18
𝑝𝑖 = 𝑃(𝑌𝑖 = 1) = 𝑃(𝐷𝑖 > 0).
16 In economics, a utility function is a real number – valued function, which measures preferences over some set of goods (including services: something that satisfies human wants); it represents satisfaction experienced by the consumer of a good. 17 An area votes for Leave if the proportion of Leave votes in that area is greater than 50%, otherwise it votes for Remain. 18 In the logit model, we only focus on the significant variables identified in the multivariate regression analysis.
Independent
Variables
Estimated
coefficient βt-statistics
p-value for testing
β=0R-squared
p-value for testing
R-squared = 0
Male_S 4.04 6.05 0.00 (***)
Educ_S -0.77 -7.08 0.00 (***)
Elderly_S 0.65 3.16 0.00 (***)
Constant -1.5 -4.7 0.00 (***)
0.74 0.00 (***)

15
Taking expectation of Yi, we get the average value of Yi as
𝐸(𝑌𝑖) = 𝑝𝑖.
The logit model reads as19
ln (𝑝𝑖
1 − 𝑝𝑖) = 𝛼𝑖 + 𝛽1 × 𝐷𝑖𝑓𝑓𝑒𝑟𝑖 + 𝛽2 × 𝑇𝑢𝑟𝑛𝑜𝑢𝑡𝑖 + 𝛽3 × 𝑀𝑎𝑙𝑒𝑖 + 𝛽4 × 𝐸𝑑𝑢𝑐𝑖 + 𝛽5 × 𝐸𝑙𝑑𝑒𝑟𝑙𝑦𝑖 + 𝜀𝑖
(5)
The dependent variable of (5) is the natural log of the odds ratio in favour of Leave.
For the logit model, we first apply it to the whole UK (that is, England, Wales, Scotland and Northern
Ireland) data. We then compare the results with those of England and Wales.
The results from the logit model for the UK produced in Stata are summarized in Table 3.8 and Table 3.9,
and the results for England and Wales are summarized in Table 3.10 for comparison.
Table 3.8: Results from the Logit Model for the whole UK
From Table 3.8, we can see that the variable Elderly becomes insignificant while the other variables
remain significant and with the same signs as identified in the multivariate regression analysis. Note also
that this factor Elderly was consistently less significant than the other significant variables in the
multivariate regression analysis above (see Table 3.3, Table 3.4, Table 3.5 and Table 3.7). So, combining
the results from both the multivariate regression analysis and the logit model, we can conclude that a
higher proportion of elderly British can contribute to a relatively higher percentage of Leave votes (a
result from the multivariate regressions), however, these extra Leave votes do not lead to a Leave
outcome in individual areas on their own (a result from the logit model). We then remove the
insignificant variable from (5). This results Table 3.9, in which all remaining factors are highly
significant.
19 A probit model can also be applied here, but as argued by Koop (2013) and Gujarati (2011)), probit and logit models tend to yield very similar results.
Independent
Variables
Logit
coefficient β
p-value for testing
β=0
Marginal effect on
probabiblity of
Leave
Pseudo
R-squared
E(Y) = P(Leave)
(predict)
Differ 13.69 0.00 (***) 2.02
Turnout 53.92 0.00 (***) 7.94
Male 130.59 0.00 (***) 19.23
Educ -71.26 0.00 (***) -10.49
Elderly 3.44 0.61 0.51
constant -83.48 0.00 (***)
0.58 0.82
16
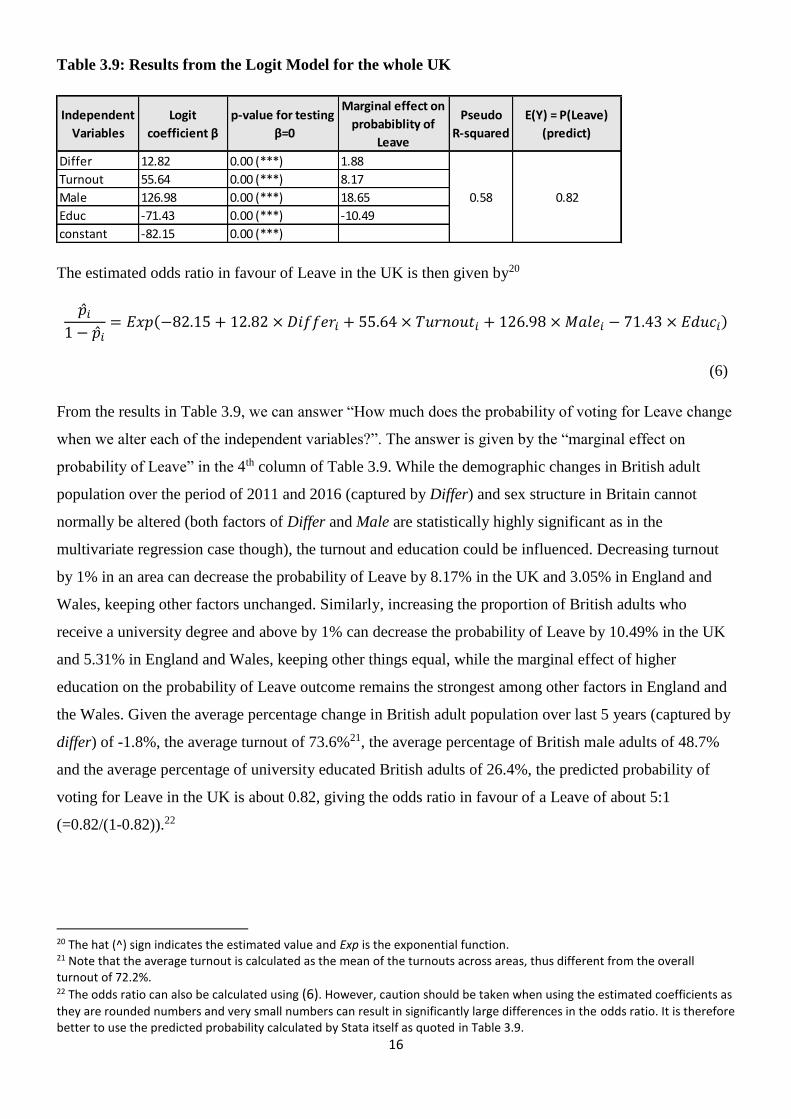
Table 3.9: Results from the Logit Model for the whole UK
The estimated odds ratio in favour of Leave in the UK is then given by20
�̂�𝑖
1 − �̂�𝑖= 𝐸𝑥𝑝(−82.15 + 12.82 × 𝐷𝑖𝑓𝑓𝑒𝑟𝑖 + 55.64 × 𝑇𝑢𝑟𝑛𝑜𝑢𝑡𝑖 + 126.98 × 𝑀𝑎𝑙𝑒𝑖 − 71.43 × 𝐸𝑑𝑢𝑐𝑖)
(6)
From the results in Table 3.9, we can answer “How much does the probability of voting for Leave change
when we alter each of the independent variables?”. The answer is given by the “marginal effect on
probability of Leave” in the 4th column of Table 3.9. While the demographic changes in British adult
population over the period of 2011 and 2016 (captured by Differ) and sex structure in Britain cannot
normally be altered (both factors of Differ and Male are statistically highly significant as in the
multivariate regression case though), the turnout and education could be influenced. Decreasing turnout
by 1% in an area can decrease the probability of Leave by 8.17% in the UK and 3.05% in England and
Wales, keeping other factors unchanged. Similarly, increasing the proportion of British adults who
receive a university degree and above by 1% can decrease the probability of Leave by 10.49% in the UK
and 5.31% in England and Wales, keeping other things equal, while the marginal effect of higher
education on the probability of Leave outcome remains the strongest among other factors in England and
the Wales. Given the average percentage change in British adult population over last 5 years (captured by
differ) of -1.8%, the average turnout of 73.6%21, the average percentage of British male adults of 48.7%
and the average percentage of university educated British adults of 26.4%, the predicted probability of
voting for Leave in the UK is about 0.82, giving the odds ratio in favour of a Leave of about 5:1
(=0.82/(1-0.82)).22
20 The hat (^) sign indicates the estimated value and Exp is the exponential function. 21 Note that the average turnout is calculated as the mean of the turnouts across areas, thus different from the overall turnout of 72.2%. 22 The odds ratio can also be calculated using (6). However, caution should be taken when using the estimated coefficients as
they are rounded numbers and very small numbers can result in significantly large differences in the odds ratio. It is therefore better to use the predicted probability calculated by Stata itself as quoted in Table 3.9.
Independent
Variables
Logit
coefficient β
p-value for testing
β=0
Marginal effect on
probabiblity of
Leave
Pseudo
R-squared
E(Y) = P(Leave)
(predict)
Differ 12.82 0.00 (***) 1.88
Turnout 55.64 0.00 (***) 8.17
Male 126.98 0.00 (***) 18.65
Educ -71.43 0.00 (***) -10.49
constant -82.15 0.00 (***)
0.58 0.82

17
Table 3.10: Results from the Logit Model for England and Wales
The estimated odds ratio in favour of Leave in England and Wales is then given by
�̂�𝑖
1 − �̂�𝑖= 𝐸𝑥𝑝(−45.71 + 20.88 × 𝐷𝑖𝑓𝑓𝑒𝑟𝑖 + 52.04 × 𝑇𝑢𝑟𝑛𝑜𝑢𝑡𝑖 + 70.32 × 𝑀𝑎𝑙𝑒𝑖 − 90.49 × 𝐸𝑑𝑢𝑐𝑖)
(7)
In England and Wales, where most Leave voters reside, the predicted probability of voting for Leave is
about 0.94 (see Table 3.10), giving the odds ratio in favour of Leave of about 16:1 (=0.94/(1-0.94)), about
3 times as the odds ratio for the entire UK. The average values for Differ, Turnout, Male and Educ across
areas in England and Wales are -1.7%, 74.2%, 48.7% and 26.6%, respectively.
4. Conclusions and Policy Implications
4.1 Conclusions
On June 23rd 2016, Britain’s vote to Leave the EU came as a surprise to most observers, with a bigger
voter turnout (72.2%) than that of any UK general election in the past decade23. On morning of the
referendum, The Economist's DATA TEAM [2] claimed that a high overall turnout would likely benefit
Remain, as younger and richer elderly voters are more supportive of being a member of the EU and this
population is normally the highest proportion of the electorate who vote. The statistical analysis of the
actual data, conducted in this paper and including the actual EU referendum results [5] provided by the
Electoral Commission and 2011 census data [12], [13], [14] and [15], reveals rather different conclusions.
The effect of voter turnout is one of the significant factors influencing the referendum result. The high
overall turnout actually benefited Leave with a big proportion of the turnout being from enthusiastic leave
supporters, with a corresponding under turnout of remain supporters. This could indicate that the Leave
23 The turnouts of UK general elections were 66.4% in 2015, 65.1% in 2010 and 61.4% in 2005, respectively (see [6]).
Independent
Variables
Logit
coefficient β
p-value for testing
β=0
Marginal effect on
probabiblity of
Leave
Pseudo
R-squared
E(Y) = P(Leave)
(predict)
Differ 20.88 0.00 (***) 1.22
Turnout 52.04 0.00 (***) 3.05
Male 70.32 0.05 (**) 4.12
Educ -90.49 0.00 (***) -5.31
constant -45.71 0.00 (***)
0.68 0.94

18
campaign was more effective in mobilising their support base, but may also explain that regardless of the
effectiveness of the campaigns the Leave voters felt more strongly about the factors affecting Leave than
did the Remain supporters.
We also find that areas in England and Wales with a lower unemployment rate tend to have a higher
turnout to support Leave while areas in Scotland and Northern Ireland with a higher proportion of
university educated people have a higher turnout to support Remain. As previously discussed, a decrease
of about 7% in turnout in England and Wales could reduce the Leave votes by circa 4%, which could
have resulted in a Remain victory in the UK.
Moreover, higher education is found to be the predominant factor dividing the nation, in particular in
England and Wales, between Remain and Leave. This analysis demonstrates highly significant evidence
that university educated British people tend to vote consistently across the UK for Remain. It can be
speculated that, as much of the Leave campaign, was characterised by emphasising detrimental factors
(such as immigration or the recession of the economy, see [4]) the university educated voters seem to be
more immune than those who do not have university education, to this kind of campaign. The marginal
effect of higher education on the referendum decision is much stronger than any other factors in England
and Wales, where most Leave voters reside. As demonstrated in Section 3.2.1, if a 3% increase in the
proportion of British adults accessing to higher education in England and Wales were to be realised, this
could have reversed the referendum result.
We also find highly significant evidence that demographic changes of British adult males in individual
areas, have an effect on the referendum outcome with areas with a higher proportion of British male
adults being associated to a higher percentage of Leave votes.
The impacts of the proportion of UK born British and income are found to be statistically insignificant.
The factor of elderly voters, although having an effect on the outcome, was generally over claimed as a
dominant factor. Combining the findings from both the multivariate regression analysis and the logit
model, we conclude that a higher proportion of elderly British can contribute to a relatively higher
percentage of Leave votes (a result from the multivariate regressions), however, these extra Leave votes
do not lead to a Leave outcome in individual areas on their own (a result from the logit model).
The logit model also allows us to predict the odds ratio in favour of Leave. We find that the odds ratio in
favour of Leave in England and Wales is about 3 times as the odds ratio for the entire UK.
4.2 Policy Implications
The above findings may have the following policy implications:

19
A lack of further or higher education affects a populations’ attitude to changes, which from the literature
could be assigned to, paradoxically, feelings of and inability to affect political changes, caused by a
perceived reduced access to a highly educated ‘political elite’.
This leads to a conclusion that a greater access to higher and further education would produce different
political outcomes.
The research also indicates that the Leave campaign was effective in motivating its supporters to turnout
to vote. Some of the voters who supported Leave might have been less engaged in the general elections
than in the EU referendum; this was potentially combined with the perceived ‘forgone’ conclusion that
Remain had of victory; with a consequential lower perceived need for the Remain voters to turnout. So,
hubris can have a significant effect on referendum outcomes. The real, or perceived, impact of migration
into post-industrial communities in the UK, may also have had an effect on the referendum result.
5. Acknowledgements
The author would like to thank the following people (in no particular order) who have helped her with
obtaining various data sets required for the analysis: CAZ (Nomis Census Customer Services), Matt
Singh (Number Cruncher Politics), Ben Davoll (Special EU Programmes Body), DoF Census NISRA,
Pawel Kosinski (Customer Services of National Records of Scotland). Great thanks go to Matthew Blake
for various useful suggestions and inputs as well as proof reading the draft. I would also like to thank my
colleagues (Clive Rix, Jeremy Levesley, Leena Sodha, Frank Neumann and Alexander Gorban etc.) for
their gracious support.

20
6. References
[1] BBC News (2016) EU referendum: the result in maps and charts, June 24th 2016. Available at
http://www.bbc.co.uk/news/uk-politics-36616028 accessed on 22 Nov 2016.
[2] The DATA TEAM (2016), The Economist’s “Brexit” poll-tracker, The Economist, June 23rd
2016. Available at http://www.economist.com/blogs/graphicdetail/2016/06/britain-s-eu-
referendum accessed on 21 Nov 2016.
[3] THE DATA TEAM (2016), Britain votes to leave the EU, The Economist, June 24th 2016.
http://www.economist.com/blogs/graphicdetail/2016/06/daily-chart-17 accessed on 21 Nov 2016.
[4] The Economist (2016), The referendum campaign: The Battle of Evermore, The Economist, 18
June 2016.
[5] The Electoral Commission (2016), EU referendum results. Available at
http://www.electoralcommission.org.uk/ accessed on 18 Nov 2016.
[6] The Electoral Commission, Electoral data. Available at
http://www.electoralcommission.org.uk/our-work/our-research/electoral-data accessed on 22 Nov
2016
[7] Gujarati, D. (2011), Econometrics by Example, Palgrave Macmillan.
[8] The Guardian (2016), EU referendum: full results and analysis. Available at
https://www.theguardian.com/politics/ng-interactive/2016/jun/23/eu-referendum-live-results-and-
analysis accessed on 22 Nov 2016.
[9] Kellner, P. (2016), EU referendum: Provincial England versus London and the Celts YouGov,
available at https://yougov.co.uk/news/2016/03/24/eu-referendum-provincial-england-versus-
london-and/
[10] Kirk, A. (2016), EU referendum: Which type of person wants to leave, and who will be voting to
remain? 22 June 2016, The Telegraph. Available at
http://www.telegraph.co.uk/news/2016/06/22/eu-referendum-which-type-of-person-wants-to-
leave-and-who-will-b/ accessed on 21 Nov 2016.
[11] Koop, G. (2013), Analysis of Economic Data, 4th Edition, Willey.
[12] National Record of Scotland (2016), Scotland’s census 2011. Available at
http://www.scotlandscensus.gov.uk/ods-web/standard-outputs.html accessed on 18 Nov 2016.
[13] Northern Ireland Statistics & Research Agency, NISRA 2011 Census. Available at
http://www.nisra.gov.uk/census/2011Census.html access on 18 Nov 2018.
[14] Office for National Statistics, 2011 Census Data on Nomis www.nomisweb.co.uk accessed 18
Nov 2016.
[15] Office for National Statistics. Available at https://www.ons.gov.uk/ accessed on 17 Nov 2016.

21
[16] Radcliff, B. (1992), The Welfare State, Turnout, and the Economy: A Comparative Analysis.
American Political Science Review 86:444-54.
[17] Stolz, B., Harrington, H.A. and Porter, M.A. (2016), The Topological Shape of Brexit, 30 October
2016, Cornell University Library. Available at https://arxiv.org/abs/1610.00752