new frontiers in payments epayables and global card programs · 2014. 4. 8. · leveraging...
TRANSCRIPT

New frontiers in payments ePayables and Global Card programs Presented by:
Cynthia D. Watts Director, Senior Product Solution Specialist Manager April 24, 2014
SoCal EXPO 2014

2 2
agenda Taking steps towards AP automation globally
What’s trending now?
Going global
Key decisions
Make your move

Taking steps towards AP automation globally

4 4
Objectives
Effectively manage your payables
Improved AP efficiency
Increased days payable outstanding
Enhanced cash flow
Controlled financing and processing costs
Strengthened supplier relationships
SIMPLE STREAMLINED
EFFECTIVE

5 5
Components of automated payables
How is Requisition initiated and managed within ERP system?
How are approvers approving the requisition?
How is PO created?
How is invoice processed?
How is reconciliation completed?
How is PO sent to Supplier?
How is remittance info sent to Supplier?
How is invoice received from supplier?
How are payments made to suppliers?
When are payments made to suppliers?
How is data captured and stored?
How are supporting documents captured and stored?
What reports are produced?
How are reports produced?
Internal processing External processing Payment execution Data warehousing

What’s trending now?

7 7
Card continues to grow globally
Key areas of significant volume growth
Percentage of commercial card purchases initiated outside of the
U.S by 2015 (4.8% growth)
Total transactional value of global card purchases
43%
trillion $6.4
Sources: Capgemini “Global Trends in the Payment Card Industry: Issuers”, 2012;
+32%
Chi
na
+10.
1% B
razi
l
+18.
1% A
PAC
+7.3
% E
MEA
Card usage continues in key markets around the globe Card growth trends

8 8
Procurement & payables card evolving
Among multi-national corporations, 37% have established purchasing card programs outside of North America. The majority of these programs are in the United Kingdom, Asia and the Asia-Pacific region.**
* MasterCard Worldwide ** RPMG Purchasing Card Benchmarking Survey Results 2010.
B2B Opportunities*
9 9
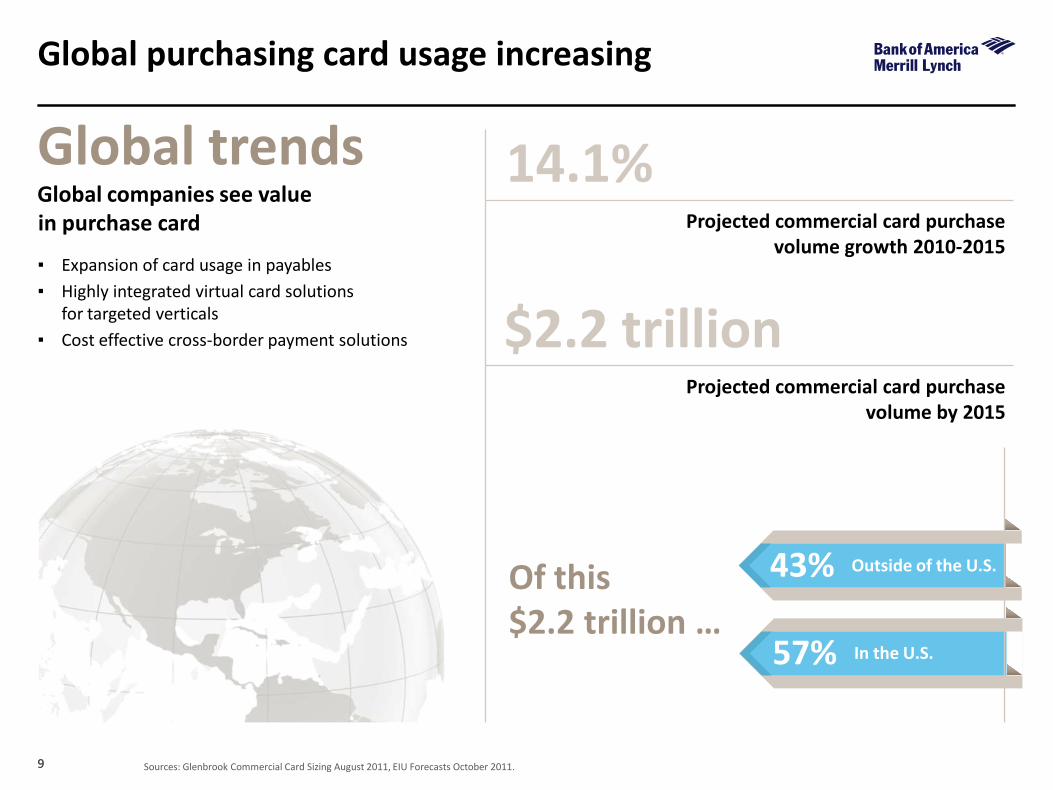
Global purchasing card usage increasing
Global companies see value in purchase card
Sources: Glenbrook Commercial Card Sizing August 2011, EIU Forecasts October 2011.
▪ Expansion of card usage in payables ▪ Highly integrated virtual card solutions
for targeted verticals ▪ Cost effective cross-border payment solutions
14.1% Projected commercial card purchase
volume growth 2010-2015
$2.2 trillion Projected commercial card purchase
volume by 2015
Of this $2.2 trillion …
43% Outside of the U.S.
57% In the U.S.
Global trends

10 10
Purchasing card usage increases in N.A.
Spending & savings continues to rise in North America
Annual purchasing card spending in North America
Spending
Cost savings per transaction in administrative costs when compared
to the traditional purchase-order driven acquisition process
The cost savings that purchasing card use is generating per year in
North America
$44
$74
Savings
Data from RPMG Purchasing Card Benchmarking Survey Results 2012.
billion $196 billion
2011
$212 billion
2012
$247 billion
2013
$290 billion
2014
Purchasing Card trends

11 11
Why make the move the automated payables?
Cost savings drives electronic payment adoption
Automated payables
Fraud control
Improved cash
forecasting Cost
savings Reconcile efficiently
Improved working capital
Better supplier/ customer relations
2013 AFP Electronic Payments Survey, November 2013
The biggest barrier was the unwillingness of suppliers to accept electronic payments
Shortage of IT resources for implementation
Lack of standard format for remittance information
Lack of integration between electronic payment and accounting systems
Barriers to adoption of electronic AP solutions

Driving automation

13 13
Payment strategy goals
13
Reduce fixed costs in the payment cycle
Optimize cash flow in support of working capital
Corporate transparency and local control
Process efficiencies
Objective: A cost effective way to do business globally
Card is a key component to meeting overall payment objectives

14 14
Examining options
Solutions for every type of spend…
These solutions work effectively together to help improve working capital
Purchasing Card
Virtual card & electronic ACH
solutions
Supply Chain Finance (SCF)
$ Working Capital Improvement $$$
Type of spend
Strategic international and domestic suppliers
Invoiced spend
Non - invoiced spend/ lower dollar
Employee programs
Benefit
DPO extension/ COGS reduction
DPO extension/ Financial incentive/ Dynamic discounting
Financial incentive/DPO Extension/reduced processing Costs/data consolidation
Control and data capture/ Financial incentive Travel Card
U.S. and Global

15 15
Virtual Cards: The newest Card program
Extending traditional one card and purchasing card to virtual card has
dramatically increased purchase volume in just the last 2 years.
Virtual card program success depends on your ability to recruit and retain vendors. Establish a vendor value proposition and ensure vendor recruitment is integrated into the sourcing process to ensure maximum program adoption and financial benefits received.
Vendor recruitment
Begin with a known product / internal
need
Ensure Card is integrated
throughout existing business
processes
Identify solutions to address local
and regional differences
Position solutions with management
Ongoing monitoring and best practices
review
The right solution at the right time Virtual card solution evolved from more traditional travel and purchasing card program usage

Going Global

17
Client-focused service and support A single point of contact for a consultative
implementation with regional and global expertise
Knowledgeable and specialized customer service for employees and client servicing for program administrators in local time zones
Strategic account management support to ensure program optimization
Robust capabilities Increased global acceptance for all employees
and cardholders
A market-specific card offering in each market
A single data management and reporting tool for all global usage
A solution provider that leads the market with client-centric innovation
Global Card programs
Key drivers expanding your Global Card program
visibility Single view into purchasing and T&E spend enterprise
and worldwide
control Ability to implement
consistent controls, common purchasing tools, and uniform
policies around the globe
optimization Realize benefits associated
with payments optimization globally
connectivity Benefit from a multi-tiered
client support team with global connectivity

18 18
Location, location, location
Where do you do business?

19 19
Program insights/considerations
Ways to promote global growth with regional differences ▪ Ongoing reporting and analysis at the global and regional levels ▪ Regular communications between program offices ▪ Integration w/ sourcing to identify new vendors ▪ Accountability to performance goals
Language expectations Local customs
Card Security Purchase Card Central Travel Cultural/ regional
nuances
Chip and PIN Chip and Signature Magnetic Stripe Only
Central travel accounts Business Travel
Accounts
Usage by region / country Data available Virtual card options

20 20
Think globally, implement locally
Common framework for program development and deployment meets local needs and ensures global accountability.
Design
Identify potential vendor targets for Pcard v. ePayables
Implement
Vendor enrollment call campaign for
ePayables
Expand
Ongoing vendor identification campaigns;
sourcing integration
Project roadmap for deploying a multi-solution/multi-region EAP solution

Key decisions

22 22
Define success
Approach Global mandate use of card and
mandated global expense policy across organization, unless government laws prohibit/risk Align with move to shared service
centers Realize cost saving from card roll
out in countries as a back office process improvement project to harmonize systems
Get cards deployed and spend on cards – time driven
Capturing global spend and data to a centralized tool
Process efficiency - moving low dollar non recurring spend to card
Leveraging discounts with travel vendors globally
Cost saving
Realize higher card acceptance compared to current issuer
Alignment with organizational change

23 23
Measure success
23
Metrics to consider…
▪ Spend, Transaction Volume, Ave. Ticket, ▪ Monthly reporting – minimum ▪ Performance by region / business office ▪ Consider other metrics such as vendor
enrollment, # active vendor accounts
Monitoring local, regional, and global contributions Promote centralized reporting and regular communications Between local program management teams
Set a growth target for the portfolio – spend, rebate, etc.

24 24
Best practice recommendations
24
Ensure that company policies are enforced in regards to T&E and purchasing.
Global data will be provided on card spend
Use the implementation as an opportunity to ‘open the hood’ and identify best practice
Engage regional stakeholders early and determine what input you need from them
Allow sufficient time to migrate before serving notice to your existing provider
Consider your internal communication requirements from the outset
Assign a clear project lead to assist with comms and stakeholder management
Engage in an early and detailed dialogue with your project manager
Focus on the overall benefits for the program not just on the rebate potential
Let us help you to understand regional differences

Make your move

26 26
Summary
26
Expert team Global project managers and local
teams Dedicated and experienced Understand global markets Best practice guidance
Best in class tools Global Reporting and Account
Management Tool Across all markets Global and local reporting Integration with ERPs, expense
management solution and HR systems
Range of support materials Implementation guides Regional/country program guides Questionnaires for use with regions Cardholder communications Project plans GANTT charts Executive updates Activation reporting PA training and train the trainer materials Global Reporting Tool training and FAQs Payments guides Insurance and emergency guides

27
Q&A Partnering for success

28
Notice to Recipient
"Bank of America Merrill Lynch" is the marketing name for the global banking and global markets businesses of Bank of America Corporation. Lending, derivatives and other commercial banking activities are performed globally by banking affiliates of Bank of America Corporation, including Bank of America, N.A., member FDIC. Securities, strategic advisory, and other investment banking activities are performed globally by investment banking affiliates of Bank of America Corporation ("Investment Banking Affiliates"), including, in the United States, Merrill Lynch, Pierce, Fenner & Smith Incorporated and Merrill Lynch Professional Clearing Corp., both of which are registered as broker-dealers and members of SIPC, and, in other jurisdictions, by locally registered entities. Merrill Lynch, Pierce, Fenner & Smith Incorporated and Merrill Lynch Professional Clearing Corp. are registered as futures commission merchants with the CFTC and are members of the NFA. Investment products offered by Investment Banking Affiliates: Are Not FDIC Insured * May Lose Value * Are Not Bank Guaranteed.
This document is intended for information purposes only and does not constitute a binding commitment to enter into any type of transaction or business relationship as a consequence of any information contained herein.
These materials have been prepared by one or more subsidiaries of Bank of America Corporation solely for the client or potential client to whom such materials are directly addressed and delivered (the “Company”) in connection with an actual or potential business relationship and may not be used or relied upon for any purpose other than as specifically contemplated by a written agreement with us. We assume no obligation to update or otherwise revise these materials, which speak as of the date of this presentation (or another date, if so noted) and are subject to change without notice. Under no circumstances may a copy of this presentation be shown, copied, transmitted or otherwise given to any person other than your authorized representatives. Products and services that may be referenced in the accompanying materials may be provided through one or more affiliates of Bank of America, N.A.
We are required to obtain, verify and record certain information that identifies our clients, which information includes the name and address of the client and other information that will allow us to identify the client in accordance with the USA Patriot Act (Title III of Pub. L. 107-56, as amended (signed into law October 26, 2001)) and such other laws, rules and regulations.
We do not provide legal, compliance, tax or accounting advice. Accordingly, any statements contained herein as to tax matters were neither written nor intended by us to be used and cannot be used by any taxpayer for the purpose of avoiding tax penalties that may be imposed on such taxpayer.
For more information, including terms and conditions that apply to the service(s), please contact your Bank of America Merrill Lynch representative.
Investment Banking Affiliates are not banks. The securities and financial instruments sold, offered or recommended by Investment Banking Affiliates, including without limitation money market mutual funds, are not bank deposits, are not guaranteed by, and are not otherwise obligations of, any bank, thrift or other subsidiary of Bank of America Corporation (unless explicitly stated otherwise), and are not insured by the Federal Deposit Insurance Corporation (“FDIC”) or any other governmental agency (unless explicitly stated otherwise).
This document is intended for information purposes only and does not constitute investment advice or a recommendation or an offer or solicitation, and is not the basis for any contract to purchase or sell any security or other instrument, or for Investment Banking Affiliates or banking affiliates to enter into or arrange any type of transaction as a consequent of any information contained herein.
With respect to investments in money market mutual funds, you should carefully consider a fund’s investment objectives, risks, charges, and expenses before investing. Although money market mutual funds seek to preserve the value of your investment at $1.00 per share, it is possible to lose money by investing in money market mutual funds. The value of investments and the income derived from them may go down as well as up and you may not get back your original investment. The level of yield may be subject to fluctuation and is not guaranteed. Changes in rates of exchange between currencies may cause the value of investments to decrease or increase.
We have adopted policies and guidelines designed to preserve the independence of our research analysts. These policies prohibit employees from offering research coverage, a favorable research rating or a specific price target or offering to change a research rating or price target as consideration for or an inducement to obtain business or other compensation.
Copyright 2014 Bank of America Corporation. Bank of America N.A., Member FDIC, Equal Housing Lender.