new live unilever milestone 5 report aug...
TRANSCRIPT

grow
Milestone 5 Report - August 2002
Unilever Sustainable Agriculture ProjectAustralian Processing Tomato PilotDeveloping an Environmental Management Systems Framework
Project Report
sustainably
Project Number: TM00002

Australian Tomato Growers! Kennedy Agricultural Company Pty Ltd, John & Pat Kennedy! Tydale Holdings Pty Ltd, Graeme Lehmann! Sellwood Farms Pty Ltd, Ray & Jo Sellwood! Spencer Farms Pty Ltd, Geoff & Sandy Spencer! Rorato Nominees Pty Ltd, Sergio, Glenn & Allan Rorato
Government Contributions! Australian Greenhouse Office, Support with Energy Analysis! CSIRO Division of Land and Water Resources, Microbial Activity Analysis! Department of Land & Water Conservation, Biodiversity Assistance! Department of Natural Resources and Environment Victoria, Biodiversity Assistance, Project Team Support! Goulburn Broken Catchment Management Authority, Biodiversity Farm Review Assistance! Goulburn Murray Water, Ground Water Information and Water Supply Assistance! Horticulture Australia, Funding and Project Management Support! Murray Irrigation, Ground Water Information and Water Supply Assistance! Murray Darling Basin Commission, Ground Water Information ! New South Wales Agriculture, Project Team Support! Northern Campaspe Catchment Management Authority, Biodiversity Farm Review Assistance! Parks Victoria, Biodiversity Farm Review Assistance, Access to Parks for Environmental Benchmarking! Shire of Campaspe Local/Regional Council, Consultative Committee Assistance! State Chemistry Laboratory, Laboratory Services - Soil, Plant & Water! University of Adelaide, Mychorizzal Assessments! University of Essexs, Soil Microbial Activity Assessments
NGO Contributions! Aquatec Pty Ltd, Drip Irrigation System Design Reviews ! Australian Processing Tomato Industry Research Council, Industry Support! Brij Bug Trap Consultants Pty Ltd, Insect Pest Identification! Creation Care Pty Ltd, Biodiversity Method Development & Farm Assessments! ECO Research Pty Ltd, Earthworm Assessments! Horizon Soil Water Pty Ltd, Soil Sampling! Land Management Surveys Pty Ltd, Whole Farm Planning! MAIT Industries Pty Ltd, Soil Moisture & Water Conservation Technologies! McMaster Consulting Pty Ltd, Project Planning, Literature Review, Field Research! Spatial Vision Innovations Pty Ltd, Graphic Information Systems & Maps! Vox Bandicoot Pty Ltd, Environmental Communications & Field Day Facilitation
Pilot Project Management Team! Graeme Ashby, Unilever Australasia Limited! Richard Bennett, Horticulture Australia Limited! Tim Dyer, Unilever Australasia Limited! Mark Hickey, New South Wales Agriculture! Stuart Holland, Department of Natural Resources & Environment Victoria! John Kennedy, Kennedy Agricultural Pty Ltd! Pat Kennedy, Kennedy Agricultural Pty Ltd! Graeme Lehmann, Tydale Holdings Pty Ltd! Jamie McMaster, Outsourced Environmental! Lewis McMaster, Outsourced Environmental! Allan Rorato, Rorato Nominees Pty Ltd! Glenn Rorato, Rorato Nominees Pty Ltd! Ray Sellwood, Sellwood Farms Pty Ltd! Leigh Sparrow, Horticulture Australia Limited! Geoff Spencer, Spencer Farms Pty Ltd! Sandy Spencer, Spencer Farms Pty Ltd! Garry West, Unilever Australasia Limited
Funding Contributions Project Manager & Facilitator! Australian Greenhouse Office MAC Global Pty Ltd trading as Outsourced Environmental! Horticulture Australia Limited! Unilever Australasia Limited
This report was produced as a final milestone report for Horticulture Australia Project TM00002 “Development of an Environmental Management Systems Framework for Processing Tomatoes” and a bridging report for the Initiation of Horticulture Australia Project TM02005 “Implementing an EMS for Processing Tomatoes”.
Copyright © Outsourced Environmental 2002. All rights reserved.
Project Participants & Key Roles
Page 1 Milestone 5 Report, August 2002

Since the mid-1990's, Unilever has been consulting
with experts and engaging with suppliers,
customers, consumers and business partners
around the world to find a sustainable way forward
for agriculture.
Experts are concerned, among other things, about
the decline in soil fertility, biodiversity, rising water
tables, availability of water and decline in water
quality.
Over the past two decades, community awareness
of the environment and expectations of a healthy
environment have been growing. Today's
consumers are a lot more conscious of issues such
as chemical residues, fertiliser use and the
potential impact big companies have on the
environment. As a result, Unilever is aligning
economic goals with the social and environmental
consequences of its operations. The Unilever
approach to the Triple Bottom Line - people, planet
and profit reflects the importance of acting
responsibly beyond the financial bottom line.
Currently, Unilever buys and processes 7% of the
world's processing tomatoes and is one of the
world's largest users and buyers of agricultural raw
materials. Agriculture provides more than two thirds
of the raw materials for Unilever's branded
products. As a business Unilever is committed to
ensuring a sustainable supply of raw materials in
order to continue to run a prosperous and healthy
company in the long term.
Hence this Australian Sustainable Agricultural
Project (SAP) is important to the Unilever long term
strategy and was made possible by the combined
support of Horticulture Australia, the Australian
Greenhouse Office and Unilever Australasia.
The SAP is one of 17 pilot projects being run by
Unilever around the globe in a quest to develop
monitoring systems to assess the sustainability of
current production technologies, identify best
management practices to positively improve key
indicators and develop management systems to
ensure continuous improvement.
The first phase involving a two year pilot study
successfully concluded in August 2002. The
environmental indicators monitored during the
2000/2001 and 2001/2002 growing seasons
provided a useful insight into the environmental
impact of processing tomatoes.
This project is unique in its focus, developing farm environmental monitoring systems as a basis for the implementation of an integrated environmental management system (EMS).
Despite the increases in productivity evident in recent years on processing tomato farms in Australia, this study highlights several areas requiring immediate attention. Key areas for improvement include; organic matter management, improved nutrient management, identification of renewable inputs (fertilizers & others), changes towards improved IPM practices, improvement in farm biodiversity management and improved water use efficiency.
The key words on the front cover of this report, “grow sustainably”, provide a central theme for this project, embracing an informed understanding of the impacts of agricultural production and supply chain practices, implementation of best practices and control measures, in order to positively enhance productivity and to monitor the effectiveness of these changes. This theme forms the basis of our proposed EMS.
This report summarises the key learning's from the two year monitoring project and describes our current progress. We are at the beginning of a very long journey and we need the continued support and partnership of our growers and key stake holders in order to make progress.One thing that has become clear as a result of this study is the need for this project and the participating farms to link with neighbouring land users and stakeholders, perhaps at a catchment or regional scale, in order to achieve net sustainability improvements. Given biodiversity and ground water table management as two examples, achieving meaningful improvements clearly requires catchment scale change. The next phase of this project will provide the rollout of a best practice management system (EMS) for all Unilever growers and steps towards linkages between this project and regional programs.
Tim Dyer
Project Director
Supply Manager
Food Ingredients & Agriculture
Unilever Australasia Limited30 August 2002
Foreword
Milestone 5 Report, August 2002, Page 2

Project Participants & Key Roles 1
Foreword 2
Summary 4
Introduction to the Unilever Sustainability Initiative 7
Unilever Sustainable Agriculture Indicators 8
Introducing the 5 Pilot Growers 10
The Australian Project Development & Context 11
Initial Environmental Review 11
Literature Review 13
Understanding the Natural Resource Base 13
Sustainability Indicator Key Learning’s 15
Management Systems Framework 23
Looking Forward 24
Appendix 1: Sustainability Enabler Matrix 25
Appendix 2: Draft Indicator Results 34
Contents
Page 3 Milestone 5 Report, August 2002

Milestone 5 Report, August 2002, Page 3Milestone 5 Report, August 2002, Page 3
The Australian processing tomato industry is
arguably one of the most efficient in the world To further assist in developing the monitoring plan
given that tomatoes are produced in a country a review of literature was conducted. In order to
void of trade barriers & subsidies and in one of the h e l p i n t e r p r e t t h e s u s t a i n a b i l i t y
harshest environments, often combating the indicator/parameter monitoring results, a study of
unpredictable elements of summer rainfall events the Natural Resource Base was conducted for
and winter drought. each farm. This study involved soil survey, land
capabi l i ty assessment, a b iodivers i ty
Not only are these farmers efficient, on a global reconnaissance survey and the development of
scale they are considered by Unilever to be whole farm plans.
innovative and progressive, possessing many of
the desired best management practices required For each of Unilever's 10 sustainability indicator
for sustainable production. clusters a range of parameters were selected to
monitor on each farm. 8 Sustainability Indicators
Over the past 2 years the Australian SAP has were selected for the 2 year monitoring study, and
partnered with 5 tomato growers to learn about included; Soil Fertility & Health, Soil Loss,
sustainability indicators. The growers involved in Nutr ients, Pest Management, Biod iversity,
this study joined Unilever Australasia and Energy, Product Value and Water Management.
Horticulture Australia on a journey to better
understand and improve farm environmental In addition to the resolution of a set of
performance. sustainability indicators and parameters, several
key themes for sustainable production of
This study resolved key parameters which tomatoes emerged from the initial environmental
effectively help to measure and monitor farm review on 15 farms and the two year monitoring
environmental performance. Another important study on the five farms.
aspect of this study was the identification of best
management practices to positively influence Themes included;
selected indicators. Carbon Management: A range of parameters
associated with soil fertility and health were
The journey was initiated with a scoping study in considered. Organic carbon levels provided the
January 2000, followed by a detailed farm central link to beneficial levels for most Soil
environmental review. Fertility & Health parameters reviewed. Organic
carbon levels for tomato soils ranged from 0.7 to
The init ial envi ronmental review provided 2.5%. Growers with soils having high organic
valuable insight into farm sustainability issues carbon levels had trash retention strategies (no
and helped to select key susta inabil ity burning), higher levels of earthworm activity,
parameters and resolve the project strategy. With microbial biomass and mychorizzal colonization
the support of the Australian Greenhouse (tomato roots). Clearly cultural practices
Challenge Office an extension of the initial associated with trash burning and stubble
environmental review to a wider grower audience removal need to be further reviewed. Links
was made possible. 15 tomato growers between trash burning, pest and disease
participated in this detailed review. The key management also require further research.
learning's from the study are included in this
report.
Summary
Milestone 5 Report, August 2002, Page 4

Diagnostics for Fertility Assessment: A range of
methods are currently used to determine nutrient
application rates. Growers using soil, plant tissue and
infield sap analysis generally utilized lower inputs of
fertilizer.
Water Use Efficiency & Conservation: 49% of the
Australian processing tomato industry grew tomatoes
in 2001/2002 with sub-surface drip irrigation. Over the
past 10 years a significant transition has occurred
from furrow to drip irrigation with water use improving
from 12 ML/ha to 4 ML/ha. Even with this transition,
the SAP review highlighted the importance of
irrigation design, selection of drip technology and
post-installation maintenance. Drip irrigation system
distribution uniformities (DU) reviewed ranged from
67% to 91%. Interestingly, the grower with 91% DU
designed the system himself and the tube was 22
years old, having been installed and retrieved 6 times.
Water use efficiency ranged from 6.7 to 24.2 tonnes
of fresh tomatoes per ML of water used (irrigation and
summer rainfall).
Biodiversity & Landscape Health: 11 Parameters
associated with biodiversity were evaluated on the 5 Reduction in Fertilizer Inputs: On the basis of soil farms. Biodiversity assessment methods were analysis, nutrient leaching studies and crop removal developed and applied over the two monitoring analysis it is clear that for some growers, reductions in seasons to each farm, resulting in development of fertilizer inputs can be achieved without any farm biodiversity improvement plans. Significant significant yield penalty. Nitrogen input rates ranged areas for biodiversity enhancement were identified from 130 to 360+ kg/ha N, and there was no with existing areas of permanent vegetation per farm significant correlation between yield and the amount ranging <1 to 10%. Enhancement plans considered 4 of nitrogen.parameters including; stock shelter, water table
management, surface water management and Beneficial’s and not just Chemicals for Pest biodiversity value improvement. All farmers in the Management: A review of current pest management project developed plans to significantly enhance practices has highlighted gaps in several areas of a biodiversity on their farms in line with project goals, balanced Integrated Pest Management System. The local and regional biodiversity goals.tomato industry in Australia relies heavily on several
key pesticides for pest control, a number of which are Renewable Input & Energy Gaps: Given the growers of concern in Europe and USA due to issues relating involved in this pilot, there was virtually no renewable to eco-toxicity and human health. More extensive fertilizer used for processing tomatoes and monitoring and management of beneficial insects is associated crop rotations. Several growers have clearly required to induce reduction in chemical considered organic based fertilizers, however further dependent production systems.research is required to verify product effectiveness
and manufacturer performance claims. While Chemical Storage & Equipment Calibration: renewable energy sources such as bio-diesel are Controlled chemical management practices reduce emerging in Australia, these technologies are not risks to the environment, people handling these currently in use on tomato farms.products and wider ecosystems potentially impacted
by them. Improved storage and handling procedures
(& facilities) will be a priority for the next phase of this
project. Spray equipment calibration is also an area
requiring focus. The use of aircraft for pesticide spray
application is being reviewed, with several farms
converting to ground spray equipment to minimize
drift and off target application.
Page 5 Milestone 5 Report, August 2002

Yield & Quality Improvements; Yields in excess of 140
metric t/ha were recorded on drip irrigated tomatoes.
A combination of well managed nutrient, water, soil
health and pest control were found to be central to
growers consistently achieving high yields. However
soluble solid levels across the Australian industry
appear to have declined in recent years perhaps due
to changes in water management and cultivars. More
effective monitoring and improved soil fertility and
health is considered to be central to sustaining high
levels of productivity over consecutive seasons.
Other issues;
For each sustainability indicator and parameter a
range of best management practices (BMP's) has
been identified and presented in Appendix 1 of this
report. A condensed version of identified BMP's will be
incorporated into the EMS and form the basis for the
development of sustainability standards and the
management system.
Preliminary results for selected indicators are also
presented in Appendix 2 for consideration.
The management system to be developed in phase 2
will incorporate the BMP’s identified, selected
sustainability indicators and parameters considered
in phase 1. These indicators and parameters will
provide a monitoring and continuous improvement
framework to facilitate and measure change over
time.
It is proposed to develop a management system
framework that incorporates the mixed farming
requirements (cereals, sheep, orchards, rice), while
considering the key food safety requirements
required by Unilever.
Growers have requested consideration and
incorporation of occupational health and safety
issues including; contractor safety, slips, trips and
falls, confined space entry, dangerous goods, working
from height, machine guarding and electrical safety.
To this end an array of expertise across environment,
agronomy, food safety and occupational health and
safety fields has been assembled to facilitate creative
documentation of the management and training
system.Milestone 5 Report, August 2002, Page 6
The 2 indicators not included in the phase 1 monitoring
study included Social Human Capital and Local
Economy. These two indicators will be formally
considered in future years as funding permits.

Page 2 Milestone 5 Report, August 2002
Unilever have launched 17 pilot projects for key
sourcing crops around the globe in a quest for answers
to achieve sustainable production outcomes.
Unilever's Pilot Projects
- Broccoli - Austria
- Mixed Rotations - Colworth Farm, United
Kingdom
- Palm Oil - Ghana, Malaysia
- Peas - United Kingdom
- Rape Seed - Germany, Poland
- Spinach - Germany, Italy
- Sunflower - France, Hungary
- Tea - India, Kenya, Tanzania
- Tomatoes - Australia, Brazil, California
Accordingly, in July 2000 Unilever Australasia and
Horticulture Australia jointly launched an initiative for
the processing tomato industry in Australia to develop a
process for the assessment of the sustainability of
existing practices associated with processing
tomatoes. Within the context of Unilever's 10
sustainability clusters, parameters and associated field
methods were developed and applied to 5 pilot farms
selected to represent the diversity of operations and
activities currently found in the Australian industry.
The Unilever Sustainable Agriculture Project (SAP)
came into being in the mid-1990’s. Recognising that the
pressures on agriculture had implications for Unilever in
the long term, they began working with others in Europe
to develop the programme. At around the same time,
Unilever started work on similar initiatives for water and
fisheries in response to pressures on water resources
and fish stocks which are also essential to their
business.
The aim of the SAP is to ensure continued access for
Unilever to the key agricultural raw materials on which
they depend. Ultimately market mechanisms will
develop that allow consumers and customers to
influence the sourcing of agricultural raw materials
through their buying habits.
The question Unilever faces is; “how farming can
become more productive, protect the environment,
preserve natural resources and contribute to rural
communities, while using fewer agrochemicals and
other inputs?” This question poses a huge challenge for
all those involved in agriculture: farmers, scientists,
experts, governments and businesses such as
Unilever's.
What Sustainability Means to Unilever
The use of farming practices and systems which
maintain or enhance:
- the economic viability of agricultural production;
- the natural resource base; and
- other ecosystems which are influenced by
agricultural activities (neighbours, downstream
etc).
4 Key Principles
- Produce crops with high yield and nutritional
quality to meet existing and future needs, while
keeping resource inputs as low as possible;
- Ensure that adverse effects on soil fertility, water
and air quality and biodiversity from agricultural
activities are minimised;
- Optimise the use of renewable resources while
minimising the use of non-renewable resources;
- Enable local communities to protect and improve
their well being and environment.
Page 6 Milestone 5 Report, August 2002
Introduction
Page 7 Milestone 5 Report, August 2002

Milestone 5 Report, August 2002, Page 8
6 Product ValueProduct value is a measure of the desired outputs of an agricultural system. Sustainable practices should be able to maintain or improve
product value.Parameters: Total value of produce per ha, Yield in tonnes per ha, Conformity to quality specifications - Soluble Solids (Brix), Lycopene, Heavy metal and Pesticide residues in produce (mg/kg).
7 EnergyAlthough the energy of sunlight is a fundamental input to agriculture, the energy balance of agricultural systems depends on the
additional energy supplied from renewable sources to power machinery. Sustainable practices can improve the energy balance and ensure that it remains positive - there is more energy coming in than going out.Parameters: Ratio of renewable to non renewable energy inputs, Fuel use (per hectare and per tonne produce), Estimated emissions from cultivation (CO /ha), Net 2
emissions per farm (CO ).2
8 WaterSome agricultural systems make use of water for irrigation, some pollute or contaminate ground or surface water with pesticides,
nutrients or soil. Sustainable practices can make targeted use of inputs, and reduce loss.Parameters: Amount of water used per ha or tonne of produce, Irrigation distribution uniformity %, tail water loss %, leaching or runoff of pesticides to surface and ground water, leaching and run off of N/P/K (nutrients) to surface and ground water.
9 Social/Human CapitalThe challenge with using natural resources sustainably is fundamentally a social one. It requires collective action, the sharing of new
knowledge and continuous innovation. Sustainable agriculture practices can improve both social and human capital in order to ensure normal outputs. The prime responsibility for this should remain with the local community, leading to realistic and actionable targets.Parameters: Group dynamics/organisational density (farmer groups), (Rural) community awareness of r e l e v a n c e a n d b e n e f i t s o f s u s t a i n a b l e practices/connectivity to society at large, Rate of innovation.
10 Local Economy Agricultural inputs (goods, labour, services) can be sourced from many places, but when they come from the local economy, the expenditure
helps to sustain local businesses and livelihoods. Sustainable agriculture practices can help to make the best use of local and available resources in order to increase efficiency.Parameters: Amount of money/profit invested locally, Percentage of goods/labour/services sourced locally, Employment level in local community.
1 Soil Fertility/HealthSoil is fundamental to agricultural systems, and a rich soil ecosystem contributes to crop and livestock performance. Sustainable practices
can improve beneficial components of the soils ecosystem. Parameters: Number of beneficial organisms (e.g. earthworm density and biomass), number of beneficial micro-organisms (microbial biomass), Soil chemical properties (pH, EC, Ca:Mg ratio etc), Soil organic carbon (measure of health soil structure).
2 Soil LossSoil eroded by water, wind and harvest (to factory) can lose both structure and organic matter, diminishing the assets of an agricultural
system. Sustainable practices can reduce soil erosion and loss.Parameters: Slope (% Fall), Soil cover index (total bare months of soil, proportion of time soil is covered with crop, cover protects against leaching and erosion, promotes water use), Soil erosion (tonnes per hectare soil loss to factory), Soil compaction index (compaction resulting from crop machine activities).
3 NutrientsCrops and livestock need a balance of nutrients. Some of these can be created locally (e.g. nitrogen), and some must be imported.
Nutrients are lost through cropping, erosion, emissions to the air. Sustainable practices can enhance locally produced nutrients and reduce losses.Parameters: Amount of inorganic Nitrogen (N)/ Phosphorus (P) / Potassium (K) applied (per hectare or per tonne of product), Balance of N/P/K over crop rotations, Emissions of N-compounds to air, % Renewable Fertilizer Utilized.
4 Pest ManagementWhen pesticides are applied to crops or livestock, a small but significant proportion can escape to water and air or accumulate in foods,
affecting ecosystems and human health. Sustainable practices can substitute natural controls for some pesticides, reducing dependence on synthetic substances. Management of beneficial insects and cultural practices can also provide further non-chemical control.Parameters: Amounts of pesticides (active ingredient) applied (per ha or per tonne of product), Type applied (profiling, positive list, weighting factor), Percentage of crop under Integrated Pest Management (IPM).
5 BiodiversityAgriculture has shaped most ecosystems in the world, and biodiversity can be improved or reduced by agricultural practices. Some
biodiversity is highly beneficial to agriculture. Sustainable practices can improve biodiversity by strategically revegetating unproductive farm areas, providing habitat for native fauna etc.Parameters: % Area under permanent vegetation, Boundary to Area Ratio, Vegetation Strata, Species Richness, Conservation Status, Native Vegetation Health, Weed Invasion & Feral Fauna in Native Vegetation, Frog Abnormalities and Aquatic Macro Invertebrates.
Sustainable Agriculture Indicators

3 Project Elements
The Australian SAP project framework consists of 3 key
components;
1) Evaluation of Sustainability Indicators & Parameters
(00/01 & 01/02),
2) Development & Implementation of an Environmental
Management System (02/03),
3) Further Monitoring and Implementation of Strategies
to Positively Influence Key Parameters (02 to 05).
Project Strategy - Establishing the Basics
A number of the current practices associated with
processing tomato production are believed to fall short of
the requirements for sustainability. Environmental
problems are of increasing concern both from the point
of view of preserving the natural resource base used for
production and with the broader issues of biodiversity,
community health and pollution.
Five Growers were selected to represent the range of
environments and management practices encountered
within the processing tomato industry. Measurable
changes in all selected variables were interpreted for
either positive or negative effects upon the environment
with associated implications for the “sustainability” of the
observed management practices.
Information and data for some 130 indices has been
collected over 2 seasons on the 5 farms enabling the
environmental significance of existing practices to be
reviewed and monitored. Indicator methods were
refined and the number of parameters streamlined.
A range of professional expertise to address different
aspects of the indicator set and implement the project
were assembled. A joint industry/Unilever advisory
council (Pilot Project Team) was established to guide the
research and monitoring process.
A series of best management practices were identified
and presented in this report and will be integrated into
Unilever existing best management practice system. A
framework for the development of an environmental
management system (EMS) has also been established.
Confidentiality
Information in this report has been compiled with the
generous support of the 5 growers participating in the
detailed two year study and the additional 10 growers
participating in the initial environmental review. To
preserve confidentiality, a grower number has been
assigned to all information relating to farm production
and indicator results.
The next step for the context of the Australian pilot
project involves the development of the EMS and a set of
training support tools, plus field application (road testing)
across the industry. In terms of implementation the initial
focus will involve Unilever's growers, however the
system will be made available to the wider industry in due
course.
Further, given that the focus of the first phase of the
Australian pilot was the selection of environmental
indices, field assessment and data collection, the
challenge is to resolve and test management strategies
for their ability to effect positive changes in the
environment. To this end, partnering with the 5 core
farmers involved in Phase 1, a series of management
strategies will be implemented across each farm, and
using the monitoring system developed in Phase 1 the
environmental impacts or change resulting will be
assessed.
Page 9 Milestone 5 Report, August 2002
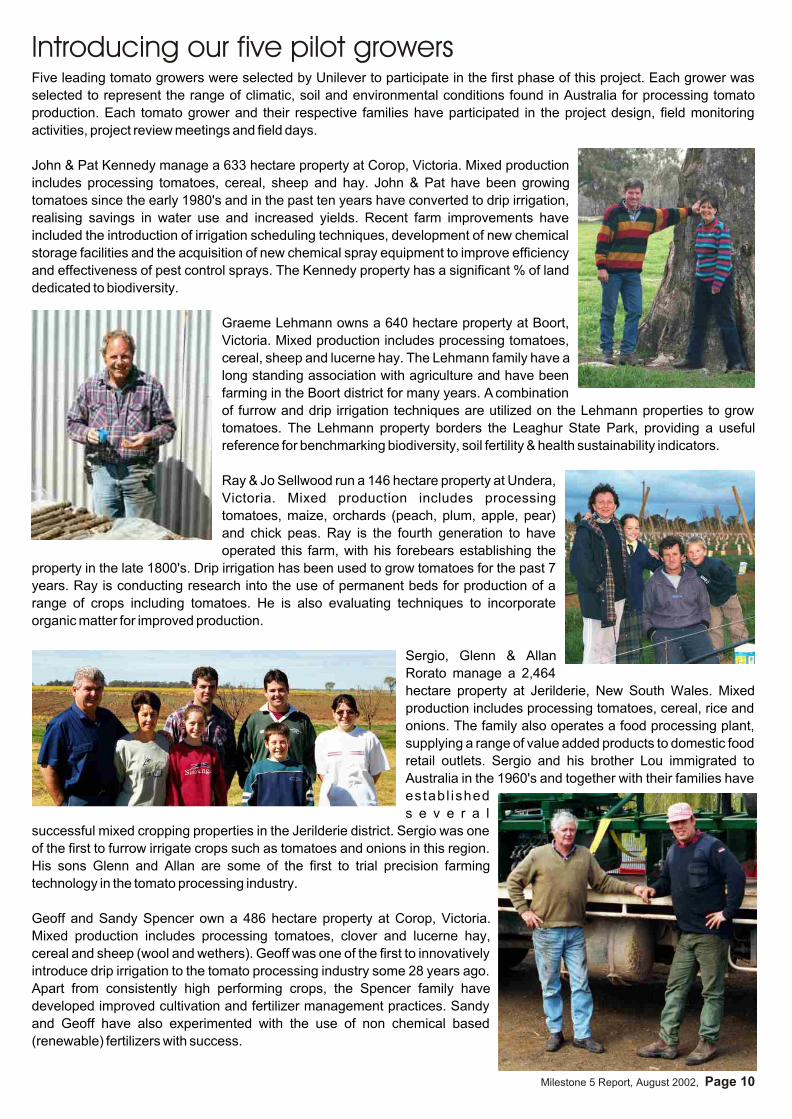
Five leading tomato growers were selected by Unilever to participate in the first phase of this project. Each grower was
selected to represent the range of climatic, soil and environmental conditions found in Australia for processing tomato
production. Each tomato grower and their respective families have participated in the project design, field monitoring
activities, project review meetings and field days.
John & Pat Kennedy manage a 633 hectare property at Corop, Victoria. Mixed production
includes processing tomatoes, cereal, sheep and hay. John & Pat have been growing
tomatoes since the early 1980's and in the past ten years have converted to drip irrigation,
realising savings in water use and increased yields. Recent farm improvements have
included the introduction of irrigation scheduling techniques, development of new chemical
storage facilities and the acquisition of new chemical spray equipment to improve efficiency
and effectiveness of pest control sprays. The Kennedy property has a significant % of land
dedicated to biodiversity.
Graeme Lehmann owns a 640 hectare property at Boort,
Victoria. Mixed production includes processing tomatoes,
cereal, sheep and lucerne hay. The Lehmann family have a
long standing association with agriculture and have been
farming in the Boort district for many years. A combination
of furrow and drip irrigation techniques are utilized on the Lehmann properties to grow
tomatoes. The Lehmann property borders the Leaghur State Park, providing a useful
reference for benchmarking biodiversity, soil fertility & health sustainability indicators.
Ray & Jo Sellwood run a 146 hectare property at Undera,
Victoria. Mixed production includes processing
tomatoes, maize, orchards (peach, plum, apple, pear)
and chick peas. Ray is the fourth generation to have
operated this farm, with his forebears establishing the
property in the late 1800's. Drip irrigation has been used to grow tomatoes for the past 7
years. Ray is conducting research into the use of permanent beds for production of a
range of crops including tomatoes. He is also evaluating techniques to incorporate
organic matter for improved production.
Sergio, Glenn & Allan
Rorato manage a 2,464
hectare property at Jerilderie, New South Wales. Mixed
production includes processing tomatoes, cereal, rice and
onions. The family also operates a food processing plant,
supplying a range of value added products to domestic food
retail outlets. Sergio and his brother Lou immigrated to
Australia in the 1960's and together with their families have
establ ished
s e v e r a l
successful mixed cropping properties in the Jerilderie district. Sergio was one
of the first to furrow irrigate crops such as tomatoes and onions in this region.
His sons Glenn and Allan are some of the first to trial precision farming
technology in the tomato processing industry.
Geoff and Sandy Spencer own a 486 hectare property at Corop, Victoria.
Mixed production includes processing tomatoes, clover and lucerne hay,
cereal and sheep (wool and wethers). Geoff was one of the first to innovatively
introduce drip irrigation to the tomato processing industry some 28 years ago.
Apart from consistently high performing crops, the Spencer family have
developed improved cultivation and fertilizer management practices. Sandy
and Geoff have also experimented with the use of non chemical based
(renewable) fertilizers with success.
Introducing our five pilot growers
Milestone 5 Report, August 2002, Page 10

0 Virtually no growers applied potassium, despite the Prior to field monitoring commencement, 3 important export of 400 to 500 kg/ha K per season in fruit and steps occurred, including conducting;burnt trash.
- An initial environmental review,0 Zero use of renewable or organic fertilizers.
- A detailed review of literature and,0 50% of growers used diagnostic tools such as regular
- Facilitating a review of the natural resource base on soil testing (shallow & deep), plant tissue testing &/or
and around each pilot farm.sap nitrate.
Initial Environmental ReviewPest Management
Approach0 Considerable variability in grower
In August 2000 an initial environmental review was knowledge of pest profiles was identified,
conducted on the 5 pilot grower properties selected for however the majority of growers utilized a
the monitoring study. The review focussed on the 10 crop scout.
Unilever sustainability indicators and a review of point 0 IPM programs consisted of scouting for major pests,
source issues (chemical storage & handling etc) and minimal use of beneficial insects for control, and
waste management. In addition a further 17 farms strong reliance on chemical based control measures.
participated in a wider survey of greenhouse related 0 Chemical storage facilities on all farms were void of
issues and 10 of these farms participated in a more bunding, segregation of chemicals by class,
detailed on farm review similar to the review conducted adequate ventilation, spill control and emergency
in August 2000. Information was gathered, a database management equipment.
created, grower reports generated and key sustainability
indicator data assembled.Biodiversity
0 The initial review focussed on the presence What we learnt
and health of existing native vegetation Soil Fertility & Health
(NV).0 Linkages between Microbial activity and
0 Typically farms had <3% NV; it was generally sparse tomato production needs further research
and located around fencelines and roadsides.but may be to be central to sustained tomato
0 One farm had a significant area of NV (9% in one production
large block). Another grower had 10% of farm area 0 Organic matter levels for most farms were low (<1.5%
under native woodlot (flooded & spotted gums). O.C), with 70% of farms burning cereal and tomato
0 Boundary to area ratios for NV on most farms were trash each year.
poor due to thin or narrow areas present. Diversity of
species was generally poor also.Soil Loss
0 Most growers are interested and committed to 0 During tomato growing periods soil had
improving farm biodiversity (flora & fauna).<50% cover for 8 to 10 months of year.
Bare soil periods included winter months Product Value
where both erosion potential and ground water 0 Average tomato yields ranged from 60 to
aquifer recharge is higher .140 t/ha, higher yields generally occurring
0 Soil export at harvest to various processors was as on drip irrigated farms.
high as 0.8 t/ha/yr, mainly due to soil type and 0 Soluble solids (brix) ranged from 3.3 to 6% with lower
cultivation practices.solids generally occurring on drip irrigated farms.
0 Up to 17 tillage activities were noted for each crop of
processing tomatoes.
0 Total number of traffic movements ranged from 28 to
44 passes per season.
Nutrient Management
0 Inorganic nitrogen inputs ranged from 128
to 389 kg/ha N, without a strong correlation
to yield.
Australian Project Development & Context
Page 11 Milestone 5 Report, August 2002

Energy Waste Management
0 No renewable energy sources were 0 Waste streams include workshop wastes (oils,
used on tomato farms. filters, batteries, rags), chemical and oil drums,
0 Fuel use efficiency ranging from 3.3 to 8.3 L wash down residues from equipment cleaning,
(diesel) per tonne tomatoes. rinsates from chemical drums, packaging wastes
0 Emissions of greenhouse gas predominately relate and cardboard.
to water logging and denitrification of nitrogen 0 No formal recycling program is in place for tomato
fertilizer. growers, with the majority of wastes being
0 Knowledge and information about fuel use disposed of to land fill (on farm and off farm) and via
efficiency of farm equipment was limited. burning.
0 The chemical industry Drum Muster recycling
Water program not functioning well in tomato areas at this
0Water use ranged from 3.6 to 12 ML per stage.
ha of tomatoes.
0 Furrow irrigated growers generally used more water Point Source Contamination Areas Identified
per hectare than drip irrigated growers. 0 Equipment and machinery wash down areas.
0 <10% of drip irrigated growers checked irrigation 0 Above and below ground fuel storage facilities (no
system uniformity on a regular basis. bunding).
0 <10% of all growers utilized infield soil moisture 0 Chemical & liquid fertilizer storage and handling
devices to schedule watering. areas.
0 Ground water tables ranged from <1 m to 20 m
below the natural surface. On several farms water Other
levels were found to have risen recently despite Several occupational health and safety risks and food
drought conditions over past five years. Ground safety risks identified as a consequence of this
water tables were generally saline (EC 5 to 30 review. These key learning's will be incorporated into
dS/m). the design for the next phase of SAP.
Social/Human Capital Next Steps
0 All farms were family owned and 0 Dialogue with each farmer regarding identified
operated. risks and opportunities for sustainability
0 Tonnes of tomatoes produced per full time improvement identified.
equivalent (FTE) staff ranged from 700 to 1800 or 8 0 Development of risk plans for each farm.
to 28 hectares of tomatoes grown per FTE. 0 Identification of best management plans for each
0 With increased mechanisation employment grower to improve sustainability indicator
opportunities were considered by growers to performance.
remain the same or decline on most farms in the 0 Implementation of Unilever best practice
future. management system (the EMS).
0 Majority of farm employees and casual labour lived 0 Selection of key sustainability indicators for farm
<30 kms from farms. monitoring and improved performance (set
objectives).
Local Economy 0 Develop and implement recycling programs as part
0 Majority of chemical and fertilizer inputs of the EMS for farm waste streams.
sourced locally but manufactured overseas.
0 Most farm implements and machinery used were
manufactured overseas.
0 All farms reinvest profits into local areas.
0 Tomato farms are important to many local mixed
businesses and provide one of the major
employment opportunities in most areas.
Milestone 5 Report, August 2002, Page 12

What we've been doing
0 To initiate the project a review of some 340 literature What we've been doing
references provided an understanding of the 0 A study of the dominant soils was conducted on
thinking and methodology relating to sustainable each of the 5 pilot farms.
agriculture, EMS & BMP's for irrigated horticulture. 0 A detail grid (75 m) soil survey was also conducted
0 This exercise provided a review of methodology for on the fields selected for the two year monitoring
assessment techniques and (where available) study and for native reference sites.
interpretative thresholds etc. 0 Soil pits were excavated on each farm (paddock
and reference sites) and soil samples were
What we've learnt collected for moisture holding capacity and full
0 Conventions for sustainability assessment are chemical analysis.
poorly defined, developed or agreed (globally). 0 Whole farm plans, GIS, environmental pathway and
0 There is widespread acceptance of the concept of target maps were developed for each pilot farm.
sustainability at a policy level by governments. 0 A biodiversity reconnaissance survey was
0 There is a need for conventions in terminology & conducted on each pilot farm and surrounding
methods. areas.
0 Micro-level issues are yet to be addressed (farm- 0 Ground water table data was assembled for all pilot
site). farms (20+ year history).
0 There is a need for national/international 0 Long term weather data was collected for each
coordination of effort. region also.
0 There has been a focus or emphasis on bio-
physical aspects of environment which has created What we've learnt
an imbalance of invested effort. 0 Identified impeding soil layers to tomato root growth
0 There is a need to embrace the socio-economic & with 1 grower having 40 cm top soil only before a
energy dimensions of sustainability. medium clay sodic sub soil.
0 Human health appears to have been overlooked in 0 Defined Readily Available Water (RAW) for
the sustainability debate so far. paddock soils with profile water holding capacities
0 Ne ed fo r a ne w ho li st ic pa ra di gm (c /f ranging between 15 and 90 mm RAW (-8 kPa and -
“reductionist”). 60 kPa).
0 The Dutch “amoeba” concept for representing an 0 Top soil depth and RAW varied across fields and
env i ronment o f fered a usefu l ho l is t ic between farms.
representation. 0 Changes in RAW distribution in fields influences
0 Tomato research and development (R&D) has irrigation design (drip precipitation rate, emitter
focused on yield/quality and not environment or spacing etc).
sustainability. 0 Root systems in furrow irrigated soils grew down to
0 Processing Tomato Industry internationally has yet 80 cm, while for drip irrigated tomato roots grew
to come to terms with the sustainability challenge. from 40 to 60 cm below the soil surface.
0 Conventional tomato industry R&D focus needs to
be challenged.
0 There is a need to consider “sustainable yield” as a
production goal, rather than just maximum yield.
Literature Review Understanding the Natural Resource Base
Page 13 Milestone 5 Report, August 2002

Depth to 1st Impeding Layer
Soil Profile
Whole Farm Plan
Historical Review
Readily Available Water
Farm Locality Plan
Biodiversity Reconnaissance
Biodiversity Management Plan
Environment Plan
Soil Morphology & Type
Readily Available Water
Testwel l 977710
1
2
3
4
5
S-91 J-93 J-94 O-95 M-97 J-98 D-99 A-01Date
Depth
(m)
Chloride (mg/L)
EC (dS/m)
14
4,700
Water Table depth and quality forGrower 1 test well
Depth to 1st Impeding Layer
Milestone 5 Report, August 2002, Page 14
Farm Locality Plan
Biodiversity Reconnaissance
Biodiversity Management Plan
Environment Plan
Soil Morphology & Type
Readily Available Water
Soil Profile
Whole Farm Plan
Historical Review
Readily Available Water

Challenges
0 The past two seasons have been below average
winter rainfalls, hence earthworm activity and
What we've been doing microbial activity would have been reduced,
0 Soil samples were collected from monitoring sites possibly skewing results achieved to date.
on pilot tomato farms, native reference sites prior to 0 Trash is often burnt as a method of pest and
planting and post harvest each year. disease control, particularly for cut worm and
0 Samples were analysed for microbial biomass, bacterial canker. At the same time however, several
microbial activity, protozoa, fungi, actinomycetes growers were found to be effectively controlling
and bacteria. these problems without trash burning or using
0 Tomato plant root samples have been collected at excessive pesticides.
harvest for mycorrhiza colonization.
0 Soils were sampled several times per year for Next steps
earthworm activity & biomass. 0 Continue to monitor earth worm activity, biomass
0 Surface and subsurface soils were sent to the and microbial activity under a range of production
laboratory for full chemical analysis each season methods.
(pre-planting and post harvest). 0 Implement organic matter retention strategies.
0 Conduct industry research into “perceived” links
What we've learnt between pest and disease control associated with
0 Results indicate that where organic matter levels trash burning.
were high, microbial activity levels were 0 Facilitate further mycorrhiza studies with University
correspondingly high. of Adelaide.
0 Fungi levels were notably lower in paddock sites
compared with native undisturbed monitoring sites,
possibly due to cultivation and/or fungicide sprays.
0 Actinomycetes (filamentous bacteria) were higher
in cultivated fields than native sites at all 4 sampling
periods.
0 Protozoa levels were higher in cultivated fields.
0 Microbial quotient is likely to be a useful soil micro
organism parameter.
0 Earthworm numbers (density and biomass) were
higher on soils with >1% organic carbon (OC) or >2
% organic matter. Earthworm activity was also
higher during the growing season on tomato beds
at 10 to 20 cm, rather than 0 to 10 cm.
0 Dry seasonal conditions over the past 2 years may
have contributed to low earthworm counts in all
areas.
0 Mychorriza colonisation was higher on soils with
higher organic matter levels.
0 Organic carbon levels for paddock soils ranged
from 0.5 to 2.5 % OC, while native reference soils
ranged from 0.6 to 3.2 % OC.
0 Subsoils on several farms were sodic (>5%
exchangeable sodium), many farm sub soils had
elevated soil chloride levels at depth.
Unilever Sustainability Indicator Key Learning’s
Soil Fertility & Health
Page 15 Milestone 5 Report, August 2002

Challenges
0 Transitioning growers from rotary hoe and other
aggressive equipment to less destructive methods
What we've been doing requires capital investment.
0 Developed whole farm plans with contours (slope). 0 A combination of best management practices will
0 Evaluated the months soil is bare or void of be required to reduce cultivations.
vegetation and cover. Months of bare soil may be 0 Australian summer rainfall events and seasonal
an important consideration for soil erosion and conditions make cultivating for weed control
water recharge to underground “rising” water difficult, clods on beds result from cultivating moist
tables. soils.
0 The number and type of cultivations have been
reviewed for all growers. Next steps
0 The total number of traffic movements including 0 Review cultural practices with growers.
cultivation, spraying, fertilizing, harvesting were 0 Discuss cultivation techniques, review soil
recorded. responsiveness to gypsum etc for growers with
0 The amount of soil delivered to the factory and higher export soil rates.
recorded for each load of tomatoes delivered. 0 Focus on final bed preparation.
0 Develop methods to reduce clods for a range of
What we've learnt Australian tomato soils.
0 Tomato farms in Australia are on relatively flat
landscapes, so that erosion from surface water
movement is minimal.
0 A number of tomato farms have recycle systems for
surface water, hence soil eroded from surface soils
is often caught in drains on farm.
0 Most farms had medium to heavy clay textured
soils, hence were less susceptible to erosion.
0 It is difficult to explain differences in cultivations,
other than to suggest it relates to the diversity within
the grower community & their approaches to land
management. Several growers who had higher
average yields tended to have a lower number of
cultivation’s and traffic movements.
0 Several growers utilized a lilleston bar cultivator
instead of rotary hoe (less destructive).
0 Tomato bed preparation and removal of soil clods
from the top of beds is important to reduce harvest
soil loss. Soil type played an important role with
sodic hard setting soils contributing more soil (up to
0.89 t/ha/yr). These hard setting soils are likely to
be responsive to higher gypsum application rates.
0 Growers cultivating in wet or moist conditions for
inter row weed control tend to create clods of soil on
beds.
Soil Loss
Milestone 5 Report, August 2002, Page 16

with high K). However, are we mining a natural “non renewable resource” wisely?0 Fertilizer application equipment calibration needs
What we've been doing critical review and documentation.0 Reviewed Choice of fertilizers used, Rates of 0 Several growers using furrow irrigation water run
application, Application methods, Frequency of urea with a paddle wheel applicator mounted over application and Timing. the channel. Given inefficiencies in water 0 Reviewed use of renewable fertilizer sources. application, fertilizer application rates across the 0 Conducted shallow and deep soil profile sampling field are considered highly variable and inefficient.
and analysis prior to planting and post harvest for 0 Fertilizer injection into drip irrigation systems on each season. several farms did not allow for irrigation lag times, 0 Harvested replicate segments of crop (fruit, foliage and so fertilizer distribution uniformity on drip
and root systems) and sent samples to laboratory systems for several farms was found to be poor for nutrient analysis. (<70%).0 Developed nutrient budgets for each pilot farm for
Nitrogen (N), Phosphorous (P) and Potassium Challenges(K). 0 Most growers use contract spreaders for pre plant 0 Conducted nitrate (NO ) leaching studies and fertilizer, many of these contractors lack industry 3
accreditation for equipment calibration.developed climatic (& irrigation) water balance.0 A number of scientists have been working on soil 0 Evaluated ground water NO levels on farms and 3
assessment methods for estimating the labile P surrounding areas.pool, a P sorption test method is currently under review but not yet available.What we've learnt0 Limited research is available to advise on the 0 A range of rates of nitrogen are applied to tomatoes
responsiveness of South Eastern Australian soils (130 to 300+ kg/ha N).to applied K.0 Use of legumes such as clover pasture or lucerne 0 Many growers in the industry consider shallow soil provide biologically fixed (natural) nitrogen in a
test to be sufficient, few conduct nutrient budgets.rotation.0 Several growers have lost faith in soil testing due to 0 On several farms higher rates of nitrogen were
conflicting results from Australian laboratories applied than the crop utilized.and/or poor advice.0 A significant proportion of fertilizer nitrogen is 0 Using soil testing on a frequent and regular basis applied prior to the first watering on several farms,
requires ability to collect profile soil samples (need leading to extenuated leaching losses during the drilling rig) and would elevate cost of sampling.wet up period.
0 Leaching losses on one farm was estimated to be Next steps>200 kg/ha N.0 Promote the annual use of deep and shallow soil 0 Nitrate leaching studies utilized ceramic cups to
testing for all growers on dominate soil types extract solute soil solution at depth in soil profile, Introduce nutrient budgeting principles to assist in failing to account for preferential flow, which is fine tuning fertilizer rates.considered important for the deep cracking clays 0 Establish permanent monitoring sites and improve present on these farms. Further research is
grower soil test and fertilizer record management.required as leaching estimates are “indicative 0 Calibrate and document procedures associated estimates” only at this stage.
with efficient use of fertilizers.0 Phosphorus budgets for each farm highlight that 0 Implement the Fertilizer Industry Federation of rates applied ranged from 30 to 210 kg/ha P, where
Australia “Cracking the Nutrient Code” as part of P removal rates ranged from 30 to 45 kg/ha P.EMS.0 Significant amounts of applied P is believed to 0 Suggest some growers cut back the rates of become rapidly unavailable in Australian soils.
nitrogen and phosphorus applied.Current soil test methods provide an indication or 0 Trial the use of potassium fertilizers and evaluate estimate of the labile (or plant available) pool of P.
crop responses (& any links to improved soluble Relatively low levels of P were found at depth with solids).soil sampling. Low levels were found in ground 0 Evaluate renewable and organic fertilizer options water, indicating that for these tomato soils P
available on the Australian market to identify any leaching is minor.scientifically credible and cost effective 0 Most growers applied no potassium to tomato soils, alternatives. Our goal could be to substitute 10-despite rates of up to 500 kg/ha K being exported in 20% of the manufactured fertilizer with renewable fruit and trash (burnt). South Eastern Australian sources on each farm.soils are naturally high in potassium (clay minerals
Nutrient Management
Page 17 Milestone 5 Report, August 2002

0 Broad-spectrum insecticides are widely used, often
these chemicals are reported in literature to be
disruptive to wider ecosystems and beneficial What we've been doing insects.
0 Consulted with industry specialists and crop scouts 0 Fungicide usage has increased in recent years, about IPM issues for tomatoes. particularly the use of inorganic sprays (copper).
0 Scouted 5 pilot farms for two seasons to understand 0 Insecticide rates decreased (in ai/kg) but toxicity pests. (EIQ) has not decreased.
0 Developed inventories for each major insect, disease 0 Grower spray records were found at times to be and weed present on tomato farms. inaccurate and often incomplete.
0 Desktop study of lifecycle and habits of pests. 0 European and U.S. chemicals lists of concern due to
ecotoxicity and safety issues were compared with 0 Set sticky, pheromone and pitfall traps for insects in pilot farm spray programs over the past 3 seasons. tomato fields.Results highlighted the possibility of a major impact
0 An insect taxonomist was used to identify and count to the Australian industry, should use of these beneficial and pest insects observed on traps.pesticides be withdrawn locally.
0 Collected pesticide spray records from growers.0 Chemical storage, handling, equipment calibration,
0 Studied pesticide eco toxicity, maximum residual spray records and waste management are issues limits (MRL's), environmental fate for pesticides used. requiring further focus on most farms.
0 Reviewed pesticides used in Australia with schedules Challengesof concerned (suspect) pesticides by USA EPA and
0 Perceived linkage between burning of trash and pest European authorities.control methods needs to be classified.
0 Modelled the the surface water impact of pesticides 0 Need to have crop scouts monitor beneficial insect applied.
populations other than Trichogramma wasps. 0 Tested plant tissue (trash) and fruit for pesticide
0 Further research into trap or sacrificial crops is residues.required.
0 Tested ground water and sub soil (>60 cm) for 0 Insect resistance is increasing to several broad pesticide residues.
spectrum chemical sprays and industry lacking What we've learnt registered alternatives.
0 The IPM program currently utilised by growers are 0 Capital costs are associated with the transition from
predominantly chemical dependant. aircraft applied to ground applied chemicals. Furrow
0 Some of the basic requirements of an IPM program irrigated growers may not be able to transition to
are present, such as defined economic thresholds for ground spray rigs short term (until change over to drip)
major pests, however there are significant gaps in the given extended furrow saturated periods and vehicle
implementation of all the key principles of a access.
biointensive IPM program. Gaps include; thorough 0 Capital costs associated with building chemical
understanding of pest lifecycles, preventative storage & handling facilities fit for purpose, meeting all measures such as habitat management for Australian government standards.beneficials and availability of IPM compatible
Next stepschemicals.0 Trial the use of trap crops (e.g. chick peas to trap
0 A number of the research/technology transfer Heliothis moths) on tomato farms.programs currently used by the Australian industry 0 Need to identify beneficial insects and control promote chemical dependent IPM programs.
methods other than Trichogramma that can be 0 Minimal monitoring of beneficial insects.
cultured and/or strategically released to reduce Trichogramma wasps monitored are often ineffective industry total dependence on chemical based pest in controlling Heliothis in the early months of year control.when this major pest is a key concern.0 Providing standards for
0 Industry lacks a predictive disease model to support c h e m i c a l s t o r a g e , reduction in fungicide applications.handling and waste
0 Crop scouting records are variable. Not all scouts management.appear to use industry established thresholds.
0 Continue to monitor 0 Heliothis moths is the main pest needing control. MRL's.
Pest Management
Milestone 5 Report, August 2002, Page 18
indicators selected requiring external service
provider to establish baseline information and
initiate monitoring for each grower.What we've been doing0 Frog samplings for abnormalities was restricted
0 Conducted reconnaissance survey of biodiversity due to lack of summer rain, need to sample for frogs on all pilot farms.during or following rain at night. Further research
0 Developed biodiversity stock take maps for each required to gain useful data set for discussion on farm.frog abnormalities.
0 Researced global and Australian literature on 0 Perennial vegetation may provide help to growers biodiversity indicators and assessment methods.
in managing rising water tables.0 Identified a wide range of flora and fauna indicators,
and filtered them on basis of primary and Challengessecondary criteria.0 Growers were concered over removing productive
0 Selected mostly flora based indicators of land for biodiversity enhancement.biodiversity because of the variability of the 0 For biodiversity to be enhanced effectively for presence of fauna for non grower related reasons
tomato farms, wider regional adoption of (seasonality etc).enhancement goals needs to occur (involving the
0 Assessed and evaluated biodiversity indicators on neighbours). 5 pilot farms.0 Unilever's goal short term involves “no further net
0 Developed biodiversity enhancement plans based loss” and then to establish a “net gain” position for on indicator results and grower consultation.key indicators. In order to be able to quantify “no net
0 Identified regional and catchment goals for loss” a baseline needs to be established.biodiversity and linked farm goals to wider priorities 0 Paying for the establishment of native vegetation where possible.
and grower access to government funds.0 Identified presence of endangered species.
0 Recent dry winters have restricted the Created flora species lists.effectiveness of vegetation reestablishment
0 Reviewed birds on and around farms and their activities.linkage with processing tomato crop.
Next stepsWhat we've learnt0 Further frog monitoring this season.
0 Biodiversity is present on all farms to some extent.0 Implement biodiversity enhancement plans for
0 Larger and wider areas of native vegetation are of each pilot farm and monitor their progress.greater value than narrow strips for fauna habitat (& 0 Assist the wider Unilever grower community to corridors), stock shelter and ground water
evaluate their farm biodiversity, establish species interception.lists, maps and monitoring systems and develop
0 Some management practices present on farm pose enhancement plans (goals & targets).a risk to native vegetation (clearing, alteration of 0 Identify opportunities to participate and link with natural drainage patterns, chemical spray drift etc).
regional biodiversity strategies.0 Areas dedicated to native vegetation can be
enhanced without taking out significant areas of
productive land (use of fence lines, paddock
corners, road sides etc).
0 Biodiversity enhancement can provide a range of
ecosystem benefits.
0 Ground water tables in and around large areas of
native vegetation were generally significantly
deeper than in areas void of vegetation.
0 Perennial vegetation may provide assistance to
growers in managing rising water tables.
0 Biodiversity is a specialist area, with several of the
Biodiversity
Page 19 Milestone 5 Report, August 2002

Challenges
0 Understanding factors influencing Lycopene in
tomatoes and how to positively influence levels in
What we've been doing fruit.
0 Measured tomato yields on target monitoring 0 Maintaining high yields as achieved under drip
blocks for each grower. irrigation whilst improving soluble solids levels.
0 Reviewed pilot farm average yields, highest and 0 The need to strike a balance between yield and
lowest. quality (if there is a trade off, how can growers be
0 Reviewed soluble solids levels achieved (brix). compensated for yield penalty?).
0 Collected processor yield and soluble solids
records. Next steps
0 Evaluated fruit quality for lycopene and other 0 Improve scheduling and uniformity of water
nutrient value qualities. application for drip irrigated tomatoes.
0 Assessed fruit for pesticide and heavy metal 0 Trial inducing water stress post flowering in
residues. patterns similar to those observed with furrow
irrigation.
What we've learnt 0 Assist growers with low yields to identify best
0 Yields ranged from 49 to 140 t/ha. management practices to improve.
0 Yields generally higher for tomatoes grown on drip
irrigation.
0 Mainly Heinz varieties bred for high viscosity and
tomato sauce manufacture are used in Australia.
0 While these varieties display a number of beneficial
attributes such as extended vine storage and crack
resistance to rain, these varieties have low soluble
solids (Brix) and do not appear as adaptable to
Australian summer rains, local soils or drip
irrigation.
0 Tomato varieties with low soluble solids present a
significant problem for the Australian industry,
particularly for processors such as Unilever, as the
yield recovery from raw tomatoes to tomato paste is
significantly lower than that achieved with high brix
varieties.
0 Soluble solids levels in fruit were lower on drip
irrigated tomatoes (not new news).
0 No significant difference was found in Lycopene
levels in ripe fruit between growers, despite
differences in plant variety, suggesting that
Lycopene levels may be influenced by factors other
than soil and variety.
0 Pesticide levels in fruit, including wild card samples
taken randomly around each growers property
were below MRL's both seasons.
0 Heavy metals do not at present pose a significant
risk to fruit quality. There is a need to monitor
fertilizer heavy metal contents and conduct periodic
shallow soil tests.
Product Value
Milestone 5 Report, August 2002, Page 20

drip versus furrow irrigated crops. The role of
organic matter levels and DU need to be further
understood also.
What we've been doing 0 Gaining accurate fuel use efficiency figures for
0 Worked with the Australian Greenhouse Office. some farms will be challenging given the number
0 Conducted an initial audit on 23 mixed production of farm implements and tractors etc.
tomato farms.
0 Conducted detailed review across 15 tomato Next steps
farms. 0 Recommend industry research into trash burning
0 Evaluated existing farm practices contributing to and pest management.
greenhouse emissions including fuel use, 0 Gather information on machinery efficiency, work
cultivation practices, nitrogen fertilizer use, rate and fuel use per hectare.
livestock. 0 Research renewable energy options further and
0 Evaluated potential for denitrification on 15 farms, link producers of bio-diesel with tomato growers
including irrigation methods, irrigation scheduling for trials.
technology. 0 Conduct field based research into greenhouse
0 Conducted extensive literature study to better emissions, particularly denitrification losses
understand greenhouse emissions for irrigated associated with nitrogen fertilizer and water use.
agriculture.
What we've learnt
0 A number of farms had inefficient irrigation
practices resulting in anaerobic soil conditions,
potentially leading to denitrification and nitrous
oxide release to atmosphere.
0 >80% of growers burnt cereal and tomato trash
due to perceived benefits in pest management
control.
0 Trash burning also contributes to greenhouse
emissions.
0 Fuel use efficiency information for farm
implements (l/ha & work rate hrs/ha) was
generally unavailable.
0 No renewable sources of energy are currently in
used, other than wind generator for one growers
pump shed. Bio-diesel from oil seed extraction is
emerging as a potential cleaner fuel substitute to
diesel.
0 Increasing areas under permanent native
vegetation can offer significant carbon sink
opportunities (potentially tradable carbon credits).
0 More research is required regarding estimation of
greenhouse emissions associated with mixed
tomato farming systems, particularly nitrous oxide
(denitrification) release.
Challenges
0 Field research is required to gain accurate
estimates of greenhouse emissions. Particularly a
better understanding of denitrification losses in
Energy
Page 21 Milestone 5 Report, August 2002

flushing of laterals and sub mains resulted in
several systems clogging up.
0 Ground water tables on several farms have risen
What we've been doing from 20+ metres to <1.5 m below the soil surface
0 Using flow sensors to monitor irrigation timing, in the past 30 years due to changes in catchment
frequency, duration for drip irrigation farms. water balance (removal of trees and replacement
0 Using soil profile moisture devices (set at 10, 30, with shallow rooted annual crops using less water
50 and 80 cm soil depths) to understand etc).
effectiveness and impact of irrigations. 0 Tomato paddock test wells did appear to rise from
0 Using field weather stations to gather evapo- 1.5 to 0.6 metres during the tomato growing
transpiration data for use in a theoretical crop season, possibly a localised effect of inefficient
water use model. water use/delivery.
0 Developing a net drainage model for each pilot 0 Further research into winter cover crops between
farm based on irrigation and rainfall data, soil consecutive processing tomato seasons needs to
characteristics, evaporation and crop water use. occur. Currently tomato fields are void of
0 Measuring tail water volume loss, particularly from vegetative cover in high rainfall winter periods,
furrow irrigated farms. extenuating leaching losses to rising water tables.
0 Installing and monitoring ground water test wells. 0 Several farms need to install adequate tail water
Also gaining access to irrigation supply company drainage and pump recovery systems.
test wells and historical test well data.
0 Analysing tail water quality, surface water quality Challenges
leaving farms, ground water quality for nutrients 0 Transitioning from furrow to drip irrigation has
and pesticide residues. significant capital costs for growers.
0 Measuring drip irrigation system Distribution 0 Government funding is required to help install
Uniformity (DU), hydraulic design characteristics, ground water test wells.
maintenance methods etc. 0 Overhead irrigation systems may offer a way of
avoiding soil saturation (water logging) to establish
What we've learnt tomato crops. Labour costs, capital costs and
0 Water use ranged from 3.5 to 12 mega litres per practicalities need evaluating.
hectare. 0 Managing ground water issues effectively will
0 Water use efficiency ranged from 6.7 to 24.2 involve each tomato farmer adopting a no net
tonnes of fresh tomatoes per ML of water ground water recharge strategy. However isolated
(irrigation & summer rainfall). farmer improvement in reducing excessions to
0 The first watering up period is most significant in ground water tables is unlikely to have any
terms of saturating the soil profile and extenuating significant impact; a wider regional or catchment
leaching losses. Partly due to inefficiency with strategy is required, involving neighbours and other
furrow and some drip systems. catchment stakeholders in a coordinated effort to
0 Drip irrigated farms generally applied less water lower ground water levels.
per hectare than furrow.
0 Irrigation systems for furrow are generally poor Next steps
due to variability in soil type influencing water 0 Promote wider use of irrigation scheduling
penetration, wheel compaction etc. techniques including objective soil moisture meters
0 Drip irrigation systems can be very efficient in and weather data.
delivery of water, with one farm having DU's >90% 0 Evaluate water holding capacities and soil profile
(worlds best practice), particularly given that this impeding layers for tomato soils. Need to know the
grower designed the system himself and the drip Readily Available Water content of each soil on
tube was 22 years old, having been retrieved and each farm.
replaced at least 6 times! 0 Evaluate drip irrigation systems for DU.
0 Poor irrigation design advice offered to several
growers resulted in under sizing of sub mains and
poor DU's. Lack of regular maintenance and
Water Management
Milestone 5 Report, August 2002, Page 22

In recent years a wide array of management systems continuous improvement steps include: Plan, Do,
have been knocking on Australian farm gates, each with Measure and Improve (PDMI). PDMI and other
thei r own expectations, performance standards, management system principles will be incorporated into
documentation and systems requirements. the design of the system from the outset.
Accordingly the EMS framework proposed for phase two To further simplify the process of implementation a
of the SAP will focus on key farming activities and detailed legal compliance review will be facilitated by the
processes, adoption of best management practices and project team for environment, food safety and
establishment of farm monitoring programs based on a occupational health & safety. The results of this review
condensed version of the sustainability indicators and presented by key farm activity (spraying, fertilizing,
parameters discussed in this report (& associated maintenance of native vegetation), to enable growers to
appendices). efficiently understand and comply with legislative
requirements. Six monthly and annual reviews of the
Unilever pilot programs world wide are adopting an ISO compliance system are forecast and updates will be
14000 approach to system design, compliance and made available to growers via interactive CD Rom.
assurance. However Unilever and the Australian Pilot
Project Management Team recognise that this ISO The key components of the Unilever management
approach will need to be streamlined to avoid system are likely to include;
inefficiencies often experienced with ISO systems - Facilitating an initial farm environmental review (80%
implementation and maintenance. complete for most Unilever growers),
- Checking and understanding legal obligations,
The Unilever Australasia grower community will provide - Mapping & documenting farm activity processes,
a very important sounding board (reality check) as the procedures (e.g. calibration procedures),
management system development progresses. Several - Setting goals, improvement targets and “must do”
workshops are scheduled with the grower community compliance standards,
prior to the release of the management system, as the - Performance monitoring (sustainability, food safety,
documentation develops and evolves. occupational health & safety), using the sustainability
indicators (& others) and BMP's,
The management system framework will integrate - Self assessment & external reviews,
documentation requirements for farm environmental - Improving based on monitoring results and other key
management systems, food safety assurance and learning's,
occupational health and safety. - Conducting an annual review of progress and
establishing next steps.
In order to minimise the burden management system
paperwork can apply to farm managers a critical review The project management team recognise that the
of likely documentation will occur in the early stages of success of the next phase of this initiative will largely
the next phase. depend on;
- Grower commitment to the process and willingness to
Documentation of chemical, fertilizer and other inputs, adopt best management practices (if & where
crop scout records, soil analysis (& other sustainability required).
parameter monitoring) results, procedures for calibrating - The simplicity of the system and its adaptability to the
equ ipment , and documenta tion required under existing and varied BMP's already in place across the
Australian legislation for storage and handling of industry
dangerous goods will need to be incorporated into the - Adaptability of the system for grower mixed farming
management system. activities.
- The ability to ensure the system meets a range of
It is recognised that integrating management of requirements through a “single” implementation and
sustainability (& other) risks into best practices can be a management process.
challenging task. Many farm managers already employ - The certify-ability of the system to ISO or EUREPGAP
continuous improvement approaches to problem solving and other standards adaptability of system.
during day-to-day management activities. These four
Management System Framework
Page 23 Milestone 5 Report, August 2002

Accordingly, the next phase of this project has 3 What it has meant to our growers so far;
components including; (Quotes in their words)
Building the Integrated Best Management Practice - Awareness that it might be possible to protect the
System environment and still maintain acceptable farm profit
- Develop EMS policy (workshop, document, desktop levels (yet to be tested fully).
publish), - Made us more aware of our impact on the
- Quantify & develop environmental risks matrix environment.
template, - More aware of our fertilizer, chemical and water inputs
- Conduct legal compliance review for landholders (E, etc (measuring).
OHS, QA), - Closer relationship with our processor developed.
- Document BMP's, integrate Unilever global - Bringing us up to standards on health & safety
experience, (particularly safe chemical storage, handling, use and
- Develop farm environmental plans template and record management).
performance tracking tools/systems, - Awareness about the importance of soil health and
- Develop integrated management framework & biodiversity.
process for combining EMS, Occupational Health and - And as one grower said recently, in the past we have
Safety, Food safety and QA into a simple farm changed the environment to suit our practices,
management system, perhaps the future will involve us changing our
- Develop EMS & technical support tools, practices to suit the environment.
- Scope & develop competency based training system,
The Project Roadmap:Implementing the Best Management Practice 0 Final project workshop for phase 1 (August 02),System0 Pilot project team workshop to plan phase 2 (August - Pilot implementation on 5 farms, then use these farms
02),as case study examples of implementation,0 Review indicators for 5 pilot farms and establish - Implementation of management system on farm (plus
improvement goals for 02/03 (September 02),to wider industry post Jul 03),0 Development of EP field monitoring and management - Farm implementation review and internal assessment
system (September 02),(plus to wider industry post Jul 03),0 Implementation of EP monitoring program (Year 1) - External verification & pre-certification audit (plus to
(October 02 to May 03),wider industry post Jul 03).0 Development of the EMS & BMP (August to
December 02),Conducting Environmental Parameter Research0 Development of the training system (October to - Utilizing the 5 benchmark properties from phase 1,
December 02),identify environmental parameter (EP's) for each 0 Start implementation of management system for 5 grower that are non sustainable in value,
pilot farms (January to May 03),- Review current growing expertise & production 0 Industry review of progress at APRTC workshop (May technology,
03),- Propose a “causal” mechanism which has generated 0 Field day workshop on EMS implementation at pilot the EP's in question (those with negative or un-
grower farms (pilot grower lead) (June/July 03),sustainable impacts),0 Release of EMS via training & implementation - Apply the strategy(s) resolved in season 3 (02/03) on
assistance to Unilever Growers (July 03 to July 04),each of the 5 benchmark grower properties monitored 0 Implementation of EP monitoring program (Year 2) during stage 1 and monitor the values of the EP's in
(October 03 to May 04),question,0 Industry review of EMS & EP progress (May 04),- Evaluate the effectiveness of management 0 Implementation for wider tomato industry growers strategy(s) upon EP values and amend the causal
(July 04 to July 05),model.0 Implementation of EP monitoring program (Year 3) - Repeat the above steps for seasons 4 (03/04) and 5
(October 04 to May 05),(04/05)0 Industry review of EMS & EP progress (May 05).- Communicate results and findings via web media,
workshops and grower agronomy nights etc.
Milestone 5 Report, August 2002, Page 24
Looking Forward

Milestone 5 Report, August 2002, Page 25
Appendix 1: Sustainability Enabler Matrix
Soil Fertility & Health 26
Soil Loss 27
Nutrient Management 28
Pest Management 29
Biodiversity 30
Product Value 31
Energy 32
Water Management 33

Sustainability Enabler Matrix – Soil Fertility & Health
Indicator Parameter Who Frequency Best Management Practices
Earth Worm Density G Beginning and end of the tomato phase of
the rotation
Earth Worm Biomass G As Above
Increase organic matter incorporation into soil, avoid burning trash, Incorporate a pasture phase or green manure crop into the rotation, use nutrient amendments high in organic matter (animal manures / composts etc), reduce cultivations, reduce chemical applications e.g. soil fumigants, manage soil to keep pH close to neutral range.
Microbial Quotient G,SP As Above As above Respiratory Quotient G,SP As Above As above Organic Matter G,SP As Above As above Soil Slaking G,SP As Above Increase organic matter, reduce cultivation. Soil Dispersion G,SP As Above Use appropriate rates of gypsum, increase soil organic matter. Soil Salinity G As Above Avoid high chloride fertilizers, apply an irrigation leaching fraction,
monitor ground water tables depth & quality, reduce net discharge of irrigation Below Effective Rooting Zone (BERZ).
Soil Chloride G,SP As Above As above Exchangeable Sodium % G,SP As Above Use appropriate rates of gypsum, leach salts. Calcium : Magnesium Ratio G,SP As Above Increase lime & gypsum inputs. Cation Exchange Capacity G,SP As Above Increase lime, gypsum & organic matter inputs. Cadmium – Heavy Metal G,SP Once Every
10 yrs Select & use low heavy metal phosphate fertilizers.
Lead – Heavy Metal G,SP Once Every 10 yrs
Select & use low heavy metal fertilizers.
Copper – Heavy Metal G,SP Once Every 10 yrs
Select & use low heavy metal fertilizers.
Soi
l Fer
tility
& H
ealth
Mercury – Heavy Metal
G,SP Once Every 10 yrs
Select & use low heavy metal fertilizers.
Legend: P = Processor, G = Grower, SP = External Service Provider
Milestone 5 Report, August 2002, Page 26

Sustainability Enabler Matrix – Soil Loss
Indicator Parameter Who Frequency Best Management Practices
Slope (% Fall) G Once per Field
Maintain ground cover, contour banks leading to grassed water ways, cultivate across slope, convert to drip irrigation, increase organic matter content (decrease erodibilty).
Total Months Bare Soil/Crop G Annual Consider cover crops or between season crop (e.g. annual pasture species), reduce months between initial work up and planting.
Nos Cultivations G Annual Improve timing of cultivations, consider alternative more efficient equipment.
Nos Vehicle Passes G Annual Record paddock activity, reduce cultivations were possible. Post Harvest Compaction Index
SP Bi Annual Reduce cultivations and vehicle passes, consider narrow width large diameter tyres on tractors, increase organic matter content, reduce waterlogging.
Soil Export (t/ha) P,G Annual Improve bed preparation prior to and during crop establishment, avoid cultivating in wet/moist conditions, efficient harvester operation.
Soi
l Los
s
Soil Export (Tonne of Soil per Tonne Tomatoes)
P,G Annual
Improve bed preparation prior to and during crop establishment, avoid cultivating in wet/moist conditions.
Legend: P = Processor, G = Grower, SP = External Service Provider
Milestone 5 Report, August 2002, Page 27

Sustainability Enabler Matrix – Nutrient Management
Indicator Parameter Who Frequency Best Management Practices
% Renewable Fertilizers G Annual Identify suitable renewable / organic products, increase levels of organic matter incorporation.
Applied N Inputs (kg/ha N) G Annual Soil test pre-planting and post harvest, deep soil test (0-10 & 10-60 cm), establish permanent monitoring sites, conduct soil tests for every crop each year, plant tissue/SAP nitrate throughout season, use nutrient budgeting (input/export to modify rates), increase organic matter content, integrate legumes into rotation.
Input : Export N (kg/ha N) G Annual Soil test pre-planting and post harvest, deep soil test (0-60 cm), establish permanent monitoring sites, every crop every year soil test, plant tissue/SAP nitrate throughout season, use nutrient budgeting (input/export to modify rates), increase organic matter content, integrate legumes into rotation.
Applied P Inputs (kg/ha P) G Annual Soil test, apply P close to planting, top ups via drip system. Input : Export P (kg/ha P) G Annual As above Applied K Inputs (kg/ha K) G Annual As above Input : Export K (kg/ha K) G Annual As above Nitrate Leached BERZ (kg/ha N)
G,SP Annual Reduce water movement below the root zone of the crop (no net loss), adopt objective measures of soil moisture status, irrigation scheduling, improve irrigation efficiency through proper design and maintenance of systems (DU%), improve effective rooting zone by strategic moisture stress (RDI), use small frequent applications of N fertilizer to match crop N demand.
Nut
rient
Man
agem
ent
Ground Water Nitrates (mg/L NO3)
G, SP Annual
As above
Legend: P = Processor, G = Grower, SP = External Service Provider
Milestone 5 Report, August 2002, Page 28

Sustainability Enabler Matrix – Pest Management
Indicator Parameter Who Frequency Best Management Practices Ratio (Beneficial’s : Pests) G,SP Annual Increase monitoring frequency & type, use a crop scout, chemical selection to consider
impact on beneficial insects, implement non chemical control measures such as destroying pest habitats.
Total Active Ingredients (kg A.I. /ha)
G Annual Use a crop scout, spray only when pest reaches an economic threshold, ensure proper calibration of chemical application equipment, chemical selection to incorporate impact on beneficial insects.
Total Active Ingredients (kg A.I./tonne)
G Annual As above
Total Insecticides (kg A.I. /ha) G Annual As above
Total Insecticides (kg A.I./tonne)
G Annual As above
Total Herbicides (kg A.I. /ha) G Annual Integrate both chemical and physical weed control methods, Improve control of paddock edge (fencelines) weeds, Improve between crop weed control, eliminate noxious weeds.
Total Herbicides (kg A.I./tonne) G Annual As above
Total Fungicides (kg A.I. /ha) G Annual Use a crop scout, spray when weather conditions are conducive to fungus development rather than routine calendar cover sprays, ensure proper calibration of chemical application equipment
Total Fungicides (kg A.I./tonne) G Annual As above
Nos Insecticide Sprays / Season
G Annual As for Total Insecticides
Nos Herbicide Sprays / Season G Annual As for Total Herbicides
Nos Fungicide Sprays / Season G Annual As for Total Fungicides
Surface Soil Pesticides G,SP At the end of the tomato
phase of the rotation
Keep to label rates, calibrate equipment, control contractors, use ground spray rigs, find alternative to dumping boom clean & other rinsates to ground.
Sub Surface Soil Pesticides G,SP At the end of the tomato
phase of the rotation
As above, reduce leaching
Pes
t Man
agem
ent
Ground Water Pesticides G,SP At the end of the tomato
phase of the rotation
As above, reduce leaching
Legend: P = Processor, G = Grower, SP = External Service Provider
Milestone 5 Report, August 2002, Page 29

Sustainability Enabler Matrix – Biodiversity
Indicator Parameter Who Frequency Best Management Practices
Area of Permanent Vegetation
G,SP Every 5 Years
Allocate non-production areas to permanent vegetation, identifying area that by establishing permanent vegetation will provide other benefits to the farm e.g. stock shelter or water table management, revegetate to extend areas of native vegetation.
Boundary to Area Ratio (B:A)
G,SP Every 5 Years
Establish native vegetation (NV) buffer zones and extend existing areas of native vegetation to make them more block shaped rather than linear.
Vegetation Strata G,SP Every 5 Years
Remove stock that may be affecting certain strata (fencing may be necessary), control weeds and feral vertebrates, revegetation with local species typically found in that area (similar land class or soil type etc), consider fire as a management tool to release seed germination, reduce effects of irrigation, nutrient loading and soil erosion that create the environment favourable for weeds and less favourable for native vegetation.
Species Richness G,SP Every 5 Years
Remove stock that may be affecting certain species (fencing may be necessary), control weeds and feral vertebrates, revegetation with species not present, fire as a management tool to release seed germination, reduce effects of irrigation, nutrient loading and soil erosion that create the environment favourable for weeds.
Conservation Status G,SP Every 5 Years
Reduce effects of irrigation, nutrient loading and soil erosion that create the environment favourable for weeds and less favourable for threatened native vegetation, establish Ecological Vegetation Classes (EVC’s) and native species lists for farm areas, draw maps, initiate species recovery programs (in partnership with Government programs).
Health of Native Vegetation G,SP Every 5 Years
Remove stock from native vegetation areas, avoid spraying chemicals near or over NV, groundwater or salinity management, remove pressure from excessive nutrients (use vegetation buffer zones, review fertiliser use, review leaching - location/flow and amount, revegetate to establish floristic composition to balance the ecosystem, revegetation (new areas or increasing size of existing areas) to buffer existing native vegetation from wind exposure and agricultural practices.
Weed Invasion of Native Vegetation
G,SP Every 5 Years
Weed control programs.
N.V. Feral Fauna G,SP Every 5 Years
Feral fauna control programs.
Frog Abnormalities G,SP Every 5 Years
Reduce pesticide and surfactant contamination of water bodies (related to spraying conditions, drift management, pesticide selection, use of additives and timing of operations).
Bio
dive
rsity
Aquatic Macro Invertebrates G,SP Every 5 Years
Reduce pollution of water with nutrients, heavy metals and pesticides.
Legend: P = Processor, G = Grower, SP = External Service Provider
Milestone 5 Report, August 2002, Page 30

Sustainability Enabler Matrix – Product Value
Indicator Parameter Who Frequency Best Management Practices
Average Yield (t/ha) G Annual Improve input & water management etc. Average Paste Yield (t/ha) G Annual Schedule irrigation based on objective soil moisture meters,
inspect crop regularly for stress, strategically stress crop, optimise N rate, increase K and Mo inputs etc.
Soluble Solids (% Brix) P,G Annual Schedule irrigation based on objective soil moisture meters, inspect crop regularly to check for stress, strategically stress crop, optimise N rate, increase K and Mo inputs etc Processor ability to forecast harvest date and ensure ripe fruit can be harvested at optimum time.
Greens Loss (t/ha) G Annual Variety and harvest timing. Rottens Loss (t/ha) G Annual Processor ability to forecast harvest date and ensure ripe fruit
can be harvested at optimum time. Lycopene (kg/ha) P,G,SP Annual Select varieties higher in Lycopene. Copper Residues (mg/kg) P,G,SP Annual Reduce fungicide sprays close to harvest where possible. Cadmium Residues (mg/kg) P,G,SP Annual
Mercury Residues (mg/kg) P,G,SP Annual
Lead Residues (mg/kg) P,G,SP Annual
Select low heavy metal fertilizers, soil and fruit quality test periodically.
Chlorothanonil Residues (mg/kg)
P,G,SP Annual
Total Endosulfan Residues (mg/kg)
P,G,SP Annual
Dithiocarbamate Residues (mg/kg)
P,G,SP Annual
Pro
duct
Val
ue
Cypermet Residues (mg/kg) P,G,SP Annual
Observe label rates and withholding periods, monitor MRL’s, prevent spray drift from neighbouring crop.
Legend: P = Processor, G = Grower, SP = External Service Provider
Milestone 5 Report, August 2002, Page 31

Sustainability Enabler Matrix – Energy
Indicator Parameter Who Frequency Best Management Practices
Fuel – Diesel (l/ha) G Annual Monitor & record fuel use and work rate per hectare, upgrade equipment when possible, reduce number of traffic activities per crop, Match tractor and implement draft requirements, gear up and throttle back.
Fuel – Diesel (l/tonne) G Annual Monitor & record fuel use and work rate per hectare, upgrade equipment when possible, reduce number of traffic activities per crop, Match tractor and implement draft requirements, gear up and throttle back.
Electricity (kW/ha) G Annual Monitor electricity use, identify efficiency savings with appliances (particularly pumps).
Electricity (kW/tonne) G Annual As above Cultivation CO2 (t/farm) G Annual Reduce cultivations where possible (from 17 to 14) Burnt Tom. Trash t CO2/Farm
G Annual Mulch trash – don’t burn.
Burnt Cereal Trash t CO2/Farm
G Annual Mulch trash – don’t burn.
CO2 Sinks (Native Veg) (t/farm)
G,SP Every 3 Years
Enhance native vegetation in concentrated areas as per biodiversity enhancement plans.
Ene
rgy
Net CO2 Emissions/Year
G Annual
All of the above. Legend: P = Processor, G = Grower, SP = External Service Provider
Milestone 5 Report, August 2002, Page 32

Sustainability Enabler Matrix – Water Management
Indicator Parameter Who Frequency Best Management Practices
Irrigation System Efficiency (DU%)
G Every 3 Years
Transition from flood to trickle, check irrigation system uniformity, avoid telescoping submains, flush submains and blocks regularly.
Eff. Rooting Depth (m) G Every 5 Years
Identify and remove where possible sub soil physical and chemical barriers e.g. remove hardpans with deep ripping, salinity or calcium carbonate layers.
Profile RAW (mm/profile) SP Every 10 Years
Increase soil organic matter levels.
Volume Applied (meg/ha) G Annual Use irrigation scheduling techniques to finetune water applications, reduce frequency of watering’s for drip irrigation.
Volume Applied (meg/tonne) G Annual As above. % Tail Water Loss G,SP Annual Increase emitter spacing, consider overhead sprinkler for first
wet up?, improve irrigation system DU. Net Loss (% BERZ) (BERZ = Below Effective Rooting Zone)
SP Annual Monitor profile soil moisture, improve DU, plant winter active deep rooted crop prior to planting to dry profile, practice RDI to stress crop, promote increased effective rooting depth etc.
Ratio Theoretical :Applied G,SP Annual Schedule with weather station and ET as well as soil moisture sensors.
GW Salinity (dS/m) G,SP Annual As above GW Chloride (mg/L Cl) G,SP Annual As above
Wat
er M
anag
emen
t
GW Nitrate (mg/L NO3) G,SP Annual
Improve water and nitrogen use efficiency.
Legend: P = Processor, G = Grower, SP = External Service Provider
Milestone 5 Report, August 2002, Page 33

Milestone 5 Report, August 2002, Page 34
Appendix 2: Draft Indicator Results
Soil Fertility & Health
Soil Organic Carbon %
Worms
Microbial Quotient
Soil Loss & Erosion Potential
Harvest Soil Loss
Nutrient Management
% Renewable Fertilizers
Applied Nutrients
Nutrient Input to Export Ratio
Nutrients in Ground Water
Nitrate Leaching Below the Effective Root Zone
Pest Management
Beneficial:Pest Insect Ratio
Active Chemical Ingredients Per Hectare
Active Chemical Ingredients Per Tonne
Soil Pesticide Residues (Surface Soils)
Soil Pesticide Residues (Sub Soils)
Ground Water Pesticide Residues
AI Residues in Tomato Residues
Tomato Trash Pesticide Residues
Biodiversity
Area Permanently Vegetated
Boundary:Area Ratio
Vegetation Strata
Species Richness
Conservation Status
Health of Native Vegetation
Weed Invasion
Feral Fauna
Frogs
Aquatic Macro Invertebrates
Product Value
Processing Tomato Yields
Energy
Diesel Use
Cultivation and Traffic Movements
Water Management
Irrigation Distribution Uniformity
Irrigation Volume Applied Per Season
Irrigation Tail Water Loss
Ground Water Depth & Quality

Key Crops TomatoesIndicator Soil Fertility And Health
Parameter Soil Organic Carbon %Status
Functions/Relevance
Enablers
Method
Results
Actions
Soil Organic Carbon %
0.0
0.5
1.0
1.5
2.0
2.5
Org
anic
Car
bon
%
00/01 2.4 1.0 0.9 1.1 1.3 0.0 0.0 0.0 0.0 0.0 1.4 1.5 1.0 0.0 0.0 0.7
01/02 2.2 0.9 0.7 1.0 1.1 0.0 0.0 0.0 1.5 0.0 0.0 0.0 0.0 0.0 0.8 0.5
G 1 G 2 G 3 G 4 G 5 G 6 G 7 G 8 G 9 G 10 G 11 G 12 G 13 G 14 G 15 Ave
A recognised laboratory method used to estimate soil organic carbon.Common indicator for all tomato soils.
Soil organic carbon is an estimate of the soil organic matter (humus) content. Soil organic matter plays an important part in the soil's physical fertility contributing to good soil structure and water holding properties. Organic carbon also contributes a large proportion of soil nutrients for plant uptake such as nitrogen and sulfur.
Retention of crop residues.Reduced cultivation.Green manure crops.Application of animal manures and composts.Not burning cereal and tomato trash.
Soil samples are taken from the cultivation layer (0 - 20cm depth) from permanently marked monitoring sites and analysed in a laboratory using the Walkley and Black (1947) method for the 5 core growers.
Typically low soil organic carbon levels were found on the farms involved in the review. Most farms burn crop residues and employ aggressive cultivation practices (e.g. rotary hoe). It is likely that if crop residues were retained and intensive cultivation practices reduced, soil organic carbon levels could increase over the long term. Increases in organic carbon levels will have benefits for soil structure and water holding capacity, while also increasing soil nutrient reserves held in organic matter.It is interesting to note that Grower 1 incorporates crop residues back into the soil every year and also has higher organic carbon levels when compared with other pilot farms and also the nearby native vegetation site. Of the 5 core farms involved in the review, 2 farms had greater tomato field soil organic carbon levels compared to nearby native vegetation sites, 2 farms had lower and 1 was the same as the nearby native vegetation. The native sites generally had low soil organic carbon. The production and cycling of native plant biomass is often limited by rainfall for significant parts of most years. The native site associated with grower 1 had the highest values of 2.2 & 2.0% over the two years. The average soil organic carbon percentage for each of the other native sites varied between 0.9 - 1.3%.
Encourage industry research into pest and disease issues associated with crop residue retention.Investigate making use of winter rainfall to grow green manure crops prior to planting tomatoes the following spring.Investigate analytical methods which estimate the labile portion of soil organic matter such as the Carbon Management Index put forward by Blair, Lefroy & Lisle (1995).
Australian Tomato Indicator Results 2002.xls Soil Organic Carbon 2/09/2002

Key Crops TomatoesIndicator Soil Fertility And Health
Parameter WormsStatus
Functions/Relevance
Enablers
Method
Results
Actions
Worm levels
0
20
40
60
80
100
120
Cou
nt/s
q. m
Sep-Nov 00 100 0 0 0 80 36
Sep-01 36 1.3 0 10 10 11.46
Grower 1 Grower 2 Grower 3 Grower 4 Grower 5 Average
A new parameter under development as an indicator of biodiversity and soil fertility & health.
Earthworms are not only responsive to the soil environment, but also influence it.Their presence and abundance are often linked to farm management practices including organic carbon management, cultivation and chemical use.
Minimise soil cultivation.Improve soil organic matter levels.Manage soil to keep pH close to neutral range.
Sample in early spring when the soil is moist. Sample soil at 10 cm and 20 cm depth. Sift worms from the soil and count the number of worms collected. Convert the counts to worms per square metre. Weigh the worm samples from each collection point.
Sampling at 0-10 cm depth in the tomato paddocks in September- November 2000 and September 2001 are presented in the graph below.
A large variation has occurred between sites and seasons. Farm thresholds and the ideal time of year to sample are yet to be finalised. Below average winter rainfalls over the past two seasons may have influenced low levels observed on grower results. Low organic matter levels may have also had an influence for grower 2 in particular.
The threshold and sampling time has yet to be finalised and further worm sampling is required to do this.Field sampling on all five pilot farms over the next 3 seasons.
Australian Tomato Indicator Results 2002.xls Worms 2/09/2002

Key Crops TomatoesIndicator Soil Fertility And Health
Parameter Microbial QuotientStatus
Functions/Relevance
Enablers
Method
Results
Actions
Soil Microbial Quotient
0
2
4
6
8
10
12
%
Paddock Nov 00 3.12 2.31 2.32 6.43 3.40 3.55
Native Nov 00 3.45 3.61 3.92 3.09 6.99 3.52
Paddock Mar 01 3.70 3.48 3.32 6.56 4.47 4.31
Native Mar 01 2.96 3.63 10.41 2.65 5.03 4.94
Paddock Sept 01 3.14 6.44 3.01 8.06 9.47 6.02
Native Sept 01 4.42 3.76 7.67 3.73 6.10 5.14
Paddock Mar 02 2.73 4.65 3.60 7.10 4.38 4.49
Native Mar 02 7.20 3.33 5.87 4.05 7.90 5.67
G 1 G 2 G 3 G 4 G 5 Ave
A useful indicator of changes in soil microbial status. Reported to be a better indicator than microbial biomass carbon as it helps in avoiding problems associated with absolute values and comparing across different soil types and environments.
There is a 2 way relationship between the soil micro-organisms and agricultural production. As soil micro-organisms play a key role in a number of nutrient transformation processes, crop residues form the essential supply of carbon (energy source) and nutrients for microbial activity. The activity of soil organisms can be divided into 4 functions:Regulation of organic matter and nutrient cycling (N, P, & S),Biological degradation of agricultural chemicals,Formation and maintenance of soil structure,Interaction with plants via disease transmission, disease suppression and biocontrol of plant pathogens and insect pests.
Reduced tillage.Crop residue retention.Crop rotations.Application of fertilizers and pesticides.Irrigation.Reduced soil compaction.
Permanent monitoring sites were sampled to a depth of 20cm and kept cool prior to pre-incubation in the dark at 25oC for 10 days at an adjusted moisture level.Microbial quotient (MQ) is microbial biomass carbon / organic carbon expressed as a percentage.Microbial biomass carbon were determined using chloroform fumigation extraction of pre-incubated soils as per the methods of Amoto and Ladd (1988) and Sparling et al. (1993). Soil organic carbon methodology is described earlier.
There is no ideal value to indicate whether a soil is "healthy" or not but on a comparable soil type if the MQ value for a particular management is less than the reference value then it could be regarded as unfavourable.There seems to be an increase in the MQ values in the March 2001 samples from paddock sites compared to November 2000. This clearly indicates that plant residues from the harvested tomato crop are causing a significant increase in the total amount of soil micro-organisms.The average values for MQ for native soils were higher than those for paddock soils at both post harvest sampling times. The soil systems with the lower MQ suggest the presence of a soil condition that has restricted the build-up of microbial biomass and loweredmicrobial activity i.e. the presence of a "stress condition" such as agricultural chemicals on microbial activity.The paddock sample from Grower 4 was higher in MQ at 3 out of the 4 sampling times compared to the other grower paddocks. This grower also consistently produces high yields. Further work is required to determine if there is a cause and effect relationship between soil microbial activity and high yielding tomatoes.
Further work is required to expand the understanding of soil microbial activity and quantify the linkages with high yielding tomatoes. Issues such as identification of beneficial and non beneficial soil microbes requires greater definition. The impact specific agriculturachemicals and agricultural practises have on soil microbial activity also requires further clarification.
Australian Tomato Indicator Results 2002.xls Microbial Quotient 2/09/2002
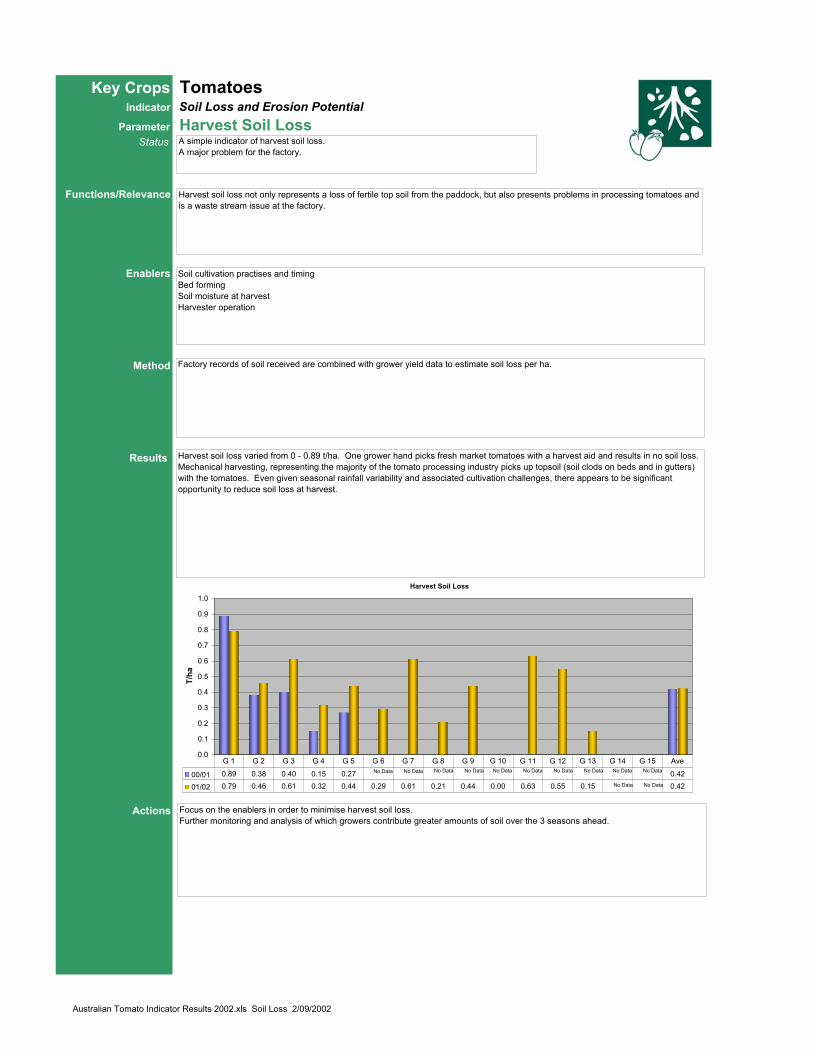
Key Crops TomatoesIndicator Soil Loss and Erosion Potential
Parameter Harvest Soil LossStatus
Functions/Relevance
Enablers
Method
Results
Actions
Harvest Soil Loss
0.0
0.1
0.2
0.3
0.4
0.5
0.6
0.7
0.8
0.9
1.0
T/ha
00/01 0.89 0.38 0.40 0.15 0.27 0.42
01/02 0.79 0.46 0.61 0.32 0.44 0.29 0.61 0.21 0.44 0.00 0.63 0.55 0.15 0.42
G 1 G 2 G 3 G 4 G 5 G 6 G 7 G 8 G 9 G 10 G 11 G 12 G 13 G 14 G 15 Ave
A simple indicator of harvest soil loss.A major problem for the factory.
Harvest soil loss not only represents a loss of fertile top soil from the paddock, but also presents problems in processing tomatoes and is a waste stream issue at the factory.
Soil cultivation practises and timingBed formingSoil moisture at harvestHarvester operation
Factory records of soil received are combined with grower yield data to estimate soil loss per ha.
Harvest soil loss varied from 0 - 0.89 t/ha. One grower hand picks fresh market tomatoes with a harvest aid and results in no soil loss. Mechanical harvesting, representing the majority of the tomato processing industry picks up topsoil (soil clods on beds and in gutters) with the tomatoes. Even given seasonal rainfall variability and associated cultivation challenges, there appears to be significant opportunity to reduce soil loss at harvest.
Focus on the enablers in order to minimise harvest soil loss.Further monitoring and analysis of which growers contribute greater amounts of soil over the 3 seasons ahead.
No Data No DataNo Data No Data No Data No DataNo Data No Data No Data No Data
No Data No Data
Australian Tomato Indicator Results 2002.xls Soil Loss 2/09/2002

Key Crops TomatoesIndicator Nutrient Management
Parameter % Renewable FertilizersStatus
Functions/Relevance
Enablers
Method
Results
Actions
% Renewable Fertilizer Used
0
10
20
30
40
50
60
70
80
90
100
% o
f Tot
al F
ertil
izer
Inpu
ts /
Seas
on
00/01 0.00% 0.00% 0.00% 0.50% 0.00% 0.00% 0.00% 0.00% 0.00% 0.00% 0.00% 0.00% 0.00% 0.00% 0.00% 0.03%
01/02 0.00% 0.00% 0.00% 0.00% 0.00% 0.00% 0.00% 0.00% 0.00% 0.00% 0.00% 0.00% 0.00% 0.00% 0.00% 0.00%
G 1 G 2 G 3 G 4 G 5 G 6 G 7 G 8 G 9 G 10 G 11 G 12 G 13 G 14 G 15 Ave
A relatively new measure of nutrient management under development.
Most conventional fertilizers are manufactured from non renewable resources. Natural gas is combined with nitrogen from the air in the presence of catalysts to produce ammonia from which other products are manufactured. Phosphate rock is mined from the earth and is the basic material used in production of most phosphatic fertilizer. Potassium is mined from minerals such as sylvinite and refined to produce products such as potassium chloride and potassium sulfate.Natural gas, phosphate rock and sylvinite have finite reserves and are not being rapidly replaced.
Currently there are few if any renewable fertilizers commercially available in the region. Further work is required to identify and trial renewable fertilizers to determine their agronomic and environmental performance.
Grower fertilizer application records were gathered and renewable products identified based on supplier product information.
There is currently little use made of renewable fertilizer sources. The only renewable fertilizer identified on the review farms was earth worm castings.
Further work is required to identify and trial renewable fertilizers to determine their agronomic and environmental performance.Trial work is forecast for this coming season.
Australian Tomato Indicator Results 2002.xls % Renewable Fert 2/09/2002

Key Crops TomatoesIndicator Nutrient Management
Parameter Applied NutrientsStatus
Functions/Relevance
Enablers
Method
Results
Actions
Chemically Manufactured Fertilizer Inputs
0
50
100
150
200
250
300
350
400
Fert
ilize
r Inp
uts
/ Sea
son
(kg/
ha)
N 00/01 133 210 230 178 218 0 0 0 0 0 0 0 0 0 0 194
N 01/02 128 311 249 199 160 184 149 275 314 173 275 182 204 389 201 226
P 00/01 171 29 210 139 94 0 0 0 0 0 0 0 0 0 0 129
P 01/02 79 145 104 158 72 52 160 130 107 220 121 130 92 260 45 125
K 00/01 0 0 12 26 0 0 0 0 0 0 0 0 0 0 0 8
K 01/02 0 0 0 0 0 0 0 0 0 144 46 0 0 0 300 33
G 1 G 2 G 3 G 4 G 5 G 6 G 7 G 8 G 9 G 10 G 11 G 12 G 13 G 14 G 15 Ave
Widely used crop nutrient input measure.
Nutrient inputs can have a significant impact on the productivity and profitability of tomatoes. When nutrient inputs are either under or over applied, there can also be significant environmental consequences in the long term.
In applying nutrients to the soil, managers have control over:Choice of product,Rate of application,Application method,Frequency of application,Timing of application.
Grower fertilizer application records were gathered and converted to the nutrients applied (N, P & K) based on a the product analysis provided by the fertilizer supplier.
Nutrient rates varied significantly between growers. Nitrogen, phosphorus and potassium rates varied from 128 - 389 kg/ha, 29 - 260 kg/ha and 0 - 300 kg/ha respectively. Refer to the input export ratio for a yield comparison.Fertilizer application methods included broadcast, banded and fertigation techniques. Nitrogen was generally split into several applications ranging from 2 - 50 applications starting from either preplant or at planting and extending through the period of crop growth. Small frequent applications were generally associated with drip irrigation methods whereas furrow irrigation methods typically had 2 applications of nitrogen.The majority of the phosphorus was generally applied either preplant and/or at planting. In a limited number of drip irrigation situations, a small amount of phosphorus was sometimes applied in products such as phosphoric acid through the growing season. This may be done for disease control reasons rather than strictly from a crop nutrition point of view.Potassium is generally not applied to tomatoes on the farms reviewed. The soils are generally considered to be high in potassium.Growers generally rely on past experience and local trial / demonstration work to guide nutrient inputs. There is limited use of shallow soil testing and plant analysis.
Greater use of objective methods to guide nutrient inputs i.e. shallow and deep soil testing, plant tissue analysis and nutrient budgeting techniques.
Australian Tomato Indicator Results 2002.xls Nutrient Inputs 2/09/2002

Key Crops TomatoesIndicator Nutrient Management
Parameter Nutrient Input to Export RatioStatus
Functions/Relevance
Enablers
Method
Results
Actions
Fertilizer Input:Export Ratio
-1.0
1.0
3.0
5.0
7.0
9.0
11.0
13.0
15.0
Rat
io
N I:E 00/01 1.7 1.5 1.0 1.1 1.2 0.0 0.0 0.0 0.0 0.0 0.0 0.0 0.0 0.0 0.0 1.3
N I:E 01/02 1.7 1.1 1.5 1.7 0.8 1.1 0.9 2.1 0.0 1.4 1.5 1.0 0.0 2.7 1.0 1.2
P I:E 00/01 12.4 4.3 6.6 1.2 9.5 0.0 0.0 0.0 0.0 0.0 0.0 0.0 0.0 0.0 0.0 6.8
P I:E 01/02 6.5 3.3 7.2 6.9 3.3 2.3 7.4 7.4 0.0 12.9 5.0 5.5 0.0 13.0 1.7 5.5
K I:E 00/01 0.1 0.0 0.1 0.0 0.0 0.0 0.0 0.0 0.0 0.0 0.0 0.0 0.0 0.0 0.0 0.0
K I:E 01/02 0.0 0.0 0.0 0.0 0.0 0.0 0.0 0.0 0.0 0.7 0.2 0.0 0.0 0.0 0.9 0.1
G 1 G 2 G 3 G 4 G 5 G 6 G 7 G 8 G 9 G 10 G 11 G 12 G 13 G 14 G 15 Ave
A new and useful tool to estimate relative nutrient inputs and exports in fruit.
A useful audit and planning tool to assess the balance of nutrient inputs and losses in exported fruit when soil fertility is close to optimum. Ideally the nutrient input to export ratio would equal one given there are no other nutrient losses in the system. This tool is of little relevance when soil nutrients are very low as fertility will need to be increased in order to obtain optimum crop yields (i.e. nutrient inputs will need to be greater than nutrient losses). Conversely if soil fertility is very high, the system could be mined for a period of time until the soil nutrient level falls close to the optimum level at which time maintenance rates of nutrients may be appropriate.
Shallow and deep soil testing, tissue testing, nutrient budgeting, Choice of product, Rate of application, Application method, Frequency of application, Timing of application.
Refer to the Fertilizer Industry Federation of Australia code entitled "Cracking the Nutrient Code" for additional information.
The nutrient input to export ratio is the ratio of nutrient inputs and exports in fruit. The nutrient input is described in the Nutrient Input parameter sheet.The nutrient export is estimated from the yield of tomatoes and the nutrient concentration of tomato fruit.
Nitrogen phosphorus and potassium input: export ratios varied from 0.8 - 2.7, 1.2 - 13.0 & 0 - 0.9 respectively.It would appear that in a situation where the nitrogen input:export ratio is high, there is potential for large losses of nitrogen (eg. leaching, denitrification and burning of crop residue) and opportunity to use this nitrogen fertilizer more efficiently. Being a soluble and mobile element, soil water management can have a large impact on efficient use of soil nitrogen.Phosphorus input:export ratios are generally higher than the other nutrients. Issues such as soil fixation of soluble phosphorus into forms which are unavailable to the plant may contribute to higher ratios. Again it would appear that there is considerable scope for more efficient use of phosphorus inputs. Alternative products and application techniques may need to be explored in order to achieve greater plant uptake efficiencies. Typically no potassium fertilizer is applied to tomatoes on the farms reviewed. Soil potassium levels are often cited in literature as being high and hence have no requirement for fertilizer. Currently the industry is mining the soil resource. At some stage the potassium which is removed in tomatoes will need to be replaced. Monitoring of soil and plant potassium levels will be critical in order to prevent the soil resource being depleted too far. Determining at what point potassium fertilizer will need to be applied may need further clarification.
Greater adoption of shallow and deep soil testing, plant tissue analysis and nutrient budgeting techniques. Trialing use of applied potassium.
Australian Tomato Indicator Results 2002.xls Input Export Nutrient Ratio 2/09/2002

Key Crops TomatoesIndicator Nutrient Management
Parameter Nutrients in Ground WaterStatus
Functions/Relevance
Enablers
Method
Results
Actions
Ground Water Nutrient Levels
-3
2
7
12
17
22
27
32
37
42
mg/
L
NO3 00/01 17.48 4.45 40.55 8.65 4.29 15.08
NO3 01/02 13.53 0.07 2.24 14.57 9.33 7.95
PO4 00/01 0.06 0.12 0.03 0.41 0.13 0.15
PO4 01/02 0.12 0.02 0.09 0.19 0.43 0.17
G 1 G 2 G 3 G 4 G 5 Ave
A simple indicator of nutrient management performance.
Mobile nutrients such as nitrate can move past the crop root zone in soil water and may contribute to pollution of ground water rendering the water unsuitable for some uses. Monitoring of nutrients in ground water over time is a useful indicator of the environmental impacts of agricultural practice.
The following enablers will assist in reducing nutrient loss to ground water; shallow and deep soil testing, plant analysis, nutrient budgeting, Choice of fertilizer products, Rate of application, Application method, Frequency of application, Timing of application.In general terms, small frequent applications of nitrogen fertilizer are likely to result in reduced loss of nitrate to ground water compared to a large single application. The following enablers will assist in reducing water loss below the root zone of the crop:objective measures of soil moisture such as neutron probes, capacitance probes and time domain reflectrmetry to assist with irrigation scheduling. A well designed and managed drip irrigation system is likely to improve water use efficiency compared to furrow irrigation methods.
Test wells were installed in each pilot monitoring paddock. The nutrient concentration of ground water and depth to ground water was measured at monthly intervals during the growing season and then averaged.
The World Health Organisation (WHO) has given a limit of 10 mg/L of nitrate N as the maximum allowable concentration for human consumption. As can be seen in the graph below, several properties exceeded the WHO limit for drinking water.It would appear that there is opportunity to improve management of nitrogen and water inputs in order to reduce loss to ground water. Phosphorus levels were much lower than nitrogen levels in ground water and are not of concern at this point. Even though practices in the fields where the test wells were located may influence ground water nutrient levels, it is likely that neighbouring paddocks and properties may also impact ground water nutrient levels in the test wells.
Improved irrigation methods (drip), general irrigation scheduling and nitrogen fertilizer management will be the areas to focus on in order to reduce nutrient loss to ground water.
Management of ground water depth is likely to be of much greater significance in terms of sustainable agriculture and the impact on other ecosystems compared to nutrient levels in ground water in this area. Ground water levels are generally rising bringing native chloride and other salts closer to the soil surface which can have a devastating impact on the productivity of agricultural and native ecosystems. Future effort should largely focus on management of ground water depth with ground water nutrient levels being a minor component.
Australian Tomato Indicator Results 2002.xls Ground Water Nutrients 2/09/2002

Key Crops TomatoesIndicator Nutrient Management
Parameter Nitrate Leaching Below the Effective Root ZoneStatus
Functions/Relevance
Enablers
Method
Results
Actions
Estimated Nitrates Leaching Below the Effective Root Zone
0
50
100
150
200
250
300
kg/h
a N
NO3 00/01 88 39 4 7 1 28
NO3 01/02 272 59 12 9 8 72
G 1 G 2 G 3 G 4 G 5 Ave
An estimate of nitrate nitrogen lost from the crop by leaching which may pollute ground water.
Soil nitrate which moves in solution beyond the depth which the plant roots can access is lost and contributes to pollution of ground water. Valuable fertilizer is wasted when leaching occurs.
The following enablers will assist in reducing nutrient loss to ground water; shallow and deep soil testing, plant analysis, nutrient budgeting, Choice of fertilizer products, Rate of application, Application method, Frequence of application, Timing of application.In general terms, small frequent applications of nitrogen fertilizer are likely to result in reduced loss of nitrate to ground water compared to a large single application. The following enablers will assist in reducing water loss below the root zone of the crop: objective measures of soil moisture such as neutron probes, capacitance probes and time domain reflectrmetry to assist with irrigation scheduling; greater awareness of the plant available water in the root zone of the crop; a well designed and managed drip irrigation system is likely to improve water use efficiency compared to furrow irrigation methods.
Ceramic tipped cups are placed in the soil at 0.4, 1.0 & 1.8m depths in replicates or clusters (5 or more) at the start of the season. The tips are placed under a vacuum in order to obtain a sample of the soil solution at the various depths down the profile typically on a 3 weekly basis. The nitrate nitrogen concentration of the sample is then determined. Daily rainfall, irrigation water applied and surface water runoff were measured in order to estimate the water remaining on the paddock. Daily crop evaporatranspiration water use is estimated from weather station data, crop factors and % ground cover estimates. The difference between daily water remaining on the paddock and daily crop evaporatranspiration water use after accounting for the water holding capacity of the soil in the root zone is assumed to move beyond the maximum depth plant roots achieve for the season. The product of the daily water moving beyond the plant root zone and the nitrate nitrogen concentration of the soil solution at the maximum depth the plant roots achieve for the season is used to estimate nitrate nitrogen leaching in kg/ha.
The method described above provides an indicative estimate of nitrate nitrogen which has been leached beyond the root zone. Limitations of the method used include:Ceramic suction cups take "snap shot" samples of the nutrient concentration of the soil solution (as opposed to continuous sampling). Nitrate in soil solution may pulse down the soil profile, not necessarily flowing evenly all the time.The estimates of soil water moving beyond the plants roots was calculated as the difference between the irrigation water remaing on the field and estimated crop evapotranspiration loss. The project budget did not allow for direct measurement.Ceramic tipped cups take no account of preferential flow of soil water down the soil profile through cracks in the soil. This may have been significant in the furrow irrigated crops, particularly grower 3.For growers 4 & 5 the water table rose to within 70 cm of the soil surface with the plant roots exploring the top 60cm of the profile. As a result, the 40 cm suction cups were above the lower depth of the root zone and the 1 m suction cups which were below the rootzone would have sampled diluted leachate (ground water) and hence the estimates of total leaching loss may be underestimated. It is interesting to note that the largest leaching loss came from a drip irrigation system in which the plant roots only achieved a depth o35 cm. A combination of excessive irrigation waterings and nitrogen fertilizer also contributed to the higher losses. A crop failure resulting in resowing of the paddock contributed to the large loss in the 01/02 season for Grower 1. Grower 2 & 3 were both furrow irrigated crops. The main difference between the furrow growers related to Grower 2 having higher nitrogen concentrations. Typically50% of the leaching loss occurred in the first drip irrigation for growers 4 & 5 due to the need to completely saturate the beds in order to establish the resulting crop. For Growers 2 - 5, the ceramic tipped cup sampling depth for the two seasons was different as only two depths (0.4 & 1.8m) were installed in the first season. If the second season three depths (0.4, 1.0 & 1.8m) were installed to improve the accuracy of the estimates.
Irrigation method, general irrigation scheduling and nitrogen fertilizer management will be the areas to focus on in order to reduce nutrient loss to ground water.
Alternative ways of achieving crop establishment in drip irrigation rather than completely saturating the tomato beds after seeding / transplanting need to be investigated in order to reduce deep drainage early and improve water use efficiency e.g. use of overhead irrigation for the first watering.
Evaluate alternative method of estimating nitrate leaching e.g. ion exchange resin leaching boxes.
Australian Tomato Indicator Results 2002.xls Nitrate Leaching 2/09/2002

Key Crops TomatoesIndicator Pest Management
Parameter Beneficial:Pest Insect RatioStatus
Functions/Relevance
Enablers
Method
Results
Actions
Ratio of Beneficial to Pest Insects
0.00
0.20
0.40
0.60
0.80
1.00
1.20
1.40
Rat
io
00/01 1.21 0.62 0.89 0.93 0.46 0.82
01/02 0.61 0.89 0.92 0.90 1.02 0.87
Grower 1 Grower 2 Grower 3 Grower 4 Grower 5 Average
Use of pheromone and sticky traps provides indications of changes in the diversity of flying insects in tomato crops.The presence of a high proportion of beneficial insects is indicative of a balanced ecosystem.Biointensive IPM or Integrated Pest Management (non chemical reliant IPM) relies on beneficial insects to help control pests. The more diverse the population of beneficial insects, the better the probability of successful pest control without the need for pesticides. Changes in the beneficial:pest insect ratio over a number of seasons gives indication of the impact of the pest management program over time.
Use crop scouts to provide regular in field monitoring of pests and beneficial insect populations.Use pesticides only when pest pressure reaches the economic spray threshold.When available use selective pesticides, which only affect the target organism, rather than broad spectrum pesticides which have an adverse effect on a beneficial insects.Implement non-chemically dependent IPM strategies such as control of non crop pest habitats.
Place yellow sticky traps in the crop on stakes at canopy height.Remove and replace the traps on a fortnightly basis.Trapped insects are identified and classed by an insect taxonomist as being either beneficial, pest or as having no effect. Tally up the total numbers of beneficial and pest insects for each paddock and calculate the ratio.Pheromone traps, which are specific for the two main tomato pests (Helicoverpa armigera and Helicoverpa punctigera), are used to determine the proportions of the two moths in the crop. H. armigera has shown a level of resistance to most of the main insecticide groups.
Traps are selective and only give an indication of the changes in the populations of trappable flying insects, not changes in the ratio ofall species.There does not appear to be a good correlation between increases in the proportion of beneficial insects and decreases in the total insecticidal active ingredient applied (see AI per ha).
Collect and collate trap data for non crop areas to give an indication of the possible impact of pest control programs on the surrounding environment.Identify the range of beneficial insects species present and determine their role in processing tomato production.Further research into the selection of pesticides and their effects on beneficial organisms.Wider adoption of independent crop scouts.Examining modifications which can be made to the environment surrounding crops to encourage beneficial insects.Study the possibilities of using trap crops (such as chick peas) in reducing pest pressure in the crops.
Threshold
The tomato processing industry in Australia predominantly relies on chemical based pest control methods, which often have a negative effect on beneficial insects.Limited use is made of beneficial insects in providing pest control in processing tomatoes in southern Australia.Only one naturally occurring beneficial insect (Trichogramma ) is monitored, and no attempts made to supplement its population on farms with strategic releases or habitat enhancement.
Australian Tomato Indicator Results 2002.xls Beneficial to Pest Ratio 2/09/2002

Key Crops TomatoesIndicator Pest Management
Parameter Active Chemical Ingredients Per HectareStatus
Functions/Relevance
Enablers
Method
Results
Actions
Active Ingredients/Hectare Tomatoes
02468
101214161820
Act
ive
Ingr
edie
nt (k
g / H
ecta
re)
Ins 00/01 1.23 1.76 2.25 2.84 1.13 1.84
Ins 01/02 1.11 0.33 2.98 0.84 2.23 1.50
Her 00/01 1.12 0.03 5.38 2.25 1.33 2.02
Her 01/02 0.00 0.75 1.70 0.00 0.00 0.49
Fung 00/01 3.36 6.71 9.27 10.32 12.25 8.38
Fung 01/02 6.60 6.20 17.78 11.49 12.64 10.94
Grower 1 Grower 2 Grower 3 Grower 4 Grower 5 Average
Common indicator used in Australian processing tomatoes.
Provides a breakdown of the amounts of pesticides applied in terms of active ingredient (A.I.) per hectare of tomatoes.A readily available measure that is essential for further applied pesticide toxicity calculations.Allows a comparison of pesticide usage to be made between growers and seasons.
Using crop scouting to accurately determine pest pressure and the use of valid economic spray thresholds.Ensuring spray equipment is properly calibrated.Using non chemical pest control method such as physical cultivation and destroying pest habitats.Improving the accuracy of data recording.
Grower spray records, which should contain the date of application, trade name of product used and the rate applied, are obtained. This data, along with manufacturer's information on the concentration of A.I. in the product, are used to calculate the kilograms of A.I. applied per hectare for each individual paddock.
A single grower used a soil fumigant (fum) for both seasons studied (Metham Sodium). The normal application rate of active ingredient for the fumigant is 84.6 kg/ha, which is high in comparison to the typical rates used for other pesticides. Fungicides formed the major proportion of the balance of pesticides applied. Most fungicides are applied on a preventative basis and require a good coverage and relatively high rates of active ingredient.The average rate of application of insecticide (Ins) and herbicide (Her) in A.I./ha decreased in the second season studied, whilst the total kilograms of A.I./ha of fungicides (fung) increased.The records of herbicide applications are incomplete for some growers, as some pre-planting sprays are not necessarily recorded by all growers.Some of the grower spray records are incomplete, with data on rates of application, area sprayed and accurate product details missing.Accuracy of spray rig calibration has an impact on the amount of pesticide physically applied to a paddock, as well as spraying paddocks in inappropriate weather conditions (extremely hot or windy).A reduction in the total A.I./ha applied to a paddock will not necessarily result in a reduction in the overall hazard to the environment, as a high volume of low toxicity pesticide can be exchanged for a low volume highly toxic compound.
Improving the quality and accuracy of the data recorded in grower spray diaries.Ensuring spray application equipment is accurately calibrated and documented.Establish reliable predictive models for diseases to reduce the reliance on blanket (feel good) preventative fungicidal treatments.Determine that there is a correlation between crop spray recommendations and actual practices.
Active Ingredients/Hectare Tomatoes
0
10
20
30
40
50
60
70
80
90
Act
ive
Ingr
edie
nt (k
g / H
ecta
re)
Fum 00/01 0 0 0 0 84.6 16.92
Fum 01/02 0 0 0 0 84.6 16.92
Grower 1 Grower 2 Grower 3 Grower 4 Grower 5 Average
Australian Tomato Indicator Results 2002.xls AI per HA 2/09/2002

Key Crops TomatoesIndicator Pest Management
Parameter Active Chemical Ingredients Per TonneStatus
Functions/Relevance
Enablers
Method
Results
Actions
Active Ingredients/Tonne Tomatoes
0.000.100.200.300.400.500.600.700.800.901.00
Act
ive
Ingr
edie
nt (
kg/T
onne
)
Ins 00/01 0.01 0.02 0.02 0.02 0.01 0.02
Ins 01/02 0.01 0.00 0.03 0.01 0.02 0.02
Her 00/01 0.01 0.00 0.06 0.02 0.01 0.02
Her 01/02 0.00 0.01 0.02 0.00 0.00 0.01
Fung 00/01 0.04 0.07 0.10 0.07 0.13 0.08
Fung 01/02 0.08 0.09 0.19 0.10 0.11 0.12
Fum 00/01 0.00 0.00 0.00 0.00 0.9 0.18
Fum 01/02 0.00 0.00 0.00 0.00 0.74 0.15
Grower 1 Grower 2 Grower 3 Grower 4 Grower 5 Average
Common indicator in processing tomatoes in Australia.
Provides a breakdown of the amounts of pesticides applied in terms of active ingredient (A.I.) per tonne of tomatoes.A readily available measure that gives a comparison of the potential level of pesticide contamination of fruit from different sources and allows an estimation to be made of the possible residue levels in processing waste products.
Using crop scouting to accurately determine pest pressure and the use of valid economic spray thresholds.Ensuring spray equipment is properly calibrated.Using non chemical pest control method such as physical cultivation and destroying pest habitats.Improving the accuracy of data recording.Maximising crop yields.
Grower spray records, which should contain the date of application, trade name of product used and the rate applied, are obtained together with the yield per hectare. This data, along with manufacturer's information on the concentration of A.I. in the product, are used to calculate the kilograms of A.Iapplied per tonne of tomatoes for each individual paddock.
Fumigants provide the greatest proportion of the average applied A.I./tonne, although only one of the five growers studied used it. Insecticides and herbicides make up the smallest proportion of the average applied A.I./tonne.
Improving the quality and accuracy of the data recorded in grower spray records.Ensuring spray application equipment is accurately calibrated and documented.Establish reliable predictive models for diseases to reduce the reliance on blanket preventative fungicidal treatments.Determine that there is a correlation between crop spray recommendations and actual practices.
Australian Tomato Indicator Results 2002.xls AI per Tonne 2/09/2002

Key Crops TomatoesIndicator Pest Management
Parameter Soil Pesticide Residues (Surface Soils)Status
Functions/Relevance
Enablers
Method
Results
Actions
Maximum Detected Pesticide Residues in Surface Soils (0 to 20 cm)
0.00
0.05
0.10
0.15
0.20
0.25
0.30
Act
ive
Ingr
edie
nt (m
g/kg
)
Endo 00/01 0.06 0.03 0.00 0.25 0.00 0.07
Endo 01/02 0.02 0.00 0.00 0.16 0.00 0.04
Dimeth 00/01 0.00 0.00 0.00 0.00 0.00 0.00
Dimeth 01/02 0.00 0.00 0.00 0.00 0.00 0.00
Cyper 00/01 0.00 0.00 0.05 0.00 0.00 0.01
Cyper 01/02 0.00 0.00 0.00 0.00 0.00 0.00
Delta 00/01 0.00 0.00 0.00 0.00 0.00 0.00
D lt 01/02 0 00 0 00 0 00 0 00 0 00 0 00
Grower 1 Grower 2 Grower 3 Grower 4 Grower 5 Average
Widely used measure of the environmental fate of applied pesticides.
Pesticides in the soil surface (0-20 cm) are a result of current or recent pesticide applications.Testing pre and post season enables monitoring of the possible environmental impacts of that season's pest control program.Results from testing in native sites gives an indication of the background level of environmental contamination and/or the disturbance of natural sites.
Using pesticides only when pest pressure reaches the economic spray thresholds.Selecting pesticides which have the least tendency to leach.Ensuring spray equipment is properly calibrated.Using non chemical pest control methods such as physical cultivation and destroying pest habitats.
Use replicate monitoring sites in both the paddock and native vegetation sites to obtain representative soil samples in the depth range of 0-20 cm.Test samples for a range of pesticides including those known to have been applied to the crop.Record maximum levels of each pesticide, pre and post season against background levels.Pre season residue values were subtracted from the post season results to give an indication of the net change in the level of contamination over the season.
Residue testing picked up traces of Endosulfan in the paddock samples of 3 out of the 5 growers monitored during the 00-01 season, and for two growers during the 01-02 season.Another grower tested positive for traces of Cypermethrin during the 00-01 season.All residue traces found were of insecticides not fungicides, herbicides or fumigants. Net changes in the levels of contamination over a season needs to be considered when assessing the overall effects of the current season's pest control practices. Grower 1 was found to have Endosulfan residues of 15 mg/kg in the 0-20 cm soil depth range in a native reference site. This incident was found by chance and contamination levels are believed to have been related to spray contractor practices.No paddock soil samples exceeded published guidelines for pesticides in agricultural soils.
Expand the residue monitoring program.Increase grower awareness of the possible impact on the environment of the presence of residues.Establish spray application protocols to minimise the likelihood of contamination occurring.Review above data and consider pesticide risk profile for each pesticide detected in agricultural soils. Identify remediation and treatment options also.
Australian Tomato Indicator Results 2002.xls Surface Soil AI Residues 2/09/2002

Key Crops TomatoesIndicator Pest Management
Parameter Soil Pesticide Residues (Sub Soils)Status
Functions/Relevance
Enablers
Method
Results
Actions
Maximum Detected Pesticide Residues in Sub Soils (>60 cm)
0.00
0.05
0.10
0.15
0.20
0.25
Act
ive
Ingr
edie
nt (m
g/kg
)
Endo 00/01 0.00 0.00 0.00 0.00 0.00 0.00
Endo 01/02 0.00 0.00 0.00 0.20 0.00 0.04
Dimeth 00/01 0.00 0.00 0.00 0.00 0.00 0.00
Dimeth 01/02 0.00 0.00 0.00 0.00 0.00 0.00
Cyper 00/01 0.00 0.00 0.00 0.00 0.00 0.00
Cyper 01/02 0.00 0.00 0.00 0.00 0.00 0.00
Delta 00/01 0.00 0.00 0.00 0.00 0.00 0.00
Delta 01/02 0 00 0 00 0 00 0 00 0 00 0 00
Grower 1 Grower 2 Grower 3 Grower 4 Grower 5 Average
An indicator of environmental contamination by pesticides.
Detectable levels of pesticide residues in the sub-soil (>60 cm) are indicative of pesticide overuse.The presence of residues in this part of the soil profile is due to leaching below the root zone, increasing the possibility of contamination of the water table.
Using pesticides only when pest pressure reaches the economic spray threshold.Selecting pesticides which have the least tendency to leach.Ensuring spray equipment is properly calibrated.Using non chemical pest control methods such as physical cultivation and destroying pest habitats.Using irrigation management practices which minimise run-off into ground water.
Use replicate monitoring sites in both the paddock and native vegetation sites to obtain representative soil samples at a depth of >60 cm.Test samples for a range of pesticides including those known to have been applied to the crop.Record maximum levels of each pesticide, pre and post season against background levels.
A single grower was found to have a detectable level of Endosulfan in the sub soil for the 01-02 season. This residue was not present in pre-season sampling, therefore probably arose through the actions of the grower during that period.Grower 1 was found to have a native vegetation site with a maximum residue level for Endosulfan of 17 mg/kg in the >60 cm soil depth. See comments for surface Soil AI Residues.
Expand the residue monitoring program.Increase grower awareness of the possible impact on the environment of the presence of residues.Establish spray application protocols to minimise the likelihood of contamination occurring.Improve irrigation management to reduce excess water movement.
Australian Tomato Indicator Results 2002.xls Sub Soil AI Residues 2/09/2002

Key Crops TomatoesIndicator Pest Management
Parameter Ground Water Pesticide ResiduesStatus
Functions/Relevance
Enablers
Method
Results
Actions
Pesticide Residues in Ground Water
0
1
2
3
4
5
6
7
8
9
10
Act
ive
Ingr
edie
nt (u
g/L)
Endo 00/01 0.00 3.50 4.40 8.60 0.00 3.30
Endo 01/02 0.07 0.00 0.00 2.30 0.00 0.47
Dimeth 00/01 0.00 0.00 0.00 0.00 0.00 0.00
Dimeth 01/02 0.00 0.00 0.00 0.00 0.00 0.00
Cyper 00/01 0.00 0.00 0.00 0.00 0.00 0.00
Cyper 01/02 0.00 0.00 0.00 0.00 0.00 0.00
Delta 00/01 0.00 0.00 0.00 0.00 0.00 0.00
Delta 01/02 0.00 0.00 0.00 0.00 0.00 0.00
Grower 1 Grower 2 Grower 3 Grower 4 Grower 5 Average
Used as an indicator of the contamination of the environment by pesticides.
The presence of pesticides in the ground water indicates potentially harmful environmental contamination, with the potential for the residue to spread further. Aquatic organisms can be easily harmed by the presence of pesticide residues.
Using pesticides only when pest pressure reaches the economic spray threshold.Selecting pesticides which have the least tendency to leach.Ensuring spray equipment is properly calibrated.Using non chemical pest control method such as physical cultivation and destroying pest habitats.Using irrigation management practices which minimise run-off into ground water.
Samples from testwells around the farm property and in the paddock environment are tested for the presence of a range of pesticide residues known to be used for processing tomatoes and associated mixed rotations.
Samples from three growers showed traces of Endosulfan residue for the 00-01 season, Grower 4 test wells showed presence of Endosulfan for the 01-02 season.The level of residue found in the second season tested was lower than the first.The second season had a dryer summer rainfall period. Further work required.
Expand the residue monitoring program.Increase grower awareness of the possible impact on the environment of the presence of residues.Establish spray application protocols to minimise the likelihood of contamination occurring.Improve irrigation management to reduce excess water movement.
Australian Tomato Indicator Results 2002.xls Ground Water AI Residues 2/09/2002

Key Crops TomatoesIndicator Pest Management
Parameter AI Residues in Tomato FruitStatus
Functions/Relevance
Enablers
Method
Results
Actions
Pesticide Residues in Tomato Fruit
0.00
0.50
1.00
1.50
2.00
2.50
Act
ive
Ingr
edie
nt (m
g/kg
)
Chloroth 00/01 0.00 0.00 0.00 0.10 0.01 0.02
Chloroth 01/02 2.11 0.00 0.00 0.00 0.00 0.42
Cypermet 00/01 0.00 0.00 0.00 0.00 0.02 0.00
Cypermet 01/02 0.00 0.00 0.00 0.00 0.00 0.00
Dithioc 00/01 0.00 0.00 0.00 0.00 0.00 0.00
Dithioc 01/02 0.00 0.17 0.06 0.40 0.00 0.13
Grower 1 Grower 2 Grower 3 Grower 4 Grower 5 Average
Widely used indicator of the potential for residues to enter the food chain.
Pesticide residues in fruit pose a potential food safety risk. Chemical residues in fruit can be compared with the maximum permissible concentration (MPC) established for the particular pesticide.
Using pesticides only when pest pressure reaches the economic spray threshold.Selecting pesticides which have short withholding periods later in the growing season.Ensuring spray equipment is properly calibrated.Using non chemical pest control method such as physical cultivation and destroying pest habitats.Check all pesticide withholding periods prior to spraying.
Representative samples of tomatoes are tested for a range of pesticide residues from selected fields.
The maximum residue limits (MRL's) for tomatoes for Chloroth, Cypermet and Dithioc are 10, 0.5 & 3 mg/kg respectively. All the residues detected in the fruit were well below the MRL's.
Continue to monitor residue levels.Implement enablers/BMP's mentioned in Appendix 1.
Australian Tomato Indicator Results 2002.xls AI Residues in Fruit 2/09/2002

Key Crops TomatoesIndicator Pest Management
Parameter Tomato Trash Pesticide ResiduesStatus
Functions/Relevance
Enablers
Method
Results
Actions
Pesticide Residues in Tomato Trash
0.00
0.10
0.20
0.30
0.40
0.50
0.60
Act
ive
Ingr
edie
nt (m
g/kg
)
Deldrin 00/01 0.00 0.01 0.00 0.00 0.01 0.00
Deldrin 01/02 0.00 0.00 0.00 0.00 0.00 0.00
Endo 00/01 0.50 0.17 0.00 0.00 0.00 0.13
Endo 01/02 0.00 0.00 0.00 0.05 0.00 0.01
Cyper 00/01 0.00 0.00 0.22 0.00 0.02 0.05
Cyper 01/02 0.00 0.00 0.00 0.00 0.00 0.00
Fenvalor 00/01 0.26 0.00 0.00 0.09 0.00 0.07
Grower 1 Grower 2 Grower 3 Grower 4 Grower 5 Average
Widely used indicator of the potential for residues to enter the food chain (particularly livestock).
Tomato trash is occasionally fed to livestock, any pesticide residues present on the trash and in surface soils can enter the food chain. Burning or deep incorporating the trash can also disperse the residues through the environment (incorporation is preferred method).
Use pesticides only when pest pressure reaches the economic spray threshold.Select pesticides which have short withholding periods later in the growing season.Ensuring spray equipment is properly calibrated.Using non chemical pest control method such as physical cultivation and destroying pest habitats.Incorporate trash into soil.
Representative samples of tomato trash are tested at harvest for a range of pesticide residues.
The maximum residue limits (MRLs) for primary feed commodities for Cypermethrin, Endosulfan and Fenvalerate are 5, 0.3 and 10 mg/kg respectively, whilst the extraneous residual level (ERL) for Dieldrin is 0.01 mg/kg.Dieldrin residues were found in the trash samples of 2 growers during the 00-01 season, due to historical soil contamination (application in late 1980's). Both are below the ERL.Endosulfan residue for one grower was over the MRL, whilst all the rest of the samples tested below came in below the prescribed MRL.
Continue monitor residue levels.Test residue levels of the livestock which have grazed the trash.
Dieldrin ERL
Endosulfan MRL
Australian Tomato Indicator Results 2002.xls AI Residues in Trash 2/09/2002

Key Crops TomatoesIndicator Biodiversity
Parameter Area Permanently VegetatedStatus
Functions/Relevance
Enablers
Method
Results
Actions
Permanent Vegetation Areas
0.0%
2.0%
4.0%
6.0%
8.0%
10.0%
12.0%
14.0%
16.0%
18.0%
% o
f far
m
00/01 7.5% 7.6% 8.8% 5.5% 10.1% 7.9%
With planned works (05/06) 15.8% 11.8% 9.2% 8.9% 11.9% 11.5%
Grower 1 Grower 2 Grower 3 Grower 4 Grower 5 Average
Common issue on all Australian tomato farms.High importance.
Flora species diversity is greater in larger areas of permanent vegetation than in smaller areas.Below 10% tree cover results in rapid decline of woodland dependant birds and other fauna.Permanent vegetation can play an important role in water table management, with shallow water tables of key concern for growers.
Allocating non-production area to permanent vegetation.Identifying area that by establishing permanent vegetation will provide other benefits to the farm.Revegetation to extend areas of native vegetation.
For each farm, areas that have permanent vegetation (PV) are identified. These areas include:* areas on-farm with remnant native vegetation;* roadsides surrounding the farm (over which landholders have an influence and responsibility);* areas of revegetation on-farm with non-local natives species; (revegetation with local species is included in remnant native vegetation)* woodlots for timber or firewood production.The size (area) of each property is obtained and the area of PV as a percentage of the property size is calculated.
The results are given in the graph below. All properties have high levels of permanent vegetation areas but only Grower 5 has currently met the 10% of property target. With the biodiversity works planned the 10% threshold will be exceeded for 3 properties and the other two will be approximately 9%.
Biodiversity enhancement plans have been developed for each grower involved in the pilot study.See enabler matrix in Appendix 1.
Australian Tomato Indicator Results 2002.xls Area Permanent Vegetation 2/09/2002

Key Crops TomatoesIndicator Biodiversity
Parameter Boundary:Area ratioStatus
Functions/Relevance
Enablers
Method
Results
Actions
Boundary:Area ratio
0.0%10.0%20.0%30.0%40.0%50.0%60.0%70.0%80.0%90.0%
100.0%
% o
f Per
man
ent V
eget
atio
n A
rea
01/02 0.0% 84.3% 48.3% 50.0% 86.3% 53.8%
Grower 1 Grower 2 Grower 3 Grower 4 Grower 5 Average
Not widely discussed but deserving of more consideration.
Blocks or round shaped areas of native vegetation are better for biodiversity than long narrow areas due to effects of microclimate, weed invasion and fauna movement between edges and centre.Native fauna prefer wider areas.
Revegetation to establish buffer zones and extend areas of native vegetation to make them more block shaped than linear.
Calculate the boundary length for each permanent vegetation site, then the boundary:area ratio (B:A), where;B:A = Boundary (m)/Area (ha)For each permanent vegetation site with B:A<400, the sum of their areas is calculated and presented as a percentage of the permanent vegetation areas. Threshold = all permanent vegetation areas (10% of property) with B:A<400.Example: Property has 18.6 ha of permanent vegetation areas, of which 13.2 ha has B:A<400. Percentge of area with B:A<400 = 71.0%.
The results are given in graph below. Grower 2 and Grower 5 have high levels for B:A ratio. Grower 1 had no areas with B:A ratio<400.
Implement biodiversity enhancement plans for the 5 pilot growers.See enabler matrix in Appendix 1.
Australian Tomato Indicator Results 2002.xls BA ratio 2/09/2002

Key Crops TomatoesIndicator Biodiversity
Parameter Vegetation strataStatus
Functions/Relevance
Enablers
Method
Results
Actions
Vegetation Strata
0%10%20%30%40%50%60%70%80%90%
100%
%
2001 13% 43% 41% 35% 43% 35%
Grower 1 Grower 2 Grower 3 Grower 4 Grower 5 Average
Widely recognised as an important but different methods used to assess it.
All layers of vegetation strata present in close proportions to undisturbed native vegetation will maximise habitat value for biodiversity.
Remove grazing that may be affecting certain strata (fencing may be necessary).Control weeds and feral vertebrates.Revegetation with species no longer present.Fire as a management tool to release seed germination.Reduce effects of irrigation, nutrient loading and soil erosion that create the environment favourable for weeds and less favourable for native vegetation.
For each on-farm site compare the % cover of each vegetation strata with the vegetation strata in matching undisturbed EVC’s. The Threshold is when the vegetation strata match is the same as the undisturbed vegetation strata, in which chase the score would be 100%
The results in the graph below show that all properties are lacking in vegetation strata. This indicates a large degree of disturbance.
Implement biodiversity enhancement plans for the 5 pilot growers.See enabler matrix in Appendix 1.
Australian Tomato Indicator Results 2002.xls Vegetation Strata 2/09/2002

Key Crops TomatoesIndicator Biodiversity
Parameter Species richnessStatus
Functions/Relevance
Enablers
Method
Results
Actions
Species richness
0%5%
10%15%20%25%30%35%40%45%50%
%
2001 7% 43% 27% 11% 16% 20.80%
Grower 1 Grower 2 Grower 3 Grower 4 Grower 5 Average
Widely recognised as an important indicator of biodiversity.
High floristic diversity indicates minimum ecosystem disturbance and maximum biodiversity.
Remove grazing that may be affecting certain species (fencing may be necessary).Control weeds and feral vertebrates.Revegetation with species no longer present.Fire as a management tool to release seed germination.Reduce effects of irrigation, nutrient loading and soil erosion that create the environment favourable for weeds and less favourable for native vegetation.
Compares the number of species in the matching Ecological Vegetation Class (EVC) with the number found on each farm site.The species richness per site is calculated as the percentage of species of an undisturbed EVC, and the species richness per property as the total species counted as a percentage of the total number of species in matching EVC’s.
The results in graph below show that for all growers except grower 2 the species richness is at low levels. The high result for Grower 2 is not a common occurrence.
Implement biodiversity enhancement plans for the 5 pilot growers.See enabler matrix in Appendix 1.
Australian Tomato Indicator Results 2002.xls Species richness 2/09/2002
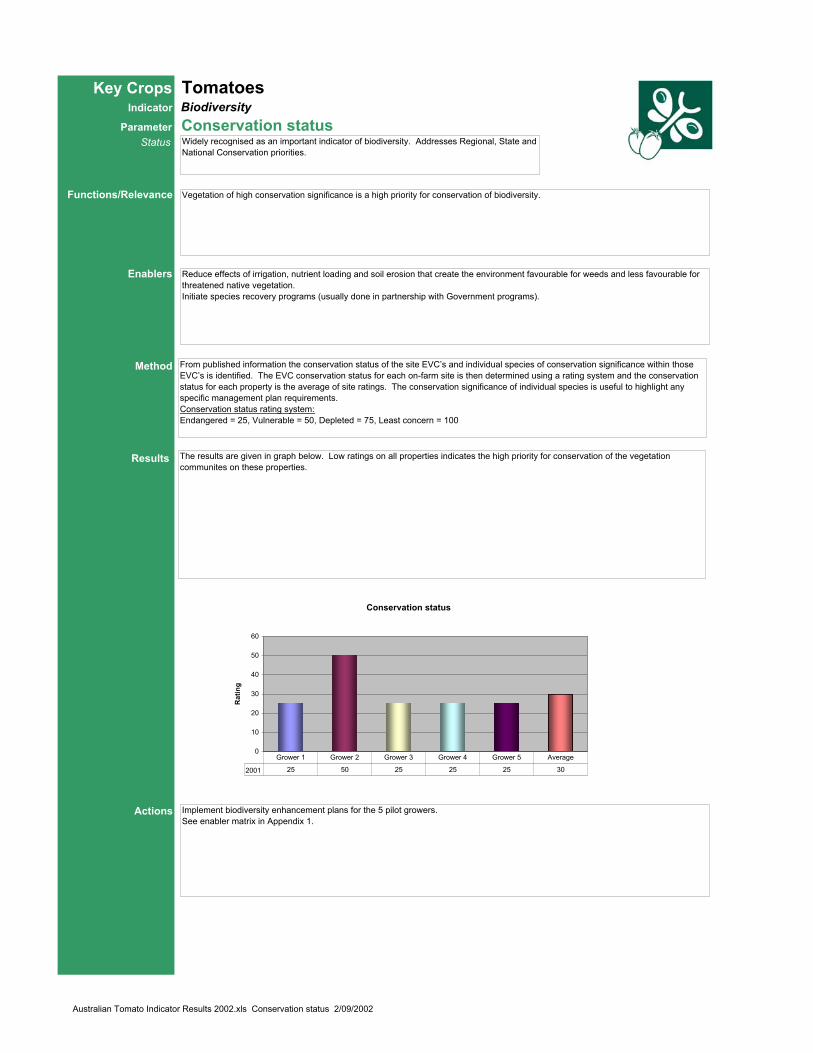
Key Crops TomatoesIndicator Biodiversity
Parameter Conservation statusStatus
Functions/Relevance
Enablers
Method
Results
Actions
Conservation status
0
10
20
30
40
50
60
Rat
ing
2001 25 50 25 25 25 30
Grower 1 Grower 2 Grower 3 Grower 4 Grower 5 Average
Widely recognised as an important indicator of biodiversity. Addresses Regional, State and National Conservation priorities.
Vegetation of high conservation significance is a high priority for conservation of biodiversity.
Reduce effects of irrigation, nutrient loading and soil erosion that create the environment favourable for weeds and less favourable for threatened native vegetation.Initiate species recovery programs (usually done in partnership with Government programs).
From published information the conservation status of the site EVC’s and individual species of conservation significance within those EVC’s is identified. The EVC conservation status for each on-farm site is then determined using a rating system and the conservation status for each property is the average of site ratings. The conservation significance of individual species is useful to highlight any specific management plan requirements.Conservation status rating system:Endangered = 25, Vulnerable = 50, Depleted = 75, Least concern = 100
The results are given in graph below. Low ratings on all properties indicates the high priority for conservation of the vegetation communites on these properties.
Implement biodiversity enhancement plans for the 5 pilot growers.See enabler matrix in Appendix 1.
Australian Tomato Indicator Results 2002.xls Conservation status 2/09/2002

Key Crops TomatoesIndicator Biodiversity
Parameter Health of native vegetationStatus
Functions/Relevance
Enablers
Method
Results
Actions
Health of native vegetation
0102030405060708090
100
Hea
lth ra
ting
2001 65 69 73 97 95 80
Grower 1 Grower 2 Grower 3 Grower 4 Grower 5 Average
Widely recognised as an important indicator of vegetation condition.
Healthy vegetation indicates a healthy ecosystem. Unhealthy vegetation usually indicates the ecosystem is under stress of some kind – such as salinity, waterlogging, wind exposure, overgrazing.Poor vegetation health is represented by foliage dieback, which may be extreme to the point of complete death.
Groundwater or salinity management.Remove pressure from excessive nutrients (use vegetation buffer zones, review fertiliser use, review leaching - location/flow and amount.Revegetation to establish floristic composition to balance the ecosystem.Revegetation to buffer native vegetation from wind exposure and agricultural practices.
Each permanent vegetation site on each farm is evaluated using a rating system and the average dieback rating for the property is calculated.Dieback rating system:More than 90% foliage dieback, including dead vegetation = 0, 50-90% of foliage dieback = 2510-50% of foliage dieback = 50Less than 10% of foliage dieback = 75No visible dieback = 100
The results are given in the graph below. Generally the vegetation is in reasonable health, especially for Growers 4 and 5.
Implement biodiversity enhancement plans for the 5 pilot growers.See enabler matrix in Appendix 1.
Australian Tomato Indicator Results 2002.xls Health of native vegetation 2/09/2002

Key Crops TomatoesIndicator Biodiversity
Parameter Weed invasionStatus
Functions/Relevance
Enablers
Method
Results
Actions
Weed invasion
0102030405060708090
100
Wee
d ra
ting
2001 48 60 58 59 48 55
Grower 1 Grower 2 Grower 3 Grower 4 Grower 5 Average
Perhaps the importance of this indicator is often underestimated.
Weed levels indicate the level of disturbance and influence of agricultural systems on native ecosystems.Weeds compete with native flora often suppressing regeneration of native species.
Weed control programs.
Each permanent vegetation site is rated for weed invasion (see below). Regional lists of ‘Serious’ weed species are obtained and used with the weed rating system. A value for multiple on-farm blocks is determined by summing single block ratings and calculating an average farm rating. Preparation of farm weed lists helps with biodiversity management plans.Weed invasion rating system:More than 50% cover of weeds = 30, or 10 if 'Serious' weeds present25-50% cover of weeds = 50, or 40 if 'Serious' weeds present5-25% cover of weeds = 70, or 60 if 'Serious' weeds presentLess than 5% cover of weeds 90, or 80 if 'Serious' weeds presentNo weeds = 100
The results are given in the graph below. There are high level of weeds requiring significant works programs.
Implement biodiversity enhancement plans for the 5 pilot growers.See enabler matrix in Appendix 1.
100 = no weedsLower values indicate greater amounts
of weeds present
Australian Tomato Indicator Results 2002.xls Weed invasion 2/09/2002

Key Crops TomatoesIndicator Biodiversity
Parameter Feral faunaStatus
Functions/Relevance
Enablers
Method
Results
Actions
Feral fauna
0102030405060708090
100
Abu
ndan
ce ra
ting
2001 100 100 83 100 100 96.6
Grower 1 Grower 2 Grower 3 Grower 4 Grower 5 Average
Unsure
Feral fauna such as Rabbits, Hares and Foxes compete with native fauna and can destroy native vegetation quality.
Feral fauna control programs.
Rate each permanent vegetation site for the feral fauna (rabbits and hares) levels and calculate an average farm rating.Feral fauna rating system:High/severe levels of disturbance (fresh diggings, large burrows), plentiful fresh dung, visible rabbits = 25Moderate levels of disturbance (small burrows), dung present but fresh dung not plentiful, generally few rabbits visible = 50Low levels of disturbance (few, if any burrows apparent), fresh dung absent, generally no rabbit visible = 75None/no evidence of rabbit activity = 100
The results are given in the graph below. Actions for feral fauna control are only required on one property.
Implement biodiversity enhancement plans for the 5 pilot growers.See enabler matrix in Appendix 1.
100 = no feral fauna presentLower values indicate greater amounts
of feral fauna
Australian Tomato Indicator Results 2002.xls Feral fauna 2/09/2002

Key Crops TomatoesIndicator Biodiversity
Parameter FrogsStatus
Functions/Relevance
Enablers
Method
Results
Actions
% Frogs Abnormalities
0102030405060708090
100
Abn
orm
ality
ratin
g
2001 30 77 30 30 20 37.4
Grower 1 Grower 2 Grower 3 Grower 4 Grower 5 Average
New and useful assessment tool.
Frogs are a useful indicator of ecosystem health. Frogs and tadpoles are sensitive to a large number of waterborne pollutants including pesticides. Some chemical pollutants affect tadpole development and can cause deformities in bones and tissue.
Reduce pesticide and surfactant contamination of water bodies (relates to spraying conditions, drift management, pesticide selection, use of additives and timing of operations).
Collect frogs in spring or early summer immediately after a rainfall event. Assess frog abnormality percentage.Percent abnormalities rating system10% or greater abnormality = 109% abnormality = 208% abnormality = 307% abnormality = 406% abnormality = 505% abnormality = 604% abnormality = 703% abnormality = 802% abnormality = 90Less than 2% abnormality = 100
The results in the graph below indicate abnormalities are prevelent on the case-study properties. However, further work is required to determine the cause of the abnormalities and whether the environmental contamination is from off-farm causes and the water coming onto the farms is already toxic to frogs.
Further field work required to assess frog populations on Grower 1, 3 and 4 properties. Samplings scheduled for the coming summer.Implement biodiversity enhancement plans for the 5 pilot growers.See enabler matrix in Appendix 1.
100 = acceptible frog abnormalitiesLower values indicate greater Levels of frog
abnormalities
Australian Tomato Indicator Results 2002.xls Frogs 2/09/2002

Key Crops TomatoesIndicator Biodiversity
Parameter Aquatic macro-invertebratesStatus
Functions/Relevance
Enablers
Method
Results
Actions
Aquatic macro-invertebrates
0.0
5.0
10.0
15.0
20.0
25.0
30.0
35.0
40.0
45.0
50.0
Wat
er Q
ualit
y In
dex
2001 16.3 13.3 18.2 15.3 9.5 14.5
Grower 1 Grower 2 Grower 3 Grower 4 Grower 5 Average
A well developed and widely used indicator of water quality in Australia.
The species of aquatic macro-invertebrates present in water indicate levels of water pollution.
Reduce pollution of water with nutrients, heavy metals and pesticides.
Sample water in Spring. Sample water from the debris and soil at the bottom of channels and dams; water surrounding aquatic plants and water from 'artificial homes' (wire cages filled with rocks and debris). Assess the water samples for aquatic-macroinvertebrates. Record the number of species. Determine a "Water Quality Index" using the Australian Standard system.Categories are:Poor quality = 20 or lessFair quality = 21 - 35Good quality = 36 - 50Excellent quality = more than 50
The results in the graph below indicate that all the water bodies may be highly polluted. However, the species in the National assessment system may not all be occuring in farm dams and irrigation channels and thresholds for farm water supplies need to be set.
The national standards are for flowing watercourses in pristine vegetation and the threshold needs to be established for agricultural systems, which are likely to be much lower than the national standards.
Since the field assessment of the Unilever case-study properties, the National System has been upgraded to better account for frequency of species occurence and future analysis should include this upgraded methodology.
Implement biodiversity enhancement plans for the 5 pilot growers.See enabler matrix in Appendix 1.
50 = Maximum value possible (cleanest water)Lower values indicate greater amounts of water pollution
Australian Tomato Indicator Results 2002.xls Aquatic macro-invertebrates 2/09/2002

Key Crops TomatoesIndicator Product Value
Parameter Processing Tomato YieldsStatus
Functions/Relevance
Enablers
Method
Results
Actions
Processing Tomato Yield Summary
0
25
50
75
100
125
150
tonn
es /
ha
Fresh Yield (t/ha) 00/01 89.38 66.47 55.61 145.31 85.48 88.45
Fresh Yield (t/ha)01/02 79.33 71.49 93.14 110.14 114.92 93.804
Brix% 00/01 4.73 5.35 4.24 4.82 5.72 4.972
Brix% 01/02 4.41 4.68 4.24 4.18 4.32 4.366
SS (t/ha) 00/01 4.23 3.56 2.36 7 4.89 4.408
SS (t/ha) 01/02 3.5 3.34 3.95 4.6 4.96 4.07
30 Brix (t/ha) 00/01 13.88 11.68 7.75 22.97 16.06 14.468
30 Brix (t/ha) 01/02 11.5 10.98 12.96 15.12 16.3 13.372
G 1 G 2 G 3 G 4 G 5 Ave
A fundamental measure of crop performance.
Crop yield can have a significant impact on the economic sustainability of the processing tomato enterprise for the grower. The concentration of solids has a major financial impact on the paste processors. Clearly the agronomic and economic interaction between these two factors needs to be understood and managed.
Irrigation practices.Variety.All aspects of crop input management.
Collate processor harvest field sheets for each field of tomatoes.
Yields vary from 60 to 140 t/ha. Higher yields were achieved on drip irrigated farms.
Trial inducing water stress post flowering in patterns similar to those observed with furrow irrigation.
See enabler matrix in Appendix 1.

Key Crops TomatoesIndicator Energy
Parameter Diesel UseStatus
Functions/Relevance
Enablers
Method
Results
Actions
Diesel Consumption (L/T)
0
1
2
3
4
5
6
7
8
9
Grower Number
Fuel
Use
Effi
cien
cy (L
/T)
Diesel (L/T) 3.2 5 2.6 5 6.7 5.7 4.1 8.3 4.3 4.7 4.1 3.9 6.7 3.9 4.9
G 1 G 2 G 3 G 4 G 5 G 6 G 7 G 8 G 9 G 10
G 11
G 12
G 13
G 14
Ave
A simple measurement of energy use on farm
Diesel is the dominate source of energy consumed on most farms in the review. Activities which consume diesel include: cultivation, planting, fertilizing, spraying, irrigation and harvesting.
Matching tractor and implement draft requirements.Gear up and throttle back for light tractor work.Reduce paddock movements.Reduce irrigation pumping.
Accurate records of total farm diesel consumption are kept on all farms. There were generally few if any farm records available on allocation of diesel between farm enterprise or the fuel usage of individual pieces of machinery. The allocation of diesel to tomato production was in most cases the grower's best guess.
These results should be regarded as indicative estimates of diesel consumption due to the general lack of farm records and detailed knowledge on the fuel consuption of individual pieces of machinery. There appears to be considerable variation in fuel consumption which may present opportunites for improvement in the efficent use of diesel. Further work is required to quantify dieseconsumption.
Improve the record keeping on machinery efficiency, work rates and fuel use etc.
See enabler matrix in Appendix 1.
Diesel Consumption (L/ha)
0
100
200
300
400
500
600
Grower Number
Fuel
Use
Effi
cien
cy (L
/ha)
Diesel (L/ha) 280 539 228 439 388 544 365 586 399 486 420 419 561 421 434
G 1 G 2 G 3 G 4 G 5 G 6 G 7 G 8 G 9 G 10
G 11
G 12
G 13
G 14 Ave

Key Crops TomatoesIndicator Energy
Parameter Cultivation and Traffic MovementsStatus
Functions/Relevance
Enablers
Method
Results
Actions
Cultivation and Traffic Movements
0
10
20
30
40
50
60
Num
ber o
f Mov
emen
ts p
er S
easo
n
No Cultivations 00/01 17 16 17 13 14 0 0 0 0 0 0 0 0 0 0 15.4
No Cultivations 01/02 17 16 17 13 14 14 15 15 12 10 12 13 13 17 12 15.4
Traffic Movements 00/01 42 43 37 33 44 0 0 0 0 0 0 0 0 0 0 39.8
Traffic Movements 01/02 42 43 37 33 44 31 33 31 28 59 33 36 34 44 33 37.4
G 1 G 2 G 3 G 4 G 5 G 6 G 7 G 8 G 9 G 10 G 11 G 12 G 13 G 14 G 15 Ave
A basic indicator of energy use on farm.
Cultivation and paddock traffic movement contribute to energy consumption. Reducing cultivation and traffic movement is likely to result in decreased diesel usage.
Cultivation type and frequency.Crop spraying frequency.
Cultivation and paddock traffic movements were retrieved from farm records and grower practices.
Cultivation and paddock traffic movements associated with tomatoes are considered high, particularly when compared to other enterprises on the same farms and hence consumes a significant proportion of the energy consumed on farm.
Cultivation and traffic movements between farms and seasons was similar with the exception of Grower 10. Grower 10 has trellised tomatoes which are hand pick with a harvest aid resulting in much higher paddock traffic movements.
Explore opportunities to reduce cultivation and traffic movement.
See enabler matrix in Appendix 1.

Key Crops TomatoesIndicator Water Management
Parameter Irrigation Distribution UniformityStatus
Functions/Relevance
Enablers
Method
Results
Actions
Irrigation Distribution Uniformity
0
10
20
30
40
50
60
70
80
90
100
% D
U
01/02 75 50 50 90 79 68.8
G 1 G 2 G 3 G 4 G 5 Ave
Both furrow and drip irrigation methods are currently utilized by Australian tomato growers.Furrow systems are known to be highly variable in the delivery of water across a field.Drip irrigation systems vary in uniformity due to design and maintenance issues.
Uneven application of water results in some parts of the paddock being underwatered causing moisture stress to the crop and other parts of the field being overwatered which may result in both waterlogging stress to the crop and leaching loss of water and nutrientbelow the crop root zone.
Irrigation system design.Irrigation system operation and maintenance.
Irrigation distribution uniformity compares the statistical average of the lowest quarter of the flow readings divided by the average of the total. This means it is an indicator of under watering problems that can occur in irrigation systems.
Furrow irrigation distribution is highly variable, extremely difficult to objectively quantify and has been assumed to be 50% for the two furrow irrigated growers involved in the pilot.
Drip irrigation systems can be very efficient in the delivery of water, with one farm have a distribution uniformity of >90% (world best practice), particularly given that this grower designed the system himself and the drip tube was 22 years old having been retrieved and relayed at least 6 times!
Poor irrigation design advice and lack of regular maintenance and flushing of laterals and sub mains resulted in several systems clogging up.
Further awareness and evaluation of irrigation system distribution uniformity across the broader industry.
See enabler matrix in Appendix 1.
Threshold

Key Crops TomatoesIndicator Water Management
Parameter Irrigation Volume Applied Per SeasonStatus
Functions/Relevance
Enablers
Method
Results
Actions
Irrigation Water Applied (ML/Ha)
0
2
4
6
8
10
12
Meg
alitr
es /
Hec
tare
00/01 6.1 5.7 7.1 4.6 3.6 5.42
01/02 10 4.8 9.4 4.5 4.4 6.62
G 1 G 2 G 3 G 4 G 5 Ave
A relatively simple measure of how efficiently water is used to produce tomatoes.
Water is a scarce resource and needs to be managed wisely. Inefficient use of irrigation water has both an economic and environmental concequence. Water which moves beyond the plant roots adds to rising ground water tables and nutrient loss.
Uniform and efficient irrigation systems (preferably drip irrigation due to greater control achievable).Regular field and soil profile inspections by growers (determining soil moisture content).Use of weather information and infield weather stations to determine evapotranspiration rates, soil moisture sensors etc.Use of analogue or digital flow sensors to log water volumes applied to each field.
Collection of data from flow sensors on timing and duration of irrigations and effective growing season rainfall to determine total water applied to the paddock.Use of processor field sheets to determine paddock yields.Divide the total volume of water applied per paddock by the area of paddock to calculate megalitres per hectare applied water.Divide the tonnes per hectare of tomatoes by the applied water volume (ML/ha) to calculate water use efficiency in tonnes of tomatoes per megalitre.
Grower 2 & 3 utilize furrow irrigation techniques. Growers 1, 4 & 5 use drip irrigation. A crop failure necessitating resowing of the crop in the second year for grower 1 contributed to the poor water use efficiency in that year. This data demonstrates that there is significant opportunity to improve water use efficiency with existing technology.
Transition the industry to drip irrigation methods.Investigate alternative ways to establish tomatoes which avoid completely saturating the beds during the first watering e.g. overhead irrigation for the first watering.
See enabler matrix in Appendix 1.
Threshold
Water Use Efficiency (T/ML)
0
5
10
15
20
25
Tonn
es /
Meg
alitr
e
00/01 11.8 9.5 6.7 24.2 17.1 13.86
01/02 6.9 11.8 8.8 18.7 19.8 13.2
G 1 G 2 G 3 G 4 G 5 Ave

Key Crops TomatoesIndicator Water Management
Parameter Irrigation Tail Water LossStatus
Functions/Relevance
Enablers
Method
Results
Actions
Irrigation Water Applied (Meg/Ha)
0
2
4
6
8
10
12
14
16
Meg
alitr
es /
Hec
tare
00/01 1.5 14.2 13.5 1 1 6.24
01/02 1.5 2.1 9.4 1 1 3
G 1 G 2 G 3 G 4 G 5 Ave
Threshold
An indicator of surface water loss from tomato fields.
The objective of well designed irrigation systems involves application of water to soil to meet crop needs.Runoff of water from tomato fields contributes a loss or inefficiency as well as providing a pathway for the surface movement of nutrients and pesticide residues.Laser levelled ground with well designed (& efficient) irrigation delivery systems minimises tail water losses due to ineffective water applications.Excessive tail water losses are most common with furrow irrigated tomato systems.
Laser levelling of fields.Drip irrigation systems designed with a DU >90%.Regular maintenance of drip irrigation systems including flushing of lateral lines, chlorination, acid injection, field assessment of DU.Establishment of tail water recovery and recycle systems.
All paddocks were laser levelled with surface water flow proceeding to one end of the field.A tail water drain is constructed by grower to recycle surface water.Flumes were installed at the lowest point in paddocks into the tail water drains.Capacitance depth sensors are installed into a well located adjacent to the flume.Releases of tail water are logged using depth sensors (timing, water level changes in flume).An algorithm calibrated for the 300 mm flume is used to calculate the volume of water released over the flume per irrigation event.The total volume discharged over the flume is then calculated.
Grower 2 and 3 had furrow irrigation systems.
See enabler matrix in Appendix 1.

Key Crops TomatoesIndicator Water Management
Parameter Ground Water Depth & QualityStatus
Functions/Relevance
Enablers
Method
Results
Actions
Ground Water Table Depth
0
1
2
3
4
5
6
7
8
9
10
Dep
th (m
)
00/01 2.0 8.9 7.5 2.0 2.7 4.6
01/02 2.4 8.3 7.6 2.6 3.3 4.8
G 1 G 2 G 3 G 4 G 5 Ave
Rising ground water tables and saline water quality is an issue for all Australian processing tomato growersSignificant increases in water table depths have occurred in past 30 years throughout most areas. Regional increases have been noted in some areas in past few years despite the 5 year drought experienced by most growers.
Ground water depth and quality are two key parameters for Unilever tomato growers in Australia.Water table depth has risen in some tomato areas from 20+ m below the natural surface level to <1.5 m with salinity levels >30 dS/m and chloride concentrations in excess of 20,000 mg/kg Cl.Minimisation of irrigation water discharges to ground water on tomato farms is considered essential to sustained production.Impacts of other land holder practices (catchment neighbours) is also a key priority.
Installation and monitoring of ground water depth and quality.Improvement in irrigation system distribution uniformity.Adoption and utilization of irrigation scheduling techniques such as infield weather stations, soil moisture sensors, infield inspection.Enhancement of native vegetation as part of farm biodiversity enhancement plan to assist in naturally lowering ground water level.Working with farm neighbours and local catchment groups on integrated "regional" ground water management plans.
Monitor existing regional catchment management authority or water authority testwells surrounding farms.Install test wells around farm fence lines (to protect wells from traffic activity).Test well depths will depend on regional water table levels.Using a fox whistle pipe on measuring tape, test depth on a monthly or bi monthly basis (record results).Using simple Electrical Conductivity Meter test water quality.Once every 3 months bail out contents of well to flush stagnant water, retest water table depth and quality 7 days following bailing.
Grower 2 and 3 had furrow irrigation systems.
Working with farm neighbours and local catchment groups on integrated "regional" ground water management plans.
See enabler matrix in Appendix 1.
Ground LevelGround Water Quality (Electrical Conductivity)
0
5
10
15
20
25
30
EC (d
S/m
)
00/01 7.7 6.7 24.3 28.2 19.1 17.2
01/02 6.0 10.0 27.5 20.5 28.5 18.5
G 1 G 2 G 3 G 4 G 5 Ave