new millennium (nml) a technical report on the ... 2010 amended as of february 16, 2011 new...
TRANSCRIPT

April 2010 Amended as of February 16, 2011
New Millennium Capital Corp. (NML)
A TECHNICAL REPORT
on the
FEASIBILITY STUDY OF THE DIRECT SHIPPING IRON ORE
(DSO) PROJECT
Prepared by the following Qualified Persons:
Dean Journeaux, ing., Chief Operating Officer, NML
Bish Chanda, ing., Senior Vice‐President Marketing & Strategy, NML
Jean‐Charles Bourassa, ing., Vice‐President Mining, NML
Moulaye Melainine, ing., Vice‐President Development, NML
Laurent Piette, ing., Project Manager DSO, NML
Rock Gagnon, ing., Manager, Mineral Processing, NML
and Independent Qualified Persons:
André Boilard, ing., Senior Project Manager, Met‐Chem Canada Inc.
Robert de l’Étoile, ing., SGS Canada Inc.
April 9, 2010
Amended as of February 16, 2011

April 2010 Amended as of February 16, 2011
It is to be noted that the Items in this report are numbered in accordance with the Rules and Policies that govern the contents of an NI 43-101 Technical Report.
The title page being Item 1 and the table of contents being Item 2, the text begins only at Item 3, the Summary.

New Millennium Capital Corp. Technical Report – Feasibility of the DSO Project Page 1
April 2010 Amended as of February 16, 2011
3.0 SUMMARY 6 3.1 Introduction ..................................................................................................................... 6 3.2 Study Results ................................................................................................................. 2 3.3 Geology .......................................................................................................................... 2 3.4 Mining ............................................................................................................................. 3 3.5 Metallurgical Testing ....................................................................................................... 3 3.6 Mineral Processing ......................................................................................................... 5 3.7 Process Plant Site .......................................................................................................... 6 3.8 Transportation ................................................................................................................ 9 3.9 Environment ................................................................................................................... 9 3.10 First Nations ................................................................................................................... 9 3.11 Personnel Fly-in/Fly-out Concept ................................................................................. 10 3.12 Project Execution Plan ................................................................................................. 10
3.12.1 Project Management and Organization 10
3.12.2 The Integrated Project Team 11
3.13 Schedule ....................................................................................................................... 11 4.0 INTRODUCTION 14
4.1 General ......................................................................................................................... 14 4.2 Terms of Reference ...................................................................................................... 15 4.3 Units ............................................................................................................................. 18 4.4 Notice ........................................................................................................................... 22
5.0 RELIANCE ON OTHER EXPERTS 23 6.0 PROPERTY DESCRIPTION AND LOCATION 23
6.1 Location ........................................................................................................................ 23 6.2 Property Description and Ownership ............................................................................ 27 6.3 Property Agreements .................................................................................................... 27 6.4 Royalties ....................................................................................................................... 27 6.5 Permitting ..................................................................................................................... 27 6.6 Environmental Issues ................................................................................................... 27
7.0 ACCESSIBILITY, CLIMATE, LOCAL RESOURCES, INFRASTRUCTURE AND PHYSIOGRAPHY 28
7.1 Access .......................................................................................................................... 28 7.2 Climate ......................................................................................................................... 28 7.3 Local Resources and Infrastructure .............................................................................. 28 7.4 Physiography ................................................................................................................ 28 7.5 Land use ....................................................................................................................... 29
8.0 HISTORY 30 8.1 General ......................................................................................................................... 30
9.0 GEOLOGICAL SETTING 31 10.0 DEPOSIT TYPES 32 11.0 MINERALIZATION 33 12.0 EXPLORATION 34
12.1 Bulk Sampling ............................................................................................................... 34 12.1.1 2008 Program 34
12.1.2 2009 Program 35
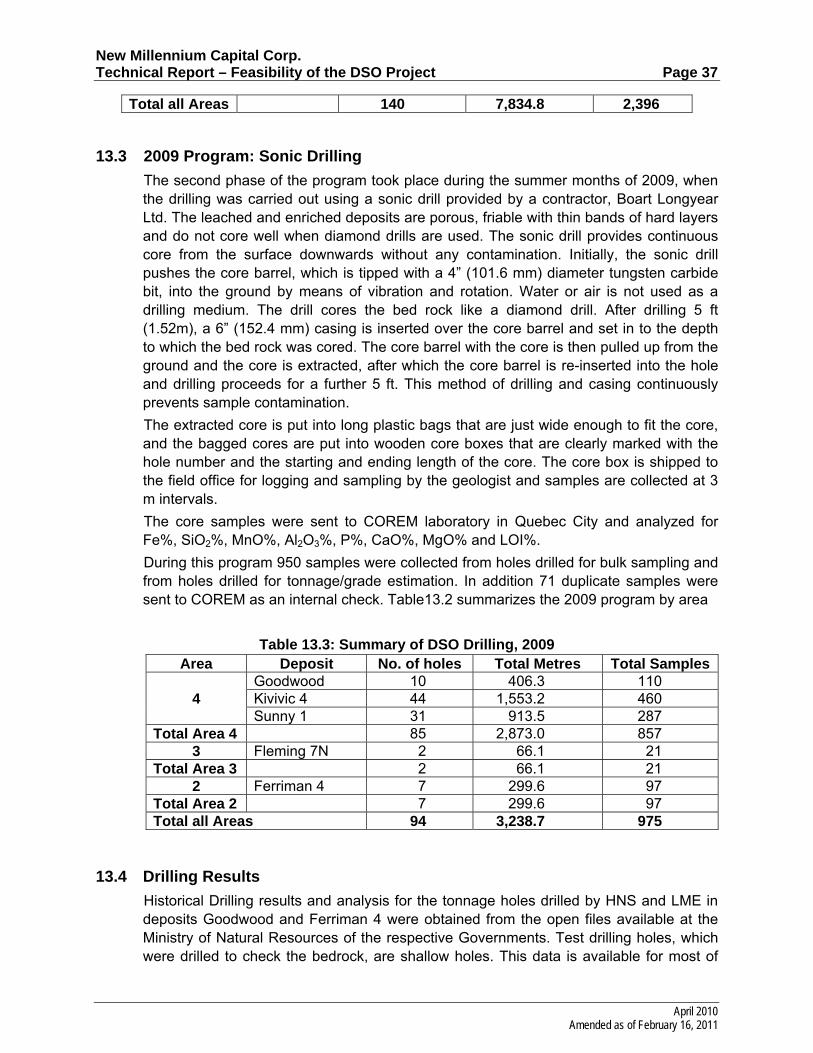
13.0 DRILLING 36 13.1 Historical Drilling ........................................................................................................... 36 13.2 2008 Program: Reverse Circulation Drilling ................................................................. 36 13.3 2009 Program: Sonic Drilling ........................................................................................ 37

New Millennium Capital Corp. Technical Report – Feasibility of the DSO Project Page 2
April 2010 Amended as of February 16, 2011
13.4 Drilling Results .............................................................................................................. 37 13.4.1 DSO Area 4 38
13.4.2 DSO Area 3 38
13.4.3 DSO Area 2 38
14.0 SAMPLING METHOD AND APPROACH 38 15.0 SAMPLE PREPARATION, ANALYSIS AND SECURITY 40 16.0 DATA VERIFICATION 41
16.1 Site Visits ...................................................................................................................... 41 16.2 Integrity of the drill hole databases ............................................................................... 41 16.3 Quality control measures .............................................................................................. 41 16.4 Twin hole analysis ........................................................................................................ 44
17.0 ADJACENT PROPERTIES 45 18.0 MINERAL PROCESSING AND METALLURGICAL TESTING 46
18.1 Process Development Activities ................................................................................... 46 18.1.1 Flowsheet development program for Pre‐feasibility Study 47
18.1.2 Modification and improvement of the PFS flowsheet 47
19.0 MINERAL RESOURCE AND MINERAL RESERVE ESTIMATES 51 19.1 Mineral Resource Estimate .......................................................................................... 51
19.1.1 Resource Block Models 51
19.2 Mineral Reserve Estimate ............................................................................................ 54 19.2.1 Mining Block Models 54
19.2.2 Moisture Content 54
19.2.3 Recovery 54
19.3 Economic Analysis ....................................................................................................... 54 19.3.1 Sales Price 55
19.3.2 Mining Costs 55
19.3.3 Net Value 55
19.3.4 Pit Slope Angle 55
19.3.5 Results of the Analyses 55
19.4 Pit Design ..................................................................................................................... 57 19.4.1 Design Parameters 58
19.4.2 Design Selection 58
19.5 Mine Scheduling ........................................................................................................... 61 19.5.1 Schedule Parameters 61
19.5.2 Production Schedule 62
20.0 OTHER RELEVANT DATA AND INFORMATION 64 20.1 Mining ........................................................................................................................... 64
20.1.1 Method 64
20.1.2 Dumps 64
20.1.3 Equipment 64
20.1.4 Protection of the Environment 66
20.2 Mineral Processing ....................................................................................................... 66 20.2.1 Design Criteria 66
20.2.2 Process and Plant description 67
20.3 Tailings Management ................................................................................................... 72 20.3.1 Site selection 72

New Millennium Capital Corp. Technical Report – Feasibility of the DSO Project Page 3
April 2010 Amended as of February 16, 2011
20.3.2 Design basis 72
20.4 Infrastructure ................................................................................................................ 72 20.4.1 Timmins Site 72
20.4.2 Goodwood Site 80
20.5 Electricity ...................................................................................................................... 80 20.5.1 Design Basis 80
20.6 Other Infrastructure ...................................................................................................... 83 20.6.1 Product Transportation 83
20.6.2 Product Storage and Ship Loading 87
20.7 Environmental Aspects ................................................................................................. 87 20.7.1 Environmental Approval Requirements – Phase 1 90
20.7.2 Baseline Studies – Phases 1 and 2 93
20.7.3 Summary of EISs for AG1a 94
20.7.4 First Nations 99
20.7.5 Local Communities 101
20.7.6 DSOP Phase 2 101
20.7.7 Methodological Considerations 103
20.7.8 Overview 104
20.8 Project Schedule ........................................................................................................ 104 20.8.1 Advance Engineering 104
20.8.2 Full Notice to Proceed 105
20.8.3 Key Milestone Dates 105
20.8.4 Feasibility Study 106
20.8.5 Production Start‐up 106
20.9 Market ......................................................................................................................... 108 20.9.1 Marketing 108
20.9.2 Product Pricing 108
20.9.3 Iron ore price development 111
20.9.4 Long–term Price Projection 112
20.10 Capital Cost Estimate ................................................................................................. 113 20.10.1 Scope of Estimate 113
20.10.2 Basis of Estimate 114
20.10.3 Equipment 116
20.10.4 Mining 118
20.10.5 Off‐site Installations and Facilities 119
20.10.6 Indirect costs 119
20.10.7 Summary of the Estimate 119
20.11 Operating Cost Estimate ............................................................................................ 121 20.11.1 Summary of Estimated Operating Costs 121
20.11.2 Operating Schedules 121
20.11.3 Site Restoration and Mine Closure 123
20.12 Financial Analyses ...................................................................................................... 123 20.12.1 General 123
20.12.2 Revenues 124

New Millennium Capital Corp. Technical Report – Feasibility of the DSO Project Page 4
April 2010 Amended as of February 16, 2011
20.12.3 Expenses 124
20.12.4 Capital Expenditures 124
20.12.5 Fiscal Considerations and Depreciation 125
20.12.6 Residual Value 125
20.12.7 Financing 126
20.12.8 Results 126
20.12.9 Sensitivity 126
21.0 INTERPRETATION AND CONCLUSIONS 129 21.1 Interpretation .............................................................................................................. 129 21.2 Conclusions ................................................................................................................ 131
22.0 RECOMMENDATIONS 132 23.0 CERTIFICATES 134 24.0 REFERENCES 143

New Millennium Capital Corp. Technical Report – Feasibility of the DSO Project Page 5
April 2010 Amended as of February 16, 2011
Tables Table 3.1: Summary of Study Results .......................................................................................... 2 Table 3.2: Summary of 43-101 Compliant Resources .................................................................. 2 Table 3.3: Summary of Mineral Reserves ..................................................................................... 3 Table 4.1: NML’s Technical Team .............................................................................................. 17 Table 4.2: Acronyms, abbreviations and symbols ...................................................................... 18 Table 6.1: Potential Targets for Exploration ................................................................................ 24 Table 6.2: DSO Claims and Licenses ......................................................................................... 26 Table 13.1: Summary of the IOCC drill holes per deposit reported ............................................ 36 Table 13.2: 2008 Grouping by Area of the Deposits of the DSO Project .................................... 36 Table 13.3: Summary of DSO Drilling, 2009 ............................................................................... 37 Table 16.1: Results of QA-QC Duplicate Assays Analysis ......................................................... 42 Table 18.1: Results of Pilot Plant Tests on Area 4 Composite ................................................... 49 Table 19.1: Classified Resources by Deposit (combined blue, red and yellow ore types) .......... 53 Table 19.2: Moisture Content ...................................................................................................... 54 Table 19.3: Recovery Values ...................................................................................................... 54 Table 19.4: Mining Cost .............................................................................................................. 55 Table 19.5: Results of Economic Analyses ................................................................................. 57 Table 19.6: Break Even Stripping Ratios .................................................................................... 57 Table 19.7: Mineable reserves by Deposit .................................................................................. 59 Table 19.8: Average MLSA Values ............................................................................................. 61 Table 19.9: PMLSA Values ......................................................................................................... 62 Table 19.10: Summarized Production Schedule (‘000 tonnes) ................................................... 63 Table 20.1: Truck Requirements ................................................................................................. 65 Table 20.2: Haul distances (One-way) ........................................................................................ 65 Table 20.3: Auxiliary Equipment ................................................................................................. 66 Table 20.4: Basic Process Plant Design Criteria ........................................................................ 67 Table 20.5: Supply and Demand for Electricity (MW) ................................................................. 81 Table 20.6: Subdivision of the DSOP for Purposes of Environmental Impact Assessment ........ 88 Table 20.7: Probable GNL Timeline for Environmental Impact Assessment of AG1a ................ 91 Table 20.8: GC Timeline for Environmental Impact Assessment of AG1a ................................. 92 Table 20.9: Planned and Current Baseline Studies for Phases 1 and 2 ..................................... 93 Table 20.10: Overview of Baseline Data Collected in Summer and Fall of 2009........................ 94 Table 20.11: Cumulative Effects on Socio-economic VECs, DSOP ........................................... 95 Table 20.12: Monitoring Programme, DSOP .............................................................................. 96 Table 20.13: Status of Land-Claims Settlements and Negotiations .......................................... 100 Table 20.14: Tentative KEQC Timeline for Environmental Impact Assessment ....................... 102 Table 20.15: Tentative GC Timeline for Environmental Impact Assessment of AG2a .............. 102 Table 20.16: Tentative GNL Timeline for Environmental Impact Assessment of AG2b ............ 103 Table 20.17: Tentative GC Timeline for Environmental Impact Assessment of AG2b .............. 103 Table 20.18: Major Equipment Delivery Lead Times ................................................................ 105 Table 20.19: Project Milestone Dates ....................................................................................... 105 Table 20.20: Forecast Iron Ore Demand by Source of Demand .............................................. 109

New Millennium Capital Corp. Technical Report – Feasibility of the DSO Project Page 6
April 2010 Amended as of February 16, 2011
Table 20.21: Forecast Iron Ore Demand by Type of Ore ......................................................... 109 Table 20.22: Forecast Fines Demand (million tonnes) ............................................................. 110 Table 20.23: Summary of Capital Cost Estimate ...................................................................... 119 Table 20.24: Summary of Production and Operating Costs ..................................................... 121 Table 20.25: Estimated Tonnages and Revenues by Year ...................................................... 124 Table 20.26: Results of Financial Analyses .............................................................................. 126 Table 20.27: Sensitivity of Pre-Tax IRR to Variations in Key Parameters ................................ 127 Figures Figure 3.1: Location of DSO Deposits, Claims and Principal Infrastructure ................................. 5 Figure 3.2: Block Diagram of Process Flowsheet ......................................................................... 6 Figure 3.3: Timmins Site Overall Layout ....................................................................................... 8 Figure 3.4: Overall DSO Project ................................................................................................. 10 Figure 3.5: Contracting Structure for IPT Approach .................................................................... 11 Figure 3.6: Summary Master Schedule ...................................................................................... 12 Figure 3.7: Timmins Site Overall Layout ..................................................................................... 13 Figure 6.1: Location of DSO Deposits, Claims and Principal Infrastructure ............................... 25 Figure 16.1 – Scattergram of QA-QC Fe Pulp Duplicates .......................................................... 43 Figure 16.2 – Scattergram of QA-QC SiO2 Pulp Duplicates ...................................................... 43 Figure 16.3 – Scattergram of QA-QC Mn Pulp Duplicates ......................................................... 44 Figure 18.1: Block Diagram of Process Flowsheet ..................................................................... 50 Figure 19.1: Timmins 3N Ultimate Pit ......................................................................................... 60 Figure 20.1: Block Diagram of Process Flowsheet ..................................................................... 68 Figure 20.2: Overall Plan View of the Project Sites .................................................................... 69 Figure 20.3: Timmins Site Overall Layout ................................................................................... 70 Figure 20.4: Goodwood Site Overall Layout ............................................................................... 71 Figure 20.5: Existing Interchange at Ross Bay Junction ............................................................ 85 Figure 20.6: Existing Interchange at Arnaud Junction ................................................................ 86 Figure 20.7: DSOP Deposits, by Assessment Group ................................................................. 89 Figure 20.8: Summary Project Schedule .................................................................................. 107 Figure 20.9: Fines Demand Forecast (million tonnes) .............................................................. 111 Figure 20.10 Sensitivity of Pre-tax IRR to Variations in Key Parameters ................................. 128
3.0 SUMMARY
3.1 Introduction
The Direct Shipping Ore (“DSO”) Project is a brownfield development located in Canada’s historic iron ore producing region of Northern Quebec and Labrador. The Iron Ore Company of Canada (“IOCC”) mined and shipped products from various DSO deposits from 1954 to 1982. Having the basic infrastructure in place, the Project provides an opportunity to rapidly build a mining operation and start shipping products in late 2011
New Millennium Capital Corp. Technical Report – Feasibility of the DSO Project Page 2
April 2010 Amended as of February 16, 2011
to Corus, the European steelmaking unit of the Tata Group, the world’s sixth largest steel producer,
A Joint Venture Agreement (“JVA”) exists between NML and Tata Steel Global Minerals Holdings Pte. Ltd. (“Tata”) of Singapore, also a member of the Tata Group, and it is planned that the DSO Project will be developed and operated in accordance with the terms of the JVA.
This Feasibility Study (the “Study”) was completed on 25 February, 2010, after twelve months of intensive work that included ore drilling, metallurgical testing, process development, in-depth facility design, capital and operating cost estimates and associated financial analyses. The engineering for the Study was completed in accordance with acceptable standards.
The Study was submitted for review and approval by the Board of Directors of NML on 18 February, 2010. Having been approved by the Board, it is now being recommended to Tata in accordance with the terms of the JVA.
3.2 Study Results
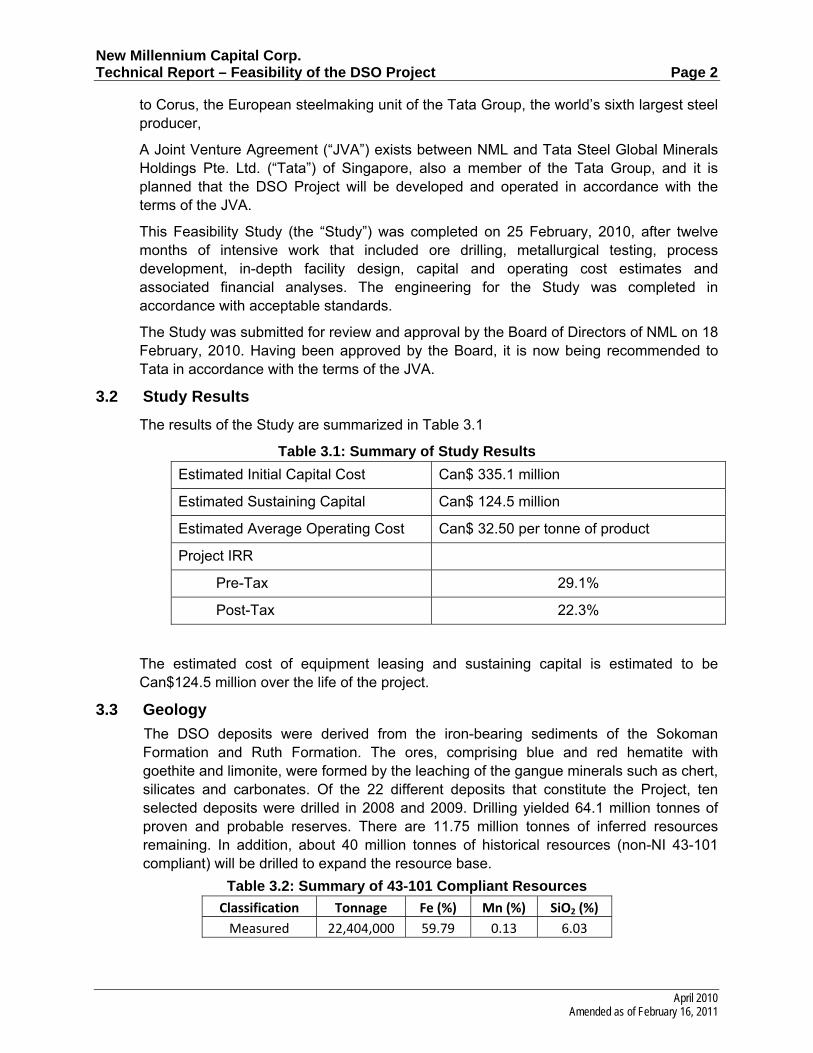
The results of the Study are summarized in Table 3.1
Table 3.1: Summary of Study Results
Estimated Initial Capital Cost Can$ 335.1 million
Estimated Sustaining Capital Can$ 124.5 million
Estimated Average Operating Cost Can$ 32.50 per tonne of product
Project IRR
Pre-Tax 29.1%
Post-Tax 22.3%
The estimated cost of equipment leasing and sustaining capital is estimated to be Can$124.5 million over the life of the project.
3.3 Geology
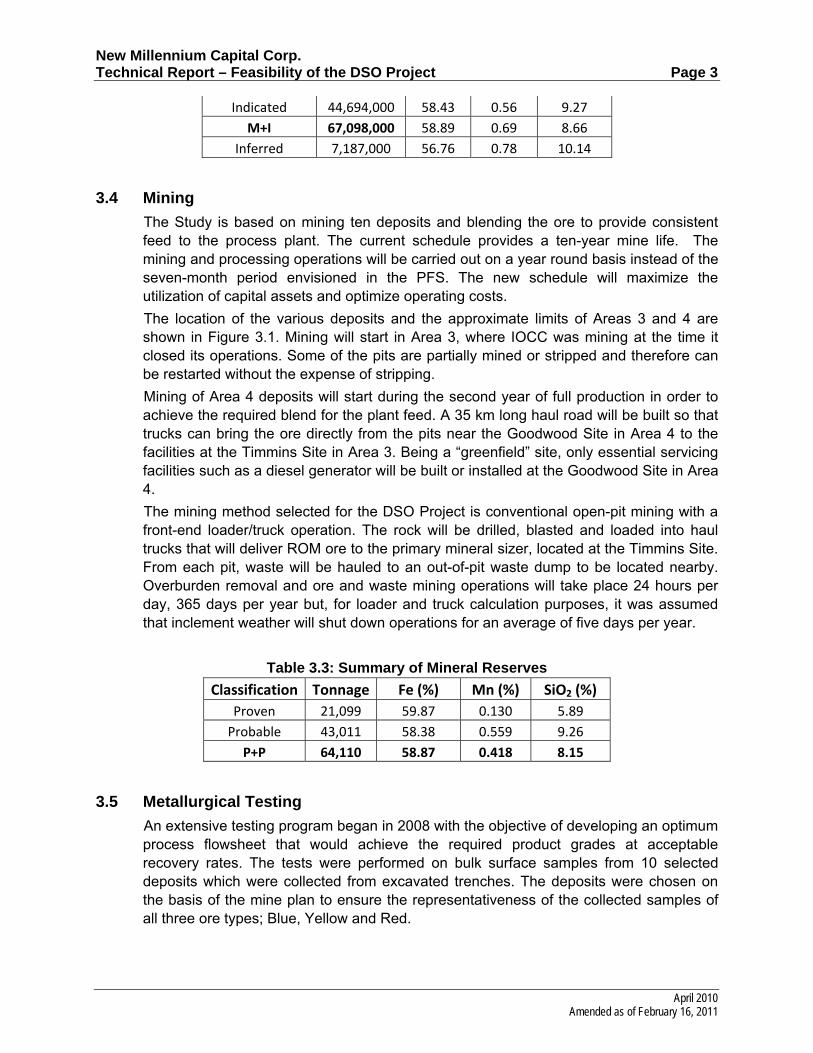
The DSO deposits were derived from the iron-bearing sediments of the Sokoman Formation and Ruth Formation. The ores, comprising blue and red hematite with goethite and limonite, were formed by the leaching of the gangue minerals such as chert, silicates and carbonates. Of the 22 different deposits that constitute the Project, ten selected deposits were drilled in 2008 and 2009. Drilling yielded 64.1 million tonnes of proven and probable reserves. There are 11.75 million tonnes of inferred resources remaining. In addition, about 40 million tonnes of historical resources (non-NI 43-101 compliant) will be drilled to expand the resource base.
Table 3.2: Summary of 43-101 Compliant Resources
Classification Tonnage Fe (%) Mn (%) SiO2 (%)
Measured 22,404,000 59.79 0.13 6.03
New Millennium Capital Corp. Technical Report – Feasibility of the DSO Project Page 3
April 2010 Amended as of February 16, 2011
Indicated 44,694,000 58.43 0.56 9.27
M+I 67,098,000 58.89 0.69 8.66
Inferred 7,187,000 56.76 0.78 10.14
3.4 Mining
The Study is based on mining ten deposits and blending the ore to provide consistent feed to the process plant. The current schedule provides a ten-year mine life. The mining and processing operations will be carried out on a year round basis instead of the seven-month period envisioned in the PFS. The new schedule will maximize the utilization of capital assets and optimize operating costs.
The location of the various deposits and the approximate limits of Areas 3 and 4 are shown in Figure 3.1. Mining will start in Area 3, where IOCC was mining at the time it closed its operations. Some of the pits are partially mined or stripped and therefore can be restarted without the expense of stripping.
Mining of Area 4 deposits will start during the second year of full production in order to achieve the required blend for the plant feed. A 35 km long haul road will be built so that trucks can bring the ore directly from the pits near the Goodwood Site in Area 4 to the facilities at the Timmins Site in Area 3. Being a “greenfield” site, only essential servicing facilities such as a diesel generator will be built or installed at the Goodwood Site in Area 4.
The mining method selected for the DSO Project is conventional open-pit mining with a front-end loader/truck operation. The rock will be drilled, blasted and loaded into haul trucks that will deliver ROM ore to the primary mineral sizer, located at the Timmins Site. From each pit, waste will be hauled to an out-of-pit waste dump to be located nearby. Overburden removal and ore and waste mining operations will take place 24 hours per day, 365 days per year but, for loader and truck calculation purposes, it was assumed that inclement weather will shut down operations for an average of five days per year.
Table 3.3: Summary of Mineral Reserves
Classification Tonnage Fe (%) Mn (%) SiO2 (%)
Proven 21,099 59.87 0.130 5.89
Probable 43,011 58.38 0.559 9.26
P+P 64,110 58.87 0.418 8.15
3.5 Metallurgical Testing
An extensive testing program began in 2008 with the objective of developing an optimum process flowsheet that would achieve the required product grades at acceptable recovery rates. The tests were performed on bulk surface samples from 10 selected deposits which were collected from excavated trenches. The deposits were chosen on the basis of the mine plan to ensure the representativeness of the collected samples of all three ore types; Blue, Yellow and Red.
New Millennium Capital Corp. Technical Report – Feasibility of the DSO Project Page 4
April 2010 Amended as of February 16, 2011
A detailed test program was designed to evaluate the chemical, physical and metallurgical characteristics of each ore type from different deposits so that a blending program could be developed to ensure consistent feed quality to the plant. Furthermore, the test results were used to select and design appropriate process equipment to upgrade the ore to the required specifications.
The tests were conducted in different independent laboratories in North America, Europe, South Africa and India as well as in facilities operated by equipment/technology suppliers experienced in the processing of DSO-type ores.
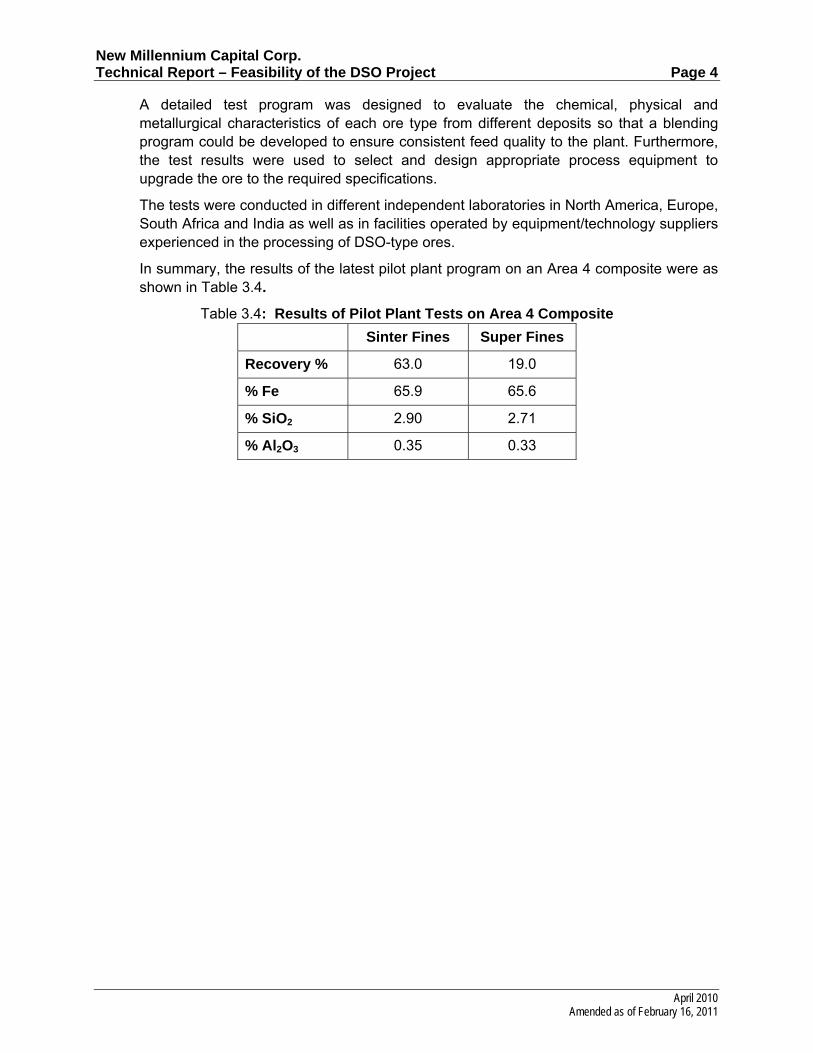
In summary, the results of the latest pilot plant program on an Area 4 composite were as shown in Table 3.4.
Table 3.4: Results of Pilot Plant Tests on Area 4 Composite
Sinter Fines Super Fines
Recovery % 63.0 19.0
% Fe 65.9 65.6
% SiO2 2.90 2.71
% Al2O3 0.35 0.33

New Millennium Capital Corp. Technical Report – Feasibility of the DSO Project Page 5
April 2010 Amended as of February 16, 2011
3.6 Mineral Processing
Figure 3.1: Location of DSO Deposits, Claims and Principal Infrastructure

New Millennium Capital Corp. Technical Report – Feasibility of the DSO Project Page 6
April 2010 Amended as of February 16, 2011
The run-of-mine ore processing consists of crushing and wet screening to reduce the ore to - 6 mm size. Gravity separation methods, employing jigs, spirals and hydro-classifiers, are utilized to upgrade coarse fractions. Materials below 0.1 mm are separated by wet high intensity magnetic separators (“WHIMS”).
A block diagram representing the selected flowsheet is presented as Figure 3.2. It covers the reception of Run-of-Mine ore at the Primary Sizing station to the loading of Super Fines and Sinter Fines products into railcars for transportation to storage and ship loading facilities at Pointe-Noire.
Figure 3.2: Block Diagram of Process Flowsheet ROM Tails (reground)
(‐6mm) Oversize Concentrate
5 7
Undersize 8
Tail 9
Conc
O/F
13 12 18
Conc Conc
14
Tail 15 19
U/F
16 O/F
Fine screening(1.0 mm)
Spirals
Filtration of Sinter Fines
Concentrate cycloning(0.1 mm)
Tailings
Hydroclassifiers
Filtration of SuperFines
Fine jigs
WHIMS
Crushing &Scrubbing
Sinter Fines
Product
Super Fines
Product
The plant will process 5.0 million natural tonnes per year (“mtpy”) to produce 4.0 million dry tonnes of sinter fines and super fines. About 80% of the production will be the higher-valued sinter fines. Various tests performed on representative bulk samples at laboratories and facilities operated by experienced technology providers demonstrated the processing ability to meet product quality requirements.
Tailings from the process plant will be pumped to the nearby mined-out Timmins #2 pit and the reclaimed water will be pumped back to be used as process water. Hydro power will be available during summer months from Menihek power station, in an amount yet to be determined. An electricity transmission line will be re-established from the Hydro-Quebec (“HQ”) Schefferville substation to feed the Timmins Site installations. Since sufficient hydro power will not be available during the winter months, diesel generating sets will be used to supply all the required power at the Timmins Site.
3.7 Process Plant Site
The Timmins Plant, where the crusher, processing plant, offices, laboratories, maintenance and service facilities etc. will be located, is near the mined-out Timmins #1

New Millennium Capital Corp. Technical Report – Feasibility of the DSO Project Page 7
April 2010 Amended as of February 16, 2011
pit and next to the Railway Loop at the end of a 28 km long rail link that is to be rebuilt on an old rail bed from the main line at Mile Post (“MP”) 353 on the TSH main line.
Except for the primary sizing station and product loadout facilities, all other facilities will be housed under a 106 m wide x 170 m long x 35 m high air-supported dome. In addition to providing adequate protection from the weather, the dome will be more economical than having separate buildings for individual facilities. The overall layout of the Timmins site is shown on Figure 3.3.

New Millennium Capital Corp. Technical Report – Feasibility of the DSO Project Page 8
April 2010 Amended as of February 16, 2011
Figure 3.3: Timmins Site Overall Layout

New Millennium Capital Corp. Technical Report – Feasibility of the DSO Project Page 9
April 2010 Amended as of February 16, 2011
3.8 Transportation
Products will be filtered and dried in winter to a low enough moisture content to prevent freezing in ore cars during shipping to the port. Dried products will be stored in silos at the Timmins Site. A 240-car train will be loaded every 48 hours for dispatching to the port.
A 28 km long rail link from the main line will be re-established from Mile Post (“MP”) 353 to the Timmins Site near the mined-out Timmins #1 pit on the existing rail bed, which is in excellent condition. Of this rail link, NML expects another mining company to build eight kilometers from MP 353 to the QC/ NL border.
From the Timmins Site, products will be hauled in 100-tonne gondola railcars to the Terminal in Pointe-Noire, Sept-Îles, where a car dumper will be installed and the products will be stockpiled. It is assumed that the existing dock, owned by the Sept-Iles Port Authority, will be used to load vessels using existing ship loading equipment owned by Wabush Mines (“WM”).
Negotiations are being carried out with three rail carriers, each of which is designated as a common carrier, regarding the tariff to haul the ore to the port.
Similar negotiations are in progress with WM regarding the use of the ore handling and ship loading equipment.
To date, the rail and port tariff agreements have not been concluded. For the Feasibility Study NML has used its best judgment to determine the expected cost of rail tariffs, based on an extensive study, by Charles River Associates, of publicly available rail tariffs in North America. In addition NML has commissioned a study to calculate the cost of the Quebec North Shore and Labrador (“QNS&L”) rail service in anticipation of further negotiations and other action with the rail carriers.
3.9 Environment
NML submitted an Environmental Impact Statements (“EIS”) for Area 3 to the Government of Newfoundland and Labrador (“GNL”) at the end of 2009. Based on knowledge of the GNL’s procedures, an approval is expected by May, 2010.
The deposits in Area 4 are located both in Quebec and in Newfoundland and Labrador, and therefore Project Notices have been submitted to the respective Governments. These deposits will be mined starting in the second year of full production for blending with the ores from Area 3. The preparation of an EIS for Area 4 is in progress and will be submitted in April, 2010. It is expected that Area 4 construction permits will be received in advance of the planned construction dates.
3.10 First Nations
Four First Nations will be affected by the project. Two of the four First Nations, the Naskapi Nation of Kawawachikamach (“NNK”) and the Nation Innu Matimekush Lac John (“NIMLJ”) live in the immediate vicinity of the project. Since 2005, NML has provided employment to both of these First Nations during the summer drilling season and has maintained a close relationship with the communities. NML has held meetings with members of the communities and Band Councils to explain the long term benefits of

New Millennium Capital Corp. Technical Report – Feasibility of the DSO Project Page 10
April 2010 Amended as of February 16, 2011
the project. All Nations have been provided with details of financial and other benefits offered by NML. Impacts and Benefits Agreement (“IBA”) negotiations are in progress with the affected Nations, but NML has yet to conclude any such agreements. NML has estimated the cost impact of IBAs based on the recent agreement reached between Consolidated Thompson Iron Mines Ltd. and Innu Takuaikan Uashat mak Mani Utenam (“ITUM”) of Sept-Îles, and used this information as the basis for the Study. The conclusion of IBAs is desirable, but not mandatory for the project to proceed.
3.11 Personnel Fly-in/Fly-out Concept
A camp to house some 200 persons, initially to be used by construction and later for operational personnel will be built near the dome. Operations personnel will be hired on the basis of four consecutive weeks of work followed by a one week rest and recreation period, when they will be returned to their home bases on a Fly-in/Fly-out basis.
3.12 Project Execution Plan
3.12.1 Project Management and Organization
To carry out the DSO Project, NML intends to adopt an Engineering, Procurement and Construction Management (“EPCM”) approach. However, unlike the traditional approach to such a project, the EPCM team will be an Integrated Project Team (“IPT”), comprised of personnel from New Millennium, EPCM firms, consultants and subcontractors.
The purpose of this project organization is to quickly and efficiently bring the project to production, while engaging the skills and expertise of different EPCM contractors and subcontractors on the project.
The project consists of the development of mines, processing facilities and supporting infrastructure, some of which will be geographically located at some distance from the others. The nature of the construction work at the different locations will also vary. The overall project comprises the elements shown in Figure 3.4
Figure 3.4: Overall DSO Project
It is therefore planned to engage contractors or consultants that are specialized in a specific area or process, and for them to provide the expertise and resources required to cover particular elements of the project as identified in Figure 3.4. The overall

New Millennium Capital Corp. Technical Report – Feasibility of the DSO Project Page 11
April 2010 Amended as of February 16, 2011
management and coordination of the DSO Project will be under the control of the IPT Project Manager, who will represent the owners of the project
The contracting structure would thus be as set out in Figure 3.5
Figure 3.5: Contracting Structure for IPT Approach
With this project structure, the IPT will be responsible for the scope and execution of the overall project, with the specific specialized personnel and consultants reporting through counterparts in the IPT to the IPT Project Manager.
3.12.2 The Integrated Project Team
The NML will establish a team, consisting of its employees or individual consultants who have been involved in the development of the DSO Project thus far, supplemented by newly-hired or contracted persons who have experience of the successful realization of projects of a similar nature.
3.13 Schedule
As soon as the required funds are received from Tata, NML will start detailed engineering, site camp mobilization and procurement of long-delivery equipment. NML considers it possible that it will receive a Full Notice to Proceed, issued by Tata, at the beginning of May, 2010. Based on the above, production is expected to start in mid October, 2011.
A Summary Master Schedule is presented as Figure 3.6

New Millennium Capital Corp. Technical Report – Feasibility of the DSO Project Page 12
April 2010 Amended as of February 16, 2011
Figure 3.6: Summary Master Schedule

New Millennium Capital Corp. Technical Report – Feasibility of the DSO Project Page 13
April 2010 Amended as of February 16, 2011
Figure 3.7: Timmins Site Overall Layout

New Millennium Capital Corp. Technical Report – Feasibility of the DSO Project Page 14
April 2010 Amended as of February 16, 2011
4.0 INTRODUCTION
4.1 General
New Millennium Capital Corp. (“NML”) holds a 100% interest in 512 claims in Québec and 217 claims in 15 licenses in Newfoundland and Labrador (“NL”) that are located in isolated claim blocks and extend from some 15 km southeast of Schefferville to some 55 km northwest of that town. In addition, the LabMag General Partnership (“LGP), in which NML has an 80% interest and the Naskapi Nation of Kawawachikamach (“NNK”) holds 20%,, also owns 32 claims in one license in Labrador and furthermore, as a result of an Asset Exchange Agreement with Labrador Iron Mines Ltd. (“LIM”), NML owns 71% and LGP owns 29% of eight claims in one other license in Labrador. The exploration and development of the hematite deposits on 22 properties that are covered by these claims constitutes the Direct Shipping Iron Ore (“DSO”) Project. Some of the deposits were developed and mined by Iron Ore Company of Canada (“IOCC”) from 1954 to 1982, under sub-leasing arrangements with the then owners of the claims. The deposits covered by the claims were reported by the Geological Survey of Canada to contain about 400 million tonnes of reserves and IOCC was reported to have produced in excess of 150 million tonnes of direct shipping ore containing about 58% Fe on a dry basis. In 1982, because of the depressed state of the global market for steel and therefore iron ore, IOCC closed its operations and the claims were allowed to lapse by their owners.
Since 2004, NML has obtained the above-referenced map-staked claims and licences from the governments of Quebec and Newfoundland and Labrador and has also acquired licences from LIM under the terms of the abo0ve-referenced Asset Exchange Agreement. The claims and licences cover hematite deposits that are understood either to have been developed or to have been identified for development by IOCC. Based on historical estimates, which are non-compliant with National Instrument (“NI”) 43-101 (“NI 43-101”), those claims contain approximately 113 million tonnes of resources. Using available geological, mining and other data for similar operations, NML undertook preliminary financial evaluations, on the basis of which it decided to re-activate production from these properties.
On October 1, 2008, NML announced that Tata Steel Global Minerals Holdings Pte. Ltd. (“Tata”) of Singapore, a member of the Tata Group that is the world’s sixth largest steel producer, had become a strategic investor in NML by purchasing 19.9% of NML’s shares. Under the terms of the deal, after NML’s completion of this Feasibility Study for the DSO Project, Tata Steel will have an option for a 180 day period to acquire an 80% equity interest in the DSO Project. Upon exercising the option, Tata will pay 80% of NML’s costs incurred to the exercise date to advance the DSO Project. Tata will arrange for funding for up to $300 million to earn its 80% share and will commit to take 100% of the DSO Project’s iron ore production for the life of the mining operation.
In February, 2009, NML issued a Pre-Feasibility Study of its Direct Shipping Iron Ore project and Met-Chem Canada Inc (“Met-Chem”) prepared a document entitled “TECHNICAL REPORT PRE-FEASIBILITY STUDY OF THE DSO PROJECT”, dated April 2009, that was filed with SEDAR on April 17, 2009 (“the PFS Technical Report”).

New Millennium Capital Corp. Technical Report – Feasibility of the DSO Project Page 15
April 2010 Amended as of February 16, 2011
The Pre-feasibility Study confirmed NML’s belief that the project is both technically feasible and financially viable.
In a news release issued on 06 November, 2009, it was announced that NML and Tata had signed a Joint Venture Agreement (“JVA”) to advance the development of the DSO Project. Under terms of the JVA, Tata and NML agree to form a Joint Venture Company (“JVC”) after Tata has delivered to NML a notice of joint venture investment arising after the Feasibility Study is completed by NML and delivered to Tata.
Throughout the development of the Feasibility Study, NML liaised closely with Tata. However, the Study was managed by NML and the conclusions of the Study are those of NML.
On 25 February, 2010, NML announced the results of the Feasibility Study to develop a project to mine 5.0 million natural tonnes per year of hematite ore and to produce therefrom 4.0 million dry tonnes per year of DSO products, consisting of:
80% of sinter fines (“SF”) product sized between 75 µm and 6mm;
20% a super fines (“SSF”) product sized at less than 75 µm.
The DSO products will be transported, in railcars, under contract by existing railway companies from the processing facilities located on a site near the mined-out Timmins #1 pit some 25 kms northwest of the Town of Schefferville (the “Timmins site”)to existing product storage and ship loading facilities at Pointe-Noire that are currently operated by a third party which, under contract, will operate them as a service to NML.
The project that is the subject of this report is based upon a flowsheet developed on the basis of the results of extensive test work carried out on exploration samples and bulk samples obtained in the years 2008 to 2009.
To assist in the carrying out of its Feasibility Study by addressing specific areas of its scope, NML retained the services of SGS Canada Inc. (“Geostat”), Genivar Société en Commandite, (“Genivar”) UMA Engineering Ltd. doing business as AECOM (“AECOM”) and Paul F. Wilkinson & Associates Inc. The drill hole database consists of data for holes drilled by NML in 2008 and 2009 and data for historical holes that was retrieved by NML from documents filed by previous owners of the DSO property with the Quebec Ministère des Ressources naturelles et de la Faune
4.2 Terms of Reference
NML instructed its Technical Team to review its Feasibility Study report on its Direct Shipping Iron Ore project and to document the review in a technical report prepared in compliance with the requirements of the Canadian Securities Administration (“CSA”) National Instrument 43-101 (“NI 43-101”)
The preparation of this technical report was authorized by Mr. Dean Journeaux, ing., Chief Operating Officer of NML.
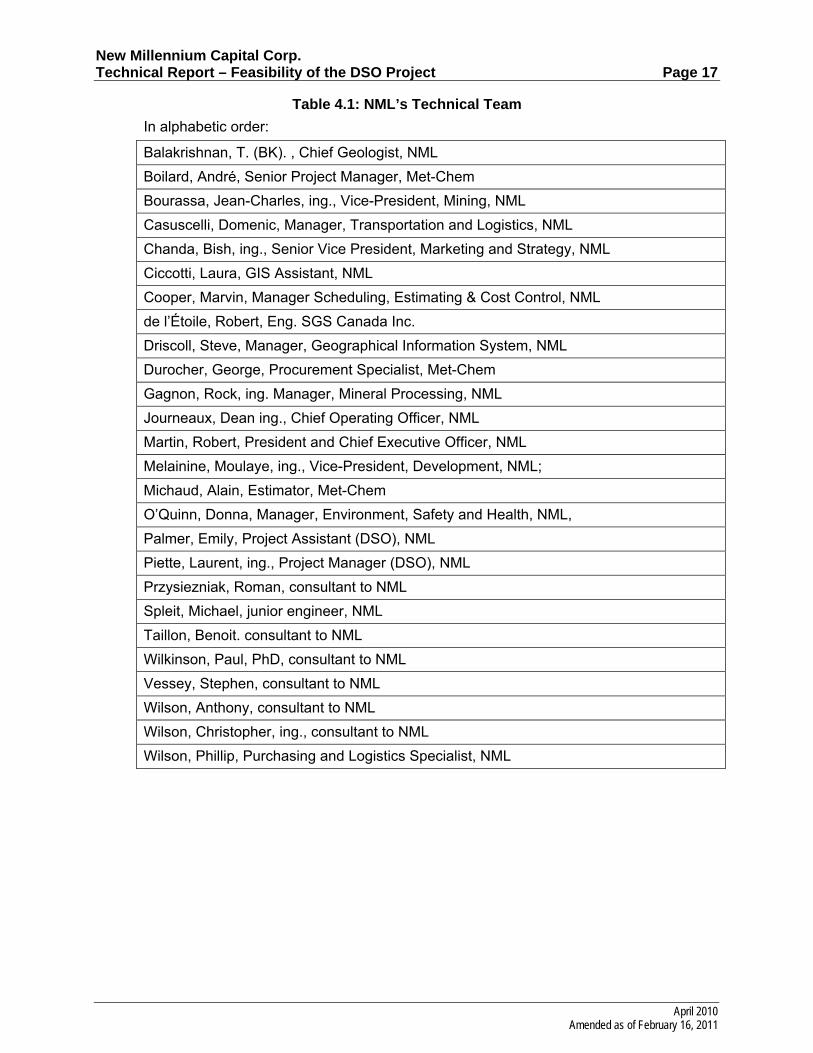
The NML and Met-Chem personnel and individual consultants who comprised the Technical Team are named in Table 4.1 and their work was supervised by the following persons all of whom, together with Mr. Journeaux, are Qualified Persons as defined by NI 43-101:
Mr. Bish Chanda, ing., Senior Vice-President, Marketing and Strategy, NML;
Mr. Jean- Charles Bourassa, ing., Vice-President-Mining, NMl;

New Millennium Capital Corp. Technical Report – Feasibility of the DSO Project Page 16
April 2010 Amended as of February 16, 2011
Mr. Moulaye Melainine, ing., Vice-President, Development, NML;
Mr Laurent Piette, ing., Project Manager (DSO);
Mr. Rock Gagnon, ing., Manager, Mineral Processing, NML;
Mr. André Boilard, ing.,Senior Project Manager, Met-Chem – Ind QP.
Mr. Robert de l’Etoile, Eng. SGS Canada Inc.
The resource estimate was prepared by Mr Robert de l’Ếtoile, Eng. of SGS Canada Inc., also a Qualified Person as defined by NI 43-101, in compliance with the Canadian Institute of Mines, Metallurgy and petroleum (“CIM”) Definitions and Standards on Mineral resources and Mineral Reserves, as adopted by the CIM council on 11 December, 2005.
New Millennium Capital Corp. Technical Report – Feasibility of the DSO Project Page 17
April 2010 Amended as of February 16, 2011
Table 4.1: NML’s Technical Team
In alphabetic order:
Balakrishnan, T. (BK). , Chief Geologist, NML
Boilard, André, Senior Project Manager, Met-Chem
Bourassa, Jean-Charles, ing., Vice-President, Mining, NML
Casuscelli, Domenic, Manager, Transportation and Logistics, NML
Chanda, Bish, ing., Senior Vice President, Marketing and Strategy, NML
Ciccotti, Laura, GIS Assistant, NML
Cooper, Marvin, Manager Scheduling, Estimating & Cost Control, NML
de l’Étoile, Robert, Eng. SGS Canada Inc.
Driscoll, Steve, Manager, Geographical Information System, NML
Durocher, George, Procurement Specialist, Met-Chem
Gagnon, Rock, ing. Manager, Mineral Processing, NML
Journeaux, Dean ing., Chief Operating Officer, NML
Martin, Robert, President and Chief Executive Officer, NML
Melainine, Moulaye, ing., Vice-President, Development, NML;
Michaud, Alain, Estimator, Met-Chem
O’Quinn, Donna, Manager, Environment, Safety and Health, NML,
Palmer, Emily, Project Assistant (DSO), NML
Piette, Laurent, ing., Project Manager (DSO), NML
Przysiezniak, Roman, consultant to NML
Spleit, Michael, junior engineer, NML
Taillon, Benoit. consultant to NML
Wilkinson, Paul, PhD, consultant to NML
Vessey, Stephen, consultant to NML
Wilson, Anthony, consultant to NML
Wilson, Christopher, ing., consultant to NML
Wilson, Phillip, Purchasing and Logistics Specialist, NML

New Millennium Capital Corp. Technical Report – Feasibility of the DSO Project Page 18
April 2010 Amended as of February 16, 2011
4.3 Units
In this report, unless specifically stated otherwise, quantities are generally expressed in the metric units as defined by the Système International d’Unités (“SI”), the standard practice in Canada and internationally and fiscal amounts are expressed in Canadian dollars.
Table 4.2 sets out the various Acronyms, abbreviations and symbols used in the Feasibility Study report and hence possibly appearing in this report
Table 4.2: Acronyms, abbreviations and symbols $
Dollar
° Degree of angle
°C Degree Celsius
” Inch English measure% Percentage µm Micron AECOM AECOM Canada Ltd.AG Assessment GroupAllmineral Allmineral Aufbereitungstechnik GmbH.Aus$ Australian dollarBF Blast furnace BOKELA BOKELA Ingenieurgesellschaft für Mechanische Verfahrenstechnik GmbH ¢/dmtu US cents per dry metric tonne unitCABO CABO Drilling (Ontario) Corp.CAGR Compound annual growth rateCan$ Canadian dollarCEAA Canadian Environmental Assessment ActCFA Chemin de Fer ArnaudCIF Carriage Insurance and FreightCIS Commonwealth of Independent StatesCOMFAR Computer model for feasibility analysis and reportingCVRD Companhia Vale do Rio Doce (now Vale)DEC Department of Environment and ConservationDFO Department of Fisheries and Oceans, CanadaDOE Dorr‐Oliver EriezDR Direct reductionDSO Direct shipping iron oreDSOP Direct Shipping Iron Ore ProjectDWT Deadweight tonnageEIA Environmental Impact AssessmentEIS Environmental Impact StatementELAIOM Elross Lake Area Iron Ore MineEPA Environmental Protection ActEPCM Engineering, Procurement and Construction ManagementEQA Environment Quality ActE/RBJ Interchange
Railway interchange to be located between Emeril and Ross Bay Junction
ESH Environment, Safety and HealthFe The chemical symbol for the element “iron”FOB Free on boardFS Feasibility Study

New Millennium Capital Corp. Technical Report – Feasibility of the DSO Project Page 19
April 2010 Amended as of February 16, 2011
GC Government of CanadaGDP Gross Domestic ProductGENIVAR GENIVAR Société en CommanditeGeostat SGS (Geostat) SGS Canada Inc..GIS Geographic Information SystemGNL Government of Newfoundland and LabradorGPS Global positioning systemGQ Government of QuébecGUIF Gray Upper iron formationH Hour Ha Hectare HAPSET Health and Post‐Secondary Education TaxHDPE High Density PolyethyleneHNS Hollinger North Shore Explorations Ltd.HP Horsepower HQ Hydro‐QuebecHVAC Heating, Ventilation and Air‐conditioningHW‐CMT Humboldt Wedag – Coal and Mineral TechnologiesIBA Impacts and benefits agreementi.e. that is Ing. Member of the "Ordre des ingénieurs du Québec"IOCC Iron Ore Company of CanadaIPT Integrated Project TeamIRR Internal rate of returnITUM Innu Takuaikan Uashat mak Mani UtenamJBNQA James Bay and Northern Québec AgreementJVA Joint Venture AgreementJVC Joint Venture CompanyKEQC Kativic Environmental Quality CommissionKg Kilogram Km Kilometre kPa Kilopascal Kt Kilotonne (1,000 kg)kV Kilovolt kVA Kilovolt‐amp kW Kilowatt kWh Kilowatt‐hourL Litre l/s litres per secondLBM Les Forages L.B.M.LC Lean chert LG 3D Lerch‐Grossman 3DLGP LabMag General PartnershipLIF Lower iron formationLIM Labrador Iron Mines Ltd.LME Labrador Mining and Exploration Co. Ltd.LOI Loss on ignitionLRC Lower red chertM Metre m² Square metre m³ Cubic metre M Million MCC Motor control centre

New Millennium Capital Corp. Technical Report – Feasibility of the DSO Project Page 20
April 2010 Amended as of February 16, 2011
MBE‐CMT McNally Bharat Engineering – Coal and Mineral Technologies MDDEP Ministère du Développement durable, de l’Environnement et des Parcs METSO METSO CorporationMg Milligram MIF Middle iron formationMin Minute Mintek Mintek, South Africa.MIMS Medium Intensity Magnetic SeparationMLSA The sum of the MnO, LOI, SiO2 and Al2O3 values for an ore block Mm Millimetre Mm³ Million cubic metresMP353 Mile Post 353 MRC Midland Research CenterMS Menihek formation (Shale)Mtpy Million tonnes per yearMVA Megavolt‐ampereMW Megawatt N North n.d. no date NEQA Northeastern Québec AgreementNI National InstrumentNL Newfoundland and LabradorNLH Newfoundland and Labrador HydroNIMLJ Nation Innu Matimekush‐Lac JohnNm³ Normal cubic metreNML New Millennium Capital Corp.NMLJ National Metallurgical Laboratory ‐ JamshedpurNNK Naskapi Nation of KawawachikamachNPV Net present valueNTP Notice to ProceedNTS National Topographic SystemNW Northwest PFS Pre‐feasibility studyPGC Pink grey chert
PMLSA The sum of MnO and LOI values plus predetermined fixed values for SiO2 and Al2O3
for an ore block PNL Province of Newfoundland and LabradorPpm parts per million Project Direct Shipping Iron Ore ProjectQA/QC Quality assurance/Quality controlQNS&L Québec North Shore and LabradorRBC Rotation Biological ContactorRF Ruth formationROE Return on equityROM Run‐of‐mine Rpm revolutions per minuteRUIF Red Upper iron formationSCIF Silicate Carbonate iron formationSE Southeast SGA Studiengesellschaft für Eisenerz‐AufbereitungSGS SGS Lakefield Research LimitedSF Sinter Fines SiO2 The chemical formula for silica

New Millennium Capital Corp. Technical Report – Feasibility of the DSO Project Page 21
April 2010 Amended as of February 16, 2011
SIPA Sept‐Îles Port AuthoritySLon A type of WHIMS manufactured in ChinaSSF Super Fines T Metric tonne Tata Tata Steel Global Minerals Holdings Pte Ltd.Tph Tonnes per hourTpy Tonnes per yearTSH Tshiuetin Rail Transportation Inc.UCS Uniaxial compressive strengthUIF Upper iron formationUNCTAD United Nations Conference on Trade and DevelopmentUNIDO United Nations Industrial Development OrganizationURC Upper red chertUS$ American dollarUSA United States of AmericaUTM Universal Transverse MercatorV Volt VEC Valued Ecosystem ComponentVFD Variable Frequency DriveW West WBS Work Breakdown StructureWM Wabush MinesWi Work index WHIMS Wet High‐Intensity Magnetic SeparationYMIF Yellow Middle iron formationY Year XRF X‐Ray Fluorescence (analytical method)

New Millennium Capital Corp. Technical Report – Feasibility of the DSO Project Page 22
April 2010 Amended as of February 16, 2011
4.4 Notice
This document contains the expression of the professional opinion of employees of, and consultants to, NML (collectively, the “Contributors”) as to the matters set out herein, using their professional judgment and reasonable care. It is to be read in the context of the methodology, procedures and techniques used, any agreements entered into with NML, their assumptions, and the circumstances and constrains under which the work was performed. This document is written for the sole and exclusive benefit of NML. The Contributors disclaim any liability to NML and to third parties in respect of the publication, reference, quoting, or distribution of this report or any of its contents to and reliance thereon by any third party. The Qualified Persons who prepared this report do not assume any responsibility or liability for losses occasioned by any party as a result of the circulation, publication or reproduction or use of this report contrary to the provisions of this paragraph. Notwithstanding anything contained in this paragraph each Qualified Person does not: (a) disclaim responsibility for, or reliance on, that portion of the report the Qualified Person prepared or supervised the preparation of; or (b) limit the use of publication of the report in a manner that interferes with NML's obligation to reproduce the report by filing it on SEDAR.
,

New Millennium Capital Corp. Technical Report – Feasibility of the DSO Project Page 23
April 2010 Amended as of February 16, 2011
5.0 RELIANCE ON OTHER EXPERTS
The Feasibility Study and, therefore this technical report, is based in part upon data, design criteria and information developed by firms acting as consultants to NML and use was made of reports by
Paul F, Wilkinson & Associates Inc. for all environmental aspects;
Metallurgical testing firms and laboratories:
ALS Chemex (“Chemex”)
Metso Corporartion (“Metso”);
Studiengesellschaft für Eisenerz-Aufbereitung (“SGA”)
Mintek, South Africa;(“Mintek”)
Midland Research Center (‘MRC’);
Allmineral Aufbereitungstechnik GmbH.(“Allmineral”);
Humboldt Wedag – Coal and Mineral Technologies (“HW-CMT”);
Outotec Oyj (“Outotec”);
Dorr-Oliver Eriez (“DOE”);
National Metallurgical Laboratory – Jamshedpur (“NMLJ”);
COREM;
McNally Bharat Engineering – Coal and Mineral Technologies (“MBE-CMT”);
BOKELA Ingenieurgesellschaft für Mechanische Verfahrenstechnik GmbH (“Bokela”).
Genivar Société en Commandite for the work required at the product storage and ship loading facilities at Pointe-Noire, Quebec;
UMA Engineering Ltd. doing business as AECOM, for all aspects relating to the transportation of ore in railcars between the Timmins Site and the product storage and ship loading facilities at Pointe-Noire, Quebec
Ferrum Consultants, for a market analysis that formed the basis for the estimation of DSO product prices;
The authors of each of the above-listed reports are responsible for the contents thereof.
6.0 PROPERTY DESCRIPTION AND LOCATION
6.1 Location
The 22 deposits of the DSO project (the “Property”) are situated to the northwest and southeast of the Town of Schefferville, along an imaginary NW-SE line, and some are on the Quebec side and some are on the Labrador side of the provincial border. By

New Millennium Capital Corp. Technical Report – Feasibility of the DSO Project Page 24
April 2010 Amended as of February 16, 2011
reference to the National Topographic System (“NTS”), they are in the regions 23J/10, 23J/14, 23J/15 and 23O/03, as shown in Table 6.1.
The locations of the deposits and claims are shown on Figure 6.1 and details of the DSO claims in Québec and licenses in Newfoundland and Labrador are set out in Table 6.2
Table 6.1: Grouping by Area of the Deposits of the DSO Project
AREAS DSO 2 & 3 AREA DSO 4
(23J/15) (23J/14) Goodwood
Star Creek 2 Fleming 7N Kivivic
Ferriman 4 Fleming 7X Sunny 1
Fleming 6 Timmins 3N Leroy 1
Timmins 4
Timmins 7
Timmins 8
Barney 1
Barney 2
Sawmill
Timmins 3S
In addition to the above–listed deposits, NML has identified as potential targets for exploration some other deposits in Québec and in Newfoundland and Labrador, listed in Table 6.1 for which no historical resource estimates are available:
Table 6.1: Potential Targets for Exploration Area DSO 3 Snow Lake 1
Area DSO 3 Snow Lake 2
Area DSO 3 Elross 2
Area DSO 3 Aurora
Area DSO 4 Sunny 2

New Millennium Capital Corp. Technical Report – Feasibility of the DSO Project Page 25
April 2010 Amended as of February 16, 2011
Figure 6.1: Location of DSO Deposits, Claims and Principal Infrastructure

New Millennium Capital Corp. Technical Report – Feasibility of the DSO Project Page 26
April 2010 Amended as of February 16, 2011
Table 6.2: DSO Claims and Licenses PROVINCE AREA LICENSE(S) CLAIMS AREA (HA)
Newfoundland and Labrador DSO 1
016574M 10 250 016572M 1 25
DSO 2 &DSO 3 (Timmins 3N,4*,7,8, Fleming 7N) * held by LGP
016533M 10 250 015914M 3 75 016016M 25 625 016503M 12 300 016580M 32 800 016958M 18 450
DSO 4 (Kivivic 1C,2*,3N,4,5)
014674M 1 25 014675M 1 25 015850M 79 1,975 015851M 5 125 015852M 1 25 015853M 3 75 016015M 47 1,175 016290M 8 200 016670M 1 25
Total Newfoundland and Labrador 17 licenses 257 6,425Québec
DSO 1
2172703 (group) 1 49.75 58038 (group) 4 115.6 58044 (group) 2 99.51 58047 (group) 1 49.77
DSO 2 & DSO3 (Star Creek 2, Ferriman 4, Timmins 3S, Fleming 6,7X, Barney 1,2, Sawmill 1)
2151895 (group) 1 39.64 2179975 (group) 2 89.67 2180419 (group) 2 71.29 51671 (group) 4 198.59 98011 (group) 1 39.18
2148786 (group) 4 95.64 2153808 (group) 2 15.99 2161015 (group) 1 49.58 2161706 (group) 1 46.04 2171745 (group) 7 347.32 2179974 (group) 2 90.77 2179977 (group) 2 99.24 2180421 (group) 2 89.77 2188490 (group) 1 40.65 2188827 (group) 1 26.31 2189996 (group) 4 180.46 2190000 (group) 1 37.96 50744 (group) 10 410.55
DSO 4 (Goodwood, Kivivic 3S, Leroy 1, Sunny 1)
2050700 (group) 3 148.15 2082420 (group) 58 2798.98 2082463 (group) 30 1388.73 2148790 (group) 4 31.63 2171752 (group) 2 98.6 2190615 (group) 2 98.62 2192007 (group) 2 98.61 2192785 (group) 2 98.64 50755 (group) 6 295.89 58049 (group) 9 293.53 99048 (group) 5 246.63
DSO Exploration 2172713 (group) 333 15,479.91 Total Québec 512 23,361.2

New Millennium Capital Corp. Technical Report – Feasibility of the DSO Project Page 27
April 2010 Amended as of February 16, 2011
6.2 Property Description and Ownership
The Property comprises 512 map-staked claims in Québec and 257 map-staked claims in 17 licenses in Newfoundland and Labrador, covering 22 properties that are located in isolated claim blocks and extend from some 15 km southeast of the Town of Schefferville to some 55 km northwest of that town. NML has a 100% interest in 15 of the 17 licenses and a majority interest in the other 2 licenses. Map-staked claim means a claim giving the holder the exclusive right to explore for minerals in an area covered by the claim. A claim does not bestow any surface rights.
The claim group extends for a distance of about 70 km aligned on a north-northwest – south-southeast axis. Map-staking of claims started in 2005 and is ongoing. The Property has not been legally surveyed but map-staked claims are defined on the basis of Universal Transverse Mercator (“UTM”) coordinates and consequently the Property location is accurate. Claim and license data are summarized in Table 6.2
6.3 Property Agreements
NML owns either 100% or a majority share in the claims referred to in the preceding subsection and the mining of the Property is not subject to any agreement with any other entity.
6.4 Royalties
NML has not entered into any agreements regarding royalties payable on the extraction or sale of mineral from the Property.
6.5 Permitting
Permits Nos. E090058 and E090072 giving NML permission to carry out exploration work in the DSO Areas were issued by the Newfoundland and Labrador Department of Natural Resources in May 2009 and were valid until December 31, 2009. A corresponding permit, No. 3004790, was issued by the Quebec Ministère des Ressources naturelles et de la Faune in April 2008 and was valid until 31 March, 2009. New permits will be obtained as and when required.
6.6 Environmental Issues
The authors know of no environmental baseline investigations or studies carried out by previous owners of the DSO deposits and it is unlikely that neither Labrador Mining and Exploration Co. Ltd. (“LME”) nor Hollinger North Shore Explorations Ltd. (“HNS”), the companies that carried out the initial exploration of the area, nor IOCC, the subsequent owner of the Property, carried out any such studies during their tenure, as there was no legal requirement for environmental impact assessments at that time. Since becoming the owner of the Property, NML has, through the environmental consulting firm Paul F. Wilkinson & Associates (“PFWA”), arranged for 25 baseline studies covering all environmental aspects, including archaeology, biophysics, land and resource use by First Nations, to be undertaken by some ten firms, each with a specific expertise. The baseline data collected up to and including the summer and fall of 2009 suggest that there are no matters of environmental concern that cannot be avoided or mitigated.

New Millennium Capital Corp. Technical Report – Feasibility of the DSO Project Page 28
April 2010 Amended as of February 16, 2011
7.0 ACCESSIBILITY, CLIMATE, LOCAL RESOURCES, INFRASTRUCTURE AND PHYSIOGRAPHY
7.1 Access
The Property is accessible to its nearest point by a good gravel road, an old IOCC mine haulage road, for 25km northwest of Schefferville past some former open pit mines to a point near the old Timmins #1 pit. For a further 30km or so to the Goodwood deposit, a new road will be constructed along the route of the track that is currently only usable by 4x4 Pick-up trucks or All-Terrain Vehicles.
A network of all-weather roads connects Schefferville to the neighbouring Matimekush and Lac John reserves and to Kawawachikamach. Roads also lead to the railway station, to the cemetery, to old mine sites, to the town’s water treatment facilities, to the Menihek Dam, to lac de la Squaw and to lac Chantal (MRC de Caniapiscau no date). Schefferville is not, however, connected to the outside world by road.
The Schefferville Airport is owned by Transport Canada. It has been leased and operated by the Schefferville Airport Corporation, which belongs equally to the NNK and NIMLJ, since March 1999, prior to which it was operated by the NNK since the early 1990s. The airport is classified as a Remote Airport under the National Airports Policy. According to Transport Canada (no date) the area of the Schefferville Airport is 125 ha and i Its facilities include an air terminal building of 200 m2
built in 1971, one paved runway (5000' X 150'), and a combined fire hall and maintenance garage of 1,130 m2
Again according to Transport Canada, the airport serves around 1,500 people regionally.
Air Inuit operates daily flights between Schefferville and Sept-Îles and three flights per week between Schefferville and Montréal via Quebec City.
Nolinord operates two to three charter flights per week between Montréal and Schefferville during the sport hunting season for caribou in August and September. Every year, approximately 2,200 passengers, mainly the clients of outfitters, use this service (Boudreault, July 13, 2006).
TSH, which is owned in equal parts by NNK, NIMLJ and ITUM, provides passenger and freight rail transportation services between Schefferville and Sept-Îles. There are two passenger trains and one freight train per week. The trains are operated by TSH employees from Schefferville to Ross Bay Junction and by QNS&L employees between Ross Bay Junction and Sept-Îles.
The major infrastructure associated with the train service in Schefferville is a maintenance shelter, built in 2006-2007 and a station. The station employs two full-time workers (ITUM, NNK and NIMLJ, November 28, 2003).
7.2 Climate
The description remains as set out in the PFS Technical Report.
7.3 Local Resources and Infrastructure
The description remains as set out in the PFS Technical Report.
7.4 Physiography
The description remains as set out in the PFS Technical Report.

New Millennium Capital Corp. Technical Report – Feasibility of the DSO Project Page 29
April 2010 Amended as of February 16, 2011
7.5 Land use
Descriptions of:
Land use by First Nations; Outfitting; Cultural and Heritage Sites; Protected Areas; Current Industrial Land Use; Past Industrial Land Use; Potential Site Contamination from Past Land Use. remain as set out in the PFS Technical Report.

New Millennium Capital Corp. Technical Report – Feasibility of the DSO Project Page 30
April 2010 Amended as of February 16, 2011
8.0 HISTORY
8.1 General
Most of the 22 deposits occurring in the four DSO Areas were originally discovered by geologists working for Labrador Mining and Exploration Co. Ltd. (“LME”) and Hollinger North Shore Explorations Ltd. (“HNS”). The exploration work included ground magnetometer and gravity surveys followed by test pitting, trenching and test drilling. Once a favourable target was outlined, deeper holes were drilled on a broad grid pattern to define the structure, and the ore at depth and the grade. The drilling method included standard diamond drilling, chop and drive and mud tricone drilling. However, on several of the deposits, drilling was insufficient to permit the estimation of minable reserves and the development of pit designs.
In 1949, IOCC was formed to develop and mine all the deposits outlined by LME and HNS. IOCC carried out detailed development work by mapping, trenching, test drilling and tonnage drilling on each of the deposits to classify them under measured, indicated and inferred categories. The deposits covered by the claims were reported by the Geological Survey of Canada to contain about 400 million tonnes of reserves and IOCC was reported to have produced in excess of 150 million tonnes of direct shipping ore containing about 58% Fe on a dry basis. When IOCC ceased its mining operations in 1982, these deposits were left at various stages of development and the claims were allowed to lapse.
Since 2004, NML has staked several blocks of claims to cover the deposits in NL and QC that were previously developed or intended to be developed by IOCC, as well as any other potential sources of DSO. As blocks were acquired, NML initially carried out preliminary field investigations to outline the surface extension of the deposits by locating old drill holes, test pits and trenches. Subsequently, ground magnetometer surveying, outcrop mapping, sampling of material from the old trenches and test pits and trenching and test pitting to collect fresh samples were carried out. However, no drilling was done on any of the deposits.
Between 2005 and the end of 2009, NML obtained the map-staked claims referred to above from the governments of Quebec and Newfoundland and Labrador and also acquired licences from LIM under the terms of an Asset Exchange Agreement. The claims and licences cover hematite deposits that are understood either to have been developed or to have been identified for development by IOCC. Based on historical estimates, which are non-compliant with National Instrument (“NI”) 43-101 (“NI 43-101”), those claims contain approximately 113 million tonnes of resources.
As blocks were acquired, NML initially carried out preliminary field investigations to outline the surface extension of the deposits by locating old drill holes, test pits and trenches. Subsequently, ground magnetometer surveying, outcrop mapping, sampling of material from the old trenches and test pits and trenching and test pitting to collect fresh samples were carried out. However, no drilling was done on any of the deposits at that time.
Using available geological, mining and other data for similar operations, NML undertook preliminary financial evaluations, on the basis of which it decided to re-activate production from these properties under the name of the DSO Project.

New Millennium Capital Corp. Technical Report – Feasibility of the DSO Project Page 31
April 2010 Amended as of February 16, 2011
9.0 GEOLOGICAL SETTING
Descriptions of:
Regional Geology; Local Geology; Property Geology
remain as set out in the PFS Technical Report.

New Millennium Capital Corp. Technical Report – Feasibility of the DSO Project Page 32
April 2010 Amended as of February 16, 2011
10.0 DEPOSIT TYPES
The description of the type of the DSO deposits and the Deposit Model remain as set out in the PFS technical Report.

New Millennium Capital Corp. Technical Report – Feasibility of the DSO Project Page 33
April 2010 Amended as of February 16, 2011
11.0 MINERALIZATION
The iron deposits are a residually enriched type within the Sokoman and Ruth Formations. These formations were folded and faulted during two periods which resulted in intense fracturing. The percolating meteoric waters through the fractured iron formation leached the silica and thereby enriching the host rock into porous, granular and friable high grade iron ore deposits.
The second type of enrichment is in the form of the addition of secondary iron oxides, goethite, limonite and manganese oxides, pyrolusite and manganite. These products were the result of the alteration of iron carbonates (siderite), iron silicates (minnesotite) and manganese carbonates (rhodocrosite, kutnahorite). These oxides were carried in solution and deposited in the pore spaces.
The types of ore formed in the deposits are directly related to the different stratigraphic units. The predominantly blue ore was formed from the oxide rich middle iron formation and occasionally from the upper iron formation. The yellow-brown ore, composed of goethite-limonite, formed from the silicate-carbonate rich lower iron formation. The earthy red ore was derived from the argillaceous slaty sections of the Ruth Formation. The overall ratio of blue to yellow to red ore is approximately 70%:15%:15%. The proportion of each varies widely within the deposits.
Following the IOCC classification and definition, three ore types with the following criteria are being used to classify the resources:
Ore, blue, yellow and red: Fe +50%, SiO2% < 18%, Mn <3.5% (dry basis).

New Millennium Capital Corp. Technical Report – Feasibility of the DSO Project Page 34
April 2010 Amended as of February 16, 2011
12.0 EXPLORATION
In order to keep its claims in good standing, NML conducted reconnaissance programs in 2005, 2006 and 2007 that consisted mainly of mapping, with limited collection of grab samples.
During the summer of 2008, NML undertook an exploration program involving the drilling of 140 holes to evaluate the mining potential of several deposits which had been explored in detail by IOCC. Some of the deposits were fully developed for mining and some require additional developmental work. NML carried out detailed investigations on ten of the 22 deposits that occur in Areas 02, 03 and 04. Work continued in 2009, when five deposits, Goodwood, Kivivic 4, Sunny 1, Fleming 7N and Ferriman 4 were drilled and bulk samples were collected for testing. Kivivic 4 and Sunny 1 deposits were also drilled, for tonnage and grade estimation purposes.
The work involved reverse circulation drilling, sonic drilling, trenching and test pitting to provide samples and to delineate the surface extent of the deposits. In addition, bulk samples representing the three different types of ore were collected from several deposits for testing.
12.1 Bulk Sampling
12.1.1 2008 Program
Eleven bulk samples, each of 200 tonnes, were collected from deposits occurring in Areas 2, 3 and 4. These representative samples were collected from Blue, Red and Yellow ore types from various deposits, as follows:
Area 2: Ferriman 4 deposit, one red and one yellow ore samples;
Area 3: Timmins 4 deposit, one blue ore sample;
Timmins 3N deposit, one blue ore sample;
Timmins 7 deposit, one blue ore sample;
Fleming 7N deposit, one red ore sample;
Area 4: Goodwood deposit, two blue and one yellow ore samples;
Kivivic 4 deposit, one blue ore sample;
Kivivic 5 deposit, one blue ore sample.
The samples were crushed and screened in a plant that was temporarily erected and operated by a contractor in the old IOCC ballast quarry on the mine road to the north of Schefferville to produce, as required at that time, a coarse lump ore product (-32 mm, +6 mm) and a fine (-6 mm) fraction. For each ore type, the percentage of the lump ore present was determined, as was the chemical analysis.
From each bulk sample, a 10-tonne sample of the crushed ore was collected and shipped to MRC laboratory, Nashwauk, Minnesota, USA. These samples were used for conducting washing tests to determine the extent to which silica, alumina and phosphorous in that fraction could be reduced. 300kg composite samples were sent by air to overseas laboratories, one to SGA in Germany and four to Mintek in South Africa, for tests that enabled NML to develop the Process Plant flowsheet.

New Millennium Capital Corp. Technical Report – Feasibility of the DSO Project Page 35
April 2010 Amended as of February 16, 2011
12.1.2 2009 Program
Using sonic core drilling, seven bulk samples, totalling some 15 tonnes, were collected from deposits occurring in Areas 2, 3 and 4. These representative samples were collected from Blue, Red and Yellow ore types from various deposits, as follows:
Area 2: Ferriman 4 deposit, one (3 t) red and one (1.0 t) yellow ore samples.
Area 3: Fleming 7N deposit, one red ore sample;
Area 4: Goodwood deposit, one (3 t) blue and one (1.5 t) yellow ore samples
Kivivic 4 deposit, one (3 t) blue ore sample
Sunny 1 deposit, one (3 t) blue ore sample
These samples were collected in 200-litre drums that were then shipped to COREM in Quebec City for processing and testing

New Millennium Capital Corp. Technical Report – Feasibility of the DSO Project Page 36
April 2010 Amended as of February 16, 2011
13.0 DRILLING
13.1 Historical Drilling
The deposits under study were drilled in the 1950‟s by IOCC using tricon drilling methods. There are no details available specific to this drilling activity. What remains is the list of drill holes and results that were archived by the Quebec government. Table 13.1: Summary of the IOCC drill holes per deposit reported presents a summary of the IOCC drill holes available per deposit being reported.
Table 13.1: Summary of the IOCC drill holes per deposit reported IOCC
Deposit Number of holes
Nb of holes with assays
Cumulated hole length (m)
Goodwood 50 38 2,191.00 Timmins 7 18 18 214.00 Timmins 4 44 20 1,573.00 Timmins 3 0 0 Fleming 7 35 35 423.00 Ferriman 4 87 64 2,810.00 Kivivic 3 1 1 105.20 Kivivic 5 0 0
Total 235 176 7,316.20
13.2 2008 Program: Reverse Circulation Drilling
The first phase of the DSO drilling program, involving the use of reverse-circulation drills, started on 21 July 2008 and concluded on 24 October 2008. During that period, 140 holes were drilled for a total of 7834.8 m and 2,396 samples were collected for analysis. The drilling was carried out by two contractors, CABO Drilling (Ontario) Corp. (“CABO”), and Les Forages L.B.M. (“LBM”). Table 13.1 summarizes the 2008 program by area.
Table 13.2: 2008 Grouping by Area of the Deposits of the DSO Project
Area Deposit No. of Holes Total Metres No. of
Samples
4
Goodwood 25 1652 499 Kivivic 4 13 596 178 Kivivic 3N 10 506 162 Kivivic 5 8 426.5 132 Sunny 1 2 86 25
Total Area 4 58 3,266.5 996
3
Fleming 7N 20 1,175.2 353 Timmins 4 25 1,160.5 365 Timmins 3N 10 753 244 Timmins 7 12 562 182
Total Area 3 67 3,650.7 1,144 2 Ferriman 4 15 917.6 256
Total Area 2 15 917.6 256
New Millennium Capital Corp. Technical Report – Feasibility of the DSO Project Page 37
April 2010 Amended as of February 16, 2011
Total all Areas 140 7,834.8 2,396
13.3 2009 Program: Sonic Drilling
The second phase of the program took place during the summer months of 2009, when the drilling was carried out using a sonic drill provided by a contractor, Boart Longyear Ltd. The leached and enriched deposits are porous, friable with thin bands of hard layers and do not core well when diamond drills are used. The sonic drill provides continuous core from the surface downwards without any contamination. Initially, the sonic drill pushes the core barrel, which is tipped with a 4” (101.6 mm) diameter tungsten carbide bit, into the ground by means of vibration and rotation. Water or air is not used as a drilling medium. The drill cores the bed rock like a diamond drill. After drilling 5 ft (1.52m), a 6” (152.4 mm) casing is inserted over the core barrel and set in to the depth to which the bed rock was cored. The core barrel with the core is then pulled up from the ground and the core is extracted, after which the core barrel is re-inserted into the hole and drilling proceeds for a further 5 ft. This method of drilling and casing continuously prevents sample contamination.
The extracted core is put into long plastic bags that are just wide enough to fit the core, and the bagged cores are put into wooden core boxes that are clearly marked with the hole number and the starting and ending length of the core. The core box is shipped to the field office for logging and sampling by the geologist and samples are collected at 3 m intervals.
The core samples were sent to COREM laboratory in Quebec City and analyzed for Fe%, SiO2%, MnO%, Al2O3%, P%, CaO%, MgO% and LOI%.
During this program 950 samples were collected from holes drilled for bulk sampling and from holes drilled for tonnage/grade estimation. In addition 71 duplicate samples were sent to COREM as an internal check. Table13.2 summarizes the 2009 program by area
Table 13.3: Summary of DSO Drilling, 2009 Area Deposit No. of holes Total Metres Total Samples
4 Goodwood 10 406.3 110 Kivivic 4 44 1,553.2 460 Sunny 1 31 913.5 287
Total Area 4 85 2,873.0 857 3 Fleming 7N 2 66.1 21
Total Area 3 2 66.1 21 2 Ferriman 4 7 299.6 97
Total Area 2 7 299.6 97 Total all Areas 94 3,238.7 975
13.4 Drilling Results
Historical Drilling results and analysis for the tonnage holes drilled by HNS and LME in deposits Goodwood and Ferriman 4 were obtained from the open files available at the Ministry of Natural Resources of the respective Governments. Test drilling holes, which were drilled to check the bedrock, are shallow holes. This data is available for most of

New Millennium Capital Corp. Technical Report – Feasibility of the DSO Project Page 38
April 2010 Amended as of February 16, 2011
the deposits in the open files. All these results were incorporated in the NML database and were used in the interpretation of sections along with the current drilling data.
13.4.1 DSO Area 4
All the assay results have been received for the deposits drilled in this area. Geological interpretation has been completed, sections have been prepared, and resource models for use in pit design have been prepared for the Goodwood, Kivivic 3, Kivivic 4, Kivivic 5, and Sunny 1 deposits. Evaluation of the analytical data indicates that the overall grade remains the same as that given in IOCC data obtained from Assessment Reports available from the GQ.
The MIF (Blue) ore in Goodwood has higher LOI values compared to the Kivivic and Sunny deposits and deposits in DSO 3 area. The drill cuttings also show the presence of more goethite than in the other areas.
13.4.2 DSO Area 3
All the assays have been received for the deposits drilled in DSO 3 area. The geological interpretation of the data is complete and sections were prepared for deposits Timmins 3N, Timmins 4, Timmins 7 and Fleming 7N. Resource modeling of these deposits was completed.
13.4.3 DSO Area 2
All the assays have been received for the Ferriman 4 deposit. The geological interpretation of the data is complete and sections were prepared. Resource modeling of this deposit was completed.
14.0 SAMPLING METHOD AND APPROACH
Reverse circulation drilling utilizes a dual-tube drill pipe. The drilling fluid, water, and air are pumped down the outer tube of the drill pipe and return with the drill cuttings through the inner tube. This eliminates contamination of the samples. The circulation velocity is high and the rapid return assures that the cuttings are returned in the order they were drilled. The volume of the samples, which are a mixture of water and solids, obtained for a 3 m interval can be high, depending upon the diameter of the hole. Cabo used a 73 mm drill bit, while LBM used a 98 mm bit for drilling and therefore varying amounts of sample were returned for a 3 m drilling length.
The Cabo drill with a smaller diameter bit used a two-way splitter and half the sample was collected while the other half was rejected. Each collected sample weighed between 10 and 15 kg. The LBM drill with a larger bit used a rotary splitter with 24 partitions. The splitter rotates on its vertical axis while the sample water mixture is being discharged over it. After initial experimentation, it was found that collecting one sixth of the discharged sample was sufficient to obtain a sample weighing between 10 and 15 kg, with the five sixths portion being rejected.
The samples were collected continuously once the bedrock-overburden contact was established by the geologist at the site who periodically checked the cuttings using a

New Millennium Capital Corp. Technical Report – Feasibility of the DSO Project Page 39
April 2010 Amended as of February 16, 2011
sieve to ascertain the bedrock geology. Every 3 m, the pails were changed to collect the next sample in the form of slurry that was left to stand for a few minutes so that the finer fraction settled. The water was then carefully decanted and the remaining solid/water mixture was collected in plastic bags as a sample.
A list of relevant drill hole intersections with values could be found in SGS Geostat report on Sedar.

New Millennium Capital Corp. Technical Report – Feasibility of the DSO Project Page 40
April 2010 Amended as of February 16, 2011
15.0 SAMPLE PREPARATION, ANALYSIS AND SECURITY
The following procedure was used by ALS Chemex at its laboratory in Sudbury, Canada, which processed and analyzed the DSO laboratory samples obtained by reverse-circulation drilling in 2008. NML was unable to obtain from COREM a description of the procedure used in processing and analyzing the DSO samples taken in 2009.
Drying
Wet samples weighing between 10 and 15 kg were received at the laboratory, where they were weighed and bar-coded for tracking prior to being dried in ovens that are controlled to a maximum temperature of 60°C.
Crushing
Using jaw and/or roll crushers, the dried samples were crushed to 70% -2mm, or better.
Splitting
Using a riffle splitter, a representative sample of 250 g was taken for further processing.
Pulverizing
The entire 250g sample was pulverized to 85% passing 75 micron (200 mesh), or better, using “flying disk” or “ring and puck” style grinding mills.
Analysis
The samples were analyzed by lithium borate fusion and XRF methods. The results were reported as percentage by weight of Fe, Mn, CaO, MgO, P, SiO2, Al2O3 and LOI.
In total, from the ten deposits drilled in 2008, 2,396 samples were submitted for analysis and in 2009 an additional 975 samples were submitted, analysis results have been received and interpretation has been completed. Geological and resource models have been made for all the drilled deposits.

New Millennium Capital Corp. Technical Report – Feasibility of the DSO Project Page 41
April 2010 Amended as of February 16, 2011
16.0 DATA VERIFICATION
16.1 Site Visits
Messrs. Journeaux, and Melainine, both Qualified Persons, made a number of separate visits to the areas in which are located the various deposits and, most recently, on 31 August and 1 September, 2009, they both visited the Timmins Site. In addition to participating in the 31 August visit to the Timmins Site, Mr Bourassa, also a Qualified Person, visited the area of the Goodwood deposit (the “Goodwood Site”) and nearby deposits by road on 1 August, 2009, and by helicopter on 1 September, 2009. Mr Piette visited the Timmins and Goodwood sites on 23 March, 2010.
Mr. Robert de l’Ếtoile, having visited the sites of eight deposits in his capacity as an independent Qualified Person on 30 September, 2008, did not consider it necessary to make a visit in 2009.
16.2 Integrity of the drill hole databases
A database was set up for each individual deposit. Historical drill hole data from IOCC was recovered from the public domain and computerized by NML. A thorough data validation procedure was put in place during data entry. SGS Geostat has verified a selection of historical drill holes against the original paper logs and found no significant errors. Logs of historical drill holes were acquired from government geological archives. Since all historical logs were reported using a local coordinate system no longer in use, a reliable transformation to modern UTM coordinates was developed. This transformation was derived from 76 holes for which both modern GPS coordinates and historical local coordinates were available, achieving a root mean square error of approximately 2 metres. Regarding the holes from the 2008 and 2009 drilling campaigns, the databases were constructed directly from the electronic assay certificates received from the assay laboratory. SGS Geostat carried out random checks between the assay certificates and the drill hole database and found no errors. As mentioned in the section above, SGS Geostat has verified the field location of several 2008 drill holes and of several 2009 drill holes and, within the accuracy of the GPS device used, found a very good correlation with the database.
16.3 Quality control measures
There is no information on quality control measures taken in the historical drilling information. Only copies of original drill hole logs are available from the public domain (Quebec Ministry Natural Resources and Fauna (MRNF). In order to validate the historical information, a certain number of holes drilled in 2008 were located near the location of the old holes, close enough to be considered twins. The next section addresses the twin holes.
During the 2008 RC drilling campaign, quality control measures were directly handled by the main laboratory, ALS Chemex in Sudbury. NML has not set up its own quality control procedures using duplicates or blanks or standards. The main laboratory directly selected prepared pulps and sent them to a check laboratory, SGS Lakefield. SGS was instructed to hold on to the results of the check assays and to send them directly to SGS Geostat for analysis. From the check assay certificates, a total of 110 pulp duplicates were recovered. Based on a total of 2,159 samples available from the 2008 campaign, there is a ratio of 1 in 20 samples with pulp duplicate assays.

New Millennium Capital Corp. Technical Report – Feasibility of the DSO Project Page 42
April 2010 Amended as of February 16, 2011
SGS Geostat has inspected the results of the pulp duplicates for Fe, SiO2 and Mn and as expected, found a remarkably high correlation coefficient. However, the duplicates reported a Fe grade higher than the original assays by 1.7% (average originals of 53.56% Fe versus an average of 54.45% Fe for the duplicates). This discrepancy, however small, is statistically significant. This highlights the presence of a bias. Regarding SiO2, the correlation coefficient is very high. The statistical bias tests (Sign test and paired Student T test) are not conclusive in that the Sign test failed but the Student T test passed. As for the Fe, the duplicates reported a higher average grade than the original assays.
Regarding Mn, even though the duplicate assays also reported an average grade higher than that of the original assays, the statistical bias tests passed, meaning that a bias could not be observed.
The following table presents a summary of the duplicates analysis and the following graphs present the scattergrams of original versus duplicate assays for Fe, SiO2 and Mn.
SGS Geostat considers that the original assays can be used without correction since they are on average lower than their duplicates. However, it would be advisable to alert the laboratories of the statistical biases observed and increase the quality control measures by adding standards, blanks and field duplicates into the stream of assays sent to the laboratory in future drilling campaigns.
Table 16.1: Results of QA-QC Duplicate Assays Analysis Fe SiO2 Mn
Number of pairs analyzed 110 110 100 Average Original assays 53.56% 17.60% 0.48
Average Duplicate assays 54.45% 17.67% 0.49 % Average Difference 1.7% 0.4% 1.3% Correlation coefficient 0.998 0.999 1.000
Sign test Failed Failed Passed Paired samples Student T test Failed Passed Passed

New Millennium Capital Corp. Technical Report – Feasibility of the DSO Project Page 43
April 2010 Amended as of February 16, 2011
Figure 16.1 – Scattergram of QA-QC Fe Pulp Duplicates
Figure 16.2 – Scattergram of QA-QC SiO2 Pulp Duplicates

New Millennium Capital Corp. Technical Report – Feasibility of the DSO Project Page 44
April 2010 Amended as of February 16, 2011
Figure 16.3 – Scattergram of QA-QC Mn Pulp Duplicates
16.4 Twin hole analysis
The amount of historical drilling is important in the DSO project. The objective of the twin hole analysis is to validate with modern drilling, the historical information, by comparing a set of two holes considered close to each other. The twin holes analyzed here are not twins in the strictest sense since the historical holes could not be located in the field. However, we have identified pairs of holes that had their recorded location within a few meters from one another and considered them as twins. Three pairs of twin holes could be identified in the Goodwood deposit. Goodwood is the biggest deposit of the eight under study, with approximately 50% of the mineral resources. In order to properly compare assay values, the drill holes were composited into 3m long bench composites. This operation segments the drill holes horizontally so that the composites in each hole perfectly line up. Finally only the composites present at the same elevation in both holes were kept for analysis. The present twin hole analysis has its limitations since there exists very little information on the sample preparation and assaying of the old IOCC holes. It is known that Fe, SiO2 and Mn were assayed using wet chemistry methods for the IOCC holes and the modern samples were assayed by XRF.
SGS Geostat observed that in each pair, the NML hole has a Fe grade slightly lower than its IOCC counterpart and conversely a SiO2 grade slightly higher than its IOCC counterpart. From the global appreciation and analysis, SGS Geostat considers that the IOCC holes are adequately validated by the NML twins and that the IOCC holes can be incorporated into the mineral resource estimation. The details of the twin hole analysis in each pair of holes could be found on Sedar in the SGS Geostat report.

New Millennium Capital Corp. Technical Report – Feasibility of the DSO Project Page 45
April 2010 Amended as of February 16, 2011
17.0 ADJACENT PROPERTIES
Adjacent to the properties owned by NML in Labrador and Quebec are other former operations of IOCC that were either mined out or abandoned by IOCC in 1982. Some of these properties in Labrador are currently owned by Labrador Iron Mines Ltd. The previously owned IOCC operations in Quebec have reverted to the ownership of Hollinger, however, NML owns some of the properties with deposits. IOCC is currently operating the Carol Lake iron ore property, 200 km south of Schefferville near Labrador City, Labrador. NML holds an 80% interest in the LabMag iron ore deposit located in Newfoundland and Labrador, approximately 30 km northwest of Schefferville and a 100% interest in the KéMag iron ore deposit located in the province of Québec, approximately 50 km north of Schefferville. Positive PFS were completed for these deposits in 2006 and 2009 respectively. Reserves have been estimated at 3,545 Mt for LabMag and 2,141 Mt for KéMag.
Labrador Iron Mines Ltd is also carrying out development work for processing and shipping of Direct Shipping Ore from deposits in the Schefferville area that were previously mined by IOCC. The current iron ore mining areas at Wabush, Labrador City and Mount-Wright are within 250 km of the DSO Property. Bedford Resource Partners (Bedford) staked 99 claims in north central Québec, 160 km north of Schefferville in the spring of 2005. The claims cover the Lac Otelnuk iron ore deposit, comprised of meta-taconite. Other iron ore projects are under investigation by Adriana Resources and Champion Minerals. Metco Resources Inc. announced in 2004 a planned exploration program for gold and polymetallic massive sulphides on Lac La Touche and Lac Gauthier properties some 50 km east-northeast of Schefferville. Virginia Gold Mines Inc. is exploring for gold, uranium, nickel and platinum group metals on properties 275 km northwest of Schefferville. Various private prospectors also own claims near the Goodwood area where exploration for manganese is being conducted.

New Millennium Capital Corp. Technical Report – Feasibility of the DSO Project Page 46
April 2010 Amended as of February 16, 2011
18.0 MINERAL PROCESSING AND METALLURGICAL TESTING
18.1 Process Development Activities
The DSO testing program began in 2008 with the objective of developing an optimum process flowsheet that would achieve the required product grades at acceptable recovery rates. The tests were performed on bulk surface samples from 10 selected deposits which were collected from excavated trenches. The deposits were chosen on the basis of the mine plan to ensure representativeness of the collected samples which represented all three ore types; Blue, Yellow and Red. Tests were designed to determine their individual metallurgical characteristics and 10 to 11 tonnes of each type were collected for testing purposes.
A detailed test program was designed to evaluate chemical, physical and metallurgical characteristics of each ore type from different deposits so that a blending program could be developed to ensure consistent feed quality to the plant. The test results were used to select and design appropriate process equipment to upgrade the ore to the required specifications. Adequate quantities of sample were processed using selected flowsheet options for metallurgical evaluation by the customer.
The tests were conducted in different independent laboratories as well as facilities operated by equipment/technology suppliers. There has been little testing to upgrade DSO type ores in Canada and their liberation characteristics are not well documented. NML undertook comprehensive studies to develop a basic understanding of the behaviour of the ore during processing and to select beneficiation equipment to efficiently upgrade it to the required product grades. Results of the metallurgical test work, including reports from independent laboratories and equipment suppliers, were provided to NML.
The process plant design was developed in different stages as follows:
Initial exploratory tests leading to flowsheet finalization for the Pre-feasibility Study. The Pre-feasibility Study flowsheet was based on production of a Lump Ore and Sinter Fines with the plant operating seven months per year.
Modifications and improvements to the flowsheet were based on additional test data and process modelling.
After review, the modifications and improvements led to the finalization of criteria and a testing program to enable the Feasibility Study to be completed. Products changed to Sinter Fines and Super Fines with the plant operating on a year-round basis.
A confirmation test on the Area 4 composite in a pilot plant and auxiliary tests for equipment design was undertaken to finalize the process design.

New Millennium Capital Corp. Technical Report – Feasibility of the DSO Project Page 47
April 2010 Amended as of February 16, 2011
18.1.1 Flowsheet development program for Pre-feasibility Study
The steps taken to explore processing options leading to the selection of a flowsheet for the Pre-feasibility Study were as follows:
Collection of bulk sample:
Trenches were excavated in ten selected deposits. About 200 tonnes of samples were hauled from each pit to a processing area.
Determination of hardness and abrasiveness:
Certain samples were hand-picked for hardness and abrasiveness tests which were performed by the suppliers of crushing equipment to establish design parameters.
Bulk sample crushing and dry screening:
Samples were crushed and dry screened at 32 mm on site to collect 10 tonnes from each for shipment and further processing in different labs.
Bench scale testing on composite blends for exploratory process development:
Four composite samples of Red, Yellow and Blue ores were prepared to explore a variety of beneficiation processes. Since over 75% of the resources consist of Blue ores, two Blue composites from two different areas were prepared. These samples were tested at Mintek in South Africa and SGA in Germany.
Blending, washing and wet screening of bulk samples:
11 bulk samples were shipped in drums to Midland Research Centre (MRC) in Minnesota. After characterization of each sample, 1 Yellow, 1 Red and 2 Blue samples were selected for washing and screening into three fractions.
Pilot scale testing of equipment/processes by suppliers to assist in development of the upgrading flowsheet:
Washed and screened samples were tested in different pilot scale equipment supplied by Allmineral in Germany. After various tests, they proposed a preliminary process plant flowsheet for the pre-feasibility study.
18.1.2 Modification and improvement of the PFS flowsheet
The following steps led to modification and improvement of the PFS flowsheet.
Beneficiation process for the fines:
Based on the results of the exploratory tests at SGA and Mintek, samples of the -1 mm fraction were provided to Outotec in the USA to test its separation equipment in order to develop a concentrating process for the ore.
Pilot plant tests for the Feasibility Study
Based on Outotec’s studies, a flowsheet consisting of a combined gravity and magnetic separation circuit to upgrade the -1 mm fraction was proposed, It was decided that a 1 tonne bulk sample be sent to the National Metallurgical Laboratory in Jamshedpur (“NMLJ”), India, for further optimization studies regarding the upgrading of -1 mm fractions.

New Millennium Capital Corp. Technical Report – Feasibility of the DSO Project Page 48
April 2010 Amended as of February 16, 2011
During the meeting, the following decisions were made regarding the finalization of the process flowsheet for the Feasibility Study:
The mine, process plant and ore transportation will be operated on a year-round basis.
Two full-scale pilot plant tests will be undertaken to finalize the process flowsheet, establish plant material balances and size the process equipment.
The first test will have a composite feed made up of a 50-50 blend of Red and Blue ores from Area 3. The available 2008 bulk sample will be used for the test.
The second test will process a representative blend of Area 4 ores. In order to test ores from deposits that were not sampled in 2008, new samples will be collected from three deposits, namely Goodwood, Kivivic 4 and Sunny 1 to prepare the composite from Blue and Yellow ores.
A pilot plant flowsheet will be selected after NMLJ has completed its optimization tests.
Sufficient quantities of product sample will be produced for metallurgical tests by the customer.
No lump will be produced because of the ore’s friability and concern for degradation during transportation. The project will mainly aim to produce sinter fines but due to the fineness of the ore, some super fines will also be produced.

New Millennium Capital Corp. Technical Report – Feasibility of the DSO Project Page 49
April 2010 Amended as of February 16, 2011
Activities related to finalizing the process flowsheet for the Feasibility Study were as follows:
Pilot plant testing of Area 3 composite.
Material from the 2008 bulk sample was prepared at MRC by crushing, washing and screening. The products were shipped to Germany, to MB-CMT for jig processing and to SGA for -1 mm processing and for testing at the pilot scale.Results demonstrated that a minimum of 64.5% Fe in both sinter fines and super fines products could be achieved and the combined assay of SiO2 and Al2O3 was less than 4.5%.
Pilot plant testing of Area 4 composite:
During the summer of 2009, new bulk samples were collected by using a sonic drill to prepare an Area 4 composite. Samples were sent in drums to COREM in Quebec City to prepare a composite. Individual samples from three deposits were crushed, homogenized and proportionately blended to prepare a representative sample of Area 4 plant feed. The composite was washed, screened and sent to MB-CMT and SGA in Germany for testing.
The Area 4 composite was found to contain an excessive amount of fines. Over 80% of the sonic bulk sample was less than 1 mm in size when the 2008 trench sample contained only between 50 and 60% fines. This was found to be caused by vibration and disturbance created by sonic drilling;
18.1.3 Finalization of the Process Plant design
Confirmation pilot plant tests on Area 4 composite:
Area 4 contains 85% of the total DSO resources. It is therefore important to have proper design data based on a pilot plant test with representative samples in order to finalize the detailed design and confirm equipment sizing. A decision was made to conduct a new pilot plant test with a blend of 2008 trench samples. COREM made a new composite comprised of samples from the Goodwood deposit, blended to produce a representative feed for the process plant and the material was sent to Germany, to MB-CMT for jig processing and to SGA for -1 mm processing. The tests have been completed and the evaluation of results shows that the selected flowsheet will achieve the targeted product grade. Based on the material balance, plant recovery has exceeded 80%.
The recoveries and product grades obtained during the various tests were as shown in Table 18.1.
Table 18.1: Results of Pilot Plant Tests on Area 4 Composite
Sinter Fines Super Fines

New Millennium Capital Corp. Technical Report – Feasibility of the DSO Project Page 50
April 2010 Amended as of February 16, 2011
Recovery % 63.0 19.0
% Fe 65.9 65.6
% SiO2 2.90 2.71
% Al2O3 0.35 0.33
A block diagram representing the selected flowsheet is presented as Figure 18.1
Figure 18.1: Block Diagram of Process Flowsheet
ROM Tails (reground)
(‐6mm) Oversize Concentrate
5 7
Undersize 8
Tail 9
Conc
O/F
13 12 18
Conc Conc
14
Tail 15 19
U/F
16 O/F
Fine screening(1.0 mm)
Spirals
Filtration of Sinter Fines
Concentrate cycloning(0.1 mm)
Tailings
Hydroclassifiers
Filtration of SuperFines
Fine jigs
WHIMS
Crushing &Scrubbing
Sinter Fines
Product
Super Fines
Product

New Millennium Capital Corp. Technical Report – Feasibility of the DSO Project Page 51
April 2010 Amended as of February 16, 2011
19.0 MINERAL RESOURCE AND MINERAL RESERVE ESTIMATES
Of the 22 deposits in the DSO Project area, ten were selected for development at this stage and therefore to be the basis of the mining operation. The ten deposits, listed below, were chosen on the basis of the 100%, or close thereto, ownership by NML of the claims covering the deposit and on the historical published resources that were not 43-101 compliant.
Goodwood; Ferriman 4.
Timmins 3N; Kivivic 3N;
Timmins 4; Kivivic 4;
Fleming 7N; Kivivic 5;
Timmins 7; Sunny 1
Eight of the selected ten deposits were drilled in 2008 to an extent that permitted Geostat to prepare geological models that were used in the PFS. Two of the deposits, Kivivic 4 and Sunny 1, required further drilling that took place in the summer of 2009 and modeling of the results of the campaign was used to convert the NI 43-101 compliant resources into reserves.
It is planned that drilling will take place in the summer of 2010 on the following deposits, on which no work has yet been done.
Kivivic 1; Barney 2;
Kivivic 2; Timmins 8;
Kivivic 3S; Star Creek 2
19.1 Mineral Resource Estimate
19.1.1 Resource Block Models
Geostat used the results to build block models and evaluate the resources in eight of the DSO Deposits. Results of the resource estimate from Geostat are summarized in Table 19.1 and details are given in the Geostat 2009 Report, attached as Appendix A, and in the Geostat S1 2009 and K4 2009 Reports attached as Appendices B and C respectively. In making the resource calculation, a density of 3.0 tonnes per cubic metre was used, as were the following cut-off grade parameters:
Fe ≥ 50%
Mn ≤ 3.5%
SiO2 ≤ 18%
The same three-dimensional resource block models that were used in the PFS were used in this FS. Created by SGS Canada Inc., they were based on ore envelopes that were derived from exploration drilling. The block models were created using the Geostat Software Library.
The dimensions of the block models for the Timmins 3N, Timmins 4, Timmins 7, Fleming 7N, Kivivic 3N, Kivivic 4, Kivivic 5 and Sunny 1 deposits were 6 m × 6 m × 6 m and those for the Goodwood deposit were 5 m × 5 m × 5 m.

New Millennium Capital Corp. Technical Report – Feasibility of the DSO Project Page 52
April 2010 Amended as of February 16, 2011
Each block in the resource model contains the following information:
X Coordinate (Centroid of Block) Fe content
Y Coordinate (Centroid of Block) Al2O3 content
Z Coordinate (Centroid of Block) SiO2 content
Geologic Envelope Mn content
Density LOI value
% of Block below Topography CaO content
Resource Classification (Measured, Indicated or Inferred)
MgO content
P content
P2O5 content

New Millennium Capital Corp. Technical Report – Feasibility of the DSO Project Page 53
April 2010 Amended as of February 16, 2011
Table 19.1: Classified Resources by Deposit (combined blue, red and yellow ore types)
Deposit Tonnage Fe (%) Mn (%) SiO2 (%) Classification
Timmins 3
0 Measured
2,147,000 59.67 0.03 11.96 Indicated
485,000 59.70 0.04 11.90 Inferred
Timmins 4
0 Measured
2,131,000 60.54 0.04 9.77 Indicated
0 Inferred
Timmins 7
0 Measured
935,000 58.38 0.25 12.30 Indicated
0 Inferred
Goodwood
22,404,000 59.79 0.13 6.03 Measured
8,503,000 57.47 0.33 10.46 Indicated
821,000 53.32 1.20 13.91 Inferred
Fleming 7
0 Measured
6,572,000 61.03 0.15 6.37 Indicated
0 Inferred
Ferriman 4
0 Measured
9,361,000 55.37 1.86 8.12 Indicated
2,081,000 53.78 1.69 6.38 Inferred
Kivivic 3
0 Measured
1,754,000 60.70 0.36 7.93 Indicated
1,935,000 58.97 0.46 10.57 Inferred
Kivivic 4
0 Measured
7,540,000 58.26 0.32 10.84 Indicated
599,000 59.11 0.15 12.73 Inferred
Kivivic 5
0 Measured
2,196,000 62.16 0.08 7.56 Indicated
516,000 63.18 0.06 5.77 Inferred
Sunny 1
0 Measured
3,555,000 58.96 0.05 10.42 Indicated
750,000 54.88 0.12 15.15 Inferred
total
22,404,000 59.79 0.13 6.03 Measured
44,694,000 58.43 0.56 9.27 Indicated
67,098,000 58.89 0.69 8.66 M+I
7,187,000 56.76 0.78 10.14 Inferred

New Millennium Capital Corp. Technical Report – Feasibility of the DSO Project Page 54
April 2010 Amended as of February 16, 2011
19.2 Mineral Reserve Estimate
19.2.1 Mining Block Models
Each of the resource block models developed as set out in Section 16.1 was imported into MineSight® mining software to create three-dimensional mining block models, which contain the same blocks as the resource models, with additional parameters applied to assist in mine planning.
The Ferriman 4 deposit, although included in the resource estimate, was excluded from the detailed mine plan because the quality of material from that deposit, which previous mine planning work has shown would be very difficult to blend with other ore to meet the processing plant’s feed quality criteria.
19.2.2 Moisture Content
The first parameter applied to the resources models was the moisture content. This value, which is different for each deposit, is required for the economic analysis and mine scheduling. Moisture content was based on historical data. Table 19.2 summarizes the moisture content for each deposit. The value was coded into the model as “DRY”.
Table 19.2: Moisture Content
19.2.3 Recovery
The second parameter applied to the mining model was recovery. This value is different for each of the three ore types but the same set of values is used for each deposit. These values are required for the economic analysis and mine scheduling. Based on the results of laboratory test, recovery values were estimated by NML metallurgy specialists. Table 19.3 summarizes the recovery values for each ore type. The value was coded into the model as “REC”.
Table 19.3: Recovery Values Ore Type Recovery (%) “REC” Factor
Blue 80 0.80
Red 70 0.70
Yellow 75 0.75
19.3 Economic Analysis
The determination of the economic pit limit for each deposit was made using the EPIT module of the MineSight® mining software. The EPIT module uses the Lerch-Grossman 3D (“LG 3D”) pit optimization algorithm to develop the configuration of each open pit at
Deposit Moisture content (%) “DRY”Factor Timmins 3N 9 0.91
Timmins 4 8 0.92
Timmins 7 8 0.92
Fleming 7N 9 0.91
Ferriman 4 13 0.87
Goodwood 9 0.91
Kivivic 3N 8 0.92
Kivivic 4 9 0.91
Kivivic 5 9 0.92
Sunny 1 8 0.92

New Millennium Capital Corp. Technical Report – Feasibility of the DSO Project Page 55
April 2010 Amended as of February 16, 2011
the end of its economic life, based on the total of estimated measured and Indicated resources and thereby obtain the optimum pit that will generate the maximum profit. The LG 3D algorithm is a true pit optimizer based on the graph theory in operations research and it operates on a net value calculation for all the ore blocks in the model. A number of parameters are input into the software to calculate the results, including mining, processing and administration costs, product sales price, and maximum pit slope angles. The software applies these parameters to the ore and waste blocks of the 3D block models to determine optimum pit shells.
19.3.1 Sales Price
The sales price used for the economic analysis was 64.50 Can$ per tonne of dry product. The revenue generated for each ore block was calculated and stored in the mining model as “REV”. Blocks were considered ore if they were classified as measured or indicated and they meet the three cut-off grade criteria set out in Section 4.1.
19.3.2 Mining Costs
The mining costs used for the economic analysis varied by deposit as shown in Table 19.4. The costs were generated from the PFS. Since Kivivic 4 and Sunny 1 were not included in the PFS, their mining costs were assumed to be the same as those for Kivivic 3N. The net ore cost includes costs for mining and processing ore, rail and port charges and administration fees.
Table 19.4: Mining Cost
The cost to mine each block was calculated and stored in the mining model as “MCOST”.
19.3.3 Net Value
The net value (profit) of each block was calculated and stored in the mining model as “NET”.
19.3.4 Pit Slope Angle
The maximum pit slope angle used for the economic analysis was 50°. This value was obtained from historical data from mined-out pits in the Timmins area.
19.3.5 Results of the Analyses
The resource contained in each deposit’s economic shell was calculated and is presented in Table 19.5.
Deposit Net Ore Cost (Can$/tonne)
Waste Cost (Can$/tonne)
Timmins 3N 18.77 2.25
Timmins 4 18.96 2.16
Timmins 7 18.78 2.21
Fleming 7N 17.45 2.23
Ferriman 4 18.50 2.28
Goodwood 22.06 2.32
Kivivic 3N 21.25 2.25
Kivivic 4 21.21 2.25
Kivivic 5 21.51 2.25
Sunny 1 21.28 2.25

New Millennium Capital Corp. Technical Report – Feasibility of the DSO Project Page 56
April 2010 Amended as of February 16, 2011
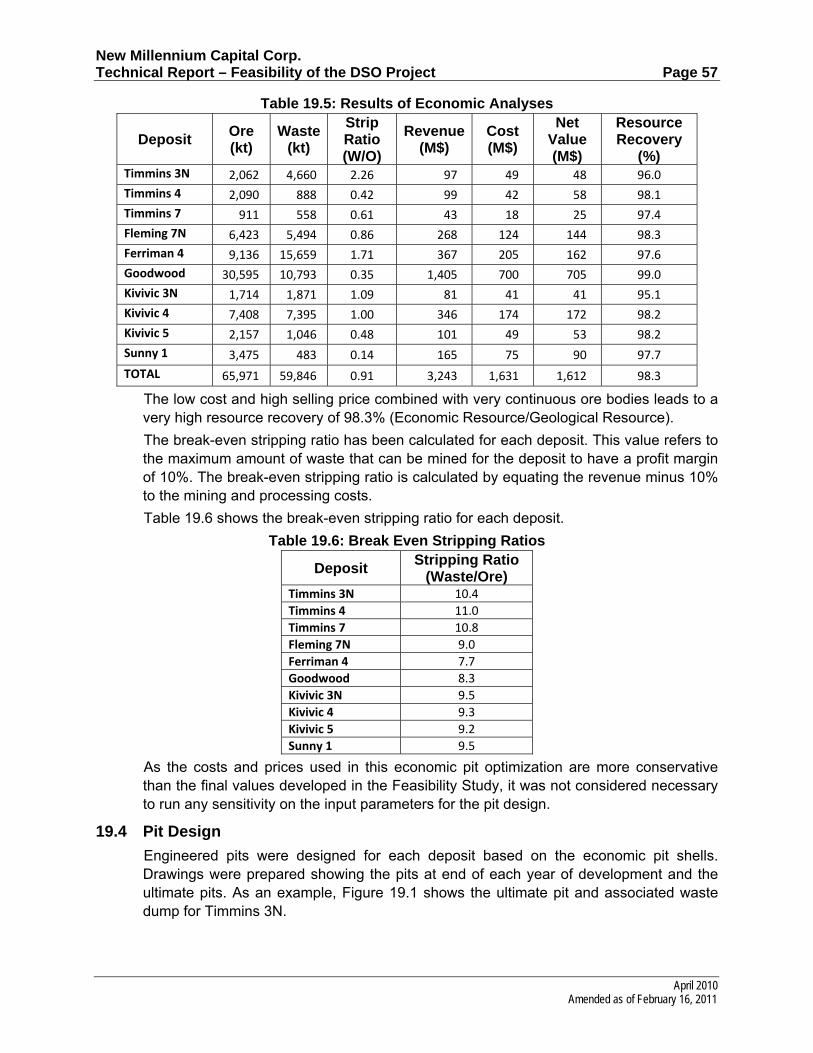
New Millennium Capital Corp. Technical Report – Feasibility of the DSO Project Page 57
April 2010 Amended as of February 16, 2011
Table 19.5: Results of Economic Analyses
Deposit Ore (kt)
Waste (kt)
Strip Ratio (W/O)
Revenue (M$)
Cost (M$)
Net Value (M$)
Resource Recovery
(%) Timmins 3N 2,062 4,660 2.26 97 49 48 96.0
Timmins 4 2,090 888 0.42 99 42 58 98.1
Timmins 7 911 558 0.61 43 18 25 97.4
Fleming 7N 6,423 5,494 0.86 268 124 144 98.3
Ferriman 4 9,136 15,659 1.71 367 205 162 97.6
Goodwood 30,595 10,793 0.35 1,405 700 705 99.0
Kivivic 3N 1,714 1,871 1.09 81 41 41 95.1
Kivivic 4 7,408 7,395 1.00 346 174 172 98.2
Kivivic 5 2,157 1,046 0.48 101 49 53 98.2
Sunny 1 3,475 483 0.14 165 75 90 97.7
TOTAL 65,971 59,846 0.91 3,243 1,631 1,612 98.3
The low cost and high selling price combined with very continuous ore bodies leads to a very high resource recovery of 98.3% (Economic Resource/Geological Resource).
The break-even stripping ratio has been calculated for each deposit. This value refers to the maximum amount of waste that can be mined for the deposit to have a profit margin of 10%. The break-even stripping ratio is calculated by equating the revenue minus 10% to the mining and processing costs.
Table 19.6 shows the break-even stripping ratio for each deposit.
Table 19.6: Break Even Stripping Ratios
Deposit Stripping Ratio
(Waste/Ore) Timmins 3N 10.4
Timmins 4 11.0
Timmins 7 10.8
Fleming 7N 9.0
Ferriman 4 7.7
Goodwood 8.3
Kivivic 3N 9.5
Kivivic 4 9.3
Kivivic 5 9.2
Sunny 1 9.5
As the costs and prices used in this economic pit optimization are more conservative than the final values developed in the Feasibility Study, it was not considered necessary to run any sensitivity on the input parameters for the pit design.
19.4 Pit Design
Engineered pits were designed for each deposit based on the economic pit shells. Drawings were prepared showing the pits at end of each year of development and the ultimate pits. As an example, Figure 19.1 shows the ultimate pit and associated waste dump for Timmins 3N.

New Millennium Capital Corp. Technical Report – Feasibility of the DSO Project Page 58
April 2010 Amended as of February 16, 2011
19.4.1 Design Parameters
The following parameters were used in the engineered pit designs:
Bench Height: 12m (Timmins, Fleming, Kivivic, Sunny), 10m (Goodwood)
Ramp Width: 21m
Ramp Grade: 8% maximum
Minimum Working Area: 30m
Face Angle: 70°
Overall Pit Slope: 50°
Catch Bench Width: 5.7m (Timmins, Fleming, Kivivic, Sunny), 9.5m (Goodwood)
One catch bench per bench (Timmins), one catch bench per two benches (Goodwood)
In all deposits, the pit ramp did not extend down to the pit bottom. It was assumed that a backhoe will mine the lowest bench, thereby reducing the waste volume required to be extracted.
The block models incorporated some internal waste as dilution during the 6 m block compositing process where sub-economic assay intersections were used in block grade interpolation. Therefore, no additional dilution factor was applied in the reserve estimate
19.4.2 Design Selection
Several pit designs were made for each deposit and were compared on a net value basis, those with the highest values being selected to arrive at the mineable reserve. Although Timmins 3N has a relatively high stripping ratio of 3.80, the pit selected generates the highest net value of Can$ 38.5 Million. A pit was designed with a stripping ratio of 2.65, resulting in a net value of Can$ 36.3 Million.
Table 19.7 summarizes the mineable reserves by deposit.

New Millennium Capital Corp. Technical Report – Feasibility of the DSO Project Page 59
April 2010 Amended as of February 16, 2011
Table 19.7: Mineable reserves by Deposit
Deposit Proven Ore (kt)
Probable Ore (kt)
Total Ore Mined (kt)
Waste (kt)
Strip Ratio
Fe (%)
Resource Recovery
(%)
Revenue (M$/t)
Cost (M$/t)
Net Value (M$/t)
Timmins 3N 0 1,969 1,969 7,474 3.80 59.8 91.7 92 54 39
Timmins 4 0 2,006 2,006 1,863 0.93 60.6 94.1 95 42 53
Timmins 7 0 868 868 859 0.99 58.4 92.8 41 18 23
Fleming 7N 0 6,325 6,325 7,943 1.26 61.0 96.8 264 128 136
Ferriman 4 0 9,075 9,075 22,913 2.52 55.4 96.9 364 220 144
Goodwood 21,099 7,984 29,083 14,918 0.51 59.2 25.8 1,336 676 660
Kivivic 3N 0 1,696 1,696 4,531 2.67 60.7 94.1 80 46 34
Kivivic 4 0 7,466 7,466 13,877 1.86 58.3 99.0 349 190 159
Kivivic 5 0 2,115 2,115 2,423 1.15 62.3 96.3 99 51 48
Sunny 1 0 3,507 3,507 2,734 0.78 58.9 98.6 166 81 86
TOTAL 21,099 43,011 64,110 79,535 1.24 58.9 95.5 2,888 1,506 1,382

New Millennium Capital Corp. Technical Report – Feasibility of the DSO Project Page 60
April 2010
Amended as of February 16, 2011
Figure 19.1: Timmins 3N Ultimate Pit

New Millennium Capital Corp. Technical Report – Feasibility of the DSO Project Page 61
April 2010 Amended as of February 16, 2011
19.5 Mine Scheduling
A production schedule was generated using the MineSight® Schedule Optimizer module from the MineSight® software. Several parameters, which are addressed hereafter, were input into the software.
19.5.1 Schedule Parameters
Production Target
The production target for the mine schedule was 100,000 tonnes of dry product in the first year of operation, 3 million tonnes in the second year and 4 million tonnes of dry product in each of the following years, until the resources are completely depleted.
Dry product was calculated by multiplying the Run of Mine Ore by the Recovery and Humidity Factors.
Ore Blending
A value known as the MLSA was calculated for each deposit to reflect the presence of impurities. The MLSA was calculated for each ore block by summing the MnO, LOI, SiO2 and Al2O3 values for the block. If a block was missing either the Al2O3 or the LOI value, the average value for the deposit was used. Table 19.8 shows the deposit averages that were used to replace missing values.
Table 19.8: Average MLSA Values Deposit Al2O3 (%) LOI (%)
Blue Red Yellow Blue Red Yellow Timmins 3N 0.16 ‐ ‐ 1.00 ‐ ‐
Timmins 4 0.78 0.89 ‐ 1.43 1.62 ‐
Timmins 7 0.55 ‐ ‐ 1.29 ‐ ‐
Fleming 7N 0.48 1.99 ‐ 2.27 3.16 ‐
Ferriman 4 1.63 1.90 1.42 5.71 5.78 5.65
Goodwood 0.73 1.88 1.02 5.59 4.78 8.36
Kivivic 3N 0.66 ‐ 0.76 2.73 ‐ 4.58
Kivivic 4 1.22 ‐ 2.10 3.30 ‐ 6.79
Kivivic 5 0.24 ‐ ‐ 1.71 ‐ ‐
Sunny 1 1.20 ‐ ‐ 4.10 ‐ ‐
The treatment process is designed to reduce the SiO2 and Al2O3 values to a constant of 4.8% for red ore and 3.2% for blue and yellow ores. A value called the PMLSA was calculated for each ore block by summing the MnO and LOI values plus a predetermined fixed value for SiO2 and Al2O3.

New Millennium Capital Corp. Technical Report – Feasibility of the DSO Project Page 62
April 2010 Amended as of February 16, 2011
Table 19.9 summarizes the PMLSA values by deposit.
Table 19.9: PMLSA Values Deposit PMLSA (%)
Timmins 3N 4.22
Timmins 4 4.68
Timmins 7 4.79
Fleming 7N 7.85
Ferriman 4 13.35
Goodwood 9.73
Kivivic 3N 6.43
Kivivic 4 7.11
Kivivic 5 5.01
Sunny 1 7.38
TOTAL/Avg 8.27
The ore blending objective for the mine schedule was to achieve close to the overall PMLSA average of 8.27% annually. To achieve this, the Goodwood deposit will be mined concurrently with other deposits.
Equipment Smoothing
The ore with the lowest stripping ratio is mined first in order to minimize the equipment requirements in the first two years. In order to avoid fluctuations in equipment requirements in subsequent years, the target number of trucks was set as ten in year 4 and maintained at that number until the final year of production.
Mining Sequence
The objective in setting the mining sequence was to begin mining in DSO Area 3 (Timmins/Fleming) and progress to DSO Area 4 (Goodwood / Kivivic / Sunny). Due to its high stripping-ratio, Timmins 3N was moved to the end of the production schedule.
19.5.2 Production Schedule
Table 19.10 summarizes the production schedule that was generated by the previously-described exercises.
The schedule as developed meets the annual production targets and ore blending criteria, but a more detailed quarterly schedule will be developed for the first few years to meet operational requirements.

New Millennium Capital Corp. Technical Report – Feasibility of the DSO Project Page 63
April 2010 Amended as of February 16, 2011
Table 19.10: Summarized Production Schedule (‘000 tonnes) Year 1 Year 2 Year 3 Year 4 Year 5 Year 6 Year 7 Year 8 Year 9 Year 10 Year 11 Total
Waste 1,094,3 5,549.9 5,44408 6,190.7 7,830.4 6,248.4 6,606.5 4,329.1 3,917.6 5,591.2 3,821.6 56,6250 Timmins 3N 0 0 0 0 0 0 2,132.4 0 575.7 3,158.4 1,60.4 7,474.0 Timmins 4 0 0 0 506.0 611.8 185.1 560.6 0 0 0 0 1,863.5 Timmins 7 0 859.2 0 0 0 0 0 0 0 0 0 859.2 Fleming 7N 1,094.3 4,690.7 2,157.8 0 0 0 0 0 0 0 0 7,942.8 Goodwood 0 0 3,287,0 1,281.3 316.0 1,716.5 1,266.5 1,280.3 1,123.9 2,432.8 2,214.2 14,918.5 Kivivic 3N 0 0 0 1,042.9 2,767.4 720.8 0 0 0 0 0 4,532.0 Kivivic 4 0 0 0 2,1251 3,351.4 2,812.8 2,198.9 1,597.6 1,792.4 0 0 13,878.2 Kivivic 5 0 0 0 0 558,.7 758.1 360.0 746.5 0 0 0 2,423.0 Sunny 1 0 0 0 1,235.5 225.3 55.0 88.3 704.6 425.6 0 0 2,734.4 Run of Mine Ore
161.2 4,530.1 5,831.8 5,578.4 5,480.5 5,607.0 5,518.6 5,585.9 5,562.9 5,642.6 5,535.3 55,034.5
Timmins 3N 0 0 0 0 0 0 .8 0 18.3 959.6 990.8 1,969.5 Timmins 4 0 0 0 259.0 416.6 435.4 894.8 0 0 0 0 2,005.7 Timmins 7 0 868.1 0 0 0 0 0 0 0 0 0 8681 Fleming 7N 161.2 3,662.0 2,501.9 0 0 0 0 0 0 0 0 6,325.0 Goodwood 0 0 3,330.0 3,403.2 2,884.7 2,402.8 2,717.4 2,470.9 2,646.8 4,683.0 4,544.5 29,083.3 Kivivic 3N 0 0 0 264.3 757.8 673.7 0 0 0 0 0 1,695.7 Kivivic 4 0 0 0 141.4 979.1 1,435.6 1,328.2 1,149.0 2,432.3 0 0 7,465.6 Kivivic 5 0 0 0 0 226.4 652.4 303.6 932,3 0 0 0 2,114.6 Sunny 1 0 0 0 1,510.6 216.0 7.1 274.0 1,033.7 465.6 0 0 3,506.9 Total Production
1,255.5 10,080.0 11,276.6 11,769.
1 13,310.9 11,855.4 12,125.2 9,914,9 9,480.6 11,233.8 9,356.9
111,658.9
Timmins 3N 0 0 0 0 0 0 2,133.2 0 593.9 4,118.1 2,598.2 9,443.5 Timmins 4 0 0 0 765.0 1,028.4 620.5 1,455.3 0 0 0 0 3,869.2 Timmins 7 0 1,727.3 0 0 0 0 0 0 0 0 0 1,727.3 Fleming 7N 1,255,5 8,352.7 4,659,7 0 0 0 0 0 0 0 0 14,267.9 Goodwood 0 0 6,616.9 4,684.5 3,200.7 4,119.3 3,983.9 3,751.2 3,770.7 7,115.7 6,758.7 44,001.8 Kivivic 3N 0 0 0 1,307.1 3,525,2 1,394.6 0 0 0 0 0 6,226.7 Kivivic 4 0 0 0 2,266.4 4,330.6 4,248.5 3,526.9 2,746.6 4,224.7 0 0 21,343.7 Kivivic 5 0 0 0 0 784.8 1,410.5 663.5 1,678.8 0 0 0 4,537.7 Sunny 1 0 0 0 2,746.1 441.3 62.1 362.2 1,738.3 891.2 0 0 6,241.2

New Millennium Capital Corp. Technical Report – Feasibility of the DSO Project Page 64
April 2010 Amended as of February 16, 2011
20.0 OTHER RELEVANT DATA AND INFORMATION
20.1 Mining
20.1.1 Method
The mining method selected for the DSO Project is conventional open-pit mining with a front-end loader/truck operation. The rock will be drilled, blasted and loaded into haul trucks that will deliver ROM ore to the primary mineral sizer, located at the Timmins Site. From each pit, waste will be hauled to an out-of-pit waste dump to be located nearby. Overburden removal and ore and waste mining operations will take place 24 hours per day, 365 days per year but, for loader and truck calculation purposes, it was assumed that operations will shut down for an average of five days per year due to inclement weather.
The mining work schedule was established as two twelve-hour shifts per day, seven days per week and the turnaround was established as two weeks in, two weeks out.
20.1.2 Dumps
Dumps that will serve as storage for material that is currently considered to be sub-economical will be located at various points between the pits, in non-mineralized areas to be defined based on the results of condemnation drilling yet to be carried out.
Waste dumps were designed for each deposit to accommodate the quantity of waste that will be removed, taking into account the fact that waste rock will be used for the construction of haul roads and, initially, the access road. The waste dumps will be progressively rehabilitated.
The following parameters were used in the waste dump designs:
Lift Height: 12 m (Timmins area), 10m (Goodwood area);
Lift Slope: 45°;
Berm Width: 12m (Timmins area), 10m (Goodwood area);
One berm per lift;
Overall Dump Slope: 26.5°;
Swell Factor: 1.25;
Minimum Dump Footprint Offset:
Pit Crest: 100m;
Railroad : 100m;
Provincial Border: 50m;
Haul Road: 50m;
NML Claim Border: 50m;
The positions and sizes of the planned dumps were shown on the ultimate mine plan for each pit, an example of which was presented as Figure 19.1
20.1.3 Equipment
The various pieces of equipment required to achieve the mine plan are addressed hereafter.

New Millennium Capital Corp. Technical Report – Feasibility of the DSO Project Page 65
April 2010 Amended as of February 16, 2011
Drilling and Blasting
Both ore and waste will be drilled using a rotary drill to produce 9⅞” (250 mm) diameter holes on patterns of 8.5 m × 7.5 m. for ore and 9 m × 8 m for waste. Drilling will generally be done on a 12 m bench height with 1.5 m sub-drilling to minimize high spots on the bench floor between holes, but at Goodwood, the bench height will be 10 m.
Blasting will be executed under contract with an explosives supplier that will not only store and provide all the blasting materials and technology required by the mine but will also provide a down-the-hole service, i.e. the supplier will deliver the required amount of explosive into each blast hole under the supervision of NML’s blaster and according to the blast design of NML’s engineer. Because of the large volume of explosives required and the remote nature of the operation, a bulk explosives plant will be constructed in the vicinity of, but not on, the mine sites. Emulsion will be used for blasting and preliminary blasting simulation and fragmentation analysis indicates that an average powder factor of 0.2 kg/t for ore and 0.18 kg/t for waste will achieve a fragmentation which is suitable for the size of front-end loaders selected for the DSO mining operation.
Haul Trucks
The haul truck to be used for the DSO project was selected on the basis of its suitability to economically and safely haul 135-tonne loads from the pits in DSO Area 04 to the Primary Crushing Station in DSO Area 03.
Table 20.1 summarizes the number of trucks required to complete the detailed mine plan and Table 20.2 summarizes the annual haul distances for ore and waste.
Table 20.1: Truck Requirements Year 1 2 3 4 5 6 7 8 9 10 11
Number 2 3 8 10 10 10 10 10 10 10 10
Table 20.2: Haul distances (One-way)
Year 1 2 3 4 5 6 7 8 9 10 11 Waste Km 1.0 1.5 2.1 1.5 1.7 2.1 2.0 2.4 2.6 2.2 2.6
Ore Km 3.4 3.8 19.4 26.9 26.5 26.2 24.6 28.0 28.3 26.4 26.4
Total Km 1.3 2.6 11.0 13.6 11.9 13.5 12.2 16.8 17.7 14.4 16.7
Loaders
The loader selected for the DSO project is the CAT 993K or equivalent. This loader was selected on the basis of experience in the operation of similar pits under similar conditions. Further study will be made to determine whether this loader is the best match for the HaulMax 3900T. T
Production Drills
The production drill selected for the DSO project is capable of drilling a 9⅞˝ (250 mm).diameter hole through a bench height of 12 m. Selection was made on the basis of experience in the operation of similar pits under similar conditions.
Auxiliary Equipment
The auxiliary equipment required for the maintenance of haul roads, the building of the access road and the creation of waste dumps, for bench preparation and for levelling before drilling is listed in Table 20.3 together with a selection of maintenance and other

New Millennium Capital Corp. Technical Report – Feasibility of the DSO Project Page 66
April 2010 Amended as of February 16, 2011
equipment including cranes and specialized service trucks, as well as equipment for use in the Process Plant.
Wherever practical, to minimize spares, mobile equipment to service the Process Plant, camp and other installations will be standardized with that specified for the mines.
Table 20.3: Auxiliary Equipment Unit Number Unit Number
Tracked Dozer (CAT D8T) 3 Mobile Crane 80 tonne Hydraulic 1
Grader (CAT 16M) 2 Mobile Crane 30 tonne All‐terrain 1
Water Tanker Truck (Inter 700 series) 1 Boom Truck 1
Sand Truck 1 Air‐track Drill and Compressor 1
Combo (CAT 450 E) 1 Flatbed 1
Fuel Tanker Truck 1 Fire truck (powder) 1
Lube Truck 1 Pump 10
Welding Truck 1 Mobile light tower 5
Tire Handler 1 Mine radio 35
Bus (40 passenger) 1 Snowplough Truck 2
Bus (24 passenger) 1 Front‐end Loader 1
Pick‐up Truck 10 Fork‐lift (Propane powered) 2
20.1.4 Protection of the Environment
Mine operations will comply with all applicable Canadian and provincial environmental guidelines, regulations and laws. Health and safety rules and regulations will be strictly enforced.
Equipment will be selected so that noise emission will not be greater than 85 dbA at a horizontal distance of one metre and waste dumps will be designed to have gentle slopes so as to avoid erosion as much as possible and facilitate revegetation.
Environmental impact mitigation measures are addressed in detail in Appendix 5 to the EIS.
20.2 Mineral Processing
20.2.1 Design Criteria
The Process Plant capacity was established for the production of four 4 million dry tonnes per year of Sinter Fines and Super Fines products. Operations will start in Phase 1 with mining in Area 3, which is a “brownfield” area where some preparation for mining has already taken place and some infrastructure already exists. In Phase 2, operations will move to the north to mine deposits in Area 4, which is a “greenfield” area requiring more preparation. The composition of the feed mix that will be sent to the Process Plant will be different for each phase but the Process Plant was designed to accommodate both types of mix, although the mines will need to correctly blend the various ore types to minimize variations in the characteristics of the feed delivered to the Process Plant. To prevent freezing of the products in railcars during cold weather, the plant will have the capability of steam filtering as well as drying, to sufficiently reduce the product moisture during transportation. Basic plant design criteria for both phases are shown in Table 20.4. Plant availability is consistent with North American standards for the type of equipment to be used and spare equipment, where appropriate, will be held on site to ensure maximum plant availability.

New Millennium Capital Corp. Technical Report – Feasibility of the DSO Project Page 67
April 2010 Amended as of February 16, 2011
Table 20.4: Basic Process Plant Design Criteria Parameter Phase 1 Phase 2
Sizing Station capacity
Ore processing rate (t/y) natural 5,000,000 5,000,000
Ore processing rate (t/d) 13,699 13,699
Ore processing rate (t/h) 634 634
Operating time (%) 90 90
Processing Plant Capacity
Ore processing rate (t/y) 5,000,000 5,000,000
Ore processing rate (t/d) 13,699 13,699
Ore processing rate (t/h) 634 634
Operating time (%) 90 90
Weight recovery (%) 75 80
Total products (t/y) dry 3,750,000 4,000,000
Products
Sinter Fines (t/y) 3,000,000 3,200,000
Sinter Fines (t/d) 8,219 8,767
Sinter Fines proportion 80 80
Super Fines (t/y) 750,000 800,000
Super Fines (t/d) 2,055 2,192
Super Fines proportion (%) 20 20
20.2.2 Process and Plant description
A simplified flowsheet is presented as Figure 20.1 an overall plan view of the Project Sites is presented as Figure 20.2 and plan views of the Timmins and Goodwood Sites are presented as Figures 20.3 and 20.4 respectively
.

New Millennium Capital Corp. Technical Report – Feasibility of the DSO Project Page 68
April 2010 Amended as of February 16, 2011
Figure 20.1: Block Diagram of Process Flowsheet ROM Tails (reground)
(‐6mm) Oversize Concentrate
5 7
Undersize 8
Tail 9
Conc
O/F
13 12 18
Conc Conc
14
Tail 15 19
U/F
16 O/F
Fine screening(1.0 mm)
Spirals
Filtration of Sinter Fines
Concentrate cycloning(0.1 mm)
Tailings
Hydroclassifiers
Filtration of SuperFines
Fine jigs
WHIMS
Crushing &Scrubbing
Sinter Fines
Product
Super Fines
Product
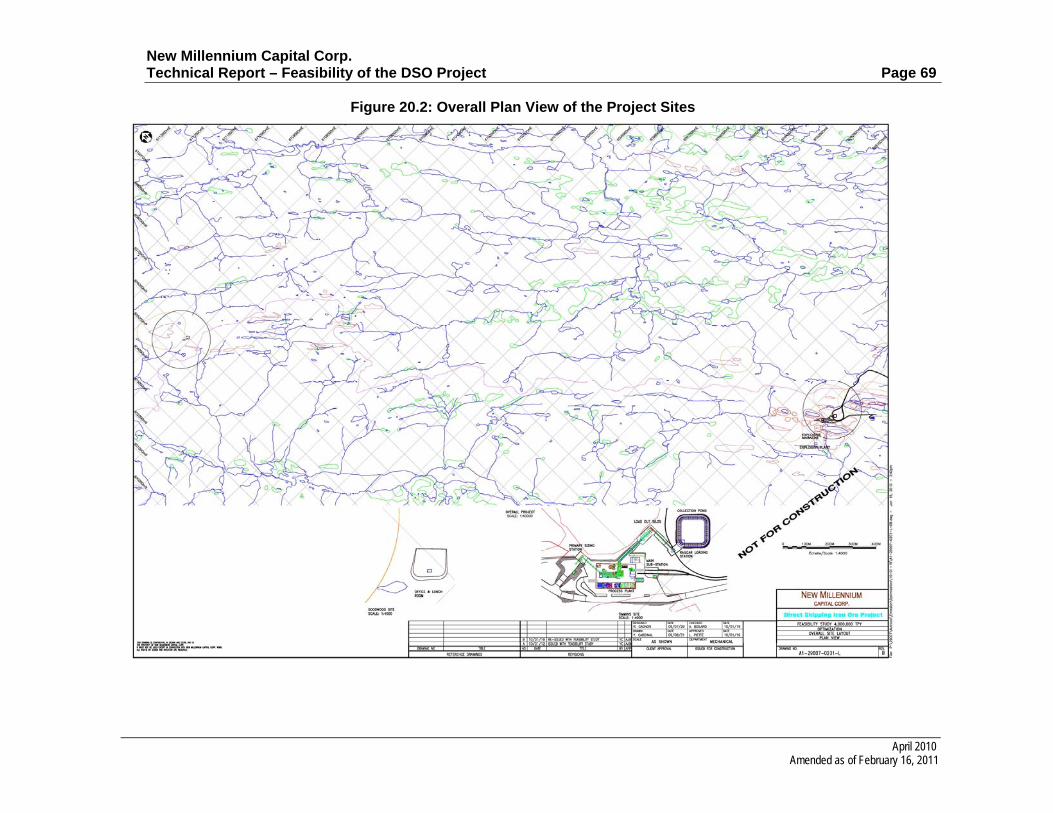
New Millennium Capital Corp. Technical Report – Feasibility of the DSO Project Page 69
April 2010 Amended as of February 16, 2011
Figure 20.2: Overall Plan View of the Project Sites

New Millennium Capital Corp. Technical Report – Feasibility of the DSO Project Page 70
April 2010 Amended as of February 16, 2011
Figure 20.3: Timmins Site Overall Layout
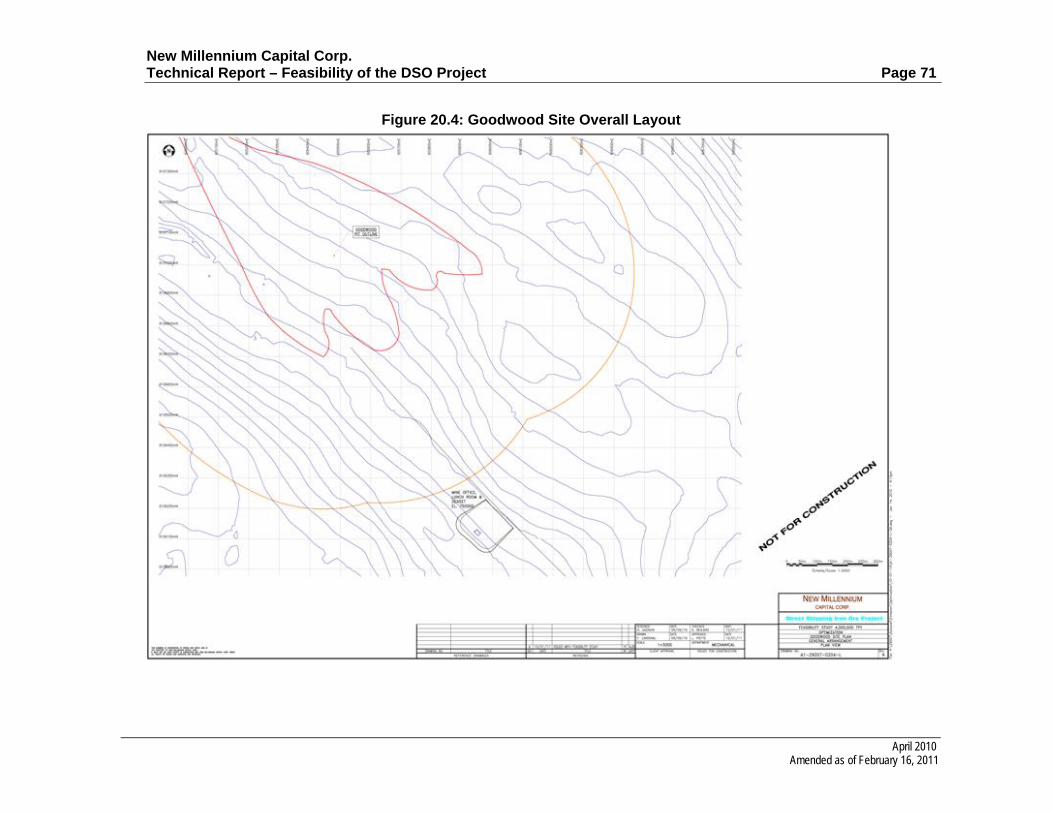
New Millennium Capital Corp. Technical Report – Feasibility of the DSO Project Page 71
April 2010 Amended as of February 16, 2011
Figure 20.4: Goodwood Site Overall Layout

New Millennium Capital Corp. Technical Report – Feasibility of the DSO Project Page 72
April 2010 Amended as of February 16, 2011
20.3 Tailings Management
The mined-out Timmins #2 pit will be used as both the tailings containment basin and the process water reservoir.
The tailings containment system will operate in closed circuit with the Process Plant. The design will meet all existing safety and environmental standards.
20.3.1 Site selection
Early in the Project, it was decided to use existing mined-out pits to dispose of the tailings instead of developing a traditional tailings containment area complete with dams and polishing ponds. Two tailings disposal locations were evaluated in the Timmins 1 and Timmins 2 mined-out pits, both of which are relatively close to the Process Plant, thereby minimizing capital and operating costs for the tailings handling and process water reclaim system.
Although it was closer to the Process Plant than the Timmins 2 pit, the Timmins 1 pit was rejected because environmental experts determined from a field survey in 2008 that the pit contains fish. The same survey indicated that the Timmins 2 pit does not contain any fish. Furthermore, the Timmins 2 pit was selected because:
It is 100% covered by a claim owned by NML;
The previous title holders declared, many years ago, that the deposit was completely mined out and no longer contains any economically mineable iron ore;
20.3.2 Design basis
The tailings pipeline will be approximately 275 m long with a diameter of 150 mm. The tailings will be pumped from the plant to the tailings pit which will be approximately 25 m below the elevation of the Process Plant. During operations in the winter months, a minimum flow of water will be maintained in the pipeline to prevent freezing. The process water reclaim pipeline will be approximately 900m long and will have an average diameter of 150 mm to return 100 m³/h of water from the tailings pit. The pipe is designed to sustain various pressures from 100 kPa to 500 kPa.
The quantity of tailings to be disposed of during the first three years of production is estimated at 3 million tonnes or 2.15 million cubic metres. It is estimated that the space in the Timmins 2 pit is sufficient to accept tailings for more than five years, after which time another mined out pit will be used.
20.4 Infrastructure
20.4.1 Timmins Site
The locations of various elements of infrastructure are shown on the already-presented Figure 20.3 and Figure 20.4.
Access Roads
Access to the Timmins Site will be via the old mine haulage road that starts at the outskirts of the town of Schefferville, Quebec. The existing 25 km of road from Schefferville northwest towards the Timmins Site already meets the specification of an all-weather unpaved highway that permits heavy traffic to circulate at normal speed as

New Millennium Capital Corp. Technical Report – Feasibility of the DSO Project Page 73
April 2010 Amended as of February 16, 2011
regulated by the provincial government and will require only relatively minor repairs to damage that reflects a lack of proper maintenance over the past 25 years.
Due to the location of the new DSO Process Plant and other installations, a 1.6 km length of the old access road will be relocated from its current route and follow a contour around the plant to the east.
Mine Haul Roads, Site Roads and Drainage
Haul roads from the pits and site roads to be used by off-highway mine trucks will be built to a stronger construction standard than the main access road and will be 12 m wide.
Site roads are required to access different parts of the property. Timmins Site roads include the following:
The continuation of mine haulage roads to the Primary Crushing Station and the maintenance garage;
A road from the bulk explosive manufacturing plant and the explosive storage magazine to the network of roads leading to pits;
A road from the Process Plant to the Timmins 2 pit that will be used for tailings containment;
A road from the Primary Crushing Station to the Process Plant that will also provide access to the crushed ore storage pile on the way.
Existing roads on and around the proposed site will be re-opened and used wherever possible.
MineSight® software was used to select the most economical routes for the access and site roads and to estimate cut and fill quantities. Rock cut quantities were kept to a minimum respecting a maximum slope of 8% for mine haulage roads and 8 to 10% for other roads.
To prevent incursion of surface water into the pits, ditches will be created that will encircle them and channel groundwater away from the pits to one or more clarification ponds. From those ponds, clarified water will be introduced into the upstream end of nearby lakes. These clarification ponds will also be used to decant the water pumped from the pit sumps.
A surface water management system will be developed on the Timmins Site that will channel run-off in areas where it would otherwise become contaminated to a central collection pond.
A storm drainage system will be created that will exploit the natural drainage around the pits with a network of open ditches and culverts that will connect with one or more of the above-referenced clarification ponds.
The Dome
By far the most important element of infrastructure to be erected at the Timmins Site will be a fabric dome, some 170 metres long and 106 metres wide at its base and 35 m high when inflated and supported on air continuously pumped into it, that will cover the whole of the site required for the various ore processing units, plus the maintenance garage, workshops, rail car maintenance facilities, warehouse, administration offices, a change house /washroom / lunch room for Process Plant personnel; the electricity generating

New Millennium Capital Corp. Technical Report – Feasibility of the DSO Project Page 74
April 2010 Amended as of February 16, 2011
station and fresh/fire and process water tanks. Made of vinyl-coated polyester and incorporating a vinyl coated galvanized steel cable net system, the dome will be erected on a graded surface and will be attached to a series of prefabricated concrete blocks placed around the perimeter of the rectangular area to be covered by the dome and inside which the various internal structures will be erected on individual concrete foundations and slab bases.
A personal airlock system, combined with a main entrance revolving door; will allow for safe entrance and egress by wheelchairs, small equipment or multiple persons at one time without affecting the internal pressure of the air-supported structure. Two truck door airlocks will permit vehicles and other equipment to pass in or out of the structure without changing the safe operating internal pressure. A third airlock will be constructed to permit railcar access to the railcar maintenance garage area.
The dome will provide protection from the local environment, which can be severe especially in the winter months. The dome will permit climate control and allow personnel to work unimpeded by the weather, as the inside temperature will not fall below the freezing mark. It will also eliminate precipitation and wind, thus providing a safer and more productive work environment.
Mine Equipment Maintenance Garage
The mine equipment maintenance garage area will be inside the Dome. It will be typical of facilities provided at similar sites and will include four major equipment maintenance bays, two of 216 m² each and two of 264 m² each, a tire shop and service bay, a drill repair area and a small vehicle service area,
Workshops
Also located under the Dome will be fully equipped mechanical and electrical workshops, with areas of 96 m² and 78 m² respectively
Railcar Maintenance Bay
A spur from the main rail line will permit railcars to be brought into the Dome for repairs in a bay equipped for axle changes and wheels repair. The 80-tonne rubber tire mobile crane will also have access to the railcars.
Warehouse
The warehouse will be located inside the Dome adjacent to the maintenance bays. It will have a surface area of 600 m² and will be equipped with storage racks and served by a fork lift truck.
Process Plant and Other Offices and Change House
The office/change house complex will consist of Atco® type trailers attached together. Each trailer will be 3.65 m by 18.3 m and the complex, located under the Dome along the southwest wall, will have the following modules:
The module housing the mining group will have three trailers giving a total area of 11.0 m by 18.3 m (200 m²) and will be equipped with all required furniture and telecommunications and computer equipment and systems;

New Millennium Capital Corp. Technical Report – Feasibility of the DSO Project Page 75
April 2010 Amended as of February 16, 2011
The Process Plant change house/washroom/lunch room module will have four trailers giving a total area of 14.6 m by 18.3 m (267m²). and will be equipped with separate baskets, showers and changing racks for men and women;
The module housing administration personnel will be composed of five trailers covering a total area of 18.3 m by 36.4 m (670 m²) and it will contain a number of fully-equipped offices.
The modules will be approximately half a metre above ground, supported on tripods and fitted with skirting.
Test Laboratory
The laboratory module, also located inside the Dome, will consist of three trailers with a total surface area of 200 m². The module, located along the southwest wall of the Dome, will be also installed on wooden tripods approximately half a meter high and it will also have skirting. One part of the module will have a concrete floor and will house the precision scales
Main Electrical Substation
Located outside the Dome, at its eastern corner and occupying an area of some 800 m², will be a substation where electricity will be received over a transmission line from the HQ Schefferville substation, in addition to the electricity generated at the station referred to in the following subsection. The electrical facilities are addressed in detail in Section 20.5
Electricity Generating Station
In addition to the electricity transmitted from the Hydro-Quebec Schefferville substation, electricity required to run the Process Plant, the camp and ancillary installations at the Timmins Site during winter months will be produced on-site by diesel engine-driven generators.
The generating station and associated facilities will be located within the Dome, where they will occupy an area of some 300m². The electrical installations will include a grounding loop for the power supply and distribution system, to ensure the safety of personnel and equipment.
The equipment is more fully described in Section 20.5 of this report.
Heating and Ventilation Systems
The pressurization system of the Dome will also be capable of heating and maintaining a minimum temperature of 16°C inside the Dome when the temperature outside is -40°C.
Direct propane-fired heaters or baseboard heater and fans will be installed in each trailer-based module to provide temperature control and ensure proper air changes.
Outside the Dome, the electrical room at the Primary Sizing Plant and DSO product silos will be equipped with electrical space heaters, mainly to prevent the electrical and hydraulic equipment from freezing. The gatehouse and the Process Plant and railcar load-out station control rooms will be heated with electrical baseboard heaters. No air conditioning units have been planned as the average summer temperature is generally below 15°C.

New Millennium Capital Corp. Technical Report – Feasibility of the DSO Project Page 76
April 2010 Amended as of February 16, 2011
Camp
Due to the limited availability of accommodation in the Schefferville area and to avoid creating problems by the influx of significant numbers of “outsiders” into First Nation communities, the project has provision for the construction of a permanent camp at the Timmins Site.
As more fully described in Section 12.0, it is estimated that the total number of employees will be 201, of which 10 will be located in the Labrador City office and 50 will be residents of local communities. Therefore, because of the work rotation, approximately 70 operations personnel [half of (201-10-50)] will require to be accommodated in the camp at any one time, plus the caterer’s employees, the explosive manufacturer/supplier’s employees, security personnel and visitors, for a total occupancy of some 100 in a camp that will have a capacity of 192 persons in 12 modules of 16 individual rooms.The camp will be installed inside the entrance gate and will be operated by a contractor that will provide all necessary services and ensure that food-related activities are conducted in accordance with appropriate regulations. The camp infrastructure; water supply, sewage, electricity, heating, kitchen and dining room will be sufficient for all the 12 dormitory units as they may be required during the construction period.
The camp will be initially composed of nine dormitory units (20 m by 16 m), each with 16 rooms per units, and a 48 m by 20 m kitchen, dining and recreation complex. The camp will occupy an overall area of 25,000 m² and each room will have individually controllable electric baseboard heaters to assure maximum comfort.
A parking area for company-supplied vehicles used by supervisory personnel will have spaces for some 20 vehicles.
A local transportation operator will be contracted to provide a bus service between Schefferville and the camp.
Gatehouse
The plant gate will be located on the south side of the existing access road, approximately 2 km from the Process Plant entrance and will control access to the Timmins Site, including the camp, and to the access road to the Goodwood Site.
Site Fencing
Fencing will be limited to the vicinity of the main gate and around lay down areas, substations and storage areas for propane tanks and explosives.
Fire Fighting
The fire fighting system will consist of the following:
One fully-equipped Fire Truck;
A heated fire pump house installed within three metres of the fire water storage tank flanged connection and designed in accordance with applicable codes, containing one diesel fire pump, one electric fire pump and one electric jockey pump;
a diesel fuel tank.
An underground loop

New Millennium Capital Corp. Technical Report – Feasibility of the DSO Project Page 77
April 2010 Amended as of February 16, 2011
The piping loop will be installed some 2.13 m below ground level around the perimeter of the Dome. Approximately eight hydrants and 11 underground feeds into various areas of the Dome will be installed.
A Fire Alarm System
A state-of-the-art Intelligent Multiplex Fire Detection System complete with Emergency Signalling System will be installed. T
NML intends to reach an understanding, as opposed to entering into formal agreements, with Schefferville and/or Kawawachikamach regarding mutual assistance in the event of large blazes.
Health Care
The process personnel unit in the Dome will include a fully-equipped clinic. NML will contract ambulance services to provide transport to the Schefferville medical center, except for extreme cases where “Medevac” airborne evacuation is required.
Compressed Air
Compressed air will be required to operate various isolation valves and instruments and for other uses such as equipment maintenance. Three 75 kW lubricated air compressors, two operating and one standby, will each be capable of providing 274l/s of compressed air at 740 kPa. Dry instrument air will also be used to prevent pipes freezing in remote areas such as those for the Sizing Station and the storage and load–out of products, where the pipes will have to run outdoors.
Communications
The following systems are planned for the mine, Process Plant and camp:
A telephone system, connected by land line to existing telecommunication facilities in Schefferville, will provide voice, fax and data transmission facilities. Cell phone service may also be available, although limited to certain network suppliers;
Hand-held closed-circuit radios operating on three separate wavelengths will provide a local communication system for operations, security and maintenance staff;
A local computer network, infrastructure and workstations will provide access to the Internet;
Water
The water systems at the Timmins Site will include those for fresh water, fire water, process water, run-off water and potable water.
Fresh Water
The fresh water source will be the mine dewatering wells to be installed around Timmins #3 pit, 1,500 m east of the Process Plant. The pumping station at Timmins #3 pit edge will be accessible via the haulage road. The pump house will include two standard vertical turbine pumps, one on stand-by, placed in a galvanized steel pipe well fed by the dewatering well pumps.
Water will be pumped from the mine dewatering wells through a pipeline to the Process Plant fresh water and fire protection water tank near the Process Plant structure under

New Millennium Capital Corp. Technical Report – Feasibility of the DSO Project Page 78
April 2010 Amended as of February 16, 2011
the Dome. The combined fresh and fire water tank will have a total capacity of 1,250m³.. The fresh water tank will also feed the water treatment unit that will produce potable water for distribution to structures under the Dome and to the camp. Total fresh water consumption is estimated to be 66 m³/h.
Process Water
Process water will be recovered from both thickeners in the Process Plant, and, when needed to maintain proper water flows in the Process Plant, make-up water will also be recovered from the site collection pond or the tailings pit and sent to the tailings thickener to ensure that solids in suspension are within acceptable limits. The water will be stored in the process water tank that will be capable of holding 1000 m³. Low pressure process water at 300 kPa will be distributed to the various process areas as needed by two pumps, one operating and one standby.
A second, higher pressure, process water system will also be installed Process water at 300 kPa will enter the system and two booster pumps, one operating and one standby, will be used to increase the pressure to 600 kPa to feed the WHIMS units, which require a minimum water pressure of 500 kPa. This high pressure process water will also feed the scrubber screen wash water spays for better washing efficiency. The total process water consumption is estimated to be 1,600 m³/h, of which up to 450 m³/h could be high pressure water,
Potable Water
As already mentioned, the potable water treatment system will be fed from the fresh water tank. A membrane filter unit (nanofiltration) will be used to provide potable water suitable for the camp (100 persons) and the plant (50 persons).
Mine Dewatering System
Pits with high water inflows will be dewatered by the use of peripheral wells fitted with pumps.
Rainfall, snow melt and ground water in the open pits will accumulate in mine sumps from where it will be removed by portable float-mounted electric submersible pumps and piped to one or more clarification ponds.
Wastewater and Sewage Treatment Systems
Two modularized treatment units utilizing a Rotating Biological Contactor (“RBC”) process (Biodisk), designed to meet effluent quality and natural environment discharge requirements with 15 mg/l BOD5 and 15 mg/l suspended solids will be installed, one near the Process Plant and the other in the vicinity of the camp. The sludge generated in this process will be removed about twice a year by a local contractor for disposal an approved waste management site.
Garbage and Solid Waste Disposal
A local contractor will dispose of garbage and solid waste by transporting the material to a new waste management site to be created near the Timmins #1 site.

New Millennium Capital Corp. Technical Report – Feasibility of the DSO Project Page 79
April 2010 Amended as of February 16, 2011
Diesel Fuel and Propane Storage
Diesel Fuel
“Arctic grade” diesel fuel, used to prevent freezing and/or separation of the fuel in fuel lines during severely cold weather, will be transported by rail from Sept-Îles to one of the two tank farms located next to rail siding on the southeast side of the Dome that will be dedicated to storing fuel for use in the electricity generating station and dryer, and used to transfer through a piping system to the second tank farm that will mainly serve as a storage and filling station for fuelling mine trucks and light vehicles and located on the southeast side of the ramp leading to the primary sizing station. Mining equipment such as front-end loaders and bulldozers will be refuelled in the pits by a fuel tanker truck that will be refilled at the tank farm. Each tank farm will consist of three inter-connected double-walled tanks, each with a capacity of some 170,000 litres, The average rate of fuel consumption at the electricity generating station is estimated to be 275,000 litres per week and the rate at the dryer, averaged over a complete year, is estimated to be 111,000 litres per week, while mining equipment will consume an average of 310,000 litres per week. Bulk storage for the diesel fuel will be provided by railcars stationed on an adjacent rail spur to maintain on average a one week inventory.
Propane
Propane will be used to fuel kitchen stoves at the camp, and to heat make-up air for the Dome, while fork-lift trucks operating inside the Dome will also be fuelled by propane in order to reduce exhaust emissions. Bulk propane tanks will normally be provided by the propane supplier, but site preparation, fencing and vaporizers will be provided by NML.
Explosives
Bulk Explosive Plant
A bulk explosive supplier will establish a manufacturing plant on the DSO Project property approximately 2.4 km from the camp site on the NL side of the border. The supplier will be responsible for the supply of raw materials to its manufacturing facility.
The supplier will build, own and manage its batch plant and will be responsible for all aspects of explosives, from obtaining the required raw materials to the delivery of some 35,000 kilograms of explosive per week into the blast holes. Two distribution trucks equipped with pumps will be used and assistance will be given by mine blasters.
The required electrical power for the explosive batch plant will be provided via a pole-mounted line from the substation outside the Dome. Water required for the plant will be obtained from a well that will be drilled nearby.
Mine Explosive Storage
Two explosives magazines will also be built by the supplier, one for cartridge explosives to be used for pre-shearing and secondary blasting and one for detonators and detonating cord, blasting caps and relays. The magazines will be located on concrete slabs surrounded by a heavy link fence with a locked gate.
The location of the magazines approximately 2.2 km from the camp is based on a maximum stored quantity of 70,000 kg and is in accordance with the requirements of the National Research Council’s Explosives Regulatory Division governing explosive quantities and distances.

New Millennium Capital Corp. Technical Report – Feasibility of the DSO Project Page 80
April 2010 Amended as of February 16, 2011
20.4.2 Goodwood Site
Access Road
For the 35 km from the Timmins Site to the Goodwood Site, a new road, 11 m wide with side berms and suitable for medium speed travel by haul trucks will be built, partially along the route of the track that is currently only usable by 4x4 Pick-up trucks or All-Terrain Vehicles. The proposed route of the new road takes into account local topography, the desire to minimize cut and fill quantities, and standards for road curvature and maximum gradients that will permit safe and efficient travel for off-highway trucks.The exact routing of the new road will be determined when a very detailed topographic survey has been completed.
Electricity
The Goodwood Site will be supplied with electric power by a diesel engine-driven generator with a capacity of 500 kW at 600 V, and there will also be a smaller standby unit. The packaged system will be tested prior to shipment and will be ready to operate when delivered on site, together with a winterized enclosure. The unit will be located near the mine office/lunch room trailer. The electrical installations will include a grounding loop for the power supply and distribution system, to ensure the safety of personnel and equipment.
The generating package is more fully described in Section 20.5
Other infrastructure
No camp accommodation will be provided at the Goodwood Site. A trailer to be used as mine office/lunch room/safety meeting room will be installed approximately 1,000 m from the entrance to the mine on a 16,500 m² pad which is large enough to accommodate the 135-tonne mine trucks. The trailer will also be equipped to act as an emergency shelter. A communications tower will be installed to facilitate communications between mobile equipment.
Sanitary facilities will be installed and bottled potable water will be provided.
20.5 Electricity
20.5.1 Design Basis
Timmins Site
At full capacity, the estimated electrical power demand at the Timmins Site for the Primary Crushing Plant, the Process Plant and associated facilities, infrastructure and services totals some 9.0 MW during five winter months and 7.5 MW during the other seven months of the year. The estimated electrical power factor of 0.85 will be compensated to 0.95 by the use of a number of variable frequency drives and capacitor banks.
Because of uncertainty as to the availability of electricity from Hydro-Quebec (“HQ”) or Newfoundland and Labrador Hydro (“NLH”) during the colder months of the year, NML has establishes\d two sources of supply of electricity and will:
generate its own electricity at a generating station to be located inside the Dome, near to the Process Plant, and,

New Millennium Capital Corp. Technical Report – Feasibility of the DSO Project Page 81
April 2010 Amended as of February 16, 2011
purchase such electricity from HQ and/or NLH as may be made available at the HQ substation in Schefferville.
As demonstrated by Table 20.5, HQ/NLH electricity will be consumed from April to November, while power generated at Site will be used from December to March, sometimes instead of and sometimes in addition to, HQ/NLH power. The higher demand during the colder months of the year reflects the use of the dryer, with its high-powered fans. The figures shown in the Table reflect process requirements and not the availability of HQ/NLH electricity.
Table 20.5: Supply and Demand for Electricity (MW) Source Jan Feb Mar Apr May Jun Jul Aug Sep Oct Nov Dec
HQ/NLH 2.1 4.8 6.8 6.8 6.8 6.8 4.8 2.1Generating Station 8.2 8.2 8.2 4.7 2.0 2.0 4.7 8.2
Total 8.2 8.2 8.2 6.8 6.8 6.8 6.8 6.8 6.8 6.8 6.8 8.2
Electricity supplied by HQ
NML will install a 69 kV transmission line, supported on H-frame poles, to transport electricity from the HQ Schefferville substation to a new 69 kV substation to be built near to, but outside, the Dome at the Timmins Site.
NML generated electricity
The generating station, to be installed on a concrete slab inside the Dome, will consist of six Cummins 1.825 MW 1,800 rpm diesel engine-driven generating units.. Five units will supply electrical power for normal operations during the winter months and four units will operate in the summer, with one unit on standby at all times The generators will be operated in rotation.
In addition to the generating units, the station will include:
two fuel reservoirs with a total storage capacity sufficient to meet two days consumption in winter;
a fuel control system;
a speed governor for each unit;
one synchronizing device;
a fuel efficiency monitoring and control unit;
load sharing and load shedding devices;
one 4.16 kV circuit breaker with protection relays and controls for each unit;
one 4.16 kV bus tie circuit breaker;
eight 4.16 kV circuit breakers with protection relays and controls for plant distribution feeders;
One 600 V MCC with a number of starters for generating station auxiliary equipment.
All of the above items will be located inside the Dome; the first three items will be in the generating station and all others will be in the station electrical room.
The control devices will ensure that the generating station will operate at maximum efficiency.

New Millennium Capital Corp. Technical Report – Feasibility of the DSO Project Page 82
April 2010 Amended as of February 16, 2011
Each generating unit will feed, via its 4.16 kV circuit breaker, a 4.16 kV bus in the electrical room. The bus will be split by a bus-tie circuit breaker to facilitate transfers and maintenance. All circuit breakers will be draw-out type to facilitate maintenance and they and associated buses will be installed in standard metal-clad, dust-tight cubicles to protect the equipment from the ingress of mineral dust.
A grounding system for all the electrical equipment at the site will be provided in order to ensure the safety of personnel and equipment.
Each generator will have a closed circuit jacket cooling system. The jacket cooling energy will be recovered by a water heat-exchanger and the heated water coming out of the exchanger will be used as feed water to the steam generator and to heat the air in the Dome to create a comfortable environment for operators. After the energy is dissipated by the HVAC system, most of the water will be returned to the fresh water tank.
Steam Plant
The exhaust gas from each generator will be collected in a common exhaust manifold and directed to a heat exchanger that will generate some five to six tonnes of steam for use in the filtration circuit. A drop of 200°C in the temperature of the gas will be required to produce the steam. Steam will go to both product filters and exhaust gas from the steam producing heat exchanger will go to the products dryer or directly to the stack scrubber if the dryer is not in operation.
Goodwood Site
The principal source of electric power at the Goodwood Site will be a 500 kW, 600V, three-phase diesel generator with a 600 V distribution panel and a 600/240 V transformer with 240-120V distribution panel. This equipment will be sufficient to meet the demand from pumps, lighting and general services.
There will also be a small 25 kW, 240 V, single-phase stand-by diesel generator with a 240-120 V distribution panel. The smaller unit will supply the power required to maintain essential services related to personnel health and safety and for use in the maintenance of the larger unit.
Pointe-Noire Site
The estimated electrical power demand for the railcar unloading, stockpiling, conveying and ship loading facilities totals some 3.0 MW, some of which is already available and supplying certain Wabush Mines installations. From the HQ Arnaud substation, a 161 kV line feeds the WM main substation from which power is distributed to all WM facilities. The WM system does not have the capacity to also supply all of the power required by NML facilities. The shortfall will be met, as required, by the supply of power from the WM emergency power generator at the required plant voltages.
Distribution system at Timmins Site
The distribution of electricity in and around buildings and structures both under and outside the Dome at the Timmins Site will be at 4.16 kV using pole-mounted overhead lines or 5 kV Teck-type insulated cables supported on trays attached to buildings and structures as appropriate.

New Millennium Capital Corp. Technical Report – Feasibility of the DSO Project Page 83
April 2010 Amended as of February 16, 2011
600 V Motor Control Centers
Each MCC will have:
one main incoming 600 V circuit breaker;
several starters for 600 V motors, 200 kW and smaller, in the area;
one 600 V distribution panel for various services;
one 600/240 V single-phase transformer with a 240-120 V distribution panel for lighting and miscellaneous services;
one 600/120 V constant voltage control transformer (120 V ±5% output while 600 V varies +10%/-20%) with a 120 V distribution panel feeding all control-starter contactors in the MCC;
20.6 Other Infrastructure
20.6.1 Product Transportation
To facilitate the handing-over of trains between railway companies, NML proposes to install sidings, complete with switches, at a site along the existing TSH rail line between Emeril and Ross Bay Junction (the "E/RBJ Interchange”). The interchange is shown on Drawing No. A1-28094-0001-L, a copy of which is presented as Figure 20.5: , and a map showing Arnaud Junction is presented as Figure 20.6.
Logistics
At the Timmins Site, the load-out station operator (or front end load operator) will use a remote control locomotive system, known as Locotrol, to index and load railcars. The loaded railcars will be verified at a weigh station to ensure proper loading and improperly loaded railcars will be corrected at that time. NML yard crew will then run either 120 or 240 loaded railcars to the railway company at the yard switch on the border of QNS&L. The railway company will deliver the train to the Labrador railway comany to the Junction at Mile Post 353 to be handed over to the TSH. All appropriate protocols will be followed to ensure a safe and a productive operation.
Thereafter the movement of DSO products will involve several railways. The TSH will transfer the loaded cars to the QNS&L Railway at the E/RBJ interchange. QNS&L will transport the 240 loaded railcars for some 350 km to Arnaud Junction, north of Sept-Îles Airport and near Pointe-Noire, where they will be transferred to the CFA railway and from where CFA will forward the railcars to Pointe Noire for unloading. The reverse routing will then be used to return the empty railcars to the Timmins Site for the next product shipment cycle.
Design Basis
The layouts at the E/RBJ Interchange and Arnaud Junction are based on the assumption that there will be a northbound empty train and a southbound loaded train at the interchange or the Junction at the same time. Efficiency in the use of locomotives will be achieved by a rail layout that will make it possible for the same sets of locomotives to exchange railcar sets at each of the Interchange and the Junction. It is to be noted that, for the trains to be at a junction and to exchange locomotives, three sidings are required to enable locomotives to be detached from, and to move around the trains.

New Millennium Capital Corp. Technical Report – Feasibility of the DSO Project Page 84
April 2010 Amended as of February 16, 2011
At Pointe-Noire, the layout of the existing Wabush Mines facilities is such that it is not feasible to accommodate a train of 240 railcars unless modifications are made to the sidings that will allow a 240-railcar train to be parked at Pointe-Noire while it is uncoupled and 120-railcar sections are sent to the car dumper for unloading.
It is also to be noted that in addition to infrastructure requirements described above, the TSH mainline must be rehabilitated to a Class 2 standard which is rated for a speed of 25 mph. To facilitate the shipment of iron ore on the TSH mainline a substantial portion of the upgrade work must be completed in years 1 and 2 of the project.
Expansion and repairs
NML commissioned AECOM Canada Ltd. (“AECOM”) to provide an estimate of rail transportation costs for the movement of iron ore from the product loadout facility at the Timmins Site to stockyard and ship loading facilities at Pointe Noire. The AECOM Report outlining this estimate was provided in January 2009 and the text of much of this Section is based on this report.
AECOM was given the mandate to estimate the rail transportation costs for this operation, with annual volumes of four million and eight million tonnes respectively.
To provide a rail transportation cost estimate, AECOM developed an operation plan and determined what additional capital assets will be required to move iron ore over this routing in an economical, efficient, effective and safe manner.
AECOM has provided in its planning for another producer to use the same railways to also transport 4 million tonnes of iron ore per year, for a total movement of 8 Mtpy. The operating plan and capital requirements for the movement of 8 million tonnes are similar to those for the movement of 4 million tonnes.

New Millennium Capital Corp. Technical Report – Feasibility of the DSO Project Page 85
April 2010 Amended as of February 16, 2011
Figure 20.5: Existing Interchange at Ross Bay Junction

New Millennium Capital Corp. Technical Report – Feasibility of the DSO Project Page 86
April 2010 Amended as of February 16, 2011
Figure 20.6: Existing Interchange at Arnaud Junction
New Millennium Capital Corp. Section 15 – Project Schedule Technical Report – DSO Feasibility Study Page 87
April 2010 Amended as of February 16, 2011
20.6.2 Product Storage and Ship Loading
Design Basis
Approximately 4.1 Mtpy of SF and SSF products containing a moisture content varying from less than 2% to 3.5% will be transported in 240-railcar consists or 120-railcar consists from the Timmins Site railcar loading facility to the stockyard and ship loading facilities owned and operated by WM at Pointe-Noire, Sept-Îles, Quebec.
It is from this port that WM currently ships all of its products by ocean-going vessels. Those products are almost all in the form of pellets, with few bulk shipments of concentrate or fines.
Facilities Description
The car unloading system will consist of a new single railcar rotary dumper that will be capable of emptying up to 50 railcars per hour and will be equipped with a car indexing mechanism, or positioner, that will advance and index ore cars for emptying without the need for locomotives.
The new dumper, to be built on the north section of the WM rail loop, will discharge DSO product into an underground hopper from which feeders will transfer the material onto a new discharge conveyor that will begin underground, emerge and run above ground before entering a new transfer house and discharging product onto the tail end of WM’s existing conveyor 10A which will be extended by some 250 m towards the western end of the WM stockyard.
The extended conveyor 10A will feed material to a new 5,000/6,000 tonnes per hour stacker/reclaimer that will be used to build and reclaim material from stockpiles, of which there will be at least one for each DSO product, with a combined capacity in excess of 300,000 tonnes.
NML products reclaimed from its stockpiles will be conveyed directly to the ship loaders and in so doing will by-pass the existing pellet storage silos. Certain transfer chutes will be modified to facilitate the handling of NML products.
It is anticipated that ships to be loaded with NML’s DSO Products will range in size from 60,000 DWT to 75,000 DWT.
20.7 Environmental Aspects
As noted elsewhere in this report, for the purpose of mining, the DSO Project (“DSOP”) was divided into Phase 1 and Phase 2. For the purpose of environmental impact assessment (“EIA”), the Project was divided into five “Assessment Groups” (“AGs”), which reflect principally the location of the deposits to be mined and, hence, the applicable EIA regimes.
Table 20.6 illustrates the relationship between the mining phases and the AGs and identifies the deposits assigned to each AG.

New Millennium Capital Corp. Section 15 – Project Schedule Technical Report – DSO Feasibility Study Page 88
April 2010 Amended as of February 16, 2011
Table 20.6: Subdivision of the DSOP for Purposes of Environmental Impact Assessment
Mining Designation
Assessment Group
Designation
Deposits Province
Phase 1 Assessment Group 1a Timmins 3N, 4, 7, Fleming 7N Labrador
Phase 1 Assessment Group 1b Ferriman 4 Québec
Phase 2 Assessment Group 2a Goodwood, Sunny 1, Kivivic 3S, Leroy 1 Québec (N of 55 ° N)
Phase 2 Assessment Group 2b Kivivic 1C, 2, 3N, 4, 5, Timmins 8 Labrador
Phase 2 Assessment Group 2c Barney 1, 2, Sawmill 1, Fleming 6, Fleming 7 Ext, Star Creek 2
Québec (S of 55 ° N)
Figure 20.7 shows each of the deposits by AG.
The sites and areas assigned to Phase 1 are those that have already been disturbed to varying degrees by prior exploration and mining.
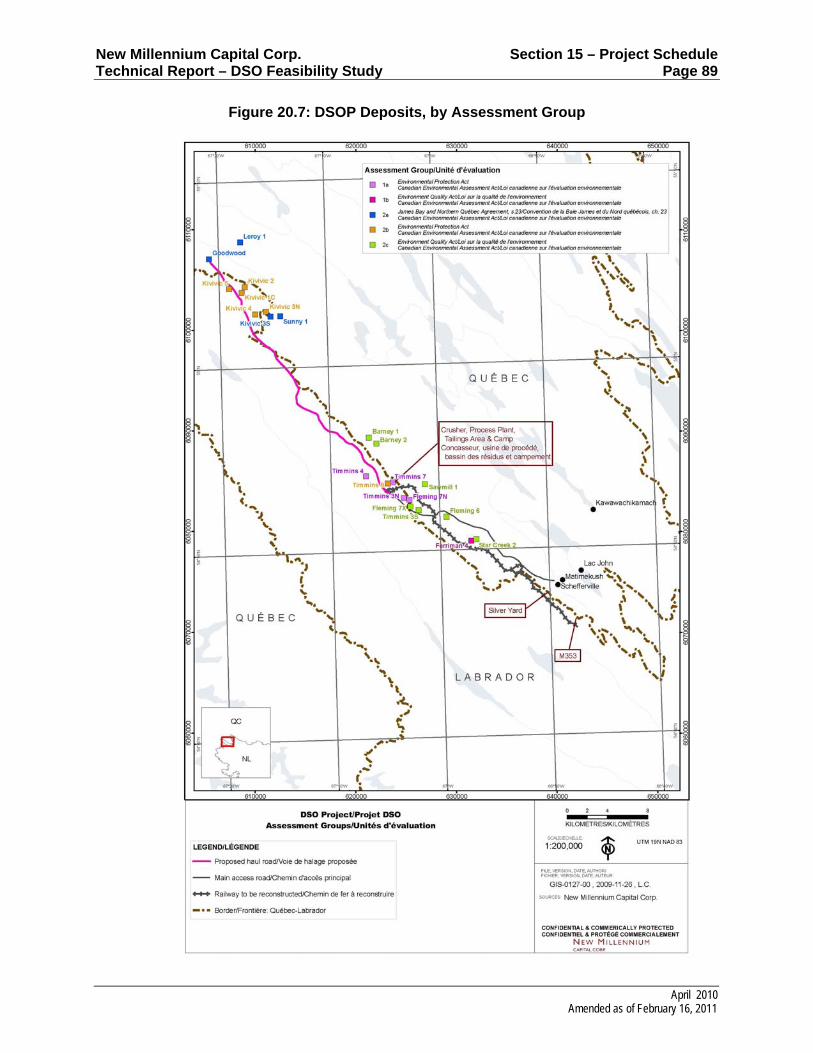
New Millennium Capital Corp. Section 15 – Project Schedule Technical Report – DSO Feasibility Study Page 89
April 2010 Amended as of February 16, 2011
Figure 20.7: DSOP Deposits, by Assessment Group

New Millennium Capital Corp. Section 15 – Project Schedule Technical Report – DSO Feasibility Study Page 90
April 2010 Amended as of February 16, 2011
20.7.1 Environmental Approval Requirements – Phase 1
Applicable Environmental Assessment Regimes
Introduction
NML tabled the project notices for the Phase 1 deposits as follows:
the initial project notice for AG1b with the Government of Québec on April 16, 2008, and a revised project notice on February 2, 2009;
the project registration for AG1a with the Government of Newfoundland and Labrador on April 29, 2008;
the project description for AG1a and AG1b with the Government of Canada (“GC”) on April 30, 2008.
Assessment Group 1a
On August 7, 2008, the Minister of the Department of Environment and Conservation (“DEC”) decided that the Elross Lake Area Iron Ore Mine (“ELAIOM”), as AG1a is called by the GNL, would be subject to the preparation of an environmental impact statement (“EIS”) pursuant to the Environmental Protection Act (“EPA”) of the GNL, which applies to all of the components of AG1a located in the Province of Newfoundland and Labrador (“PNL”). The GNL issued guidelines for the preparation of the EIS on December 12, 2008.
The only federal “triggers” for the Canadian Environmental Assessment Act (“CEAA”) identified by the GC in a preliminary scoping decision issued on August 20, 2009, are the issuing by the Canadian Transportation Agency of an authorization for the rail extension between Knob Lake Junction (M353) and the Timmins Site under subsection 98.(2) of the Canada Transportation Act and the issuing by Natural Resources Canada of a permit for the construction and operation of the explosives factory and magazines near the Timmins Site under paragraph 7(1)(a) of the Explosives Act.
In both cases, a screening pursuant to section 18 of the CEAA is required.
Assessment Group 1b
By letter of February 9, 2009, the ministère du Développement durable, de l’Environnement et des Parcs (“MDDEP”) informed NML that AG1b triggers the environmental assessment regime established by Division IV.1 of the Environment Quality Act (“EQA”). The MDDEP issued guidelines for the preparation of the required EIS in February, 2009.
The decision of the MDDEP was based on NML’s statement that production from AG1b would exceed the threshold for EIA of 7,000 tonnes per day. That threshold is in the process of being reduced to 3,000 tonnes per day.
NML has deferred the start of production at Ferriman 4. If it is developed, the daily rate of production is not yet known, and the possibility that it will not be subject to EIA under Division IV.1 of the EQA cannot be excluded.
By letter of November 18, 2008, the MDDEP confirmed, amongst other things, that the main access road and the reconstruction of the railway from M353 to the Timmins Site, as described by NML in a meeting with MDDEP on November 11, 2008, are not subject

New Millennium Capital Corp. Section 15 – Project Schedule Technical Report – DSO Feasibility Study Page 91
April 2010 Amended as of February 16, 2011
to the environmental assessment regime established by Division IV.1 of the EQA, but that some or all of them may require a certificate of authorization under section 22 of the EQA.
Fisheries and Oceans, Canada (“DFO”) has confirmed that the dewatering of the pit to be created at Ferriman 4 pit, the sole deposit in AG1b, will require the issuing of a permit under subsection 35(2) of the Fisheries Act, which is a trigger under the CEAA. Pending the submission by NML of further fisheries, hydrogeological and hydrological baseline data, however, DFO cannot determine whether a screening pursuant to section 18 of the CEAA or a comprehensive study pursuant to section 21 of the CEAA will be required. The required baseline data have been collected as noted in Section 13.2, and a report summarizing them is scheduled to be submitted to the GC in March, 2010.
General Timetable
Assessment Group 1a
Government of Newfoundland and Labrador
NML tabled the EIS for AG1a with the GNL in December, 2009.
The timeline for the remaining stages of the EPA process under the GNL, as posted in the Environmental Assessment Bulletin of the GNL on January 6, 2010, is shown in Table 20.7.
If the EIS is judged to be acceptable, the Minister of the DEC will submit a recommendation to Council within 20 days. There is no deadline for a decision by Cabinet, but informed persons within the GNL report that they are usually quite rapid.
The foregoing scenario assumes that the EIS as submitted will be accepted by the GNL without any changes or additions and that it will not be referred to an Environmental Assessment Board for public hearings. The former assumption is based on the fact that the EIS as tabled reflects intensive technical discussions between NML and the GNL on potentially controversial issues such as sedentary caribou and the benefits that would flow to the PNL. The latter assumption is based on the fact that the ELAIOM has so far attracted little public attention in the PNL and, particularly, in Labrador West.
If the GNL decides to hold public hearings, it is unlikely that its decision on the ELAIOM will be rendered before the end of November, 2010.
Table 20.7: Probable GNL Timeline for Environmental Impact Assessment of AG1a
Description Completion Date Deadline for Public Comments February 25, 2010
Decision on Acceptability of EIS March 16, 2010
Government of Canada
The GC made public the Project Agreement for the federal environmental assessment of AG1a on November 6, 2009. It establishes a timeline of approximately 7.5 months following the submission of the EIS. That timeline does not take into account delays that might be encountered in the consultations with the concerned First Nations or for NML to respond to any questions on its EIS. It also assumes, however, that revised and final versions of the EIS will have to be tabled, which NML considers to be improbable. On the basis of the foregoing, it is anticipated that the required authorization will be received

New Millennium Capital Corp. Section 15 – Project Schedule Technical Report – DSO Feasibility Study Page 92
April 2010 Amended as of February 16, 2011
by mid August, 2010, as shown in Table 20.8. It is to be noted that the first two of the three dates hve been successfully met.
Table 20.8: GC Timeline for Environmental Impact Assessment of AG1a
Description Completion Date Issue of Scoping Decision to NML August 20, 2009
Tabling of Screening Study to Rebuild Railway and to Build Explosives Factory/Magazines
December 16, 2009
Receipt of Authorization to Rebuild Railway and to Build Explosives Factory/Magazines
August 15, 2010
Assessment Group 1b
Government of Québec
NML has not yet determined when it will table the EIS for AG1b with the GQ, since the ore in Ferriman 4 is not of high priority.
If the development of AG1b is indeed subject to EIA under Division IV.1 of the EQA (see Section 13.1.1), the interest in the DSOP manifested by the populations of the Schefferville area makes it likely that public hearings will be held. The timeline for that process is likely to be similar to that for the Bloom Lake Iron Ore Mine Project of Consolidated Thompson Iron Mines Limited, which, including public hearings, was approximately 15 months from the tabling of the EIS to the receipt of Cabinet’s decision.
However, if NML can conclude impacts and benefits agreements (“IBAs”) with the concerned First Nations and a benefits-sharing agreement with the Ville de Schefferville, there might be no call for public hearings, in which case several months would be saved.
Government of Canada
It is not yet known whether AG1b will be subject to a comprehensive study or to a screening study under the CEAA. The target for the former is approximately 21 months from the tabling of the EIS to the receipt of authorization, compared to some nine months for the latter.
Scope of Assessments
The scope of any assessments for AG1b will be much less extensive than that of the assessments for AG1a, since they will not have to include the processing complex, the workers’ camp or the transportation infrastructure, all of which will have been assessed under AG1a.

New Millennium Capital Corp. Section 15 – Project Schedule Technical Report – DSO Feasibility Study Page 93
April 2010 Amended as of February 16, 2011
20.7.2 Baseline Studies – Phases 1 and 2
Numerous baseline studies have been completed and the conclusions drawn from the baseline data in terms of the environmental effects of AG1a are summarized as follows:N no negative effects of importance are predicted, while important positive effects are expected.
Planned studies and studies in progress, most of which concern Phase 2, are listed in Table 20.9
The baseline data collected in summer and fall 2009, suggest that there are no matters of environmental concern that cannot be avoided or mitigated. For example, any deleterious effects on fish habitat will be compensated according to a plan formulated in consultation with the local users and DFO.
Any further baseline studies required by the regulators will be carried out, although it is considered unlikely that any will be required.
Table 20.9: Planned and Current Baseline Studies for Phases 1 and 2
Baseline Study Assessment
Group Status
Archaeology AG2a, 2b, 2c Inspection of certain deposits and DSO4‐DSO3 road corridor planned for spring 2010.
Atmospheric Dispersion Modelling
AG2a, 2b, 2c Modelling of air/noise emissions of DSO3‐DSO4 haul road planned for early 2010.
Avifauna AG2a, 2b, 2c Breeding‐bird survey along Labrador‐based variant of DSO3‐DSO4 haul road may be needed in spring 2010; available data are being evaluated.
Caribou AG1a, 1b, 2a, 2b, 2c
Second aerial survey to determine presence of sedentary caribou planned for spring 2010, subject to cost‐sharing by Labrador Iron Mines Ltd and confirmation by the GNL of its requirement thereof.
Economic Modelling AG2a, 2b, 2c To be confirmed.
Hydrology/Piezometer Monitoring
AG2a, 2b, 2c Planned for 2010.
Efforts to conduct studies into land and resource-use and Traditional Ecological Knowledge (“TEK”) with the Sept-Îles Innu and the Labrador Innu proved to be fruitless in that both First Nations did not accept NML’s offer to participate in or to conduct such studies.

New Millennium Capital Corp. Section 15 – Project Schedule Technical Report – DSO Feasibility Study Page 94
April 2010 Amended as of February 16, 2011
Table 20.10: Overview of Baseline Data Collected in Summer and Fall of 2009 Baseline Study Area of Study
Fisheries
DSO2, DSO3 and DSO4
Québec‐ and Labrador‐based variants of DSO3‐DSO4 haul road
Hydrology
DSO2, DSO3 and DSO4
Hydrogeology DSO2, DSO3 and DSO4
Avifauna Québec‐based variant of DSO3‐DSO4 corridor
Terrestrial Ecosystem Mapping
Québec‐based variant of DSO3‐DSO4 corridor
20.7.3 Summary of EISs for AG1a
Two EISs for AG1a were submitted in December, 2009, one to the GNL and one to the GC.
EIS for AG1a Submitted to the GNL
Predicted Biophysical Effects
Fourteen biophysical environmental components were reviewed, and 11 Valued Ecosystem Components (“VECs”) were selected on the basis of the GNL Guidelines, a thorough programme of public information/consultation, a literature review and professional judgment.
The residual effects were predicted using the following criteria: nature; direction; spatial extent; duration; frequency; magnitude; level of certainty; reversibility; ecological value; and socio-economic value. All of the effects on biophysical VECs are negative, but none of them is predicted to be “significant”.
The only cumulative biophysical effect that could be measured was that on air quality in Schefferville in combination with the effects of Labrador Iron Mines Limited’s (“LIM”) Schefferville Area Iron Ore Mine. None of the measured effects exceeded approximately 20% of the applicable regulatory standard.
The potential for a negative cumulative effect on sedentary caribou was considered to be very small.
Predicted Socio-economic Effects
Thirty-three socio-economic VECs were selected in a manner similar to that described above for the biophysical VECs. The only “significant” residual socio-economic effect is a positive effect on the Newfoundland and Labrador Benefits VEC. Two of the other socio-economic residual effects are positive, and two are negative.
None of the potential cumulative effects could be evaluated quantitatively. Table 20.11 summarizes the only conclusions that could be drawn regarding cumulative effects on socio-economic VECs.

New Millennium Capital Corp. Section 15 – Project Schedule Technical Report – DSO Feasibility Study Page 95
April 2010 Amended as of February 16, 2011
Table 20.11: Cumulative Effects on Socio-economic VECs, DSOP VEC Cumulative Effect
Rail Transportation of Ore Positive effect on revenues of three concerned rail carriers.
Availability of Workers No effect predicted.
Subsistence Hunting and Trapping Insufficient data for prediction.
Newfoundland and Labrador Benefits Very positive effect.
Mitigation Measures
Approximately 170 standard mitigation measures were identified, divided into the following categories:
Tree-cutting and Management of Wood;
Erosion and Sedimentation;
Watercourse Crossings;
Transmission Line Rights-of-way;
Solid-waste Management;
Management of Hazardous Materials;
Drilling and Blasting;
Construction Equipment;
Mining Operation;
Management of Ore, Stockpiles, Tailings, Mine Waste and Overburden;
Water Management;
Process Water;
Effluent;
Air Quality;
Restoration.
The importance of effects was evaluated taking into account the application of those standard measures.
Wherever necessary and feasible, special mitigation measures were identified on a case-by-case basis with a view to enhancing positive effects and reducing the importance of negative effects. Residual effects were evaluated taking into account the application of such measures.
Component Studies
Component studies were conducted in the following areas: fish and fish habitat; archaeological and heritage sites; gender equity; Schefferville Innu and Naskapi land- and resource-use and traditional ecological knowledge; hydrogeology; breeding birds; terrestrial ecosystem mapping; commuter mining; and Aboriginal health.
They are all appended to the EIS.
A helicopter-based survey of caribou was also carried out in collaboration with LIM in May 2009. Its purpose was to ascertain the presence of sedentary caribou in the general vicinity of the DSOP deposits immediately before the calving season. The field results were inconclusive. The results of DNA analyses of samples collected from two female caribou will be available in early 2010.

New Millennium Capital Corp. Section 15 – Project Schedule Technical Report – DSO Feasibility Study Page 96
April 2010 Amended as of February 16, 2011
Table 20.12 summarizes the proposed monitoring programme.
Table 20.12: Monitoring Programme, DSOP Valued
Ecosystem Component
Activity
Air Quality Sampling for TPM and PM10 at workers’ camp over 1‐2 months during mining at Timmins 3N.
Noise Without BlastingMonitor noise at workers’ camp during day and night. Monitor the noise emitted by the generator fitted with the energy‐recovery system during the first days that it is in operation. With Blasting Maintain record of blasting data (vibration speed, ground vibration frequency, air pressure, dynamiting patterns).
Water Quality Surface Water Three times yearly monitoring of water quality parameters (temperature, pH, conductivity, oxygen, turbidity and previously analyzed metals) using the techniques already used and other appropriate techniques. Sampling stations: Timmins 1, 2 and 6; tailings pipeline between the Process Plant and Timmins 2 pit; Elross Creek; Goodream Creek. Groundwater Parameters described for surface water, plus nitrates and metals, will be sampled in at least four observation wells three times yearly and in the drinking water well six times yearly.
Water Budget Localized Drying‐upRead piezometers monthly. Monitor flow‐gauging stations in DSO3‐13 and DSO3‐14. Modulating Water Regimen Monitor fluctuations in level of Timmins 1.
Surficial Deposits Field visits during removal of substrate and topsoil. Annual inspection of storage sites.
Wetlands Loss of WetlandsField visits to check that area of wetland destroyed does not exceed the area predicted. Annual inspection to evaluate success of relocating wetland. Drying‐up of Wetlands Install piezometers in two wetlands near Timmins 4 to monitor water content and drainage.
Migratory and Sedentary Caribou
Noise DisturbanceMigratory: Financial contribution to population monitoring by government/academia in exchange for results. Participation in CARMA. Sedentary: Helicopter‐based survey in spring of every fourth year over a 50‐km radius, including collection of samples, for genetic analysis and satellite collaring. Ad hoc collection of samples for genetic analysis from Native hunters and outfitters’ clients. Loss of Habitat Migratory/Sedentary: Monitoring of losses of habitat of sedentary caribou. The results of other surveys will also be reviewed.
Harvested Mammals Hunting and trapping success by the concerned FNs will be monitored at five‐year intervals using the techniques described in Appendix D of the EIS. Results of monitoring of losses of habitat of sedentary caribou will be employed.

New Millennium Capital Corp. Section 15 – Project Schedule Technical Report – DSO Feasibility Study Page 97
April 2010 Amended as of February 16, 2011
Valued Ecosystem Component
Activity
The results of government surveys and of scientific studies will also be reviewed.
Wolverine Baited posts will be set up within a 50‐km radius of the ELAIOM every five years and will be monitored for one year (see Envirotel 3000 inc. February 2008). The work of the recovery team for the Eastern Canada wolverine population will be monitored. Wolverines will be included in the interviews with the concerned FNs.
Birds Surveys will be conducted every five years using the techniques described in Appendix F of the EIS.
Fish and Habitat Visual inspection for post‐blasting fish mortality in Pinette Creek.
Caribou Subsistence Hunting
This VEC will be addressed in the five‐year surveys of harvested mammals described above.
Local Employment Monthly, quarterly and annual reports on place of residence, ethnic affiliation and gender of all employees at the mine site will be prepared.
Local Contracting Will be addressed in the reports on local employment mentioned above.
Newfoundland and Labrador Benefits
The monthly, quarterly and annual reports described in the NLBP will identify the benefits (employment, contracting, taxes, royalties) flowing to Newfoundland and Labrador.
Trapping Trapping will be addressed in the five‐year surveys of harvested mammals.
Family and Interpersonal Relationships
NML’s human resources personnel will work individually with employees who commute to identify problems relating to family and interpersonal relationships. Subject to issues of confidentiality, examples of problems and solutions will be addressed in the annual report described above.
Community Cohesion The effects of the ELAIOM on community cohesion will be monitored at five‐year intervals.
Maintenance of Community Populations
The monitoring for local employment, local contracting and Newfoundland and Labrador benefits will collect data on the place of residence of employees. Those data will be analyzed every fifth year for changes of residence that might indicate an important effect on this VEC.
Gender Equity The reports on local employment and Newfoundland and Labrador benefits will also address gender issues. Prepare and implement an employment equity/women’s employment plan before start of construction; monitor implementation of plan yearly.
Caribou Sport Hunting
Annual discussion with the four outfitters identified in Section 5.5.7.3 of the EIS to discuss any perception of effects of ELAIOM on their business.
Local Infrastructure and Services
Annual meetings with Schefferville Administrator, airport manager, health and social services personnel. Maintain regular contact with CSSS de l’Hématite, which administers the Schefferville Dispensary.
Road Safety NML’s security personnel will record all accidents and compile an annual report.
Maintenance of Social Stability
Maintain a register of “incidents” involving non‐Native workers and local persons. Monitor appearances before itinerant court.
Maintenance of Local Labour Forces
The number of former employees of NNK and NIMLJ hired for the ELAIOM will be recorded annually in the report on local employment.
Other Annual meetings will be held with all levels of government, the concerned FNs, communities, concerned individuals and other organizations.
The following response plans are described in outline in the EIS and will be developed in full prior to or upon the release of the ELAIOM:
Emergency Response/Contingency Plan;

New Millennium Capital Corp. Section 15 – Project Schedule Technical Report – DSO Feasibility Study Page 98
April 2010 Amended as of February 16, 2011
Environmental Protection Plan;
Rehabilitation and Closure Plan;
Employment Equity Plan.
Fundamental Conclusions
The following fundamental conclusions can be drawn:
only approximately 94 ha will be disturbed, some 46% of which has already been disturbed by prior mining activities;
there will be no significant negative effects on biophysical VECs;
there will be no effects on 28 socio-economic VECs;
there will be low negative effects on two socio-economic VECs;
there will be positive effects on three socio-economic VECs, and the effect on the Newfoundland and Labrador benefits VEC will be significant;
there is little public concern about, or interest in, the ELAIOM in Labrador West;
in the absence of the ELAIOM, it is likely that the regional transportation and energy infrastructure will be decommissioned, which will virtually eliminate any serious likelihood that the mineral potential of large areas of Labrador West, Labrador North and Québec will be able to be developed economically in the foreseeable future.
Issues of Concern
The principal issues of concern are:
to ensure that the predicted benefits for the people and government of Newfoundland and Labrador are attained or exceeded;
to ensure that negative impacts on sedentary caribou are avoided.
EIS for AG1a Submitted to the GC
The Project for purposes of the EIS for AG1a tabled with the GC consists of the reconstruction and operation of the railway between M353 and the Timmins Site and the construction and operation of the rail car loading station (the “Railway Project”) and the explosives factory/magazines (the “Explosives Project”).
An analysis of the potential sources of effects of the Project reveals that the following sources merit further consideration:
Explosives Project – a spill during the transportation of hazardous products between the rail head at the Timmins Site and the explosives factory and from there to the blasting site;
Railway Project – the reconstruction of the rail line and the associated site-clearing; the operation of the rail line and the rail car loading station; a derailment; and an accident during the importing of hazardous materials.
Valued ecosystem components were selected on the basis of the nature of the Project, the federal scoping decision, public information/consultation, a literature review and professional judgment.
The following VECs were retained:

New Millennium Capital Corp. Section 15 – Project Schedule Technical Report – DSO Feasibility Study Page 99
April 2010 Amended as of February 16, 2011
Explosives Project – environmental integrity in the event of a spill of hazardous products;
Railway Project – the atmospheric and vibro-acoustic environment; sedentary caribou; Rusty blackbird; the use of cottages in the vicinity of Bean Lake and lac Star for recreational and subsistence purposes; the safety of workers and of persons using the vicinity of the rebuilt rail track for recreational or subsistence purposes; and environmental integrity in the event of a spill of hazardous products.
The effects assessment concludes as follows:
Explosives Project
in the event of a spill of hazardous products, a negative effect of minor to moderate importance would occur on environmental integrity;
Railway Project
there would be no effect on the Rusty blackbird;
the effect on ambient air quality would be at most a negligible negative one;
a negligible negative effect would occur on the vibro-acoustic environment;
a negative effect of negligible importance would be experienced by the users of cottages near Bean Lake as a result of noise and vibrations, while there would in all likelihood be a negligible negative effect or no effect at all on cottage-users in the area of Bean Lake and lac Star arising from dust;
a negative effect of minor importance would occur on sedentary caribou, should it be present in the study area;
in the event of a derailment, a negative effect of minor to moderate importance would occur on the safety of workers and other persons in the vicinity of the rail track;
in the event of a spill of hazardous substances, a minor to moderate negative effect would occur on environmental integrity.
Given that the Project will not cause any important effects, combined with the finding in the EIS for AG1a tabled with the GNL that the ELAIOM will not be the source of any significant cumulative effect, we find that there is no potential for important cumulative effects from the Project.
The monitoring programme proposed for the ELAIOM will capture any unexpected effects arising from the Project.
The following response plans will be applied:
NML’s generic Environmental, Health, Safety and Sustainability Manual;
a Health, Safety, Environment & Quality Management System for the Explosives Project;
an Emergency Response Plan for the Railway Project.
20.7.4 First Nations
Status of Land-Claims Settlements and Negotiations in Potentially Affected Areas
The James Bay and Northern Québec Agreement (“JBNQA”), signed in 1975, resolved the Québec claims of the Cree and the Inuit of Québec. Those of the Inuit extended to the vicinity of DSO4. The Northeastern Québec Agreement (“NEQA”) and

New Millennium Capital Corp. Section 15 – Project Schedule Technical Report – DSO Feasibility Study Page 100
April 2010 Amended as of February 16, 2011
Complementary Agreement No. 1 to the JBNQA, both executed in 1978, resolved the Québec claims of the Naskapis.
The First Nations whose land-claims settlements and negotiations may fall in potentially affected areas are listed in Table 20.13
Table 20.13: Status of Land-Claims Settlements and Negotiations First Nation Status of Land-Claims Settlements/Negotiations
Naskapi Nation of Kawawachikamach (“NNK”) (Kawawachikamach, Québec)
Naskapis assert rights in and to parts of Labrador, including DSO Project sites, but claim not yet accepted by GC or GNL.
Nation Innu Matimekush‐Lac John (“NIMLJ”) (Schefferville, Québec)
NIMLJ claims parts of Québec and Labrador, including all the deposits of the DSO Project. Claim accepted by GC in 1979 and by GQ in 1980, but not by GNL, and negotiations are in progress only for Québec portion of claim.
Innu Takuaikan Uashat mak Mani Utenam (“ITUM”) (Sept‐Îles, Québec)
ITUM claims parts of Québec and Labrador, including all the deposits of the DSO Project. Claim accepted by GC in 1979 and by GQ in 1980, but not by GNL, and negotiations are in progress only for the Québec portion of claim.
Innu Nation (Natuashish and Sheshatshit, Labrador)
IN Claim, which extends to the Labrador deposits of the DSO Project, accepted for negotiation by Canada in 1978, subject to participation of GNL and completion of a land‐use and occupancy study by Innu. Conditions fulfilled in 1991, and formal tripartite negotiations began in July 1991. Innu Nation presented land‐claims proposal on May 18, 2001, that both GC and GNL found to be a reasonable basis for negotiations. The execution of the New Dawn Agreement by the GNL, Energy Corporation of Newfoundland and Labrador and Innu Nation on September 26, 2008 provides guidance to NML on the obligation of negotiating an IBA with Innu Nation for the portion of the DSO Project located in NL if a final land claim agreement is ratified. The Agreement determines that the area of the DSO Project in Labrador will lie in an economic development area and states that the right of the Innu applicable to the economic development areas “will be limited to an IBA for any Major Development”. Although the Agreement does not define “Major Development”, we believe that the definition that will be adopted will capture the DSO Project. Innu Nation will, therefore, have a legal right to an IBA for the Labrador portion of the DSO Project, but that is unlikely to occur before the impact assessment of the DSO Project is completed. Innu Nation may assert claims in and to parts of Québec. These claims have not been accepted by GC or GQ. Labrador Innu claims are not believed to extend to DSO Project areas in Québec.
Impacts and Benefits Agreements
Based on the information set out in the preceding sub-section, NML is attempting to negotiate IBAs that will encompass both phases of the DSOP with each of NNK, NIMLJ, ITUM and Innu Nation. It tabled draft IBAs with each of the First Nations on August 21-22, 2009. On December 11, 2009, NML tabled its final proposal with each of the First Nations, requesting that they indicate by January 15, 2010, whether they agree to

New Millennium Capital Corp. Section 15 – Project Schedule Technical Report – DSO Feasibility Study Page 101
April 2010 Amended as of February 16, 2011
conclude an IBA by March 20, 2010. On 21 January, 2010, NML formally suspended negotiations with the IN, ITUM and NIMLJ, the three First Nations that had indicated their unwillingness to negotiate. NML has formally advised governments of the efforts that it has made to negotiate balanced IBAs and its decision to put the money to be provided under the terms of its Final Offers in a trust fund for the benefits of the FNs.
Only NNK responded positively to NML’s invitation to negotiate and NML will develop a new financial package that may reconcile the demands of the NNK and the financial requirements for a viable DSOP and consequently bring the parties to sign an IBA before the end of the first quarter of 2010.
To date, NML has executed memoranda of understanding with the NNK and NIMLJ.
20.7.5 Local Communities
In recent years, it has become normal practice for resource developments to make special efforts to ensure that the communities closest to them share in the benefits that the projects generate. NML has offered to negotiate with the Ville de Schefferville, which is the only non-Native community that has the potential to be directly impacted by the DSO Project, with a view to possibly concluding a benefits-sharing agreement, but it has not received a firm response from the Ville de Schefferville.
20.7.6 DSOP Phase 2
Applicable Environmental Assessment Regimes
Assessment Group 2a
AG2a is expected to trigger the provincial regime established by Section 23 of the JBNQA (EQA, Chapter II, Division III)1 and the CEAA.
Section 23 of the JBNQA applies with minor exceptions to all of Québec north of the 55th parallel of latitude. Schedule 1 of JBNQA Section 23 specifies that all mining developments, including significant additions, alterations or modifications to existing mining developments, are automatically subject to EIA. Air and ground reconnaissance, survey, mapping and core sampling by drilling are, however, permitted without the preparation of an impact statement.
The provincial regime of JBNQA Section 23 establishes the Kativik Environmental Quality Commission (“KEQC”) (5 Québec members, including Chair; 4 “Inuit” members).
The federal regime established by Section 23 of the JBNQA should not be triggered, since there is no component of the project under AG2a that would be under federal jurisdiction, such as a landing strip. That understanding is based on correspondence with the Principal Advisor JBNQA of the Canadian Environmental Assessment Agency in September, 2009.
11 In Moses v. Canada, the Québec Superior Court ruled on March 30, 2006, that the CEAA does not
apply in the “Territory” of the JBNQA, because the assessment process established by the CEAA is incompatible with that established by section 22 of the JBNQA. The Court of Appeal upheld that ruling. Both sides appealed that judgment. Pending the outcome of those appeals, the CEAA continues to apply. The application for leave to appeal was granted by the Supreme Court of Canada on October 16, 2008. The appeal was heard on June 9, 2009, but, as of the time of writing, the Court’s decision had not been rendered.

New Millennium Capital Corp. Section 15 – Project Schedule Technical Report – DSO Feasibility Study Page 102
April 2010 Amended as of February 16, 2011
The scope of the application of the CEAA, if any, should be known in the coming weeks, as the project description was filed on December 18, 2009.
Assessment Group 2b
AG2b is expected to trigger the same environmental assessment regimes of general application established by the CEAA and the EPA as those that apply to AG1a as set out previously although the existence of a federal “trigger” will not be confirmed until sometime in the first quarter of 2010, as the project description was tabled on December 18, 2009.
Assessment Group 2c
AG2c is expected to trigger the same environmental assessment regimes of general application established by the CEAA and Division IV.1 of the EQA of the GQ as those that apply to AG1b as set out previously. Again, the existence of a federal “trigger” will be confirmed only some time following the tabling of the project notice.
General Timetable
Assessment Group 2a
JBNQA Section 23 does not create timetables for the regimes that it creates, except that the KEQC must render a decision within 90 days of a determination by the Québec Administrator that an EIS is adequate (JBNQA 23.3.25).
After reviewing a project, the KEQC recommends whether or not the Administrator should authorize the project and establishes any conditions that it judges appropriate for authorization. The Administrator then sends the final decision to the proponent, who must comply with its terms and conditions.
The EIA of recent projects of a similar scale (i.e., Nunavik Nickel Mine Project of Canadian Royalties; Kuujjuaq Thermal Generating Station Project of Hydro-Québec) suggest a timeline of four months between the tabling of the project notice and the receipt of the guidelines (the KEQC does not use the generic guidelines used by the GQ south of the 55th parallel of latitude) and of 12 months from the tabling of the EIS to the delivery of the certificate of authorization (Table 20.14).
Table 20.14: Tentative KEQC Timeline for Environmental Impact Assessment of AG2a
Description Completion Date Tabling of Project Notice December 15, 2009
Issuance of Guidelines April 15, 2010
Tabling of EIS April 30, 2010
Receipt of Authorization April 30, 2011
Should AG2a trigger the EIA process under the CEAA, Table 20.15 presents a tentative timeline.
Table 20.15: Tentative GC Timeline for Environmental Impact Assessment of AG2a
Description Completion Date Tabling of Project Notice December 18, 2009
Issuance of Scoping Decision April 1, 2010
Tabling of Comprehensive/Screening Study April 30, 2010
Receipt of Authorization (if comprehensive study) January 30, 2012

New Millennium Capital Corp. Section 15 – Project Schedule Technical Report – DSO Feasibility Study Page 103
April 2010 Amended as of February 16, 2011
Receipt of Authorization (if screening study) January 30, 2011
A screening assessment under the CEAA would take three months less than the KEQC process, while a comprehensive study assessment would take nine months longer.
The anticipated dates of receipt of the environmental authorizations from the GQ and the GC, even in the event of a comprehensive study assessment, are compatible with the mining schedule for AG2a.
Assessment Group 2b
Table 20.16 and Table 20.17 present the tentative timelines for AG2b under the GNL and the GC processes respectively. The timeline for the GNL assumes that there will be no public hearings.
Table 20.16: Tentative GNL Timeline for Environmental Impact Assessment of AG2b
Description Completion Date Tabling of Project Registration December 16, 2009
Minister’s Decision on Assessment Type April 1, 2010
Issuance of Guidelines June 1, 2010
Tabling of EIS June 30, 2010
Decision on EIS Acceptability October 30, 2010
Recommendation to Cabinet November 30, 2010
Table 20.17: Tentative GC Timeline for Environmental Impact Assessment of AG2b
Description Completion Date Tabling of Project Notice December 18, 2009
Issuance of Scoping Decision April 15, 2010
Tabling of Comprehensive/Screening Study June 15, 2010
Receipt of Authorization (if comprehensive study) March 15, 2012
Receipt of Authorization (if screening study) March 15, 2011 Note: Application of CEAA uncertain until scoping decision received.
A screening assessment under the CEAA would take almost four months longer than is estimated for the GNL process, while a comprehensive study assessment would add almost 16 months.
The anticipated dates of receipt of environmental authorizations from the GNL and the GC, even in the event of a comprehensive study assessment, are compatible with the mining schedule for AG2b.
Assessment Group 2c
Mining of AG2c is not expected to start before 2022. There is a concern that environmental releases obtained too far in advance of the start of production might lapse or be cancelled. In the light of the foregoing, the timeline for the submission of the project notices to the GQ and the GC will be determined once the mining schedule is more firmly established.
20.7.7 Methodological Considerations
Scope of Assessments
The scope of the assessments for AG2a, AG2b and AG2c will be much less than that of the assessment for AG1a, because the processing complex, the workers’ camp, the

New Millennium Capital Corp. Section 15 – Project Schedule Technical Report – DSO Feasibility Study Page 104
April 2010 Amended as of February 16, 2011
main access road and the rail spur from M353 to the Timmins Site will all be used for the Phase 2 deposits and will not have to be re-assessed.
The environmental impact assessments for AG2a, AG2b and AG2c will be limited to the pits, the access and haul roads, the overburden and waste rock piles, the disposal of dewatering water and the road from DSO4 to DSO3.
ELAIOM GNL EIS as a Model
The EIS submitted to the GNL for the ELAIOM in December, 2009, was planned and executed so as to expedite the preparation of the EISs for AG2a, AG2b and AG2c, in the following ways:
a substantial part of the text on the rationale/need/purpose (EIS Section 3.0) will be applicable and therefore reused;
many aspects of the project description (EIS Section 4) will be reused, since such infrastructure as the processing complex, the workers’ camp, the main access road and the rail spur from M353 to the Timmins Site will be used by every AG;
the descriptions of the local and regional study areas based on the literature (EIS Section 5) will be applicable and therefore reused;
the methodology for evaluating impacts (EIS Section 7) will be identical for all the AGs;
the same standard mitigation measures (EIS Appendix 5) will be used in all the AGs;
the list of projects to be considered for cumulative impacts assessment (EIS Appendix 14) will be applicable.
20.7.8 Overview
At the present time there is no reason to anticipate the emergence of any environmental issue likely to lead to the refusal of a government to authorize the development of any of the Assessment Groups.
20.8 Project Schedule
Upon completion of Environmental Permitting in early 2010, it is estimated that the Project can be launched in the first quarter of 2010. However, due to long delivery times for certain major items for the Project and subject to funding, engineering and procurement activities have already started.
20.8.1 Advance Engineering
Advance Engineering Activities
Advance engineering activities are those that will improve the schedule by allowing the early design and procurement of key equipment that impacts the critical path of the project. This equipment is listed in Table 20.18 and is based on data received from the vendors at the time of the Feasibility Study preparation.
Advance engineering activities also provide additional time to obtain the permits and authorizations required for the project. Since some of them may well take longer to obtain than estimated it is prudent to get an early start to these activities

New Millennium Capital Corp. Section 15 – Project Schedule Technical Report – DSO Feasibility Study Page 105
April 2010 Amended as of February 16, 2011
Advance Engineering Costs
The cost of the advance engineering activities is the cost to engineer and procure those items of equipment that have an impact on the end date of the project schedule. For this Feasibility Study, delivery times were provided by the potential suppliers of equipment that also provided budget prices
Table 20.18 shows the estimated delivery times for all major items of equipment.
Table 20.18: Major Equipment Delivery Lead Times Equipment Lead Delivery Time
Railcar rotary dumper 14(*) months
Stacker/reclaimer 24(*) months
Mineral sizer 40 weeks
Conveyors and Feeders 20 weeks
Drum Scrubber 22 weeks
Slurry Pumps 32 weeks
Drum Filters 35 weeks
Cyclones 22 weeks
Rod Mill 35 weeks
Jigs 26 weeks
Stack Sizers 30 weeks
WHIMS 26 weeks
Pan Filters 28 weeks
Train Loading Chute 32 weeks
Spirals 24 weeks
Thickener 22 weeks
Switchgear 26 weeks (*) Delivery times to be negotiated to improve schedule
In order to meet schedule dates, it will be necessary to negotiate delivery lead times for some specific equipment that are better than those provided by the potential suppliers of the equipment. For example, it will be necessary to reduce the delivery time for the stacker/reclaimer and the railcar dumper at Pointe-Noire, from the present twenty-four months to fourteen months or less. It is expected that this will be achieved through successful negotiations at the time of placing a firm order. It is also planned to use the existing WM stacker-reclaimer at Pointe-Noire for the first few months of operation until the new stacker-reclaimer is installed.
20.8.2 Full Notice to Proceed
NML considers it possible that it will receive a Full Notice to Proceed, issued by Tata, at the beginning of May, 2010. At that time, advance engineering will continue but at a more detailed level and procurement activities will be stepped up.
One key aspect of the early effort will be the preparation and issue of a package to solicit bids from construction contractors.
20.8.3 Key Milestone Dates
In order to complete the Project for initial production of concentrate to begin in the fourth quarter of 2011, the key dates set out inTable 20.19 have been identified.
Table 20.19: Project Milestone Dates Event Milestone Date

New Millennium Capital Corp. Section 15 – Project Schedule Technical Report – DSO Feasibility Study Page 106
April 2010 Amended as of February 16, 2011
Start of Advance Engineering Activities 16 November, 2009
Advance Notice to Proceed 18 March, 2010
Full Notice to Proceed 31 May, 2010
Start of Timmins Site Preparation and Construction 01 June, 2010
Start of Construction activities related to the Dome at the Timmins Site
10 August, 2010
Start of Construction of Railway from NL/QC Border to Timmins Site
15 August, 2010
End of Construction of Railway from NL/QC Border to Timmins Site
30 November, 2010
End of Construction at Timmins Site 24 August, 2011
Start‐up of Mine and Process Plant 22 October, 2011
Start of Construction at Pointe‐Noire 06 June, 2010
End of Construction at Pointe‐Noire September, 2011(Car Dumper)February, 2012 (Stacker/Reclaimer)
Full Production 22 November, 2012
The major activities to be undertaken in that timeframe are described hereafter and shown on the bar-chart presented as Figure 20.8.
The scheduled development of the mine and construction of the facilities at the Timmins Site rely on the timely transportation of all construction materials and equipment from the port of Sept-Îles to the E/RBJ Interchange via the CFA and QNS&L railways, from there to Mile Post 353 (“MP353”) on the TSH railway and, finally, on the re-installed rail line to the Timmins Site.
Until the railway from MP353 to the Timmins Site is re-established, which will be some seven months after construction begins at the Site, all construction materials and equipment will continue on the TSH railway to Schefferville, where they will be off-loaded and then transported by road to the Timmins Site.
20.8.4 Feasibility Study
The Feasibility Study was started at the beginning of July, 2009, and this Study Report was submitted for review by executive management at the end of January 2010.
20.8.5 Production Start-up
Start-up of production will be initiated immediately following the end of construction. The start-up and commissioning will focus on having at least one of every piece of equipment and one of every system functional so they can be fed with feedstock. Commissioning of complementary equipment and systems will take place while the plant is operational.
Start of production is scheduled to start in the third week of October 2011. It is expected that the plant will attain 10% of its nameplate capacity for each of the first nine months. The remaining capacity is expected to be achieved in the following four months – thus full production of 4,000,000 tonnes per year is expected in the year 2013, some 13 months after start-up.

New Millennium Capital Corp. Section 15 – Project Schedule Technical Report – DSO Feasibility Study Page 107
April 2010 Amended as of February 16, 2011
Figure 20.8: Summary Project Schedule

New Millennium Capital Corp. Section 15 – Project Schedule Technical Report – DSO Feasibility Study Page 108
April 2010 Amended as of February 16, 2011
20.9 Market
20.9.1 Marketing
As already noted, in October, 2008, NML entered into a binding agreement with Tata whereby Tata has an option to acquire 80% of the DSO Project by investing up to $300 million in the capital cost. If Tata exercises its option, it will commit to take 100% of DSO production of certain products of specified quality for the life of the mining operation, paying world market prices, FOB Sept-Îles, for the products. Because of that agreement, NML has not expended any marketing effort to identify any other potential customers for the DSO products.
20.9.2 Product Pricing
The following text and figures, taken from the an independent Report, provide the background information that was used to develop the long-term product price forecast used in the financial evaluation of the DSO project.
Crude steel production
As is well known in the industry, the principal growth in crude steel production in the recent past has been in China whose growth has overshadowed virtually all other developments. Chinese crude steel production reached 502 million tonnes in 2008, representing compound annual growth over 2002-2008 of 18.4%, at which rate Chinese crude steel production will have increased to 517 million tonnes in 2009.
Looking forward to 2018, the following trends are expected:
A gradual shift in crude steel production from North America and Europe to Brazil with an increase in shipments of steel slabs from Brazil to North America and Europe. In 2009, crude steel production will have fallen by 40% in North America and by 35% in Europe.
Eastern Europe and the Commonwealth of Independent States (“CIS”) shift unevenly and slowly from downsizing and modernisation to growth with the likelihood that the EAF share of crude steel production will increase.
Japanese crude steel production will return to the 100-110 Mtpy range with a negative trend during the second half of the forecast period after a 30% fall in 2009.
Growth in South Korean crude steel production will moderate from past levels as increased demand is increasingly met from Korean-owned offshore plants in India, China, Malaysia, etc.
India will follow in China’s footsteps with increasingly rapid growth in crude steel production, reaching 111 million tonnes by the end of the forecast period. This will be under-pinned by Gross Domestic Product (“GDP”) growth as well as by foreign-owned steel mill investments.
China’s crude steel production will continue to grow at a significant rate in the short to medium term, although growth is likely to moderate significantly from the >20% per year rates of recent years as Chinese mills focus on consolidation, greater added value and cost reduction. Chinese production growth is forecast at 3% in 2009, 4% per year in 2010-2013, falling to 3% per year thereafter. This means crude steel production will reach 605 million tonnes in 2013 and 701 million tonnes in 2018.

New Millennium Capital Corp. Section 15 – Project Schedule Technical Report – DSO Feasibility Study Page 109
April 2010 Amended as of February 16, 2011
Iron ore demand
Forecasts of global blast furnace iron and DRI/HBI production have been derived from the crude steel forecast and in turn a forecast of global iron ore demand has been developed. This is summarized in Table 20.20 and the split between ore types is shown in Table 20.21.
Table 20.20: Forecast Iron Ore Demand by Source of Demand Iron ore demand (million tonnes)
2008 2013 2018
From blast furnaces 1,407 1,510 1,714
From direct reduction 103 131 178
Total 1,510 1,642 1,892
Table 20.21: Forecast Iron Ore Demand by Type of Ore Iron ore demand (million tonnes)
2008 2013 2018
Total, of which: 1,510 1,642 1,892
Pellets 266 301 381
Lump ore 154 161 183
Fines 1,090 1,180 1,328
With 2008 as the base year, cumulative incremental demand is 132 Mtpy by 2013 and 382 Mtpy by 2018.
Iron ore supply and demand
Global iron ore production in 2008 [including China] has been reported by UNCTAD at 1.72 billion tonnes [with Chinese production data corrected to 63% Fe content]. CAGR between 2004 and 2008 was 9.9%. International trade was reported at 882 Mt [exports], of which 805 Mt was seaborne. The market share of the three major producers CVRD, Rio Tinto and BHP Billiton was 68.5% of seaborne trade.
The three major producers have large expansion programmes under way which in aggregate are expected to add iron ore capacity of at least 350 Mt. There are many other projects at various stages of development in Brazil, Australia and elsewhere. UNCTAD has produced a list of iron ore projects around the world, the total potential capacity of which is 1.23 billion tpy.
The average grade of Chinese domestic iron ore production is below 30% Fe which compares with the average 62-64% Fe of imported ore. As demand has increased, average grade has decreased with incremental production in the range of 10-20% Fe. Production as mined in 2008 was 824 million tonnes, equivalent to 366 Mt at 63% Fe.
A key issue for the longer term therefore is the ability of the Chinese to sustain the current level of domestic iron ore capacity, let alone to keep on increasing it. Recent data would suggest that the growth in production has slowed or even peaked, although production data are not wholly reliable and not all information about new development projects is in the public domain. Price will clearly play a major role - whilst the economics of each mine is different, conventional wisdom appears to be that the critical price level appears to be about $80 per tonne - below which as much as 40% of China’s domestic production would become uneconomic - equivalent to more than 100 Mt of imported ore.
Indian iron ore production has grown enormously on the back of Chinese demand, reaching a reported 214 Mt in 2008. Chinese imports from India in 2008 were 91 Mt.

New Millennium Capital Corp. Section 15 – Project Schedule Technical Report – DSO Feasibility Study Page 110
April 2010 Amended as of February 16, 2011
Indian iron ore [as well as other “non-traditional” sources] has filled the gap created by the inability of “traditional” suppliers to meet the surge in Chinese demand, encouraged by the development of the spot market in China. The current level of Indian ore exports to China seems unsustainable in the longer term for a number of reasons, not the least of which is the planned growth in Indian steel production.
In summary, it would appear that, given the existing and potential expansion plans of the major producers and the various other projects in the pipeline, iron ore supply through to 2018 is likely to be sufficient to meet demand, although it is unlikely that there will be a significant over-supply - the major suppliers can be expected to manage their production and the speed of their expansions to maintain a sensible balance in the market.
Fines
The forecast demand for fines is shown in Table 20.22 and in the chart presented as Figure 20.9.
Table 20.22: Forecast Fines Demand (million tonnes) 2009 2010 2011 2012 2013 2014 2015 2016 2017 2018 Total Demand
1,004 1,058 1,111 1,147 1,180 1,207 1,236 1,265 1,296 1,328
Increase in Demand
-93 54 53 37 32 27 29 30 31 32
Cumulative Increase
-93 -39 14 51 83 110 139 169 200 232
On the face of it, it seems likely that this incremental demand could be satisfied largely from the existing expansion plans of the three major producers - which will when complete add up to 350 Mtpy supply to the market, of which at least 65% will be as fines. Add to this other brownfield expansion projects in Australia [FMG], Brazil [CSN/Casa de Pedra/Namisa, Anglo American] and elsewhere and an additional 232 Mtpy by 2018 does not seem overly challenging. Then there are numerous greenfield projects in Australia, Brazil and West Africa at various stages of development, many of them being actively encouraged by the Chinese in order to provide diversification to the big three.

New Millennium Capital Corp. Section 15 – Project Schedule Technical Report – DSO Feasibility Study Page 111
April 2010 Amended as of February 16, 2011
Figure 20.9: Fines Demand Forecast (million tonnes)
The production of Chinese ore will be an important “swing” factor in the supply - demand balance for fines - much Chinese capacity is high cost and will be taken out of operation if prices are too low.
20.9.3 Iron ore price development
In 2009 the “big three” producers established their benchmark prices that resulted in falls of 32.9% for fines [Rio Tinto - Asia], 44.4% for lump [Rio Tinto - Asia] and 48.3% for pellets [Vale - Europe]. Vale achieved a somewhat lower [28.2%] reduction for its fines, thus clawing back the freight premium established by the Australians in 2008.

New Millennium Capital Corp. Section 15 – Project Schedule Technical Report – DSO Feasibility Study Page 112
April 2010 Amended as of February 16, 2011
20.9.4 Long–term Price Projection
In addition to obtaining the above-referenced Memorandum from an independent consultant, NML also made use of long-term price forecasts developed by Jennings Capital of Toronto, Ontario, Barclays Capital, BMO Capital Markets, and CIBC World Markets.
With the worsening of a worldwide credit crisis during the second half of 2008, global steel production started to decelerate rapidly in the industrialized countries. Capacity utilization dropped to 50% in the US and EU as the credit market froze. As a result, for the first time since 1999, crude steel production was lower than in the year before, with production in 2008 being 1.2% lower than that in 2007. Only China, India and some Asian countries had a positive growth. The economic crisis has been termed as the worst since the depression of the Thirties, and there were fears about a prolonged contraction of growth worldwide as the major economies went into a deep recession.
Against this background, the world’s 20 major economies (the “G20”) met and agreed to inject an unprecedented amount of funds into the system to revive world economy and avert a total collapse. Much of the resultant spending went into infrastructure construction and to stimulate automotive production, and increased activity in both of these sectors had a positive impact on the demand for steel. Given the sizes of their economies and the depth of the downturn, the additional spending has slowed the rate of contraction in industrialized countries and recovery is now expected to begin during the second half of 2009. However, the economies of the two largest developing nations, China and India, have held up remarkably well. The continuation of growth in these two countries is credited to their internal demand, which has not been affected by the banking crisis faced by the industrialized nations. Only China and India are projected to have some growth in 2009, whilst, in spite of the projected improvement for the world economy, global crude steel production in 2009 is expected to be reduced by 10% or more.
The economic crisis is having a devastating impact on the demand for iron ore. The fall in crude steel production during the second half of 2008 reduced the demand for iron ore and major ore producers cut back their production to match the fall in demand. The spot price of delivered iron ore to China fell drastically from a record high of $200 (CIF) during March-April, 2008 to $65 in October 2008. In order to avert a sharp slowdown, in November 2008 China announced a huge stimulus package totalling some $586 billion, with funds earmarked to build highways, railways, ports, etc. Because of the weak demand, steelmakers were demanding from iron ore miners a 40-50% cut for the 2009 contract price. China’s announcement of the stimulus package provided a psychological boost to domestic steelmakers as they started to buy lower priced and higher quality imported ores, while many high cost domestic producers had to close their mines. According to some reports, marginal capacity in China could be as much as 200 million tonnes per year.
While the Chinese continued their record buying of imported ores in the early months of 2009, Japanese and Korean steelmakers accepted a 33% price reduction in May, 2009 from Rio and BHP. This was followed by a 28% price cut by Vale in June. Chinese steelmakers still insisted on a minimum price cut of 40%. At the same time, the spot

New Millennium Capital Corp. Section 15 – Project Schedule Technical Report – DSO Feasibility Study Page 113
April 2010 Amended as of February 16, 2011
price rose to a high of $115 in early August, 2009, which was 50% higher than the negotiated contract price.
In spite of the most severe downturn since the Great Depression, iron ore producers had resisted a much steeper cut, which had been projected by analysts. This was not only due to the strong bargaining power of the three big iron ore producers, but also because of the emergence of China as a dominating force capable of influencing seaborne iron ore prices. T
In December, 2009, iron ore cash price in the spot market were at a 45% premium over the 2009 benchmark price. The higher price was driven by the fact that many high cost Chinese mines were not viable at the low seaborne market price. As a result, the import to China increased rapidly, putting pressure on the supply sources. This was further underscored by the fact that Orissa State Government in India closed over 50 mines for illegal mining and unauthorized practices. Other State Governments considered similar actions. Based on the foregoing and changes in the market fundamentals, analysts raised their price forecasts for the next two years and also increased the long-term price outlook.
Based on forecasts by Ferrum Consultants, Jennings Capital, CIBC World and BMO Cap[ital Markets, the projected longer term prices assumed for the financial analysis in the Feasibility Study are as follows:
The long-term sinter fines (SF) price will be US¢ 100.0/dmtu, FOB Pointe Noire to Corus’s plants in Europe.
The super-fine (SSF) price will be 5% lower, or US¢ 95.0/dmtu.
20.10 Capital Cost Estimate
This Section covers the capital cost estimate for implementation of the ore mining, processing, transporting and ship loading facilities and infrastructure required for the Direct Shipping Ore (DSO) Project.
The following paragraphs outline the methodology used by NML and Met-Chem personnel for the estimation of the capital cost of the ore processing facilities and infrastructure. The resulting estimate is based on the application of standard methods required to achieve a Feasibility Study with an accuracy of ± 15%.
20.10.1 Scope of Estimate
The current estimate covers the costs associated with the construction of the ore processing facilities, namely the primary sizing station, the plant feed conveyor and its drive house, the Process Plant feed conveyor, the Process Plant, the secondary crusher, transfer conveyors, thickeners, the product storage and load-out facilities, the railcar loading station, and the tailings and process water reclaim pipelines.
The capital costs estimate also covers the following areas:
Mining, including mine development, mine facilities and services, and mining equipment;
Tailings disposal, including tailings delivery and process water reclaim systems;
The electricity generating station, its diesel generators and switchgear and associated substation;

New Millennium Capital Corp. Section 15 – Project Schedule Technical Report – DSO Feasibility Study Page 114
April 2010 Amended as of February 16, 2011
A 69 kV line to transmit electricity from the Schefferville substation to a substation to be installed at the Timmins Site
Infrastructure, including site development and roads, warehouse and maintenance buildings, other ancillary buildings and facilities, fresh water supply and camp accommodation;
Surface, service and emergency vehicles.
Modifications to the product storage and handling facilities at Pointe-Noire;
Extension and upgrade of the railway system from Ross Bay Junction to the Timmins site.
20.10.2 Basis of Estimate
Currency Base Date and Exchange Rate
The base date for the cost estimate is the fourth quarter of 2009. The estimate is expressed in Canadian dollars. No allowances for escalation or currency fluctuation are included.
The exchange rates used were 1.00 US$ = 1.11 Can$ when quotations were received in US dollars, 1.00 € = 1.58 Can$ for quotations in Euros and 1.00 Aus$ = 0.91 Can$ for quotations in Australian dollars.
Construction Labour Costs
The labour rate was established as an all-inclusive hourly rate by considering the basic hourly rates for tradesmen, foremen, and superintendents provided by qualified contractors for unionized workers. The contractors were selected based on their ability to work in the DSO project area and environment. The estimate is based on the assumption that labour rates are for a remote site.
The all-in labour rate includes the direct and indirect supervision, small tools and consumables, clothing and safety supplies, transportation between home base and the construction camp, contractor’s small tools, and site establishment facilities and contractor’s overhead and profit.
Calendar and Productivity
The construction working calendar was established as ten hours per day, seven days per week. The turnaround was established as four weeks in, two weeks out. In the present Study, the productivity loss factor was established at 1.04, which takes into account the fact that most of the work will be carried out inside the climate-controlled Dome.
Labour Availability
Labour and construction resources were surveyed among qualified contractors currently active in Newfoundland and Labrador. NML considers that trained and certified workers, as well as construction resources, will be available.
Freight, Duties and Taxes
Vendors were requested to provide a price for the delivery of equipment to Sept-Îles, ready for rail shipment to site by others. This freight cost was included as indicated by the suppliers, and an additional 3.2% of the cost of the equipment was added to cover

New Millennium Capital Corp. Section 15 – Project Schedule Technical Report – DSO Feasibility Study Page 115
April 2010 Amended as of February 16, 2011
the rail shipments. If no freight costs were provided with the quotes, a factor of 13.2% on the value of the goods was established to account for the freight from point of origin to site, based on recent surveys and studies.
All duties and taxes are excluded from the estimate.
Design allowances and contingencies
In an estimate, provisions are included for different areas to reflect the level of definition of the project. As such, design allowances and contingencies are two different, but essential elements of cost. Their inclusion ensures that the estimate covers all needs and requirements of the project scope.
The following definitions are taken from literature (AspenTech):
Design Allowances: Additional cost included in the estimates to cover the costs of known, but undefined, requirements for an individual activity or work item.
In the Study, design allowances were not included and this was compensated by a higher level of contingencies.
Contingency: A value added to an estimate to allow for unknown items. This may be derived either through statistical analysis of past project costs or by applying experience gained on similar projects. Contingency is not intended to cover changes in scope.
For the Feasibility Study, the contingency factor reflects the study team’s knowledge of the various aspects of the project and was applied to cover potential errors and omissions and possible unknowns. In the study, the overall factor was estimated to be 11.4% of the direct costs.
It is to be noted that contingency is an expense, and as such, is expected to be spent during the life of the project.
Civil and building works
Civil Work, Concrete Quantities and Unit Costs
Quantities for civil work, including site preparation, excavation and backfill, for concrete work including building foundations, slabs on grade, elevated slabs and equipment foundations, were calculated from site plans and from building layouts and elevation drawings. Unit prices were obtained from qualified contractors or from information from recent, similar projects.
Those unit prices were applied to material take-off quantities for the majority of the buildings and infrastructure.
Quantities for site roads were estimated from the site layout. Unit costs for road construction were established using information from recent similar projects.
An allowance was established for the upgrade of the existing access road.
Structural steel, Quantities and Unit Costs
The following quantities were calculated from layouts: structural steel including heavy and medium steel, building frame, secondary and light steel including steel deck, stairs with handrails, handrails and grating, building exteriors including insulated roofing and cladding, louvers, windows, man doors and truck doors, building interior finishing including block walls, offices and living quarters finishing, safety and security fencing and chemical resistant lining where appropriate.

New Millennium Capital Corp. Section 15 – Project Schedule Technical Report – DSO Feasibility Study Page 116
April 2010 Amended as of February 16, 2011
Budget unit prices were obtained from qualified contractors and applied to material take-off quantities.
Pre-engineered buildings
A budget price proposal was obtained for the camp accommodations including dormitory, kitchen and recreational facilities. The proposal includes delivery to site and installation.
A budget price proposal was obtained for the Emergency Vehicles Storage Building. The proposal includes delivery to site and installation.
A budget price including delivery to site and installation was also obtained for the office complex.
20.10.3 Equipment
Process Equipment
The process equipment list was derived from the flowsheets. Based on data sheets, data tables and technical descriptions, budget prices were obtained from qualified suppliers for more than 90% of the value of the process equipment. The remaining equipment was estimated from recent database information for similar projects.
Equipment installation man-hours were estimated from a recently updated in-house database for similar projects. A construction allowance to cover the cost of construction material, sub-contracts and mobile cranes for installation was established at 2% of the equipment cost, based on recent information for similar projects.
Piping and Pipelines
Process piping costs include supply and installation of pipes, slip-on flanges and back-up rings, fittings and manual valves and freight to site. Unit costs for HDPE pipelines and fittings were provided by a qualified supplier. Updated unit prices from in-house databases were used for the remaining items. The labour hourly rate and productivity factor were used to estimate installation costs.
Quantities for large bore process and water piping were calculated by take-off from flowsheets and layouts. Quantities for service piping and small bore lines were factorized. The percentage of total equipment direct cost was also taken into consideration to estimate the overall piping cost. Installation man-hours were estimated from in-house databases. The cost includes supply and installation of piping, flanges and couplings, fittings and valves, secondary steel, supports and freight.
Pipelines were estimated as HDPE pipes supplied in fusion-welded 50 foot lengths, with bolted flanges provided every 200 feet, and flanged connections for valves, instruments and other equipment.
Quantities for the tailings pipeline and the fresh water and reclaim water lines were calculated from layouts. Installation and bolt-up man hours were estimated from in-house databases.
An allowance was included for service pipelines and sanitary waste water pipeline cost.

New Millennium Capital Corp. Section 15 – Project Schedule Technical Report – DSO Feasibility Study Page 117
April 2010 Amended as of February 16, 2011
Electrical and Instrumentation Equipment and Material
The electrical equipment and material list was derived from single line diagrams and the mechanical equipment list. Quotations were received for most of the major equipment and electrical material was estimated based on databases for recent similar projects.
Quantity take-offs for instrumentation and the plant communications system were made from flowsheets and mechanical layouts.
Installation labour hours were established from in-house databases for similar projects, adjusted for hourly labour rates and productivity factors specific to the DSO project.
Budget prices for equipment, instruments and materials were obtained from qualified potential suppliers or from databases or recent similar projects.
For the diesel-fired generators, data sheets were prepared and issued to bidders based on a complete installation package, including skid-mounted generating sets, fuel distribution system, synchronization and control system, diesel day tank, sound-proofing and heat recovery equipment. Suppliers were requested to provide an optimum system in terms of capital and operating costs.
For the major items in the Timmins Site substation, the electrical list and single line diagrams were used to obtain budget quotations from qualified potential suppliers.
For the transmission line from Schefferville to the Timmins Site, budget installation costs were provided by qualified bidders that are familiar with the area, its climate and the requirements of the NL authorities.
For the Timmins Site electricity distribution system, line quantities were calculated from the Site layout and unit prices for poles were obtained from the quotations of qualified potential suppliers
Auxiliary Facilities and Services
Mobile Equipment
Budget prices for mobile equipment were either established from in-house databases for recent similar projects or based on quotations from qualified potential suppliers.
Fire protection
The fire protection requirements were developed by a qualified supplier based on mechanical equipment and site layouts. The fire protection costs include the fire loop, hydrants, sprinkler systems, specialized local fire protection required for electrical rooms and hydraulic units and 200-foot fire hose reels. In addition to the ore processing facilities, the fire loop will also service facilities outside the Dome, including the Primary Sizing Station, the railcar loading station and the camp.
HVAC
An HVAC data table was developed to calculate the heating and process ventilation requirements by area and facility, based on local conditions. These requirements meet standard industrial needs as well as applicable codes and regulations. The HVAC costs include the heating and ventilation equipment, ducting, mechanical installation and freight.
The costs also include propane piping material, installation and freight as well as excavation work. Budget prices were obtained from a qualified supplier for the

New Millennium Capital Corp. Section 15 – Project Schedule Technical Report – DSO Feasibility Study Page 118
April 2010 Amended as of February 16, 2011
equipment, ducting and installation. In-house databases were used to estimate the costs of propane piping and excavation.
Shop Tooling and Storage
A data table was developed to define the tooling and storage equipment requirements by area and facility. Mechanical, piping and electrical tool kits were also identified to properly equip site service trucks and the truck servicing facilities. Budget prices were obtained from industrial catalogues or allowances were made based on in-house databases.
Office furniture and equipment
An allowance was included for each administration office, room and area to provide for interior finishing, furniture and equipment such as work desk and chairs, cabinets and bookshelves, as well as computer and office supplies.
Change Rooms Facilities
A budget price proposal was obtained for the provision of change rooms, including interior finishing, water heating, service piping and also equipment such as lockers and benches as well as restrooms.
20.10.4 Mining
Mine development
Mine development costs were estimated from quantities and unit costs developed in-house by NML specialists experienced in the type of mining to be adopted for the DSO project.
Mine equipment
It is intended that major mine equipment such as that listed hereafter will be purchased directly from manufacturers under the terms of lease/buy agreements to be negotiated.
135 tonne haul trucks ;
10 m³ bucket capacity Front End Loaders;
6.5m³ bucket capacity backhoe style excavator;
Graders (Cat 16M or equivalent);
Tracked dozers (D-8G or equivalent);
Rotary blast hole drills 9⅞”.
The production equipment costs were based on budget quotations from manufacturers/distributors and included transportation to Site and erection where applicable. It was assumed that the costs will be redeemed by monthly payments over ten years for the trucks and drills and as such, they are excluded from the estimate of initial capital expenditure but are taken into account, as a capital lease, in the financial evaluation. .
Mine Support Equipment
Budget prices, including delivery to site and, where appropriate, erection for mine support equipment such as fuel and service trucks, mobile cranes, pick-up trucks, mine

New Millennium Capital Corp. Section 15 – Project Schedule Technical Report – DSO Feasibility Study Page 119
April 2010 Amended as of February 16, 2011
dewatering pumps, radios and mobile light towers were obtained from qualified potential suppliers
Mine facilities and services
Budget prices for mine facilities and services, including mine dewatering, were established from Met-Chem databases for recent similar projects.
20.10.5 Off-site Installations and Facilities
Rail Network
Budget pricing for modifications to the rail network between Schefferville and Sept-Îles was obtained from qualified potential contractors, based on information provided by AECOM.
It was assumed that the costs of rolling stock that will be acquired in the same manner as mining equipment, will be redeemed by monthly payments over ten years for and as such, they are excluded from the estimate of initial capital expenditure but are taken into account, as a capital lease, in the financial evaluation. .
Port Facilities
The estimate of the cost of modifications to the WM Port Facilities at Pointe-Noire was based on unit rates and on work carried out by Génivar, adjusted to reflect revised scope and other cost reduction measures.
20.10.6 Indirect costs
Met-Chem compiled indirect costs for its scope of work and that of others, based on an implementation schedule developed in-house by NML
The various elements of indirect costs are addressed hereafter:
Project development costs
Those costs may include engineering studies to come such as further metallurgical studies, independent reviews, environmental and social impact studies, occupational hazard reviews and also the costs of permitting. Project development costs are shown as provided by the Owner.
Project implementation costs
Project implementation costs include EPCM and owner’s costs.
20.10.7 Summary of the Estimate
The capital cost estimate is summarized in Table 20.23
Table 20.23: Summary of Capital Cost Estimate
A DIRECT COSTS Phase-I :: Timmins $239,160 000 INFRASTRUCTURE $98,054,111

New Millennium Capital Corp. Section 15 – Project Schedule Technical Report – DSO Feasibility Study Page 120
April 2010 Amended as of February 16, 2011
MINING $5,982,430
CRUSHING, PROCESSING, ORE STORAGE $132,100 000
AUXILIARY SERVICES $3,024 000
A INDIRECT COSTS Timmins $95,907 000 PROJECT DEVELOPMENT $2,359 000
EPCM (of direct cost) (including FIFO) AND OWNER'S COSTS $60,883 000
CONTINGENCY $30,461 000 FINANCIAL COSTS $2,205 000
A TOTAL CAPITAL COST TIMMINS $335,067 000
B DIRECT COSTS Phase-II :: Goodwood $15,898 000 INFRASTRUCTURE $15,898 000
B INDIRECT COSTS Goodwood $7,721 000 PROJECT DEVELOPMENT $200 000
EPCM (of direct cost) (including FIFO) AND OWNER'S COSTS $5,373 000
CONTINGENCY $2,147 000
B TOTAL CAPITAL COST GOODWOOD $23,619 000
TOTAL PROJECT CAPITAL COST $358,685,760
New Millennium Capital Corp. Section 15 – Project Schedule Technical Report – DSO Feasibility Study Page 121
April 2010 Amended as of February 16, 2011
20.11 Operating Cost Estimate
20.11.1 Summary of Estimated Operating Costs
The estimated total operating cost for the mine, Process Plant, rail transportation and terminal operation and administration, averaged over the life of the Project, is Can$32.50 per tonne of dry product (Sinter Fines & Super Fines), which is in line with published costs for similar operations elsewhere. A summary of the estimated ROM, waste and product tonnages over the life of the mine are shown in the table below, along with a breakdown of the major components of the estimated operating cost in Canadian dollars per tonne.
Table 20.24: Summary of Production and Operating Costs
Production Tonnes (LOM) Dry Product (project life tonnes) 39,128,361 ROM (project life tonnes) 55,034,353 Waste (project life tonnes) 56,624,505
Operating Cost $ CAN / t Dry Product Mining & Processing 12.43 Logistics 17.10 Admin 2.96
Total 32.48
20.11.2 Operating Schedules
The labour force requirements were based on the assumptions that the mines, Process Plant and product stockyard will be in continuous operation, 24 hours per day, seven days per week, but maintenance and repair will generally be done on a day shift basis. Ship loading operations will be governed by the presence of ships.
At the mines and the Process Plant, a crew will work seven 12-hour shifts per week and will rotate on the basis of two weeks at work with two weeks off work, therefore requiring four complete crews for the mine and the sizing station and the Process Plant. Some clerical employees, engineers and technicians and various tradesmen in the workshops and in the Process Plant will work12-hour day shifts, seven days per week. The only overtime paid will be for the hours worked above the normal 40 hours per week averaged on an annual basis, and this overtime will be paid at the rate of 1.5 times the base rate.
Maintenance
Mine operating costs are developed on the basis of the mining equipment list with the required operating hours to achieve production. Mechanical parts, components and replacement parts that require regular maintenance include: drill bits and drill steels, bucket teeth, teeth adaptors and wear plates, tires or undercarriage components, as well as required greases and lubricants.
Hourly estimates for repair costs and parts were developed in collaboration with major equipment suppliers. Machine operating hours were obtained through fleet sizing

New Millennium Capital Corp. Section 15 – Project Schedule Technical Report – DSO Feasibility Study Page 122
April 2010 Amended as of February 16, 2011
calculations which were based on the appropriate mechanical availability and utilization factors for the various machines
Explosive
The cost of mining includes, as a separate item, the cost of blasting. The cost estimate is based on the assumptions that slurry emulsion explosive will be manufactured on site and pumped directly into blast holes from explosives loading trucks. The manufacture and preparation of explosives, as well as the down-the-hole service, will be carried out by the explosives supplier. Assuming below normal rock hardness and based on experience from previous operators of the Schefferville area it is assumed that 0.20kg of explosive may be required per tonne of ore and 0.18kg per tonne of waste blasted. This will be achieved by using a pattern of 8.5m × 7.5m in ore and 9m × 8m in waste rock on a 12m bench and 1.5m sub-drilling. The holes will be filled up to a collar height of 6m. Crushed rock will be used for stemming purpose. The unit cost of blasting, including the down-the-hole delivery of explosive, service and detonators, was estimated to be $0.526 per tonne of rock, or $0.73 per tonne of product. These costs have been included in the costs of mining ore and waste.

New Millennium Capital Corp. Section 15 – Project Schedule Technical Report – DSO Feasibility Study Page 123
April 2010 Amended as of February 16, 2011
20.11.3 Site Restoration and Mine Closure
The preliminary cost estimate of the rehabilitation and closure plan is based on the progressive re-vegetation of the waste dumps as the various mines are sequentially closed. The revegetation cost has been estimated to be $8.23 M and funds will be set aside on a yearly basis over the life of the DSO Project.
At the end of the life of each mine, a closure program will be implemented based on a detailed plan to be developed during the first two years of operation.
As stipulated in provincial regulations, a financial assurance is required as part of the rehabilitation and closure plan. A special trust fund will be established that will cover the costs of revegetation of waste rock piles and the dismantling of project installations, including buildings and equipment. It is assumed that a portion of those costs will be offset by the residual value of equipment to be sold at that time.
20.12 Financial Analyses
20.12.1 General
This Section describes the method of analysis, the basic assumptions made, and the findings of the analyses to evaluate the viability of the Direct Shipping Ore Project to produce and sell 4 million dry tonnes per year of iron ore (approximately 80% of it in the form of Sinter Fines and 20% as Super Fines) with an average Fe content of 64.5% and SiO2 plus Al2O3 below 4.5%.
The analyses were performed using estimates of capital and operating costs, an estimated construction schedule and an estimated production schedule, all as set out in preceding Sections of this report. The analyses were made on the basis of 100% equity financing with mining and railway equipment being leased.
All financial amounts were expressed in fourth quarter 2009 Canadian dollars. The exchange rates used were 1.00 US$ = 1.11 Can$, 1.00 € = 1.59 Can$ and 1.00 Aus$ = 0.91 Can$
The estimates and assumptions were fed into a financial model constructed on COMFAR III-Expert software, developed by UNIDO. The COMFAR software produced an Income and Cash Flow Statement, a Balance Sheet, and other financial schedules for the chosen financial structure, in this case 100% equity financing. The IRR was calculated according to the discounted cash flow methodology, and sensitivity analyses were undertaken.
From the results of the financial analysis, it was determined that the project economics benefitted significantly from the adoption of the following strategies:
Leasing the mining and railway equipment instead of buying,
Optimizing the Process Plant in regards to the use of water, and product recovery;
Optimizing the mining sequence in order to reduce mine operating costs,
This analysis has no provision for capital support to the Tshiuetin Railway rehabilitation program and assumes tariffs for railway and terminal operation based upon on-going rate negotiations with the providers of those services.

New Millennium Capital Corp. Section 15 – Project Schedule Technical Report – DSO Feasibility Study Page 124
April 2010 Amended as of February 16, 2011
20.12.2 Revenues
Details related to tonnages and sales for iron ore in direct shipping ore are given in Table 20.25. Following discussions between NML management and experts in the global iron ore market, it was decided that the FOB prices for this Feasibility Study would be based on projected long-term prices provided by Ferrum Consultants. Therefore, for sinter fine ore at 64.5% Fe, the average price used was Can$ 71.67 per tonne and for Super Fines ore at 64.5% the average price was Can$ 68.80 per tonne.
For the purpose of the financial analyses, no inflation was applied to those prices, which were assumed to be constant for the life of the Project.
There will be minimal revenue in year 1 which is also a construction year as the project will only produce 2.5% of its rated capacity towards the end of the year, based on production start up by mid-October. Estimated sales tonnages and revenues are shown in Table 20.25.
Table 20.25: Estimated Tonnages and Revenues by Year
Year 1 Typical year at full
capacity Super Fines Ore Tonnes 20,534 800,000
$ ‘000 1,394 55,040 Sinter Fines Ore Tonnes 82,138 3,200,000
$ ‘000 5,886 229,344 Total Revenue $ ‘000 7,285 284,384
20.12.3 Expenses
Operating expenses were generated on an annual basis but expressed in fourth quarter 2009 Canadian dollars. Expenses were developed on a year-by-year basis for the mines, to reflect the evolution and location of the pits, and as a yearly average for other sectors of the operation. The overall cost of production, averaged over the life of the Project, is Can$32.50 per dry tonne of product, which compares favourably with other operations world-wide. Mine operating costs are on par with those for North Shore operations as published in the AME Mineral Economics, and the processing costs are much lower than those of a concentrator because the DSO process is basically a washing process. However, rail transportation costs and terminal costs are a very important factor as they account for more than half of the total operating expenses.
20.12.4 Capital Expenditures
The initial capital cost of the Project was estimated to be approximately $335 million, including direct costs of $239 million and indirect costs of $96 million. An additional $23.6 million was estimated for the cost of the mining road to Goodwood and other minor mining development required for the start up of production in DSO Area 4 in year 2, as the run of mine material coming from Area 4 is scheduled to be processed at the Timmins Site.
Additional capital expenditures totalling $124.5 million will be required. This amount includes the above-referenced $23.6 million plus the capitalized component of the cost of leasing mining equipment and rolling stock, as well as the annual cost of mine rehabilitation. Interest components of leasing are included in the financial model cash flow.

New Millennium Capital Corp. Section 15 – Project Schedule Technical Report – DSO Feasibility Study Page 125
April 2010 Amended as of February 16, 2011
Initial working capital is not included in the initial capital cost estimate, but it is however provided for in the financial model. An initial estimated amount of $15 million for the first two years of production was established based on assumptions of accounts payable at 30 days, accounts receivable at 15 days, 25 days stock of finished products and 15 days of cash in hand.
20.12.5 Fiscal Considerations and Depreciation
Given the complexity of the taxation issue with regard to the various taxation levels and numerous allowances involved, a special computer program designed in-house for tax evaluation was used with the assistance of a taxation expert. The product of that program was then fed into COMFAR for the after-tax financial analysis.
The following fiscal conditions were assumed to apply for both scenarios:
For federal and Provincial corporate income tax:
Federal income tax rate of 15%;
Provincial Income tax rate of11.9% for Quebec and 14.0% for NL;
Accelerated depreciation of 25% per year up to 100% on Class 41A mining concentrator, pipeline, pellet plant and power supply assets;
Depreciation of 25% on the declining balance for Class 41B mining and port installation assets;
Canadian development expenditure depreciation on the basis of 30% per year;
Canadian exploration expenditure depreciation on the basis of 100%;
Mining duties.
For Provincial mining tax:
Mining tax rate of 12% for Quebec and 15% for NL;
Processing allowances, for Quebec, of 15% per year of the cost of processing assets, up to a maximum of 65% of the profit for the year and for NL, 8% without a limit;
Northern mine allowance for Quebec of 166.67% of the cost of processing assets, deductible in the first ten years of production;
Exploration and development expenditures deductible at 100%;
Depreciation up to 100% of capital expenditures.
Tax payments are shown in the financial model. The combined effects of depreciation and allowances result in tax holidays of about four years for corporate income tax, two years for the Quebec mining tax and only one year for NL mining tax. The impact of taxes on project profitability is demonstrated by the “After Tax IRR” shown in Table 20.26
20.12.6 Residual Value
The COMFAR program used for this financial evaluation automatically assumes a residual value equal to the non-depreciated value of the assets, plus the value of working capital prior to its elimination in the last months of the Project.

New Millennium Capital Corp. Section 15 – Project Schedule Technical Report – DSO Feasibility Study Page 126
April 2010 Amended as of February 16, 2011
20.12.7 Financing
The financial model was created to address the case where equity is assumed to be 100% of the Project capital cost. It is however assumed that any cash deficit in the operation period will be offset by a short term financing facility at a 5% interest rate.
20.12.8 Results
The results of financial analyses for each of the before and after tax cases are presented in Table 20.26. The results show that the Project generates sufficient funds to cover its own expense and has an attractive return on investment.
Table 20.26: Results of Financial Analyses Before taxes After taxes
Project IRR (%) 29.1 22.3
Payback (Years from production start-up) 3 4
20.12.9 Sensitivity
A sensitivity analysis was prepared by measuring the effect of variations of up to ± 20% in key parameters on the Project IRR for the case “Before corporate and provincial mining taxes”. The selected parameters were:
Revenue
Capital Expenditure
Annual Operating Costs
As shown in Table 20.27 and Figure 20.10, for the pre-tax case the viability of the Project is most sensitive to variations in Revenue, and least sensitive to variations in Annual Operating Costs. Sensitivity analyses were also carried out for the case “After corporate and provincial mining taxes” and are included in the financial model.

New Millennium Capital Corp. Section 15 – Project Schedule Technical Report – DSO Feasibility Study Page 127
April 2010 Amended as of February 16, 2011
Table 20.27: Sensitivity of Pre-Tax IRR to Variations in Key Parameters
Variation Sales revenue Increase in fixed
assets Operating costs
-20.00% 15.08 % 36.55 % 35.12 %
-16.00% 18.13 % 34.84 % 33.94 %
-12.00% 21.04 % 33.25 % 32.74 %
-8.00% 23.81 % 31.77 % 31.53 %
-4.00% 26.49 % 30.38 % 30.31 %
0.00% 29.07 % 29.07 % 29.07 %
4.00% 31.58 % 27.84 % 27.82 %
8.00% 34.01 % 26.68 % 26.55 %
12.00% 36.39 % 25.58 % 25.26 %
16.00% 38.71 % 24.54 % 23.95 %
20.00% 40.97 % 23.55 % 22.62 %

New Millennium Capital Corp. Technical Report – Feasibility of the DSO Project Page 128
April 2010 Amended as of February 16, 2011
Figure 20.10: Sensitivity of Pre-tax IRR to Variations in Key Parameters
New Millennium Capital Corp. Section 15 – Project Schedule Technical Report – DSO Feasibility Study Page 129
April 2010 Amended as of February 16, 2011
21.0 INTERPRETATION AND CONCLUSIONS
21.1 Interpretation
The DSO Project is a major project that will significantly add to Canada’s iron ore production capacity, as well as to world capacity. A Pre-feasibility Study of the DSO Project was completed in February, 2009, and it not only confirmed NML’s belief that the project is both technically feasible and financially viable but also demonstrated that the project would be capable of producing iron ore in a form and of a quality suitable to be a captive source of supply of raw material to feed the Corus steelmaking facilities owned by the Tata Group of India, the world’s sixth largest steel producer.
Of particular importance to the DSO Project is the announcement made by NML on October 1, 2008, that Tata Steel Global Minerals Holdings Pte. Ltd. (“Tata”) of Singapore, a member of the Tata Group, had become a strategic investor in NML by purchasing 19.9% of NML’s shares. Under the terms of the deal, after NML’s completion of this Feasibility Study for the DSO Project, Tata Steel will have an option for a 180 day period to acquire an 80% equity interest in the DSO Project. Upon exercising the option, Tata will pay 80% of NML’s costs incurred to the exercise date to advance the DSO Project. Tata will arrange funding for up to $300 million to earn its 80% share and will commit to take 100% of the DSO Project’s iron ore production for the life of the mining operation. Any excess in capital costs over $300 million will be funded 80% by Tata and 20% by NML.
Following an in-depth review of all aspects of the Feasibility Study, the interpretation of the Study is summarized as follows:
Resource estimation
The deposits that are the basis of the DSO project were explored and drilled in the past by IOCC, and historical drill hole data, geological maps and cross-sections that were in the public domain was recovered by NML. SGS Canada Inc. (“Geostat”) verified that this data was correctly computerized and found no significant errors. In some instances, new drill holes were drilled close to historical ones and twin hole comparisons were made. Geostat concluded that historical and modern holes compare favorably and that it was safe to use the historical holes in the mineral resource estimation. Only the Goodwood deposit has a significant number of historical drill holes.
Under the procedure adopted by NML, the principal assay laboratory selected sample pulps and directed them to a control laboratory without the intervention of NML. Geostat has examined the available QA/QC data and although it found very minor biases between the principal and control laboratories, it considers that the drill hole data is reliable enough to support a mineral resource estimation.
In making the resource calculation, a bulk density of 3.0 tonnes per cubic metre was used, as were the following cut-off grade parameters:
Fe ≥ 50%
Mn ≤ 3.5%
SiO2 ≤ 18%

New Millennium Capital Corp. Section 15 – Project Schedule Technical Report – DSO Feasibility Study Page 130
April 2010 Amended as of February 16, 2011
The density value is historical and no bulk density measurements were made in the recent exploration campaigns, but Geostat considers that such a value, even though not measured, is safe to be used as it is most probably conservative.
Reserve estimation
Resource block models, created by Geostat usingthe Geostat Software Library, were imported into MineSight® mining software to create three-dimensional mining block models, which contained the same blocks as the resource models, with additional parameters applied to assist in mine planning.
Engineered pits were designed for each deposit based on economic pit shells.
The economic pit limit for each deposit was determined using the EPIT module of the MineSight® mining software. The EPIT module uses the Lerch-Grossman 3D (“LG 3D”) pit optimization algorithm to develop the configuration of each open pit at the end of its economic life, based on the total of estimated Measured and Indicated resources and thereby obtain the optimum pit that will generate the maximum profit. The LG 3D algorithm is a true pit optimizer based on the graph theory in operations research and it operates on a net value calculation for all the ore blocks in the model. A number of parameters are input into the software to calculate the results, including mining, processing, transportation, handling and ship loading and administration costs, product sales price, and maximum pit slope angles. The software applies these parameters to the ore and waste blocks of the 3D block models to determine optimum pit shells.
Based on the economic pit shells, several pits were designed and engineered for each deposit and were compared on a net value basis, those with the highest values being selected to arrive at the mineable reserve, and it was estimated that mineable reserves for the ten deposits totalled 64.1 million tonnes of ore grading 59.8% Fe with an average waste to ore stripping ratio of 1.24 and an average resource recovery of 95.5%.
The basis and details of the mineral reserve estimate have been subject to an in-depth peer review by, amongst others experienced in the mining, processing, transportation and consumption of DSO-type ores. The consensus of the reviewers is that the mineral reserve estimate has been made in accordance with appropriate industry standards and best practices for a Feasibility Study of a mine development project and that the quality of the work undertaken by NML is such as to provide an accurate estimate of the mineable reserves available at this time.
Although only ten of the 22 deposits that comprise the DSO Property have been drilled, sampled and analyzed, the DSO Project as addressed in the Study has a Mineral Reserve base of 64.1 million tones, sufficient to sustain mining and processing at a commercial rate for the 10 years used as the basis for the financial analysis. It can therefore be assumed that the DSO Project can be expanded in the future to operate profitably for additional several years to come;
The extent of the bench and pilot plant scale test work carried out not only by laboratories but by manufacturers of appropriate processing equipment is such that the flowsheet developed from the results of such test work is well defined and will

New Millennium Capital Corp. Section 15 – Project Schedule Technical Report – DSO Feasibility Study Page 131
April 2010 Amended as of February 16, 2011
achieve the required processing of the DSO hematite ore into products meeting the specifications of potential customers and in particular those of Tata.
All environmental aspects of the Project have been addressed in detail and considerable progress has been made to get the approval of the necessary provincial and federal authorities. Subsequent to much field work and the completion of numerous baseline studies by specialists in various aspects of the environment local to the DSO Property, detailed Environmental Impact Studies (“EIS”) were submitted to the governments of Canada, Quebec and Newfoundland and Labrador in December, 2009, after Project Notices had been submitted. Throughout the development of the project, NML has maintained close contact with the relevant First Nation communities and has demonstrated its willingness to inform and, to the extent practical, involve those communities at all stages of the development of the Project through Impact and Benefit Agreements where possibly;
As for the management of tailings, so as to minimize the likelihood of any adverse effect upon the local environment, NML proposes to use the mined-out Timmins #2 pit, which investigation has shown to contain water but no fish, as both the tailings containment basin and the process water reservoir.
To the extent practical, NML will make use of infrastructure abandoned by IOCC and, in many of the previously disturbed areas, it is possible that NML will “right the wrongs” of the previous operator by landscaping and revegetation of old waste dumps
Given the terms of the deal with Tata, NML has not actively pursued other potential customers, but in that the quality of its products will meet Tata’s specifications, they are likely to meet the most stringent specifications of other steelmakers;
The long term sales prices used in the financial analysis are in line with those published by analysts specializing in the sea-borne trade of iron ore.
21.2 Conclusions
Enough NI 43-101 compliant resources have been established for a sustainable project having an acceptable mine life;
NML’s exploration work has demonstrated a close correlation between the historical resources and the recent resources defined by the NML drilling programs.
The extent and quality of detailed engineering work performed is more than adequate for a Feasibility Study of this type and level of accuracy.
The economics of the project appear to be robust and will absorb variances in parameters such as product price, capital costs and operating costs.
Pilot plant tests using representative bulk samples have established that the selected flowsheet, when processing a blended plant feed, will upgrade the ore to achieve a product grading, on average, Fe > 64.5% and SiO2 + Al2O3 < 4.5%.
Pilot plant test results have also established that the following iron recoveries can be achieved on a dry basis:
Blue ore 80% Yellow ore 75% Red ore 70%

New Millennium Capital Corp. Section 15 – Project Schedule Technical Report – DSO Feasibility Study Page 132
April 2010 Amended as of February 16, 2011
22.0 RECOMMENDATIONS
Although the overall opinion as to the extent and quality of the work done in preparing the Feasibility Study is favourable, there are a number of specific areas in which additional work is recommended.
Even though bulk density measurements were made for different ore types using “Sonic” drill core, additional measurements for ores from different ore bodies should be continued. Such measurements should include bulk density, dry density and moisture content.
Future exploration drilling to convert historical resources to NI-43-101 compliant reserves and resources should include the following: Area DSO 2: Star Creek 2 was not drilled by NML. This deposit has to be drilled
to classify the historical resources to the measured/indicated category in compliance with the requirements of NI 43-101
Area DSO 3: Timmins 3N zone B and C were not drilled by NML. These two zones need to be drilled. Timmins 8 and Barney 2 are the two remaining deposits that need drilling to confirm the historical tonnages and grades.
Area DSO 4: The drilling done in deposits Kivivic 3N and 3S and Kivivic 5 was only exploratory. These two deposits require in-fill drilling to enable the quantity and grade of reserves to be fully evaluated. NML acquired deposits Kivivic 2 and Kivivic 1C in an Asset Exchange and the data from previous drilling are sporadic. The only information available is the historical resources and therefore these two deposits need to be drilled in two phases, the first of which will be exploratory.
The Goodwood deposit needs drilling at its southeastern boundary to define the potential extent of ore and waste on surface and at depth.
Before construction starts, additional geotechnical investigation has to be made at the proposed location of the Process Plant and other facilities.
Geotechnical work will need to be done in order to assess likely pit-wall stability. Hydrology investigation needs to be completed around the Timmins #1 and Timmins
# 2 pits to better understand the groundwater movement, and elsewhere to predict more precisely the amount of pit dewatering that will be required for the mining operation.
Further investigation of permafrost should be instigated in order to better define its location, depth and thickness.
Additional testing is required to better understand the freezing of ore in railcars and to be able to reduce the cost of product drying to confirm.
More precise definition of the mine equipment and rolling stock maintenance program is required, to be able to develop adequate training programs.
Truck simulations should be reviewed the size, make and model of truck and refined the required size of the fleet.
In order to maximize the use of resources, an investigation should be made to determine the optimum grade of plant feed that could be upgraded to meet the customer’s specifications.
Secondary haul roads need more definition and possible adjustments depending on the final truck selection, as referred to above.

New Millennium Capital Corp. Section 15 – Project Schedule Technical Report – DSO Feasibility Study Page 133
April 2010 Amended as of February 16, 2011
The rail and port tariffs need to be confirmed and binding agreements concluded with the various operators to confirm the accuracy of the operating cost of the results of the Financial Analysis as presented in the Feasibility Study Report

New Millennium Capital Corp. Section 15 – Project Schedule Technical Report – DSO Feasibility Study Page 134
April 2010 Amended as of February 16, 2011
23.0 CERTIFICATES
This Technical Report was prepared by the listed Qualified Persons, and delivered to NML on April 9, 2010 and amended on February 16, 2011.

New Millennium Capital Corp. Section 15 – Project Schedule Technical Report – DSO Feasibility Study Page 135
April 2010 Amended as of February 16, 2011
New Millennium Capital Corp. Section 15 – Project Schedule Technical Report – DSO Feasibility Study Page 136
April 2010 Amended as of February 16, 2011

New Millennium Capital Corp. Section 15 – Project Schedule Technical Report – DSO Feasibility Study Page 137
April 2010 Amended as of February 16, 2011

New Millennium Capital Corp. Section 15 – Project Schedule Technical Report – DSO Feasibility Study Page 138
April 2010 Amended as of February 16, 2011

New Millennium Capital Corp. Section 15 – Project Schedule Technical Report – DSO Feasibility Study Page 139
April 2010 Amended as of February 16, 2011

New Millennium Capital Corp. Section 15 – Project Schedule Technical Report – DSO Feasibility Study Page 140
April 2010 Amended as of February 16, 2011

New Millennium Capital Corp. Section 15 – Project Schedule Technical Report – DSO Feasibility Study Page 141
April 2010 Amended as of February 16, 2011

New Millennium Capital Corp. Section 15 – Project Schedule Technical Report – DSO Feasibility Study Page 142
April 2010 Amended as of February 16, 2011

New Millennium Capital Corp. Section 15 – Project Schedule Technical Report – DSO Feasibility Study Page 143
April 2010 Amended as of February 16, 2011
24.0 REFERENCES
Author Subject Date
Bokela Dewatering of different fractions from iron ore beneficiation for the New Millennium Project
October 2009
COREM
Project T1075 New Millennium Capital Corp. Characterization, Crushing and Screening of Bulk Samples
November 17, 2009
Project T1114 Feed size testing No date
Project T1114 Scrubber testing December 21, 2009
Ferrum consultants THE WORLD IRON ORE MARKET: supply-demand balance and price outlook
August, 2009
FLSMIDTH Dorr-Oliver Eimco GmbH
Vacuum Filtration and Sedimentation Test Work Report DV 0199/Section 3 For Messrs.New Millennium Capital Corporation for the DSO Project
October 15, 2009
Genivar Technical Memorandum Railway Infrastructure inspection July 27, 2009
MBE Coal & Minerals
Technology GmbH
New Milennium
Batac pilot plant tests October 12, 2009
Batch stratification test withBATAC Test work Schefferville Iron Ore deposit, Canada
November 2009
Midland Research Center
Report on Wash Testing of Two Direct Shipping Ores August 28, 2009
Mineral Processing Division, National Metallurgical Laboratory, Jamshedpur
Beneficiation of Iron Ore from Canada August, 2009
Outotec (USA) Inc Beneficiation of Iron Ore by Spiral, Floatex and SLon November 2, 2009
Outotec Test Report TH-0490 High Rate Thickening of WHIMS and SlimesTailings Sample
November 2009
Studiengesellschaft für Eisenerz-Aufbereitung
Investigation of Six (6) Direct Shipping Ores originating from deposits near Schefferville Quebec, Canada,
January, 2009
Report about Laboratory Testwork with Iron Ore Samples from Schefferville Direct Shipping Ores
May, 2009
Table of Results Area 3 Composite testing December 16, 2009
Table of Results Area 4 Composite testing on -1 mm December 4, 2009
Table of Results Area 4 Composite testing on -0.5 mm December 16, 2009
UMA doing business as
AECOM
Operations Analysis of Timmins Mine, Schefferville, Emeril and Pointe Noire – including Interchange at Ross Bay Junction and Arnaud Junction
December 8, 2008