new patterns of trade and investment in asia: … · preliminary draft new patterns of trade and...
TRANSCRIPT

Preliminary draft
New Patterns of Trade and Investment in Asia: Implications for Financial Integration
Prema-chandra Athukorala
Arndt Corden Division of Economics Research School of Pacific and Asian Studies
Australian National University
Draft paper for presentation to the conference on ‘Monetary and Financial Issues in Economic Integration in Asia’, organized by The School of Economics – University of Adelaide, the Centre for Regulation and Market Analysis – University of South Australia, and the Heinz School of Carnegie Mellon University – Adelaide, The South Australian Art Gallery, 4 August 2008.

1

2
New Patterns of Trade and Investment in Asia: Implications for Financial Integration
1 Introduction The purpose of this paper is to document and analyse the emerging patterns of
international trade and investment in Asia, with a view to informing the contemporary
debate on the process of regional financial integration. The paper aims to add new insight
into the sizeable existing literature on this subject in relation to two major areas. First, a
key theme of theme of the paper is the implications of global production sharing ——the
breakup of the production processes into geographically separated stages1 — for the
debate on regional versus global integration of these countries. Second, an attempt is
made to examine the emerging complementarities between trade and investment patterns,
an aspect which has so far remained virtually overlooked but is vital for understanding
the on-going process of economic integration in the region.
The financial crisis of 1997-1998 has sparked a new wave of interest in fostering
financial integration in Asia.2 There is a growing perception in policy circles in the region
that the crisis could have been better managed, and perhaps even prevented the severity
of the ‘Thai contagion’, if mechanisms and institutions for regional financial cooperation
had been developed to match the growth dynamism of the countries in the regions and the
increased interdependence among them achieved through global economic integration.
Most of the initiatives that have already been taken or are under consideration (such as
the Chiang Mai Initiative⎯a network of bilateral credit arrangements, the local-currency
bond market initiative of the Asian Development bank, and institutional arrangements for
information sharing, policy dialogue and economic surveillance), are in the domain of
‘loose’ financial cooperation, rather than that ofi systematic financial integration.
However, following the advent of the European Monetary Union (EMU) in 1999, there
1 In the recent literature on international trade an array of alternative terms have bee used to describe this phenomenon, including ‘international production fragmentation’, ‘vertical specialisation’, ‘slicing the value chain’ and ‘outsourcing’. 2 For surveys of the vast literature on this subject, see Kenen and Mead 2008, Chapter 6; Koroda and Kawai 2004; and Rajan 2002.

3
has been a greater deal of interest in the region in some forms of currency union⎯ an
arrangement in which the countries fix the exchange rate between their currencies
without altering the responsibilities or power of their countries’ central banks (Mundell
2002 and 2003, McKinnon 2005, Eichengreen 2006, Ogawa and Ito 2002, Williamson
2005).3
A common rational behind all these proposals for currency union is trade and
investment integration among the countries in the region, the degree of which is already
high by the standards of other regions, including the European Union. The key postulate
here, based on the theory of optimum currency area (OCA)4, is that, trade integration
increases the openness of the partner countries relative to each other and so possibly
strengthens, through synchronization of business cycle, the case for having fixed
exchange rates among them (or at least reduce the strength of the argument against fixed
exchange rates). Also, the high concentration of exports of almost all these countries in
manufactured goods is interpreted in the context of OCA theory to imply that they are
better placed, given the similarity of export baskets, to reap efficiency gains from a
currency peg, without facing high frictional cost.
The widely-held view that Asia has become increasingly integrated through trade
(and investment) and export bundles of these countries have become increasingly similar
over the years through the expansion of manufacturing exports is rooted in the ‘standard’
trade data analysis that based on the conventional notion of horizontal
specialization⎯that is, trade takes place in the form of final goods (goods that are
produced from start to finish in a given country. It has largely ignored the ongoing
process of global production sharing—the breakup of the production processes into
3 It is widely acknowledged that EMU-type full-fledged monetary union⎯the creation of a new multinational currency and transfer of responsibility for monetary policy to a new supranational institution⎯is not a viable option for Asia (or even a sub-set of countries in the region) in the absence of strong Asia-wide institutions and political commitment. 4 For an comprehensive survey of the related literature, see. Kenen 2002.

4
geographically separated stag5—and the resulting trade complementarities between the
two countries as dominant players of this new form of international exchange. Global
production sharing opens up opportunities for countries to specialize in different slices
(different tasks) of the production process depending on their relative cost advantage and other
relevant economic fundamentals. Consequently, parts and components are now exchanged
across borders at a faster rate than final goods. In this context, the decisions of how
much to produce and for which market have to be combined with decisions of whether to
produce and with what degree of intra-product specialisation. Consequently, trade flow
analysis based on data coming from a reporting system designed at a time when countries
were trading only in final goods naturally distorted values of exports and imports leading
to a falsification of the current account imbalances. The degree of falsification is likely to
increase over time as more complex production networks are created with an ever
increasing number of interacting countries (Jones and Kierzkowiski 2001a, 2001b). An
analysis based on the standard trade data also tends to overlook he link between emerging
patterns of trade and foreign direct investment, which is vital for assessing the
implications of exchange rate policy for the growth dynamism of countries whose
manufacturing performance in enmeshed in global production networks.
For the purpose of the study Asia is defined to encompass the economies of South
and East Asia. East Asia includes Japan, and developing East Asia (DEA), which covers
the newly industrialized economies (NIEs) in North Asia (South Korea, Taiwan and
Hong Kong), China and members of the Association of Southeast Asian Nations
(ASEAN). Developing Asia (DA) refers to South and East Asia except Japan. Hong
Kong and China are treated as one geographical entity, while reporting data separately for
the two economies for comparative purposes. This is justified not only because Hong
Kong was reverted back to Chinese sovereignty, but also because the two economies
have increasingly been closely interlinked through trade and investment following
China’s market oriented reform initiated in the late 1970s. To gain perspectives, the
Asian experience is examined in the wider global context.
5 In the recent literature on international trade, an array of alternative terms have bee used to describe this phenomenon, including ‘international production fragmentation’, ‘vertical specialisation’, ‘slicing the value chai’ and ‘outsourcing’.

5
The results suggest that, while global production sharing is now a global
phenomenon, it is far more important for economic growth and structural transformation
in Asian economies than elsewhere (although India and South Asia still remain minor
players in global production networks). The degree of dependence of the East Asian
economies on this new form of international specialisation is proportionately larger in
this region compared to North America and Europe. MNE from America, Europe and
Japan, and more recently MNEs from the East Asian NIEs have played a pivotal role in
linking the countries in the region to regional and global production networks. A highly
important recent development has been the rapid integration of China into regional
production networks as a major final assembler based on parts and components imported
from the rest of East Asia. These developments do not, however, mean lessening of the
regions dependence on the global economy. On the contrary, the region’s growth
dynamism based on vertical specialisation is deeply dependent on its extra regional trade
in final goods, and this dependence has, in fact, increased over the years. The on-going
process of production fragmentation has thus strengthen the case for a global, rather than
a regional, approach to trade and investment policy making in countries in the region.
Policy initiatives in the domain of financial (or trade) integration run the risk hindering
growth dynamism of these countries unless this new dimension of global integration is
not specifically taken into account.
The paper is set out as follows. Section 2 examines general patterns of trade since
1970, for Asia as a whole, for the major sub-regions, and by country. This examination
includes trade flows over time in aggregate, by major partners, and by major commodity
groups, paying particular attention to the phenomenon of ‘network trade’ based on global
production sharing. Central to the discussion in this section is the implications network
trade for the relative importance of intra-regional versus global economic integration.
Section 3 investigates investment patterns, focusing on the comparative performance of
Asian developing countries attracting and managing foreign direct investment (FDI), and
the FDI-trade nexus. The final section summarizes the key findings and draws out some
general inferences.

6
2 Trade Patterns The analysis of trade patterns is based on a dataset culled from the UN Comrade database
based on Rev. 3 of the Standard International Trade Classification (SITC). The time
coverage of the disaggregated trade flow analysis, which aims to probe the role of global
production sharing in shaping trade patterns, is from 1992 to 2006. The US data
reporting system permits systematic separation of parts and components from the
standard trade data for this period.6 Overall trade tends are however examined from a
historical perspective using data dating back to the early 1970s when export-led
industrialization began to change trade patterns in East Asian countries. Trade data are
tabulated using partner-country records, which are considered more appropriate
compared to the corresponding reporter records for analysing trade patterns for a number
of reasons (Ng and Yeats, 2003, Appendix 1; Feenstra et al., 2005). Partner-country
records are admittedly less susceptible to double counting and erroneous identification of
the source/destination country in the presence of entrepot trade compared to data based
on reporting country records (e.g., China’s trade through Hong Kong and Indonesia’s
through Singapore). Also, some countries fail to properly report goods shipped from their
own export processing zones. These exports are simply lump these exports into one
highly aggregated category of ‘special transactions’ under SITC 9. While no fully
satisfactory solutions exist for these problems, it is generally believed that data compiled
from importer records are less susceptible to recording errors and reveal the origins and
composition of trade more accurately since there normally are important legal penalties
for incorrectly specifying this information on customs declarations. Partner country
records also permit covering trade of countries which are not covered in the UN data
system. In order to achieve comparability across countries, data on oil and gas trade
(SITC 3) are excluded from the coverage of merchandise trade. Among the Asian
countries covered in this study, oil and gas account for a significant share of exports only
in Malaysia and Indonesia.7 In both countries there has been a dramatic shift in export
6 For details on this decomposition procedure, see Athukorala 2006. 7 The following statistics reveal this declining trend:
Share of oil and gas in merchandise exports (%)

7
composition of exports away from crude oil and non-oil primary products to
manufacturing. The date are in current US$ terms.
Trends
Table 1 summarises data on the relative trade performance of Asian countries in world
trade. The combined share of Asian countries in world non-oil exports recorded a three-
fold increase, from 11.1% to 33.4%, between 1969/70 and 2005/6 (Table 5).8 The region
accounted for over 40% of total increment in world exports over this period. East Asia
dominated this impressive export growth story, accounting for over 95% of the total
regional trade. Within East Asia, the combined world market share of ASEAN increased
persistently from 2.2% in 1969/70 to 6.3% in 2005/6, but these countries still account for
less than a fifth of total Asian trade. Notwithstanding notable export expansion in recent
years, South Asia still accounts for a mere 1.4% of total world trade, equivalent to less
than 5% of Asia’s total trade. Among the nine largest developing East Asian economies
(DEA) only Indonesia and the Philippines have smaller world trade shares than India, by
far the dominant South Asian economy. In 1969/70 China’s world export share (0.8%)
was at par with that of India, but was more than 10 times larger in 2005/6 (India: 1.1%,
China 12.3%)
In the 1970s and 1980s, Japan dominated the region’s trade, accounting for over
two-thirds of total exports and imports. The picture has changed dramatically over the
past two decades, as DEA’s share increased from 13.4% in 1989/90 to 25.1% in 2005/06.
The rise of China has been the dominant factor behind this structural shift, but the other 1969/70 1979/80 1989/90 2005/06
Indonesia 24.5 58.8 40.0 25.7
Malaysia 3.8 45.0 17.2 11.0
8 Hereafter, we will use the terms ‘total world exports/trade’ and ‘total world non-oil exports/trade’ interchangeably and to mean the same thing. Trade and investment magnitudes throughout the paper are measured in current US dollars unless otherwise indicated. Throughout the paper inter-temporal comparison calculations are made for the two-year averages relating to the end points of the period under study so as to reduce the impact of year-to-year fluctuations of trade flows.

8
countries in the region have also increased their world market shares. Thus, on first
inspection, there is no indication of China ‘crowding out’ its neighbours. We return to
this issue below. In the global context, Asia’s market share gains have come
predominantly at the expense of developed countries. The combined share of other
developing countries (that is, all developing countries less Asian developing countries)
has increased persistently, though of course at a slower rate than DEA.
Commodity Composition
Rapid export growth in Developing Asia (DA), mainly driven by the DEA group, has
been underpinned by a pronounced shift in export structure away from primary
commodities and toward manufactures (Tables 2). By 2005/06 manufactures accounted
for 92% of total exports from Asia, up from 78.3% three decades ago. Given the nature
of their resource endowments, Japan and the four Asian NIEs (Hong Kong, Taiwan,
Korea, and Singapore) relied very heavily on manufacturing for export expansion from
the very beginning. However, beginning in the 1970s, a notable shift towards
manufacturing is observable across all countries, at varying speeds and intensity.
Between 1979/80 and 2006/7 the share of manufacturing in total exports of developing
Asian countries increased from 63.0% to 92.0%. The shares of ASEAN and South Asia
respectively increased from 31.5% to 67.3% and 55.5% to 80.3% between these two time
points. Among individual countries Indonesia, Vietnam, and Pakistan (and of course the
very small late-comer Indo China economies) have a significantly lower share of
manufactures in their exports, reflecting both their comparative advantage and their later
adoption of export-oriented industrialization strategies.
Within manufacturing, machinery and transport equipment (SITC 7) (henceforth
referred to as ‘machinery’), in particular the three sub-categories of information and
communication technology products (ICT)9 therein, have played a pivotal role in this
structural shift. The share of Asia in world machinery exports increased from 11.9% in
9 Hereafter referred to as ICT, comprising the sum of office machinery (SITC 75), telecommunication and sound recording equipment (SITC 76), and electric machinery (SITC 77).

9
1989/90 to 41.3% in 2005/06, with DEA accounting for over four-fifths of the increment.
In 2005/6 ICT products accounted for almost 90% of total machinery exports from these
countries. In that year, over 60% of total world ICT exports originated from these
countries, up from about 30% in the early 1990s, and China alone accounted for nearly
forth of total world exports.
Asia’s share in world exports of the other main product categories has also
increased over time, though at a slower rate. Of particular interest here is the notable
increase in region’s share in miscellaneous manufacturing (SITC 8). This commodity
category mostly consists of standardized labour-intensive manufactured goods, in
particular clothing and footwear. China has accounted for much of this increase but, in
contrast to ICT exports, the geographic participation has been broader. A number of low-
wage countries in Southeast and South Asia, including Indonesia, Vietnam, India, Sri
Lanka, Bangladesh, and Cambodia (the latter included under ‘Other ASEAN countries’)
have all recorded impressive gains in market share.
Network Trade
The fast growth of ICT trade (and hence machinery trade) has been driven by the ongoing
process of global production sharing and the increasingly deep integration of East Asian
countries into the global production networks (Athukorala 2006, 2008a, 2008b). Linking
of Asia to the global electronics production networks began in 1968 with the arrival of
two US companies, National Semiconductors and Texas Instruments, to set up plants to
assemble semiconductor devices (Athukorala 2008a). By the beginning of the 1970s
Singapore had the lion’s share of offshore assembly activities of the US and European
semiconductor industries. Virtually every international electronics producer was present
in Singapore by the mid-1980s, when the hard disk drive assemblers entered the country
further boosting its role as a global assembly centre. During the next five years
semiconductor production declined in relative importance, and computer peripherals,
especially hard disk drives and computers became the more important part of the islands
electronic industry.
10
In the early 1980s, the MNEs with production facilities in Singapore began to
relocate some low-end assembly activities in neighbouring countries (particularly in
Malaysia, Thailand and the Philippines) in response to rapid growth of wages and land
prices. Many newcomer MNEs to the region also set up production bases in these
countries bypassing Singapore. By the late 1980s, this process had created a new
regional division of labour, based on skill differences involved in different stages of the
production process and relative wages, and improved communication and transport
infrastructure. There was a massive relocation of assembly activities by Japanese firms in
East Asia during this period in response to rapid appreciation of the yen against the major
currencies. This was followed, from about the early 1990s, by rapid relocation in China
of final assembly stages of ‘high-tech’ industries⎯in particular, communication and
information technology (CIT) industries from these countries and also from Japan, the
U.S. and other developed countries. Multinational firms which had already established
production bases in other countries in the region, particularly in Southeast Asia, began to
participate in the production networks in a big way as suppliers of parts and components
for final assembly activities in China. More recently, regional production networks have
begun to expand to Vietnam (Athukorala, 2007, 230-31). With the regional spread of
production networks, Singapore’s role in regional production networks has gradually
shifted from low-skill component assembly and testing to component design and
fabrication and providing headquarter services for production units located in the
neighbouring countries (Borrus et al. 2000; Mckendrik 2000).
There is no unique way to measure the intensity of production sharing in
manufacturing trade. However, for the purpose of time-profile analysis of the
phenomenon, the best available indicator is the share of parts and components in total
recorded trade in machinery and transport equipment (Ng and Yeats 2003, Athukorala
2006).10 Data on world market shares of machinery exports disaggregated into
components and finals goods (reported total exports – parts and components) and the
relative importance of components in total machinery exports are summarised in Table 3.
10 Henceforth, for the sake of brevity, we use the term ‘components’ in place of ‘parts and components’ and ‘machinery’ in place of ‘machinery and transport equipment’.
11
Asia’s share in world trade in parts and components (henceforth referred to as
‘components’) increased from 34% in 1989/90 to 40% in 2005/6. This resulted from an
increase in the share of developing East Asia from 16.5% to 28.1%, which more than
counterbalanced a sharp decline in the share of the one-time regional giant, Japan, from
17.8% to 11.3%. Within developing East Asia, all countries covered in our data
tabulations except Singapore have recorded increases in world market shares, with the
ASEAN countries exhibiting faster increases compared to the regional average. As
already noted, Singapore’s role in global production networks in high-tech industries
shows a palpable shift in the standard assembly and testing activities to product designing
and undertaking capital and technology intensive tasks in the production process, and
providing head-quarter services. Some, perhaps most, of these activities are not captured
in the data on merchandise trade. India remains a tiny participant in the global
production networks even though it has great potential to benefit from this new form of
international specialization, given the relatively low-cost and trainable labour, and its
location in a region that has become the growth centre of component production and
assembly in the world. In 2005/6 India accounted for a mere 0.3% of component exports
and 0.2% of final good exports in world machinery trade.
The growing importance of China in component trade is particularly noteworthy.
Between 1992/3 and 2005/6, the share of China in total world exports and imports of
component increased from 1.4% to 7.3%, and in total imports from 2.5% to 9.8%
respectively. A comparison of the data on the share of components in total exports and
imports points to an important difference between China and the other Developing East
Asian Countries. In China components accounts for a much larger share of imports
(60.4% in 2005/6) compared to that in exports (34.8%). In other East Asia countries the
percentage shares are broadly similar on the import and export side.
This new ‘China dimension’ of regional production networks in East Asia is
further illustrated by the data reported in Table 6. Compared to the increased intra-
regional dependence in component imports of China, geographic composition of its final
goods exports is characterised by a clear extra regional bias. In 2005/6, 62% of total final

12
product exports found market outside the East Asian region, up from 45% in 1992/3. The
share of final exports to East Asia declined from 55.0% to 38.0% between 1992/3 and
2004/6. Final goods exports to Southeast Asian countries accounted for around 5%
throughout this period, whereas the share of component imports from these countries
increased from less than 2% in 1992/3 to over 16.0 in 2005/06. These differences in the
geographic patterns of imports and exports reflects the increasingly important role played
by China as a final product assembler for advanced-country markets using components
procured from countries in the region, with Southeast Asian countries among them
playing an increasingly important role.
The continued attraction of East Asia as a location of global production sharing
seems to have been underpinned by a number of factors. First, despite rapid growth,
manufacturing wages in countries in the region except Singapore still remain lower than
or comparable to those in countries in the European periphery and Mexico (Athukorala
and Yamashita 2008). Moreover, significant differences in wages among the countries
within the East Asia region have provided the basis for rapid expansion of intra-regional
product sharing systems, giving rise to increased cross-border trade in parts and
components. Second, the relative factor cost advantage has been supplemented by
relatively more favourable trade and investment policy regimes, and better ports and
communication systems that facilitate trade by reducing the cost of maintaining ‘services
links’ (Carruthers et al. 2003). Third, as first-comers in this area of international
specialisation, countries in Southeast Asia (in particular Malaysia, Singapore and
Thailand) seem to offer considerable agglomeration advantages for companies that are
already located there. Site selection decisions of MNEs operating in assembly activities
are strongly influenced by the presence of other key market players in a given country or
neighbouring countries. Against the backdrop of a long period of successful operation in
the region, many MNEs (particularly US-based MNEs) have significantly upgraded
technical activities of their regional production networks in the region and assigned
global production responsibilities to affiliates located in Singapore and more recently also
to those located in Malaysia and Thailand (Borrus et al., 2000; McKendrick et al., 2000).
All in all, the Asian experience is consistent with the view that MNE affiliates have a

13
tendency to become increasingly embedded in host countries the longer they are present
there and the more conducive the overall investment climate of the host country becomes
over time. Finally, China’s emergence as the prime low-cost assembly centre of a wide
range of electrical and electronics products has boosted components production and
assembly activities in other countries in the region.
Direction of Trade
What have been the implications of these structural changes in the commodity
composition of trade for Asia’s geographic composition of trade? In particular, has the
relative importance of intra-regional and extra regional markets changed over time?
This section aims to address these and related issue which are of significant importance
for the debate on the relationship between trade and financial integration.
There is a vast literature on what may be termed ‘standard trade data analysis’,
that is, essentially based on the traditional notion of horizontal specialisation, in which
trade is an exchange of goods that are produced from start to finish in just one country.
This literature unequivocally points to a persistent increase in intra-regional trade in East
Asia, whether or not Japan is included or not, from about the early 1980s.11 However, the
discussion so far in this section on the emerging patterns of intra-regional component
trade casts doubts on the validity of these inferences. We have noted two important
peculiarities of trade patterns in East Asia resulting from its rapid integration into global
production networks. First, component trade has played a much more important role in
trade expansion in East Asia relative to the overall global experience and that of countries
in other major regions. Second, trade in components accounts for a much larger share in
intra-regional trade than it does in trade with the rest of the world. Given these two
peculiarities, trade flow analysis based on reported trade data is bound to yield a
misleading picture as to the relative importance of intra-regional trade relations (as
against global trade) for growth in Asia, particularly in East Asia. This is because growth
based on assembly activities depends on the demand for final goods, which in turn
depends increasingly on extra-regional growth.
11 See for example Drysdale and Garnaut 2001; Fujita 2008, Lee and Roland-Holst 1989.

14
Data on the geographic profile of trade of countries in East and south Asia
separately for total non-oil trade and trade in manufactures are presented in Appendix
Table A1. The data for manufacturing trade is further disaggregated into parts and
components and final trade (reported trade – parts and components) in order to probe the
implications of growing network trade for regional versus global integration of the
countries in the region. Intra-regional trade shares from this table for Asia and the sub
regions of interest to the current policy debate on financial integration, together with
comparative figures for NAFTA and EU, are summarised in Table 6.
The geographic profiles of total non-oil trade and that of manufacturing trade are
remarkably similar (Appendix Table A1, panels (a) and (b), Table 6). This is
understandable given the dominant role played by manufacturing in export expansion of
these countries during the period under study. The data affirms the ‘received’ view that
Asia, in Particular East Asia, has become increasingly integrated trough merchandise
trade. The share of intra-regional trade (import + export) in total trade of Asia amounted
to 51.4% in 1992/3. This increased to 57.7% in 2005/7, a level much higher than that of
NAFTA (44.5%) and slightly lower than that of EU-15 (64.4%). For developing Asia
(Asia-Japan) the increase between the two time points was from 39.6% to 47.3%. The
increase was the sharpest for ASEAN + 3, the sub-group of countries that has been the
focal point of recent discussions on forming a currency union in Asia⎯from 56.2% to
69.2%. (There are however notable differences in the degree of regional integration in
export and import trade in Asia and all regional subgroups of countries, with export trade
showing a much lesser degree of regional integration relatively that observed on the
import side. The significance of this asymmetry is discussed below.)
When manufacturing trade data are systematically decomposed into parts and
components and final goods, we clearly see a heavy ‘component bias’ in Asia’ intra-
regional trade. For instance, the intra-regional share of Asian component trade of was
70.8% in 2005/6 compared to the comparable figure of 58.3 for the region’s total
manufacturing trade (Table 6, Panels b and C). The difference is consistently vast across
he sub-groups of countries within the Asian region (except South Asia). Components
15
accounted for 40% of total intra-regional manufacturing trade in Asia in 2005/6, up from
24.7 in 1992/92 (Memo items, Table 6). Among the sub-groups of countries, the share of
components in intra-regional trade is distinctively large for ASEAN (51.7% in 2005/6).
These patterns are in sharp contrast to those in NAFTA and EU15 (as well as in overall
global trade). In both these geographical entities, the shares of intra-regional trade in total
manufacturing trade (both on export and import sides) and component trade imports are
broadly similar in magnitudes
Both the level of intra-regional trade in the two given years and the change over
time in intra-regional trade shares are significantly lower for estimates based on final
trade. The intra-regional share of Asia’s final manufacturing trade in increased
marginally from 50.2% to 52.% between 1992/3 and 2005/6 (compared to 54.9% to
70.8% in total manufacturing trade). The aggregate regional figure is significantly
influenced by the region’s continued heavy reliance on Japan for final imports. Extra-
regional trade accounts for the bulk of final manufacturing trade (over 60%) of
developing Asia. Interestingly, the estimated intra-regional trade shares for NAFTA, the
EU and the other regional groupings are remarkably resilient to the inclusion or exclusion
of component trade.
So far we have focused on intra-regional shares in total trade (imports+ exports)
as has been commonly done in previous studies of trade integration in Asia. Separate
estimates for import and export however point to a notable asymmetry in the degree of
regional trade integration. The differences are generally larger for final manufacturing
trade. For instance, intraregional trade accounted for only 48% of total Asian
manufacturing trade in 2005/6 compared to 73.4% in import trade. The comparable
figures for final manufacturing trade were 41% and 70.3% respectively. Clearly, the
dependence of Asia (and country sub-groups therein) on extra-regional markets (in
particular those in NAFTA and EU) for export-led growth is far grater than is revealed by
the standard intra-regional trade ratios commonly used in the debate of regional economic
integration, and this dependence has remained virtually unchanged for the last decade.
Unlike in EU and NAFTA, in East Asia the increase over time in intra-regional trade
16
ratio has emanated largely from rapid increase in intra-regional imports; intra-regional
exports expansion has lagged behind persistently.
3 Investment patterns Over the past three decades Asia, in particular developing East Asia, has been by far the
most favoured regional location for private capital flows to emerging market economies.
Net private capital flows to Asia increased from an annual average of less the US$2
billion in the latter half of 1980s to over US$100 billion by the mid-1990s.12 Following
an notable dip during the 1997-98 financial crisis, net inflows re-bounced to US$ 130 by
2005. The rapid increase in capital flows to the region has been accompanied by a
notable structural shift in the composition of total flows. For instance, official flows
(grants) were falling, sharply, from over a half of total net resource flows in the 1970s to
a mere 3% by 2005. At the same time, various forms of short-term capital flows (in
particular private bank lending and portfolio flows) have gained importance over the
years. FDI accounted for nearly two-thirds of total net inflows over the past two decades,
other than during a short period of about four years in the lead up to the 1997-98 (when
the share fell to about 55%, reflecting the build-up of short-term, volatile capital flows).
The available data on FDI are generally of poor quality compared to the trade
data. The only available time series data relates to only aggregate FDI inflows and out
flows. Even these data (readily available from the World Investment Report database of
the UNCTAD) suffers from a number of limitations.13 Not all countries record every
component of FDI flows. 14 For most countries, the data series on FDI capture only equity
12 Data reported in this section, unless otherwise stated, come from the standard IMF sources, in particular various issues of International Financial Statistics and World Economic Outlook. Unless otherwise stated, denomination in dollars refers to US dollars. 13 For details on the nature and limitations of the World Investment Report FDI data see UNCTAD 2005, Box 1.1 14 According to the standard definition, FDI consists of three components. These are: (a) equity capital, that is, the shares owned by the foreign direct investor (MNE) in its affiliates firms; (b) retained earnings, that is, the MNE’s share (in proportion to its direct equity participation) of earnings not distributed as dividends by affiliates, or earnings not remitted to the parent company (such retained profits are reinvested by affiliates); and (c) intra-company loans or intra-company debt transactions (except that for working capital) referred to as short- or long-term borrowing and lending of funds between the parent company and affiliated enterprises.

17
capital and inter-company debt; in fact, the majority of countries do not report data on the
third component. There is evidence that the component “retained earnings” in FDI is
positively related to the years of operation of firms in a given country, and that US MNEs
have a general tendency to rely more on retained earnings for investment expansion
compared to MNEs from other countries (Lipsey 2000). Thus, this problem of data
coverage can lead to a considerable underestimation of the actual magnitude of FDI in a
given host country, depending on the history of MNE involvement and the source country
profile of FDI. Even for the components for which data are available, the quality of data
varies considerably across countries. For instance, some countries (such as China and
Hong Kong) do not make an adequate distinction between portfolio investment and
foreign direct investment. For these reasons, a comparison of data among countries, and
even over time for a given country, should be made with caution. Moreover, the data
coverage tends to vary over time in a given country because of changes made to the data
recording system.15
Data on FDI inflows are summarised in Tables 7 and 8. Total FDI flows to
developing Asia increased sharply from an average annual level of $7 billion during
1980-04 to $200 billion in 2006. The share of Asia in total FDI flows to developing
countries increased from 29.6% to 52.6%) between these two time points. As a share of
total global flows, the increase was from 9.4% to 15.3% (Table 12). FDI inflows as a
share of gross domestic fixed capital (GDFCF) have been significantly higher than the
comparable figure for all developing countries throughout the period 1980-1996,
followed by a minor reversal in the pattern during the years of the Asian financial crisis,
1997-98. The average FDI/GDFCF ratio for developing Asia for the entire period 1970-
2006 was 9.2%, compared to 6.2% for all developing countries and a global average of
7.0%.
15 For instance, the Reserve Bank of India broadened the coverage of its FDI estimation procedure in 2003 (with effect from 2000/1 fiscal year) to include retained earnings. According to the revised data for 2000/1 and 2001/2, on average the new component accounted for about 40% of the total reported FDI figures (Reserve Bank of India).

18
A notable feature within developing Asia is the dramatic increase in inflows to
China. Over the past two decades China has been by far the largest developing country
recipient of inward FDI. China’s share in total FDI inflows to all developing and
transition economies increased from 11% during 1985-89 to 32% during 2000-04. For
the six years 2000-06, China has been the second largest recipient of foreign investment
in the world, at about $50 billion per annum and accounting for 7% of total gross inflows,
after the USA (which has received about $140 billion per annum, or 13% of total inflows)
(UNCTAD 2005). China’s share in inflows to Asian developing countries increased from
11.4% during 1980-84 to 48.5% during 2000-06, and it has accounted for well over half
of the total increment in FDI inflows to the region during this period.
Total FDI flows to the ASEAN countries increased sharply from an average
annual level of $3 billion in the second half of the 1980s to nearly $30 billion during the
six years before the onset of the recent financial crisis. Total FDI inflows to the region
declined persistently from about $35 billion per annum prior to 1997 to an annual average
of about $24 billion during 1997-79. However, the post-crisis experiences of individual
countries vary substantially. Indonesia experience negative FDI inflows until 2004,
contributing significantly to the decline in total flows to the region. When the three
atypical boom years prior to the onset of the crisis are excluded, owing to the abnormal
investor euphoria, there is no discernible break in the trend of FDI inflows to Singapore,
Thailand and the Philippines. Flows to the Philippines, the country least affected by the
crisis among this group, in fact continued to increase rapidly throughout. Net FDI flows
to Malaysia declined from $7.2 billion in 1996 to $6.0 billion in 1997, a 24% contraction,
and have remained virtually flat at that level from about mid-1998. This is contrast to a
significant increase in flows to Korea and Thailand. It could well be that the prolonged
period of policy and political uncertainty following the onset of the crisis, and widespread
market skepticism about the fate of Malaysia’s unorthodox reform package introduced in
September 1998, may have played a role. The two extreme cases of Indonesia
(continuous contraction until 2003) and the Philippine (continuous increase until its own
political woes in recent years) clearly suggest the post-crisis decline in FDI inflows to the
region was a temporary aberration associated with economic disruption and political

19
turbulence caused by the crisis. Moreover, there is also evidence that the decline in FDI
after the onset of the crisis was by and large limited to domestic market-oriented
investment, while FDI in export-oriented industries continued to increase throughout the
period, boosted by the now highly competitive exchange rates (Athukorala 2003).
It is also important to note that the continuation of the crisis-driven decline in FDI
inflows to these countries well beyond the period of recovery after the crisis (that is,
beyond 2000) was largely a reflection of a large overall decline in global FDI flows
during 2000-2003 (UNCTAD 2005), and a global downturn in electronics. Total global
FDI inflows declined from $134 billion in 2000 to $83 billion in 2001, $72 billion in
2002, and $63 billion 2003, before recovering marginally to $65 billion 2004.16 Total
inflows during the four years from 2001 to 2004 were 24% lower than the comparable
figure for the preceding four years, 1998-2000. Interestingly, FDI inflows to the crisis-
affected Asian countries (and to developing Asia in general) seemed to have been
remarkably resilient in the face of this massive global contraction.
The 1990s saw a marked increase in FDI to India, a trend that represents a clear
break from the preceding two decades. India’s share of FDI in total developing country
inflows increased from 0.4% in the 1980s to over 1.5% in the first two years of the new
millennium. FDI as a share of GDFCF increased from less than 0.3% to over 3%
between these time points.17 Nevertheless, the increase has to be seen in perspective.
Total annual FDI inflows to India during 2000-06 amounted to a mere 10% and 8%
respectively of those into China and ASEAN. A notable aspect of FDI flows to India is
that they have behaved quite independently of the global trends in FDI inflows to
developing countries. This pattern clearly suggests that the domestic investment climate
(demand-side factors in the investment market) has been the prime mover of investment
flows to the country. FDI inflows to Bangladesh, Pakistan and Sri Lanka have registered
16 There has yet to be a comprehensive explanation for this massive contraction in FDI flows, an unprecedented occurrence since 1970, when the Word Investment Report FDI series commenced. 17 The recorded increase in inflows in the past three years over the previous years partly reflects revisions to India’s FDI estimation procedures, as noted above (see footnote 5).

20
notable increases over the past two decades, but they still account for a tiny share of total
flows to developing countries, and are dwarfed by those into DEA.
Outward and Intra-regional (cross-border) FDI
There has been a significant increase in FDI flows from countries in the region over the
past three decades (Table 9). Japan emerged as a major overseas investor from the late
1960s, while for Korea, Singapore and Taiwan the outflows began to rise sharply from
around the mid 1980s. The share of DEA in total global outflows is still quite small,
although has been increasing rapidly, from just 0.3% in 1970-74 to over 6% in 2006.
These countries, however, feature much more prominently in developing country
outflows, accounting for 59% of the total in 2006, up from 41.0% in 1980-84.
Japan’s FDI in the 1980s was directed largely to North America and Europe,
when these two destinations accounted for about two thirds of the total (Kawai and Urata,
1989). But the East Asian share began to increase in the 1990s, with a sharp rise in
manufacturing FDI flows. The driving force was the sharp appreciation of Japanese yen
during 1992-95, which substantially reduced Japan’s international competitiveness. Since
the mid-1980s, the geographical distribution of Japanese FDI within Asia has changed
significantly, first from the NIEs to ASEAN, and then to China and other Asian
countries. By sector, until the mid-1980s, Japanese FDI in chemical products, and general
machinery and transport equipment was greater than that in electrical machinery.
However, since then the composition has began to switch towards electronics and
electrical machinery, accelerating in the 1990s as the large investments in China took
place. Over the past two decades, Korea, Taiwan and Singapore have sharply increased
FDI in the region.
As an outcome of its dramatic economic transformation over the past two
decades, China itself is now becoming a significant overseas investor, predominantly in
the other developing countries in the region and beyond (Chen and Lin 2007). Resource-
rich countries like Indonesia, Malaysia, Laos and Cambodia have begun to attract

21
‘resource seeking’ investors from China. There is also evidence that the rapid increase in
wages propelled by this fast growth has already begun to erode China’s attractiveness as
a low-wage investment and to entice Chinese firms involved in labour intensive
manufacturing (clothing and footwear in particular) to relocate production to lower wage
neighbours. For instance, Chinese investors are already the largest investors in the
Cambodian garment industry and they have also begun to enter Vietnam. The imposition
of punitive trade restrictions by the European Union and the USA on clothing and
footwear imports from China in the mid-2005 has also driven this process.
How important are these intra-regional flows compared to extra-regional inflows
to host countries in the region? To shed light on this issue, data on the source country
composition of FDI inflows to some Asian countries are summarised in Table 11. It is
evident that, notwithstanding recent increases in intra-regional flows, the bulk of FDI
inflows to Developing East Asian countries, other than to China, come from extra-
regional sources. However, there are significant differences among these countries in
terms of relative importance of individual source countries. For instance, investors from
the East Asian NIEs accounted for relatively large share of total investment in Lao PDR
and Vietnam. So were investors from the EU in Lao PDR, Brunei and Myanmar
(included under ‘other ASEAN). A striking feature of the recent source-country profile
of India compared to that of ASEAN in the relatively minor role played by investors from
Japan and the East Asian NIE. This mostly reflect the fact that, despite recent reforms,
the investment environment is still not conducive for efficiency seeking investment, an
area where Japanese and East Asian investors generally played a more prominent role at
the regional and global levels. Increase in the relative importance of investment by non-
resident Indian investors (captured in ‘other’ sources in Table 10) has been an important
feature of Indian investment approvals in recent years. China is unique for the
dominance of regional investors in total inflows of FDI. During 20001-05, 73% of total
FDI inflows to China originate in countries in East Asia, with Hong Kong and Taiwan
accounting for 40.5% and 6.9% respectively.18 These regional flows are related to shift
18 Part of the reported FDI from Hong Kong is ‘round tripping’ capital. That is, it is investment that originated from the Mainland and returned to it in the guise of ‘Hong Kong investment’ to take advantage
22
in production bases (mostly those involved in low-wage assembly activities to China).
Thus, FDI inflow patterns in China mirror the growing importance of that country as the
regional assembly center within regional production networks.
Industry profile
The past three decades have witnessed a profound shift, though at varying times, in the
relationship between MNEs and the host countries in the region, as more and more
countries have adopted an outward-oriented growth strategy. During the first two decades
of the postwar period, FDI in Taiwan and Korea was predominantly involved in
domestic-market oriented production. In both countries from about the mid-1960s there
was a major shift in the industry composition of FDI, from the early concentration on
import substitution toward export-oriented production. From about the late 1980s, FDI
has played an important role in the rapid world market penetration of exports from these
economies, particularly in automotive, consumer electronics and electrical goods. In
Singapore, from the beginning manufacturing FDI was predominantly in ‘efficiency
seeking’ (export oriented) production, mostly electronics. In other ASEAN countries,
there has been a major shift in MNE activities away from ‘market seeking’ (domestic-
market oriented production) and towards efficiency-seeking production, gradually from
the mid-1970s and at an accelerated pace in the 1990s. Old-style import-substituting FDI
behind tariff barriers is still found, but only in a few industries, such as automobiles and
petrochemicals, and even here significant liberalizations have occurred.
Efficiency-seeking FDI in Singapore, Malaysia and the Philippines has largely
concentrated in electronics. In Thailand in recent years there has been major FDI into
export-oriented electronics and automotive industries; for the latter industry, the country
has become the major hub for Southeast Asia. By contrast, in Indonesia efficiency-
seeking FDI has continued to remain confined largely to standard labour intensive
consumer goods production. Among the later-reforming countries in the region, in
of tax, tariff and other benefits accorded to foreign-invested firms. It may be that these flows constitute about 15% of Hong Kong investment in China (We 2000, Naughton 2006).

23
Vietnam, during the first decade of liberalization, FDI was heavily concentrated in
domestic-market-oriented capital-intensive industries and in construction and services
sectors. The period from about the late 1990s has seen a notable expansion of MNE
activity into labour-intensive consumer goods production, in particular clothing, footwear
and furniture. More recent years have seen some promising signs of MNE entry into
component assembly in the electronics and electrical goods industries (Athukorala and
Tran 2008). FIEs remain heavily concentrated in ICT industries (Sung 2007)19
FDI into China heavily concentrated from the beginning in export-oriented
industries, more so than in Vietnam and the other transition economies. As we show in
the next section, until about the mid 1990s virtually all of the industrial output of foreign-
invested enterprises (FIEs) was exported. Since then the share of domestic market sales in
total FIE output has gradually expanded in line with the relaxation of investment
approval procedures to permit production for the vast domestic market. The share of
FIEs in total exports from China has, however, expanded persistently from a mere 2% in
the early 1980 to nearly 60% by 2006 (Naughton 2006).
Among major Asian economies, India still remains an outlier in process of region-
wide process of increased FDI participation in export-oriented activities. In the case of
India, one-third of the FDI stock at independence in 1947 was in the primary sector
(plantations, mining and oil), one-quarter in manufacturing, and the rest in services,
mostly trade, construction, transportation and utilities (Athreye and Kapur, 2001, Table
3). From the 1960s, inflows tended to concentrate increasingly in manufacturing, while
there was also considerable divestment out of other sectors. Within manufacturing, the
19 On 28 February 2006, Intel Corporation, the world’s largest semiconductor producer, announced that it will invest $300 million (subsequently revised to 1 billion) to build a semiconductor testing and assembly plant (with an initial to absorb 1200 workers) in Ho Chi Ming City as part of its worldwide expansion of production capacity. Following Intel’s arrival, the Taiwanese-based Hon Hai Precision Industry Co., the world’s biggest electronics contract manufacturer announced in August 2007 its plan to set up a $5 billion plant in Vietnam (The Wall Street Journal, 213 30 August 2007, p. 1). The other major players in electronics industry which have already appeared in investment approval records of the Ministry of Planning and Investment include Foxconn, Compal and Nidec (The Wall Street Journal, 7 October 2007, p. 1).
24
capital goods sector (basic metal products, machinery and transport equipment) has
continued to remain the predominant recipient of FDI. Though India has an enormous
supply of low-wage, low-skill manpower that could be used to attract FDI into garments
and other simple assembly activities, the overall investment regime has continued to
favour foreign investment in heavy industry, complex activities predominantly focused
on the domestic market. There has not been any significant increase in India’ penetration
of world markets in industrial products in the 1990s despite the increase in FDI. The only
notable exception has been the phenomenal increase in software exports since the mid
1990s (Saxenian 2002).
Table 11 assembles a data set to examine the contribution of FDI to manufactured
exports from the four East Asian NIEs and eight developing Asian countries (China,
Indonesia, Malaysia, the Philippines, Vietnam, India Thailand and Sri Lanka). The role of
FDI is measured here in terms of the percentage share accounted for by MNE affiliates in
total manufactured exports (MNEXS) (Column 3). Export performance is measured in
terms of the share of each country in total world manufactured exports (world market
share, WMSH) (column 4). The final column contains summary observations on the
nature of the product composition of MNE-related exports in terms of the typology
developed in the previous section. The data on MNE share in exports reported here are
not strictly comparable. In particular, there is no uniform treatment of the ownership
share used in identifying the ‘multinationality’ of host country firms across the diverse
sources used in compiling the data. Estimation errors in individual country figures are
also unlikely to be consistent across countries, as obviously data quality varies.
Nevertheless, the estimates assembled here are the best available and, taken together,
they yield a number of important inferences.
There is clear evidence that the strong export performance of the latecomers to
export-led industrialization (second-tier exporting countries) in Asia. The data points to a
close positive correlation between the share of exports accounted for my MNE affiliates
and the share in total world manufacturing exports for China, Indonesia, Malaysia,
Thailand, the Philippines, and Vietnam. Clearly, the entry of MNEs has been export
25
creating in these countries. By contrast, in India, where MNE subsidiaries are still
predominantly of the old-fashioned ‘tariff-jumping’ variety, both the share of MNEs in
total manufactured exports and the rate of export growth have continued to remain low.
The widely held view that that MNE involvement in export expansion from the
NIEs (other than Singapore) is low by international standards generally remains valid in
our data set (Nayyar 1978). Nevertheless, there is evidence that MNEs have played a
qualitatively much more important role than that suggested by these figures. For
instance, many joint ventures in Korea, particularly those with minority ownership
(which constituted almost three-quarters of all investment) were initiated by Korean
entrepreneurs who approached potential foreign investors (Koo 1985). Detailed case-
studies of the export performance of Korea and Taiwan reveal the important role played
by MNEs in these countries, as they shifted from the early reliance on labour intensive,
standard consumer goods sectors to assembly activities in vertically integrated high-tech
industries, and subsequently to sophisticated consumer durables production (Hobday
1995; Amsden and Che 2003, Schieve and Tu 1991).
4 Concluding Remarks
Global production sharing has become an integral part of the economic landscape of East
Asia. Trade in parts and components have been expanding more rapidly than
conventional final-good trade. The degree of dependence on this new form of
international specialization is proportionately larger in East Asia compared North
America and Europe. A highly important recent development in international
fragmentation of production has been the rapid integration of China into the regional
production networks. China’s imports of components from countries in ASEAN and
other developing East Asia countries have grown rapidly, in line with rapid expansion of
manufacturing exports from China to extra-regional markets, mostly to North America
and the European Union.

26
The evidence harnessed in this paper supports the view that, in a context where
global production sharing is becoming the symbol of economic globalization, the
standard trade flow analysis leads to misleading inferences about the patterns and degee
of trade integration among nations. Booming trade in parts and components has resulted
in a rapid increase in intra-regional trade in East Asia, both including and excluding
Japan. This does not, however, mean that the process has contributed to lessening the
region’s dependence on the global economy. On the contrary, the region’s growth
dynamism based on vertical specialisation is deeply dependent on its extra-regional trade
in final goods, and this dependence has in fact increased over the years. Put simply,
increased participation in global production sharing has made the East Asia region
increasingly dependent on extra-regional trade for its growth dynamism. Policy
initiatives in the domain of financial (or trade) integration run the risk hindering growth
dynamism of these countries unless this new dimension of global integration is not
specifically taken into account.
Capital flows in the region are dominated by foreign direct investment that has
been increasingly concentrated in export-oriented production. The bulk of export-
oriented FDI is extra-regional. There is clear evidence of deep complementarities
between trade and FDI as reflected in a significant increase in the share of MNEs in
manufactured exports from developing countries since the mid 1970s. This, inurn, has
been the outcome of increased participation of counties in the region in global production
networks. Notwithstanding rapid expansion of regional banking networks and recent
develop regional bond markets, the degree of regional integration of capital and money
markets in Asia still remain low.
To be expanded.
27
References
Amsden, Alice H. and Wa-wen Chu (2003), Beyond Late Development: Taiwan’s Upgrading Policies, Cambridge, MA: MIT Press.
Athreye, Suma and Sandeep Kapur (2001), ‘Private Foreign Investment in India: Pain or Panacea?’, World Economy, 24(3), 399-424.
Athukorala, Prema-chandra (2003), ‘FDI in Crisis and Recovery: Lessons from the 1997-98 Asian Crisis’, Australian Economic History Review, 43(2), 197-213.
Athukorala, Prema-chandra (2006b), “Product Fragmentation and Trade Patterns in East Asia’, Asian Economic Papers, 4(3), 1-27.
Athukorala, Prema-chandra (2007), Multinational Enterprises in Asian Development. Cheltenham: Edward Elgar.
Athukorala, Prema-chandra (2008a) ‘Singapore and ASEAN in the New Regional Division of Labour’, Singapore Economic Review, Singapore Economic Review, 53(3)
Athukorala, Prema-chandra (2008b) ‘The Rise of China and East Asian Export Performance: Is the Crowding-out Fear Warranted?’, World Economy (forthcoming)
Athukorala, Prema-chandra and Tien Quang Tran (2008), ‘Foreign Direct Investment in Industrial Transition: The Experience of Vietnam’, Paper presented at the workshop on Emerging Trends and Patterns of Trade and Investment in Asia held in conjunction with the Ninth Global Development Network Conference, 1-2 January 2008, Brisbane, Australian.
Athukorala, Prema-chandra and Nobuaki Yamashita (2008), ‘Patterns and Determinants of Production Fragmentation in World Manufacturing Trade’, in Filippo di Mauro, Warwick McKibbin and Stephane Dees (eds.), Globalization, Regionalism and Economic Interdependence, Cambridge: Cambridge University Press, 45-72.
Bajpai, Nirupam and Jeffrey Sachs (2000), ‘Foreign Direct Investment in India: Issues and Problems’, Development Discussion Paper No. 759, Harvard Institution for International Development.
Borrus, M, D Earnst and S Haggard (2000), International Production Networks in Asia: Rivalry or Riches? London: Rutledge.
Buiter, Willem H. (1999), ‘The EMU and NAMU: What is the Case for North American Monetary Union?, Canadian Public Policy, 25, 285-305.
Carruthers, Robin, Jitendra N. Bajpai and David Hummels ( 2003 ), Trade and Logistics: An East Asian Perspective’, in Hathie Krumn and Homi Kraras (eds.), East Asia Integrates: A Trade Policy Agenda for Shares Growth, Washington DC: World Bank.
Chen, Edward K.Y. and Ping Lin (2007), ‘Emerging Transnational Corporations from East Asia: The Case of Mainland China’, in Juan J. Palacios (ed.), Multinational Corporations and the Emerging Network Economy in Asia and the Pacific, London: Routledge, 183-203.
Corden, Max W. (1972), ‘Monetary Integration’, Essays in International Finance No. 93, Princeton NJ: International Finance Section, Princeton University
Dobson, W and CS Yeu (1997). Multinationals and East Asian integration. Singapore: Institute of Southeast Asian Studies.
28
Drysdale, Peter and Ross Garnaut (1997), ‘The Pacific: An Application of a General Theory of Economic Integration’, in C. Fred Bergsten and Marcus Noland (eds), Pacific Dynamism and the International Economic System, Washington DC: Institute for International Economics, 183-224.
Eichengreen, Barry (2006), ‘The Parallel-Currency Approach to Asian Monetray Integration’ American Economic Review, 96(2), 432-436,
Feenstra, RC, RE Lipsey, H Deng, AC Ma and H Mo (2005). World Trade Flows, 1962-2000. National Bureau of Economic Research (NBER) Working Paper 11040, Cambridge, MA: NBER. (http:/www.nber.org/papers/w11040)
Freeman, NJ, and FL Bartels (eds.) (2004). The Future of Foreign Investment in Southeast Asia. London: Routledge.
Fujita, Masahisa (2008), ‘Promoting the Harmonious Integration in East Asia: From the Viewpoint of Spatial Economics’, paper presented at the symposium on Sustaining Development of Chinese Economy and East Asia, 12 January 2008, Nohon University, Tokyo
Honohan, Patrick and Philip R. Lane (2003), ‘Divergent Inflation Rates in EMU’, Economic Policy, 37, 359-394.
Jones, Ronals W. & HenrykKierzkowski (2001a), ‘A Framework for Fragmentation’, in Seven Arndt and Henryk Kierzkowski (eds.), Fragmentation: New Production Patterns in the World Economy, New York: Oxford University Press, 17-34..
Jones, Ronals W. & HenrykKierzkowski (2001b), ‘Globalization and the consequences of international fragmentation’, in R. Dornbusch, G. Calvo & M. Obstfeld (Eds.), Money, factor mobility and trade: the festschrift in honor of Robert A. Mundell, Cambridge, Mass.: MIT Press, 365-381.
Kenen, Peter B. (2002), ‘Currency Union and Policy Domains’, in D.A. Andrews, C.R. Henning and L.W.Pauly (eds.), Governing the World Money, Ithaca, NW: Cornell University Press, pp. 78-104.
Kenen, Peter B. and Ellen E. Meade (2008), Regional Monetary Integration, Cambridge: Cambridge University Press.
Koo, Bohn Young (1985), ‘The Role of Direct Foreign Investment in Korea’s Recent Economic Growth’, in Walter Galenson (ed.), Foreign Trade and Investment: Economic Development in the Newly Industrializing Asian Countries, Madison, Wis: University of Wisconsin Press, 176-216.
Koroda, Haruhiko and Masahiro Kawai (2004), ‘ Strengthening Regional Financial Cooperation in East Asia’, in De Brower, Gorden and Yunjoong Wang ( eds)(2004), Financial Governance in East Asia: Policy Dialogue, Surveillance and Cooperation, London: Routledge, 136- 166.
Lee, Hiro and David W. Roland-Holst (eds.) (1998), ‘Prelude to the Pacific Century: Overview of the Region, Leading Issues and Methodology’, in Lee, Hiro and David W. Roland-Holst (eds.), Economic Development and Cooperation in the Pacific Basin: Trade, Investment, Environmental Issues, Cambridge: Cambridge University Press, 3-34.
Lipsey, Robert E. (2000), ‘The Role of Foreign Direct Investment in International Capital Flows’ Feldstein, Martin (ed) (2000), International Capital Flows, Chicago: University of Chicago Press, 307-330..

29
McKendrick, David G., Richard F. Doner and Stephen Haggard (2000), From Silicon Valley to Singapore: Location and Competitive Advantage in the Hard Disk Drive Industry, Stanford, Cal: Stanford University Press.
McKinnon, Ronald I. (2005), ‘Exchange Rates under the East Asian Dollar Standard: Living with Conflicted Virtue, Cambridge, MA: MIT Press.
Mundell, Robert (2002), ‘Does Asia Need a Common Currency?”, Pacific Economic Review, 7, 3-12.
Mundell, Robert (2003), ‘Prospects for an Asian Currency Area’, Journal of Asian Economics, 14(1), 1-10.
Naughton, Barry (2007), The Chinese Economy: Transition and Growth, Cambridge, Mass: MIT Press.
Nayyar, Deepak. (1978), ‘Transnational Corporations and Manufactured Exports from Poor Countries’, Economic Journal, 88, 59-84.
Ng, Francis and Alexander Yeats (2003). Major trade trends in East Asia: what are their implications for regional cooperation and growth? Policy Research Working paper 3084. Washington DC: World Bank.
Ogawa, Eiji and Takayoshi Ito (2002), ‘On the Desirability of a Regional Basket Currency Arrangement’, Journal of the Japanese and International Economies, 16, 317-34.
Rajan, Ramkishan (2002), ‘Exchange Rate Policy Options for Southeast Asia: Is there a Case for Currency Baskets?’, World Economy, 25, 137-163.
Ryou, Jai-Won (1998), ‘Korea’s Outward Foreign Direct Investment and the Division of labor in the Asia Pacific’, in Lee, Hiro and David W. Roland-Holst (eds.), Economic Development and Cooperation in the Pacific Basin: Trade, Investment, Environmental Issues, Cambridge: Cambridge University Press
Saxenian, Annalee (2002), ‘Bangalore: The Silicon Valley of Asia?’, in Anne O Krueger (ed.), Economic Policy Reforms and the Indian Economy, Delhi and oxford: Oxford University Press, 169-193.
Schive, Chi and Jenn-Hwa Tu (1991), ‘Foreign firms and Structural Change in Taiwan’ in Eric D. Ramstetter (ed), Direct Foreign Investment in Asia’s Developing Economies and Structural Changes in the Asia-Pacific Region, Boulder: Col: Westview Press, 142-71.
Sung, Y (2007). Made in China: From World Sweatshop to a Global Manufacturing Centre? Asian Economic Papers (forthcoming).
UNCTAD (2005), World Investment Report 2005, Geneva: United Nations. Williamson, John (2005), ‘A Currency Basket for East Asia, Not Just for China’, Policy
Briefs in International Economics, Washington DC: Institute of International Economics.

30
Table 1: Asia in World Trade: Share and Composition (%) Share in world trade Country composition of Asian trade Exports 1969/70 1979/80 1989/90 2005/6 1969/70 1979/80 1989/90 2005/6 Asia 11.1 17.3 24.7 33.4 100.0 100.0 100.0 100.0 East Asia 11.0 16.5 23.8 32.0 98.9 95.0 96.4 95.7 Japan 6.3 8.6 10.4 6.8 56.8 49.7 42.3 20.4 Dev East Asia 4.7 7.9 13.4 25.1 42.1 45.4 54.2 75.3 China+ Hong Kong 1.7 2.1 4.6 12.9 15.1 12.2 18.5 38.8 China 0.8 1.0 2.9 12.3 7.0 5.9 11.7 36.8 HK 0.9 1.1 1.7 0.7 8.1 6.4 6.9 2.0 Korea 0.3 1.2 2.2 3.2 2.8 7.0 9.1 9.5 Taiwan 0.6 1.6 2.7 2.8 5.0 9.1 11.1 8.3 ASEAN 2.2 3.0 3.9 6.3 19.9 17.3 15.6 19.0 Indonesia 0.3 0.5 0.5 0.9 2.7 3.0 2.1 2.6 Malaysia 0.8 0.9 1.0 1.8 7.3 5.4 4.0 5.2 Philippines 0.5 0.5 0.3 0.7 4.8 2.8 1.4 2.1 Singapore 0.2 0.5 1.1 1.3 1.8 3.1 4.6 3.9 Thailand 0.3 0.5 0.8 1.3 2.7 2.7 3.2 3.9 Vietnam 0.0 0.0 0.0 0.3 0.0 0.0 0.1 0.9 South Asia 0.1 0.9 0.9 1.4 1.1 5.0 3.6 4.3 India 0.9 0.6 0.6 1.1 8.4 3.4 2.3 3.2 Sri Lanka 0.1 0.1 0.1 0.1 1.0 0.4 0.3 0.2 Bangladesh 0.0 0.0 0.1 0.1 0.0 0.3 0.2 0.4 Pakistan 0.2 0.1 0.2 0.1 1.8 0.9 0.7 0.4 Developing countries1, 3 10.0 8.7 7.5 13.9 Least developed countries3 1.9 0.9 0.5 0.4 Developed countries2,3 79.0 74.8 68.6 54.1 World 100.0 100.0 100.0 100.0 US$ billion 205 1093 2386 8932 (b) Imports Share in world trade (%) Country composition of Asian trade 1969/70 1979/80 1989/90 2005/6 1969/70 1979/80 1989/90 2005/6 Asia 12.8 13.6 20.5 23.9 100.0 100.0 100.0 100.0 East Asia 11.6 13.0 19.9 22.8 91.0 95.4 96.7 95.5 Japan 6.5 6.1 7.0 4.4 51.1 44.7 34.1 18.4 Developing East Asia 5.1 6.9 12.9 18.4 39.8 50.7 62.6 77.1 China + Hong Kong --- 2.7 5.4 10.7 --- 19.7 26.4 44.8 China --- 1.0 2.3 7.2 --- 7.3 11.1 30.4 HK 1.3 1.7 3.1 3.4 9.9 12.4 15.3 14.4 Korea 0.9 1.5 2.3 2.3 6.8 10.8 11.4 9.8 Taiwan 0.6 1.0 1.7 1.7 4.8 7.6 8.2 7.1 ASEAN 3.1 3.8 5.1 5.4 24.6 27.8 24.9 22.6 Indonesia 0.4 0.7 0.7 0.5 3.3 5.2 3.6 1.9 Malaysia 0.5 0.7 1.0 1.2 4.2 5.3 4.8 5.1 Philippines 0.5 0.4 0.4 0.5 4.2 3.2 1.7 2.1 Singapore 0.9 1.4 1.9 2.0 7.2 10.0 9.4 8.2 Thailand 0.5 0.5 1.1 1.1 4.3 3.8 5.3 4.5

31
Vietnam 0.0 0.1 0.0 0.3 0.0 0.4 0.1 1.3 South Asia 2.0 1.2 1.1 1.4 15.7 9.0 5.5 6.0 India 1.2 0.6 0.7 1.1 9.0 4.6 3.3 4.5 Sri Lanka 0.2 0.1 0.1 0.1 1.5 0.9 0.4 0.3 Bangladesh 0.0 0.1 0.1 0.0 0.0 1.1 0.6 0.2 Pakistan 0.7 0.3 0.2 0.2 5.1 2.5 1.2 1.0 Developing countries1, 3 11.4 16.4 8.7 16.6 Least developed countries3 1.1 0.7 0.2 0.3 Developed countries2,3 77.0 70.6 71.4 60.7 World 100 100 100 100 US$ billion 205 1093 2386 8932 Notes: 1 Excluding Asian developing countries. 2 Excluding Japan. 3 Based on the UN country classification. Source: Compiled from UN Comtrade database.

32
Table 2: Commodity Composition of Merchandise Exports4 (%) Primary products4 Manufacturing Country/country group Total Food and
beverages (SITC 0+1)
Minerals4 SITC 2+68)
Agri. Raw material SITC 4
Total Chemicals (SITC 5)
Resource-based products (SITC 6)
Machinery and
transport equipment5
(SITC7)
ICT products
Miscellaneous manufacturing6
SITC8
Clothing and
footwear (SITC
84 + 85) Asia 1979/80 20.4 8.3 10.7 1.4 78.3 4.0 22.3 36.5 15.1 17.6 3.4 2005/06 6.4 2.5 3.4 0.4 92.0 6.8 13.0 54.2 39.2 19.1 7.0 East Asia 1979/80 19.2 7.4 10.4 1.4 79.4 4.1 21.4 38.0 15.8 17.8 3.1 2005/06 5.8 2.3 3.1 0.4 92.5 6.6 12.2 56.2 40.8 18.7 6.4 Japan 1979/80 3.7 1.3 2.3 0.1 95.6 5.3 22.2 59.8 19.0 9.4 0.7 2005/06 2.7 0.4 2.3 0.0 95.5 8.7 11.1 67.4 27.6 9.3 0.1 Developing East Asia 1979/80 35.0 13.7 18.7 2.7 63.0 2.9 20.4 15.6 12.5 26.3 5.5 2005/06 6.7 2.8 3.3 0.6 91.9 6.1 12.4 53.2 44.3 20.0 8.2 China + Hong Kong 1979/80 21.0 12.6 8.1 0.3 76.7 4.1 21.5 10.2 8.0 41.6 5.9 2005/06 4.4 2.2 2.2 0.0 94.7 3.6 13.9 48.0 41.3 30.4 12.7 China 1979/80 39.4 23.8 15.1 0.5 60.1 7.8 29.8 3.5 1.2 20.1 2.0 2005/06 4.4 2.2 2.1 0.0 94.9 3.6 13.9 48.3 41.5 30.3 12.5 Hong Kong 1979/80 5.2 3.1 2.0 0.1 90.8 1.0 14.5 16.0 13.8 60.0 9.3 2005/06 3.2 0.8 2.4 0.0 91.8 4.0 14.2 42.4 37.9 31.9 14.9 Korea 1979/80 11.0 7.9 2.9 0.1 88.3 3.3 23.6 16.3 13.8 29.6 27.1 2005/06 3.6 0.9 2.7 0.0 95.2 9.9 13.7 64.1 42.3 9.0 1.0 Taiwan 1979/80 12.5 9.8 2.7 0.0 86.9 3.0 24.4 23.6 17.0 36.2 11.4 2005/06 3.5 0.9 2.7 0.0 94.9 8.9 14.2 60.0 50.8 0.0 0.1 ASEAN 1979/80 65.7 18.7 40.4 6.6 31.5 1.8 12.3 15.0 12.7 7.2 0.7 2005/06 14.2 5.8 6.2 2.2 83.4 8.0 8.2 55.2 48.5 13.1 6.2 Indonesia 1979/80 92.3 25.8 63.9 2.6 7.4 1.6 4.6 1.2 1.0 1.2 0.1 2005/06 34.1 7.9 19.8 6.4 62.7 6.0 18.0 24.5 19.7 17.6 10.5 Malaysia 1979/80 75.0 5.3 56.6 13.1 24.3 0.8 14.4 14.5 13.2 3.3 0.5 2005/06 10.1 2.0 4.1 4.0 88.4 5.1 6.4 69.7 66.3 8.0 2.2 Philippines 1979/80 65.5 24.6 31.0 9.9 32.9 1.2 8.4 10.6 9.7 14.3 1.6

33
2005/06 10.1 4.7 4.4 1.0 88.2 1.0 4.0 75.3 71.9 9.2 4.4 Singapore 1979/80 18.1 5.1 10.4 2.7 69.8 4.7 11.1 41.1 32.6 13.8 1.5 2005/06 3.0 1.5 1.3 0.2 93.2 19.3 3.6 63.3 55.2 7.3 0.3 Thailand 1979/80 72.5 45.8 26.6 0.0 27.1 1.3 22.5 6.1 5.3 6.5 0.3 2005/06 16.0 10.4 5.5 0.1 81.3 7.3 10.8 50.9 37.2 12.8 4.8 VietNam 1979/80 73.1 39.7 32.9 0.5 26.7 1.7 8.1 3.1 0.6 15.0 1.2 2005/06 25.2 21.5 3.8 0.0 74.1 1.8 7.8 13.3 9.3 51.4 37.6 Other ASEAN 1979/80 85.6 37.0 48.6 0.0 13.1 0.3 10.5 2.1 0.4 1.4 0.0 2005/06 31.9 13.3 18.5 0.0 66.5 0.2 6.6 1.2 0.5 62.5 60.6 South Asia 1979/80 43.2 26.0 16.3 0.9 55.5 2.0 40.1 6.0 0.1 12.8 9.4 2005/06 18.6 8.0 10.2 0.5 80.3 10.3 33.7 9.1 3.1 28.9 22.5 India 1979/80 41.6 24.8 15.9 1.0 57.7 2.6 40.0 8.1 0.0 14.6 11.4 2005/06 20.6 7.6 12.6 0.4 78.1 13.1 35.5 11.5 3.9 20.0 12.7 Sri Lanka 1979/80 70.5 51.7 15.9 2.9 26.9 0.6 11.5 0.8 0.4 14.1 13.7 2005/06 23.5 16.3 5.4 1.8 75.9 1.1 17.2 5.2 2.7 54.3 50.6 Bangladesh 1979/80 30.2 13.9 16.3 0.0 60.5 0.4 59.2 0.2 0.1 0.8 0.1 2005/06 6.3 4.9 1.4 0.0 93.4 1.4 8.4 0.9 0.3 82.7 82.0 Pakistan 1979/80 41.1 23.6 17.5 0.0 58.3 0.6 47.5 1.5 0.2 8.9 2.3 2005/06 12.6 9.2 3.4 0.0 86.5 2.5 52.1 1.1 0.3 31.9 26.0 Nepal 1979/80 60.4 22.8 35.5 2.0 38.3 5.4 28.2 1.2 0.3 3.5 0.0 2005/06 22.5 9.9 5.2 7.4 77.1 11.6 39.4 2.2 1.2 26.2 19.6 Developing 1979/80 65.8 40.0 24.5 1.3 30.7 4.5 22.0 10.2 4.0 8.0 1.3 countries1.3 2005/06 27.7 12.6 14.8 0.3 66.0 9.8 25.3 31.4 13.1 14.3 8.1 Developed countries2.3 1979/80 27.0 13.2 13.2 0.5 70.1 10.8 20.7 31.5 8.0 10.3 1.3 2005/06 15.0 7.9 6.8 0.3 81.1 16.8 15.3 40.8 12.7 10.7 1.5 World 1979/80 27.1 13.1 13.3 0.7 70.5 9.3 21.5 32.1 9.0 11.1 1.5 2005/06 14.0 6.7 6.8 0.4 82.1 12.5 15.6 42.9 21.1 13.4 4.0 Notes 1 Excluding Asian developing countries. 3 Based on the UN country classification 5. Including ICT products 2 Excluding Japan 4. Excluding oil and gas 6. Including clothing and footwear --- Data not available ICT Information and communication technology products (SITC 75+76+77) Source: Compiled from UN Comtrade database.

34
Table 3: World Trade in Machinery and Transport Equipment, 1992/3 and 2005/6 (%) Regional/country composition (%) Total trade Parts and
components Final goods
Share of parts and components in total trade (%)
1992/3 2005/6 1992/3 2005/6 1992/3 2005/6 1992/3 2005/6 (A) EXPORTS East Asia 34.5 37.5 34.3 39.7 34.6 35.8 40.9 46.9 Japan 19.1 11.4 17.8 11.3 19.9 11.5 38.5 43.9 Developing East Asia 15.4 26.1 16.5 28.4 14.7 24.2 43.9 48.2 Rep. of Korea 2.4 4.3 2.9 4.1 2.1 4.4 49.0 42.8 Taiwan 3.3 3.8 3.6 5.4 3.1 2.5 45.0 63.8 China 2.3 9.3 1.4 7.3 3.0 10.9 24.5 34.8 Hong Kong, SAR 1.0 0.7 1.4 1.0 0.8 0.5 55.6 60.4 AFTA 6.3 8.0 7.2 10.5 5.7 6.0 46.7 58.4 Indonesia 0.1 0.5 0.1 0.6 0.2 0.5 31.1 48.4 Malaysia 2.1 2.8 2.4 3.8 1.9 2.0 46.8 59.5 Philippines 0.4 1.2 0.7 2.0 0.2 0.6 73.7 73.5 Singapore 2.8 2.0 3.0 2.7 2.6 1.5 44.9 58.6 Thailand 0.9 1.3 1.0 1.4 0.9 1.3 43.0 45.7 Viet Nam 0.0 0.1 0.0 0.1 0.0 0.1 25.8 55.9 South Asia 0.1 0.2 0.1 0.3 0.1 0.2 49.5 53.0 Oceania 0.3 0.3 0.3 0.3 0.3 0.3 39.6 43.8 NAFTA 22.4 18.1 24.5 19.7 21.0 16.7 44.9 48.4 EU 15 35.3 35.4 32.5 31.1 37.3 38.9 37.9 38.9 World 100 100 100 100 100 100 41.1 44.3 US$ billion 1379 3110 567 1378 812 1732 (B ) IMPORTS 1989/90 2005/6 1989/90 2005/6 1989/90 2005/6 1989/90 2005/6 East Asia 24.7 26.3 27.5 36.6 22.7 18.2 45.8 61.6 Japan 3.4 3.7 3.5 4.2 3.3 3.3 42.0 49.9 Developing East Asia 21.3 22.6 24.0 32.4 19.3 14.8 46.5 63.5 Rep. of Korea 2.4 2.2 2.9 3.0 2.0 1.6 49.5 59.7 Taiwan 2.4 2.0 3.2 2.8 1.8 1.4 55.3 62.1 China 3.5 7.2 2.5 9.8 4.2 5.1 29.0 60.4 Hong Kong SAR 3.9 4.0 3.8 5.7 3.9 2.7 40.3 62.5 AFTA 9.2 7.2 11.7 11.2 7.4 4.0 52.6 68.8 Indonesia 0.9 0.3 1.0 0.3 0.9 0.3 43.5 44.7 Malaysia 2.2 1.8 3.1 3.0 1.5 0.8 58.7 75.0 Philippines 0.5 0.8 0.6 1.5 0.4 0.2 48.5 86.1 Singapore 3.7 2.9 5.0 4.6 2.8 1.6 55.1 69.4 Thailand 1.7 1.1 2.0 1.5 1.5 0.8 48.2 58.8 Viet Nam 0.1 0.2 0.1 0.2 0.2 0.3 20.8 38.3 South Asia 0.5 0.8 0.6 0.6 0.4 0.9 47.2 36.0 NAFTA 27.2 25.2 28.2 22.3 26.5 27.5 42.6 39.2 EU 15 33.7 35.4 33.1 32.0 34.2 38.2 40.4 40.0 World 100.0 100.0 100.0 100.0 100.0 100.0 41.1 44.3 US$ billion 1379 3110 567 1378 812 1732 Source: Compiled from UN Comtrade database
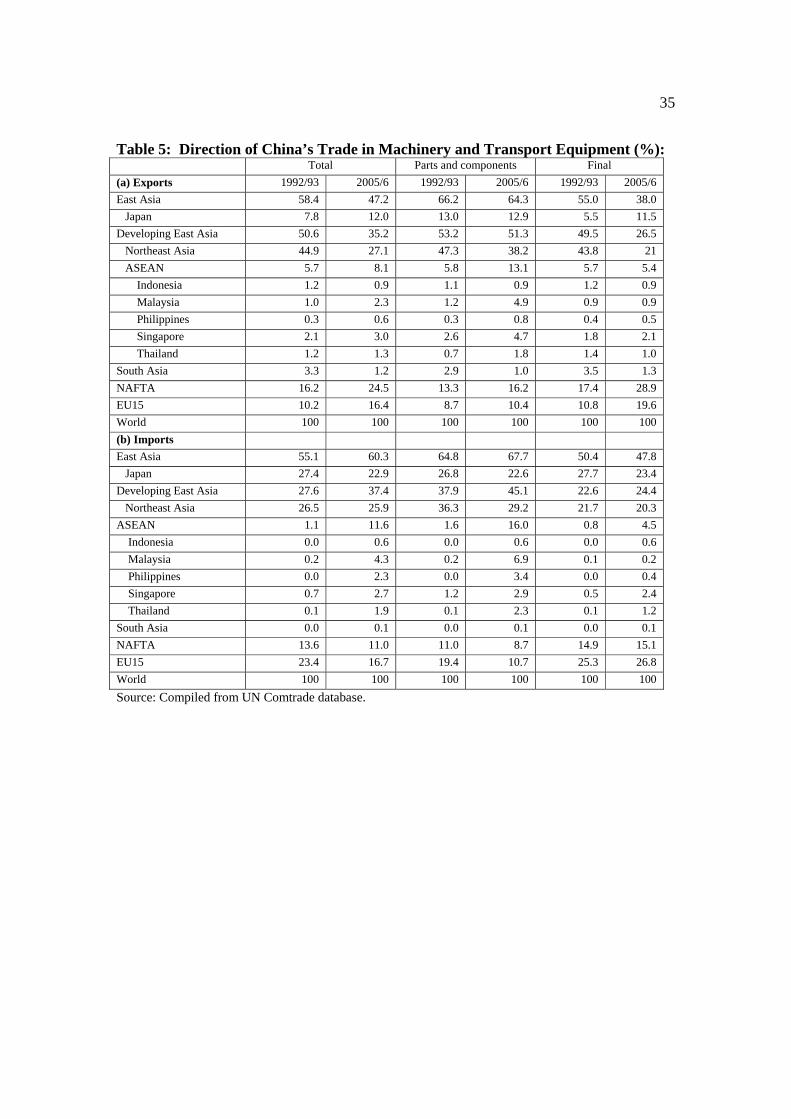
35
Table 5: Direction of China’s Trade in Machinery and Transport Equipment (%): Total Parts and components Final (a) Exports 1992/93 2005/6 1992/93 2005/6 1992/93 2005/6 East Asia 58.4 47.2 66.2 64.3 55.0 38.0 Japan 7.8 12.0 13.0 12.9 5.5 11.5 Developing East Asia 50.6 35.2 53.2 51.3 49.5 26.5 Northeast Asia 44.9 27.1 47.3 38.2 43.8 21 ASEAN 5.7 8.1 5.8 13.1 5.7 5.4 Indonesia 1.2 0.9 1.1 0.9 1.2 0.9 Malaysia 1.0 2.3 1.2 4.9 0.9 0.9 Philippines 0.3 0.6 0.3 0.8 0.4 0.5 Singapore 2.1 3.0 2.6 4.7 1.8 2.1 Thailand 1.2 1.3 0.7 1.8 1.4 1.0 South Asia 3.3 1.2 2.9 1.0 3.5 1.3 NAFTA 16.2 24.5 13.3 16.2 17.4 28.9 EU15 10.2 16.4 8.7 10.4 10.8 19.6 World 100 100 100 100 100 100 (b) Imports East Asia 55.1 60.3 64.8 67.7 50.4 47.8 Japan 27.4 22.9 26.8 22.6 27.7 23.4 Developing East Asia 27.6 37.4 37.9 45.1 22.6 24.4 Northeast Asia 26.5 25.9 36.3 29.2 21.7 20.3 ASEAN 1.1 11.6 1.6 16.0 0.8 4.5 Indonesia 0.0 0.6 0.0 0.6 0.0 0.6 Malaysia 0.2 4.3 0.2 6.9 0.1 0.2 Philippines 0.0 2.3 0.0 3.4 0.0 0.4 Singapore 0.7 2.7 1.2 2.9 0.5 2.4 Thailand 0.1 1.9 0.1 2.3 0.1 1.2 South Asia 0.0 0.1 0.0 0.1 0.0 0.1 NAFTA 13.6 11.0 11.0 8.7 14.9 15.1 EU15 23.4 16.7 19.4 10.7 25.3 26.8 World 100 100 100 100 100 100 Source: Compiled from UN Comtrade database.

36
Table 6: Intra-Regional Trade Shares: Total Manufacturing, Parts and Components, and Final Trade (%), 1992/93 and 2005/061
Asia Developing Asia1
Developing East Asia2
Northeast Asia3
ASEAN+34 ASEAN South Asia Oceania NAFTA EU15
(a) Total non-oil trade
Exports 1992/3 45.5 37.8 37.5 31.2 51.0 19.7 4.0 9.2 43.0 52.8 2005/6 49.5 40.5 39.5 30.1 61.7 19.0 2.5 9.1 50.4 63.2 Imports 1992/3 59.0 41.5 41.1 35.4 63.7 21.7 4.3 8.9 39.1 70.7 2005/6 69.0 56.1 55.3 45.0 81.3 28.6 4.6 8.0 40.2 65.5 Export + imports 1992/3 51.4 39.6 39.3 33.2 56.2 20.7 4.1 9.0 40.9 63.7 2005/6 57.7 47.3 46.3 36.4 69.2 23.4 3.6 8.5 44.5 64.4 (b) Total Manufacturing
Exports 1992/3 43.3 37.7 38.5 31.2 38.1 21.0 2.8 20.6 45.2 51.2 2005/6 48.3 40.0 39.6 29.9 42.7 19.4 1.6 20.1 51.1 61.4 Imports 1992/3 62.8 41.5 41.6 37.1 53.7 20.9 3.3 7.4 37.2 70.6 2005/6 73.4 58.6 58.5 48.8 62.3 28.5 3.5 6.5 38.8 65.1 Exports + imports 1992/3 51.3 39.6 40.1 33.9 43.9 21.0 3.1 10.5 40.8 62.9 2005/6 58.3 47.8 47.5 37.4 49.7 23.7 2.6 9.5 43.9 63.3 (c ) Parts and components
Exports 1992/3 48.4 46.7 46.5 31.4 40.0 30.7 6.1 12.5 46.7 50.2 2005/6 64.5 59.3 58.9 44.8 57.6 24.4 0.9 12.2 46.5 58.2 Imports 1992/3 63.0 37.2 37.7 29.3 62.0 23.6 1.1 6.6 44.5 68.0 2005/6 78.4 64.3 64.8 52.9 70.7 32.3 0.9 4.9 45.0 58.8
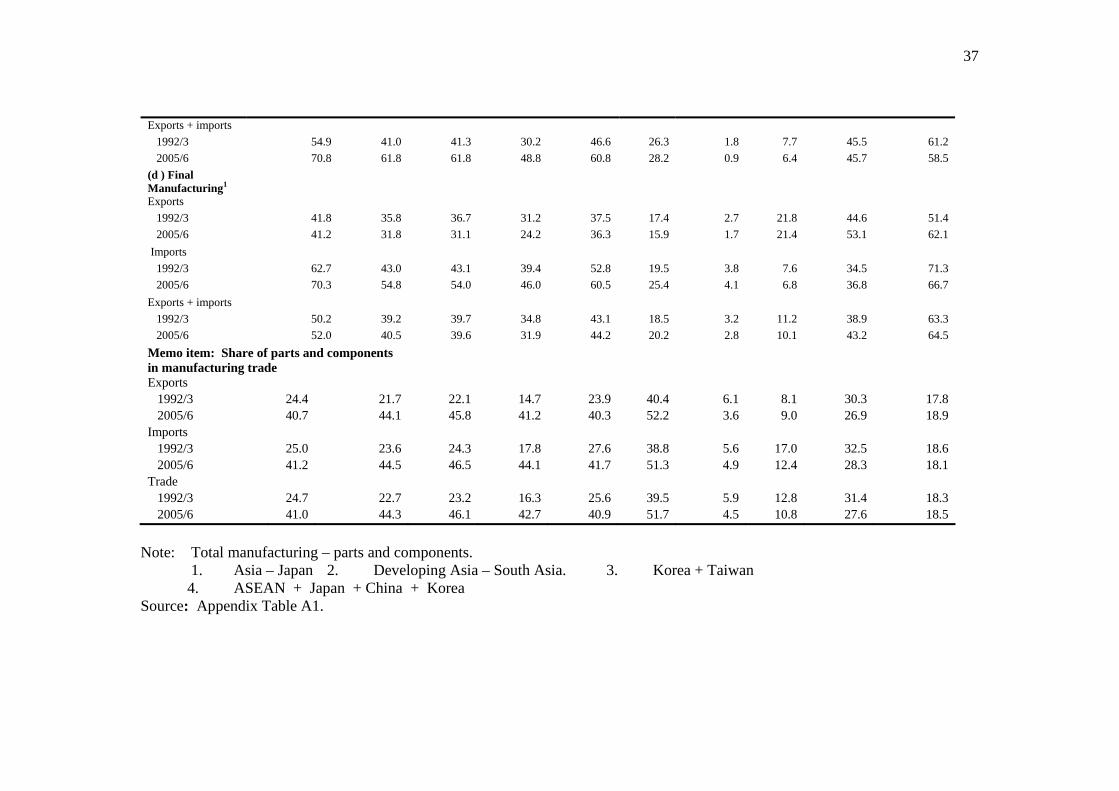
37
Exports + imports 1992/3 54.9 41.0 41.3 30.2 46.6 26.3 1.8 7.7 45.5 61.2 2005/6 70.8 61.8 61.8 48.8 60.8 28.2 0.9 6.4 45.7 58.5 (d ) Final Manufacturing1
Exports 1992/3 41.8 35.8 36.7 31.2 37.5 17.4 2.7 21.8 44.6 51.4 2005/6 41.2 31.8 31.1 24.2 36.3 15.9 1.7 21.4 53.1 62.1 Imports 1992/3 62.7 43.0 43.1 39.4 52.8 19.5 3.8 7.6 34.5 71.3 2005/6 70.3 54.8 54.0 46.0 60.5 25.4 4.1 6.8 36.8 66.7 Exports + imports 1992/3 50.2 39.2 39.7 34.8 43.1 18.5 3.2 11.2 38.9 63.3 2005/6 52.0 40.5 39.6 31.9 44.2 20.2 2.8 10.1 43.2 64.5 Memo item: Share of parts and components in manufacturing trade
Exports 1992/3 24.4 21.7 22.1 14.7 23.9 40.4 6.1 8.1 30.3 17.8 2005/6 40.7 44.1 45.8 41.2 40.3 52.2 3.6 9.0 26.9 18.9 Imports 1992/3 25.0 23.6 24.3 17.8 27.6 38.8 5.6 17.0 32.5 18.6 2005/6 41.2 44.5 46.5 44.1 41.7 51.3 4.9 12.4 28.3 18.1 Trade 1992/3 24.7 22.7 23.2 16.3 25.6 39.5 5.9 12.8 31.4 18.3 2005/6 41.0 44.3 46.1 42.7 40.9 51.7 4.5 10.8 27.6 18.5
Note: Total manufacturing – parts and components. 1. Asia – Japan 2. Developing Asia – South Asia. 3. Korea + Taiwan 4. ASEAN + Japan + China + Korea Source: Appendix Table A1.
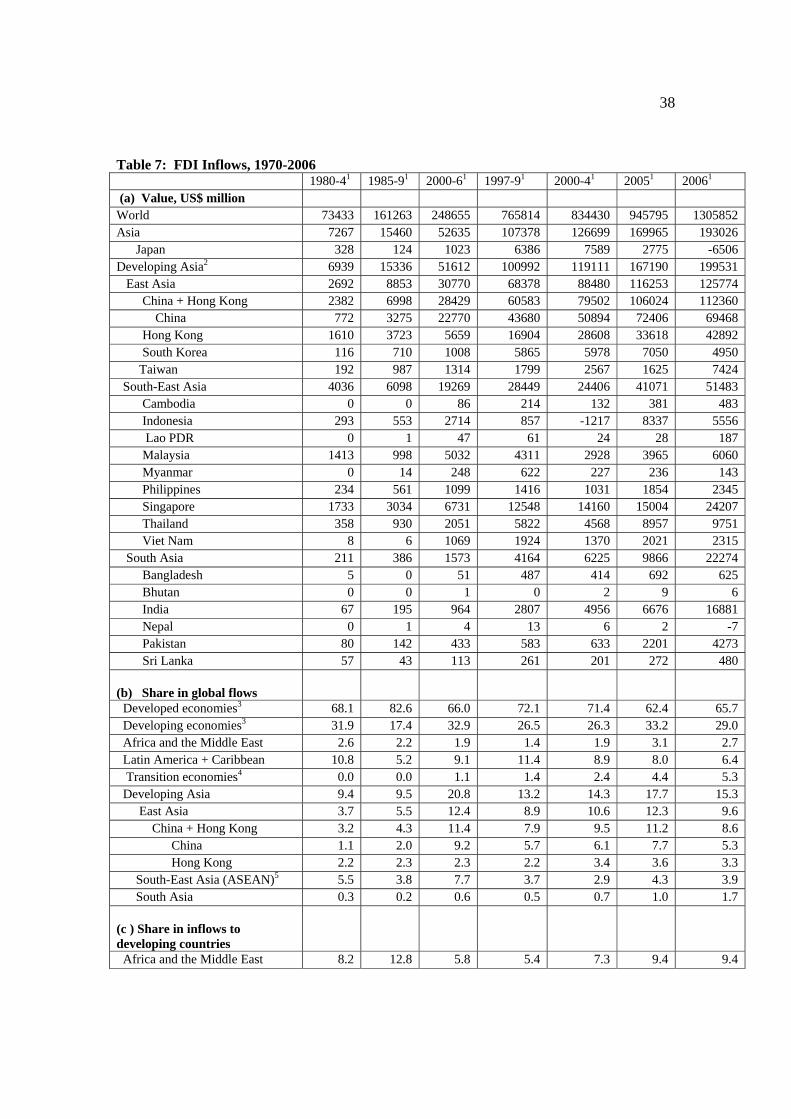
38
Table 7: FDI Inflows, 1970-2006 1980-41 1985-91 2000-61 1997-91 2000-41 20051 20061 (a) Value, US$ million World 73433 161263 248655 765814 834430 945795 1305852 Asia 7267 15460 52635 107378 126699 169965 193026 Japan 328 124 1023 6386 7589 2775 -6506 Developing Asia2 6939 15336 51612 100992 119111 167190 199531 East Asia 2692 8853 30770 68378 88480 116253 125774 China + Hong Kong 2382 6998 28429 60583 79502 106024 112360 China 772 3275 22770 43680 50894 72406 69468 Hong Kong 1610 3723 5659 16904 28608 33618 42892 South Korea 116 710 1008 5865 5978 7050 4950 Taiwan 192 987 1314 1799 2567 1625 7424 South-East Asia 4036 6098 19269 28449 24406 41071 51483 Cambodia 0 0 86 214 132 381 483 Indonesia 293 553 2714 857 -1217 8337 5556 Lao PDR 0 1 47 61 24 28 187 Malaysia 1413 998 5032 4311 2928 3965 6060 Myanmar 0 14 248 622 227 236 143 Philippines 234 561 1099 1416 1031 1854 2345 Singapore 1733 3034 6731 12548 14160 15004 24207 Thailand 358 930 2051 5822 4568 8957 9751 Viet Nam 8 6 1069 1924 1370 2021 2315 South Asia 211 386 1573 4164 6225 9866 22274 Bangladesh 5 0 51 487 414 692 625 Bhutan 0 0 1 0 2 9 6 India 67 195 964 2807 4956 6676 16881 Nepal 0 1 4 13 6 2 -7 Pakistan 80 142 433 583 633 2201 4273 Sri Lanka 57 43 113 261 201 272 480 (b) Share in global flows
Developed economies3 68.1 82.6 66.0 72.1 71.4 62.4 65.7 Developing economies3 31.9 17.4 32.9 26.5 26.3 33.2 29.0 Africa and the Middle East 2.6 2.2 1.9 1.4 1.9 3.1 2.7 Latin America + Caribbean 10.8 5.2 9.1 11.4 8.9 8.0 6.4 Transition economies4 0.0 0.0 1.1 1.4 2.4 4.4 5.3 Developing Asia 9.4 9.5 20.8 13.2 14.3 17.7 15.3 East Asia 3.7 5.5 12.4 8.9 10.6 12.3 9.6 China + Hong Kong 3.2 4.3 11.4 7.9 9.5 11.2 8.6 China 1.1 2.0 9.2 5.7 6.1 7.7 5.3 Hong Kong 2.2 2.3 2.3 2.2 3.4 3.6 3.3 South-East Asia (ASEAN)5 5.5 3.8 7.7 3.7 2.9 4.3 3.9 South Asia 0.3 0.2 0.6 0.5 0.7 1.0 1.7 (c ) Share in inflows to developing countries
Africa and the Middle East 8.2 12.8 5.8 5.4 7.3 9.4 9.4
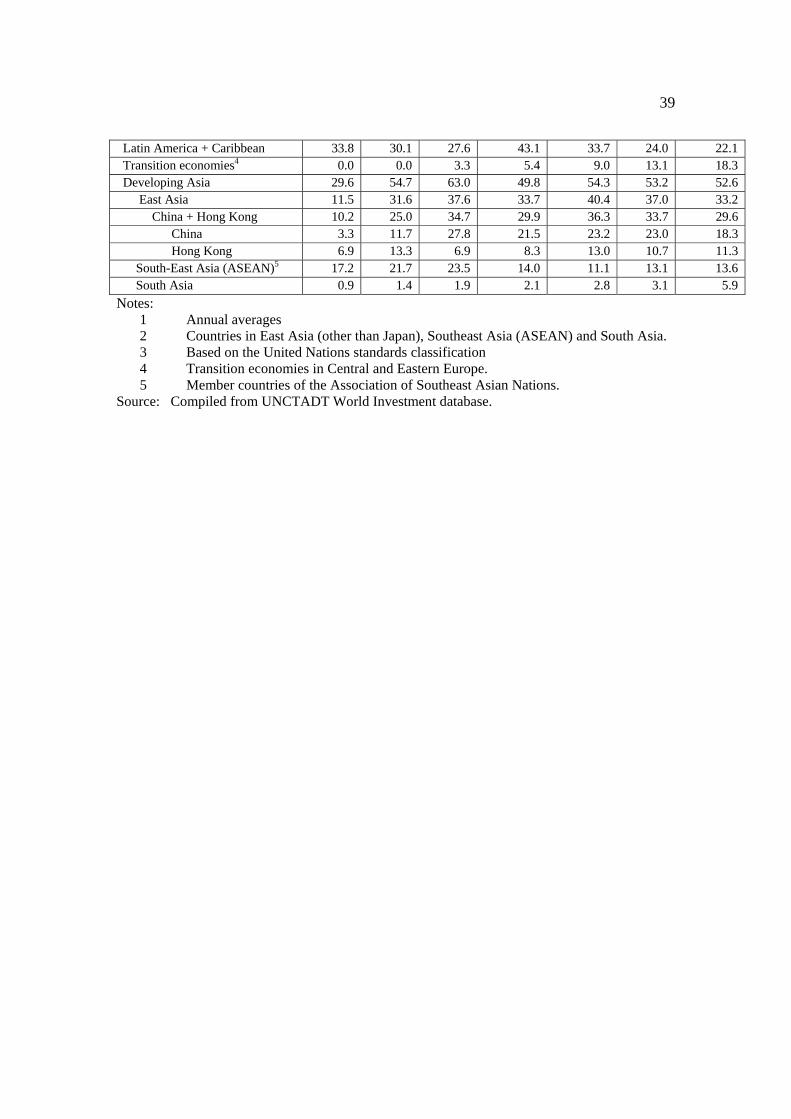
39
Latin America + Caribbean 33.8 30.1 27.6 43.1 33.7 24.0 22.1 Transition economies4 0.0 0.0 3.3 5.4 9.0 13.1 18.3 Developing Asia 29.6 54.7 63.0 49.8 54.3 53.2 52.6 East Asia 11.5 31.6 37.6 33.7 40.4 37.0 33.2 China + Hong Kong 10.2 25.0 34.7 29.9 36.3 33.7 29.6 China 3.3 11.7 27.8 21.5 23.2 23.0 18.3 Hong Kong 6.9 13.3 6.9 8.3 13.0 10.7 11.3 South-East Asia (ASEAN)5 17.2 21.7 23.5 14.0 11.1 13.1 13.6 South Asia 0.9 1.4 1.9 2.1 2.8 3.1 5.9 Notes:
1 Annual averages 2 Countries in East Asia (other than Japan), Southeast Asia (ASEAN) and South Asia. 3 Based on the United Nations standards classification 4 Transition economies in Central and Eastern Europe. 5 Member countries of the Association of Southeast Asian Nations.
Source: Compiled from UNCTADT World Investment database.

40
Table 8: FDI Inflows as % of Gross Domestic Fixed Capital Formation (GDFCF), 1970-2006 1980-4 1985-9 1990-6 1997-9 2000-4 2005 2006 Developing Asia 2.3 3.7 9.0 11.2 10.5 11.4 13.5 East Asia 1.7 3.7 9.2 11.6 11.2 10.0 10.1 China 0.7 2.5 14.9 13.3 9.6 8.8 8.0 Hong Kong 14.7 23.0 22.3 35.8 71.6 90.4 103.9 South Korea 0.4 1.2 0.9 4.6 3.5 3.0 1.9 Taiwan 1.2 3.4 3.4 2.6 4.0 2.3 10.3 South-East Asia 5.4 7.4 15.6 18.5 16.3 19.8 20.9 Cambodia 0.3 2.3 32.4 46.8 16.5 32.3 38.9 Indonesia 1.1 1.8 7.0 0.1 -4.2 12.3 6.4 Lao PDR 0.6 0.6 35.5 35.6 8.0 5.8 37.1 Malaysia 11.9 8.7 26.7 17.0 12.7 15.2 20.1 Philippines 2.0 6.8 11.1 9.2 7.1 12.6 14.1 Singapore 20.7 31.7 44.1 39.7 56.1 57.6 79.5 Thailand 2.7 3.9 5.9 20.5 14.4 17.5 16.5 Viet Nam 2.6 0.6 45.8 26.4 12.2 11.5 12.5 South Asia 0.3 0.4 2.2 3.5 4.0 4.4 9.3 Bangladesh 0.1 0.0 0.8 4.7 3.3 4.6 3.9 India 0.1 0.3 1.7 3.0 4.0 3.6 8.7 Nepal 0.0 0.2 0.7 1.3 0.5 0.2 -0.4 Pakistan 1.0 1.4 4.8 5.0 5.1 13.1 24.1 Sri Lanka 3.2 2.2 5.9 6.7 4.9 4.4 6.2 Memorandum items World 2.4 3.5 6.0 11.7 11.7 10.4 12.6 Developed countries 2.2 3.6 5.2 11.1 11.2 9.3 11.8 Developing countries 2.9 3.3 9.1 13.5 12.6 12.6 13.8 Notes
1 Annual averages 3 Based on the United Nations standard classification
2 East Asia (excluding Japan) + Southeast Asia + South Asia. 4 Transition economies in Central and Eastern Europe
Source: Compiled from UNCTADT World Investment database

41
Table 9: FDI Outflows, 1970-2006 1980-41 1985-91 1990-61 1997-91 2000-41 2005 2006 (b) Outflow, US$ million Asia 5226 30205 54219 65237 85782 110114 153280 Japan 4279 23758 25008 24296 32385 45781 50266 Developing Asia2 947 6446 29211 40941 53397 64333 103014 East Asia 542 5868 22513 31544 41209 49836 74099 China + Hong Kong 416 2656 17209 22577 31608 39463 59589 China 54 671 2322 2324 3734 12261 16130 Hong Kong 361 1985 14887 20253 27873 27201 43459 South Korea 81 715 2246 4462 3624 4298 7129 Taiwan 45 2384 3049 4500 5979 6028 7399 South-East Asia 403 649 6626 9285 10613 11918 19095 Indonesia 4 15 914 98 815 3065 3418 Malaysia 244 229 1438 1653 1526 2972 6041 Singapore 47 29 158 143 186 189 103 Thailand 106 325 3621 7024 7796 5034 8626 South Asia 2 43 72 112 1575 2579 9820 India 3 6 66 80 1529 2495 9676 (b) Geographic composition of global outflows
100 100 100 100 100 100 100
Developed countries3 94.8 93.3 86.3 91.2 88.4 84.4 84.1 Japan 9.7 16.7 9.3 3.2 4.1 5.5 4.1 Developing countries3 5.2 6.7 13.5 8.4 10.7 13.8 14.3 Africa 1.2 0.3 0.6 0.3 0.1 0.3 0.7 Latin America + Caribbean 1.4 1.1 2.0 2.7 3.7 4.3 4.0 Developing Asia2 2.1 4.5 10.8 5.4 6.7 7.7 8.5 East Asia 1.2 3.7 8.3 4.1 5.2 6.0 6.1 China + Hong Kong 0.9 1.9 6.4 3.0 4.0 4.7 4.9 China 0.1 0.5 0.9 0.3 0.5 1.5 1.3 South-East Asia 0.9 0.5 2.5 1.2 1.3 1.4 1.6 South Asia 0.0 0.0 0.0 0.0 0.2 0.3 0.8 (b) Geographic composition of outflows from developing countries
Africa 22.9 4.8 4.6 4.1 0.5 2.0 4.7 Latin America and the Caribbean
26.0 16.9 14.7 31.7 34.8 30.9 28.2
Developing Asia2 41.0 67.8 80.3 63.6 62.9 55.5 59.1 East Asia 23.5 55.8 61.9 49.0 48.5 43.0 42.5 China + Hong Kong 18.0 27.9 47.3 35.1 37.2 34.1 34.2 China 2.3 7.1 6.4 3.6 4.4 10.6 9.2 South-East Asia 17.4 6.8 18.2 14.4 12.5 10.3 10.9 South Asia 0.1 0.5 0.2 0.2 1.9 2.2 5.6 Notes
1 Annual averages 2 East Asia (excluding Japan) + Southeast Asia + South Asia. 3 Based on the United Nations standard classification.

42
Table 10: Source-country Composition of FDI Inflows into Selected Asian countries, 2001-05
ASEAN Source Countries Indonesia Malaysia Philippines Singapore Thailand Vietnam Other Total
India1 China2
Japan 24.9 9.8 21.2 13.7 23.3 19.6 1.7 15.6 8.2 11.0China -0.8 0.5 2.8 0.5 --- 4.4 1.2 0.6 --- 0.0Hong Kong 0.1 1.0 4.4 1.9 7.2 0.8 1.1 3.6 0.6 40.5Taiwan (ROC) -0.6 2.2 1.9 1.9 2.8 22.8 0.1 3.0 0.2 6.9Korea, South 8.6 -0.4 2.2 0.3 0.6 15.7 1.9 1.6 4.6 8.6ASEAN 3.2 19.7 9.5 4.3 13.7 19.4 30.8 10.7 3.7 5.7 Indonesia --- 1.0 0.4 1.3 0.1 0.9 0.3 0.8 --- --- Malaysia 1.8 --- 0.7 1.7 0.5 3.2 4.0 1.5 1.8 0.7 Philippines --- 0.5 -- 0.2 0.1 0.0 0.2 0.2 0.0 --- Singapore -1.1 16.7 8.2 --- 12.9 12.5 22.7 7.0 1.9 5.0 Thailand 3.2 0.1 0.2 0.9 --- 2.8 4.2 1.0 --- --- India 0.1 -0.1 --- 0.3 --- --- 1.2 0.2 --- --- EU 78.1 23.5 16 29.1 12.9 2.6 53.6 25.7 28.3 8.5USA -31.9 44.0 26.1 19.0 14.2 1.0 6.2 17.2 13.6 9.8Canada 5.5 -0.9 --- 4.0 0.1 0.4 0.2 2.0 --- 1.1Australia -8.3 0.9 0.8 2.3 0.9 4.8 1.0 -1.0 --- 1.0New Zealand --- 0.1 --- --- --- 8.5 1.6 0.1 --- --- Other countries 4.0 -0.9 20.2 10.1 20.8 10.7 0.2 12.5 38.13 6.9Total 100 100 100 100 100 100 100 100 100 100
Note: 1 Date for 2000-04 2 Date for 2001-06 --- Zero or negligible
3 Includes investment by non-resident Indians and possibly considerable amount of local private investment ‘round-tripped’ via Mauritius.
Source: Compiled from ASEAN Secretariat, ASEAN Statistical Yearbook (http://www.aseansec.org/pdf/ASEAN_Statistical2003.pdf , CIEC database (China), and The Indian Investment Office website at http://iic.nic.in/iic2_c01.htm.

43
Table 11: MNE Involvement in Manufactured Exports and Selected Export Performance Indicators in Developing Asian Countries1 Country
Period
MNE share in exports (MNEXS)2
(%)
World market Share (WMSH) (%)3
Nature of export composition of MNE affiliates by the late 1990s4.
(1) (2) (3) (5) (7) Hong Kong 1970-74 10.0* 0.52 Mostly B2.1 and B3, with the latter 1980-84 13.8* 1.10 Increasing rapidly in recent years. 1985-89 16.0 1.19 South 1970-74 19.3* 0.93 B3.1 and B3.2. with the latter Korea 1975-79 25.0* 1.07 Increasing rapidly in recent years 1980-84 25.8* 1.65 1985-89 26.1* 2.30 Taiwan 1975-79 36.7 1.13 2.3a and 2.3b, with the latter 1980-84 27.9 1.76 Increasing rapidly in recent years 1990-94 19.7 2.61 2000-04 10.1 Singapore 1970-74 70.0 0.78 2.3a and 2.3b. 2.3a still dominates, but 1980-84 74.9 1.35 there as been a continuing shift from 1990-94 85.2 2.16 2.3a to 2.3b since about the mid-1980s 2000-04 89.1 1.52 China 1985-89 5.3 1.49 Predominantly B2 and B3.2, with some 1990-94 24.3 2.44 Increase in B3.1 recently 2000-04 53.16 9.55 2005 58.30 13.12 Indonesia 1990-94 28.5 0.62 Predominantly B2, with some increase 1995-99 38.5 0.67 In B3.1 recently 2000-04 45.3* 0.68 Malaysia 1975-79 65.2 0.40 Predominantly B3.1a, with some 1985-89 75.6 0.59 (but diminishing) involvement in B3.2. 1990-94 78.1 1.11 2000-04 86.13 1.89 2005 87.80 1.85 Philippines 1985-89 49.9* 0.16 Predominantly B3.1, with a small and 1990-94 47.6* 0.21 diminishing share of B3.2 . 2000-04 85.7* 0.07 Thailand 1970-74 11.4* 0.15 B1, B2, B3.1 and B3.2, with the latter 1980-84 13.5* 0.33 two increasing rapidly in recent years. 1990-94 50.4* 0.91 1995-99 62.6* 1.11

44
Vietnam 1990-94 12.0 0.05 Predominantly B1 (mostly seas food) 1995-99 39.2 0.12 and B2, with a small, but increasing, 2000-04 48.6 0.20 share of B3.1. 2004-06 56.9 0.28 India 1970-74 5.0 0.50 A wide range of 1, with some minor 1980-84 8.7 0.40 increase in B2 and B3.1 1990-94 4.6 0.53 2000-04 4.6* 0.82 Sri Lanka 1975-79 25.7* 0.01 Predominantly B2, and some B1 (mostly 1980-84 42.8 0.03 ceramics and rubber goods) and B3.1 1990-94 63.5 0.05 2000-04 43.2 0.08 2005 36.3 0.07 Notes 1 In all cases manufactured exports have been measured using the ISIC-based definition
(i.e. all goods belonging to Division 3 of the International Standard Industry Classification) or an approximation to it. Figures reported are five-year averages unless otherwise indicated.
2 Annual averages. 3 Figures marked with asterisk are for a single year or some years falling within the given
five year period. For details see the Appendix. 4 Product categories listed in Column 7:
A Exports by market-seeking MNE affiliates: product mix varies depending on the nature of import-substitution policy regime, domestic market size, export incentives and export performance requirements imposed by the government.
B Exports by efficiency-seeking (export-oriented) MNE affiliates. B1 Resource-based manufacturing – Local processing of primary products
previously exported in raw state B2 Standard consumer goods – clothing, shoes, sporting goods.
B3 Assembly activities within vertically integrated production systems B3.1 Parts and component assembly : : parts of electronic and electrical machinery,
motor vehicle parts etc. B3.2 Final assembly: computers, cameras, motor vehicles etc
Source: Athukorala (2007), Chapter 3 (updates using the same data source detailed therein)

45