newcastle cbd strategy - home | hunter & central coast ... · newcastle cbd strategy final...
TRANSCRIPT

Newcastle CBD Strategy
March 2009
Newcastle CBD Strategy
Prepared for Hunter Development Corporation
PO Box 813 Newcastle NSW 2300 March 2009

© URBIS 2009 This publication is subject to copyright. Except as permitted under the Copyright Act 1968, no part of it may in any form or by any means (electronic, mechanical, photocopying, recording or otherwise) be reproduced, stored in a retrieval system or transmitted without prior written permission. Enquiries should be addressed to the publishers. URBIS Australia Asia Middle East www.urbis.com.au
DISCLAIMER
This report is prepared on the instructions of the party to whom or which it is addressed and is thus not suitable for use other than by that party. As the report involves future forecasts, it can be affected by a number of unforeseen variables. It represents for the party to whom or which it is addressed the best estimates of Urbis Pty Ltd, but no assurance is able to be given by Urbis Pty Ltd that the forecasts will be achieved.
URBIS STAFF RESPONSIBLE FOR THIS REPORT WERE:
Director Clinton Ostwald
Senior Consultant Princess Ventura
Consultant Chrystal Burnett
Support Staff Sue Taumalolo
Job Code SPE0159
Report Number 1

TABLE OF CONTENTS
Newcastle CBD Strategy Final Report March 2009
Executive Summary .................................. ................................................................................................i
1 Introduction....................................... ................................................................................................1 1.1 The Newcastle CBD Strategy – The Story So Far ..................................................................1 1.1.1 The Catalyst Projects ..............................................................................................................1 1.2 Study Purpose & Methodology................................................................................................2
2 Regional Context ................................... ...........................................................................................4 2.1 Socio-Demographic Profile of Newcastle Residents...............................................................4 2.2 Newcastle Residents’ Employment Profile..............................................................................4 2.2.1 Labourforce and Unemployment .............................................................................................4 2.2.2 Structure ..................................................................................................................................5 2.2.3 Source of Growth.....................................................................................................................6 2.3 Jobs in Newcastle....................................................................................................................7 2.3.1 Structure ..................................................................................................................................7 2.3.2 Source of Growth.....................................................................................................................8 2.4 Comparison of Employed Residents and Jobs in Newcastle by Industry ...............................9 2.5 Job Containment Within the Newcastle CBD........................................................................11 2.5.1 Mode of Travel.......................................................................................................................14 2.6 Conclusion.............................................................................................................................16
3 What Makes a CBD Work?............................. ................................................................................17 3.1 City Centre Criteria for Success ............................................................................................17 3.2 Suggested Developments in Newcastle CBD .......................................................................19 3.3 Key Benefits of a Well Designed City....................................................................................20 3.3.1 Agglomeration of Uses ..........................................................................................................20 3.3.2 Environmental Value .............................................................................................................21 3.3.3 More Cost Effective Use of Infrastructure and Accessibility..................................................21 3.3.4 Conclusion.............................................................................................................................21
4 National and International Experiences of CBDs..... ...................................................................23 4.1 Sydney...................................................................................................................................23 4.2 Wollongong............................................................................................................................25 4.3 Brisbane ................................................................................................................................28 4.4 Townsville..............................................................................................................................30 4.5 Geelong .................................................................................................................................32
5 Detailed Assessment of Catalyst Projects ........... .......................................................................34 5.1 Retail Precinct .......................................................................................................................34 5.1.1 Employment...........................................................................................................................34 5.1.2 Economic Output ...................................................................................................................35 5.1.3 Signal to Stimulate Investor Confidence ...............................................................................36 5.1.4 Increased Activity and Potential Reduction in Crime ............................................................36 5.1.5 Competition and Potential Commercial Viability of Proposed GPT Centre...........................37 5.1.6 Relative Strengths and Weaknesses of Newcastle CBD as a Retail Location .....................40 5.1.7 The Importance of Hunter Street Mall Redevelopment.........................................................40 5.1.8 Key Issues & Challenges ......................................................................................................52 5.1.9 Conclusion.............................................................................................................................52 5.2 Education Precinct.................................................................................................................52 5.2.1 Capital Investment.................................................................................................................53

TABLE OF CONTENTS CONTINUED
Newcastle CBD Strategy Final Report March 2009
5.2.2 Employment...........................................................................................................................53 5.2.3 Staff & Student Spending in the CBD....................................................................................54 5.2.4 Increase activity in the CBD ..................................................................................................56 5.2.5 Improved Safety & Amenity...................................................................................................56 5.2.6 Student Accommodation .......................................................................................................56 5.2.7 Utilisation of University Facilities for Conferencing ...............................................................57 5.2.8 Linkages to the Legal Sector.................................................................................................57 5.2.9 Increased International Student Population ..........................................................................58 5.2.10 Key Issues & Challenges ......................................................................................................58 5.3 Justice Precinct .....................................................................................................................59 5.3.1 Capital Investment.................................................................................................................59 5.3.2 Employment...........................................................................................................................59 5.3.3 Increased Activity ..................................................................................................................60 5.3.4 Collaboration with University .................................................................................................60 5.3.5 Residential Development Opportunities in Existing Legal Precinct Location........................60 5.3.6 Key Issues & Challenges ......................................................................................................61 5.4 Tourism Precinct....................................................................................................................61 5.4.1 Tourist Expenditure ...............................................................................................................61 5.4.2 Cruise Ship Market ................................................................................................................62 5.4.3 Conferencing Sector Development .......................................................................................63 5.4.4 Key Issues & Challenges ......................................................................................................64 5.5 Cultural Precinct ....................................................................................................................64 5.5.1 Facilitate cross-usage opportunities......................................................................................64 5.5.2 Social Benefits of Participation in Arts and Cultural Activities...............................................65 5.5.3 Key Issues & Challenges ......................................................................................................66 5.6 Commercial Precinct .............................................................................................................66 5.6.1 Implications for Meeting Newcastle’s Vision on Job Creation...............................................67 5.6.2 Construction Costs ................................................................................................................67 5.6.3 Employment...........................................................................................................................68 5.6.4 Key Issues & Challenges ......................................................................................................68
6 What the Future Holds for Newcastle CBD............ ......................................................................70 6.1 Implications of CBD Critical Success Factors on Proposed Catalyst Projects .....................70 6.2 Proposed Location.................................................................................................................70 6.3 Staging and Timing................................................................................................................71
APPENDICES: . ...................................... ...................................................................................................1
Appendix A Definitions

EXECUTIVE SUMMARY
Newcastle CBD Strategy Final Report March 2009 Page i
Executive Summary
� Over the past decade, Newcastle CBD has suffered a decline in retail spending as a result of increased competition from other regional centres. Violence, graffiti and drinking issues, as well as restricted parking, standard of public transport access and pedestrian mobility have acted as deterrents for locals and tourists alike to visit the city centre. Connectivity between Honeysuckle, the harbour and the traditional city centre has become more difficult, resulting in fragmentation between the city’s precincts. Promised public and private sector projects have not eventuated and the city centre has failed to attract major new office relocations from outside of Newcastle. These factors have resulted in a general decline in the appeal of the city and it’s prominence as a major regional city.
� In recognition of the problems facing Newcastle CBD, in August 2008 the State Government established the City Centre Taskforce to identify opportunities to facilitate development within the city centre. The Taskforce undertook a series of workshops to identify such opportunities. Newcastle City Council simultaneously sought to identify development opportunities within the city centre, by way of extensive community consultation. Emerging from the Taskforce and Council workshops was the conceptualisation of a suite of “catalyst projects” that were identified as having potential to revitalise the Newcastle CBD.
� The overall aim of this project is to review the catalyst projects which have been identified by the City Centre Taskforce and Newcastle City Council. The analysis will assist Hunter Development Corporation in its preparation of its submission to the Federal Government’s Major Cities Unit for funding.
� The catalyst projects that have been identified for Newcastle CBD are based around activity precincts including a Retail Precinct, Justice Precinct, Education Precinct, Arts & Cultural Precinct, Tourism Precinct and Commercial Precinct. This study assesses the precincts in terms of their potential economic benefit to Newcastle, and their ability to create a vibrant CBD. The key findings are presented in the tables overleaf.
� Analysis of the catalyst projects was carried out in the context of the unique socio-demographic characteristics of Newcastle. Newcastle LGA has a similar population to Sydney LGA, though it is far less densely populated. This lack of density has been a major factor which has contributed to the lack of vibrancy and activity in the CBD. The main industries of employment for Newcastle residents are health and community services, retail trade, manufacturing and education – combined they account for almost 53% of employed residents. Key growth sectors include government administration and accommodation and restaurants Within the Newcastle CBD, Honeysuckle and the northern part of Civic have the highest concentration of employment (37% of total jobs in Newcastle CBD), followed next by Newcastle East (34%) then Wickham and Newcastle West (29%).
� To assess the catalyst projects we also drew on research conducted into the principles behind well planned CBDs. The key principles underpinning ‘successful’ CBDs are: scale; flexibility to change; broad role; nodes; access, connectivity and circulation; and a sense of ‘place’. Implementation of these principles results in economic, social and environmental benefits to cities.
� As part of our analysis we investigated the experiences of a number of CBDs including Sydney, Brisbane, Wollongong, Townsville and Geelong. Whilst each CBD faces its own issues and challenges, the key finding is that, generally, those CBDs which are denser and are concentrated around a well defined core (‘city heart’) have achieved a greater level of vibrancy.
� The retail development proposed by GPT would bring significant economic benefit to Newcastle. However, given it’s location in the constrained eastern precinct, the development on its own will not revitalise the CBD as there will be limited opportunity to create a significant critical mass around it. Centrally located developments such as Civic will play a very critical role in tying the various elements of the CBD together. As such, well defined pedestrian connections need to be established between Civic and Hunter Street around the GPT site. Moreover, given GPT’s recent

EXECUTIVE SUMMARY
Newcastle CBD Strategy Final Report March 2009 Page ii
announcement that it will be putting its development on hold for at least three years, Newcastle Council must independently consider options to revitalise the retail precinct. Based on the experiences of other cities, opening up of the Hunter Street Mall to slow-moving vehicular traffic may provide impetus for revitalisation of the retail precinct. This would allow for more activity in Hunter Street, and would assist in reducing crime and anti-social behaviour.
� The Education and Legal precincts would bring significant economic benefit to Newcastle, and given their possible central locations around the Civic area, are seen to have the potential to provide major impetus to revitalisation of the CBD. These precincts are seen to be potential focal points of the CBD around which other precincts could be located. Given lessons from the past experiences of the Newcastle CBD and other national and international CBDs, we believe it is optimal for the justice, education and cultural precincts to be closely located and clustered together.
� Future commercial office development should be encouraged to be located immediately in and around Civic and Honeysuckle prior to continuing development in Wickham to facilitate the agglomeration of activity in and around a core.
� The key findings and analysis of the catalyst projects are detailed in the following tables:
EXECUTIVE SUMMARY
Newcastle CBD Strategy Final Report March 2009 Page i
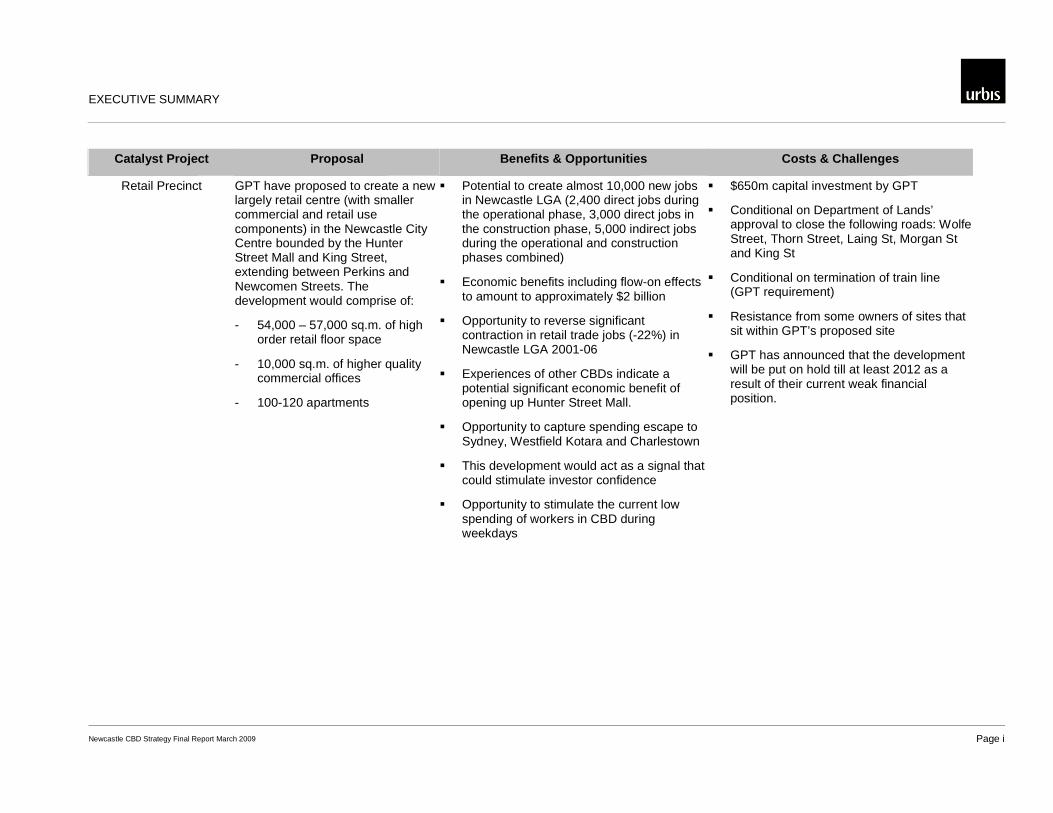
Catalyst Project Proposal Benefits & Opportunities Costs & Challenges
Retail Precinct GPT have proposed to create a new largely retail centre (with smaller commercial and retail use components) in the Newcastle City Centre bounded by the Hunter Street Mall and King Street, extending between Perkins and Newcomen Streets. The development would comprise of:
- 54,000 – 57,000 sq.m. of high order retail floor space
- 10,000 sq.m. of higher quality commercial offices
- 100-120 apartments
� Potential to create almost 10,000 new jobs in Newcastle LGA (2,400 direct jobs during the operational phase, 3,000 direct jobs in the construction phase, 5,000 indirect jobs during the operational and construction phases combined)
� Economic benefits including flow-on effects to amount to approximately $2 billion
� Opportunity to reverse significant contraction in retail trade jobs (-22%) in Newcastle LGA 2001-06
� Experiences of other CBDs indicate a potential significant economic benefit of opening up Hunter Street Mall.
� Opportunity to capture spending escape to Sydney, Westfield Kotara and Charlestown
� This development would act as a signal that could stimulate investor confidence
� Opportunity to stimulate the current low spending of workers in CBD during weekdays
� $650m capital investment by GPT
� Conditional on Department of Lands’ approval to close the following roads: Wolfe Street, Thorn Street, Laing St, Morgan St and King St
� Conditional on termination of train line (GPT requirement)
� Resistance from some owners of sites that sit within GPT’s proposed site
� GPT has announced that the development will be put on hold till at least 2012 as a result of their current weak financial position.
EXECUTIVE SUMMARY
Newcastle CBD Strategy Final Report March 2009 Page ii
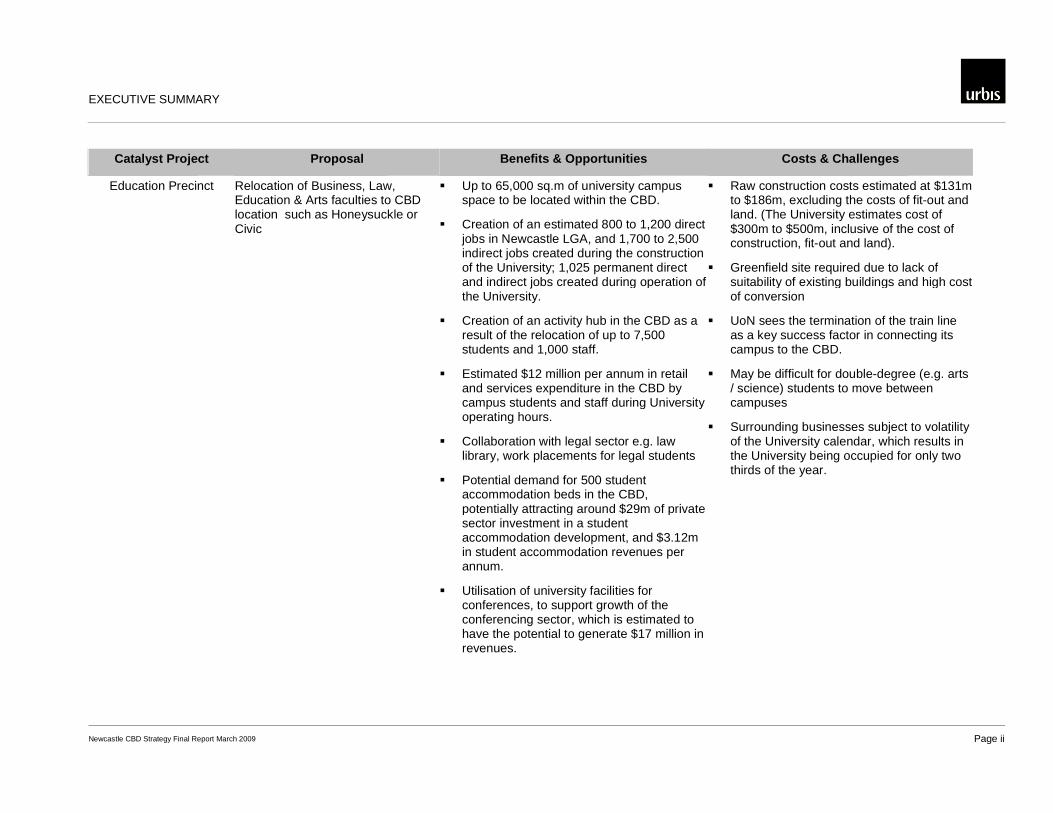
Catalyst Project Proposal Benefits & Opportunities Costs & Challenges
Education Precinct
Relocation of Business, Law, Education & Arts faculties to CBD location such as Honeysuckle or Civic
� Up to 65,000 sq.m of university campus space to be located within the CBD.
� Creation of an estimated 800 to 1,200 direct jobs in Newcastle LGA, and 1,700 to 2,500 indirect jobs created during the construction of the University; 1,025 permanent direct and indirect jobs created during operation of the University.
� Creation of an activity hub in the CBD as a result of the relocation of up to 7,500 students and 1,000 staff.
� Estimated $12 million per annum in retail and services expenditure in the CBD by campus students and staff during University operating hours.
� Collaboration with legal sector e.g. law library, work placements for legal students
� Potential demand for 500 student accommodation beds in the CBD, potentially attracting around $29m of private sector investment in a student accommodation development, and $3.12m in student accommodation revenues per annum.
� Utilisation of university facilities for conferences, to support growth of the conferencing sector, which is estimated to have the potential to generate $17 million in revenues.
� Raw construction costs estimated at $131m to $186m, excluding the costs of fit-out and land. (The University estimates cost of $300m to $500m, inclusive of the cost of construction, fit-out and land).
� Greenfield site required due to lack of suitability of existing buildings and high cost of conversion
� UoN sees the termination of the train line as a key success factor in connecting its campus to the CBD.
� May be difficult for double-degree (e.g. arts / science) students to move between campuses
� Surrounding businesses subject to volatility of the University calendar, which results in the University being occupied for only two thirds of the year.

EXECUTIVE SUMMARY
Newcastle CBD Strategy Final Report March 2009 Page iii
Catalyst Project Proposal Benefits & Opportunities Costs & Challenges
Education Precinct (cont.) � Higher appeal of CBD location could result in an increase in the proportion of international student from 19% to around 22% (2,000 students), resulting in additional study fee revenue from international students of approximately $26m annually for UoN
� Increased safety and amenity, which will support the development of Newcastle’s night time economy.
� Backfilling of Callaghan Campus would provide opportunities for private sector investment
� University can relocate quickly and thus bring immediate benefits
EXECUTIVE SUMMARY
Newcastle CBD Strategy Final Report March 2009 Page iv
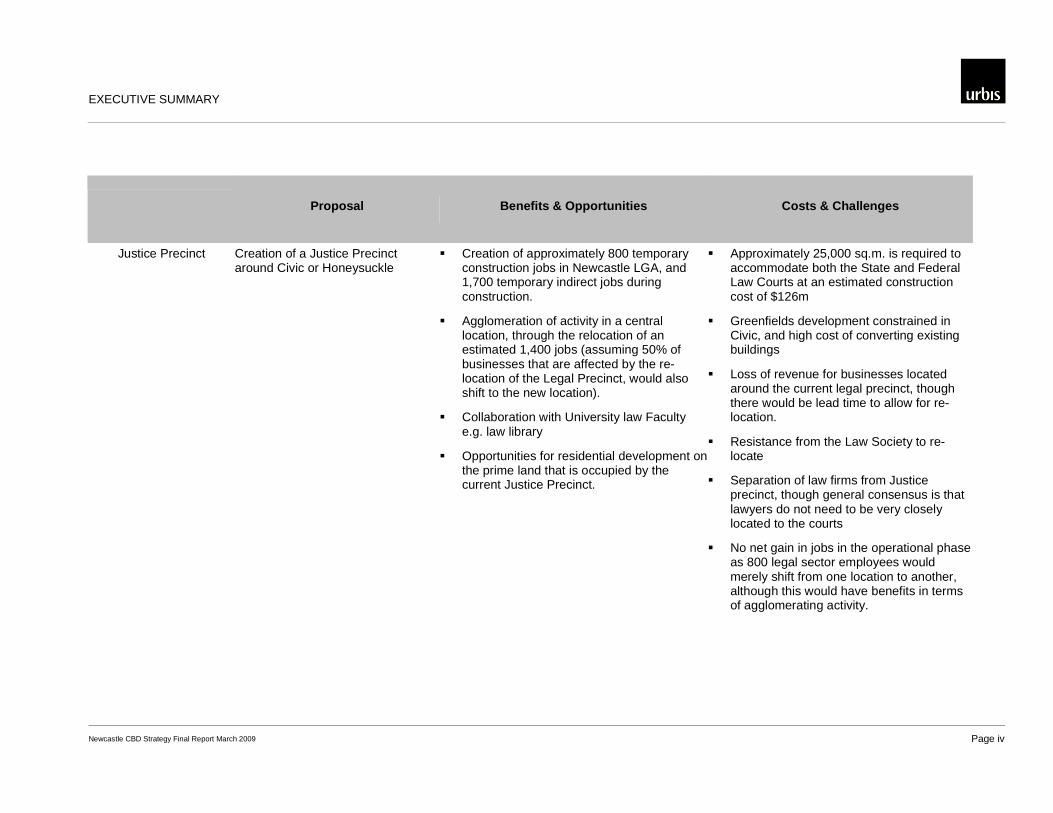
Proposal Benefits & Opportunities Costs & Challenges
Justice Precinct Creation of a Justice Precinct around Civic or Honeysuckle
� Creation of approximately 800 temporary construction jobs in Newcastle LGA, and 1,700 temporary indirect jobs during construction.
� Agglomeration of activity in a central location, through the relocation of an estimated 1,400 jobs (assuming 50% of businesses that are affected by the re-location of the Legal Precinct, would also shift to the new location).
� Collaboration with University law Faculty e.g. law library
� Opportunities for residential development on the prime land that is occupied by the current Justice Precinct.
� Approximately 25,000 sq.m. is required to accommodate both the State and Federal Law Courts at an estimated construction cost of $126m
� Greenfields development constrained in Civic, and high cost of converting existing buildings
� Loss of revenue for businesses located around the current legal precinct, though there would be lead time to allow for re-location.
� Resistance from the Law Society to re-locate
� Separation of law firms from Justice precinct, though general consensus is that lawyers do not need to be very closely located to the courts
� No net gain in jobs in the operational phase as 800 legal sector employees would merely shift from one location to another, although this would have benefits in terms of agglomerating activity.

EXECUTIVE SUMMARY
Newcastle CBD Strategy Final Report March 2009 Page v
Catalyst Project Proposal Benefits & Opportunities Costs & Challenges
Tourist Precinct / Cruise Ship Terminal
Development of cruise shipping terminal at Throsby or Queens Wharf which could also be utilised as a conference / convention venue
� 6 cruise ships visited Newcastle in 07/08, resulting in an estimated economic benefit of $2.3m ($380,000 per cruise ship) to the Hunter Region, with 50% or $1.15m of this believed to have been retained within Newcastle.
� If the number of cruise ships visiting Newcastle increases to 15, the economic benefit of cruise ships to Newcastle could increase to an estimated $2.9m, and the creation of approximately 108 jobs.
� Opportunity to utilise a cruise terminal as a convention centre, though probably not ideal given lack of custom convention facilities such as theatre rooms, break-out rooms etc. More likely to be utilised for large (e.g. 300+ person) dinners, parties etc
� Potential patronage of cruise ship visitors to retail precinct if easily accessible
� If Newcastle can improve its tourism offering such that International and Domestic Overnight visitors increased their stay by one day and night, an additional $100m in tourist revenues could be generated.
� Utilisation of University CBD campus facilities for conferencing. If Newcastle can capture 30% of the estimated 100,000 convention and conference delegates that visit the Hunter region annually, conference and convention revenues could reach up to $17m.
� According to Cruise Hunter Throsby Wharf is geographically a perfect location for a cruise terminal and has the advantage of existing traffic and parking infrastructure. However, this is hindered by a ‘pinch point’ at Dkye Point whereby vessels beyond 240m are unable to pass through to reach Throsby. Queens Wharf is therefore a preferred location, given its proximity to the retail precinct of the city and ease of access. However, adequate parking and traffic infrastructure is a concern.
� Early estimates are that a cruise port facility comprising of a 3,000 sq.m. terminal and 10,000 sq.m. commercial / retail space would cost in the vicinity of $70 million. This figure accounts for dredging, wharf construction and building costs An upgrade and extension of the existing Queens Wharf site could cost in the vicinity of $30m.
� Potential demand from cruise ships to use Newcastle as a home port is not known at this point.
� Cruise Shipping is a low employment industry, generating just 12 FTE in 2007-08 from an additional single cruise ship visit
� Convention market currently inhibited by unavailability of adequate convention venues, and lack of five star accommodation.
EXECUTIVE SUMMARY
Newcastle CBD Strategy Final Report March 2009 Page vi
Catalyst Project Proposal Benefits & Opportunities Costs & Challenges
Tourist Precinct / Cruise Ship Terminal (cont.)
� The revenue and employment benefits of the cruise ship and conferencing sectors (precincts) are marginal relative to the other precincts, though should not be ignored.

EXECUTIVE SUMMARY
Newcastle CBD Strategy Final Report March 2009 Page vii
Catalyst Project Proposal Benefits & Opportunities Costs & Challenges
Arts & Cultural Precinct Ongoing development of arts and cultural facilities around the Civic precinct
� Utilisation of heritage buildings around Civic and also east of the retail precinct
� Intangible benefits (i.e. community development & participation)
� Tourism drawcard e.g. opportunity to retain more cruise ship passengers which usually escape to the Hunter
� The economic benefit of arts and cultural facilities is difficult to quantify as benefits are largely due to flow on effects, such as increasing vibrancy and relevance of the CBD to the Newcastle population.

EXECUTIVE SUMMARY
Newcastle CBD Strategy Final Report March 2009 Page viii
Catalyst Project Proposal Benefits & Opportunities Costs & Challenges
Commercial Precinct / Transport Interchange
Continued development of the Lee Wharf precinct in Honeysuckle (Newcastle West), redevelopment of premises along Hunter Street and King Street, expansion further west into Wickham.
� 150,000 sq.m. of office space would be required to support 7,500 new commercial jobs over the next 25 years (as per Lower Hunter Regional Strategy). This would create an estimated 2,700 temporary construction jobs in Newcastle LGA, and an additional 4,800 indirect jobs during the construction phase. Of course, this would take place over the 25 year period.
� Re-vitalisation of former industrial/wharf areas
� Increased supply of A Grade space may attract quality tenants to the region
� Opportunity for office development to take place at the eastern end of Honeysuckle before new development takes place further west
� Each 10,000 sq.m. of new office space would accommodate approximately 500 employees.
� 150,000 sq.m. of office space would cost an estimated $360m (today’s prices) to construct over a 25 year period.
� Elongation of CBD exacerbated if expansion to Wickham occurs
� Tenants ability to relocate from B Grade premises ($200-$250/sq.m net rent pa) into new A Grade premises ($300-$350/sq.m net rent pa) and pay higher rents is unknown
� Slow historic supply and high vacancy rates (10% in January 2009) indicate no overwhelming demand for new office space.
� Net absorption of office space in Newcastle has averaged 5,000 sq.m. per annum for the past 10 years.
INTRODUCTION
Newcastle CBD Strategy Final Report March 2009 Page 1
1 Introduction Newcastle is Australia’s largest regional city, and the economic, administrative and cultural centre of the Hunter Region. The city has experienced a period of rapid social and economic change in the last decade, as a result of high levels of population growth, decline of the mining and heavy industries, and increasing prominence of the commercial, health, education, tourism and entertainment industries.
Despite being the regional capital and first order central business district, the Newcastle CBD fails to provide the range of retail, service, entertainment and cultural facilities to stop significant expenditure and commercial activity escaping to regional centres and Sydney.
Over the past few years Newcastle has implemented a number of long term projects aimed at re-establishing its position as a dominant employment and residential centre of NSW. One of these projects is the City Centre Revitalisation, which aims at increasing the City Centre’s role as a focus for high quality retailing, business services, entertainment and cultural activities, education facilities and residential development. This is in accordance with the Department of Planning’s ambitions for the Newcastle CBD, as captured in the Lower Hunter Regional Strategy.
1.1 The Newcastle CBD Strategy – The Story So Far During 2007 the NSW Government and Newcastle City Council through a process of extensive consultation and professional input developed a suite of documents which provided the framework for the development of the city centre. These were adopted and gazetted in February 2008 - referred to as the Newcastle City Centre Plan.
Subsequently, in August 2008, the State Government established a City Centre Taskforce (the Taskforce) to identify opportunities to facilitate development within the Newcastle city centre. The Taskforce was asked to provide recommendations to the NSW Government that could potentially meet the Commonwealth Government’s Major Cities Unit requirements.
From August to December 2008 the Taskforce conducted a series of workshops, involving key community, business, property industry and government stakeholders, to explore the possibilities for the Newcastle CBD. Simultaneously, Newcastle City Council conducted a similar process. Emerging from the Taskforce and Council workshops was the conceptualisation of a suite of “catalyst projects” that were identified as having potential to revitalise the Newcastle CBD.
1.1.1 The Catalyst Projects
Retail Precinct: Re-establishment of the CBD as a retailing hub, primarily through the development proposal put forward by GPT for land around Hunter Street. The CBD’s retail precinct has traditionally focused on the Hunter Street Mall area. This area however has been in decline for form 20 years facing fierce competition from Charlestown Square and Westfield at Kotara, amongst other retail developments in the region. The competitive strength and retail pull of these centres will not abate without significant reinvestment in the CBD. The GPT proposal offers this opportunity.
Education Precinct: Expansion of the University of Newcastle inner city campuses for additional ‘social sciences’ as well as other opportunities such as the innovative provision of adult education and other education formats. The University of Newcastle already has inner city campuses. It has also made public its intention or desire to locate other “social” sciences to the city focusing on technical sciences at the Callaghan campus. Separately discussions with the Department of Education suggest there may be further educational opportunities in the CBD.
Justice Precinct: The State and Commonwealth Attorneys General have both recognised the inadequacy of the current facilities in Newcastle’s Legal precinct in the east of the CBD. There is potential for both State and Federal Law Courts, Police, Newcastle Law School & Library, legal firm offices, community justice centre and community based organisations to be co-located around a new justice precinct.

INTRODUCTION
Newcastle CBD Strategy Final Report March 2009 Page 2
Tourism Precinct: Building on the existing conferencing market and the developing cruise ship visits, the opportunity may exist to look at permanent cruise ship terminal facilities and expanding of conferencing facilities within the CBD. The community forums recognised that Newcastle could be exploiting gaps in the convention and exhibition market. In 2007 / 08 alone the convention market generated some $11 million of expenditure in the city’s local economy. Further work is required in conjunction with NSW Tourism and Newcastle Tourism to identify market opportunities to better determine viable options for the city on this important segment of the market.
Cultural Precinct: Implementation of the 2007 Civic and Cultural Precinct Plan that encourages cultural development around the existing City Hall. In 2007 the NSW government and Newcastle Council developed and adopted the Civic and Cultural Precinct Plan. A Master Plan to accommodate and encourage the development of cultural and civic facilities around the existing City Hall area. Council has significant land holding in this precinct which could be redeveloped. This is an area which should be reviewed by this project in relation to existing and emerging opportunities.
Interchange & Commercial Precinct: Potential for development of a major rail based transport hub at Wickham as the catalyst for new and intensified commercial development (possibly looking at attracting new government offices). Some of the transport options being considered require the construction of a significant public transport interchange. This interchange if located in the Wickham area could be the focal point of significant new development. It is also an area much in need of redevelopment having faced decline for over two decades. It is however an area with significant opportunities afforded by larger land holding, higher building envelopes and greater densities. This project seeks to explore the feasibility of developing a major office facility at this interchange and attracting an office relocation with government support.
1.2 Study Purpose & Methodology The overall aim of this project is to review the catalytic projects and their relative economic benefit in order to assist government in forming financial and social decisions about the Newcastle CBD. The result of this consultancy will also assist Hunter Development Corporation in its preparation of its submission to the Federal Government’s Major Cities Unit for funding.
Each catalyst project was assessed in view of the following key metrics:
• Critical Success Factors based on state, national and international experience
• Commercial viability of the relevant projects (e.g. do market rental levels for office justify the economic cost of development?)
• Consideration of the potential infrastructure requirement for each option and associated costs.
• Economic and jobs benefits
• Preferred location in terms of commercial viability and economic stimulus to the city
• Consideration of co-location with other facilities and services versus independent locations
• High level consideration of key transport economic considerations
To conduct this assessment, insights and data were obtained from a range of sources including:
1. Stakeholders: insights obtained through a series of in-depth discussions, as well as through the CBD planning workshop conducted on the 12th and 13th of February, 2009.
2. Planning documents: The City Centre Vision, Civic Improvement Plan (CIP), Local Environment Plan (LEP), Development Control Plan (DCP)
3. Client research reports

INTRODUCTION
Newcastle CBD Strategy Final Report March 2009 Page 3
4. Publicly available demographic, economic and industry data from sources such as ABS, Rawlinsons Australian Construction Handbook, Tourism Research Australia, Department for Planning
5. Urbis proprietary GIS, property and retail data and reports

REGIONAL CONTEXT
Newcastle CBD Strategy Final Report March 2009 Page 4
2 Regional Context This section of the report will provide the social, demographic and economic context of the broader Newcastle local government area (LGA) in which the Newcastle CBD is set in.
2.1 Socio-Demographic Profile of Newcastle Residents The total population of the Newcastle LGA is quite similar to that of the Sydney LGA. However, the Sydney LGA is almost seven times more densely populated compared to the Newcastle LGA.
Per capita incomes in the Newcastle LGA are significantly lower than in the Sydney LGA and the average Sydney metropolitan area.
The Newcastle LGA has a higher proportion of older residents relative to Sydney LGA and metropolitan area. As a result, the average age of Newcastle LGA residents is higher than in the Sydney LGA and statistical division (SD).
Newcastle has a higher proportion of long-term residents relative to Sydney LGA.
Newcastle LGA has more than twice the proportion of Sydney LGA households who own their own homes. This may be linked in part to the older population in Newcastle.
Socio-Demographic Profile of Newcastle LGA Resident s
Newcastle LGA Sydney LGA Sydney SD
Population 2006 Census 141,755 155,967 4,118,844
Population Density (persons per sq km) 757.7 5,871.80 339.2
Average Per Capita Income $25,741 $42,730 $29,221
Average Age 38.7 36.1 36.7
% of Households who own homes 34.50% 14.40% 32.90%
% Households Same Address 5 Years Ago 59.50% 34.20% 61.30%
Source: ABS, Urbis
2.2 Newcastle Residents’ Employment Profile
2.2.1 Labourforce and Unemployment
The unemployment rate among Newcastle LGA residents in about two percentage points higher compared to that in the Sydney LGA and SD. Encouragingly, the 7.2% unemployment rate recorded in the Newcastle LGA in 2006 is significantly lower than the 11.2% recorded in 2001.
The labour force participation rate in Newcastle is significantly lower than in Sydney.
Newcastle has more than double the proportion of blue collar workers compared to Sydney.
The educational attainment of Newcastle residents is significantly lower relative to Sydney as evidenced by the lower proportion of the adult population undertaking or completed tertiary education. The proportion of the adult population in Newcastle who completed 12 years of schooling or higher is also vastly lower than in Sydney.

REGIONAL CONTEXT
Newcastle CBD Strategy Final Report March 2009 Page 5
Key Employment Indicators
Newcastle LGA Sydney LGA Sydney SD% Unemployed 7.20% 5.30% 5.30%
Labour Force Participation 61.00% 74.20% 65.60%
% Blue Collar Workers 30.10% 13.60% 27.20%
% White Collar Workers 69.90% 86.40% 72.80%
% Undertaking or Completed Tertiary Education or Higher*
31.60% 50.40% 35.30%
% Completed 12 Years of Schooling and Over* 43.20% 78.30% 55.10%
Source: ABS, Urbis
2.2.2 Structure
The industry of concentration of Newcastle resident workers varies significantly from Sydney.
− The main industry of employment for Newcastle residents are health and community services, retail trade, manufacturing and education – combined account for almost 53% of employed residents.
− Finance and property; utilities, communication and transport; accommodation and restaurants and retail trade are the main industries which employ Sydney residents combined account for 54% of employed residents.
The industry of employment of Newcastle residents reflect the relatively lower educational attainment and higher proportion of blue collar workers among residents compared to Sydney.
− The proportion of residents employed in manufacturing and construction among Newcastle residents is more than twice the proportion for Sydney residents.
− Sydney has more than twice the proportion of residents employed in finance and property in Newcastle (5.9% compared to 15.8%).
A higher proportion of Newcastle residents work in retail trade (10.8% compared to 13.4%), and health and community services (10.3% compared to 17.8%) compared to Sydney residents.
− The relatively high proportion of Newcastle residents employed in the health sector is a reflection of the regional role the area plays in terms of health services.
A higher proportion of Sydney residents work in utilities, communications and transport compared to Newcastle residents.

REGIONAL CONTEXT
Newcastle CBD Strategy Final Report March 2009 Page 6
Industry of Employment of Newcastle LGA Residents, 2006
Sydney Newcastle
Source : ABS 2001 and 2006 Census, Urbis.
Rural Min ingManuf act ur ing Ut i lit ies, com m un icat ion and t ranspo r tConst ruct ion Who lesale t radeRet ail t rade Accom odat ion and rest auran t sFinance and proper t y Governm en t adm in ist rat ionEducat ion Healt h and com m un it y servicesCult ural and recreat ional services
2.2.3 Source of Growth
A significant number of new jobs among Newcastle residents was recorded between 2001 and 2006 in the following industries:
− Government administration
− Accommodations and restaurants
− Mining
− Health and community services
− Construction
− Utilities, communications and transport
− Education
− Rural
In contrast, the number of Newcastle residents employed in retail trade contracted by about a fifth between 2001 and 2006.

REGIONAL CONTEXT
Newcastle CBD Strategy Final Report March 2009 Page 7
Change in Industry of Employment of Newcastle LGA R esidents, 2001-2006
Source : ABS 2001 and 2006 Census, Urbis.
0
1000
2000
3000
4000
5000
6000
7000
8000
9000
10000G
over
nmen
tad
min
istr
atio
n
Acc
omod
atio
n,re
stau
rant
s
Min
ing
Hea
lth,
com
mun
ityse
rvic
es
Con
stru
ctio
n
Util
ities
,co
mm
unic
atio
n,tr
ansp
ort
Edu
catio
n
Rur
al
Man
ufac
turin
g
Who
lesa
le tr
ade
Ret
ail t
rade
-30%
-20%
-10%
0%
10%
20%
30%
40%
50%
60%
70%
80%2001 2006 % Change
2.3 Jobs in Newcastle This section will look at the jobs available in the Newcastle LGA, which employ people from within Newcastle and from areas outside of Newcastle.
2.3.1 Structure
The Newcastle LGA economy is well-diversified as evidenced by the distribution by industry of jobs in the area.
The distribution by industry of jobs in the Newcastle LGA varies quite significantly from Sydney. However, it is quite consistent with the profile of employed Newcastle residents.
− The main employers in the Newcastle LGA are health and community services; retail trade; manufacturing; utilities, communication and transport; and education – combined account for almost 65% of jobs in Newcastle.
− Finance and property; utilities, communication and transport; and Government administration are the main industries which employ workers in Sydney -- combined account for almost 55% of total jobs.
The provision of jobs in retail trade, health and community services, education, manufacturing and construction in the Newcastle LGA account for a higher proportion of total jobs relative to Sydney.
In contrast, jobs in finance and property; utilities, communication and trade; and Government administration make up a higher share of Sydney jobs compared to Newcastle.

REGIONAL CONTEXT
Newcastle CBD Strategy Final Report March 2009 Page 8
Jobs in the Newcastle LGA, 2006
Sydney Newcastle
Source : ABS 2001 and 2006 Census, Urbis.
Rural Min ingManuf act ur ing Ut ili t ies, com m un icat ion and t ranspo r tConst ruct ion Who lesale t radeRet ai l t rade Accom odat ion and rest auran t sFinance and p roper t y Governm en t adm in ist rat ionEducat ion Healt h and com m un it y servicesCult ural and recreat ional services
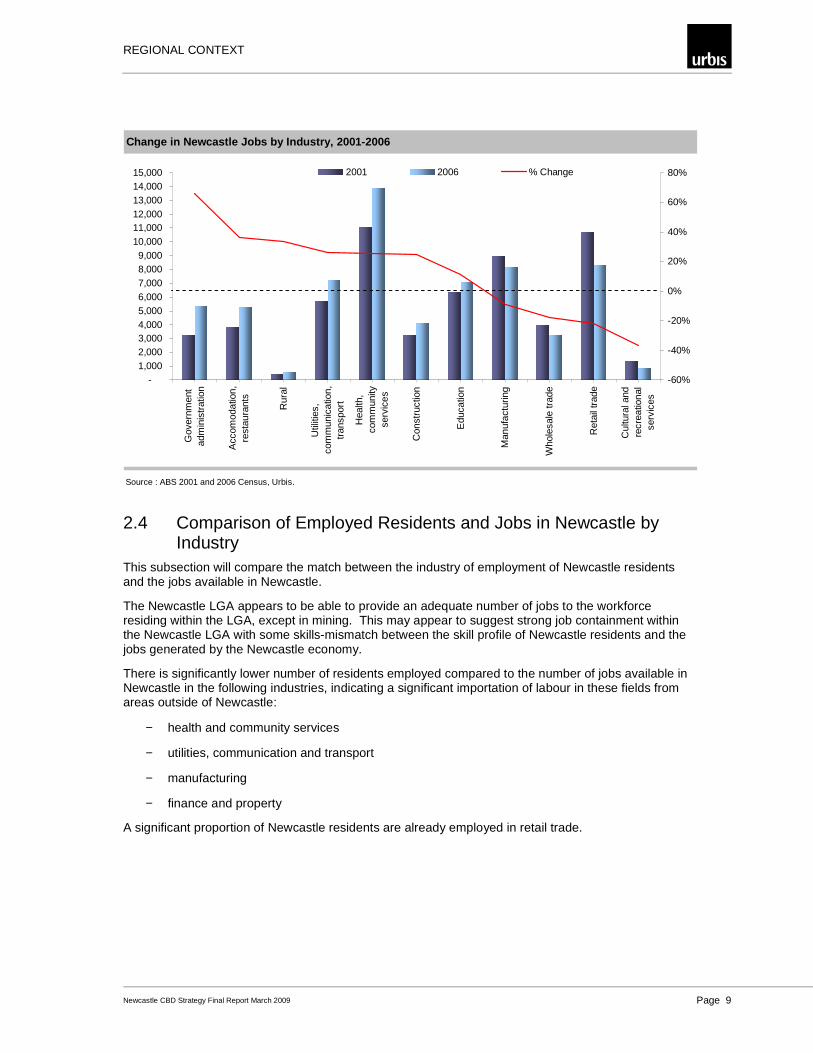
2.3.2 Source of Growth
Strong job creation in the Newcastle LGA was experienced between 2001 and 2006 in the following industries in descending order of importance:
− Government administration
− Accommodations and restaurants
− Rural
− Utilities, communication and transport
− Mining
− Health and community services
− Construction
Similar to the number of employed Newcastle residents, the number of jobs in retail trade in Newcastle also contracted between 2001 and 2006 by about a fifth.
REGIONAL CONTEXT
Newcastle CBD Strategy Final Report March 2009 Page 9
Change in Newcastle Jobs by Industry, 2001-2006
Source : ABS 2001 and 2006 Census, Urbis.
-1,0002,0003,0004,0005,0006,0007,0008,0009,000
10,00011,00012,00013,00014,00015,000
Gov
ernm
ent
adm
inis
trat
ion
Acc
omod
atio
n,re
stau
rant
s
Rur
al
Util
ities
,co
mm
unic
atio
n,tr
ansp
ort
Hea
lth,
com
mun
ityse
rvic
es
Con
stru
ctio
n
Edu
catio
n
Man
ufac
turin
g
Who
lesa
le tr
ade
Ret
ail t
rade
Cul
tura
l and
recr
eatio
nal
serv
ices
-60%
-40%
-20%
0%
20%
40%
60%
80%2001 2006 % Change
2.4 Comparison of Employed Residents and Jobs in Newcastle by Industry
This subsection will compare the match between the industry of employment of Newcastle residents and the jobs available in Newcastle.
The Newcastle LGA appears to be able to provide an adequate number of jobs to the workforce residing within the LGA, except in mining. This may appear to suggest strong job containment within the Newcastle LGA with some skills-mismatch between the skill profile of Newcastle residents and the jobs generated by the Newcastle economy.
There is significantly lower number of residents employed compared to the number of jobs available in Newcastle in the following industries, indicating a significant importation of labour in these fields from areas outside of Newcastle:
− health and community services
− utilities, communication and transport
− manufacturing
− finance and property
A significant proportion of Newcastle residents are already employed in retail trade.

REGIONAL CONTEXT
Newcastle CBD Strategy Final Report March 2009 Page 10
Comparison of Number Employed by Industry of Reside nts and Jobs in Newcastle LGA, 2006
Source: ABS Journey to Work Data; Urbis.
319
637
6,102
4,273
4,089
2,094
7,068
4,785
3,097
4,303
5,764
9,406
782
584
250
8,143
7,251
4,092
3,256
8,330
5,259
4,930
5,358
7,073
13,894
873
- 4,000 8,000 12,000 16,000
Rural
Mining
Manufacturing
Utilities, communication andtransport
Construction
Wholesale trade
Retail trade
Accomodation and restaurants
Finance and property
Government administration
Education
Health and community services
Cultural and recreationalservices
Newcastle LGA Residents' Industry of Employment Jobs in Newcastle LGA

REGIONAL CONTEXT
Newcastle CBD Strategy Final Report March 2009 Page 11
Comparison of Employment Shares by Industry of Resi dents and Jobs in Newcastle LGA, 2006
Source: ABS Journey to Work Data; Urbis.
0.6%
1.2%
11.6%
8.1%
7.8%
4.0%
13.4%
9.1%
5.9%
8.2%
10.9%
17.8%
1.5%
0.8%
0.4%
11.8%
10.5%
5.9%
4.7%
12.0%
7.6%
7.1%
7.7%
10.2%
20.1%
1.3%
0% 5% 10% 15% 20% 25%
Rural
Mining
Manufacturing
Utilities, communication andtransport
Construction
Wholesale trade
Retail trade
Accomodation and restaurants
Finance and property
Government administration
Education
Health and community services
Cultural and recreationalservices
Newcastle LGA Residents' Industry of Employment Jobs in Newcastle LGA
2.5 Job Containment Within the Newcastle CBD The employment information on the Newcastle LGA presented above appears to suggest strong job containment within the LGA. In contrast, the ABS Journey to Work data on the Newcastle CBD shows the opposite -- over 97% of Newcastle CBD workers live outside the CBD, which is not unexpected given the supply of housing in the CBD.
However, the majority of Newcastle CBD residents work within the CBD. Less than a third of Newcastle CBD residents work outside the CBD.
Within the Newcastle CBD, Honeysuckle and the northern part of Civic have the highest concentration of employment (37% of total jobs in Newcastle CBD), followed next by Newcastle East (34%) then Wickham and Newcastle West (29%).

REGIONAL CONTEXT
Newcastle CBD Strategy Final Report March 2009 Page 12
Map 2.1 – Journey to Work

REGIONAL CONTEXT
Newcastle CBD Strategy Final Report March 2009 Page 13
Map 2.2 – Employment Distribution in Newcastle CBD
REGIONAL CONTEXT
Newcastle CBD Strategy Final Report March 2009 Page 14
2.5.1 Mode of Travel
The 2.3 overleaf shows that Newcastle workers travel predominately to work by car, with only a relatively small proportion of workers utilising public transport. An approximately equal number of workers utilise the train and bus (700-800 per day). Only a small number of people catch the ferry to work from Stockton (100-200).

REGIONAL CONTEXT
Newcastle CBD Strategy Final Report March 2009 Page 15

REGIONAL CONTEXT
Newcastle CBD Strategy Final Report March 2009 Page 16
2.6 Conclusion In this section we looked at the broader economic context in which the Newcastle CBD catalyst projects are set against. The key points to note are:
� The total population in the Newcastle LGA is quite similar to that of the Sydney LGA. However, Sydney is significantly more densely populated.
� Newcastle residents are relatively disadvantaged on the following measures compared to Sydney residents:
− Per capita income
− Unemployment
− Labour force participate rate
− Educational attainment
� The Newcastle economy is quite diversified as evidenced by the employment data by industry
� While healthy level of employment growth was experienced in most industries in Newcastle, there has been a significant contraction in retail trade jobs between 2001 and 2006.
� The match between employed residents and jobs available in Newcastle LGA suggests strong job containment, most workers in the Newcastle CBD live outside the CBD.
� Most Newcastle CBD residents work in the local area.
� Within the Newcastle CBD, jobs are highly dispersed with most in Honeysuckle, northern parts of Civic, Wickham and Newcastle West. Newcastle East has the lowest concentration of jobs (7%).

WHAT MAKES A CBD WORK?
Newcastle CBD Strategy Final Report March 2009 Page 17
3 What Makes a CBD Work? This section will outline the key criteria which are considered to underpin the success of a vibrant and viable city centre and applies these factors to the case of Newcastle.
3.1 City Centre Criteria for Success The key principles which are considered to underpin the success of vibrant and viable city centre are outlined below. These principles should be considered in considering programs to revitalise the Newcastle CBD.
Scale - It is clearly important to understand the local market and its competitive environment to ensure the centre is of a sustainable scale and accommodates the appropriate range of products/services and store types to meet demand and create competitive advantage. The importance of a staged development in Newcastle should be critically based on the growth of the market over time.
The Newcastle CBD will ultimately develop further over a period of time. Any plan must be flexible to accommodate the inevitable changes that will occur as the market emerges. Nevertheless, in order to ensure a vital and vibrant city centre at any point in time, the core of the centre should have a human scale, in the following respects :
It should be no longer than around 400 metres, which is the typical maximum distance people are willing to walk in a single trip.
Building heights adjacent to the town centre core should not be so high that they effectively lose contact with street level.
Plazas and open spaces should be small enough that they do not break the continuity of an active street front or suggest lack of use.
The “core” area should become the focus for activities. Failure to do so will result in fragmentation and the centre vision will not be realised. A centre that is too big or spread out too thinly will not encourage human activity but rather breed a vacuous, vacant and unappealing space.
vs.
Good Practice
Central Focus in compact space
Poor Practice
Sprawling Space with lack of focus
Flexibility to Change – The economic environment is extremely dynamic, constantly changing to meet the expectations of sophisticated and fickle citizens. These changes are both supply and demand led. A fundamental consideration for any planned precinct is therefore its ability to accommodate change. It should be recognised that change does not generally take place instantly, but rather occurs gradually and incrementally. Centres therefore need to be adaptable to changing footprints customer needs.
In emerging markets staged development is a common occurrence for practical commercial reasons. A masterplanned and staged approach also ensures that centres can expand and evolve over time based on changing needs.

WHAT MAKES A CBD WORK?
Newcastle CBD Strategy Final Report March 2009 Page 18
Broad Role - City centres need to create the broadest role possible so as to satisfy a range of stakeholder needs in one location. It should facilitate maximise reasons for visit, length of stay, frequency of visit and amount spent.
Consideration should be given to the inclusion of various uses to complement and extend the role of the centre beyond retailing and employment. Such activities and uses, whilst may not necessarily be attractive commercially, serve to reinforce the credentials of the centre as a community focal point, adding value to other tenants. They are also uses which can occupy the least attractive space (e.g. dead pockets and fringe locations).
Nodes – As a general rule both retail and non-retail uses can be categorised as either “core” or “peripheral” uses within a centre.
The core uses are those which:
� are significant activity generators
� rely upon foot traffic flow
� tend to be regularly used
� tend to have cross-usage association with other uses
Core uses are therefore generally high intensity uses, some of which rely upon other activities for success. The creation of mutually beneficial commercial relationships is a key to successful, vibrant activity centres, and the co-location of core uses within centres is therefore of paramount importance.
Peripheral uses, on the other hand, are secondary functions, destination uses, trade related, and other non-commercial and non-retail facilities that add to the critical mass of the centre and its relevance as a community focal point. These types of uses are therefore secondary functions and low intensity uses which do not tend to be used in conjunction with other stores to anywhere near the same extent as core uses. Peripheral uses should therefore be encouraged in edge of centre locations and in secondary spaces.
Access, Connectivity and Circulation - CBDs need maximum accessibility to and within the site including attention to both vehicular and pedestrian circulation. A key imperative is to minimise vehicular and pedestrian conflict while maximising the degree of connectivity between surrounding uses. Linkages are therefore important to the optimal functioning of a city centre and fundamental to the design.
The following elements relate to the overall accessibility of a centre and how easy it is to use:
� location and presentation of carparks
� public transport nodes
� nature of edge uses
� pedestrian access
� movement patterns
In relation to connectivity, the primary objective should be to provide customers with choices that maximise convenience and enhance pedestrian traffic flow into various nodes from different directions, whilst at the same time channelling users into the high intensity nodes.
A five minute (400 metre) walking radius is the most comfortable distance for people to cover therefore design should encourage activity and nodes be accommodated within these distances from each other. It is noted that particular attention will have to be paid to the connection between the Hunter Street Mall / GPT Development and Civic, as the distance between these nodes is approximately 500 metres.

WHAT MAKES A CBD WORK?
Newcastle CBD Strategy Final Report March 2009 Page 19
Carparking is a critical issue and ultimately determines the success of a regional centre and its ability to serve a broad role. An ample provision of convenient carparking is required.
Good Practice
Walkable, connected nodes (at most 400m apart)
Poor Practice
Excessive distances between activity discourages walking and creates a disconnect
vs.
Create the “Place” – This essentially relates to all the attributes and features of the centre that result in it being incorporated into the daily lives of residents because it establishes a sense of community. The attributes and features range from architectural elements to continuity, security, treatment of spaces, and the overall ambience. The difference in value that results from place making is generally referred to as the “design dividend”.
Maximum visibility and signage exposure of the centre and its key components is required from thoroughfares and surrounding areas.
3.2 Suggested Developments in Newcastle CBD Building on the critical factors behind a successful town centre discussed above, the proposed precincts within the Newcastle CBD need to be considered along four key dimensions, namely: complementarity, commercial viability, land requirement and community goals/planning.
Complementarity – Complimentarity refers to whether a proposed development compliments existing facilities and uses in the centre, and adjacent service providers. Are there cross-usage opportunities between the proposed development and already existing facilities and services on site?
Commercial Viability – A proposed development must be commercially viable and sustainable. There must be a demonstrated or future need for the particular land use in question.
Land Requirement – A proposed land use must promote the use of the centre as a compact city and generate adequate usage intensity.
Community Goals/Planning – Lastly, one must ask if the proposed land use will add value to the community being in a particular location and whether the land use is consistent with best practice planning policies.
The key findings from this analysis point to the following key messages regarding suggested land use for the Newcastle CBD:
Residential and accommodation type land uses appears well suited to the periphery of the Newcastle CBD, particularly the eastern end with its frontage to the Pacific Ocean and the Wickham end, which is able to produce a significant level of development density. They complement existing facilities and services in the periphery of the centre, would be commercially viable and will add value to the community. This use at the periphery of the centre is also consistent with the need to keep the centre compact and should generate adequate usage intensity.

WHAT MAKES A CBD WORK?
Newcastle CBD Strategy Final Report March 2009 Page 20
The education and justice precincts appear suitable land uses for the Civic. These precincts will compliment the existing library and cultural uses in the Civic, add value to the community, are commercially viable and would be consistent with keeping the centre compact and promote pedestrian activity in the CBD and promote multi-purpose trips.
Tourism related uses such as accommodation are well located water fronts to capitalise on the CBDs greatest assets. Conferencing uses have a high degree of synergy with the proposed university uses and could work well with the education precinct. Cruise ship uses could be better located to relate to the proposed retail core and the Newcastle beaches, a potential location being Queens Wharf.
Most office type land uses appear suitable in central portions of the centre such as the Honeysuckle region and around Civic, tending towards the western side. They would compliment existing facilities and services in the periphery of the centre, would be commercially viable and would add value to the community.
Most retail related land uses considered appear suitable within the Newcastle CBD centre, with street front activated retail around Civic with higher order retailing potentially located around the traditional retail heart of the Hunter Street Mall (notably the GPT proposal). The various retail related land uses considered would compliment existing facilities and services and appear commercially viable. The proposed GPT regional shopping centre in the Newcastle Mall would have significant impacts on job creation and on the local economy, however it will need to be well connected from a pedestrian and public transport perspective to the Civic core.
3.3 Key Benefits of a Well Designed City Sustainable development and sustainability have become important concepts in urban planning. It is now widely recognized that current consumption and living habits may lead to problems such as the overuse of natural resources, ecosystem destruction, pollution, growing social inequality and large-scale climate change. As a result, many governments the world over, including in Australia, have begun to adapt land use policies for the development of sustainable and more compact cities.1
Wheeler (1998) suggests a definition for sustainable urban development as "development that improves the long-term social and ecological health of cities and towns." His framework on what would constitute a 'sustainable' city recognizes the need to build more compact and greener cities that utilize land and other non-renewable resources more efficiently and minimize negative externalities associated with increased urbanization such as traffic congestion and associated vehicular emissions.
Low-density urban sprawl is deemed to have become both socially undesirable and economically unsustainable. It is also highlighting the advantages of centres as central places.
Centres are generally a mix of different land uses co-located in a compact space that usually generates a high degree of pedestrian activity. Provided the centre is integrated accordingly, the co-location of tenants creates destinational appeal for comparative shopping. This provides a greater foot flow, higher potential to spend and positive spin off effects for all businesses in the centre.
Centres provide a platform for a more diverse range of office, residential, retail and hotel formats. Lifestyle changes and demographics are driving this need for diversity in offer. Consumers have shown an increasing desire to shop, work and live in areas that have a distinct community feeling. This is something that centres can provide when compact and highly visited nature.
The following is a summary of the key benefits of a well designed centre.
3.3.1 Agglomeration of Uses
Economic benefits from a managed approach to growth, via a centres policy, are principally generated through increased agglomeration, resource savings (such as lower travel times and distances) and
1 Stephen Wheeler. "Planning Sustainable and Livable Cities", 1998, ISBN 0-415-27173-8, Routledge, New York.

WHAT MAKES A CBD WORK?
Newcastle CBD Strategy Final Report March 2009 Page 21
more efficient use of infrastructure. Agglomeration leads to increased competition, collaboration and innovation among businesses from clustering.2
The benefits of concentrating economic activity within a certain geographical space are well known. For example, evidence of increase in productivity from agglomeration in the United States, the United Kingdom and in Europe has been documented. The doubling of population density in centres has been found to have led to a 5% increase in productivity in the US, 4% in Europe and 3.5% in the UK.3
Agglomeration is not simply an objective for governments. Agglomeration is driven by market forces. The concept of the shopping centre is testament to this. Throughout the world, retailers have traditionally co-located in single locations even where this would appear to increase competition.
3.3.2 Environmental Value
The NSW Centres Policy and others alike aim to proactively set out the broad spatial pattern of growth to provide certainty for public investment, while allowing flexibility for existing centres to grow and new centres to form.
This approach to managed growth helps to reduce emissions from travel by locating trip generating development in places that reduce the reliance on cars, encourage multi-purpose trips and provide suitable accessibility by public transport or on foot. Furthermore, a centres policy can result in more economic use of finite land resources than urban sprawl and in turn lower the extent of land use and have positive impacts on reducing greenhouse gas emission.
Again, environmental impacts from trips to the shops are generally externalised. Planning policy can be used to limit this externality.
3.3.3 More Cost Effective Use of Infrastructure and Accessibility
The use of urban growth boundaries (UGB) represents a good example of the planning system maximising use of infrastructure. As a city grows, population, employment and production all continue to increase. This leads to a necessary increase in the demand for land.
The introduction of an UGB does not necessarily limit the long term capacity of a city to grow. Generally UGBs change over time. A UGB is better utilised as a tool for staging growth, protecting future growth areas, and maximising access to both infrastructure and community services (including retail). By staging development, the cost of public goods can be accounted for, and more efficient use of current services and infrastructure can occur.
In order to ensure that required services are provided at minimum cost, staged geographical development needs to be ensured. The cost of infrastructure cannot be recouped by market driven prices; these are provided as a public good (e.g. street lights, roads). Infrastructure charges can be levied on development so as to employ a user pays principle. However, this does not necessarily result in market prices being paid. For this reason, the level of expenditure on infrastructure needs to be minimised for a given level of output so as to minimise the cost of the provision of public infrastructure (including the indirect cost of taxation).
3.3.4 Conclusion
The basis for a planned centres approach to growth at the macro level is sound. Some attempts have been made to quantify the net benefit of different aspects of a planned approach to growth. For example, the NSW Planning Department has suggested that in Sydney a substantial physical
2 NSW Department of Planning, 2005; SGS Economics and Planning.
3 A. Ciccone and R.E. Hall, “Productivity and the density of economic activity”, American Economic Review, 86 (1996); A. Ciccone, “Agglomeration effects in Europe”, European Economic Review 46 (2002); P. Rice and A.J. Venables, “Spatial determinants of productivity: analysis for the regions of Great Britain”, CEP Discussion Paper #642 (July 2004).

WHAT MAKES A CBD WORK?
Newcastle CBD Strategy Final Report March 2009 Page 22
infrastructure cost savings of around $20,000 per dwelling exist for urban consolidation over urban sprawl.4
A managed approach to growth can facilitate the agglomeration of services in centres which would encourage people to combine several activities and purposes in one trip. This can cut down their total number of trips. Activity centres can also be strategically located to cut down on the distances people need to travel. These both lead to less strain on transport infrastructure and could result in net savings and environmentally more sustainable development.
Whilst it is generally accepted that there are economic and social benefits in the creation of city centres, it should also be recognised that one model does not fit all. Land use plans or strategies based on theoretical approaches are likely to result in sub-optimal outcomes such as poor town centre development, changes and/or delays if not implemented properly. The discussion in the previous section outlined some of the criteria for success which can be applied to the master planning exercise for the Newcastle CBD.
4 Gillespie, R. (2004) Economic Analysis of Urban Form (App 2) for TEC Sustainability Report (Sydney).

NATIONAL AND INTERNATIONAL EXPERIENCES OF CBDS
Newcastle CBD Strategy Final Report March 2009 Page 23
4 National and International Experiences of CBDs
Metropolitan and regional cities both nationally and internationally have experienced rapid economic and demographic change. Some CBDs have been re-building, renewing and revitalising their communities and infrastructure to respond to this change. Meanwhile, other cities have remained stagnant, and as a result have experienced fragmentation, deterioration and economic downturn. It is valuable to look to the experiences of other CBDs, both metropolitan and regional, when developing strategies to revitalise Newcastle’s CBD. These experiences provide insight into concepts and ideas that may have potential to contribute or impede on the revitalisation of Newcastle’s CBD.
4.1 Sydney Sydney is Australia’s most populous city, and has gained international status as a vibrant, metropolitan hub with world-class retail, entertainment and arts and cultural offerings.
Sydney CBD is testament to the concept of agglomeration. The CBD is dense, compacted into a space of two kilometres, as compared to Newcastle’s four kilometre CBD.
There are well defined nodes within Sydney CBD including retail, entertainment, and arts and culture. The retail core which is focused around Pitt, George and Castlereagh Streets forms the heart of the city, with other precincts wrapping around it. Retail nodes outside the core retail precinct are targeted at servicing the needs of CBD workers. These are largely located around the transport hubs such as Wynyard, Town Hall and Circular Quay.
The proposed GPT development in Newcastle is different to Sydney CBD’s retail hub in terms of its location within the CBD. While Sydney’s retail precinct is located in a central position and forms a ‘heart’ to the CBD, the GPT site is on the periphery of the CBD. As a result, we foresee that the retail precinct in Newcastle may not have the same relative level of prominence. It is likely that the precincts occupying a more central position in Newcastle (for example, in Civic) will play a more important role in creating a vibrant CBD.
The various university campuses which are located in close proximity to Sydney CBD have resulted in a large student population, especially international students, occupying residential space in the CBD. This large international student population has provided economic benefit to surrounding retail and services businesses, and has contributed to the development of a diverse resident and worker population in the CBD at the street level.
There is no dedicated legal precinct in Sydney CBD, with the state and federal law courts being located in separate locations. However, the courts are of a large enough scale to independently create vibrant activity centres. In contrast Newcastle’s state and federal law courts would need to be co-located in order to achieve scale, and thus create activity.
The core arts and cultural precinct in Sydney – comprising landmarks such as the Opera House, Art Gallery of NSW, Botanic Gardens, Gallery of Modern Art and Museum of Contemporary Art – is a vibrant hub, which is well connected to the CBD, allowing tourists to easily move between the precincts.

NATIONAL AND INTERNATIONAL EXPERIENCES OF CBDS
Newcastle CBD Strategy Final Report March 2009 Page 24
Comparison Between Newcastle and Sydney CBDs
NATIONAL AND INTERNATIONAL EXPERIENCES OF CBDS
Newcastle CBD Strategy Final Report March 2009 Page 25
4.2 Wollongong With a population of over 280,000 Wollongong is the third largest city in NSW, After Sydney SD and Newcastle, and the ninth largest in Australia.
The Illawarra Regional Strategy sets the framework for Wollongong’s economic and social development over the next 25 years. In terms of employment, the goal is for 10,000 jobs to be created in Wollongong over the period –the same target set for Newcastle. The intention is for the large majority of these jobs to be located within the city centre, and the diverse precincts immediately surrounding it.
Wollongong’s CBD is significantly smaller than Newcastle’s, spanning just two kilometres, resulting in a greater level of density.
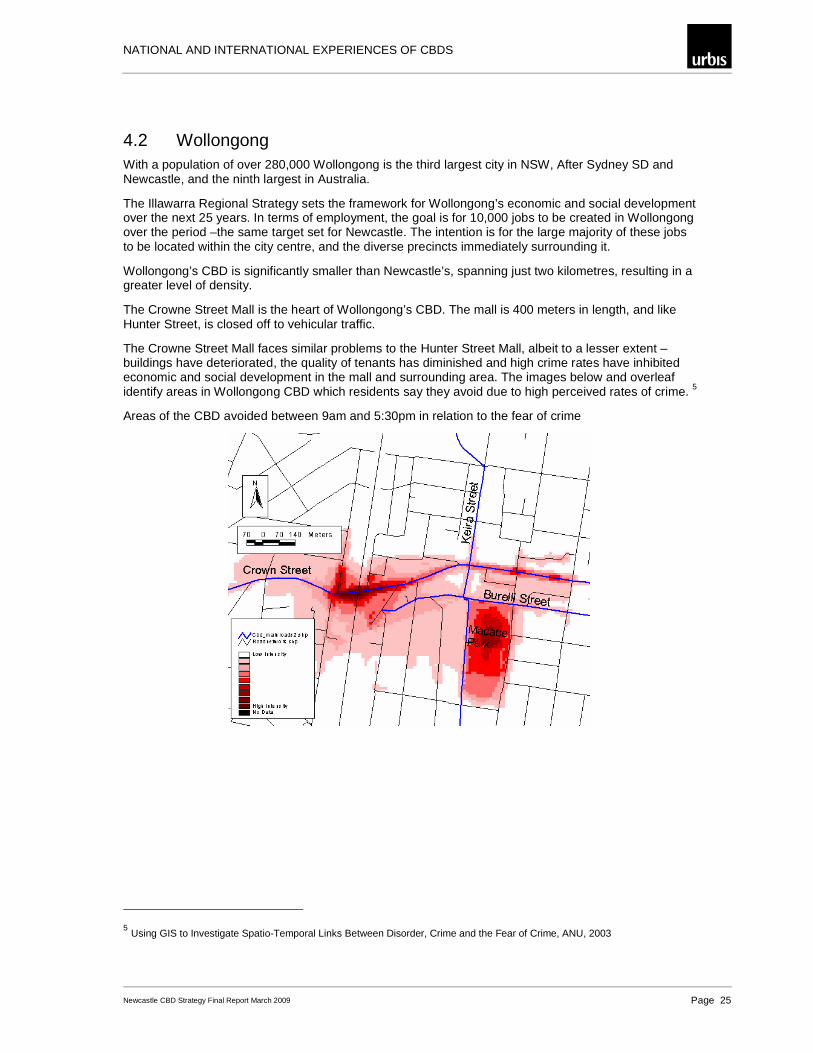
The Crowne Street Mall is the heart of Wollongong’s CBD. The mall is 400 meters in length, and like Hunter Street, is closed off to vehicular traffic.
The Crowne Street Mall faces similar problems to the Hunter Street Mall, albeit to a lesser extent – buildings have deteriorated, the quality of tenants has diminished and high crime rates have inhibited economic and social development in the mall and surrounding area. The images below and overleaf identify areas in Wollongong CBD which residents say they avoid due to high perceived rates of crime. 5
Areas of the CBD avoided between 9am and 5:30pm in relation to the fear of crime
5 Using GIS to Investigate Spatio-Temporal Links Between Disorder, Crime and the Fear of Crime, ANU, 2003

NATIONAL AND INTERNATIONAL EXPERIENCES OF CBDS
Newcastle CBD Strategy Final Report March 2009 Page 26
Areas of the CBD avoided after 7pm in relation to the fear of crime
GPT’s proposed $311 million upgrade of the Crowne Street mall and Wollongong Central Shopping Centre has been put on hold till at least 2012. There is debate amongst business and community groups as to whether the mall should be opened up to vehicular traffic. Council has set aside around $2.5 million for the project in case it opts to go ahead, though the estimated cost for the project is $15 million.
The University of Wollongong is a successful and well-regarded university with a population of 22,000 students. The campus is located three kilometres from Wollongong CBD. Although not right in the CBD, it is close relative to UoN’s distance from Newcastle CBD. The large international student population – which represents 38% of the total student population – could be attributed to the central location of the campus, which makes for a more cosmopolitan and exciting university experience for international students, as opposed to a campus which is located 12 kilometres from the CBD, like UoN. This provides an indication of the potential ability of a UoN CBD campus to attract more international students.

NATIONAL AND INTERNATIONAL EXPERIENCES OF CBDS
Newcastle CBD Strategy Final Report March 2009 Page 27
Comparison Between Newcastle and Wollongong CBDs

NATIONAL AND INTERNATIONAL EXPERIENCES OF CBDS
Newcastle CBD Strategy Final Report March 2009 Page 28
4.3 Brisbane Despite spanning a large area, Brisbane has achieved density and a high level of activity in a set of well defined precincts. The CBD is very walkable, and serviced by a good transport system which delivers people to the centre of the CBD. Extensive parking supply also makes the CBD accessible.
Queen Street Mall is the main retail precinct in Brisbane and is the metaphoric and geographic heart of the CBD. It is generally regarded as the most successful retail mall in Australia, having achieved consistently high rents, low tenant turnover, and attracting strong anchor tenants including Myer and David Jones.
Brisbane’s cultural precinct is located in Southbank and contains the Gallery of Modern Art (GOMA), Queensland Art Gallery, Queensland Museum, Queensland Performing Arts Centre and the State Library. This vibrant precinct is well connected to the retail precinct, allowing ease of access for locals and tourists alike, albeit via a bridge over the Brisbane River.
The legal precinct consists of the Supreme, Magistrates and Federal Courts, Police Headquarters, barristers’ chambers and law firms. The precinct is located along North Quay, and adjoins the Civic Precinct which contains the Brisbane City Council and Council Chambers.
Thousands of students studying at Queensland University of Technology (QUT) bring a high level of diversity and activity to the CBD. A large student population reside in accommodation within the CBD.

NATIONAL AND INTERNATIONAL EXPERIENCES OF CBDS
Newcastle CBD Strategy Final Report March 2009 Page 29
Comparison Between Newcastle and Brisbane CBDs

NATIONAL AND INTERNATIONAL EXPERIENCES OF CBDS
Newcastle CBD Strategy Final Report March 2009 Page 30
4.4 Townsville Townsville’s CBD is home to more than 1,100 businesses and 14,000 employees contributing over $1 billion annually to the economy of Northern Queensland. Throughout the eighties and nineties Townsville CBD experienced intense social and economic change, resulting in the deterioration and loss of focus of the city’s CBD. Local conditions affecting the Townsville CBD included:
• Growth of major suburban shopping centres
• Relocation of government and commercial offices to suburban centres
• Obsolete and poorly performing land uses
• A piecemeal approach to addressing the problems
• A neglected city attracted crime
• Tourist facilities affected by the lack of funding of quality public infrastructure
• Movement of the local economy from manufacturing to technology and service industries
Since 2000 Townsville CBD has been redeveloped in accordance with the CBD Masterplan. The Masterplan was reviewed in 2008, with the focus being on redeveloping the Flinders Street Mall, incorporating major residential development, and improving transport and pedestrian access. The mall redevelopment is yet to take place (refer to section 5.1.7).
Like Newcastle, Townsville’s CBD is very elongated, stretching over three kilometres. Townsville has, however, addressed this issue by creating a set of well defined precincts. The retail and commercial precincts are the key activity hubs located in the centre of the CBD. The precincts are well connected by pedestrian walkways, and are accessible by public transport or car.

NATIONAL AND INTERNATIONAL EXPERIENCES OF CBDS
Newcastle CBD Strategy Final Report March 2009 Page 31
Comparison Between Newcastle and Townsville CBDs

NATIONAL AND INTERNATIONAL EXPERIENCES OF CBDS
Newcastle CBD Strategy Final Report March 2009 Page 32
4.5 Geelong Geelong is located about 75km south west of Melbourne. It is Victoria’s largest regional city with a population base of around 200,000 and a labourforce of almost 100,000. It is a leading commercial and industrial centre for Victoria’s south-west and is home to about 10,000 business enterprises including a number of multinationals such as Ford Motor and Alcoa World Alumina.
The Geelong economy has experienced considerable diversification over the past decade with sectors such as retailing, hospitality, health, research, biotechnology and education providing increasing employment opportunities. Today, manufacturing, retail trade, health care, construction and education combined provide over half of the jobs in the area.
Geelong is an attractive location for commercial and industrial activity because of its favourable location, lifestyle appeal, and extensive infrastructure and transport links.
Similar to Newcastle, Geelong is a waterfront CBD. However, the Geelong CBD is significantly more compact compared to the Newcastle CBD. It is deeper north-south and shorter east-west – about a third the length of Newcastle. This makes the agglomeration of activities easier and facilitates the creation of a walkable CBD. Although even in Geelong the links and extent of cross-usage between the restaurants and cafes by the water and the rest of the CBD are relatively weak.
The Geelong CBD is quite consistent with a number of the best practices described in Section 3. It serves quite a broad role for the region and is able to satisfy a range of stakeholder needs in one location. This facilitates maximum reason for visit, length of stay, frequency of visit and amount spent.
High activity generators that rely heavily on foot traffic, tend to be used regularly and have cross-usage associations with other uses such as retail, education and cultural facilities are located at the core of the CBD and in close proximity to each other.
Geelong’s commercial and retail centre radiates out from Moorabool Street which includes major shopping centres Market Square and Westfield Bay City Plaza on the east and a variety of restaurants and cafes on the west of Moorabool Street. The retail and commercial activities are well agglomerated around Moorabool Street and are all within 400 meters. This facilitates walking, multi-purpose visits and vibrancy.
The cultural precinct is clearly on the western end of Little Malop Street with cafes, studios and art galleries all within walking distance of each other including the Geelong Performing Arts Centre and the Geelong Art Gallery. This precinct is also within a five minute walk from the retail precinct.
The Gordon Institute of TAFE is located on the western edge of the cultural precinct.
Deakin University’s Geelong Waterfront campus is on the foreshore of Corio Bay. It caters to more than 1,200 students. Originally built in 1893, the buildings have been extensively renovated to create a modern and impressive campus. The Deakin Geelong Waterfront Campus is centrally located and within walking distance of the restaurants and cafes by the foreshore, retail precinct to the southeast and cultural precinct to the southwest. This clearly contributes to the vibrancy of the Geelong CBD.
Secondary functions, destination uses, trade related and non-retail facilities such as industrial and related commercial facilities, and hospitals are rightly located in the periphery of the CBD because they are low intensity uses which do not tend to be used in conjunction with other facilities nowhere near the same extent as core uses.
Similar to Newcastle, Geelong has a strong regional role in terms of healthcare. A number of large hospitals such as Geelong Hospital, St John of God Hospital and Geelong Private Hospital are agglomerated around the southern end of the CBD.
Most industrial sites and associated commercial buildings are located west of the cultural precinct or east of the retail precinct at the edges of the CBD.

NATIONAL AND INTERNATIONAL EXPERIENCES OF CBDS
Newcastle CBD Strategy Final Report March 2009 Page 33
Comparison Between Newcastle and Geelong CBDs

DETAILED ASSESSMENT OF CATALYST PROJECTS
Newcastle CBD Strategy Final Report March 2009 Page 34
5 Detailed Assessment of Catalyst Projects
This section will looks at the potential economic benefits of the catalyst precincts which have been identified as having the potential to revitalise the Newcastle CBD.
Input-Output (I-O) tables produced by the ABS in 1996/1997 have been utilised to estimate the employment and production output that would result from the projects. Therefore, it is assumed that the industrial structure of the Australian economy has remained unchanged since this period which directly affects the accuracy of our predictions.
The investment in one type of economic activity does not produce economic outcomes and employment for that one transaction alone. There will be supplementary benefits that flow through other sectors of the economy which the input-output multipliers attempt to capture.
The economic benefit that this section analysed is in terms of employment and output – the increased number of jobs or level of production resulting from increased activity within the industry in response to the initial stimulus and added demand derived from increased consumption in the household sector as a result of wages and salaries derived from this economic activity.
These supplementary effects will be captured by an output multiplier which represents the economic impact of an increase in employment or production in one industry on all others.
It is important to note that the employment and output multipliers are not additive but are rather two ways of looking at potential economic impacts. The first looks at the associated impacts of the development on job creation both directly and indirectly. The later looks at demand for additional output generated by the development directly and flow-on effects on output in other sectors of the economy.
A detailed explanation of the I-O methodology is contained in appendix A.
5.1 Retail Precinct GPT is proposing to invest approximately $650 million (in 2008$) in a new regional shopping centre to be located in the Newcastle CBD.
This will comprise the following:
− 54,000 -57,000 sq.m of higher order retail floorspace
− 10, 000 sq.m. of high quality commercial offices
− 100 -120 apartment units
5.1.1 Employment
The GPT proposed regional shopping centre is forecasted to result in the creation of an additional 9,500 total jobs in direct and indirect employment within the Newcastle LGA.
− The development is expected to generate a total of 5,300 jobs directly including around 4,400 jobs within the Newcastle LGA.
� About 2,400 workers annually are expected to be required by the proposed GPT shopping centre if it goes ahead. About 10% of these jobs are expected to be transferred from existing jobs resulting in an approximate net 2,200 jobs being generated annually in retail trade.
� About 3,000 new temporary direct jobs are expected to be created in constructing the shopping centre with about 30% expected to accrue outside the Newcastle LGA.

DETAILED ASSESSMENT OF CATALYST PROJECTS
Newcastle CBD Strategy Final Report March 2009 Page 35
− An additional 5,000 jobs are expected to be generated by the GPT development in indirect employment.
Direct Employment Impact of GPT Proposal Table x
Employment Proposed CentrePer '000 Sq.m
Type of Use Industry GLA EmploymentAverage (Sq.m) (Persons)
Department Store 27.6 30,000 828
DDS(s) 23.5 7,500 176Supermarket(s) 40.8 3,800 155
Mini-Majors 23.5 5,495 129Specialty Shops 60.7 10,205 619
Total Retail 57,000 1,908Commercial Offices 50.0 10,000 500100-120 Apartments 0.0 8,400 0
External Tenants 40.0 0
Total Property 2 75,400 2,408
1. Takes into account reduced vacancies2. Includes non-retail and external components. Excludes additional management, cleaning & security staffSource : Urbis
Additional1
Job Creation Impact of GPT Proposal on Newcastle LG A1 Table x
SupplierDirect Newcastle LGA's Employment Total New
Development Option/ Employment Share of Multiplier Newcastle JobsType of Employment Direct Employment Effects
Construction Phase2 3,154 2,208 3,475 5,683Employment Increase3 2,167 2,167 1,725 3,892
Total 5,321 4,375 5,200 9,575
1. Total Employment - full-time, part-time and casual2. Indicates the estimated number of jobs over the life of the construction project plus ongoing multiplier effects.Jobs are for the equivalent of one year of employment. Assumes 30% of jobs generated will accrue outside the Newcastle LGA3. Indicates the estimated number of ongoing jobs as a result of the proposed expansion (ie the floorspace increase)Assumes 10% employment transfer from existing jobsSource : Urbis
5.1.2 Economic Output
An alternative way of gauging the flow-on effects of the GPT proposed development is in terms of output.
The regional shopping centre, offices and residential development proposed by GPT for the Newcastle CBD is forecasted to result in over $2 billion worth of flow-on effects to the national economy in terms of additional output.
These supplementary effects will be captured by an output multiplier which represents the economic impact of an increase in production in one industry on all others. The total economic benefit resulting from one transaction is comprised of a variety of multipliers which can be explained as follows:
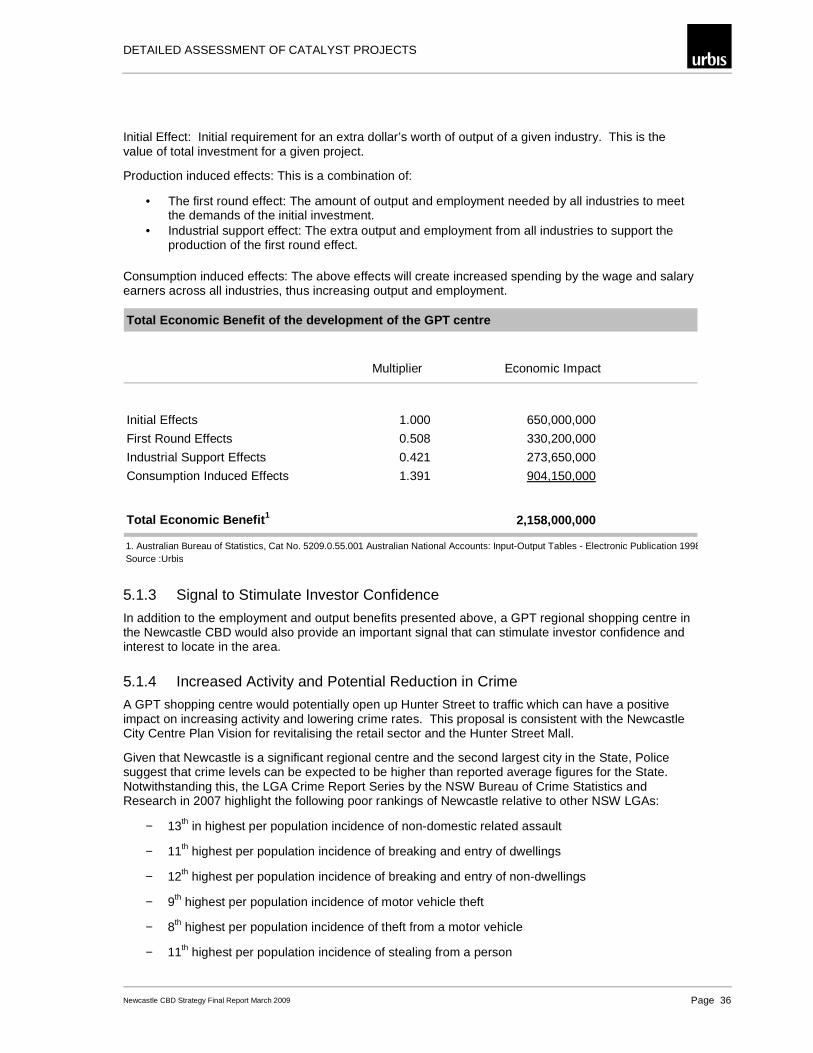
DETAILED ASSESSMENT OF CATALYST PROJECTS
Newcastle CBD Strategy Final Report March 2009 Page 36
Initial Effect: Initial requirement for an extra dollar’s worth of output of a given industry. This is the value of total investment for a given project.
Production induced effects: This is a combination of:
• The first round effect: The amount of output and employment needed by all industries to meet the demands of the initial investment.
• Industrial support effect: The extra output and employment from all industries to support the production of the first round effect.
Consumption induced effects: The above effects will create increased spending by the wage and salary earners across all industries, thus increasing output and employment.
Total Economic Benefit of the development of the GP T centre
Multiplier Economic Impact
Initial Effects 1.000 650,000,000
First Round Effects 0.508 330,200,000
Industrial Support Effects 0.421 273,650,000
Consumption Induced Effects 1.391 904,150,000
Total Economic Benefit 1 2,158,000,000
1. Australian Bureau of Statistics, Cat No. 5209.0.55.001 Australian National Accounts: Input-Output Tables - Electronic Publication 1998-99Source :Urbis
5.1.3 Signal to Stimulate Investor Confidence
In addition to the employment and output benefits presented above, a GPT regional shopping centre in the Newcastle CBD would also provide an important signal that can stimulate investor confidence and interest to locate in the area.
5.1.4 Increased Activity and Potential Reduction in Crime
A GPT shopping centre would potentially open up Hunter Street to traffic which can have a positive impact on increasing activity and lowering crime rates. This proposal is consistent with the Newcastle City Centre Plan Vision for revitalising the retail sector and the Hunter Street Mall.
Given that Newcastle is a significant regional centre and the second largest city in the State, Police suggest that crime levels can be expected to be higher than reported average figures for the State. Notwithstanding this, the LGA Crime Report Series by the NSW Bureau of Crime Statistics and Research in 2007 highlight the following poor rankings of Newcastle relative to other NSW LGAs:
− 13th in highest per population incidence of non-domestic related assault
− 11th highest per population incidence of breaking and entry of dwellings
− 12th highest per population incidence of breaking and entry of non-dwellings
− 9th highest per population incidence of motor vehicle theft
− 8th highest per population incidence of theft from a motor vehicle
− 11th highest per population incidence of stealing from a person
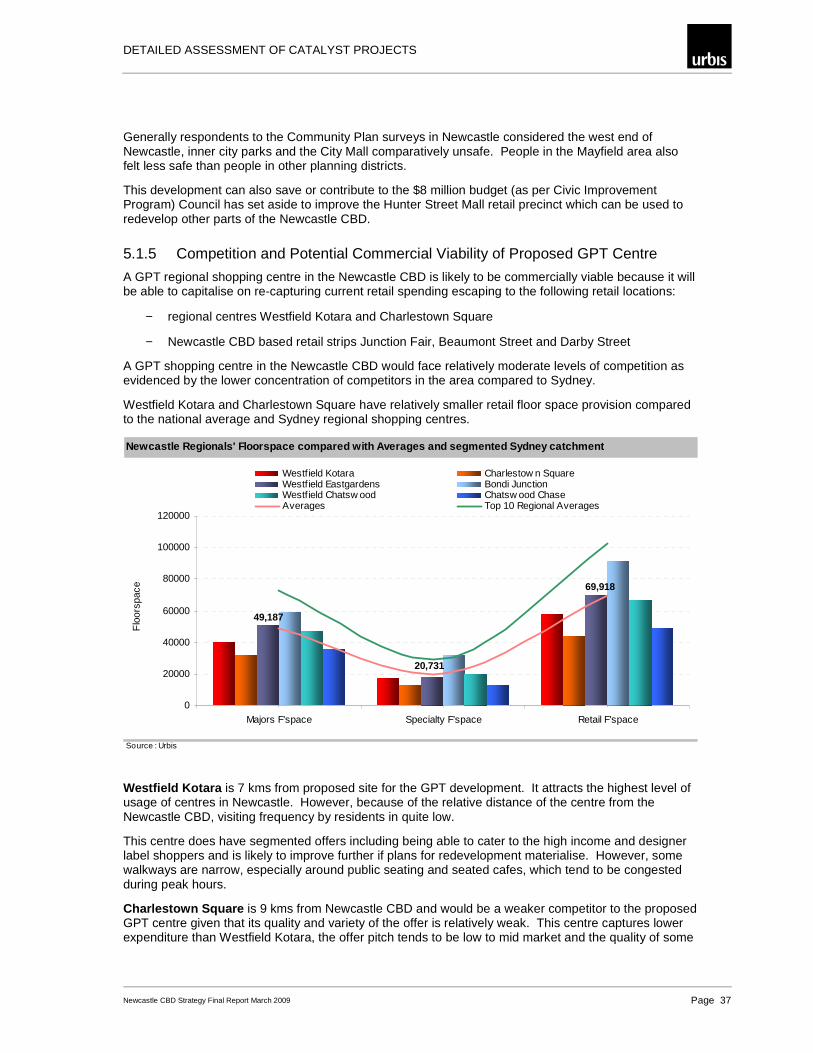
DETAILED ASSESSMENT OF CATALYST PROJECTS
Newcastle CBD Strategy Final Report March 2009 Page 37
Generally respondents to the Community Plan surveys in Newcastle considered the west end of Newcastle, inner city parks and the City Mall comparatively unsafe. People in the Mayfield area also felt less safe than people in other planning districts.
This development can also save or contribute to the $8 million budget (as per Civic Improvement Program) Council has set aside to improve the Hunter Street Mall retail precinct which can be used to redevelop other parts of the Newcastle CBD.
5.1.5 Competition and Potential Commercial Viability of Proposed GPT Centre
A GPT regional shopping centre in the Newcastle CBD is likely to be commercially viable because it will be able to capitalise on re-capturing current retail spending escaping to the following retail locations:
− regional centres Westfield Kotara and Charlestown Square
− Newcastle CBD based retail strips Junction Fair, Beaumont Street and Darby Street
A GPT shopping centre in the Newcastle CBD would face relatively moderate levels of competition as evidenced by the lower concentration of competitors in the area compared to Sydney.
Westfield Kotara and Charlestown Square have relatively smaller retail floor space provision compared to the national average and Sydney regional shopping centres.
Newcastle Regionals' Floorspace compared with Avera ges and segmented Sydney catchment
Source : Urbis
69,918
20,731
49,187
0
20000
40000
60000
80000
100000
120000
Majors F'space Specialty F'space Retail F'space
Flo
orsp
ace
Westfield Kotara Charlestow n SquareWestfield Eastgardens Bondi JunctionWestfield Chatsw ood Chatsw ood ChaseAverages Top 10 Regional Averages
Westfield Kotara is 7 kms from proposed site for the GPT development. It attracts the highest level of usage of centres in Newcastle. However, because of the relative distance of the centre from the Newcastle CBD, visiting frequency by residents in quite low.
This centre does have segmented offers including being able to cater to the high income and designer label shoppers and is likely to improve further if plans for redevelopment materialise. However, some walkways are narrow, especially around public seating and seated cafes, which tend to be congested during peak hours.
Charlestown Square is 9 kms from Newcastle CBD and would be a weaker competitor to the proposed GPT centre given that its quality and variety of the offer is relatively weak. This centre captures lower expenditure than Westfield Kotara, the offer pitch tends to be low to mid market and the quality of some

DETAILED ASSESSMENT OF CATALYST PROJECTS
Newcastle CBD Strategy Final Report March 2009 Page 38
areas is poor. However, current redevelopment the centre which may address some or all of these issues.
The Junction and Beaumont Street are within 3 km of the proposed GPT site. They are more frequented by those with high incomes from the local area. In contrast to the regional shopping centres, customers tend to visit these strips more often (once a week). However, the offer is a mix of poorly presented stores and high quality fashion boutiques.
The Darby Street retailers are about a km from the proposed GPT site. This area is more of a café and restaurant precinct with not much retail offer aside from some boutique retailers. Therefore, there can be potential significant cross-uses potential between the GPT centre and Darby Street restaurants and cafes, particularly if strong pedestrian connections are established.

DETAILED ASSESSMENT OF CATALYST PROJECTS
Newcastle CBD Strategy Final Report March 2009 Page 39

DETAILED ASSESSMENT OF CATALYST PROJECTS
Newcastle CBD Strategy Final Report March 2009 Page 40
5.1.6 Relative Strengths and Weaknesses of Newcastle CBD as a Retail Location
The Newcastle CBD as a location for a retail precinct offers the following strengths:
− Newcastle LGA already has a large share of retail employment – a solid base to build on.
− CBD workers under-utilizing the Hunter Street mall area during the working week.
− Lack of strong and closely located competition for retail, particularly to the north and west.
At the same time, the following weaknesses are worth noting:
− Retailers do better when co-located with other retailers. However, there is currently a low agglomeration of retail offer in the Newcastle CBD.
− The Newcastle CBD is elongated in shape. Therefore, making it difficult to walk from one end to the other.
− Competitive strengths of Westfield Kotara and Charlestown Square are likely to improve if their redevelopment and expansion plans go ahead.
5.1.7 The Importance of Hunter Street Mall Redevelopment
Regardless of whether GPT progresses with its development, redevelopment of Hunter Street Mall is critical to improving the performance, in terms of turnover and vibrancy, of the Hunter Street retail precinct. We have drawn on experiences of other CBDs, including Townsville, Rockhampton Southport, Coffs Harbour and Blacktown, to identify the benefits that could be expected from a mall redevelopment.
The reconfiguration case studies examined all involved designs aimed at facilitating the reintroduction of “calmed” traffic to the malls. Other common attributes include:
• the retention of wide footpaths conducive to the attraction of uses characterised by an active frontage (e.g. Alfresco dining)
• the use of restricted parking arrangements which encourage enhanced customer and pedestrian turnover and accessibility. (e.g. short term parking of half hour duration which is actively enforced by Council, has been very successful in the Southport example).
• Removal of visual and physical clutter to improve pedestrian flow, restore sightlines and enhance opportunities for casual surveillance;
• the use of a high standard furniture, fixtures and beautification works to enhance pedestrian amenity and distinguish pedestrian, vehicular and/or shared use areas
The relevant Local Government has typically taken responsibility for the capital funding of mall reconfiguration works, with expenditure recouped through the introduction of (or increase in an existing) benefited area levy. The quantum of funding required is site specific and varies dependant upon the extent of construction/reconfiguration works involved. Comparison of case studies examined generally indicates that pedestrian malls have contributed to significant increases in shop and office vacancy. In the first instance this appears to be related to reduced accessibility and the corresponding decline in pedestrian traffic and business performance. In all case studies examined, on-going declines in occupancy were exacerbated by associated problems of poor design (e.g. Cluttering, loss of sightlines), deterioration tenancy mix and the common emergence of social problems including crime and anti social behaviour. Mall reconfiguration typically contributes to reductions (in some cases sizeable reductions) in vacancy, initially by enhancing vehicular access, parking, pedestrian numbers and street activity, and ultimately through corresponding improvements in business performance, capital values and rental returns. While some case studies exhibit trends of rapid occupancy increase (e.g. Coffs Harbour), more typically significant decreases in vacancy are realised within 12 months to two years following the completion of works, often following an initial period of market and community familiarisation during which only a limited reductions in vacancy are evident.

DETAILED ASSESSMENT OF CATALYST PROJECTS
Newcastle CBD Strategy Final Report March 2009 Page 41
Tenancy mix and composition within case studies examined exhibits general trends of deterioration with most mall areas being characterised by a decline in the quality and depth of merchandise available and growth in the number of lower tier tenants (e.g. Second hand dealers, $2 Shops). In the case studies examined this has been partly due to external trends, including competition from competing centres, rationalisation with the banking and financial sector, and the shift of retail anchors to suburban centres. The case studies and literature reviewed identify a clear correlation between the weakening of traditional traders and services offered within a shopping street after the pedestrianisation of the street. Mall reconfiguration is typically accompanied by a change in tenancy mix involving an increase in niche retailing, personal services and entertainment uses (e.g. restaurants/alfresco dining). The nature of uses attracted to reconfigured malls both reflect and contribute to increased street and pedestrian activity. Rental ranges within case studies examined reflected a trend increase in line with reductions in vacancy, improving property values and increased competition for available floorspace. The upward pressure on rental returns is often influenced by the extent of vacant space at the time of reconfiguration. In this regard the take up of existing spare capacity will often delay rental increases as supply initially either exceeds or matches demand. As available supply diminishes, competition increases upward pressure on rental levels. A rise in rental rates is also typically indicative of increased business turnover reflected through the re-negotiation of lease terms. Case studies completed some time ago such as Blacktown and Southport demonstrate that the passage of time and improvement in associated economic indicators have ultimately contributed to increasing rental returns. All case studies examined exhibit trends of declining property values during the life of the mall. This is typically associated with the gradual decline in economic performance, a reduction in demand and competition for available floorspace, falling rentals and corresponding reductions in premise maintenance and upkeep. Sales evidence in centres examined (including Townsville) reflect increasing yields on sale which indicate a market perception of reduced value and increased investment risk. Property values can be seen to have generally improved following mall reconfiguration in response to improved market demand and business performance. Not unlike rentals, values typically remain constant in the short term before improvement in associated fundamentals (business turnover, decreasing vacancy) contributes to increases in underlying land value. Case studies examined and associate research have confirmed that Mall areas suffer from a both a perceived and an actual lack of safety and security. Such problems are commonly highlighted by an increasing incidence of crime and anti-social behaviour (e.g. vagrancy, violence, public drunkenness etc). Notwithstanding that in many cases actual crime rates may not be as high as perceived by the community, the fear of crime is often just as important, given that it may influence people’s behaviour and the amenity of a space. Certain physical features are considered to foster crime and anti-social behaviour in mall environments. These include:
• The lack of street activity arising from the absence of vehicular traffic and reduced pedestrian numbers;
• Access and parking availability problems often not encountered at competing stand-alone centres.
• A declining tenancy mix which contributes to a general lowering of the public’s perception of the quality of the shopping environment;
• Aspects of physical design that contribute to a physically “cluttered” environment including often inappropriately located buildings and structures;
• The loss of sightlines and opportunities for casual surveillance; • Areas of both formal and informal seating encourage ‘undesirables’ to loiter in Malls for
extended periods of time. It is difficult to dispute that mall reconfiguration involving the re-introduction of calmed traffic has in all cases examined contributed to notable (and in some cases significant) improvement in the social performance of the former mall area. This is primarily attributable to:
• Increased levels of pedestrian and vehicular activity;

DETAILED ASSESSMENT OF CATALYST PROJECTS
Newcastle CBD Strategy Final Report March 2009 Page 42
• In conjunction the reintroduction of traffic, the redesign of the area to remove obsolete structures, restore sightlines and improve opportunities for casual surveillance (by pedestrians and vehicles);
• The ability of redesigned areas to attract new uses including niche retailing and alfresco dining which make a positive contribution to street activity;
• The need for design which more clearly identifies public and private areas; • Improved standards of landholder investment in maintenance and refurbishment in line with
enhanced economic performance. The case studies are documented below and overleaf. Townsville, Northern QLD
Townsville’s CBD, and in particular Finders Street, has experienced a significant loss of civic and retail amenity over the last decade. Constructed in 1981, the Flinders Mall is focused on the Townsville retail core between Denham Street (north) and Stanley Street (south). The Flinders Mall extends a total of approximately 430 metres and is slightly longer and wider than the Queen Street Mall in Brisbane. There are approximately 230 retail tenancies and 80 commercial office tenancies that have frontage to the mall. Despite some initial success, the long term trends for the Mall have been declining patronage, investment and commercial interest. Land use within the mall predominately comprises retail and commercial premises interspersed with entertainment and community uses. Since the mid to late 1980’s, there have been growing concerns centred on the perceived demise of the Mall as a viable and functionally relevant retail, commercial, aesthetic and social environment. In 1994 David Jones, the Mall’s anchor tenant, vacated their CBD premises and the Townsville market. This had a major negative impact on the mall and retail tenants and sparked a major decline in many aspects of Townsville’s CBD retail function. Vacancy rates for retail properties fronting the mall have ranged from 25-30% over the last few years, with office accommodation immediately adjacent to the mall having a vacancy approaching 40% over the period. Reasons for the substantial increase in vacancy levels are reportedly:
� Relocation of major tenants from the CBD to new enclosed air conditioned shopping centres;
� Loss of David Jones as a major tenant in 1994;
� Reluctance on behalf of retailers to duplicate tenancies between major regional shopping centres in the Townsville suburbs and the CBD;
� The high proportion of commercial and retail space which in its present form is functionally obsolete, and does not match the requirements of higher tier commercial and retail tenants;
� A decline in the quality and range of available merchandise;
� Perception that the mall is no longer safe associated with anti-social behaviour including vagrancy and crime within the CBD;
� Insufficient car parking which detracts from customer convenience and accessibility;
� Over cluttering of the Mall with structures that block lines of sight and impede pedestrian movement;
� Reduction in pedestrian movements and a reduction in the overall office based workforce;
� Inaction by Council concerning the future of the Mall has discouraged potential retail tenants from committing to retail accommodation; and
� Loss of regional airlines and post September 11 reduction in domestic and international tourism.
Mall frontage tenancies have demonstrated rates of up to $800 per square metre during the early 1990’s whilst non mall front tenancies where typically no more than $300 per square metre. Mall front retail tenancies have demonstrated a significant decrease in the upper end of the rental range to approximately $600 per square metre.

DETAILED ASSESSMENT OF CATALYST PROJECTS
Newcastle CBD Strategy Final Report March 2009 Page 43
The deterioration in rental values can be directly linked with affordability and the ability of the tenant to meet their rental obligation whilst achieving a business profit. As retail trade and turnover have declined so too has the ability of retailers to meet rental obligations. As such this has placed downward pressure on rentals and upward pressure on vacancy. As vacancy and competition increases landlords are progressively more motivated to lease their vacant tenancies at lower rentals, to maintain occupancy. This places further negative pressure rentals. The total body of available sales evidence demonstrates a consistent decrease in values over the past 15 years. Average values have decreased by approximately 42% and yields have increased (softened) by approximately 2.5%. The progressive decline in the economic performance of the Flinders Mall has been accompanied by a corresponding reduction in the ability of the Mall to function as a viable and attractive public space. Reductions in occupancy coupled with a traditional tenancy mix typified by uses lacking an active frontage detracted from the mall’s ability to stimulate and attract pedestrian interest. This contributed to an increase in anti-social behaviour and safety and security problems including petty crime, vagrancy, public drunkenness vandalism and violent assaults. Factors contributing to a decline in the social performance of the Mall include:
� Loss of major tenants such as David Jones that restricted attractiveness of the Mall to pedestrian traffic;
� the absence of vehicle traffic and reductions in pedestrian numbers;
� high rates of vacancy which detracted from both tenancy range and the quality and depth of available merchandise;
� poor physical design characterised by:
− the predominance of permanent structures which contributed to a physically cluttered character; − the loss of retail sight-lines resulting in the emergence of commercial “dead spots” − the presence of physical settings conducive to criminal activity (e.g. Spaces which did not
permit passive surveillance, poor lighting)
� Poor public perception of the Flinders Mall being unsafe;
� Obsolete building stock that did not meet the evolving accommodation requirements of top tier retail / commercial tenants;
� Reorientation of tourist focus to the Strand foreshore redevelopment;
� Competition from suburban based enclosed air conditioned retail centres
Redevelopment of the Flinders Street Mall has been identified by Townville City Council as the immediate trigger for the CBD’s revitalisation, and thus is a key element to the 2008 CBD Masterplan. It has been estimated that reconfiguration of the mall to allow vehicular traffic has the potential to generate an additional turnover figure of approximately $64 million. Two-way traffic will allow for a dynamic city centre with increased connectivity, clearer sight lines and a well-defined city heart The proposed new Flinders Street would have more than 1,400 additional car parks in the adjoining Flinders Plaza shopping complex Townsville City Council intends to begin construction work on the redevelopment project in March 2010 with a completion date of December 2010. Council is aiming to complete the project by establishing a joint and equal funding partnership with the Queensland and Federal Governments.
Southport, Gold Coast, QLD
The Southport Mall occupied the eastern end of Nerang Street between Scarborough Street and Marine Parade, Southport. The formerly malled section was situated on the northern fringe of the core retail

DETAILED ASSESSMENT OF CATALYST PROJECTS
Newcastle CBD Strategy Final Report March 2009 Page 44
area centred on the “Australia Fair” shopping complex. The former mall was approximately 200metres in length and had views of both the Southport Broadwater and the adjacent Anzac Park from its northern end. In the early 1980’s the Southport Chamber of Commerce undertook a number of surveys concerning the proposal to establish a pedestrian mall in Southport. The Southport area, had a long and established tradition as the Central Business District of the Gold Coast supporting the primary concentration of commercial office space and comprising the preferred location for professional, medical and legal service providers. Notwithstanding this, rapid and sustained tourism and resident growth throughout the 1970’s and early 1980’s, contributed to the emergence of competing retail and commercial centres at Broadbeach and Surfers Paradise. The traditional retail heart of Southport was also subject to direct competitive pressure from stand-alone retail centres, most notably Sundale which had attracted a growing share of Southport’s retail growth since its establishment in 1968. Competitive influences were accentuated further from 1977 with the establishment of the Pacific Fair Centre at Broadbeach, which accommodated some of the Gold Coast’s first major department stores. In 1984, the Chamber of Commerce in conjunction with Gold Coast City Council established a committee to examine the feasibility of establishing a mall in Southport, and to make recommendations on its location, size and design. The committee recommended the Nerang Street site from a choice of five (5) possible locations. In 1986 Scarborough Fair Shopping Centre opened between Scarborough and Nerang Streets. This was subsequently expanded in 1988 and renamed Australia Fair. In response to growing pressure from retail and business interests, Council resolved to proceed with construction of the Mall at an estimated capital cost of between $750,000-$900,000. At that time it was broadly perceived that the mall would contribute to the re-emergence of Southport’s traditional retail and recreational heart. The mall was officially opened on 27 November 1988. Despite a lengthy public debate, the decision to establish the Nerang Street Mall was hastily conceived, and in hindsight is generally identified as a major contributing factor to the demise of Southport’s traditional retail core. By the mid 1990’s the economic and social performance of the mall had declined significantly being characterised by declining turnover, property values, rents and investment returns, high vacancy and an increasing incidence of criminal and anti-social behaviour. In 1998, following a lengthy public campaign by mall traders and the Southport Chamber of Commerce, Gold Coast City Council resolved to re-open the mall and re-introduce calmed traffic. The redesign of the Southport Mall was based on the reintroduction of two-way calmed traffic and kerbside parallel parking. The adopted design provides for the retention of wide footpaths and elevated paved pedestrian crossings. Planting and street furniture are used to delineate shared pedestrian / vehicle areas from those intended purely for pedestrians and/or mall front activities (e.g. outdoor dining). A divided carriage-way at the eastern (Marine Parade) end permitted the retention of a pedestrian underpass linking the former mall area with the adjacent Anzac Park. The mall reconfiguration was completed at a capital cost of $1,650,000. The project was funded by Gold Coast City Council with allocated funding recouped through an increase in the existing benefited area levy. The Southport Mall redevelopment contributed to a significant reduction in tenancy vacancy from a high of between 50%-60% prior to reconfiguration, to approximately 5% four years after completion of

DETAILED ASSESSMENT OF CATALYST PROJECTS
Newcastle CBD Strategy Final Report March 2009 Page 45
redevelopment works. Factors that had contributed to the marked and progressive decline in occupancy prior to reconfiguration included:
� a reduction in pedestrian traffic and passing trade;
� diminished accessibility and parking availability; � physical problems which detracted from economic performance including a cluttered design and the
loss of sight lines;
� the emergence of an unbalanced and ultimately obsolete tenancy mix;
� an increase in anti-social behaviour including vagrancy, petty crime and vandalism; and
� rationalisation in the banking and financial institutions sector.
In addition to the sizeable reduction in the quantum of vacant premises, redevelopment of the mall has contributed to a shift in the prevailing tenancy mix. Prior to redevelopment the mall was characterised by discount retailers ($2 shops), clothing outlets and banks and financial institutions. Since redevelopment land use and occupancy trends have witnessed the emergence of entertainment uses, restaurants (including alfresco dining), educational institutions (3) and the establishment of commercial and professional services (e.g. Law firms). Uses exiting the mall have been confined primarily to financial institutions including Westpac and National Australia Bank, Suncorp Metway and MBF. The re-opened Nerang Street now has a lively presence, which has been assisted by the introduction of uses that attract patronage outside of normal business hours. Educational institutions, al fresco dining and entertainment uses have extended the core active hours of the former mall area. Anecdotal evidence has attributed the reduction in vacancy since redevelopment of the mall to:
� increases in pedestrian and vehicle traffic;
� corresponding improvement in retail turnover;
� improved public space amenity;
� the restoration of retail sight lines;
� improved access and the provision of short term parking;
� the extension in core activity hours arising from changes to tenancy mix;
� increases in surrounding residential density.
We have not been able to identify a large volume of sales evidence within the Southport Mall area for the ten years prior to the removal of the mall and reintroduction of traffic. Based on anecdotal information derived from local agents and property owners, it would appear that there had been limited sales transactions due to a general lack of interest in the area from the broader investment community. As such it has been difficult to identify any pattern. From our research it would appear that demand for investment or owner occupied property in the Southport Mall was limited prior to 1998 when the major redevelopment works were undertaken. It would follow that this would result in a limited number of transactions. Despite the fact that sales evidence is limited, research evidence suggests that market rental values have increased by as much as 30% to 35%, vacancy has fallen to approximately 5% and investment confidence in the area has risen resulting in lower yields and an increase in capital values. This is supported by recent sales that typically reflect the parameters of an improving market. Rental ranges also indicate improving returns with average retail rents improving from $350-400 /sq.m prior to redevelopment of the mall, to a present day range of between $450-$550/sq.m. Average commercial rental returns have increased marginally from $170/sq.m to approximately $200/sq.m. Tenant and marketing co-ordination prior to the reconfiguration of the Mall was facilitated by the Southport Mall Traders organisation. Marketing approaches at that time were generally perceived to be

DETAILED ASSESSMENT OF CATALYST PROJECTS
Newcastle CBD Strategy Final Report March 2009 Page 46
dated and failed to effectively promote and position the centre. Since reconfiguration of the mall the Southport Mall Traders organisation has ceased to exist. The progressive decline in the economic performance of the Southport Mall was accompanied by a corresponding reduction in the ability of the Mall to function as a viable and attractive public space. Reductions in occupancy coupled with a traditional tenancy mix typified by uses lacking an active frontage detracted from the mall’s ability to stimulate and attract pedestrian interest. This contributed to an increase in anti-social behaviour and safety and security problems including petty crime, vagrancy and vandalism.
Rockhampton, Central QLD
The Rockhampton Mall formerly occupied two blocks of East Street between Fitzroy Street and William Street. Stage 1 of the “de-malling” project involved that section of the mall between Denham and William Streets. Stage 2 of the project involving the reintroduction of calmed traffic to that section between Denham Street and Fitzroy Street. The former mall was situated in the traditional commercial core of the Rockhampton CBD. The former mall was approximately 425 metres in length and also extended along Denham Street to the east and west between Quay Lane and Bolsover Street. The Mall is situated in relative proximity to an emerging entertainment precinct on the southern banks of Fitzroy River. From the mid to late 1980’s, the Rockhampton CBD had been subject to increasing vacancy and falling investor interest. Declining retail patronage emerged in response to a shift in the primary retail focus from the CBD to North Rockhampton, particularly through the development of integrated stand alone shopping centres outside of the traditional CBD retail area. Council initiated the proposal to establish the mall in response to the expressed concerns of the business community related to declining retail turnover and the loss of tenants to competing centres. Following the completion of detailed design in 1987, works commenced on the establishment of the Mall with construction being completed by late 1989. From its establishment in 1990, the mall was largely unsuccessful in addressing the inherent economic and physical deficiencies of the CBD. Vacancy rates, which had been uncharacteristically high prior to the construction of the mall continued to increase following construction, with localised trends of declining retail patronage being accentuated by the progressive consolidation in the role of North Rockhampton as the primary focus of new retail development. This included the establishment and ultimate expansion of the Rockhampton Shopping Fair retail centre. In response to declining turnover and vacancy the Rockhampton City Council resolved to undertake a partial opening of the mall to traffic. The initial stage of the project involved the reconfiguration of the mall between Denham and William Streets to permit the introduction of “calmed” traffic was completed in 2000. Stage 2 de-malling works involving the remaining section between Denham and Fitzroy Streets was completed in 2003. The redevelopment of the Rockhampton Mall involved the reintroduction of two-way calmed traffic utilising a divided carriageway and both kerbside and centre parking. Mature centre planting complement wide footpaths, with vehicle and pedestrian areas being clearly demarcated by bollard, planting and wall treatments. The Denham / East Street intersection retains a mall character with an elevated and paved carriageway permitting restricted traffic flow. The Stage 1 mall reconfiguration was completed at an estimated capital cost of $2.2 million. Stage 2 cost in the order of $2 Million. Rockhampton City Council funded the project with allocated funding to be recouped through a benefited area levy. Vacancy levels had been observed pre-reconfiguration at a rate of 20% to 30%. Present evidence suggests a vacancy rate at the upper end of 10-15% range, indicating a substantial improvement.

DETAILED ASSESSMENT OF CATALYST PROJECTS
Newcastle CBD Strategy Final Report March 2009 Page 47
Positive trends are emerged after the completion of Stage One with local industry participants indicating that leasing inquiry had increased and the likelihood of a significant reduction in vacancy. Unlike the Southport project the reconfigured space continues to display a number of “mall-like” attributes. Factors that had contributed to decline in occupancy prior to reconfiguration included:
� a reduction in pedestrian traffic and passing trade;
� diminished accessibility and parking availability;
� a shift in the city’s primary retail focus to North Rockhampton outside of the core CBD retail area;
� the emergence of an inappropriate tenancy mix characterised by an excessive number of discount traders;
� declining land values which contributed to a reluctance on behalf of property owners to invest further in the maintenance and refurbishment of premises or streetscape/public area upgrading; and
� an increase in anti-social behaviour and safety and security concerns.
Changes in tenancy mix just prior and since the redevelopment of the mall have included the departure of selected retail tenants, particularly those more suited to stand-alone or retail warehouse premises (e.g. Spotlight) and the entry of institutional and professional services (e.g. Major medical practice, University of Central Queensland). An interesting tenancy trend which has emerged since the completion of reconfiguration works, involves the relocation of fringe mall traders to mall-front premises. Anecdotally this has been attributed to enhanced access, parking and pedestrian activity, and may also be indicative of improving tenant perceptions particularly given the negligible change in the current low rental rates.
Anecdotal evidence has attributed the reduction in vacancy since redevelopment of the mall to:
� increases in pedestrian and vehicle traffic (particularly during the day);
� corresponding improvement in retail turnover;
� improved public space amenity, which has made the area more attractive to the community for passive recreation purposes;
� improved access and parking provision;
� flow-on benefits associated with nearby riverfront redevelopment and beautification projects.
Historically, the Rockhampton mall experienced a 60% reduction in land values between 1990 and 2000. This fall in value was prompted by the gradual degradation of the Mall that resulted in increasing vacancy and stagnation / reduction in rental growth. This general fall in value was compounded by a lack of investment to maintain mall front properties to a modern standard resulting in a gradual decay in the quality of retail and office premises. In addition the focus of retailing shifted to North Rockhampton with the regional centre Rockhampton Shopping Fair, sub regional Rockhampton Kmart Plaza and neighbourhood based Northside Plaza. These developments have drawn traditional mall front tenants away from the mall and placed negative pressure on rental levels. Indeed mall front retail rents are relatively low at between $150 to $200 per square metre. During and since reconfiguration, tenants have been represented by the Mall Traders Association. This organisation continues to operate as a trader’s peak body. The decline in the economic performance of the mall was accompanied by an increase in safety and security issues. Not unlike Southport and Townsville an increase in anti-social behaviour associated with declining occupancy and pedestrian activity was experienced. Prevailing tenancy mix prior to and during the life of the mall was focused largely on fashion and discount retail outlets, and financial institutions. Such uses contributed little to street activity, which diminished further following construction of the mall.

DETAILED ASSESSMENT OF CATALYST PROJECTS
Newcastle CBD Strategy Final Report March 2009 Page 48
The resident perception of the mall from a safety and security perspective ranged from poor during daylight hours, to unsafe at night. Security patrols have been introduced as one component of a program to improve personal safety outside of normal business hours.
Coffs Harbour, Northern NSW
The Coffs Harbour Mall was established in 1985. At that time it was envisaged that the development of a pedestrian mall would enhance the amenity and attractiveness of the central retail and commercial precinct. The Mall occupied the western end of High Street between the Pacific Highway and Gordon Street. The former mall was 350 metres in length, and was situated in the heart of the retail core focused on the Palms Regional Shopping complex. The mall resulted in a gradual then ultimately pronounced downturn in the economic performance of the central retail area. This was characterised by decline in business turnover and property values, anti social behaviour including violence and drug use and a marked decline in community use and pedestrian traffic. Vacancy increased over the corresponding period to peak within the 25-30% range. The economic decline of the mall was accompanied by an increase in criminal activity including violence, drug use, vandalism and personal safety and security issues. Increasing vacancy, poor design, declining community use and perceptions accentuated these trends. The predominance of discount traders and the subsequent lack of depth in available merchandise also contributed to a loss of trade to competing centres (particularly the adjacent Palms Regional Centre). Recognising the need to address the preceding problems and to respond to trader and community concerns, the Coffs Harbour City Council resolved to redevelop the mall to facilitate the re-introduction of vehicular traffic. The mall redevelopment proceeded after a lengthy consultation and design phase. Construction works associated with the redevelopment of the mall were completed in May 2001. The redevelopment of the Coffs Harbour Mall involved the reintroduction of two-way calmed traffic utilising an undivided carriageway with kerbside parallel parking. Key elements of the adopted $3.75 million redevelopment concept included:
� A centrally aligned, narrow, straight carriageway with 8.4 metre-wide footpaths and 5 crossing areas – each spanning 9 metres in width;
� An open city square, 2 kiosks and a water feature intended to become the focal point of the redeveloped city centre;
� Sail structures spanning the carriageway and footpaths to shade pedestrian areas;
� Intermittent tree plantings to create an avenue effect;
� Relocation of the existing taxi rank to Gordon Street to maximise the number of parking spaces;
� The retention of a 4-5 metre width zone to retain pedestrian access during the construction phase.
The Coffs Harbour mall redevelopment has contributed to a significant decrease in vacancy from a rate of 25-30% to approximately 5% following redevelopment. New tenants to the redeveloped mall have included fashion boutiques, restaurants / alfresco dining and personal service providers such as travel agents. Key uses vacating the reconfigured Mall have included kiosks, a McDonald’s restaurant, and a discount retailer. The Coffs Harbour City Council has attributed the success of the mall redevelopment to an increase in accessibility, improved public safety and increased pedestrian and vehicular movements. Anecdotal evidence derived from Coffs Harbour City Council suggests turnover increases in excess of 50% in 2001, the year after redevelopment of the mall. This was attributed primarily to increased pedestrian traffic, estimated to have increased by about 6,000 pedestrians per day. The redevelopment contributed to significant improvements in the social performance of the Mall as a place of public activity and social interaction. This has been most evident through a significant reduction

DETAILED ASSESSMENT OF CATALYST PROJECTS
Newcastle CBD Strategy Final Report March 2009 Page 49
in anti-social behaviour and crime and corresponding increases in pedestrian movements and commercial activity. The mall was designed in close liaison with the NSW police service, and accordingly encapsulates relevant CPTED design principles. Investment in the redevelopment has had a number of positive flow-on benefits including an increased preparedness on the part of property owners to invest in the refurbishment of premises. The Coffs Harbour City Centre Revitalisation Project, which transformed the City Square area, was chosen as the winner of the 2005 Local Government Award by experts from Australia's peak property association, the Australian Property Institute (API).
Blacktown, Sydney NSW
The Blacktown Mall formerly occupied a single block between Flushcombe Road and Campbell Street in the Blacktown City Centre. The Blacktown City Centre is a key sub-regional centre in Western Sydney that is dominated, in terms of floorspace, by retail activities. Retail activities occupy almost twice the amount of floorspace that is occupied by offices in the City Centre. The mall adopted an east-west alignment and was approximately 120 metres in length and 22 metres wide. The Blacktown City Centre occupies a total area of approximately 62 hectares and spans north and south of the Richmond and Main Western railway line. The City centre is the principal commercial centre in the Blacktown Local Government Area and the focal point for retail, commercial, entertainment and civic related activities. The development of the Blacktown City Centre over time, from a traditional main street shopping centre to a centre of sub-regional status, occurred partly because of its strategic location in Western Sydney and partly because of the Department of Planning’s Centres Policy for the Sydney Region (1986). This policy identified the CBDs of Sydney-North Sydney and Parramatta as two regional centres and nominated Blacktown, Mount Druitt (another centre in the Blacktown LGA), Chatswood, Bankstown and Penrith as sub-regional centres. The Centres Policy identified the sub-regional centres in western and south-western Sydney as “priority centres” for commercial growth and the development of transport and community facilities. Under the Centres Policy, Sydney’s regional sub-centres were intended to be the focal point for jobs, services, recreation, community activities, higher density housing and public transport. Following the completion of the Blacktown Retail Hierarchy Study in 1981, Blacktown Council resolved to construct a pedestrian mall in Main Street, between Flushcombe Road and Campbell Street. The Mall was to be part of an environmental improvement program and a total traffic management and parking program which intended to eliminate unnecessary through traffic in the City centre. Following the 1981 Retail Hierarchy Study a further study, the Blacktown CBD Urban Design/Landscape Scheme, was completed in 1983. The aim of this Study was to investigate ways in which Council could: “Create a vital, diverse, economically viable and attractive City Centre with its own distinctive character and identity.” As a part of the concept planning and schematic design component of the Study, an overall master plan for the CBD and sketch plans of pedestrian areas, including the Main Street Mall, were prepared. This master plan was further developed by Council staff and then due to the environmental significance of the proposal, an Environmental Impact Statement (EIS) was prepared under the Environmental Planning and Assessment Act. The EIS stated that the purpose of the closure and pedestrianisation of Main Street was to:
DETAILED ASSESSMENT OF CATALYST PROJECTS
Newcastle CBD Strategy Final Report March 2009 Page 50
� “improve the environmental amenity of the City Centre, by the exclusion of motor vehicles and the provision of landscaping and recreation facilities to provide freer opportunities for pedestrian movement;
� to stimulate commercial activity in the City Centre; and � to exclude through traffic from the Centre by provision of the Bungaribee bypass route.”
Two key reasons were identified in favour of constructing the Mall. Firstly, there was a desire to improve the image and amenity of the area and to remove vehicular congestion. Secondly, there was a desire to compete with other shopping centres by providing a safer and more attractive shopping environment. It was also intended that the Mall may perform a civic function by acting as a focal point for open community activities such as displays, charity drives, performances etc. A survey of some 58 businesses that would be directly affected by the Mall was also undertaken for the EIS. The key findings of the survey are summarised as follows:
� 13 businesses (22%) anticipated that the Mall would cause major problems for access by delivery vehicles.
� Some banks expressed concern about possible security problems as a result of new access arrangements.
� In relation to access, the EIS concluded that rear access only with no on-mall servicing by vehicles would be the best option, provided that loading zones were provided at both ends of the Mall.
� When questioned about the expected effect of the Mall on trade, 38% of the businesses thought that the Mall would increase trade whilst 20% thought that it would decrease trade. Some of the reasons or an expected loss in business included a reduction in passing trade (particularly on weekends and after hours) and a reduction in the availability of parking.
� 38% of businesses offered strong support for the Mall, 25% moderate support, 13% were strongly opposed to the Mall and 4% moderately opposed to it.
The EIS concluded that the Mall would provide positive benefits to the Centre by ameliorating the poor environment and traffic conditions in the area at the time. The EIS acknowledged that the Mall lacked a major drawcard, such as a department store, to attract pedestrians and shoppers to the area and relied heavily on the future development of land in Warrick Lane (to the north east of the Mall) to justify its viability. The mall was constructed in 1986 at a capital cost of $1,478,571. From as early as the late 1980’s it became apparent that the Mall was impacting adversely on retail trade, rental returns, and property values. Key symptoms of this decline included the emergence of an unbalanced tenancy mix, declining public use and an increase in crime. After an in-depth Planning Study, Blacktown City Council resolved to redevelop the mall in 1997. Reconfiguration works were ultimately completed in 1998. The redevelopment of the Blacktown Mall was based on the reintroduction of one-way calmed traffic and kerbside angle parking. The adopted design provides for the retention of a wider footpath along the southern frontage and elevated paved pedestrian crossings. Planting and street furniture are used to delineate pedestrian and vehicle carriageway and parking areas. The mall reconfiguration was completed at an estimated capital cost of $1,300,000. The project was funded by Blacktown City Council. The Blacktown case study example differs slightly from those examined previously as vacancy rates prior to development of the mall were within a range of 5% to 10%. Since redevelopment works were completed in 1998 vacancy has remained constant however this may be partly attributable to external market trends. The Blacktown City Council is of the opinion that a potentially significant increase in vacancy, which may have otherwise occurred, was averted as a result of the redevelopment works. As is the case with many traditional centres, vacant tenancies are primarily located in retail arcades accessed from the mall. Tenancy mix within the Blacktown Mall has been subject to significant change both during the life of the Mall, and since its redevelopment.

DETAILED ASSESSMENT OF CATALYST PROJECTS
Newcastle CBD Strategy Final Report March 2009 Page 51
A notable feature of the change in the Mall’s tenancy mix between 1989 and 1996, was the increase in uses typically associated with the deterioration in the quality of retailing provided within a centre. These include uses such as second hand dealers and discount retailers such as $2 Shops. Over the corresponding period there was also a decline in fresh food vendors, furniture and electrical stores. Since redevelopment of the mall, key changes in tenancy mix have included an increase in fashion boutiques, restaurants / alfresco dining, and a reduction in banks and associated financial institutions. According to available data provided by the Blacktown City Council, the Blacktown Mall experienced an approximate 14% reduction in property values between 1990 and 1995. The primary influence behind this reduction was negative growth in rental values bought about by vacancies created by the relocation and rationalisation of the banking/financial sector within the mall. Despite the fact that overall vacancy rates did not increase this was a function of property owners accepting substantially lower rental from second and third tier retail operators. Immediately prior to de-malling within Blacktown average retail rentals were in the order of $187 per square metres. Since the completion of the mall reconfiguration, vacancy levels have remained unchanged however rentals have increased by as much as 70%. After redevelopment retail rentals typically ranged between $300 and $400 per square metre. Office rentals have also experienced an increase since the completion of works. A combination of increasing rents, overall growth in the Sydney property market and a general improvement in investor confidence in the Blacktown area have lead to a significant increase in value for properties in and around the mall. Anecdotal evidence from local real estate agents and the Blacktown City Council suggest that the redevelopment project is expected to deliver continued growth in both rentals and capital values. Deterioration in the economic performance of the mall from the late 1980’s was accompanied by evidence of declining social performance. In January 1995 Blacktown Police prepared a Crime Prevention Audit of the Main Street Mall. This audit examined the incidence of anti-social behaviour and crime and associated contributory factors. The findings of the audit highlighted the following problems:
� The physical design of the mall incorporated a number of elements that encouraged anti-social and/or criminal activity. These included the seating in the mall that encouraged youths to meet and loiter, and the layout and location of certain structures (e.g. the covered stage, trees and the toilet facility) which discouraged opportunities for casual surveillance and/or obstructed sight lines;
� assaults – particularly late at night and during the early hours of the morning;
� breaking and entering;
� vagrancy
� the supply of alcohol to juveniles;
� petty theft;
� drug dealing and use; � malicious damage to property.
The Mall had a poor reputation in safety and security terms. This was primarily due to the threatening presence (and apparent colonisation by) youths and “undesirables” in the Mall. The increased pedestrian and vehicular activity since the reconfiguration has been attributed as a primary factor in the improvement of the social performance of the Mall. Blacktown City Council confirm a marked decrease in anti-social and criminal behaviour associated with the following factors:
� design changes associated with the re-introduction of traffic which have included the removal/redesign of poorly located buildings and structures;
� restoration of site lines and improved opportunities for casual surveillance;
DETAILED ASSESSMENT OF CATALYST PROJECTS
Newcastle CBD Strategy Final Report March 2009 Page 52
� Landscape and streetscape improvements which have assisted pedestrian flow and improved pedestrian amenity;
� improved accessibility and parking;
� changes to tenancy mix which have seen the establishment of uses that have increased street life and activity;
� improved management and maintenance
The public perception of the area has improved significantly which has been reflected through increased public use of the area.
5.1.8 Key Issues & Challenges
The following potential issues and challenges facing the GPT proposal are worth noting:
• Relatively weak financial position of GPT may delay or prevent the investment.
• GPT’s proposal is conditional on the removal of the railway line east of Civic.
• Resistance from some owners of sites that sit within GPT’s proposed site.
• Centre not in close proximity of other CBD nodes such as Civic. Therefore, limited benefits from continuous foot traffic, Refer to research on Key Success Factors for retail precincts, highlighting the need for strong pedestrian connections.
• Implications of increased car traffic from new regional shopping centre.
• Limited generator of foot traffic and activity to other areas of CBD.
5.1.9 Conclusion
The GPT proposed development is quite large and unlikely to have a competitive alternative if it does not go ahead. It will result in significant job creation, flow-on effects on economic activity and serve as an important signal on the attractiveness of investing in the Newcastle CBD. It will also be effective in capturing spending escape to Westfield Kotara, Charlestown and Sydney for higher end fashion. However, the proposed regional centre is likely to be an enclosed multi-level centre which will be heavily car based. Therefore, whilst providing some on street activation, it on its own will not provide the solution for revitalising the Newcastle CBD.
The proposed development will have significant overall benefits and will have to form part of a broader strategy aimed at increasing activity across a broad range of sectors. Perhaps the most important role of the proposed development will be to relieve Council and potentially the NSW State Government of the sole responsibility of resolving the issue of the failing Hunter Street Mall. Should the GPT development not proceed, it will be imperative that government acts to improve the performance of the Mall area, potentially through the costly reintroduction of calmed vehicle traffic into the Mall precinct to increase and improve street activation and safety. This alternative will come at a significant expenses to Council, with approximately $8 million identified in the Newcastle Civic Improvement Plan for this task, however the actual cost could be significantly higher.
5.2 Education Precinct The University of Newcastle (UoN) has identified development of a City Campus in the Newcastle CBD as a strategic objective that will align it closely with the NCC’s plan for an Education precinct.
This strategy aims to benefit from co-locating University functions close to other cultural and institutional facilities including the Town Hall, City Library, Art Gallery, and the Legal and Commercial Precinct.

DETAILED ASSESSMENT OF CATALYST PROJECTS
Newcastle CBD Strategy Final Report March 2009 Page 53
The University has proposed to re-locate the Business School, Newcastle Law School and the Faculty of Education & Arts into a purpose built teaching, learning and research facility in the CBD, bringing up to 7,500 students and 1,000 staff to the CBD. This would leave the current Callaghan campus to be occupied by sciences faculties which could not be suitably accommodated in the CBD due to the unique infrastructure requirements (for example, medical laboratories).
Faculty / Portfolio Students EFTSU Staff FTE Space (sq .m.)
Business and Law 2,500 200 11,000
Education and Arts 5,000 720 30,000 – 50,000
Support Services (corporate, student etc) 80 5,500
Total 7,500 1,000 46,500 – 66,500
Source: University of Newcastle
Proposed Student, Staff and Space in the City Campu s
5.2.1 Capital Investment
The construction of Business & Law and Education & Arts, as well as Support Services buildings would require up to approximately $186 million in capital investment. We note that our cost estimates are conservative and are based on the application of industry cost data for a based building only. The cost estimate excludes the cost of fit-out and land. We note that the broad budget identified by UoN is in the order of $300m to $500m incorporating base building, fit-out and land costs. The UoN envisages that Federal Government funding, through the Education Investment Fund, would be required to support the development of a CBD campus.
University of Newcastle Estimated CBD Campus Constr uction Costs
Construction Cost ($ per sq.m.)
Business and Law 2,750Education and Arts 30,000 - 50,000 2,750 $82,500,000 - $137,500,000Support Services 2,000
Total 46,500 - 66,500 - $123,750,000 - $178,750,000
Carparking 15,000 per bay
Total Inc. Carparking - $131,250,000 - $186,250,000
Source: Rawlinsons Construction Cost Guide, 2009
Note: Construction costs refer to 'raw' construction costs, and exclude the costs of land. Refer to appendix for a detailed definition.
-
Total Construction Cost
$30,250,000
$11,000,000
$7,500,000
11,000
5,500
500 bays
GFA (sq.m.)
5.2.2 Employment
The development of a UoN CBD campus would have a positive impact on employment levels. Employment generated by the new campus would be as a result of two separate phases.
1. The construction phase – temporary direct and indirect jobs that are created during the construction of the university.
2. The operational phase - full-time and part-time employment of the additional staff which will be required as part of the ongoing operation.
A UoN CBD campus would provide direct employment for up to approximately 1,000 teaching and administration staff once in operation. Approximately 800 jobs would be accounted for by the re-location

DETAILED ASSESSMENT OF CATALYST PROJECTS
Newcastle CBD Strategy Final Report March 2009 Page 54
of employees at the existing Callaghan campus, meaning that the net benefit in terms of direct employment during operation would be 200 jobs.
The estimated number of indirect jobs created as a result of the operation of the university would be approximately 825. These jobs would be spread across a range of industries and services including retail, entertainment and arts and culture.
The number of direct jobs created during the construction phase of the University is estimated to be between approximately 1,200 and 1,700, however an estimated 30% of these would be accrued outside of Newcastle LGA, meaning that the number of jobs created within Newcastle LGA would be between approximately 800 and 1,200. The number of indirect jobs created during construction is estimated to be 1,700 to 2,500.
In total, development of a UoN CBD campus could result in the creation of up to approximately 3,700 jobs during construction, and 1,825 jobs (1,025 new jobs) during operation.
Employment Impact of University of Newcastle CBD Ca mpus 1
Construction Phase 1 1,179 - 1,674 825 - 1,172 1,760 - 2,499 2,586 - 3,671
Operational Phase 2
1. Total employment - full time, part time and casual
Source: ABS; Urbis
2. Indicates estimated number of jobs over the life of the construction project plust multipler effects. Jobs arefor the equivalent of one year employment
Assumes 30% of jobs generated will accrue outside of Newcastle LGA
3. Indicates the estimated number of ongoing jobs
Total Newcastle Jobs
1,825
Direct Employment
1,000
Supplier Employment
Multipler Effects
825
Newcastle LGA's Share of Direct Employment
1,000
5.2.3 Staff & Student Spending in the CBD
The new University campus will bring thousands of students and staff to the CBD, who in turn will patronise City Centre shops and services.
Based on research conducted by the National Centre for Social and Economic Modelling (NATSEM) on retail and services expenditure by university students, as well as primary research conducted by Urbis on office worker retail and services expenditure, we estimate that a UoN CBD campus would generate retail and services expenditure in the CBD during university operating hours of up to $12 million annually. This assumes that 75% of student and staff expenditure on academic days is retained within the CBD. Our analysis is presented in the table overleaf.

DETAILED ASSESSMENT OF CATALYST PROJECTS
Newcastle CBD Strategy Final Report March 2009 Page 55
Estimated Student & Staff Spending in the CBD Durin g University Hours
Staff / Students (No.) Average Daily Expenditure ($)Retail & Services Expenditure
Per Annum ($)Newcastle CBD's Share of Retail & Services Expenditure Per Annum ($)
Staff 1,000 15 4,500,000 3,375,000
Local Students 5,850 12 7,020,000 5,265,000
International / Inter-State Students 1,650 25 4,125,000 3,093,750
Total 8,500 - 15,645,000 11,733,750
Assumes 300 staff working days, and 100 university days for students per annum
Includes expenditure on food, beverage, transport and miscelleneous services during working / class hours
75% of expenditure assumed to be retained within the CBD, since staff and students are assumed to stay close to the university campus during work / class hours.
Source: NATSEM, Urbis
International and inter-state students spend more than local students as they have to be self-sufficient (for example, buy all their meals). International and interstate student number assumed to grow to account for 22% of the total student population
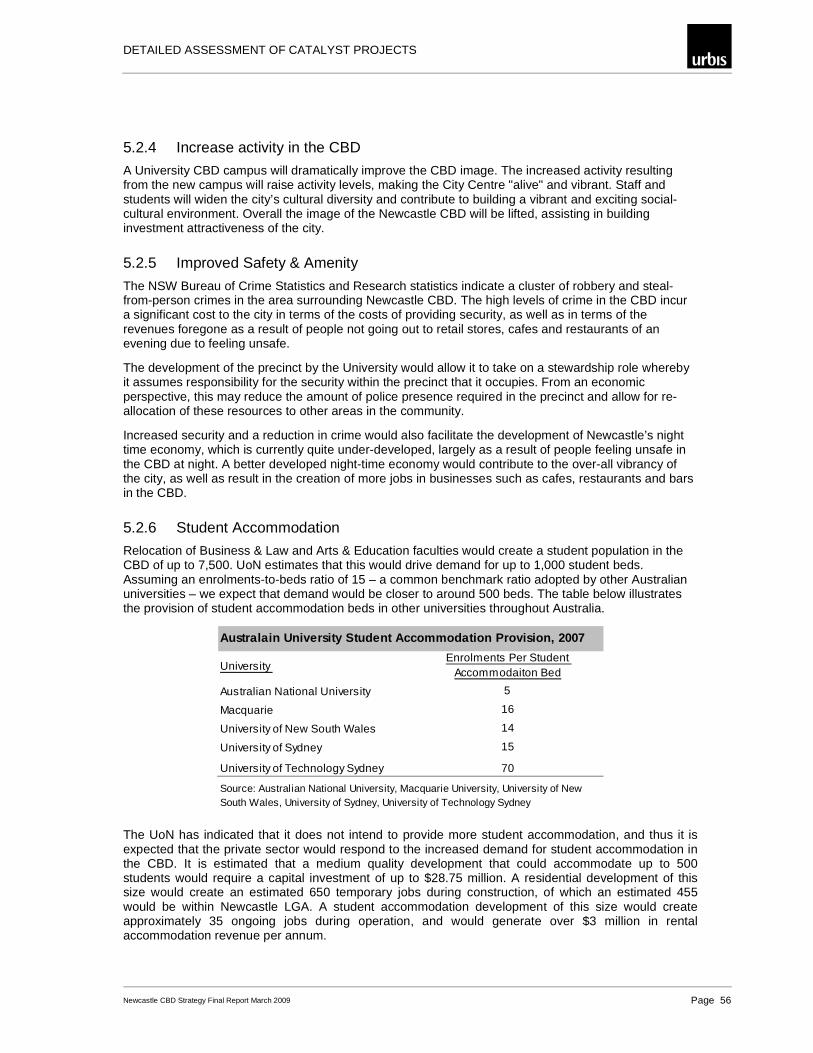
DETAILED ASSESSMENT OF CATALYST PROJECTS
Newcastle CBD Strategy Final Report March 2009 Page 56
5.2.4 Increase activity in the CBD
A University CBD campus will dramatically improve the CBD image. The increased activity resulting from the new campus will raise activity levels, making the City Centre "alive" and vibrant. Staff and students will widen the city’s cultural diversity and contribute to building a vibrant and exciting social-cultural environment. Overall the image of the Newcastle CBD will be lifted, assisting in building investment attractiveness of the city.
5.2.5 Improved Safety & Amenity
The NSW Bureau of Crime Statistics and Research statistics indicate a cluster of robbery and steal-from-person crimes in the area surrounding Newcastle CBD. The high levels of crime in the CBD incur a significant cost to the city in terms of the costs of providing security, as well as in terms of the revenues foregone as a result of people not going out to retail stores, cafes and restaurants of an evening due to feeling unsafe.
The development of the precinct by the University would allow it to take on a stewardship role whereby it assumes responsibility for the security within the precinct that it occupies. From an economic perspective, this may reduce the amount of police presence required in the precinct and allow for re-allocation of these resources to other areas in the community.
Increased security and a reduction in crime would also facilitate the development of Newcastle’s night time economy, which is currently quite under-developed, largely as a result of people feeling unsafe in the CBD at night. A better developed night-time economy would contribute to the over-all vibrancy of the city, as well as result in the creation of more jobs in businesses such as cafes, restaurants and bars in the CBD.
5.2.6 Student Accommodation
Relocation of Business & Law and Arts & Education faculties would create a student population in the CBD of up to 7,500. UoN estimates that this would drive demand for up to 1,000 student beds. Assuming an enrolments-to-beds ratio of 15 – a common benchmark ratio adopted by other Australian universities – we expect that demand would be closer to around 500 beds. The table below illustrates the provision of student accommodation beds in other universities throughout Australia.
Australain University Student Accommodation Provisi on, 2007
University
Australian National University
Macquarie
University of New South Wales
University of Sydney
University of Technology Sydney
Source: Australian National University, Macquarie University, University of New South Wales, University of Sydney, University of Technology Sydney
Enrolments Per Student Accommodaiton Bed
5
16
14
15
70
The UoN has indicated that it does not intend to provide more student accommodation, and thus it is expected that the private sector would respond to the increased demand for student accommodation in the CBD. It is estimated that a medium quality development that could accommodate up to 500 students would require a capital investment of up to $28.75 million. A residential development of this size would create an estimated 650 temporary jobs during construction, of which an estimated 455 would be within Newcastle LGA. A student accommodation development of this size would create approximately 35 ongoing jobs during operation, and would generate over $3 million in rental accommodation revenue per annum.

DETAILED ASSESSMENT OF CATALYST PROJECTS
Newcastle CBD Strategy Final Report March 2009 Page 57
Economic Impact of Student Accommodation Developmen t in the CBD
Size of Development GFA (sq.m.)Construction Cost
(per sq.m.)Total Construction Cost
500 beds 12,500 2,300 $28,750,000
Direct Jobs (No.) Indirect Jobs (No.) Total Jobs (No.)Construction Phase 260 390 650Operational Phase 20 15 35
Total 280 405 685
Weekly Rent (per Student)
Annual Rent (per Student)
Total Annual Rent for 500 Students
500 Students 120 $6,240 $3,120,000
Construction Costs
Employment Impact
Accommodation Revenue
Source: Rawlinson's Construction Cost Handbook, 2009; ABS; Urbis
5.2.7 Utilisation of University Facilities for Conferencing
The lack of quality conferencing facilities in Newcastle is seen as being a key barrier to the growth of the conferencing market. Town Hall and Civic Theatre are currently the main conference venues, with a combined capacity of 2,300 (but more comfortably accommodating 1,500 people). These venues are old, and lack custom conferencing facilities such as exhibition space and well equipped break-out rooms. The UoN itself is the largest conference organizer in Newcastle, hosting 21,000 delegates and generating an estimated $28 million in conference revenues between 2001 and 2009. Given the isolation of the Callaghan campus, the University has traditionally utilised the venues in Civic to host conferences.
Having a University campus located within the CBD would create opportunities for university facilities, such as lecture theatres, to be utilised for conferences. Conferences provide economic benefits in terms of conference delegate expenditure in retail, entertainment and accommodation establishments in Newcastle. If Newcastle were able to capture 10% of the estimated 100,000 conference delegates that visit the Hunter Region each year, conference revenues could reach up to approximately $17 million.
Increasing the number of conferences in Newcastle would also bring an economic benefit to the city by raising the profile of Newcastle amongst state, interstate and international business and leisure travellers, which could ultimately translate into more commercial and tourist activity in the city.
The benefits of conferences to the Newcastle economy are discussed in more detail in section 5.4.4.
5.2.8 Linkages to the Legal Sector
A Law School located close to a Legal Precinct would provide opportunities for sharing of resources between the University and the Legal Sector. For example, the law library could be shared, bringing benefits to the legal sector due to access to a larger collection of resources. This would create an economic benefit by allowing land, which would have been required for two libraries, to be freed up for other purposes.
Proximity of the Law School and Legal Centre with the Legal Precinct would also present opportunities for the University to establish a new standard of excellence for the professional training of lawyers. For

DETAILED ASSESSMENT OF CATALYST PROJECTS
Newcastle CBD Strategy Final Report March 2009 Page 58
example, Law students could undertake work-place training more easily as a result of close location to legal businesses. This would contribute to lifting the overall profile of the University’s Law faculty.
5.2.9 Increased International Student Population
International students bring economic benefits to Universities and cities, as they spend more on retail goods and services than local students, due to the need for them to be self-sufficient. They also pay a premium on study fees.
In 2007 international students accounted for 19% of the total student population at UoN – slightly below the national average benchmark of around 22%. Some universities have a higher proportion of international students. For example, the University of Wollongong’s international student population accounted for 38% of the total student population in 2007. This is surprising given the University’s regional location and is an example of how regional University campuses also have the ability to attract international students.
Australian Universities' International Student Popu lation
University International Student Population
University of Newcastle, NSW 19%
University of Sydney, NSW 22%
University of New South Wales, NSW 22%
University of Wollongong, NSW 38%
La Trobe University, VIC 21%
University of the Sunshine Coast, QLD 21%
University of Western Australia, WA 20%
Notre Dame, WA 9%
University of South Australia,SA 34%
Source: DEEWR, 2007; Urbis
The UoN has identified an increase in the proportion of international students as a key goal for the University going forward. A CBD location would increase the overall appeal of the University, supporting the goal of attracting more international students.
An increase in the international student population from 19% to 22% would represent an increase in the number of international students from approximately 5,000 to 7,000 (assuming that the total student population increases by 20% due to the increased appeal of the University). The increase in the proportion of international students would generate approximately $26 million in additional international student study fees annually.
5.2.10 Key Issues & Challenges
The following potential issues and challenges facing the UoN CBD campus proposal are worth noting:
• There are a restricted number of greenfields sites in the CBD that would be suitable for a university CBD campus. The alternative of re-furbishing existing buildings is not seen as ideal given the high costs of conversion. Also, utilisation of existing buildings would mean that the university would be spread across a number of fragmented sites, rather than being amalgamated on one large CBD campus. This is not preferable to the University.
• Double degree students (e.g. Business & Science) may face difficulty and inconvenience travelling between the CBD campus and the current Callaghan campus.
• Surrounding businesses would be subject to volatile activity as a result of the university only being occupied for approximately two thirds of the year.
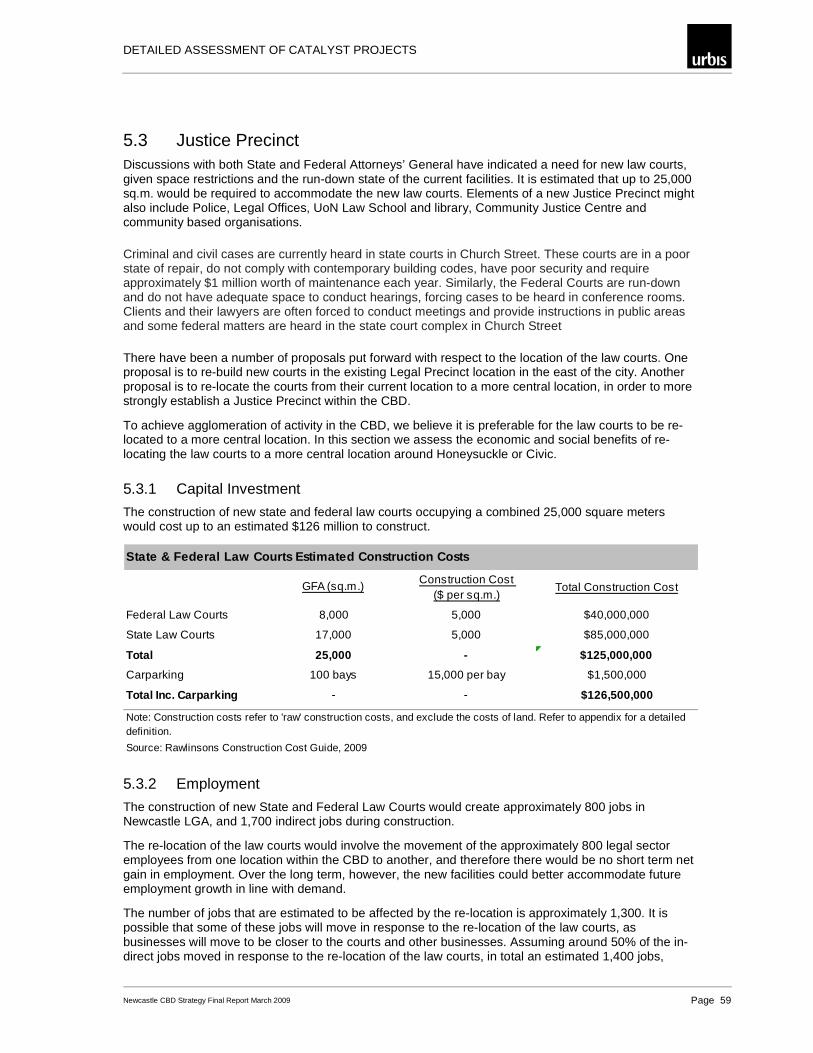
DETAILED ASSESSMENT OF CATALYST PROJECTS
Newcastle CBD Strategy Final Report March 2009 Page 59
5.3 Justice Precinct Discussions with both State and Federal Attorneys’ General have indicated a need for new law courts, given space restrictions and the run-down state of the current facilities. It is estimated that up to 25,000 sq.m. would be required to accommodate the new law courts. Elements of a new Justice Precinct might also include Police, Legal Offices, UoN Law School and library, Community Justice Centre and community based organisations.
Criminal and civil cases are currently heard in state courts in Church Street. These courts are in a poor state of repair, do not comply with contemporary building codes, have poor security and require approximately $1 million worth of maintenance each year. Similarly, the Federal Courts are run-down and do not have adequate space to conduct hearings, forcing cases to be heard in conference rooms. Clients and their lawyers are often forced to conduct meetings and provide instructions in public areas and some federal matters are heard in the state court complex in Church Street
There have been a number of proposals put forward with respect to the location of the law courts. One proposal is to re-build new courts in the existing Legal Precinct location in the east of the city. Another proposal is to re-locate the courts from their current location to a more central location, in order to more strongly establish a Justice Precinct within the CBD.
To achieve agglomeration of activity in the CBD, we believe it is preferable for the law courts to be re-located to a more central location. In this section we assess the economic and social benefits of re-locating the law courts to a more central location around Honeysuckle or Civic.
5.3.1 Capital Investment
The construction of new state and federal law courts occupying a combined 25,000 square meters would cost up to an estimated $126 million to construct.
State & Federal Law Courts Estimated Construction C osts
Construction Cost ($ per sq.m.)
Total Construction Cost
Federal Law Courts 5,000 $40,000,000
State Law Courts 5,000 $85,000,000
Total - $125,000,000
Carparking 15,000 per bay $1,500,000
Total Inc. Carparking - $126,500,000
Source: Rawlinsons Construction Cost Guide, 2009
GFA (sq.m.)
8,000
-
17,000
25,000
Note: Construction costs refer to 'raw' construction costs, and exclude the costs of land. Refer to appendix for a detailed definition.
100 bays
5.3.2 Employment
The construction of new State and Federal Law Courts would create approximately 800 jobs in Newcastle LGA, and 1,700 indirect jobs during construction.
The re-location of the law courts would involve the movement of the approximately 800 legal sector employees from one location within the CBD to another, and therefore there would be no short term net gain in employment. Over the long term, however, the new facilities could better accommodate future employment growth in line with demand.
The number of jobs that are estimated to be affected by the re-location is approximately 1,300. It is possible that some of these jobs will move in response to the re-location of the law courts, as businesses will move to be closer to the courts and other businesses. Assuming around 50% of the in-direct jobs moved in response to the re-location of the law courts, in total an estimated 1,400 jobs,

DETAILED ASSESSMENT OF CATALYST PROJECTS
Newcastle CBD Strategy Final Report March 2009 Page 60
(including legal sector jobs) would shift from the current law courts location in the east of the CBD, to the new Legal Precinct location.
Employment Impact of Re-Location of Law Courts 1
Direct Employment
Newcastle LGA's Share of Direct Employment
Supplier Employment
Multipler Effects
Total Newcastle Jobs
Construction Phase 2 1,139 797 1,700 2,497
800 800 641 1,441
1. Total employment - full time, part time and casual
Source: ABS, HDC, Urbis
2. Indicates estimated number of jobs over the life of the construction project plust multipler effects. Jobs arefor the equivalent of one year employment
Assumes 30% of jobs generated will accrue outside of Newcastle LGA3. Indicates the estimated number of ongoing jobs. Assumes that 50% of the businesses affected by the movement of the law courts would re-locate to the new location
Operational Phase - Number
of Jobs Re-Located 3
5.3.3 Increased Activity
As indicated above, establishment of a Justice Precinct would involve re-locating approximately 800 legal sector employees from one location within the CBD to another location within the CBD. This might therefore be perceived as having no or limited economic benefits. However, assuming the Justice Precinct is established in a more centralised location in close proximity to other precincts such as the proposed education and cultural precincts, this would aid in creating an activity hub, and would contribute to improving the overall vibrancy of the City. In essence, it would achieve concentration of activity – a key success factor for cities – rather than spread activity across a large area, which is what would occur if the courts remained in the same location while other precincts formed around Honeysuckle and Civic.
5.3.4 Collaboration with University
As discussed in section 5.2.8, there would be a number of benefits to having the Legal Precinct located next to the UoN’s Law School. The Legal Sector could utilise the University Law Library, which has a larger collection of legal resources than the current law library utilised by the legal sector. Sharing of the library by the University and Legal sector would allow land which would have been required for two libraries, to be freed up for other uses.
Proximity to the Law School would also provide the legal sector with easier access to Legal Students who could take up work-experience positions as part of their study requirements.
5.3.5 Residential Development Opportunities in Existing Legal Precinct Location
The land on which the current legal precinct is located in the eastern CBD precinct is prime land, ideal for residential development. It has extensive view opportunities similar to the former Newcastle Hospital site that is being developed by Mirvac for residential and tourism purposes. Furthermore, it may provide opportunities for the State Government to unlock substantial value in the existing law court sites and potentially the adjoining John Fletcher Hospital site that may be re-located. We also note that a move towards residential / tourism development in the eastern precinct of the CBD will assist with re-use of heritage buildings such as terrace houses on Church Street and the former General Post Office.

DETAILED ASSESSMENT OF CATALYST PROJECTS
Newcastle CBD Strategy Final Report March 2009 Page 61
5.3.6 Key Issues & Challenges
The following potential issues and challenges facing the proposed re-location of the Justice Precinct are worth noting:
• Greenfields sites are constrained in Civic
• Businesses located around the current Justice precinct would be adversely affected by re-location of the Justice Precinct. However, there would be sufficient lead-time for businesses to move to be closer to the new Justice Precinct, or alternatively down-scale within a reasonable timeframe.
• There is currently resistance from the Law Society re-locate the Justice Precinct.
• Law firms which are located around the current Justice Precinct would be separated from the law courts, however, the general consensus is that it is not critical for legal firms to be located this closely to the courts. There is a more direct relationship between barristers and law courts.
5.4 Tourism Precinct Since the mid 1990s Newcastle has been building its tourism sector, with a focus on conferencing and cruises. In 2007 Newcastle attracted 2.9 million visitors, who spent a combined $525 million.
There were almost 1,900 tourism businesses in Newcastle in 2007. A significant number of these are sole proprietor businesses, for example bed and breakfasts. However, compared to the state and national averages, Newcastle has a higher proportion of medium to large sized tourism businesses, indicating the relative importance of the tourism market to the Newcastle’s economy.
The key proposal put forward with respect to Newcastle’s tourism market is the development of a permanent docking facility that could potentially attract a cruise ship to permanently dock in Newcastle. It is intended that the Cruise Terminal would also be utilised for conferencing.
In this section we explore the economic benefits of developing Newcastle’s tourism sector, with a focus on the cruise ship and conferencing sectors.
5.4.1 Tourist Expenditure
As illustrated in the table below, tourism expenditure in Newcastle LGA was $525 million in 2007. Given that around 70% of accommodation establishments are located within the CBD, as are the majority of retail and services businesses, we could assume that around 70%, or around $368 million, of this expenditure was retained within the CBD.
If Newcastle could improve its tourism offering, such that International and Domestic Overnight visitors increased their stay by one day and night, tourist expenditure could grow by approximately $100 million per annum in Newcastle LGA, with an estimated $70 million of this being retained within the CBD (primarily in accommodation).

DETAILED ASSESSMENT OF CATALYST PROJECTS
Newcastle CBD Strategy Final Report March 2009 Page 62
Newcastle (LGA) International & Domestic Tourism, 2 007
International Domestic Overnight
DomesticDay
Total
Visitors ('000) 59 903 1,959 2,921Spend ($millions) 74 263 188 525Average stay (nights) 18 3 - -Average spend per trip ($) 1,249 291 96 -Average spend per night ($) 69 111 - -
State AverageAverage stay (nights) 19 4 - -Average spend per trip ($) 1,837 433 99 -Average spend per night ($) 97 124 - -
National AverageAverage stay (nights) 29 4 - -Average spend per trip ($) 2,717 500 95 -Average spend per night ($) 95 127 - -
Source: Tourism Research Australia
Note: Care should be taken when using these statistics, as some margin of error may exist due to low sample sizes
5.4.2 Cruise Ship Market
From 2001 to 2007, Newcastle could market itself to cruise ships up to 210m in length due to restrictions of size vessels that could fit at Throsby Wharf. This represented a small niche of the overall deployment of cruise ships to Australia. Recognising cruise ships are getting bigger, if Newcastle wanted to attract larger ships then another berth has to be used. In December 2007 the Mercury, at 263m, berthed at Dyke Point opposite the Newcastle CBD. Due to security concerns and a lack of landside infrastructure passengers disembarked ship waterside onto to tender vessels and ferried to Queens Wharf. From Queens Wharf passengers either boarded buses to do tours or accessed city and beaches. Cruise Hunter is now marketing Newcastle as a cruise destination to cruise ships up to 300 meters – the maximum size cruise ship that can safely navigate Newcastle Harbour. The majority of future bookings, as far forward as 2012, are for large cruise ships accommodating up to 2,000 passengers berthing at Dyke Point.
Newcastle’s current model for hosting cruise ships up to 300 meters is not ideal given that: • the cost of hiring a local tender vessel is high • tendering is not preferred by cruise ships due to staggered method of getting passengers on and off
the ship, which is inconvenient and incurs additional labour costs • it impedes on working port operations In light of this, a proposal has been put forward for the development of a permanent docking facility for visiting cruise ships, which could potentially attract a cruise liner to make Newcastle its primary place of residence. Cruise Hunter has indicated that the preferred infrastructure is a wharf facility located close to the city which can accommodate cruise ships of 300 meters in length – the maximum size cruise ship that can safely navigate Newcastle Harbour. Cruise Hunter envisages a basic facility that could simply get passengers off the ship quickly, undercover and onto buses, rather than a very elaborate and extremely costly facility. Cruise Hunter believes that Throsby Wharf is geographically a perfect location for a cruise terminal and has the advantage of existing traffic and parking infrastructure. Queens Wharf is also seen as being ideal, perhaps more so than Throsby Wharf, however, there is a lack of adequate parking and traffic infrastructure. We note that this could be resolved if the rail line was removed from Newcastle Station and this area was utilised for cruise facilities.
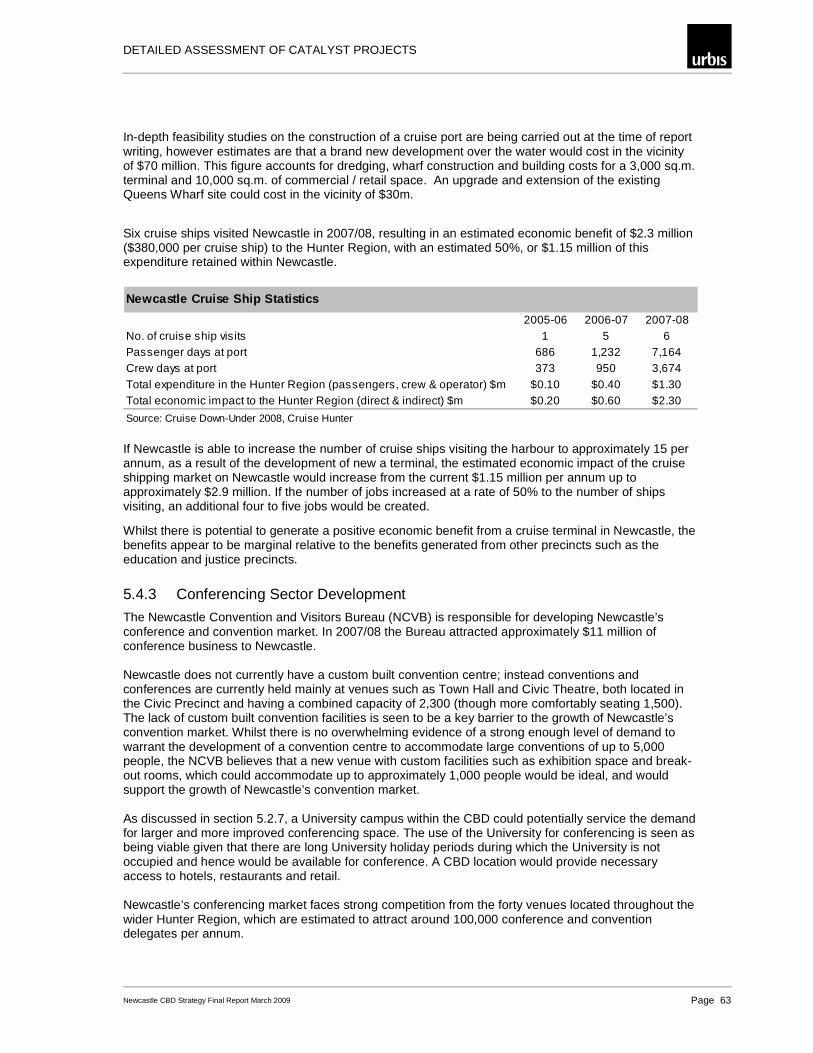
DETAILED ASSESSMENT OF CATALYST PROJECTS
Newcastle CBD Strategy Final Report March 2009 Page 63
In-depth feasibility studies on the construction of a cruise port are being carried out at the time of report writing, however estimates are that a brand new development over the water would cost in the vicinity of $70 million. This figure accounts for dredging, wharf construction and building costs for a 3,000 sq.m. terminal and 10,000 sq.m. of commercial / retail space. An upgrade and extension of the existing Queens Wharf site could cost in the vicinity of $30m.
Six cruise ships visited Newcastle in 2007/08, resulting in an estimated economic benefit of $2.3 million ($380,000 per cruise ship) to the Hunter Region, with an estimated 50%, or $1.15 million of this expenditure retained within Newcastle.
Newcastle Cruise Ship Statistics
2005-06 2006-07 2007-08No. of cruise ship visits 1 5 6Passenger days at port 686 1,232 7,164Crew days at port 373 950 3,674Total expenditure in the Hunter Region (passengers, crew & operator) $m $0.10 $0.40 $1.30Total economic impact to the Hunter Region (direct & indirect) $m $0.20 $0.60 $2.30
Source: Cruise Down-Under 2008, Cruise Hunter
If Newcastle is able to increase the number of cruise ships visiting the harbour to approximately 15 per annum, as a result of the development of new a terminal, the estimated economic impact of the cruise shipping market on Newcastle would increase from the current $1.15 million per annum up to approximately $2.9 million. If the number of jobs increased at a rate of 50% to the number of ships visiting, an additional four to five jobs would be created.
Whilst there is potential to generate a positive economic benefit from a cruise terminal in Newcastle, the benefits appear to be marginal relative to the benefits generated from other precincts such as the education and justice precincts.
5.4.3 Conferencing Sector Development
The Newcastle Convention and Visitors Bureau (NCVB) is responsible for developing Newcastle’s conference and convention market. In 2007/08 the Bureau attracted approximately $11 million of conference business to Newcastle. Newcastle does not currently have a custom built convention centre; instead conventions and conferences are currently held mainly at venues such as Town Hall and Civic Theatre, both located in the Civic Precinct and having a combined capacity of 2,300 (though more comfortably seating 1,500). The lack of custom built convention facilities is seen to be a key barrier to the growth of Newcastle’s convention market. Whilst there is no overwhelming evidence of a strong enough level of demand to warrant the development of a convention centre to accommodate large conventions of up to 5,000 people, the NCVB believes that a new venue with custom facilities such as exhibition space and break-out rooms, which could accommodate up to approximately 1,000 people would be ideal, and would support the growth of Newcastle’s convention market. As discussed in section 5.2.7, a University campus within the CBD could potentially service the demand for larger and more improved conferencing space. The use of the University for conferencing is seen as being viable given that there are long University holiday periods during which the University is not occupied and hence would be available for conference. A CBD location would provide necessary access to hotels, restaurants and retail. Newcastle’s conferencing market faces strong competition from the forty venues located throughout the wider Hunter Region, which are estimated to attract around 100,000 conference and convention delegates per annum.

DETAILED ASSESSMENT OF CATALYST PROJECTS
Newcastle CBD Strategy Final Report March 2009 Page 64
According to NCVB, day-trip convention / conference delegates account for around 50% of all delegates and are estimated to spend around $58 per day, while over-night / multi-day delegates account for 50% of all delegates, and are estimated to spend approximately $413 per day. Based on these estimates, and assuming that the average length of stay for multi-day visitors is 2.6 nights, as per Tourism Research Australia data, if Newcastle is able to attract 30% of the Hunter Region’s conference and convention delegates, the market could grow to generate an estimated $17 million per year.
Hunter Region Conference Delegate Expenditure
No. of DelegatesAverage Spend
Per TripTotal Annual Conference
Expenditure
Day / Part Day Conference Delegate 15,000 $58 $870,000
Overnight Conference Delegate 15,000 $1,074 $16,107,000
Total 30,000 - $16,977,000
Source: NVCB, TRA, Urbis
5.4.4 Key Issues & Challenges
• The economic benefit of cruise ships to Newcastle appears to be marginal – relatively low revenues and low employment generation.
• The majority of cruise ship passenger expenditure currently escapes to the broader Hunter Region.
• Interest from cruise ships to use Newcastle as a permanent port is unknown at this point. It faces strong competition from the nearby Sydney Port.
• Parking and traffic infrastructure would need to be put in place to support a cruise terminal.
• NCVB sees a cruise terminal as being suitable for large convention and conference dinners and cocktail parties for up to 300 people, however it is seen as not being suitable for the actual convention and conferences.
• There are currently no five star hotels in Newcastle and this is seen being a key barrier to the development of Newcastle’s conference and convention market.
5.5 Cultural Precinct In 2007 the NSW government and Newcastle Council developed and adopted the Civic and Cultural Precinct Plan. A Master Plan to accommodate and encourage the development of cultural and civic facilities around the existing City Hall area was adapted. Council has significant land holding in this precinct which could be redeveloped.
The expansion of the cultural and arts offer in the Newcastle CBD and utilising the existing heritage buildings would contribute to realising the Newcastle City Centre Plan Vision of celebrating the special character of Newcastle.
This section will review the potential benefits that can flow from expanding the cultural and arts facilities in the Newcastle CBD.
5.5.1 Facilitate cross-usage opportunities
Expanding the cultural and arts facilities around Civic if the Education and Justice precincts were to locate in this area would be consistent with developing a broader role for the Newcastle CBD and compliment each precinct and promote cross-uses. As mentioned in Section 3 above, city centres need to create the broadest role possible so as to satisfy a range of stakeholder needs in one location. This
DETAILED ASSESSMENT OF CATALYST PROJECTS
Newcastle CBD Strategy Final Report March 2009 Page 65
would maximise reasons for visit, length of stay and frequency of visit which are crucial for creating and active and vibrant urban space.
5.5.2 Social Benefits of Participation in Arts and Cultural Activities
There are a number of benefits that accrue from participating in cultural and arts activities. In general terms these are described as the improvement of literacy levels, increasing job skills, increased social interaction and reduced anti-social behaviour.
The Newcastle CBD has a strong cultural offering that will benefit from improved linkages and increased density / activity in the CBD. These facilities include:
� Newcastle Regional Art Gallery
� Newcastle Cultural Centre
� Newcastle Regional Museum
� Newcastle Library
� Civic Theatre
� City Hall
Culture, in its widest sense, has been found to improve quality of life and the richness of experiences available. It refreshes and expands the capacity of the mind and body and provides intrinsic benefits, which go a long way towards providing the rights of citizenship which in themselves encourage active and responsible citizens.6 Research has also shown that participation in artistic or music-related leisure, theatre attendance, reading for pleasure and writing for leisure all have a statistically significant and positive impact on person’s economic capital. These benefits are particularly relevant to Newcastle given the relatively low educational attainment and safety concerns in certain areas within the Newcastle LGA.
Various studies have found a number of social and economic benefits that emanate from participating in arts and cultural activities either as a creative or receptive participant.7 These benefits can be categorised broadly under six headings illustrated below.
1. Cognitive skills and educational attainment
A longitudinal study of 25,000 American high school students over a period from 1988 found that participation in arts and cultural programs positively affected educational attainment. Similarly, in the UK, research found a link between cultural participation and increased literacy, and above average reading and math skills.8
2. Community pride, identity and cohesion
A reputed Arts and Cultural Centre can promote a positive local image and identity, create a ‘sense of place’ and civic pride, promote cultural tourism, social cohesion, and personal and community empowerment.
6 Long, P.J.m Welch, M., Bramham, D.P., Butterfield, J., Hylton, K., Lloyd, E. Count me in. The dimensions of social inclusion through culture, media and sport, Leeds, United Kingdom: Centre for Leisure and Sport Research. (2002)
7 Creative participation is defined for the purposes of this report as participation associated with making, creating, organizing, initiating, producing, facilitating arts activities and indicates active involvement. While, receptive participation is participation that involves watching or purchasing a cultural event or product.
8 Ruiz, J , op cit

DETAILED ASSESSMENT OF CATALYST PROJECTS
Newcastle CBD Strategy Final Report March 2009 Page 66
3. Crime prevention
Where arts and sports activities have been targeted at young people at risk, or actual offenders, there have been significant reduction in crime figures in these areas or a reduced propensity to offend.9 For young people, participation has also been found to reduce truancy/bad behaviour at school. Arts activities create a diversion from criminal behaviour, facilitate key skills in learning, develop personal and social skills and provide routes into further education and employment. All these lead to the propensity not to re-offend or participate in criminal behaviour.
4. Self-esteem and life skills
Participation in arts has been found to increase confidence, improves communication skills and deepens the understanding of diversity which are all transferable life skills required for successful future employment.
5.5.3 Key Issues & Challenges
The key challenge for expanding the cultural and arts offer in the Newcastle CBD is that historically not for profit cultural and arts facility struggle to stay financially viable without financial support from Government and significant number of volunteers.
We also note that the maximum benefit from these facilities will be gained by improved physical linkages. Access from the waterfront via the new museum, Civic Place and Civic Theatre through to the Art Gallery and its link to Darby Street needs to be enhanced to maximise their value and impact.
5.6 Commercial Precinct The proposal put forward in relation to the commercial precinct is for development of a major rail based transport hub at Wickham, to provide a catalyst for new and intensified office development, especially government offices. This project seeks to explore the economic impact of developing a major office facility at this interchange and attracting an office relocation with government support.
The Newcastle office market contained a total of 220,219sq.m floor space as at July 2008 and 244,167sq.m as at January 2009. The table below breaks this down into the various office grades. Of the total office stock, 6% or 13,263sq.m was vacant as at July 2008 (a 1% reduction from July 2007) and 10%, or 24,410sq.m was vacant as at January 2009. This increase in vacancy was driven by an increase in supply of office accommodation.
Newcastle Office Supply, July 2008 - January 2009
Office Space (sq.m.) %
Office Space (sq.m.) %
Premium 0 0 0 0%A Grade 59,241 27% 75,530 31%B Grade 78,742 36% 84,517 35%C Grade 71,312 32% 72,946 30%D Grade 10,922 5% 11,174 5%Total 220,217 100% 244,167 100%
Jul-08 Jan-09
Source: Property Council of Australia
9 Ibid

DETAILED ASSESSMENT OF CATALYST PROJECTS
Newcastle CBD Strategy Final Report March 2009 Page 67
Historically, a total of 54,172sq.m of office floor space has been added to the Newcastle CBD in the past 10 years with 44% of that being completed in the past 6 months.
Recently Completed Office Developments include:
� HQ Building, 20-22 Honeysuckle Drive
� The Glass House, Lot 101 Hannell Street
� Sparke Helmore House (Honeysuckle House Stage 1), 28 Honeysuckle Drive � Price Waterhouse Coopers Centre (Honeysuckle House Stage 2), 26 Honeysuckle Drive –
6,060sq.m
� The Hunter Water Corporation Head Office (Lee 5 South, Lot 21), 36 Honeysuckle Drive – 5,275sq.m
� Riverwalk, 710 Hunter Street – 3 level building offering strata title offices B Grade – 3,000sq.m
� 670 Hunter Street – 5 level A Grade building, 10,273sq.m plus 197 car spaces.
We note that net absorption over the past 10 years has been approximately 5,000 sq.m. per annum. On this basis the CBD has approximately three to four years of supply in vacant accommodation before the CBD drops to its 10 year average vacancy rate of 7.4%.
New supply including the new NIB head office has replaced older office stock that has not yet been back filled. This is similarly the case for the former Hunter Water headquarters located in Hunter Street.
5.6.1 Implications for Meeting Newcastle’s Vision on Job Creation
The rising vacancy rates in the Newcastle CBD combined with the historically low supply of new office space suggest that there is limited demand for new office space in Newcastle.
According to the Lower Hunter Regional Strategy, the goal is for 10,000 new jobs to be created in Newcastle over the next 25 years, with most of these expected to be in the commercial services sector. Assuming that 75% of new jobs were to be created in the commercial services sector, an additional 150,000 sq.m. of office space would be required to support this growth. To put this in perspective, this is equal to approximately two thirds of the current office supply in Newcastle. A 20,000 to 30,000 sq.m commercial development (equivalent of meeting 15-20% of the new floor space target) would require a Federal/State government department of 1,000 to 1,500 employees. However, such a move would be highly dependent on government policy and would not be in the Hunter Development Corporation or Newcastle Council’s control.
5.6.2 Construction Costs
As mentioned above, to support the goal of creating 7,500 new commercial services jobs in Newcastle over the next 25 years, an additional 150,000 sq.m. of office space would be required. Assuming that the new office supply would comprise of an equal mix of premium and A-Grade space, construction costs are estimated to be in the order of $360 million ($2008), inclusive of car parking

DETAILED ASSESSMENT OF CATALYST PROJECTS
Newcastle CBD Strategy Final Report March 2009 Page 68
Office Construction Costs
GFA (sq.m.)Construction Cost
($ per sq.m.)Total Construction Cost
Premium 75,000 2,500 $187,500,000A-Grade 75,000 2,000 $150,000,000
Total 150,000 - $337,500,000Carparking 1,500 bays 15,000 per bay $22,500,000
Total Inc. Carparking - - $360,000,000
Source: Rawlinsons Construction Cost Guide, 2009
Note: Construction costs refer to 'raw' construction costs, and exclude the costs of land. Refer to appendix for a detailed definition.
5.6.3 Employment
Construction of 150,000 sq.m. of office space and 1,500 car bays would create an estimated 2,700 temporary construction jobs in Newcastle LGA, and an additional 4,800 indirect jobs during the construction phase.
150,000 sq.m. of new office space would support 7,500 office jobs, as per the Lower Hunter Regional Strategy. To achieve the goal of creating 10,000 new jobs in Newcastle over the next 25 years, an additional 2,500 jobs would need to be created in non-commercial industries.
Employment Impact of 150,000 sq.m. of New Office De velopment in Newcastle CBD
Direct Employment
Newcastle LGA's Share of Direct Employment
Supplier Employment
Multipler Effects
Total Newcastle Jobs
Construction Phase 1 3,240 2,268 4,837 7,105
Operational Phase 2 7,500 7,500 2,500 10,000
1. Total employment - full time, part time and casual
Source: ABS; Urbis
for the equivalent of one year employment
Assumes 30% of jobs generated will accrue outside of Newcastle LGA
3. Indicates the estimated number of ongoing jobs
5.6.4 Key Issues & Challenges
The commercial precinct proposal carries a number of challenges and risks. Key ones include the following:
• Worsening of the elongation of the CBD if commercial development takes place around a transport interchange at Wickham. New office development needs to initially be focused around the Civic precinct and within the eastern portions of Honeysuckle near Civic prior to development being promoted further to the west.
• Relocation of tenants from B Grade premises ($200-$250/sq.m net rent pa) into new A Grade premises ($300-$350/sq.m net rent pa) is questionable. Companies may find it difficult to afford and absorb higher rents that would be incurred if moving form their current premises to new office space. We note that there have been some notable exceptions including NIB and Spark Helmore, however these are at the upper end of the Newcastle corporate market.

DETAILED ASSESSMENT OF CATALYST PROJECTS
Newcastle CBD Strategy Final Report March 2009 Page 69
• Vacancy rates are on the rise indicating limited new demand for office space from the local market. New office space would most likely need to be absorbed by government department’s, however, their plans to re-locate are unknown, and not within HDC’s or Council’s control.

WHAT THE FUTURE HOLDS FOR NEWCASTLE CBD
Newcastle CBD Strategy Final Report March 2009 Page 70
6 What the Future Holds for Newcastle CBD The previous discussion in Section 5 looked at the commercial viability, potential benefits and challenges and issues in each catalyst area individually. This section takes a more holistic view and recognises the connection or reliance of each precinct on the other.
The following will highlight the key issues and implications of Section 3 What Makes a CBD Work? And Section 4 National and International Experiences of Regional CBDs on the location and sequencing decisions behind various proposals for revitalising the Newcastle CBD. It is worth noting that all these points are consistent with the Principles/Criteria: Checklist for Newcastle CBD Regeneration Plans arrived at during the 12-13 February 2009 Hunter Development Council workshop.
6.1 Implications of CBD Critical Success Factors on Proposed Catalyst Projects
This section will look at the key principles which are considered to underpin the success of vibrant and viable city centre
The Newcastle CBD is elongated East-West and extends approximately four kilometres in length from Wickham to Newcastle East. The CBD comprises of at least three distinct areas – Wickham in the west, Civic in the middle and Newcastle East. Furthermore, Honeysuckle is isolated from the rest of the CBD by the train line. The steep Hill behind the Hunter Street Mall is another source of North-South division. These natural and man-made topographical barriers have resulted in poor permeability between different areas within the CBD and have prevented the area reaching an adequate scale of activity to be a competitive destination.
As discussed in Section 3, the agglomeration of economic and social activity within a geographically compact space is a key quality of vibrant, lively and safe CBD. However, you find almost the converse in Newcastle. In addition to the topographical challenges described above, the departure of the Newcastle Hospital from the CBD, development of regional shopping centres in nearby suburbs and the development of commercial offices in Honeysuckle have all contributed to the dilution of a sufficient scale of agglomeration of economic and social activity in the Newcastle CBD. This has also negative impacts on safety and crime in certain areas of the CBD. As a result, the CBD has a poor sense of “place”.
6.2 Proposed Location Given lessons from the past experiences of the Newcastle CBD and other national and international CBDs, the location of future developments needs considerable thought.
Given the potential benefits emanating from creating a broader role for the CBD, a sense of “place”, mixed use and complementarities among the justice, education and cultural precincts, these should be closely located and clustered together. Given it’s past and the presence of a number of heritage sites, Civic offers a natural location for these three precincts. As much as possible, these precincts should be within walking distance of each other. That would be key to revitalising the Newcastle CBD. This will also help realise the Newcastle City Centre Plan Vision of ensuring the human scale development at the pedestrian level, establish Newcastle as a learning centre and improve the safety throughout the city.
The location of the proposed GPT shopping centre rightly so should be around the Hunter Street Mall as this should be positive for safety and crime in that area. This is also consistent with agglomerating the retail offer in the CBD within one core area. Retailers tend to trade better when co-located with other retailers since customers prefer to comparison shop and get different things within one area.
Future commercial office development should be encouraged to be located immediately in and around Civic prior to continuing development in Wickham to facilitate the agglomeration of activity in and around a core. This would foster development of ground level retail around the Civic core, complementing the broader regional role of the proposed GPT development.

WHAT THE FUTURE HOLDS FOR NEWCASTLE CBD
Newcastle CBD Strategy Final Report March 2009 Page 71
The potential future removal of the railway line with a new terminus at Wickham will also have significant benefits to the CBD in opening up multiple north-south oriented pedestrian and vehicle corridors as well as providing direct access to the Newcastle Waterfront and better connecting the strengthening Cultural Precinct.
6.3 Staging and Timing While a number of the catalyst projects can have significant economic or vitality benefits to offer the Newcastle CBD, the reality is there are budgetary and time constraints which would not allow for the catalyst projects to all proceed in parallel. Therefore, staging of development is crucial. This means both having a long-term vision for the Newcastle CBD and an eye on the appropriate sequencing of these developments starting in the short-term.
The focus of sequencing should be on getting the highest return for the available investment and also building small successes that can be strategically leveraged for the need for additional funding in the future. There is nothing more convincing than demonstrable success.
It is crucial to stage the development of the different precincts in the Newcastle CBD. We understand that the long-term view is to push out the CBD up to Wickham. However, this should only be done once a sufficient scale of development takes place in the more established sections of the CBD, with a view on maximising the economic and social benefits of agglomeration. Otherwise, developing Wickham prematurely may further dilute the already low concentration of activity in the CBD.
Given the strong links between the Justice, Education and Cultural precincts the timing of their development should be well-sequenced. First, decision on the relocation of the law courts to a new justice precinct should be fast tracked in order to create some certainty and a focus for other complimentary development such as the University. Second, the first stage of the UoN which include the Law Faculty can then follow so it is closely located to it. This is to take advantage of the vibrancy and foot traffic that should result from the cross-uses between the two precincts. The second stage of the University campus development is likely to require land across the railway line and this may strengthen the need to remove the railway line east of Civic. Third, the cultural precinct can start to expand with potentially higher demand for cultural and arts events particularly from the new student population in the CBD.
In a sense the retail precinct does not need to be timed with the other developments. This is more dependent on how quickly GPT can muster the required capital to commerce construction and how quickly various permits, (i.e. road closures), land acquisitions and the termination of the railway line in Newcastle can be completed. However, given that there is unlikely to be an alternative to the GPT proposal at the same scale proposed, Government should try to reach a firm agreement on this development as soon as possible as this development will provide a significant economic boost to the region and assist in revitalising the Hunter Street Mall area.

APPENDICES
Newcastle CBD Strategy Final Report March 2009 Appendix A
Appendix A Definitions

APPENDICES
Newcastle CBD Strategy Final Report March 2009 Appendix A
Construction costs: costs given are average prices for typical buildings as at December 31, 2008, and include allowance for preliminaries, builders profits and overheads. Costs should be adjusted to account for factors such as sloping sites, foundation problems, high wall to floor ratios, unusual shape, and any special design factors. Costs exclude land, demolitions, balconies, covered ways, external services outside 3 meters from the outside face of the building, external works other than those immediately adjacent to the building, loose or special equipment, furniture, furnishings, legal and professional fees.
Input-Output Analysis: Input-Output (I-O) analysis is a useful way of measuring the impact of economic shocks to a regional
economy. I-O analysis requires the use of I-O tables for the defined region. Generating such tables is a complex, resource intensive process. I-O tables are a snap-shot of an economy. They provide a detailed picture of the intermediate transactions in an economy, and describe the supply and use of the products for that economy. As such, they provide great detail on the workings of an economy, and the interrelationships between different industries, different segments of final demand (e.g. exports, households), and different sources of inputs (e.g. imports, labour). When an individual industry changes its level of production, the impact is felt by all industries that are linked to that industry via supply or demand chains. By observing how each industry and segment of the economy is linked, it is possible to estimate how a shock that changes production in one industry impacts on the economy as a whole. I-O Multipliers are a useful product of I-O tables. Multipliers are a simply way of showing the impact on one industry on the rest of the economy. Production multipliers show how much production is required throughout the entire economy to produce $1 worth of production in a single industry. Another useful multiplier is the employment multiplier – it shows how many jobs are required to produce $1 million in a single industry. For the purposes of this analysis we have utilised employment multipliers. I-O employment multipliers are generally divided into four segments:
1. Initial Effects: The extra employment required to construct the facility. 2. First Round Effects: The amount of employment created in all industries of the economy to
produce the goods required for the construction of the facility.
3. Industrial Support Effects: The first round output from all industries will induce output from all industries, and in turn, these will induce extra output, and so on. All of this extra output will require increased employment.
The first round effects and industrial support effects are cumulatively known as the production induced effects.
4. Consumption Induced Effects: The construction of the facility (initial effect) and the production induced output wage and salary earners will earn extra income which they will spend on commodities produced by all industries in the economy. This spending will induce further production in all industries. The required employment for this further induced production is the consumption induced output.
There are a few underlying assumptions when forecasting impacts using I-O analysis that need to be taken into account : � There is a fixed input structure in each industry, and all producers in an industry produce an
identical product (or products in fixed proportions to each other). In reality, however, demand changes in one industry is likely to change the mix of goods demanded in other industries as relative prices of goods change.

APPENDICES
Newcastle CBD Strategy Final Report March 2009 Appendix A
� Each industry exhibits constant returns to scale in production. That is, greater production can only be achieved by increasing demand for all inputs in fixed relative proportions. This is because I-O analysis only describes average effects, not marginal effects. In reality, industries are likely to be able to achieve economies of scale as they expand.
� There is no restriction to the availability of labour or capital at a fixed price. Further, labour is
assumed to have been idle prior to any economic shock, and not contributing to final demand. However:
� It is likely that some new labour demand resulting from an economic shock will be satisfied by
labour that was previously employed (resulting in a zero net increase in employment). � Previously unemployed workers are likely to have been on some form of welfare, therefore
contributing to final demand. On average, these assumptions generally result in I-O analysis exaggerating the impact of economic shocks, whether positive or negative. However, as long as these assumptions are kept in mind, I-O analysis is still a useful and illustrative tool for conducting economic analysis.