newcastle transport strategy
TRANSCRIPT

Newcastle Transport Strategy
www.newcastle.nsw.gov.au

Production Newcastle Transport Strategy prepared by the Infrastructure Group of Newcastle City Council
Published by Newcastle City Council PO Box 489, Newcastle NSW 2300 Ph: 4974 2000 Fax: 4974 2222 Email: [email protected] Web: www.newcastle.nsw.gov.au
December 2014 © 2014 Newcastle City Council

Table of ContentsGlossary and Acronyms .................................................................................................. 4
1.0 Introduction ................................................................................................................ 71.1 Process ............................................................................................................... 8
1.2 Structure ............................................................................................................. 8
2.0 Context ..................................................................................................................... 102.1 Governments’ Roles in Transport ..................................................................... 10
2.2 Policy and Planning Context ............................................................................ 12
2.3 Community Context ......................................................................................... 18
2.4 Challenges and Opportunities .......................................................................... 24
3.0 Objectives and Targets ........................................................................................... 26
4.0 Land Use and Transport.......................................................................................... 324.1 Policy Commitments ........................................................................................ 34
4.2 Actions .............................................................................................................. 34
5.0 Public Transport ...................................................................................................... 365.1 Policy Commitments ........................................................................................ 37
5.2 Actions .............................................................................................................. 37
6.0 Walking and Cycling ................................................................................................ 386.1 Policy Commitments ........................................................................................ 39
6.2 Actions .............................................................................................................. 40
7.0 Parking ..................................................................................................................... 427.1 Policy Commitments ........................................................................................ 43
7.2 Actions .............................................................................................................. 43
8.0 Roads and Freight ................................................................................................... 448.1 Policy Commitments ........................................................................................ 45
8.2 Actions .............................................................................................................. 45
9.0 Travel Demand Management ................................................................................. 469.1 Policy Commitments ........................................................................................ 47
9.2 Actions .............................................................................................................. 47
10.0 Implementation ...................................................................................................... 4810.1 Actions ............................................................................................................ 48
References ..................................................................................................................... 52
Figures
Figure 1: The NSW Transport Cluster .............................................................................. 11
Figure 2: Council’s Integrated Planning and Reporting Framework ................................ 16
Figure 3: Residential Location of Newcastle LGA Workers ............................................. 18
Figure 4: Newcastle LGA - Number of Motor Vehicles ................................................... 19
Figure 5: Newcastle LGA - Number and Degree of Crashes 2008 - 2012 (by year) ....... 23
Figure 6: Separation of bicycles and motor vehicles according to traffic speed and volume .................................................................................. 39
Figure 7: Typical space occupied in a city street by three common
modes of transport ........................................................................................... 45
Tables
Table 1: Key Transport Indicators1 by Statistical Local Area of Residence 2010/11 ....... 21
Table 2: Newcastle LGA - Method of Travel 1991 - 2011................................................ 22
Table 3: Strategic Directions and Strategic Objectives ................................................... 27
Table 4: ‘Connected City’ Objectives, Strategies and Responsible Agencies ................ 29
Table 5: Targets ............................................................................................................... 30
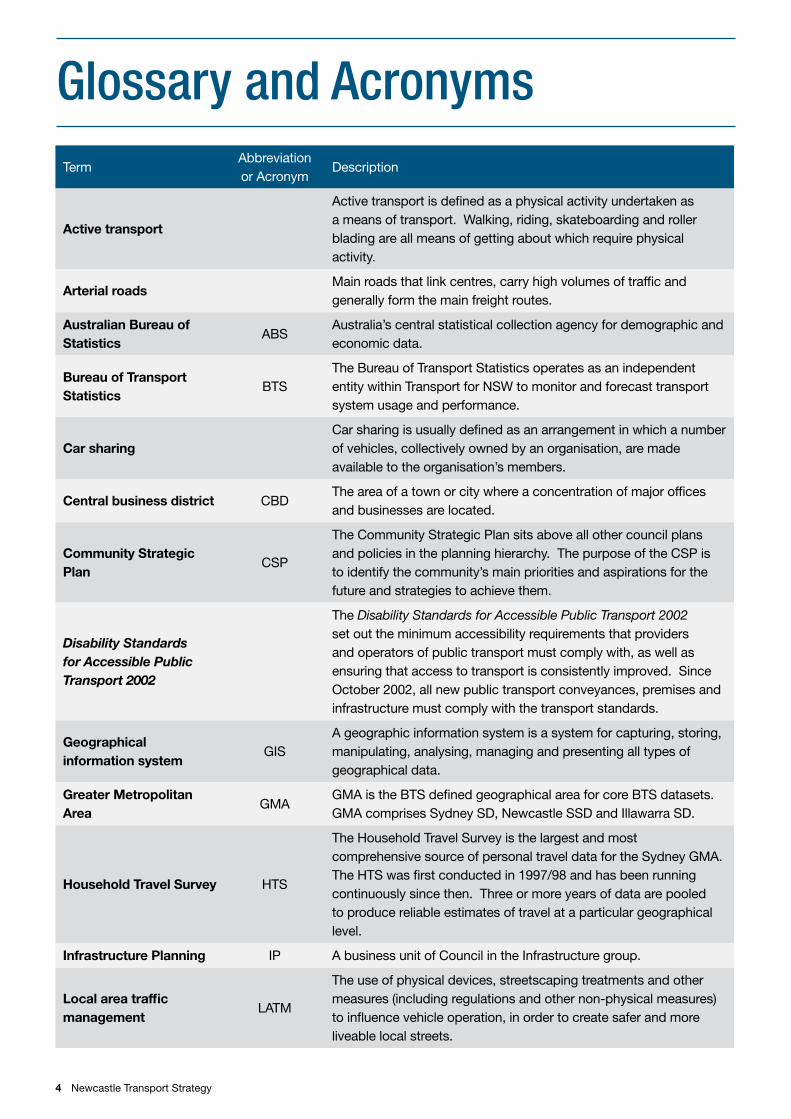
TermAbbreviation or Acronym
Description
Active transport
Active transport is defined as a physical activity undertaken as a means of transport. Walking, riding, skateboarding and roller blading are all means of getting about which require physical activity.
Arterial roadsMain roads that link centres, carry high volumes of traffic and generally form the main freight routes.
Australian Bureau of Statistics
ABSAustralia’s central statistical collection agency for demographic and economic data.
Bureau of Transport Statistics
BTSThe Bureau of Transport Statistics operates as an independent entity within Transport for NSW to monitor and forecast transport system usage and performance.
Car sharingCar sharing is usually defined as an arrangement in which a number of vehicles, collectively owned by an organisation, are made available to the organisation’s members.
Central business district CBDThe area of a town or city where a concentration of major offices and businesses are located.
Community Strategic Plan
CSP
The Community Strategic Plan sits above all other council plans and policies in the planning hierarchy. The purpose of the CSP is to identify the community’s main priorities and aspirations for the future and strategies to achieve them.
Disability Standards for Accessible Public Transport 2002
The Disability Standards for Accessible Public Transport 2002 set out the minimum accessibility requirements that providers and operators of public transport must comply with, as well as ensuring that access to transport is consistently improved. Since October 2002, all new public transport conveyances, premises and infrastructure must comply with the transport standards.
Geographical information system
GISA geographic information system is a system for capturing, storing, manipulating, analysing, managing and presenting all types of geographical data.
Greater Metropolitan Area
GMAGMA is the BTS defined geographical area for core BTS datasets. GMA comprises Sydney SD, Newcastle SSD and Illawarra SD.
Household Travel Survey HTS
The Household Travel Survey is the largest and most comprehensive source of personal travel data for the Sydney GMA. The HTS was first conducted in 1997/98 and has been running continuously since then. Three or more years of data are pooled to produce reliable estimates of travel at a particular geographical level.
Infrastructure Planning IP A business unit of Council in the Infrastructure group.
Local area traffic management
LATM
The use of physical devices, streetscaping treatments and other measures (including regulations and other non-physical measures) to influence vehicle operation, in order to create safer and more liveable local streets.
Glossary and Acronyms
4 Newcastle Transport Strategy

Local government area LGA
Local roads
Local roads are the responsibility of councils to fund, determine priorities and carry out works and comprise those roads not classified under the Roads Act 1993 and some classified roads that provide for local circulation and access.
Mobility The ability to move or be moved easily and without constraint.
Newcastle Voice Newcastle Voice is Council’s community reference panel.
Projects and Contracts P & C A business unit of Council.
Regional roads
Regional roads provide the main connections between smaller towns and districts and form a sub-arterial function within major urban centres. This category generally includes roads classified under the Roads Act 1993 as Secondary Roads and some of the less significant Main Roads and some roads not classified under the Roads Act 1993.
Regulatory Services RS A business unit of Council in the Planning and Regulatory group.
Roads and Maritime Services
RMS
Roads authorityA roads authority is a person or body that is, by or under the Roads Act 1993, declared to be a roads authority and, in relation to a particular public road, means the roads authority for that road.
State roadsState roads are the major arterial links throughout NSW and within major urban areas for the movement of people and goods. State roads are funded and managed by RMS.
Statistical division SD
Statistical local area SLA
SLA is an Australian Standard Geographical Classification (ASGC) defined area. SLAs are local government areas or part thereof. There are three SLAs in Newcastle – Inner City, Throsby and Outer West. The ASGC is being progressively replaced by the Australian Statistical Geography Standard (ASGS). SLAs have been made available in 2011 to provide a bridging unit between the ASGC and the ASGS.
Strategic Planning SP A business unit of Council in the Planning and Regulatory group.
Sub-arterial roadsRoads connecting arterial roads to areas of development, and carrying traffic directly from one part of a region to another.
Transport for NSW TfNSW
Travel demand management
TDM
Travel demand management, also called transportation demand management or mobility management, is the application of techniques and programs to achieve more efficient use of transport resources. It emphasises the movement of people and goods, rather than motor vehicles, and so gives priority to more efficient modes (such as walking, cycling, ridesharing and public transit), particularly under congested conditions.
Vehicle kilometres travelled
VKT
5Newcastle Transport Strategy
6 Newcastle Transport Strategy

1.0 IntroductionMany aspects of our lives are impacted by how we get around, to work or school, shop and entertainment, and the movement of goods to support us. Transport systems shape our land use (and vice versa) and affect other aspects of the physical environment. Social and health impacts, such as isolation due to lack of access and reduced physical activity can be attributed to the way our transport systems have evolved.
Transport is a shared responsibility across all levels of government. Council has a role to play in contributing to better social, health and environmental outcomes for the Newcastle community, through its decisions and actions on transport matters.
A wide range of studies and plans on various aspects of transport have been produced, and implemented to varying degrees, by service units across Council over time. Council’s adoption of the Newcastle Community Strategic Plan has provided the opportunity to realign its strategies, plans and guidelines to the seven strategic directions identified by the community for Newcastle. The consultation undertaken for its development provided a clear picture of community aspirations for transport in Newcastle, and their areas of concern.
The key purpose of the Newcastle Transport Strategy is to guide Council’s transport-related decisions and actions to contribute, within the limits of its roles and responsibilities, to achieving the objectives of the Newcastle Community Strategic Plan. It aims to:
• enunciate Council’s roles and responsibilities
• define policy commitments
• note current issues and Council’s proposed responses
• consolidate information and relevant transport actions from a range of sources
• allocate responsibility for actions, and their prioritisation, for translation into future operational plans and delivery programs.
7Newcastle Transport Strategy

1.1 ProcessThe Newcastle Transport Strategy was prepared by a group of Council officers from across the organisation, with roles covering the spectrum of Council’s transport operations. Over years, Council has prepared a wide range of reports and studies on aspects of transport. It does not, however, have an overarching transport strategy. Development of this strategy has been largely a task of consolidation of information from a wide range of adopted documents and supporting studies, confirming the status and relevancy of those documents, and determining how best to respond to current issues, challenges and community expectations, within the bounds of Council’s roles and responsibilities.
A series of working papers was produced to consolidate background information. The working papers are mode or theme based, covering:
• planning and policy context
• public transport
• walking and cycling
• parking
• roads and freight
• travel demand management.
The majority of the papers are presented in a consistent format, covering Council’s role, key references, a description of the existing situation, discussion of issues, challenges and opportunities and presentation of some considerations for future policy setting. Such policy considerations include submissions and specific resolutions made by Council, and positions and targets adopted by other levels of government for transport outcomes to which Council can contribute or for which it has shared responsibility.
Data for the working papers has been derived from a range of sources. Products from an agreement Council had with the company ‘.id’ to analyse and present census data and prepare population and dwelling forecasts were often referenced. In addition to this resource, data was also sourced directly from the Australian Bureau of Statistics and the NSW Bureau of Transport Statistics (primarily from the Household Travel Survey) to inform sections on demographics and travel patterns. Statistics on road safety were obtained from Roads and Maritime Services.
Specific surveys have not been undertaken for this project. However, the outcomes of previous Newcastle Voice consultation processes, including
Cycling in Newcastle (2010), Road Safety (2010) and Newcastle 2030 (2012) have been reviewed. Officers’ participation in public forums for projects undertaken by the NSW Government and other organisations has provided opportunities to glean information about the community’s aspirations for transport and their areas of concern. Forums conducted as part of the Newcastle 2030 project, the Hunter Independent Public Transport Inquiry, the NSW Long Term Transport Master Plan and the Newcastle Urban Renewal Strategy have led to useful insights.
Public exhibition offered the opportunity for further comment and input by the community on Council’s policy positions and proposed actions.
1.2 StructureThe body of the Newcastle Transport Strategy is set out as follows.
Section 2 sets out the context for the strategy. It notes the roles of the three levels of government in transport, sets out the planning and policy framework for decision making on transport by Council, and provides a summary of demographics and travel patterns in Newcastle. The ‘big picture’ issues and challenges which will influence Council’s future actions are noted.
Section 3 sets out the vision for transport in Newcastle, the objectives that Council will address and how progress towards meeting the objectives will be assessed.
Sections 4 through to Section 9 are centred on a transport mode or theme, covering land use, public transport, walking and cycling, parking, roads and freight and travel demand management, and describe the actions that Council will undertake. These sections set out Council’s commitments, or policy positions, as they relate to each theme. In some cases, the policy statement is an indication of a commitment to a particular practice, and may be borne out or supported by the following actions. Others may relate to matters for which Council does not have direct control, but indicate a particular advocacy position or support for an Australian Government or NSW Government objective. Collectively, the policy commitments are intended to provide a framework for future decisions on transport matters.
Section 10 sets out how the Newcastle Transport Strategy will be implemented, monitored and reviewed.
8 Newcastle Transport Strategy

9Newcastle Transport Strategy

2.0 Context2.1 Governments’ Roles in TransportIn practice, aspects of transport are addressed by the three levels of government, with some areas of overlap.
Constitutional responsibility for local government and for transport rests with state and territory governments. In recent years, there have been initiatives to create national laws and national regulators for the heavy vehicle, rail and maritime sectors, aimed at improving efficiencies without compromising safety standards. In terms of land transport, the Australian Government’s focus has been predominantly on roads, though the establishment of Infrastructure Australia, and recent policy initiatives, such as the National Urban Policy, suggest increasing interest in urban transport issues.
The NSW Government is responsible for public transport, vehicle licensing and registration, and regulates and enforces road user behaviour. It is responsible for public transport infrastructure, such as buses, trains, ferries, light rail vehicles and interchanges, the planning of public transport networks, timetabling, information and service provision. The NSW Government is responsible for provision and operation of the road network, though through the Roads Act 1993 and the Local Government Act 1993, some of these functions are devolved to local government. Through Roads and Maritime Services, the NSW Government provides infrastructure for and maintains state roads, controls traffic on classified roads and has control of traffic signals on all roads. Through its policies and plans, the NSW Government can facilitate desirable land use and transport outcomes and facilitate travel behaviour change.
10 Newcastle Transport Strategy

What Does Council Do?
Council makes land use decisions and guides development outcomes, which impact on transport outcomes. In preparing local environment plans and development control plans, and in assessment of development applications, Council must consider how it can address objectives to improve access by sustainable transport modes, reduce travel demand and reduce dependence on cars. It facilitates provision of roads, footpaths, cycleways, public transport support infrastructure and traffic management facilities by developers through preparation of developer contribution plans and application of appropriate consent conditions.
Council owns and manages approximately 745km of local roads and 44km of regional roads. It undertakes inspections and funds, prioritises and undertakes maintenance and upgrade of these assets. Council is also responsible for the footways of state roads.
In accordance with its delegation from Roads and Maritime Services, Council undertakes traffic management on local roads and regional roads, including traffic planning and investigations, regulation of works, structures and activities, and processing of road freight applications.
Council constructs, inspects and manages footpaths and cycleways and associated infrastructure such as bike parking, in the public domain.
Under the Road Transport (General) Regulation 2013, Council is a parking authority and as such can establish and operate pay parking schemes, define restricted parking areas, and establish permit parking schemes. Council is an owner and provider of off-street and on-street parking, and is responsible for enforcement of parking rules throughout the city.
Council, in its capacity as a roads authority, approves the location of transport stops. At its discretion, it provides infrastructure such as seating and shelters. If Council does choose to provide this infrastructure, it must ensure that it is compliant with the Disability Standards for Accessible Public Transport 2002.
Council has an advocacy role, on behalf of the Newcastle community, to other levels of government for improvements in transport in the city and funding to meet transport needs.
The functions that Council performs arise from its statutory responsibilities under such legalisation as the
11Newcastle Transport Strategy
Figure 1: The NSW Transport ClusterSource: http://www.transport.nsw.gov.au/transport-portfolio, viewed 3 September 2014.
Minister for Transport
Minister for Roads and Ports
Secretary
Office of Transport Safety
Investigations
Parliament
Independant Transport Safety
Regulator
Transport for NSW
Customer Experience
Freight and Regional Development
Planning and Programs
Policy and Regulation
Transport Projects
Transport Services
Sydney Ports Coroporation
Newcastle Ports Coroporation
Port KemblaPorts Coroporation
Sydney Ferries
Privatebus operators
Lightrail operator
Roads & MaritimeServices
Sydney Trains
NSW Trains
State TransitAuthority
PRIVATE OPERATORS OPERATING AGENCIES
PORT CORPORATIONS
CORE DIVISIONS
Environmental Planning and Assessment Act 1979, the Roads Act 1993 and the Local Government Act 1993. Under the latter, Council also has a responsibility to prepare a community strategic plan that sets out the main priorities and aspirations for the local government area, and which is developed having regard to relevant state and regional plans of the NSW Government. The consultation process for the development of the Newcastle Community Strategic Plan highlighted the importance of transport choice, with effective public transport and walking and cycling networks key community priorities.
Like many local governments across Australia, Council has financial constraints which impact on how comprehensively its statutory roles are addressed and the extent to which it can undertake discretionary functions.
2.2 Policy and Planning ContextAs highlighted, responsibility for transport is shared across the three levels of government, with some significant areas of overlap, which heightens the need for coordination of action and alignment of objectives. At all levels, planning for transport should be consistent with, and supportive of, broader social, economic and environmental goals for a just, prosperous and environmentally responsible society.
National, State and Regional Context
Many of the issues faced by Newcastle are shared by other communities. The Australian and NSW Governments have produced a range of documents that provide context for development of a transport strategy for Newcastle, in that they:
• set out roles
• enunciate policy
• highlight opportunities for collaboration between different levels of government
• contain actions for implementation at a local level and/or
• set targets which are relevant at a local level.
Council should have regard to these in shaping our own policy and in framing actions in response to specific local issues. Key documents are noted below.
12 Newcastle Transport Strategy

National
Disability Standards for Accessible Public Transport
The Disability Standards for Accessible Public Transport 2002 set out the minimum accessibility requirements that providers and operators of public transport must comply with, as well as ensuring that access to transport is consistently improved. Since October 2002, all new public transport conveyances, premises and infrastructure must comply with the transport standards.
National Road Safety Strategy 2011 – 2020
The National Road Safety Strategy 2011 – 2020 (Australian Transport Council, 2011) aims to set out a path for national action on reducing fatal and serious injury crashes on Australian roads. It is founded on the internationally recognised ‘Safe System’ approach. The National Road Safety Strategy 2011-2020 sets a target of cutting deaths and serious injuries on our roads by at least 30% by 2020.
Our Cities, Our Future – a national urban policy for a productive, sustainable and liveable future
The Minister for Infrastructure and Transport released Our Cities, Our Future — A national urban policy for a productive, sustainable and liveable future, in May 2011. The policy outlines the Australian Government's goals and priorities for the nation’s cities and how it will contribute to making them more productive, sustainable and liveable. It recognises the critical roles that state, territory and local governments, the private sector and individuals play in planning, managing and investing in cities.
The Australian National Cycling Strategy 2011 – 2016
The overarching vision is to realise a step-change in attitudes to cycling and in the numbers of riders in Australia. In the short term, the goal is to double the number of people riding by 2016. It sets out a framework of six key priorities and objectives with generic actions that can be applied within states and local governments.
Walking, Riding and Access to Public Transport
This document explores how the Australian Government can work with other levels of government, business and the community to encourage and support walking and riding as part of the transport systems in Australia's cities and towns. The report explores options to increase the mode share of walking, riding and public transport through planning, building and encouragement.
13Newcastle Transport Strategy

State
NSW 2021 – A Plan to Make NSW Number One
NSW 2021 is a ten-year plan to guide policy and budget decision making in NSW. It is based around five key strategies: rebuild the economy; return quality services; renovate infrastructure; strengthen our local environment and communities; and restore accountability to government. The plan enunciates 32 goals, including reducing travel times; increasing patronage on public transport by making it a more attractive choice; improving customer experience with transport services; and improving road safety.
NSW BikePlan1
Released in 2010, the NSW BikePlan included targets for lifting the share of short trips by bike in Greater Sydney for all travel purposes to 5% and doubling the use of cycling to get to work across NSW. These were carried through to the Newcastle Cycling Strategy and Action Plan (2012). The current NSW Government strategies in relation to cycling are the regional transport plans and Sydney’s Cycling Future.
NSW Freight and Ports Strategy
The NSW Freight and Ports Strategy is intended to provide a framework for industry, all levels of government and stakeholders to guide investments and other decisions to enhance freight logistics in NSW.
NSW Long Term Transport Master Plan
The Master Plan sets the direction for transport planning for the next 20 years. It provides a framework for transport policy and investment decisions that respond to key challenges that the transport system in NSW needs to address to support the State’s future economic and social performance. It covers all modes, roads and freight and foreshadows further detailed planning.
NSW Road Safety Strategy 2012 – 2021
The NSW Road Safety Strategy is a ten year blueprint to reduce death and serious injury on NSW roads by more than 30%, consistent with the target of the National Road Safety Strategy 2011 – 2020. Initiatives are aligned with the Safe System framework of safer roads, safer vehicles, safer people, safer speeds and post crash trauma treatment.
Regional
Lower Hunter Regional Strategy2
The government’s vision embraces a sustainable future for the region and emphasises the integration of land use and transport planning to connect homes, employment and services, minimising the need to travel and encouraging resource and energy efficiency.
Hunter Regional Transport Plan
Released in April 2014, the Hunter Regional Transport Plan is one of ten regional plans released by Transport for NSW in fulfilment of commitments made in the NSW Long Term Transport Master Plan. It notes commitment by the NSW Government to continue to work with local councils to identify and prioritise actions for the future, so improvements can be delivered to communities as funding becomes available.
1 The NSW Government has since released a new strategy, Sydney’s Cycling Future. 2 The Lower Hunter Regional Strategy is being reviewed by the Department of Planning and Environment.
14 Newcastle Transport Strategy

Local Context
The Local Government Amendment (Planning and Reporting) Act 2009, assented to in October 2009, introduced reforms aimed at improving integration of statutory planning and reporting processes, strengthening councils’ strategic focus and streamlining the reporting process. Under the integrated planning and reporting framework introduced by the changes, councils are required to develop a long-term community strategic plan in collaboration with their community that:
• identifies the main priorities and aspirations for the future of the community
• establishes strategic objectives and strategies to achieve those objectives
• addresses social, environmental, economic and civic leadership issues in an integrated manner
• has due regard to the State Plan and other relevant state and regional plans
• is based on social justice principles.
Community strategic plans developed by councils are required to be supported by a resourcing strategy that addresses long term financial planning, workforce management planning, and asset management planning. The community’s goals are translated into actions through four-year delivery programs and annual operational plans.
Newcastle 2030 – Newcastle Community Strategic Plan sets out the long term vision of Newcastle residents for a smart, liveable, sustainable city. Seven strategic directions emerged from the engagement process:
• a connected city
• a protected and enhanced environment
• vibrant and activated public places
• a caring and inclusive community
• a liveable and distinctive built environment
• a smart and innovative city
• open and collaborative leadership.
Each strategic direction is supported by objectives and strategies, with responsibility for implementation shared by all levels of government, other agencies and the community. The Newcastle Transport Strategy aligns with the ‘connected city’ strategic direction, and
sets out Council’s actions to contribute to achievement of the community vision of a city in which transport networks are well connected and convenient, and walking, cycling and public transport are viable options for the majority of residents’ trips.
With the implementation of the integrated planning and reporting framework and adoption of the Newcastle Community Strategic Plan, Council initiated reconfiguration of its document hierarchy and review of its strategies, plans and policies, to clarify alignment with the seven strategic directions.
Council has undertaken detailed studies and prepared plans on various aspects of transport over time and has advocated for preparation of a regional transport plan by the NSW government to establish the framework for coordinated action by both state and local governments. It does not however, have a consolidated transport strategy. Council’s broad directions for transport are essentially embodied in the Newcastle Urban Strategy, which, prior to development of the Newcastle Community Strategic Plan, was Council’s key strategic document and guided land use and transport decisions in Council ³.
³ As noted in Section 4, the Newcastle Urban Strategy is being transformed into a local planning strategy.
Transport strategies and actions are embedded in a wide range of documents, some of which will be, or have been, superseded with adoption of the new core strategies. In addition to the Newcastle Urban Strategy, documents which have informed and directed Council’s activities across the transport spectrum include:
• A Car Parking Policy for Newcastle (Nelson English, Loxton and Andrews Pty Ltd, 2000)
• Community Plan 2006 - 2010 (Newcastle City Council, 2006)
• Disability Action Plan 2005 - 2010 (Newcastle City Council, 2005)
• Newcastle Airshed Management Action Plan (Newcastle City Council, 2005)
• Newcastle Cycling Strategy and Action Plan (The City of Newcastle, 2012)
• Newcastle Environment Management Plan (Newcastle City Council, 2003)
15Newcastle Transport Strategy

Figure 2: Council’s Integrated Planning and Reporting Framework
• Newcastle Pedestrian Access and Mobility Plan (Gutteridge, Haskins & Davey Pty Ltd, 2002)
• Newcastle Recreation Plan 2006 – 2016 (Newcastle City Council, 2006)
• Pedestrian Network Strategic Plan Stage 1 Report (The City of Newcastle, 1996)
• Road Safety Strategic Plan 2002 -2010 (Newcastle City Council, 2002).
Brief summaries of these documents and notes on their relevance to development of the Newcastle Transport Strategy are provided in the background working papers. The project team reviewed the status of transport-related actions of the listed documents (excluding the Newcastle Cycling Strategy and Action Plan, due to its relatively recent adoption and direct alignment with Objective 1.2 of the Newcastle Community Strategic Plan). Those that were still considered relevant and feasible have been carried through, in some form, to the action tables in this document.
16 Newcastle Transport Strategy

17Newcastle Transport Strategy

2.3 Community ContextDemographic data and information on travel patterns from the census and Household Travel Survey (HTS) provide insights that will influence what actions Council will undertake or how it will perform them.
Population and Employment
• The estimated resident population, which is the official population of Newcastle, was 157,273 at 30 June 2012.
• From 2006 to 2011, the population grew by 6,778 people, which represents an increase of 4.8%.
• The population density of Newcastle is 7.95 persons per hectare.
• The average household size is 2.34 people per dwelling.
• Census data indicates that 40.1% of Newcastle’s population had changed address from 2006 to 2011.
• Of the 70,256 people living in Newcastle who are employed, 61% are working full time and 37% are working part time.
• The unemployment rate, at 5.7%, is comparable to that of NSW.
• 49.1% of those employed in Newcastle also live in Newcastle.
• Of the 88,179 people employed in Newcastle, just over half live outside the LGA. The main areas that people travel from to work in the LGA include Lake Macquarie North, Lake Macquarie East, Maitland and Port Stephens.
• Of Newcastle’s residents, 61.7% also work in the LGA. 24.8% of residents live and work in the same statistical local area (SLA).
Figure 3: Residential Location of Newcastle LGA WorkersSource: Australian Bureau of Statistics, Census of Population and Housing 2011. Compiled and presented in profile.id by .id, the population experts.
19% Newcastle - Inner City
19% Newcastle - Throsby
17% Lake Macquarie - North
12% Newcastle - Outer West
9% Lake Macquarie - East
8% Maitland
6% Port Stephens
4% Lake Macquarie - West
2% Cessnock
4% Other
Based on 2011 census population.4
4
18 Newcastle Transport Strategy

Car ownership
The 2011 census indicates that 11.4% of private dwellings in the Newcastle LGA do not have a car, slightly more than the average for NSW. The number of households with three or more vehicles is lower than the average for NSW.
Car ownership may be influenced by various factors, including income, prices, interest rates and demographic trends. The number of cars owned by a household affects how much residents travel and what modes are used.
In 2011, Fletcher – Minmi had the highest proportion of households with two or more vehicles, while Jesmond had the highest proportion of households without a motor vehicle. Access to employment and services, such as health and education services, are strongly
influenced by access to transport. Households without a motor vehicle can therefore be disadvantaged if they are not in an area well-serviced by public transport.
The suburbs of Jesmond, Mayfield and Waratah, which have a relatively high proportion of households without a car, are also those suburbs which historically have housed many students, being proximate to the University of Newcastle. Bar Beach, which also has a high percentage of households without a car, has a large public housing component.
The analysis of census data by ‘.id’ indicates that households with two or more motor vehicles are more likely to be located in areas without good public transport, where access to motorised transport is a necessity and are also more likely to be mature families with teenage or older children at home.
Figure 4: Newcastle LGA – Number of Motor VehiclesSource: Australian Bureau of Statistics, Census of Population and Housing 2011. Compiled and presented in profile.id by .id, the population experts.
11% No motor vehicles
38% 1 motor vehicle
33% 2 motor vehicles
12% 3 or more motor vehicles
6% Not stated
11%
38%
33%
12%
6%
19Newcastle Transport Strategy

Travel Patterns
Information on travel patterns has been drawn from census data and the HTS. The census provides detailed information about how people travel to work. The HTS examines the travel patterns of residents of the Greater Metropolitan Area – how often they travel, how far, by what mode and for what purpose. Trip purposes are categorised as commute, work-related business-related trips, education/child care, shopping, personal business, social recreation, serve passenger and other. For Newcastle, as for the Lower Hunter region, the commute is typically the fourth highest reason for travel, as a percentage of trips. Greater proportions of trips are undertaken for social/recreation purposes, to serve passenger and shopping.
As shown in Table 1, public transport mode share is low, at around 4% of trips. Walking accounts for 16% of trips in Newcastle, though these represent less than 3% based on distance.
20 Newcastle Transport Strategy

Newcastle - Inner City
Newcastle - Outer West
Newcastle - Throsby
Newcastle
Population2
Persons 52,000 45,000 55,000 153,000
No. of households 24,000 17,000 24,000 65,000
Average household size 2.2 2.6 2.3 2.4
Total travel
Trips av. weekday 205,000 185,000 239,000 629,000
Trips av. weekend day 207,000 122,000 237,000 567,000
Trips per person - weekday 3.9 4.1 4.3 4.1
Trips per person - weekend 4.0 2.7 4.3 3.7
Trips per household - weekday 8.7 10.7 10.1 9.7
Trips per household - weekend 8.7 7.1 10.0 8.8
Purpose3 of travel (trips %)
Commute 16% 15% 12% 14%
Work related business 9% 5% 7% 7%
Education/childcare 4% 8% 7% 6%
Shopping 18% 18% 21% 19%
Personal business 10% 8% 7% 9%
Social/recreation 30% 23% 27% 27%
Serve passenger 10% 20% 16% 15%
Other 3% 2% 2% 2%
Mode of travel (trips %)
Vehicle driver 52% 58% 55% 55%
Vehicle passenger 17% 31% 21% 23%
Train 1% 1% 0% 1%
Bus 3% 2% 3% 3%
Walk only 25% 6% 18% 16%
Other modes 3% 1% 3% 2%
Purpose³ of travel (distance %)
Commute 28% 19% 16% 21%
Work related business 16% 5% 23% 15%
Education/childcare 3% 9% 4% 5%
Shopping 11% 13% 17% 14%
Personal business 8% 10% 5% 8%
Social/recreation 21% 23% 20% 22%
Serve passenger 9% 18% 12% 13%
Other 3% 4% 3% 3%
Mode of travel (distance %)
Vehicle driver 74% 66% 72% 71%
Vehicle passenger 14% 28% 21% 21%
Train 4% 2% 0% 2%
Bus 2% 3% 2% 2%
Walk only 4% 1% 2% 2%
Walk linked 1% 1% 1% 1%
Other modes 1% 0% 2% 1%
Distance (kms)
Total travel 1,163,000 1,350,000 1,478,000 3,991,000
Total travel per person 22.4 29.8 26.7 26.2
Av. trip length 5.7 7.3 6.2 6.3
Vehicle travel (VKT) 855,000 888,000 1,071,000 2,814,000
VKT per person 16.5 19.6 19.3 18.5
Travel time (mins)
Av. work trip duration 24 19 23 22
Av. non-work trip duration 15 17 14 15
Av. trip duration - all purposes 17 17 16 17
Daily travel time per capita 67 71 69 69
4
4
5
Table 1: Key Transport Indicators1 by Statistical Local Area of Residence 2010/11Source: 2010/11 five-year pooled HTS dataset. The geography is based on the 2006 Australian Standard Geographical Classification (ASGC). 21Newcastle Transport Strategy

Main method of travel
1991 %
1996 %
2001 %
2006 %
2011 %
Train 1.2 1.2 1.2 1.0 1.2
Bus 4.7 3.5 2.9 2.5 2.6
Tram or Ferry 0.3 0.1 0.1 0.1 0.1
Taxi 0.6 0.4 0.3 0.3 0.2
Car - as driver 57.1 59.6 61.1 63.2 65.8
Car - as passenger
9.1 7.6 6.9 6.2 5.6
Truck 0.0 0.0 1.3 1.0 0.7
Motorbike 1.0 0.9 0.7 0.8 0.9
Bicycle 2.6 2.1 1.8 1.7 1.8
Walked only 5.3 4.5 3.9 4.4 3.8
Other 0.8 1.6 1.2 0.8 1.0
Worked at home 2.8 2.9 3.1 3.0 2.9
Did not go to work
10.5 13.9 13.9 13.4 12.0
Not stated 4.0 1.6 1.5 1.6 1.4
Total employed persons aged 15+
100.0 100.0 100.0 100.0 100.0
Table 2: Newcastle LGA – Method of Travel to Work 1991 - 2011Source: Australian Bureau of Statistics, Census of Population and Housing 1991 to 2011. Compiled and presented in profile.id by .id, the population experts.
Table 2 shows mode share for the journey to work on census day, from 1991 to 2011, for Newcastle. The car remains by far the dominant mode for journeys to work, with over 70% travelling to work by car on census day in 2011. The areas with the highest percentages of car use, Northern Environmental Region, Maryland, Fletcher – Minmi, Elermore Vale and Shortland – Sandgate, are also areas which show low levels of public transport accessibility. Across the LGA, approximately 4% of employed people used public transport to get to work.
At 1.8%, the proportion of Newcastle’s residents who rode to work is higher than the regional average of 0.7%. There were significant variations across the city. Tighes Hill had the highest proportion of residents who rode bicycles to work, with a mode share to cycling of
6.1%, followed by Carrington at 5.9%, and Maryville-Wickham at 5.1%.
The proportion of residents who walked to work also varied significantly across the city. Though on a citywide basis, the mode share was just under 4%, Newcastle – Newcastle East – Newcastle West had a mode share to walking of 13.8%, followed by Cooks Hill and The Hill, at 12.7%.
From 1991 to 2011 census data shows steady increases in the proportion of individuals travelling to work by car and slight decreases in the proportions using active transport and public transport.
Table 1 Notes:1. Unless otherwise stated, estimates are for an average weekday. Estimates are rounded to the nearest thousand, but averages and percentages are computed based on unrounded numbers.2. Population estimates are based on HTS estimates of those in occupied private dwellings.3. Estimates of trip purpose are based on linked trip. Trips to return home have been reallocated to the previous ‘priority’ purpose.4. Estimates of trip mode are based on unlinked trips except for walk trips.5. ‘Walk linked’ is a walk trip to change mode to other forms of transport.
22 Newcastle Transport Strategy

Road Safety
Road safety statistics for the Newcastle LGA have been reviewed. Over the five years 2008 - 2012:
• 5,980 crashes have been reported, 25 of which involved a fatality, 2,547 involved injuries and 3,408 were non-casualty crashes
• there were 3,233 casualties, of which 25 were deaths
• 23.8% of crashes occurred on State Highways, 39.4% on other classified roads and 35.8% on unclassified roads
• 54.2% of crashes occurred at intersections
• 5.8% of crashes involved motorcycles
• 4.0% of crashes were pedal cycle crashes
• 3.9% of crashes involved pedestrians.
By far the most common type of crash movement in the years 2008 – 2012 was rear-end crashes (28.7%).
0
100
200
300
400
500
600
700
800
2008 2009 2010 2011 2012
548
699
518
714
526
682
496
687
459
626
FatalInjury
Non-casualty (towaway)
Figure 5: Newcastle LGA – Number and Degree of Crashes 2008 -2012 (by year)
7 7 3 5 3
23Newcastle Transport Strategy

2.4 Challenges and OpportunitiesA number of broad issues, challenges and opportunities that will influence Council’s actions and policy commitments across its transport roles are noted in the following. Many of these are relevant to communities across Australia, and are eliciting responses from all levels of government.
Climate Change and Air Quality
The transport sector is a significant contributor to greenhouse gases and other emissions that are detrimental to air quality. Transport is the second-largest emitter of greenhouse gas emissions, with cars accounting for around half of these. Motor vehicles are a major source of common air pollutants, such as hydrocarbons, volatile organic compounds and nitrogen oxides (Department of Infrastructure and Transport, 2013, p. 9).
A Growing and Ageing Population
From 2006 to 2011, Newcastle’s population increased by 4.8% and continued steady growth is predicted. Newcastle has a higher than average proportion of people with disabilities and our proportion of people aged over 65 is forecast to reach approximately 18% by 2031. These projections support moves to increase transport choice and improve equity of access in public transport and our pedestrian networks in particular.
High Reliance on Cars
Residents of Newcastle, and the Lower Hunter generally, are highly dependent on cars. Though not bad by comparison with cities such as Sydney, there have been noticeable increases in congestion in parts of the city. Some congestion will be accepted as impetus for promoting mode shift. Many of the trips that contribute to congestion are short trips that could feasibly be undertaken by walking or riding. Table 1 indicates that the average trip length for Newcastle residents is 5.7km. On an average weekday, 37.8% of residents’ trips are less than 2km and more than 80% are less than 10km. Better understanding of specific factors that will lead to travel behaviour change in Newcastle is needed.
Peak Oil
Potential for reduction in ready availability of fossil fuels places increased importance on sustainable transport options.
Shifting Focus in Transport Planning
As discussed further in subsequent sections, transport planning is increasingly shifting to focus on movement of people and goods, as opposed to movement of vehicles. This has implications for how limited road space can be used most effectively. Council will likely face opposition and some difficult decisions as the status quo is challenged.
Financial Sustainability
In common with many councils across Australia, Newcastle City Council is faced with increasing costs of service provision and maintenance of a large asset base. For transport networks, maintenance expenditure is predicted to increase with ageing infrastructure and expansion of road and path networks. Council will continue to rely heavily on funding from the Australian and NSW Governments for maintenance of its road network. Addressing the needs of an ageing population, improving equity of access and making walking and cycling more attractive by providing well-maintained connected networks will be ongoing challenges. With limited budgets, Council must focus on those areas of transport for which it has direct responsibility and is more constrained in its ability to undertake functions which may be considered discretionary or which have arisen as a result of cost-shifting from other levels of government.
Multi-agency Involvement
All levels of government contribute to transport outcomes in Newcastle, with significant areas of overlap. This can be particularly challenging for coordination of action and the timing of incentives and disincentives to encourage travel behaviour change. It may also provide opportunities for partnership and funding from the Australian and NSW Governments, as they seek to implement policy objectives at a local level.
Sedentary Lifestyles
Changes in travel patterns over time, leading to a heavy reliance on cars for the majority of our trips, has contributed to sedentary lifestyles and associated health impacts. As reported by the National Health Performance Authority (2013), overweight and obesity rates are increasing rapidly across Australia, from 44% of adults in 1989 to 63% in 2011-12. The report indicates that in the Hunter, 70% of adults were overweight or obese. Negative health impacts associated with high levels of obesity in Australia’s population have contributed to efforts by all levels of government to encourage active transport. Initiatives which seek to increase active transport are potential contenders for partnership funding.24 Newcastle Transport Strategy

25Newcastle Transport Strategy

3.0 Objectives and TargetsThrough the extensive communication process undertaken for development of the Newcastle Community Strategic Plan, residents of Newcastle defined their vision for the city:
In 2030 Newcastle will be a smart, liveable and sustainable city. We will celebrate our unique city and protect our natural assets. We will build resilience in the face of future challenges and encourage innovation and creativity. As an inclusive community, we will embrace new residents and foster a culture of care. We will be a leading lifestyle city with vibrant public places, connected transport networks and a distinctive built environment. And as we make our way toward 2030, we will achieve all this within a framework of open and collaborative leadership.
The community’s aspirations for transport are embodied in its vision for a connected city, which means that:
Transport networks and services will be well connected and convenient. Walking, cycling and public transport will be viable options for the majority of our trips.
The Newcastle Transport Strategy has been prepared to guide Council’s actions and decision making on transport matters, to contribute to achieving the community’s vision for a connected city. As such, the strategic directions for ‘connected city’ are directly applicable. Because of the potential for transport decisions to influence a range of environmental, social, economic outcomes, additional strategic objectives defined in the Newcastle Community Strategic Plan have been adopted for the Newcastle Transport Strategy. These are highlighted in bold in Table 3.
The Newcastle Community Strategic Plan includes a range of strategies, for implementation by various stakeholders, to achieve the desired community outcomes. Council is nominated as the lead agency for a number of strategies supporting the objectives for a connected city and a key partner in others. The strategies aimed to achieve a ‘connected city’ are reproduced in Table 4. The actions proposed in subsequent sections of the Newcastle Transport Strategy are intended to contribute to implementation of these strategies.
26 Newcastle Transport Strategy

Our strategic directions for Newcastle Our objectives
Connected City Transport
Transport networks and services will be well connected and convenient. Walking, cycling and public transport will be viable options for the majority of our trips.
1.1 Effective and integrated public transport
1.2 Linked networks of cycle and pedestrian paths
1.3 A transport network that encourages energy and resource efficiency
Protected and Enhanced Environment
Our unique environment will be understood, maintained and protected.
2.1 Greater efficiency in the use of resources
2.2 Our unique natural environment is maintained, enhanced and connected
2.3 Environment and climate change risks and impacts are understood and managed
Vibrant and Activated Public Places
A city of great public places and neighbourhoods promoting people’s health, happiness and wellbeing.
3.1 Public places that provide for diverse activity and strengthen our social connections
3.2 Culture, heritage and place are valued, shared and celebrated
3.3 Safe and activated places that are used by people day and night
Caring and Inclusive Community
A thriving community where diversity is embraced, everyone is valued and has the opportunity to contribute and belong.
4.1 A welcoming community that cares and looks after each other
4.2 Active and healthy communities with physical, mental and spiritual well-being
4.3 A creative, culturally rich and vibrant community
Liveable and Distinct Built Environment
An attractive city that is built around people and reflects our sense of identity.
5.1 A built environment that maintains and enhances our sense of identity
5.2 Mixed use urban villages supported by integrated transport networks
5.3 Greater diversity of quality housing for current and future community needs
5.4 Best practice energy and water efficient buildings and infrastructure
Smart and Innovative City
A leader in smart innovation with a healthy, diverse and resilient economy.
6.1 A vibrant diverse and resilient green economy built on educational excellence and research
6.2 A culture that supports and encourages innovation and creativity at all levels
6.3 A thriving city that attracts people to live, work, invest and visit
Open and Collaborative Leadership
A strong local democracy with an actively engaged community and effective partnerships.
7.1 Integrated, sustainable long-term planning for Newcastle and the Region
7.2 Considered decision-making based on collaborative, transparent and accountable leadership
7.3 Active citizen engagement in local planning and decision-making processes and a shared responsibility for achieving our goals
7.4 Newcastle City Council: a local government organisation of excellence
Table 3: Strategic Directions and Strategic ObjectivesSource: Newcastle 2030 - Newcastle Community Strategic Plan 27Newcastle Transport Strategy

28 Newcastle Transport Strategy

Connected City
No. Strategies Responsibility Key Partners
Objective 1.1 Effective and integrated public transport
1.1aDevelop and implement a regional transport strategy covering all modes
NSW Government
Hunter Councils, Transport providers
1.1b
Undertake service planning on a regional basis to provide public transport services with connectivity, accessibility and frequency to make it more attractive to current and future patrons
NSW Government
Lower Hunter Councils
1.1cIntroduce integrated fares and ticketing throughout the Lower Hunter Region
NSW Government
Transport providers
1.1dPromote the benefits of public transport, walking and cycling
NSW Government
Federal Government, Newcastle City Council
Objective 1.2 Linked networks of cycle and pedestrian paths
1.2aDevelop a network of safe, linked cycle and pedestrian paths integrated with key destinations and green space
Newcastle City Council
Lower Hunter Councils
1.2bPlan for cyclists and pedestrians in planning for new developments
Newcastle City Council
Developers
1.2cGive greater priority to cyclists and pedestrians in planning for new developments
Newcastle City Council
NSW Government
1.2dEnhance support infrastructure such as end of trip facilities to encourage walking and cycling
Newcastle City Council
Major employers
Objective 1.3A transport network that encourages energy and resource efficiency
1.3aManage and plan our transport networks to maximise accessibility
NSW Government
Transport providers, Newcastle City Council
1.3bEnhance transport links to and within Newcastle including investigations of high speed rail and freight by-pass
NSW Government
1.3cConsider the need for all modes of transport in planning for new development and infrastructure networks
Newcastle City Council
Developers
1.3dMaintain and enhance safe local road networks and provide appropriate levels of parking in urban centres
Newcastle City Council
Table 4: ‘Connected City’ Objectives, Strategies and Responsible AgenciesSource: Newcastle 2030 – Newcastle Community Strategic Plan
29Newcastle Transport Strategy

Several targets are proposed in the Newcastle Transport Strategy, that reflect targets adopted by the NSW and/or Australian Governments and to which action by Council can contribute. The proposed targets and measurement sources are shown in Table 5 and are reiterated in policy commitments in subsequent sections.
Target Measurement Source
Public Transport
• Increase mode share to public transport for commuter trips to and from Newcastle CBD during peak hours to 20% by 2016 (NSW 2021)
NSW 2021 Performance Report
Walking
• Increase the mode share of walking trips made in Newcastle, at a local and district level, to 25% by 2016
NSW 2021 Performance Report
Household Travel Survey
Cycling
• Lift the share of short trips by bike for all travel purposes to 5% (NSW BikePlan, Newcastle Cycling Strategy and Action Plan)
• Double the use of cycling to get to work (NSW BikePlan, Newcastle Cycling Strategy and Action Plan)
Household Travel Survey
ABS Census
Household Travel Survey
Road Safety
• Reduce death and serious injury on Newcastle’s roads by more than 30% (NSW Road Safety Strategy 2012 – 2021)
NSW Centre for Road Safety
Table 5: Targets
30 Newcastle Transport Strategy

31Newcastle Transport Strategy

4.0 Land Use and TransportAt all levels of government, efforts are being made to direct growth and change in our cities in ways that are economically, socially and environmentally sustainable. An area of focus is transport and travel patterns. The number of trips made and time spent travelling in undertaking daily activities have increased over years, with the private car dominating mode share. Plans and strategies such as Walking, Riding and Access to Public Transport (Department of Infrastructure and Transport, 2013), NSW 2021 (NSW Department of Premier and Cabinet, 2011) and the NSW Long Term Transport Master Plan (Transport for NSW, 2012) include key objectives to reduce travel times, increase the proportion of travel undertaken by walking, cycling and public transport, offer more travel choice and improve connectivity.
At a local and regional level, the way we plan for land use influences how much and how people travel, the cost effectiveness of providing transport services, and the amenity and safety of our environment. A reciprocal relationship applies, in that transport networks can shape land use. Integration of land use and transport planning is critical to achieving more sustainable outcomes.
As indicated in Improving Transport Choice (NSW Department of Urban Affairs and Planning, 2001), achieving sustainability in transport requires focus on:
• the movement of people and goods, rather than the movement of vehicles and
• maximising accessibility (the ability to undertake a range of daily activities with a minimum of travel), rather than mobility (the ability to move freely).
32 Newcastle Transport Strategy

Accessibility Versus Mobility-based Transport Planning (Litman, 2003)
Accessibility refers to the ability to reach desired goods, services, activities and destinations (together called opportunities). For example, a stepladder provides access to a high shelf, a store provides access to goods, and a library or computer provides access to information. Access is the ultimate goal of most transportation, except a small portion of travel in which movement is an end in itself (e.g. cruising, historic train rides, jogging etc.)
Many factors can affect accessibility, including mobility (physical movement), road and path connectivity, land use patterns (the location of activities), and mobility substitutes (telecommunications and delivery services). The affordability, information availability, and even the social acceptability of transport options, can also affect overall accessibility.
Conventional planning often evaluates transport system performance based primarily on mobility (using indicators such as traffic speed and vehicle operating costs), ignoring other accessibility factors and improvement options. For example, with mobility-based planning, the only practical solution to traffic congestion is to expand roadway capacity. Accessibility-based planning allows other solutions to be considered, including improvements to alternative modes, more accessible land use patterns, and improvement to mobility substitutes. Accessibility-based transport planning tends to support sustainability by expanding the scope of analysis and supporting more resource-efficient solutions. As a result, as much as possible, sustainable transportation indicators should reflect accessibility-based planning.
Source: Online TDM Encyclopedia - Sustainable Transport and TDM, Victoria Transport Policy Institute, http://www.vtpi.org/tdm/tdm67.htm, viewed 3 September 2014.
Council influences transport outcomes through its land use planning and development control functions. The location of trip attractors such as schools, shops and employment, how they are placed in relation to where people live, and their density and mix, affects the number and length of day to day trips. Compact, connected urban environments, integrating a mix of land uses such as residential, open space and neighbourhood commercial outlets, create shorter distances between destinations. This allows people to undertake multiple activities within the one trip and encourages walking and cycling for transport. Examples of urban form which do not facilitate sustainable transport include:
• poorly connected street networks
• vast areas of single use development
• low density development close to major centres and employment nodes
• major developments located in areas only accessible by cars.
The Newcastle Urban Strategy is Council’s overarching strategic land use document. Adopted in 1998 and updated in 2005 and 2009, its key objective is to promote existing neighbourhoods as mixed use centres - ‘urban villages’ - with higher employment and housing densities than in the past, and with buildings and streetscape works that celebrate local identity and respect local character. At its core are the principles of ‘Newcastle urbanism’ - a phrase coined to describe the application of new urbanist principles to the urban structure of Newcastle and to guide urban design and planning. The aim of Newcastle urbanism is to provide greater choices to the community, in terms of housing, employment, transport, and social and cultural services, while offering reduced travel demand, improved air quality and greater identity for Newcastle, its city centre, and its district and neighbourhood centres.
33Newcastle Transport Strategy

Principles of Newcastle Urbanism
The principles of Newcastle urbanism will guide all future planning and development activities where and when alterations to the urban fabric of Newcastle area proposed. The principles of Newcastle urbanism include:
• improve access for all people, including those who are socially, culturally, physically or economically disadvantaged
• help to accommodate public transport, walking and cycling as alternatives to the car as well as accommodating the need to move goods around the city and region for commerce and industry by road and rail
• acknowledge that streets are the primary public places for access and exchange between people, and should be made safe, friendly, attractive and efficient
• create or contribute to a highly interconnected street system offering improved pedestrian, bicycle and traffic efficiency, a pleasant environment and increased opportunities for social and economic exchange between people
• help neighbourhoods in city, district and suburban locations, to become fine-grained mixed use centres, ‘urban villages’ when suitable
• contribute to incremental development of urban villages that will have higher employment and residential densities than post-war suburban development.
The Newcastle Urban Strategy is primarily implemented through the Newcastle Local Environmental Plan 2012 by land use zoning and density controls. The specific guidelines for new development in the city are detailed in the Newcastle Development Control Plan 2012. Facilitation of sustainable transport in new development can be supported through guidelines for street layout, active street frontages, provision of appropriate end of trip facilities and preparation of travel plans, for example. Requirements for car parking can also influence the relative attractiveness and convenience of sustainable transport modes.
Several bodies of work have recently been undertaken, which have implications for land use in Newcastle. To address these, and the changes in the legislative planning context, the Newcastle Urban Strategy is being transformed into a local planning strategy. The renewed strategy will be supported by the latest census information and economic data and will also respond to the objectives and strategies of the Newcastle Community Strategic Plan that specifically relate to land use planning. The strategy will look at how we can balance competing claims over land use and ensure that Newcastle remains a robust, dynamic and resilient city. The principles of the Newcastle Urban Strategy are considered sound and relevant and will be carried through to the local planning strategy.
4.1 Policy Commitments
P1
Council reaffirms its commitment to the principles of Newcastle urbanism, as adopted by Council in 1998 and detailed in the Newcastle Urban Strategy.
P2Preparation of travel plans will be conditioned on consents for applications for major development.
4.2 Actions
A1 Develop a local planning strategy.
Develop a local planning strategy to reinforce appropriate activity, commercial and employment areas in relation to transport and accessibility.
A2 Review Council’s development contributions plans.
Review Council’s development contributions plans to ensure the extent of transport works supports the desired development patterns and projections of the Local Planning Strategy.
34 Newcastle Transport Strategy

The Newcastle Urban Strategy is primarily implemented through the Newcastle Local Environmental Plan 2012 by land use zoning and density controls. The specific guidelines for new development in the city are detailed in the Newcastle Development Control Plan 2012. Facilitation of sustainable transport in new development can be supported through guidelines for street layout, active street frontages, provision of appropriate end of trip facilities and preparation of travel plans, for example. Requirements for car parking can also influence the relative attractiveness and convenience of sustainable transport modes.
Several bodies of work have recently been undertaken, which have implications for land use in Newcastle. To address these, and the changes in the legislative planning context, the Newcastle Urban Strategy is being transformed into a local planning strategy. The renewed strategy will be supported by the latest census information and economic data and will also respond to the objectives and strategies of the Newcastle Community Strategic Plan that specifically relate to land use planning. The strategy will look at how we can balance competing claims over land use and ensure that Newcastle remains a robust, dynamic and resilient city. The principles of the Newcastle Urban Strategy are considered sound and relevant and will be carried through to the local planning strategy.
4.1 Policy Commitments
P1
Council reaffirms its commitment to the principles of Newcastle urbanism, as adopted by Council in 1998 and detailed in the Newcastle Urban Strategy.
P2Preparation of travel plans will be conditioned on consents for applications for major development.
4.2 Actions
A1 Develop a local planning strategy.
Develop a local planning strategy to reinforce appropriate activity, commercial and employment areas in relation to transport and accessibility.
A2 Review Council’s development contributions plans.
Review Council’s development contributions plans to ensure the extent of transport works supports the desired development patterns and projections of the Local Planning Strategy.
35Newcastle Transport Strategy

5.0 Public TransportIn comparison with other areas of the Hunter, Newcastle is relatively well-served by public transport. Newcastle Buses operates services throughout the majority of the city, excluding the western corridor, which has services operated by Hunter Valley Buses. Most services operate daily, with less frequent services on weekends. Service frequencies are typically hourly through the middle part of the day, though some key routes have higher frequencies in the morning and evening peaks. A fare free zone extends over the city centre and allows for free travel on all Newcastle Buses services seven days a week, from 7.30am to 6pm. Ferry services operate between Stockton and Newcastle (Queens Wharf) from early morning to late evening. Passenger train services operate on the electrified line from the city centre to Sydney, and diesel services from the city centre to Maitland and further up the Hunter valley.
Increased frequency and more direct services have been identified in various consultation processes as key to increasing public transport mode share. With severely constrained funding for new services, implementation of service frequencies, coverage and span of services to attract new patrons is challenging.
Council’s role in public transport is primarily one of facilitation through:
• supportive land use and development decisions
• consulting with transport providers and advocating for network improvements
• provision of infrastructure such as shelters and seating, and good walking connections to public transport nodes
• supporting other levels of government to promote public transport use
• parking management.
Key challenges for Council include:
• meeting community and legislative requirements for compliant, comfortable transport stops
• getting the balance right with parking management
• working with other levels of government to influence public transport provision for Newcastle.36 Newcastle Transport Strategy

5.1 Policy Commitments
P3Council will facilitate higher mode share to public transport, through provision of support infrastructure such as shelters and seating at transport stops.
P4 Council is committed to improving equity of access to public transport.
P5 Council will prioritise siting of transport stops over loss of on-street parking.
P6Council supports the NSW Government’s target of 20% mode share to public transport for commuter trips to and from the Newcastle city centre in the peak periods by 2016.
P7Council supports integrated ticketing, and daily and weekly caps on fares as incentives for increased public transport use.
P8Council supports formation of a regional transport body, to be tasked with planning and coordination of transport in the Lower Hunter.
5.2 ActionsA3 Provide infrastructure such as shelters and seating, at transport stops.
There are approximately 1,700 transport stops in Newcastle, with varying provision of infrastructure such as boarding points, seats and shelters. Provision of well-designed and aesthetically pleasing support infrastructure such as shelters enhances the appeal of public transport and makes interchange between services more convenient. Council requires provision of public transport support infrastructure such as bus shelters as part of major developments and has included provision of new shelters in its developer contribution plans. Consideration will be given to new agreements for advertising on shelters, as a means to offset costs associated with supply and maintenance of shelters.
A4 Improve equity of access to public transport, through upgrading of transport stops to meet the Disability Standards for Accessible Public Transport.
The compliance timetable included in the Disability Standards for Accessible Public Transport indicates that 90% of transport stops should be compliant by 31 December 2017 and 100% by 31 December 2022. Council’s Transport Stops, Shelters and Seating Policy provides guidelines for location, design and construction of stops, shelters and seating; placement and content of advertising; and defines performance standards for maintenance.
A5 Work with Transport for NSW to implement bus priority measures.
Council will engage with Transport for NSW and its agencies, RMS and Newcastle Buses and Ferries, to investigate and implement bus priority measures at key intersections and corridors to improve journey times for public transport. Bus lanes, peak hour clearways, transitways and high occupancy vehicle lanes may be considered.
A6 Advocate to the Australian Government and NSW Government for public transport improvements.
Through submissions and direct contact, Council will advocate to Transport for NSW, Newcastle Buses and Ferries and other agencies for improvements to train, bus and ferry operations, such as higher frequency, and more direct services, and fare incentives for greater public transport use. Council will also continue to advocate to other levels of government for assistance to meet compliance standards for transport stops. In addition to public transport improvements within the Newcastle LGA and urban area, Council will advocate for better regional connections, including the rail link to Sydney and links to Newcastle Airport.
A7 Promote public transport.
Council will promote public transport through various measures, such as enhancement of information on Council’s web site and extending its production of transport access guides, to add to those for Newcastle Beaches and Broadmeadow. Council contributes to production of the Lower Hunter Transport Guide, and will continue its support of this initiative.
A8 Improve access to public transport stops.
As part of development of a holistic plan to address infrastructure for walking throughout the city, Council will focus on walking catchments to public transport stops.
37Newcastle Transport Strategy

6.0 Walking and CyclingResponses to a range of global issues and shifts in transport planning to focus more on efficiency and accessibility are motivating all levels of government to consider ways to encourage walking and cycling for transport. Walking and cycling are basic, affordable forms of travel available to almost all ages and groups in society. Increased participation in these forms of non-motorised transport offers a range of economic, environmental and social benefits, in addition to potential health gains. In Newcastle, though private cars are the dominant mode for commuting and, indeed, all trip purposes, the large majority of trips are at distances that could reasonably be undertaken by walking or cycling. Coupled with large areas of relatively flat topography and Newcastle’s favourable climate, potential for mode substitution is high.
There are however, substantial challenges to increased participation in active transport. Newcastle’s suburbs have developed over many years, with variations in standards and development requirements over time, resulting in significant differences in urban form and levels of accessibility. Footpaths, for example, may be provided on both sides of the street, one side, or not at all. A systematic process to assess and map pedestrian infrastructure and identify a pedestrian network, has not been undertaken to date.
Planning for cycling has been approached differently. Bike planning over time has led to definition of a series of routes, on roads and shared paths, based on linking of employment and education nodes, topography, observations of usage, attractors such as shopping centres, parks and beaches, and linkages between them. Further work is in progress to define specific treatments and priority for addressing network gaps.
Development of the Newcastle Cycling Strategy and Action Plan highlighted safety as a key priority, and the perception of lack of safety as a significant barrier to
38 Newcastle Transport Strategy

increased participation. Physical separation between vulnerable road users and motorised vehicles is one way to address perceptions of safety. Lower speed environments are another. Literature suggests similar barriers apply to walking. If substantial mode shifts are to occur, as desired by the community vision, Council will need to change the way it addresses the needs of pedestrians and cyclists relative to cars and the way space is allocated. Importantly, an integrated package of measures spanning infrastructure and facility improvements, education and information programs, is needed for substantive changes in participation.
Other issues include:
• limited data on walking and cycling participation
• incomplete databases of walking and cycling infrastructure
• maintenance of paths
• conflict between cyclists and pedestrians on shared paths.
6.1 Policy Commitments
P9The needs of pedestrians and cyclists are addressed in planning, design and construction of works.
P10Council will actively prioritise the needs of pedestrians and cyclists over vehicles, including parking, in activity centres and local streets.
P11New residential subdivisions are to be planned and designed as 40km/h local area traffic zones.
P12
Council supports reduction in speeds limits in appropriate areas across the local government area to address road safety objectives and to encourage greater use of active transport.
P13Council supports the NSW Government’s mode share target to walking of 25% of local and district trips.
P14
Council supports a mode share target of 5% to cycling for trips less than 10km, and doubling of the mode share to cycling for the journey to work, from 2006 to 2016.
P15
In design of cycling facilities, Council will take all reasonable measures to ensure separation of bicycles and motor vehicles in accordance with Figure 3.2, NSW Bicycle Guidelines (RTA, 2003), with physical separation where indicated by best practice.
P16Council will progressively phase out instances of bicycle shoulder lanes with inadequate clearance to parked vehicles on roads under its control.
Mixed
traffic
Bicycle lanes or
Shoulder lanes
Separate paths
Bicycle paths
Bicycle lanes
Bicycle paths with a
separating vergeMixed traffic
Combinations of low speeds and high traffic volumes are very rare. When these conditions occue, segregation may be necessary in order to minimise onflicts.
Volume of motor vehicles (vehicles/day)
85th percentile speed in km/h0 10 20 30 40 50 60 60 70 80 90 100
1,000
5,000
2,000
3,000
4,000
6,000
7,000
8,000
9,000
10,000
11,000
12,000
Figure 6: Separation of bicycles and motor vehicles according to traffic speed and volumeSource: Figure 3.2, NSW Bicycle Guidelines (RTA, 2003, p. 13), Figure 2.1 of Austroads Ltd (2011a)
Note: This diagram is to be applied to urban roads and is not appropriate for rural or non-urban roads.
39Newcastle Transport Strategy

6.2 ActionsA9 Implement a proactive and holistic approach to provision of pedestrian infrastructure.
Council will systematically assess the provision of pedestrian infrastructure throughout the city, and define a principle pedestrian network and associated program of works. In defining the network, access to and within major activity, education and employment centres, and links to public transport nodes will be prime considerations.
A10 Continue to implement the Newcastle Cycling Strategy and Action Plan.
The Newcastle Cycling Strategy and Action Plan, adopted by Council in March 2012, identifies a range of infrastructure improvements and social initiatives to increase cycling participation in Newcastle. The works program is a ‘live’ document, which will be progressively refined and updated as works are planned, designed and completed. Priority actions include the completion of missing links in the network, such as Broadmeadow to the city centre, Merewether to the city centre and from the Fernleigh Track to the city centre.
A11 Implement measures to enhance safety of cyclists and pedestrians, such as public lighting and signage.
Good lighting contributes to a heightened sense of personal safety, which is an enabling factor for walking and riding. Council will consider lighting of major shared paths, such as the Fernleigh Track and sections of the route from Howe Street to Wallsend, and those in the vicinity of Islington Park and Kullaiba Reserve. Council will investigate implementation of signage or other visual cues to alert drivers to the potential presence of cyclists and pedestrians, at potential conflict points.
A12 Strengthen development provisions to facilitate walking and riding.
Council will review development controls and contributions plans to incorporate public pedestrian and cycle links where they can contribute to desirable connections and through routes, and to include provisions for design of new residential subdivisions as 40km/h local traffic areas.
A13 Undertake research to better understand participation in walking and cycling, and the needs of pedestrians and cyclists.
Council has limited data on perceptions of, and participation in, walking and cycling. Information about the attitudes of Newcastle residents to walking and riding, their preparedness to undertake active travel, the distances they consider reasonable and perceptions of the provision of infrastructure such as footpaths will assist in determining and prioritising works to support mode share targets. Potential measures include surveys through Newcastle Voice and as part of community events. Procedures for local area access studies and traffic counts will be modified to address counts of pedestrians and cyclists.
A14 Improve databases of pedestrian and cycling infrastructure.
Council will complete GIS mapping of pedestrian infrastructure, bike parking facilities and cycle paths, to a detailed level suitable for asset management purposes. Internal publication and coordination of data will facilitate work allocation and identification of a pedestrian network.
40 Newcastle Transport Strategy

41Newcastle Transport Strategy

7.0 ParkingParking is a key component of the transport picture. The way parking is managed can be influential in mode choice, affect congestion, energy consumption, emissions, urban design outcomes and development costs.
Parking supply within the city centre is a mixture of off-street public and private (residential and non-residential) spaces, and on-street spaces which are predominantly for short-term parking for retail and commercial uses and for service vehicles. The choice of time and price restrictions applicable in different parts of the city centre reflects the adjacent land uses and proximity to activity areas, with price decreasing with increasing distance from activity areas. Time restricted parking operates in mainstreets throughout Newcastle and in the majority of Council’s off-street car parks in commercial centres. Other Council off-street parking areas are located in conjunction with recreational facilities. The majority of these offer free parking.
Current issues and challenges include:
• lack of clear framework for parking decisions
• resistance to parking management measures
• managing parking without compromising viability of centres
• lack of flexibility in development controls.
42 Newcastle Transport Strategy

7.1 Policy Commitments
P17Council will manage parking to improve the safety, accessibility, amenity and vitality of centres across the local government area, and to encourage increased use of sustainable transport modes.
P18Implementation of parking management measures will be evidence-based and have regard to industry best practice.
P19In any extension to areas of paid parking, Council will consider the implementation of a local reinvestment model to allocate a proportion of the parking income to pedestrian, traffic (including cycle) and public domain improvements in the area in which income is generated.
7.2 ActionsA15 Implement parking management strategies in centres.
Council will continue to investigate and implement supply and demand side parking management strategies in centres, having regard to the specific needs of each centre, the range of potential management measures to address those needs, best practice management practices, and available parking technologies.
A16 Finalise and implement the parking study of the city centre and surrounding suburbs.
Though many of the principles of the parking strategy adopted by Council in 2002 are sound, its implementation has been piecemeal and changes have occurred which have impacted on its ongoing relevancy. Council has recently undertaken a parking study of the city centre and adjacent precincts, to determine supply and demand, identify and/or confirm current issues, make recommendations for changes to the parking regime and recommend areas for trial of initiatives.
A17 Investigate, and consider implementation of local reinvestment models for paid parking areas.
Council has investigated several local reinvestment models as part of proposals to expand parking meters. A potential model is to allocate revenue to a transport infrastructure reserve, to improve local amenity and access to public transport through financing of infrastructure such as local area traffic management devices and compliant public transport stops.
A18 Monitor parking supply and its distribution in the city centre (as a priority) and other centres, to inform decision making.
Lack of current, accurate data hinders informed decision-making. For the city centre, Council will endeavour to repeat the 2001 floor space study in line with the census to accurately assess the number of parking spaces; monitor on-street parking supply, and develop a system to maintain a cumulative tally of private and public parking spaces associated with new development. Parking supply and demand will be assessed as part of local area access studies for other centres.
A19 Confirm the suitability and number value of a parking cap for the city centre.
A20 Review development controls for parking.
In line with best practice parking management, consideration is to be given to stipulation of maximum rates of parking provision and facilitation of opportunities for sharing of spaces. Other matters to be addressed include the impacts of exempt and complying development controls, as they relate to car parking.
A21 Improve way-finding signage in commercial centres to assist drivers to locate available parking in a more timely manner.
A22 Audit restrictive parking signage and road marking to ensure that it is clear.
A23 Manage parking for motorbikes.
Council will encourage use of motorbikes as an alternative to single occupant cars, though not in preference to more sustainable modes such as walking, cycling and public transport. In some areas, all day parking of motorbikes is appropriate, while in areas of high demand, time and potentially price constraints may be appropriate to ensure turnover of spaces.
A24 Revise Council’s Permit Parking Policy.
Council will complete the review of its policy for establishment and operation of permit parking schemes and the definition of the permit exclusion zone. Findings to date support maintenance of permit exclusion areas, with unambiguous definition by land use zoning reflecting the current or intended land use for the site.
A25 Review Council’s development contribution plans to allow for expenditure of contributions on a range of transport facilities.
In conjunction with A2, review Council’s development contribution plans to allow for expenditure of contributions on a range of transport facilities including sustainable transport measures, such as park and ride.
43Newcastle Transport Strategy

8.0 Roads and FreightNewcastle’s road network comprises approximately 827km of roads of which 745km are categorised as local roads, 44km as regional roads and 38km as state roads. Ongoing maintenance of its road assets to standards desired by all road users presents a continuing challenge to Council.
Cars are a highly convenient and popular form of transport in Newcastle. However, there is increasing recognition that we need to modify demand for car travel, rather than continually increase road capacity.
Council’s road hierarchy defines roads throughout the local government area as arterial, sub-arterial, collector and local, based on (motorised) vehicle movements per day. These categories align with the administrative categories of state, regional and local roads used by Roads and Maritime Services for coordination of road management and funding. To improve efficiency of transport networks and to realise significant increases in mode share to sustainable transport modes will require systematic examination of how we currently address the needs of various road users across our road network and where it may be appropriate to make changes.
Other issues include:
• noise and amenity impacts arising from freight movements
• lack of funding for local area traffic management works.
44 Newcastle Transport Strategy

8.1 Policy Commitments
P20 Council endorses the ‘Safe System’ approach to road safety.
P21Council supports the target to reduce death and serious injury on roads by more than 30%, in line with targets of the National Road Safety Strategy 2011 – 2020 and the NSW Road Safety Strategy 2012 – 2021.
P12Council supports reduction in speeds limits in appropriate areas across the local government area to address road safety objectives and to encourage greater use of active transport.
P22Council supports investigation by the NSW Government, in the short term, of a western freight rail bypass of Newcastle.
P23Upgrades of major road infrastructure should be undertaken in such a way as to encourage increased use of sustainable transport modes.
8.2 ActionsA26 Develop and implement a road management framework.
Demands on road reserve space arise from cars and freight, public transport, pedestrians, cyclists, utilities and landscaping. This project aims to define street types and associated user hierarchies and asset management regimes to complement the road hierarchy. Indicative road allocations for various generic street types and widths will be defined. The specific allocation of road space and management of different road users will be determined on a case by case basis.
A27 Review and revise procedures for undertaking local area studies
Council will review the way local area traffic studies are undertaken and reported, to address access more holistically and ensure that the needs of pedestrians and cyclists are considered proactively and prioritised. A key objective of the studies will be to consider potential for speed reductions.
A28 Investigate and consider implementation of extension to, and provision of new 40km/h local traffic areas.
Lower speeds correlate to enhanced safety for vulnerable road users such as pedestrians and cyclists. This action will be informed by the work on Council’s road user hierarchy. Implementation of areas of reduced speed limit will be supported by education and enforcement.
A29 Review the warrant systems for local area traffic management works and pedestrian works.
Council will review the methodology for rating of priority for local area traffic management and pedestrian works, to promote a more holistic, area-based approach.
A30 Undertake road safety education.
Council will partner with RMS and other agencies to carry out a range of education programs for all road users.
Figure 7: Typical space occupied in a city street by three common modes of transport - cars, bicycles and a busSource: Cycling Promotion Fund. On Sunday 9th September 2012, 69 volunteers, 69 bicycles, 60 cars and one bus gathered in Canberra to recreate a world-renowned photograph taken more than 20 years ago to demonstrate the advantages of bus and bicycle travel in congested cities. The project used 69 people, as this is the capacity of a standard Canberra bus, and 60 cars, as this is the number occupied on average by 69 people.
45Newcastle Transport Strategy

9.0 Travel Demand Management
Greater mode share to sustainable transport modes is a clear community priority, as indicated by consultation undertaken for preparation of the Newcastle Community Strategic Plan. Strategies that seek to increase use of sustainable modes, influence development to support walking and cycling and strategies to manage parking can all be considered to fall within the scope of travel demand management. As such, a wide range of Council’s transport actions could be considered in terms of travel demand management.
At all levels of government, there are initiatives to reduce single occupant car trips and increase mode share to walking, cycling and public transport.
Through advocacy and direct action to improve walking and cycling networks, Council is working towards changes in mode share. Walking and cycling are the most sustainable modes of transport, accessible to the majority and offer significant health benefits and, given that the majority of residents’ trips are less than 10km, there would appear to be significant potential to substitute car trips for these modes. However, not everyone wants to walk or cycle and if public transport is not viable, a reduction in single occupant car trips may be achieved through facilitating car pool, car share and park and ride.
46 Newcastle Transport Strategy

9.1 Policy Commitments
P6Council supports the NSW Government’s target of 20% mode share to public transport for commuter trips to and from the Newcastle city centre in the peak periods by 2016.
P13 Council supports the NSW Government’s mode share target to walking of 25% of local and district trips.
P14Council supports a mode share target of 5% to cycling for trips less than 10km, and doubling of the mode share to cycling for the journey to work, from 2006 to 2016.
P24The use of motorbikes is supported as an alternative to single occupant cars, but not as an alternative to more sustainable modes such as walking, cycling and public transport.
9.2 ActionsA31 Facilitate opportunities for establishment of car share schemes.
Dedication of parking spaces for car-sharing purposes; flexible development controls and developing a car share policy, are examples of ways in which Council can facilitate car sharing. Though Newcastle may not yet meet density and trip pattern criteria that make car share viable in the short term, development of a policy that sets out Council’s position on car sharing, and the procedures by which organisations would be selected and schemes implemented, signals Council’s interest and will position Council to respond to future opportunities. In the short term Council will initiate discussions with car share companies to determine the feasibility of establishment of car sharing programs in Newcastle and inform development of a policy.
A32 Develop and implement a Workplace Travel Plan (Green Travel Plan) for Council.
Council will lead by example and encourage its own staff to reduce reliance on cars for work journeys, through surveying staff travel patterns and developing a travel plan. The process of developing a travel plan will have regard for potential for wider application and include production of a template for adaptation by other major employers in the Lower Hunter.
A33 Facilitate car pooling.
Council will investigate partnering with education and health sectors and other Lower Hunter councils to implement a car pooling program in the region. This initiative may be progressed through the Lower Hunter Councils Transport Group. Car pooling for work travel will be encouraged through development of a workplace travel plan.
A34 Investigate and advocate for park and ride schemes.
Examples of park and ride schemes exhibit significant variations in scale and form. Though the ‘ride’ part is usually taken to mean a public transport journey, car to car-pool transfers already occur and may be encouraged as a viable intermediate step. Council will continue to advocate to Transport for NSW for investigation and development of regional park and ride facilities. Council will investigate the role of park and ride in Newcastle in reducing single occupant car trips and potential locations for parking of vehicles to facilitate transfer to public transport or car pooling.
A35 Provide information on sustainable transport options and promote their use.
Council will communicate the benefits of active transport and promote increased participation in walking and cycling through such measures as publication of cycling maps, and participation in events such as Walk to Work Day, NSW Bike Week and Ride to Work Day. In conjunction with completion of significant walking and cycling facilities projects, Council will undertake communication to promote their use. Council will enhance its communication of sustainable transport options through enhancement of its web site and through expansion of production of transport access guides. Officers will be encouraged to include information about sustainable transport options in conjunction with promotion of events. Council will continue its involvement in the Lower Hunter Councils Transport Group to facilitate increased mode share to sustainable transport. Through this group and fostering of other partnerships, Council will develop a regional communications strategy for conveying the benefits of reduced car use and increased participation in active transport.
47Newcastle Transport Strategy

10.0 ImplementationThe Newcastle Community Strategic Plan includes strategies for implementation by a wide range of stakeholders. The Newcastle Transport Strategy focuses on those areas of transport in which Council has a significant role or responsibilities.
Transport outcomes are influenced by multiple business units in Council. It is proposed that a cross-Council working group be established to monitor implementation of the strategy and report on progress every two years. Full review is to be undertaken every five years, to ensure ongoing relevancy.
The implementation plan table summarises the actions from Sections 4 to 9. The responsible business unit within Council to address the action is listed, and a timeframe of short, medium or long term for achievement. The following interpretation should be applied:
• short (S) – the action is to be initiated within the next two years (for translation into the Operational Plan)
• medium (M) – the action is to be initiated within the next two to five years (for input to the Delivery Program)
• long (L) – initiation of the action will be longer than five years.
• S, M. L – the action is ongoing.
As noted in Section 3, the actions in the Newcastle Transport Strategy are intended to contribute to a range of objectives and strategies of the Newcastle Community Strategic Plan. The table includes a column ‘CSP’ which nominates the objective(s), for example ‘1.1’ or specific strategy, for example ‘1.2c’, supported by the proposed action.
10.1 ActionsA36 Report on implementation of the Newcastle
Transport Strategy every two years.
The form of the report is to include comment on the status of each of the actions listed, trending of vehicle kilometres travelled and trending of progress towards endorsed mode share targets.
A37 Review the Newcastle Transport Strategy five years from its endorsement.
48 Newcastle Transport Strategy

49Newcastle Transport Strategy

Ref. Action Responsibility Timeframe CSP
Land Use and Transport
A1Develop a local planning strategy to reinforce appropriate activity, commercial and employment areas in relation to transport and accessibility.
SP S 5.2
A2 Review Council’s development contributions plans. SP, IP S
Public Transport
A3Provide infrastructure such as shelters and seating, at transport stops.
IP S, M, L 1.1
A4Improve equity of access to public transport, through upgrading of transport stops to meet the Disability Standards for Accessible Public Transport.
IP S, M, L 1.1
A5 Work with Transport for NSW to implement bus priority measures. IP S, M 1.1
A6Advocate to the Australian Government and NSW Government for public transport improvements.
IP S, M, L 1.1
A7 Promote public transport. IP, SP S, M, L 1.1
A8 Improve access to public transport stops. IP M 1.2
Walking and Cycling
A9Implement a proactive and holistic approach to provision of pedestrian infrastructure.
IP M 1.2a
A10Continue to implement the Newcastle Cycling Strategy and Action Plan.
IP, P & C S,M,L
1.2a, 1.2b, 1.2c, 1.2d
A11Implement measures to enhance safety of cyclists and pedestrians, such as public lighting and signage.
IP M1.2a, 3.3
A12 Strengthen development provisions to facilitate walking and riding. SP, IP S 1.2b
A13Undertake research to better understand the needs of pedestrians and cyclists.
IP S 1.2
A14 Improve databases of pedestrian and cycling infrastructure. IP S 1.2
Parking
A15 Implement parking management strategies in centres. RS, IP S, M, L 1.3d
A16Finalise and implement the parking study of the city centre and surrounding suburbs.
RS, IP S 1.3d
A17Investigate, and consider implementation of local reinvestment models for paid parking areas.
RS S, M 7.2
A18Monitor parking supply and its distribution in the city centre (as a priority) and other centres, to inform decision making.
RS, IP S, M, L 1.3d
A19Confirm the suitability and number value of a parking cap for the city centre.
RS, IP S 1.3d
A20 Review development controls for parking. SP, IP S1.3c, 1.3d
50 Newcastle Transport Strategy

A21Improve way-finding signage in commercial centres to assist drivers to locate available parking in a more timely manner.
IP, RS M 1.3
A22Audit restrictive parking signage and road marking to ensure that it is clear.
IP, RS S, M
A23 Manage parking for motorbikes. IP, RS S, M, L 1.3d
A24 Revise Council’s Permit Parking Policy. IP, RS S
A25Review Council’s development contributions plans to allow for expenditure of contributions on a range of transport facilities.
SP S
Roads and Freight
A26 Develop and implement a road management framework. IP S 1.3
A27 Review and revise procedures for undertaking local area studies. IP M 1.3
A28Investigate and consider implementation of extension to, and provision of new 40km/h local traffic areas.
IP S, M, L 1.2
A29Review the warrant systems for local area traffic management and pedestrian works.
IP M 1.2
A30 Undertake road safety education. IP S, M, L 1.3d
Travel Demand Management
A31 Facilitate opportunities for establishment of car share schemes. IP S 1.3
A32 Develop and implement a Workplace Travel Plan for Council. IP S 1.1d
A33 Facilitate car pooling. IP S, M, L
A34 Investigate and advocate for park and ride schemes. IP S, M, L
A35Provide information on sustainable transport options and promote their use.
IP S, M, L 1.1d
Implementation
A36Report on implementation of the Newcastle Transport Strategy every two years.
IP M
A37Review the Newcastle Transport Strategy five years from its adoption.
IP L
51Newcastle Transport Strategy

ReferencesAustralian Transport Council, 2011, National Road Safety Strategy 2011 – 2020
Austroads, 2010, The Australian National Cycling Strategy 2011 - 2016
Department of Infrastructure and Transport, 2011, Our Cities Our Future – A national urban policy for a productive, sustainable and liveable future, Commonwealth of Australia
Department of Infrastructure and Transport, 2013, Walking, Riding and Access to Public Transport – Supporting Active Travel in Australian Communities Ministerial Statement, Commonwealth of Australia
Department of Planning, 2006, Lower Hunter Regional Strategy
National Health Performance Authority, 2013, ‘Overweight and obesity rates across Australia, 2011-12’, http://www.nhpa.gov.au/internet/nhpa/publishing.nsf/Content/Report-Download-HC-Overweight-and-obesity-rates-across-Australia-2011-12/$FILE/NHPA_HC_Report_Overweight_and_Obesity_Report_October_2013.pdf
NSW Department of Premier and Cabinet, 2011, NSW 2021: A Plan to Make NSW Number One
NSW Department of Urban Affairs and Planning, 2001, Integrating Land Use and Transport, Improving Transport Choice – Guidelines for planning and development
NSW Government, 2010, NSW BikePlan
Roads and Traffic Authority of New South Wales, 2003, NSW Bicycle Guidelines, www.rta.nsw.gov.au/trafficinformation/downloads/technicalmanuals_dl1.html
The City of Newcastle, 2010, Newcastle Voice – Road Safety, http://www.newcastle.nsw.gov.au/__data/assets/pdf_file/0014/135023/Report_-_Road_Safety-_FINAL.pdf
The City of Newcastle, 2010, Newcastle Voice – Cycling in Newcastle, http://www.newcastle.nsw.gov.au/__data/assets/pdf_file/0006/116718/Report_-_Cycle-_Final_with_Appendix.pdf
The City of Newcastle, 2012, Newcastle Voice – Newcastle 2030, http://www.newcastle.nsw.gov.au/__data/assets/pdf_file/0016/222550/Report-FINAL.pdf
Transport for NSW, 2012, NSW Long Term Transport Master Plan, State of New South Wales
Transport for NSW, 2013, NSW Freight and Ports Strategy
Transport for NSW, 2013, NSW Road Safety Strategy
52 Newcastle Transport Strategy

53Newcastle Transport Strategy

54 Newcastle Transport Strategy

55Newcastle Transport Strategy

56 Newcastle Transport Strategy