news release q3 2019 - s23.q4cdn.com · news release q3 2019 corteva agriscience reports third...
TRANSCRIPT

News Release Q3 2019
Corteva Agriscience Reports Third Quarter 2019 Results –
Delivers Earnings Improvement Over Prior Year • GAAP earnings per share (EPS) from continuing
operations was a loss of $(0.69) for the third quarter
and operating EPS1 was a loss of $(0.39) – both
improved compared to prior year2.
• Net sales were $1.9 billion, down 2% from the same
quarter last year, with flat organic1 sales. On a
segment net sales basis, timing shifts contributed to
a 24% increase in Seed, which was more than offset
by a 12% decline in Crop Protection.
• GAAP loss from continuing operations after income
taxes was $(527) million; Operating EBITDA1 was a
loss of $(207) million – both improved over prior year
on a pro-forma basis2.
• Merger cost synergies for the three months ended
September 30, 2019 totalled approximately
$100 million and remain on track with full-year
commitment of $350 million.
• Outlook5 – Management provided full-year 2019
operating EBITDA1 guidance at the low end of the
prior range, or approximately $1.9 billion, due to
further negative impact of currency. Full-year 2019
operating EPS1 range revised with a $0.04
improvement over the prior guidance mid-point.
1. Organic sales, Operating EPS, Pro Forma Operating EPS, Operating EBITDA and Pro Forma Operating EBITDA are non-GAAP measures. See page 5 for further discussion. 2. First Quarter 2019 and prior year GAAP information is on
a pro forma basis and was determined in accordance with Article 11 of Regulation S-X. Non-GAAP measures for these periods are reconciled to the GAAP pro forma measure. 3. North America is defined as U.S. and Canada. EMEA is
defined as Europe, Middle East and Africa. 4. Enlist E3™ soybeans are jointly developed by Dow AgroSciences and MS Technologies™ 5. The company does not provide the most comparable GAAP measure on a forward-looking basis.
See page 5 for further discussion. 6. Improvement over prior year for Loss from Continuing Operations After Income Taxes and GAAP EPS is primarily due to the absence of a goodwill impairment charge recognized in the third quarter
2018. See page 1 of the Financial Statement Schedules for further disclosure.
FINANCIAL HIGHLIGHTS Net Sales EPS Loss From
Cont. Ops. (AT)
GAAP $1.91 B $(0.69) $(527 M)
vs. 3Q182 (2)% +90%6 +90%6
Organic Sales1
Operating EPS1
Operating EBITDA1
NON-GAAP $(0.39$1.94 B $(0.39) $(207 M)
vs. 3Q182 -% +35% +18%
Our teams around the globe delivered an extraordinary effort in the quarter to support our
customers in the face of numerous challenges. Corteva achieved solid earnings
improvement relative to the prior year and made ongoing progress on our priorities for
shareholder value creation, including securing new product registrations, driving
continued synergy and productivity improvements, and returning cash to shareholders.
We remain focused on driving operational discipline and committed to setting the stage
for solid net sales and operating earnings growth in 2020.
– James C. Collins, Jr., Corteva Chief Executive Officer
2020 Launch of Key Seed Products
Corteva recently launched the 2020 sales season in North America3. Expanded launch of new Qrome® products are expected to provide low single digit price uplift in corn, given demonstrated yield advantages. In soybeans, the new Enlist E3TM4 offerings are expected to scale to 10% of North America acres with continued licensing opportunities.
New Investment Authorized to Expand Spinosyns Capacity
Corteva’s Board of Directors recently authorized an investment to increase Spinosyns fermentation capacity by 30% to address global market growth in insecticides that handle chewing insects in specialty and row crops. The additional capacity will be staged to come online over the next few years and will generate >$100 million of annual operating EBITDA1 at maturity.
Delivering on Commitment to Return Cash to Shareholders
Corteva took two critical next steps related to shareholder remuneration commitments as it intends to return approximately $220 million to shareholders by the end of the year. The Company repurchased shares in the quarter as part of its $1 billion share repurchase program and in October declared its second continuous quarterly dividend
since spin.
Company Updates

News Release Q3 2019
Summary of Third Quarter 2019
WILMINGTON, Del., October 31, 2019 – Corteva, Inc.
(NYSE: CTVA) today reported financial results for the
quarter ended September 30, 2019 and provided
guidance for the full year.
For the quarter, net sales declined 2% versus the same
period last year, with flat organic sales1. Favorable
impacts from shifts of soybean and corn sales into the
third quarter, driven by delayed planting in North
America3, were more than offset by shifts of Crop
Protection sales in Latin America.
Local price declined 3% in the third quarter 2019 versus
the same period last year, driven by North America.
Higher replant in soybeans and corn, coupled with
increased grower incentive discounts, contributed to the
decline.
Volumes increased 3% versus the same period last
year, as delayed North America planting shifted second
quarter sales into the third quarter. This volume growth
was partially offset by declines in Latin America, where
early demand for Crop Protection products shifted sales
into the second quarter and delays in the Brazil
soybean season shifted Crop Protection sales into the
fourth quarter. Currency represented a headwind of 2%,
primarily due to the Brazilian Real and Euro.
GAAP loss from continuing operations after income
taxes was $(527) million in the quarter. Operating
EBITDA1 was a loss of $(207) million, an improvement
of 18% as compared to the same period last year on a
pro forma basis2. Improvement in Seed operating
EBITDA due to timing shifts in North America and cost
savings from synergies was partially offset by lower
Crop Protection operating EBITDA, due to timing of
sales in Latin America.
The Company reported a loss $(0.69) for GAAP EPS
from continuing operations and a loss of $(0.39) for
operating EPS1 for the third quarter 2019.
($ in millions, except where noted)
3Q 2019
3Q 2018
% Change
% Organic Change1
Net Sales $1,911 $1,947 (2)% - %
North America $623 $537 16% 16%
EMEA $305 $296 3% 8%
Latin America $762 $875 (13)% (11)%
Asia Pacific $221 $239 (8)% (6)%
($ in millions, except where noted)
3Q 2019
3Q 20182
% Change
GAAP Loss from Continuing Operations After Income Taxes
$(527) $(5,336) 90%6
Operating EBITDA1 $(207) $(251) 18%
GAAP EPS from Continuing Operations ($/share)
$(0.69) $(7.13) 90%6
Operating EPS1 ($/share) $(0.39) $(0.60) 35%
News Release Q3 2019
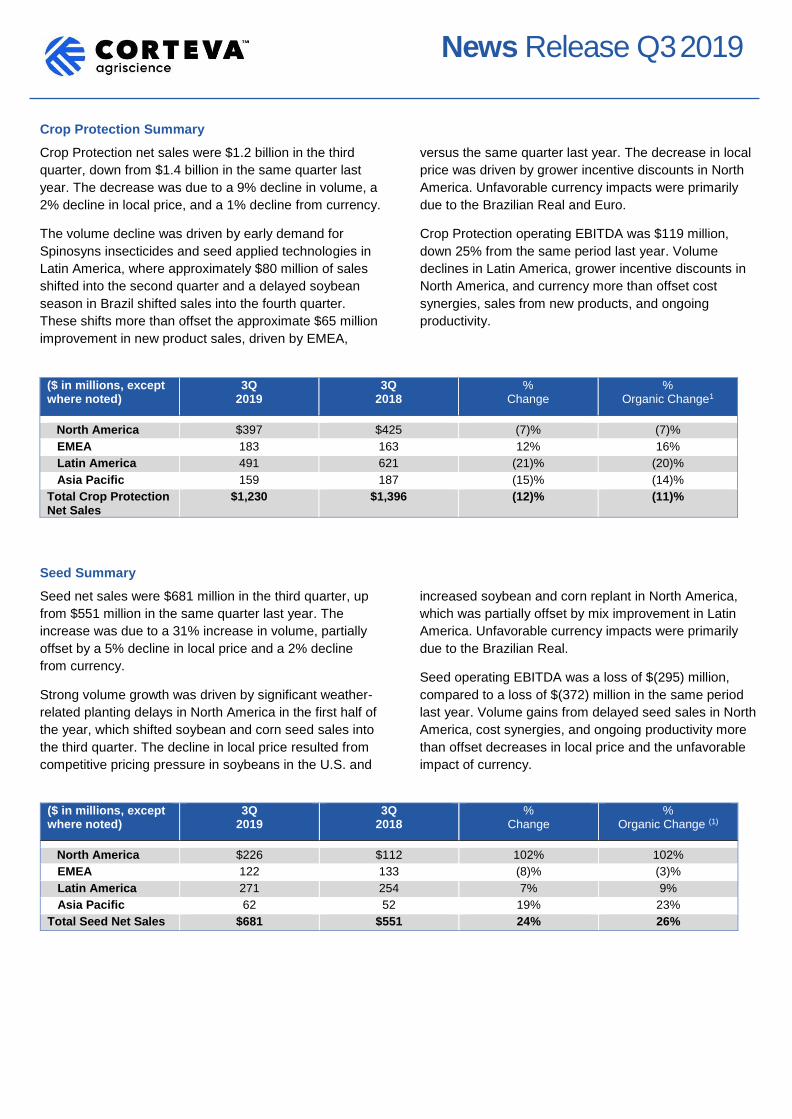
Crop Protection Summary
Crop Protection net sales were $1.2 billion in the third
quarter, down from $1.4 billion in the same quarter last
year. The decrease was due to a 9% decline in volume, a
2% decline in local price, and a 1% decline from currency.
The volume decline was driven by early demand for
Spinosyns insecticides and seed applied technologies in
Latin America, where approximately $80 million of sales
shifted into the second quarter and a delayed soybean
season in Brazil shifted sales into the fourth quarter.
These shifts more than offset the approximate $65 million
improvement in new product sales, driven by EMEA,
versus the same quarter last year. The decrease in local
price was driven by grower incentive discounts in North
America. Unfavorable currency impacts were primarily
due to the Brazilian Real and Euro.
Crop Protection operating EBITDA was $119 million,
down 25% from the same period last year. Volume
declines in Latin America, grower incentive discounts in
North America, and currency more than offset cost
synergies, sales from new products, and ongoing
productivity.
($ in millions, except where noted)
3Q 2019
3Q 2018
% Change
% Organic Change1
North America $397 $425 (7)% (7)%
EMEA 183 163 12% 16%
Latin America 491 621 (21)% (20)%
Asia Pacific 159 187 (15)% (14)%
Total Crop Protection Net Sales
$1,230 $1,396 (12)% (11)%
Seed Summary
Seed net sales were $681 million in the third quarter, up
from $551 million in the same quarter last year. The
increase was due to a 31% increase in volume, partially
offset by a 5% decline in local price and a 2% decline
from currency.
Strong volume growth was driven by significant weather-
related planting delays in North America in the first half of
the year, which shifted soybean and corn seed sales into
the third quarter. The decline in local price resulted from
competitive pricing pressure in soybeans in the U.S. and
increased soybean and corn replant in North America,
which was partially offset by mix improvement in Latin
America. Unfavorable currency impacts were primarily
due to the Brazilian Real.
Seed operating EBITDA was a loss of $(295) million,
compared to a loss of $(372) million in the same period
last year. Volume gains from delayed seed sales in North
America, cost synergies, and ongoing productivity more
than offset decreases in local price and the unfavorable
impact of currency.
($ in millions, except where noted)
3Q 2019
3Q 2018
% Change
% Organic Change (1)
North America $226 $112 102% 102%
EMEA 122 133 (8)% (3)%
Latin America 271 254 7% 9%
Asia Pacific 62 52 19% 23%
Total Seed Net Sales $681 $551 24% 26%

News Release Q3 2019
Outlook
The Company affirmed 2019 guidance for net sales and
expects operating EBITDA at approximately $1.9 billion,
which is the lower end of the previously communicated
range of $1.9 billion to $2.05 billion. The Company now
expects to deliver at the lower end of the previously
communicated range largely due to further negative impact
of currency. The Company revised its full-year operating
EPS range, now expected to be between $1.20 and $1.26
per share. Using the mid-point, this represents a $0.04
improvement over the mid-point of the prior guidance.
Corteva is not able to reconcile its forward-looking non-
GAAP financial measures to its most comparable U.S.
GAAP financial measures, as it is unable to predict with
reasonable certainty items outside of its control, such as
significant items, without unreasonable effort.
Third Quarter Conference Call
The Company will host a live webcast of its third quarter earnings conference call with investors to discuss its results and
outlook today, October 31, 2019, at 9:00 a.m. ET. The slide presentation that accompanies the conference call is posted
on the Company’s Investor Events and Presentations page. A replay of the webcast will also be available on the Investor
Events and Presentations page.
About Corteva Agriscience
Corteva, Inc. (NYSE: CTVA) is a publicly traded, global pure-play agriculture company that provides farmers around the
world with the most complete portfolio in the industry – including a balanced and diverse mix of seed, crop protection and
digital solutions focused on maximizing productivity to enhance yield and profitability. With some of the most recognized
brands in agriculture and an industry-leading product and technology pipeline well positioned to drive growth, the
Company is committed to working with stakeholders throughout the food system as it fulfills its promise to enrich the lives
of those who produce and those who consume, ensuring progress for generations to come. Corteva became an
independent public company on June 1, 2019, and was previously the Agriculture Division of DowDuPont. More
information can be found at www.corteva.com.
Follow Corteva on Facebook, Instagram, LinkedIn, Twitter and YouTube.
Cautionary Statement About Forward-Looking Statements
This communication contains forward-looking statements within the meaning of Section 21E of the Securities Exchange Act of 1934, as amended, and Section 27A of the Securities Act of 1933, as amended, which are intended to be covered by the safe harbor provisions for forward-looking statements contained in the Private Securities Litigation Reform Act of 1995, and may be identified by their use of words like “guidance”, "plans," "expects," "will," "anticipates," "believes," "intends," "projects," "estimates" or other words of similar meaning. All statements that address expectations or projections about the future, including statements about Corteva's strategy for growth, product development, regulatory approval, market position, anticipated benefits of recent acquisitions, timing of anticipated benefits from restructuring actions, outcome of contingencies, such as litigation and environmental matters, expenditures, and financial results, as well as expected benefits from, the separation of Corteva from DuPont, are forward-looking statements.
Forward-looking statements are based on certain assumptions and expectations of future events which may not be accurate or realized. Forward-looking statements also involve risks and uncertainties, many of which are beyond Corteva's control. While the list of factors presented below is considered representative, no such list should be considered to be a complete statement of all potential risks and uncertainties. Unlisted factors may present significant additional obstacles to the realization of forward-looking statements. Consequences of material differences in results as compared with those anticipated in the forward-looking statements could include, among other things, business disruption, operational problems, financial loss, legal liability to third parties and similar risks, any of which could have a material adverse effect on Corteva's business, results of operations and financial condition. Some of the important factors that could cause Corteva's actual results to differ materially from those projected in any such forward-looking statements include: (i) effect of competition and consolidation in Corteva's industry; (ii) failure to successfully develop and commercialize Corteva's pipeline; (iii) failure to obtain or maintain the necessary regulatory approvals for some Corteva's products; (iv) failure to enforce Corteva's intellectual property rights or defend against intellectual property claims asserted by others; (v) effect of competition from manufacturers of generic products; (vi) impact of Corteva's dependence on third parties with respect to certain of its raw materials or licenses and commercialization; (vii) costs of complying with evolving regulatory requirements and the effect of actual or alleged violations of environmental laws or permit requirements; (viii) effect of the degree of public understanding and acceptance or perceived public acceptance of Corteva's biotechnology and other agricultural products; (ix) effect of changes in agricultural and related policies of governments and international organizations; (x) effect of disruptions to Corteva's supply chain, information technology or network systems; (xi) competitor's establishment of an intermediary platform for distribution of Corteva's products; (xii) effect of volatility in Corteva's input costs; (xiii) failure to raise capital through the capital markets or short-term borrowings on terms acceptable to Corteva; (xiv) failure of Corteva's customers to pay their debts to Corteva, including customer financing programs; (xv) failure to realize the anticipated benefits of the internal reorganizations taken by DowDuPont in connection with the spin-off of Corteva; (xvi) failure to benefit from significant cost synergies and risks related to the indemnification obligations of legacy DuPont liabilities in connection with the separation of Corteva; (xvii) increases in pension and other post-employment benefit plan funding obligations; (xviii) effect of compliance

News Release Q3 2019
with environmental laws and requirements and adverse judgments on litigation; (xix) risks related to Corteva's global operations; (xx) effect of climate change and unpredictable seasonal and weather factors; (xxi) effect of counterfeit products; (xxii) failure to effectively manage acquisitions, divestitures, alliances and other portfolio actions; and (xxiii) risks related to the discontinuation of LIBOR.
Additionally, there may be other risks and uncertainties that Corteva is unable to currently identify or that Corteva does not currently expect to have a material impact on its business. Where, in any forward-looking statement, an expectation or belief as to future results or events is expressed, such expectation or belief is based on the current plans and expectations of Corteva's management and expressed in good faith and believed to have a reasonable basis, but there can be no assurance that the expectation or belief will result or be achieved or accomplished. Corteva disclaims and does not undertake any obligation to update or revise any forward-looking statement, except as required by applicable law. A detailed discussion of some of the significant risks and uncertainties which may cause results and events to differ materially from such forward-looking statements is included in the "Risk Factors" section of Exhibit 99.1 of Amendment No. 4 to Corteva's Registration Statement on Form 10 and of Corteva's Quarterly Report on Form 10-Q for the period ended June 30, 2019, as modified by subsequent reports on Form 10-Q and Current Reports on Form 8-K.
Corteva Unaudited Pro Forma Financial Information
In order to provide the most meaningful comparison of results of operations, supplemental unaudited pro forma financial information for the first quarter of 2019 and prior has been included in this presentation. This presentation presents the pro forma results of Corteva, after giving effect to events that are (1) directly attributable to the merger of DuPont and Dow, debt retirement transactions related to paying off or retiring portions of Historical DuPont’s existing debt liabilities, and the separation and distribution to DowDuPont stockholders of all the outstanding shares of Corteva common stock; (2) factually supportable and (3) with respect to the pro forma statements of income, expected to have a continuing impact on the consolidated results. Refer to Corteva’s Form 10 registration statement filed on May 6, 2019, which can be found on the investors section of the Corteva website, for further details on the above transactions. The pro forma financial statements were prepared in accordance with Article 11 of Regulation S-X, and are presented for informational purposes only, and do not purport to represent what the results of operations would have been had the above actually occurred on the dates indicated, nor do they purport to project the results of operations for any future period or as of any future date.
Regulation G (Non-GAAP Financial Measures)
This earnings release includes information that does not conform to U.S. GAAP and are considered non-GAAP measures. These measures include organic sales, operating EBITDA, pro forma operating EBITDA, operating EBITDA margin, pro forma operating EBITDA margin, operating earnings per share, pro forma operating earnings per share, base tax rate, and pro forma base tax rate. Management believes that these non-GAAP measures best reflect the ongoing performance of the Company during the periods presented and provide more relevant and meaningful information to investors as they provide insight with respect to ongoing operating results of the Company and a more useful comparison of year over year results. These non-GAAP measures supplement the Company's U.S. GAAP disclosures and should not be viewed as an alternative to U.S. GAAP measures of performance. Furthermore, such non-GAAP measures may not be consistent with similar measures provided or used by other companies. Reconciliations for these non-GAAP measures to U.S. GAAP are provided in the Selected Financial Information and Non-GAAP Measures starting on page 5 of the Financial Statement Schedules. For first quarter and prior year, these non-GAAP measures are being reconciled to a pro forma GAAP financial measure prepared and presented in accordance with Article 11 of Regulation S-X. See Article 11 Pro Forma Combined Statements of Operations starting on page 14 of the Financial Statement Schedules.
Corteva is not able to reconcile its forward-looking non-GAAP financial measures to their most comparable U.S. GAAP financial measures, as it is unable to predict with reasonable certainty items outside of the company’s control, such as Significant Items, without unreasonable effort. For Significant items reported in the periods presented, refer to page 8 of the Financial Statement Schedules.
Organic sales is defined as price and volume and excludes currency and portfolio impacts. Operating EBITDA is defined as earnings (i.e., income from continuing operations before income taxes) before interest, depreciation, amortization, non-operating benefits , net and foreign exchange gains (losses), excluding the impact of significant items (including goodwill impairment charges). Non-operating benefits, net consists of non-operating pension and other post-employment benefit (OPEB) credits, tax indemnification adjustments, environmental remediation and legal costs associated with legacy businesses and sites of Historical DuPont. Tax indemnification adjustments relate to changes in indemnification balances, as a result of the application of the terms of the Tax Matters Agreement, between Corteva and Dow and/or DuPont that are recorded by the company as pre-tax income or expense. Operating EBITDA margin is defined as Operating EBITDA as a percentage of net sales. Operating earnings per share are defined as "Earnings per common share from continuing operations - diluted" excluding the after-tax impact of significant items (including goodwill impairment charges), the after-tax impact of non-operating benefits, net, and the after-tax impact of amortization expense associated with intangible assets existing as of the Separation from DowDuPont. Although amortization of the Company's intangible assets is excluded from these non-GAAP measures, management believes it is important for investors to understand that such intangible assets contribute to revenue generation. Amortization of intangible assets that relate to past acquisitions will recur in future periods until such intangible assets have been fully amortized. Any future acquisitions may result in amortization of additional intangible assets. Base tax rate is defined as the effective tax rate excluding the impacts of foreign exchange gains (losses), non-operating benefits, net, amortization of intangibles as of the Separation from DowDuPont, and significant items (including goodwill impairment charges). All periods for the first quarter of 2019 and prior are on a pro forma basis as discussed above in the paragraph ‘Corteva Unaudited Pro Forma Financial Information’.
® TM SM Trademarks and service marks of Dow AgroSciences, DuPont or Pioneer, and their affiliated companies or their respective owners.
# # #
10/31/19

News Release Q3 2019
Media Contact: Gregg M. Schmidt +1 302-485-3260 [email protected] Investor Contact: Megan Britt +1 302-485-3279 [email protected]
News Release Q3 2019
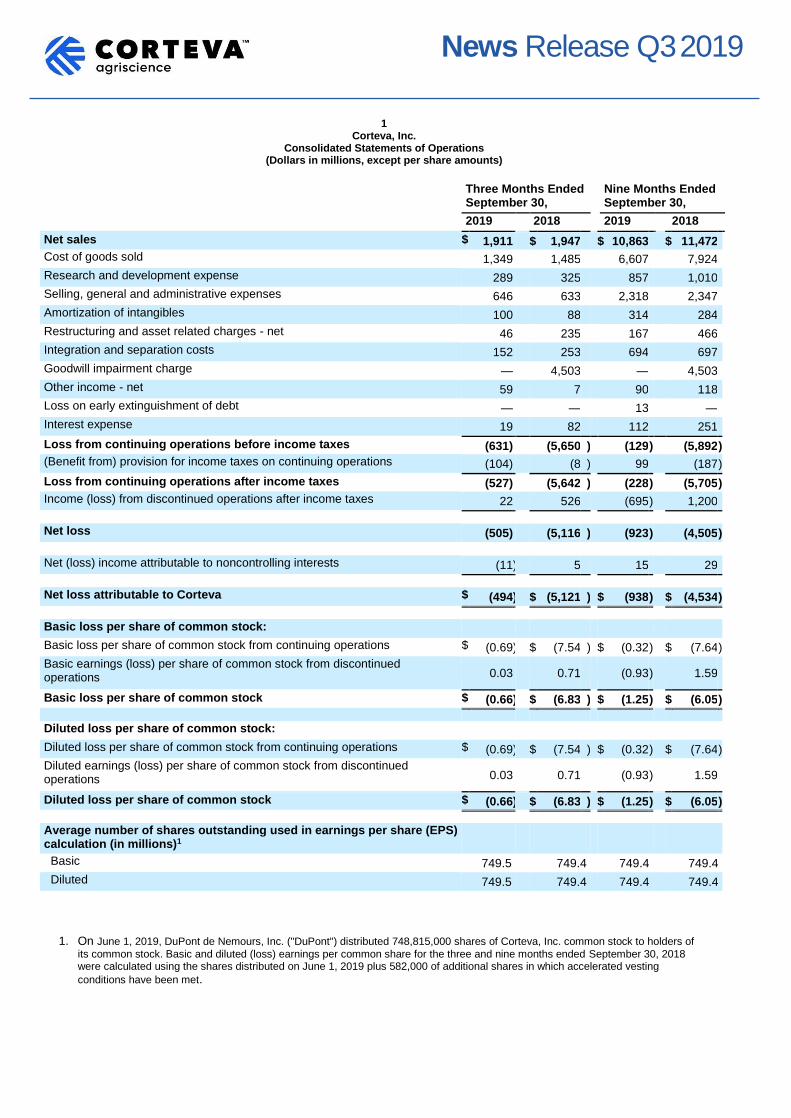
1 Corteva, Inc.
Consolidated Statements of Operations (Dollars in millions, except per share amounts)
1. On June 1, 2019, DuPont de Nemours, Inc. ("DuPont") distributed 748,815,000 shares of Corteva, Inc. common stock to holders of
its common stock. Basic and diluted (loss) earnings per common share for the three and nine months ended September 30, 2018 were calculated using the shares distributed on June 1, 2019 plus 582,000 of additional shares in which accelerated vesting
conditions have been met.
Three Months Ended
September 30, Nine Months Ended
September 30,
2019 2018 2019 2018
Net sales $ 1,911 $ 1,947 $ 10,863 $ 11,472
Cost of goods sold 1,349 1,485 6,607 7,924
Research and development expense 289 325 857 1,010
Selling, general and administrative expenses 646 633 2,318 2,347
Amortization of intangibles 100 88 314 284
Restructuring and asset related charges - net 46 235 167 466
Integration and separation costs 152 253 694 697
Goodwill impairment charge — 4,503 — 4,503
Other income - net 59 7 90 118
Loss on early extinguishment of debt — — 13 —
Interest expense 19 82 112 251
Loss from continuing operations before income taxes (631) (5,650 ) (129 ) (5,892 )
(Benefit from) provision for income taxes on continuing operations (104) (8 ) 99 (187 )
Loss from continuing operations after income taxes (527) (5,642 ) (228 ) (5,705 )
Income (loss) from discontinued operations after income taxes 22 526 (695 ) 1,200
Net loss (505) (5,116 ) (923 ) (4,505 )
Net (loss) income attributable to noncontrolling interests (11 ) 5 15 29
Net loss attributable to Corteva $ (494 ) $ (5,121 ) $ (938 ) $ (4,534 )
Basic loss per share of common stock:
Basic loss per share of common stock from continuing operations $ (0.69 ) $ (7.54 ) $ (0.32 ) $ (7.64 )
Basic earnings (loss) per share of common stock from discontinued operations 0.03 0.71 (0.93 ) 1.59
Basic loss per share of common stock $ (0.66 ) $ (6.83 ) $ (1.25 ) $ (6.05 )
Diluted loss per share of common stock:
Diluted loss per share of common stock from continuing operations $ (0.69 ) $ (7.54 ) $ (0.32 ) $ (7.64 )
Diluted earnings (loss) per share of common stock from discontinued operations 0.03 0.71 (0.93 ) 1.59
Diluted loss per share of common stock $ (0.66 ) $ (6.83 ) $ (1.25 ) $ (6.05 )
Average number of shares outstanding used in earnings per share (EPS) calculation (in millions)1
Basic 749.5 749.4 749.4 749.4
Diluted 749.5 749.4 749.4 749.4
News Release Q3 2019
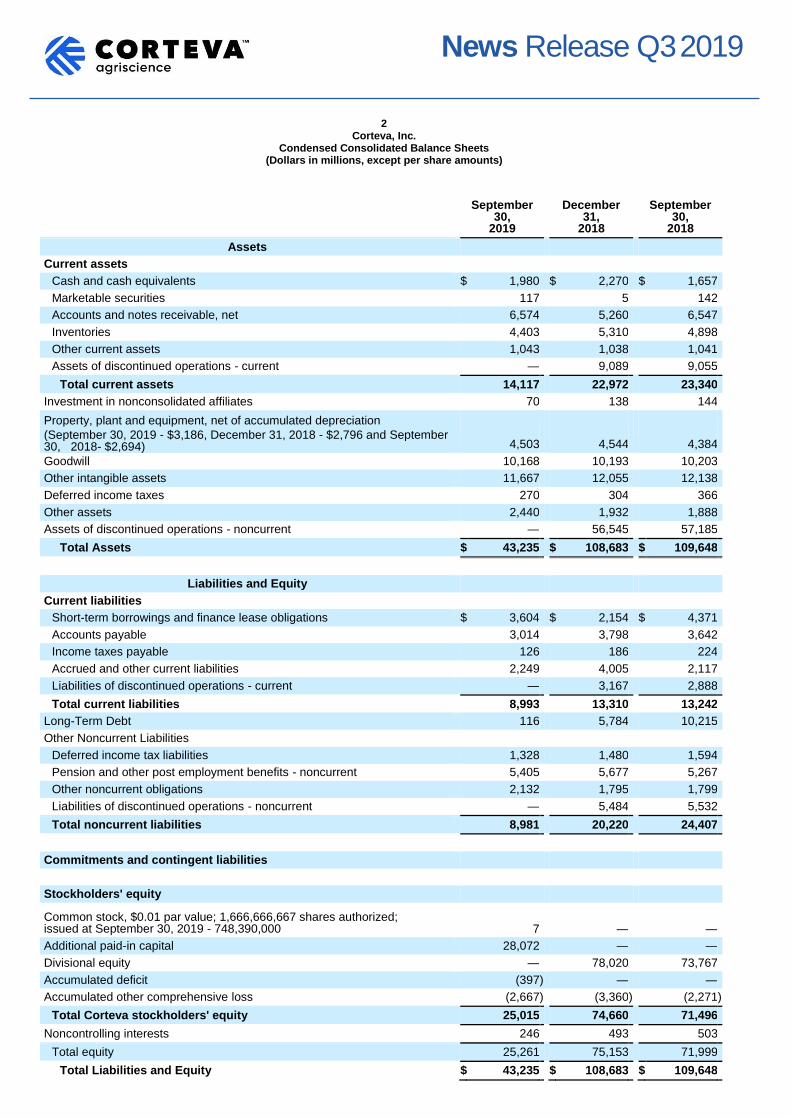
2 Corteva, Inc.
Condensed Consolidated Balance Sheets (Dollars in millions, except per share amounts)
September 30,
2019
December 31,
2018
September 30,
2018
Assets
Current assets
Cash and cash equivalents $ 1,980 $ 2,270 $ 1,657
Marketable securities 117 5 142
Accounts and notes receivable, net 6,574 5,260 6,547
Inventories 4,403 5,310 4,898
Other current assets 1,043 1,038 1,041
Assets of discontinued operations - current — 9,089 9,055
Total current assets 14,117 22,972 23,340
Investment in nonconsolidated affiliates 70 138 144
Property, plant and equipment, net of accumulated depreciation
(September 30, 2019 - $3,186, December 31, 2018 - $2,796 and September 30, 2018- $2,694) 4,503
4,544
4,384
Goodwill 10,168 10,193 10,203
Other intangible assets 11,667 12,055 12,138
Deferred income taxes 270 304 366
Other assets 2,440 1,932 1,888
Assets of discontinued operations - noncurrent — 56,545 57,185
Total Assets $ 43,235 $ 108,683 $ 109,648
Liabilities and Equity
Current liabilities
Short-term borrowings and finance lease obligations $ 3,604 $ 2,154 $ 4,371
Accounts payable 3,014 3,798 3,642
Income taxes payable 126 186 224
Accrued and other current liabilities 2,249 4,005 2,117
Liabilities of discontinued operations - current — 3,167 2,888
Total current liabilities 8,993 13,310 13,242
Long-Term Debt 116 5,784 10,215
Other Noncurrent Liabilities
Deferred income tax liabilities 1,328 1,480 1,594
Pension and other post employment benefits - noncurrent 5,405 5,677 5,267
Other noncurrent obligations 2,132 1,795 1,799
Liabilities of discontinued operations - noncurrent — 5,484 5,532
Total noncurrent liabilities 8,981 20,220 24,407
Commitments and contingent liabilities
Stockholders' equity
Common stock, $0.01 par value; 1,666,666,667 shares authorized; issued at September 30, 2019 - 748,390,000 7
—
—
Additional paid-in capital 28,072 — —
Divisional equity — 78,020 73,767
Accumulated deficit (397 ) — —
Accumulated other comprehensive loss (2,667 ) (3,360 ) (2,271 )
Total Corteva stockholders' equity 25,015 74,660 71,496
Noncontrolling interests 246 493 503
Total equity 25,261 75,153 71,999
Total Liabilities and Equity $ 43,235 $ 108,683 $ 109,648
News Release Q3 2019
3
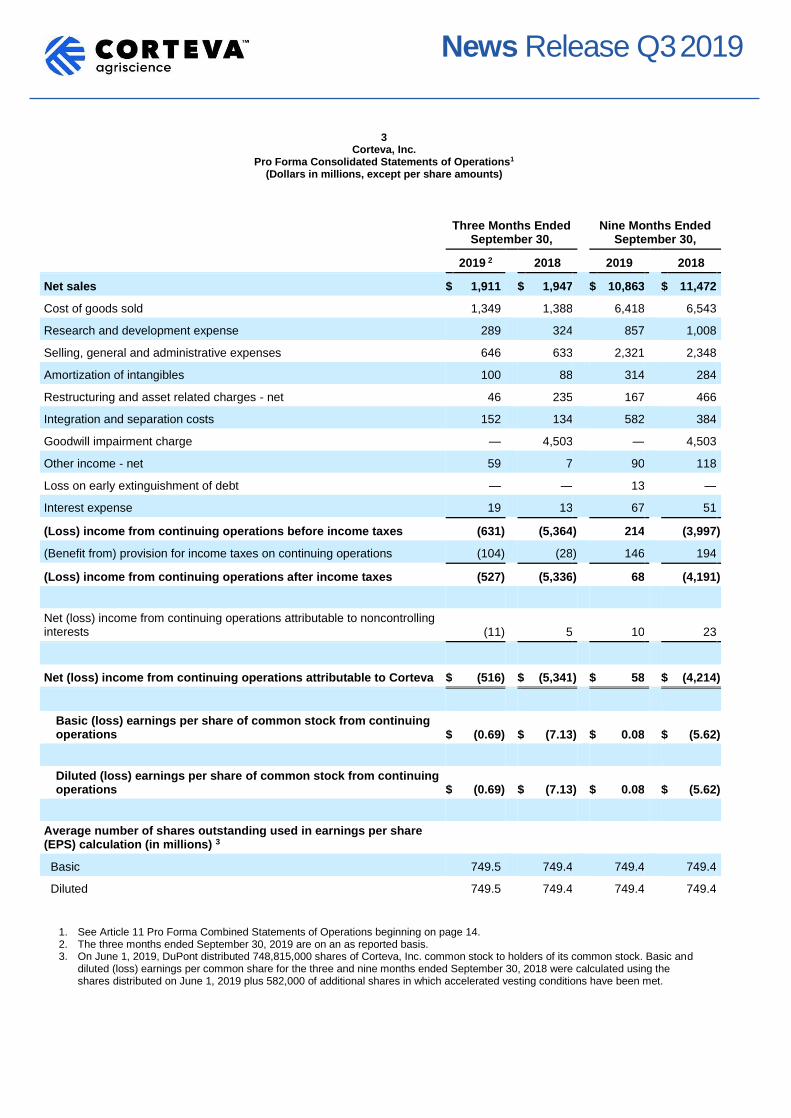
Corteva, Inc. Pro Forma Consolidated Statements of Operations1
(Dollars in millions, except per share amounts)
Three Months Ended
September 30, Nine Months Ended
September 30,
2019 2 2018 2019 2018
Net sales $ 1,911 $ 1,947 $ 10,863 $ 11,472
Cost of goods sold 1,349 1,388 6,418 6,543
Research and development expense 289 324 857 1,008
Selling, general and administrative expenses 646 633 2,321 2,348
Amortization of intangibles 100 88 314 284
Restructuring and asset related charges - net 46 235 167 466
Integration and separation costs 152 134 582 384
Goodwill impairment charge — 4,503 — 4,503
Other income - net 59 7 90 118
Loss on early extinguishment of debt — — 13 —
Interest expense 19 13 67 51
(Loss) income from continuing operations before income taxes (631 ) (5,364 ) 214 (3,997 )
(Benefit from) provision for income taxes on continuing operations (104 ) (28 ) 146 194
(Loss) income from continuing operations after income taxes (527 ) (5,336 ) 68 (4,191 )
Net (loss) income from continuing operations attributable to noncontrolling interests (11 ) 5
10
23
Net (loss) income from continuing operations attributable to Corteva $ (516 ) $ (5,341 ) $ 58 $ (4,214 )
Basic (loss) earnings per share of common stock from continuing operations $ (0.69 ) $ (7.13 ) $ 0.08
$ (5.62 )
Diluted (loss) earnings per share of common stock from continuing operations $ (0.69 ) $ (7.13 ) $ 0.08
$ (5.62 )
Average number of shares outstanding used in earnings per share (EPS) calculation (in millions) 3
Basic 749.5 749.4 749.4 749.4
Diluted 749.5 749.4 749.4 749.4
1. See Article 11 Pro Forma Combined Statements of Operations beginning on page 14. 2. The three months ended September 30, 2019 are on an as reported basis. 3. On June 1, 2019, DuPont distributed 748,815,000 shares of Corteva, Inc. common stock to holders of its common stock. Basic and
diluted (loss) earnings per common share for the three and nine months ended September 30, 2018 were calculated using the shares distributed on June 1, 2019 plus 582,000 of additional shares in which accelerated vesting conditions have been met.

News Release Q3 2019
4 Corteva, Inc.
Consolidated Segment Information (Dollars in millions)
Three Months Ended
September 30, Nine Months Ended
September 30,
SEGMENT NET SALES - SEED 2019 2018 2019 2018
Corn $ 372 $ 344 $ 4,149 $ 4,289
Soybean 168 54 1,297 1,449
Other oilseeds 44 57 469 514
Other 97 96 432 464
Seed $ 681 $ 551 $ 6,347 $ 6,716
Three Months Ended
September 30, Nine Months Ended
September 30,
SEGMENT NET SALES - CROP PROTECTION 2019 2018 2019 2018
Herbicides $ 584 $ 648 $ 2,399 $ 2,579
Insecticides 322 334 1,158 1,111
Fungicides 254 292 776 839
Other 70 122 183 227
Crop Protection $ 1,230 $ 1,396 $ 4,516 $ 4,756
Three Months Ended
September 30, Nine Months Ended
September 30,
GEOGRAPHIC NET SALES - SEED 2019 2018 2019 2018
North America 1 $ 226 $ 112 $ 4,238 $ 4,590
EMEA 2 122 133 1,200 1,222
Asia Pacific 62 52 273 272
Latin America 271 254 636 632
Rest of World 3 455 439 2,109 2,126
Net Sales $ 681 $ 551 $ 6,347 $ 6,716
Three Months Ended
September 30, Nine Months Ended
September 30,
GEOGRAPHIC NET SALES - CROP PROTECTION 2019 2018 2019 2018
North America 1 $ 397 $ 425 $ 1,562 $ 1,844
EMEA 2 183 163 1,136 1,157
Asia Pacific 159 187 674 653
Latin America 491 621 1,144 1,102
Rest of World 3 833 971 2,954 2,912
Net Sales $ 1,230 $ 1,396 $ 4,516 $ 4,756
1. Reflects U.S. & Canada
2. Reflects Europe, Middle East, and Africa
3. Reflects EMEA, Latin America, and Asia Pacific
News Release Q3 2019
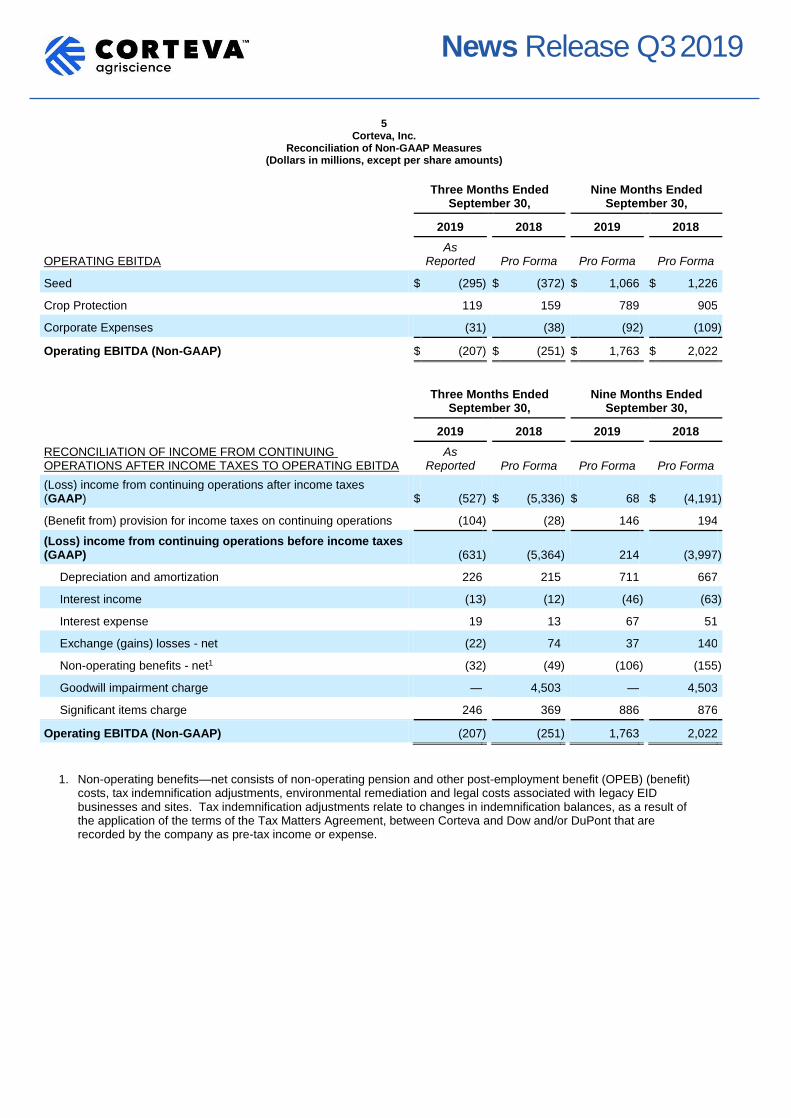
5 Corteva, Inc.
Reconciliation of Non-GAAP Measures (Dollars in millions, except per share amounts)
Three Months Ended
September 30, Nine Months Ended
September 30,
2019 2018 2019 2018
OPERATING EBITDA As
Reported Pro Forma Pro Forma Pro Forma
Seed $ (295 ) $ (372 ) $ 1,066 $ 1,226
Crop Protection 119 159 789 905
Corporate Expenses (31 ) (38 ) (92 ) (109 )
Operating EBITDA (Non-GAAP) $ (207 ) $ (251 ) $ 1,763 $ 2,022
Three Months Ended
September 30, Nine Months Ended
September 30,
2019 2018 2019 2018
RECONCILIATION OF INCOME FROM CONTINUING OPERATIONS AFTER INCOME TAXES TO OPERATING EBITDA
As Reported Pro Forma Pro Forma Pro Forma
(Loss) income from continuing operations after income taxes (GAAP) $ (527 ) $ (5,336 ) $ 68
$ (4,191 )
(Benefit from) provision for income taxes on continuing operations (104 ) (28 ) 146 194
(Loss) income from continuing operations before income taxes (GAAP) (631 ) (5,364 ) 214
(3,997 )
Depreciation and amortization 226 215 711 667
Interest income (13 ) (12 ) (46 ) (63 )
Interest expense 19 13 67 51
Exchange (gains) losses - net (22 ) 74 37 140
Non-operating benefits - net1 (32 ) (49 ) (106 ) (155 )
Goodwill impairment charge — 4,503 — 4,503
Significant items charge 246 369 886 876
Operating EBITDA (Non-GAAP) (207 ) (251 ) 1,763 2,022
1. Non-operating benefits—net consists of non-operating pension and other post-employment benefit (OPEB) (benefit) costs, tax indemnification adjustments, environmental remediation and legal costs associated with legacy EID businesses and sites. Tax indemnification adjustments relate to changes in indemnification balances, as a result of the application of the terms of the Tax Matters Agreement, between Corteva and Dow and/or DuPont that are recorded by the company as pre-tax income or expense.

News Release Q3 2019
6 Corteva, Inc.
Reconciliation of Non-GAAP Measures (Dollars in millions, except per share amounts)
PRICE - VOLUME - CURRENCY ANALYSIS
REGION
Q3 2019 vs. Q3 2018 Percent Change Due To:
Net Sales Change
(GAAP) Organic Change 1
(Non-GAAP) Local Price
& Portfolio /
$ % $ % Product Mix Volume Currency Other
North America $ 86 16 % $ 86 16 % (15 )% 31 % — % — %
EMEA 9 3 % 22 8 % 1 % 7 % (5 )% — %
Asia Pacific (18 ) (8 )% (14 ) (6 )% (4 )% (2 )% (2 )% — %
Latin America (113 ) (13 )% (101 ) (11 )% 4 % (15 )% (2 )% — %
Rest of World (122 ) (9 )% (93 ) (7 )% 2 % (9 )% (2 )% — %
Total $ (36 ) (2 )% $ (7 ) — % (3 )% 3 % (2 )% — %
SEED
Q3 2019 vs. Q3 2018 Percent Change Due To:
Net Sales Change
(GAAP) Organic Change 1
(Non-GAAP) Local Price
& Portfolio /
$ % $ % Product Mix Volume Currency Other
North America $ 114 102 % $ 114 102 % (63 )% 165 % — % — %
EMEA (11 ) (8 )% (5 ) (3 )% 2 % (5 )% (5 )% — %
Asia Pacific 10 19 % 12 23 % 5 % 18 % (4 )% — %
Latin America 17 7 % 21 9 % 14 % (5 )% (2 )% — %
Rest of World 16 4 % 28 7 % 10 % (3 )% (3 )% — %
Total $ 130 24 % $ 142 26 % (5 )% 31 % (2 )% — %
CROP PROTECTION
Q3 2019 vs. Q3 2018 Percent Change Due To:
Net Sales Change
(GAAP) Organic Change 1
(Non-GAAP) Local Price
& Portfolio /
$ % $ % Product Mix Volume Currency Other
North America $ (28 ) (7 )% $ (28 ) (7 )% (3 )% (4 )% — % — %
EMEA 20 12 % 27 16 % — % 16 % (4 )% — %
Asia Pacific (28 ) (15 )% (26 ) (14 )% (6 )% (8 )% (1 )% — %
Latin America (130 ) (21 )% (122 ) (20 )% (1 )% (19 )% (1 )% — %
Rest of World (138 ) (14 )% (121 ) (12 )% (1 )% (11 )% (2 )% — %
Total $ (166 ) (12 )% $ (149 ) (11 )% (2 )% (9 )% (1 )% — %

News Release Q3 2019
7 Corteva, Inc.
Reconciliation of Non-GAAP Measures (Dollars in millions, except per share amounts)
PRICE - VOLUME - CURRENCY ANALYSIS
REGION
Nine Months 2019 vs. Nine Months 2018 Percent Change Due To:
Net Sales Change
(GAAP) Organic Change 1
(Non-GAAP) Local Price
& Portfolio /
$ % $ % Product Mix Volume Currency Other
North America $ (634 ) (10 )% $ (606 ) (10 )% (3 )% (7 )% — % — %
EMEA (43 ) (2 )% 164 7 % 1 % 6 % (9 )% — %
Asia Pacific 22 2 % 66 7 % 4 % 3 % (5 )% — %
Latin America 46 3 % 114 7 % 4 % 3 % (4 )% — %
Rest of World 25 — % 344 6 % 2 % 4 % (6 )% — %
Total $ (609 ) (5 )% $ (262 ) (2 )% — % (2 )% (3 )% — %
SEED
Nine Months 2019 vs. Nine Months 2018 Percent Change Due To:
Net Sales Change
(GAAP) Organic Change 1
(Non-GAAP) Local Price
& Portfolio /
$ % $ % Product Mix Volume Currency Other
North America $ (352 ) (8 )% $ (338 ) (8 )% (4 )% (4 )% — % — %
EMEA (22 ) (2 )% 93 7 % 1 % 6 % (9 )% — %
Asia Pacific 1 — % 18 6 % 2 % 4 % (6 )% — %
Latin America 4 1 % 29 5 % 6 % (1 )% (4 )% — %
Rest of World (17 ) (1 )% 140 6 % 3 % 3 % (7 )% — %
Total $ (369 ) (5 )% $ (198 ) (3 )% (1 )% (2 )% (2 )% — %
CROP PROTECTION
Nine Months 2019 vs. Nine Months 2018 Percent Change Due To:
Net Sales Change
(GAAP) Organic Change 1
(Non-GAAP) Local Price
& Portfolio /
$ % $ % Product Mix Volume Currency Other
North America $ (282 ) (15 )% $ (268 ) (15 )% (2 )% (13 )% — % — %
EMEA (21 ) (2 )% 71 6 % 1 % 5 % (8 )% — %
Asia Pacific 21 3 % 48 7 % 4 % 3 % (4 )% — %
Latin America 42 4 % 85 8 % 2 % 6 % (4 )% — %
Rest of World 42 1 % 204 7 % 2 % 5 % (6 )% — %
Total $ (240 ) (5 )% $ (64 ) (1 )% 1 % (2 )% (4 )% — %
1. Organic sales is defined as price and volume and excludes currency and portfolio impacts.
News Release Q3 2019
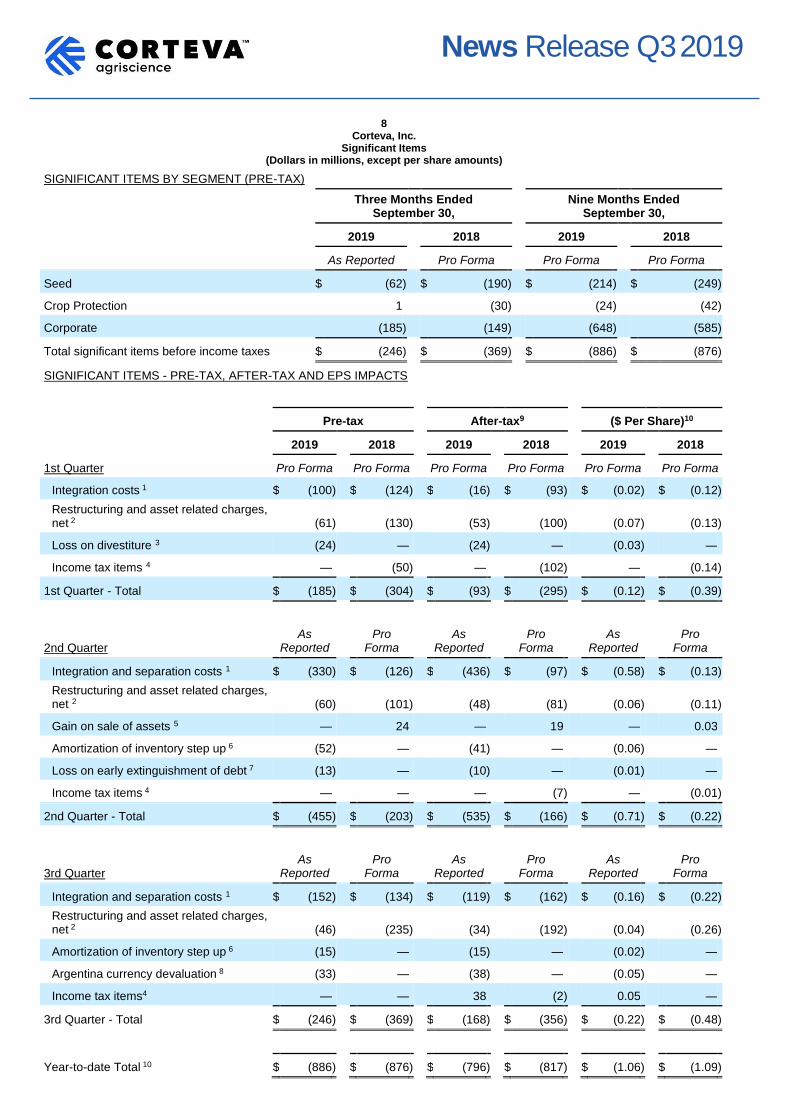
8 Corteva, Inc.
Significant Items (Dollars in millions, except per share amounts)
SIGNIFICANT ITEMS BY SEGMENT (PRE-TAX)
Three Months Ended
September 30, Nine Months Ended
September 30,
2019 2018 2019 2018
As Reported Pro Forma Pro Forma Pro Forma
Seed $ (62 ) $ (190 ) $ (214 ) $ (249 )
Crop Protection 1 (30 ) (24 ) (42 )
Corporate (185 ) (149 ) (648 ) (585 )
Total significant items before income taxes $ (246 ) $ (369 ) $ (886 ) $ (876 )
SIGNIFICANT ITEMS - PRE-TAX, AFTER-TAX AND EPS IMPACTS
Pre-tax After-tax9 ($ Per Share)10
2019 2018 2019 2018 2019 2018
1st Quarter Pro Forma Pro Forma Pro Forma Pro Forma Pro Forma Pro Forma
Integration costs 1 $ (100 ) $ (124 ) $ (16 ) $ (93 ) $ (0.02 ) $ (0.12 )
Restructuring and asset related charges, net 2 (61 ) (130 ) (53 ) (100 ) (0.07 ) (0.13 )
Loss on divestiture 3 (24 ) — (24 ) — (0.03 ) —
Income tax items 4 — (50 ) — (102 ) — (0.14 )
1st Quarter - Total $ (185 ) $ (304 ) $ (93 ) $ (295 ) $ (0.12 ) $ (0.39 )
2nd Quarter As
Reported Pro
Forma As
Reported Pro
Forma As
Reported Pro
Forma
Integration and separation costs 1 $ (330 ) $ (126 ) $ (436 ) $ (97 ) $ (0.58 ) $ (0.13 )
Restructuring and asset related charges, net 2 (60 ) (101 ) (48 ) (81 ) (0.06 ) (0.11 )
Gain on sale of assets 5 — 24 — 19 — 0.03
Amortization of inventory step up 6 (52 ) — (41 ) — (0.06 ) —
Loss on early extinguishment of debt 7 (13 ) — (10 ) — (0.01 ) —
Income tax items 4 — — — (7 ) — (0.01 )
2nd Quarter - Total $ (455 ) $ (203 ) $ (535 ) $ (166 ) $ (0.71 ) $ (0.22 )
3rd Quarter As
Reported Pro
Forma As
Reported Pro
Forma As
Reported Pro
Forma
Integration and separation costs 1 $ (152 ) $ (134 ) $ (119 ) $ (162 ) $ (0.16 ) $ (0.22 )
Restructuring and asset related charges, net 2 (46 ) (235 ) (34 ) (192 ) (0.04 ) (0.26 )
Amortization of inventory step up 6 (15 ) — (15 ) — (0.02 ) —
Argentina currency devaluation 8 (33 ) — (38 ) — (0.05 ) —
Income tax items4 — — 38 (2 ) 0.05 —
3rd Quarter - Total $ (246 ) $ (369 ) $ (168 ) $ (356 ) $ (0.22 ) $ (0.48 )
Year-to-date Total 10 $ (886 ) $ (876 ) $ (796 ) $ (817 ) $ (1.06 ) $ (1.09 )

News Release Q3 2019
1. Integration and separation costs is included in "Integration and separation costs" on the Consolidated Statement of Operations. Beginning in Q2 2019, this includes both integration and separation costs. Included in the after-tax charges are net tax charges of $(32) million and $(114) million related to U.S. state blended tax rate changes associated with the Business Separations for the first and second quarter 2019, respectively. Also, included in the after-tax charges are a net tax charge of $(96) million and a net tax benefit of $13 million related to application of the U.S. tax reform’s foreign tax provisions for the second and third quarter 2019, respectively, and a tax benefit of $102 million related to an internal legal entity restructuring associated with the Business Separations for the second quarter 2019.
2. Third quarter, second quarter, and first quarter 2019 included restructuring and asset related charges of $(46) million,
$(60) million and $(61) million, respectively. The charge for the third quarter included a $(54) million non-cash asset impairment related to certain intangible assets that primarily relate to heritage Dow AgroSciences intangibles previously acquired from Cooperativa Central de Pesquisa Agrícola's ("Coodetec"), classified as developed technology, other intangible assets and in-process research and development ("IPR&D"), partially offset by a benefit of $8 million associated with the DowDuPont Cost Synergy Program. The charge for the first and second quarter is primarily related to the DowDuPont Cost Synergy Program.
Third quarter, second quarter, and first quarter 2018 included restructuring and asset related charges of $(235) million, $(101) million and $(130) million, respectively. The charges for the first and second quarter primarily related to the DowDuPont Cost Synergy Program. The charges for the third quarter included a $(109) million charge related to the DowDuPont Cost Synergy Program, an $(85) million non-cash asset impairment related to certain IPR&D intangibles, and a $(41) million other than temporary non-cash impairment related to an investment in nonconsolidated affiliates in China.
3. First quarter 2019 included a loss of $(24) million included in other income - net related to Historical Dow's sale of a joint
venture related to synergy actions. 4. First quarter 2018 includes a $(50) million pre-tax foreign exchange loss related to adjustments to foreign currency
exchange contracts as a result of U.S. tax reform and a $(64) million after tax charge related to effects of U.S. tax reform.
Second quarter 2018 relates to effects of U.S. tax reform.
Third quarter 2018 includes an after tax benefit related to the impacts of a tax valuation allowance recorded against the net deferred tax asset position of a Brazilian legal entity ($75 million expense), a tax charge related to an internal legal entity restructuring associated with the Business Separations ($25 million expense), and U.S. Tax Reform ($16 million expense), which were almost entirely offset by the impact of the company's discretionary pension contribution in 2018 which was deducted on a 2017 tax return ($114 million benefit).
Third quarter 2019 includes an after tax benefit related to Swiss Tax Reform.
5. Second quarter 2018 includes a gain of $24 million included in other income - net related to an asset sale. 6. Third quarter and second quarter 2019 include amortization of inventory step up of $(15) million and $(52) million,
respectively, included in cost of goods sold related to the amortization of the inventory step-up in connection with the Merger.
7. Second quarter 2019 includes a loss on the early extinguishment of debt related to the difference between the redemption
price and the par value of the Make Whole Notes and Term Loan Facility, partially offset by the write-off of unamortized step-up related to the fair value step-up of EID’s debt.
8. Third quarter 2019 includes a $(33) million loss included in other income - net associated with remeasuring the company’s
Argentine Peso net monetary assets, resulting from an unexpected August primary election result in Argentina. Throughout the three months ended September 30, 2019, the Argentine Peso dropped approximately a third of its value against the U.S. dollar and in September of 2019, the country’s central bank announced new restrictions on foreign currency transactions. The after tax charge of $(38) million includes a tax valuation allowance recorded against the net deferred tax asset position of an Argentine legal entity.
9. Unless specifically addressed in notes above, the income tax effect on significant items was calculated based upon the
enacted tax laws and statutory income tax rates applicable in the tax jurisdiction(s) of the underlying non-GAAP adjustment.
10. Earnings per share for the year may not equal the sum of quarterly earnings per share due to rounding and the changes in
average share calculations.
News Release Q3 2019
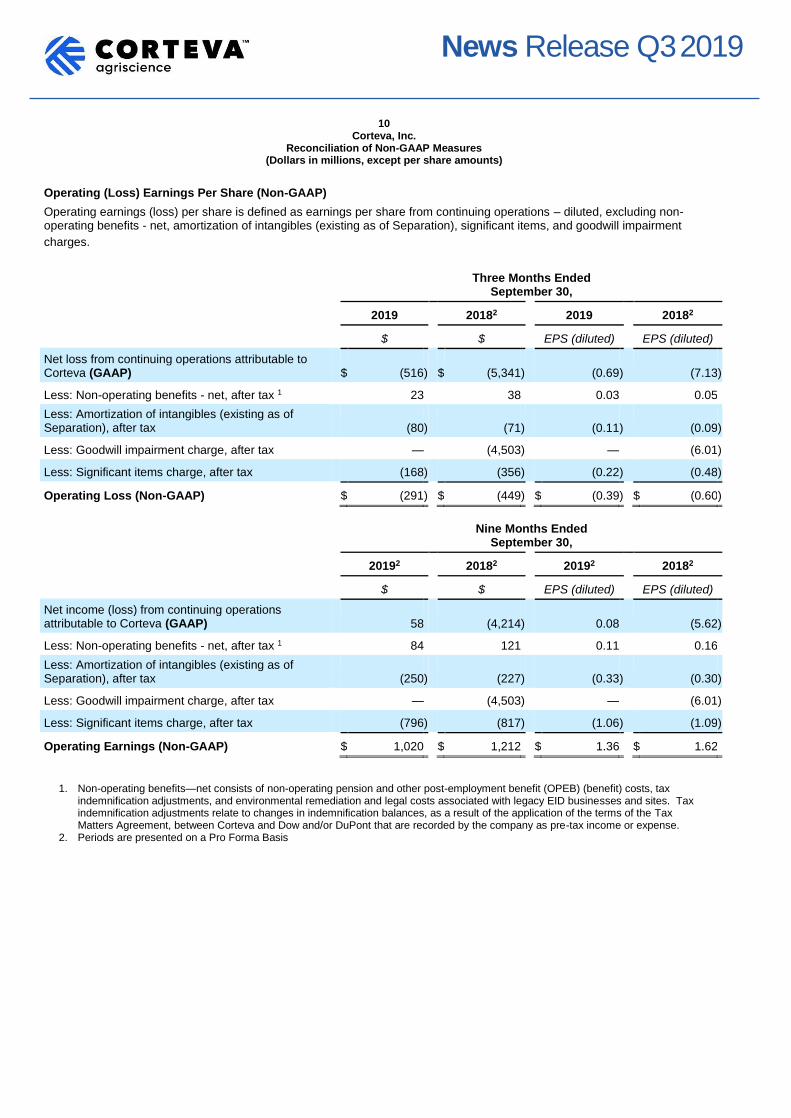
10 Corteva, Inc.
Reconciliation of Non-GAAP Measures (Dollars in millions, except per share amounts)
Operating (Loss) Earnings Per Share (Non-GAAP)
Operating earnings (loss) per share is defined as earnings per share from continuing operations – diluted, excluding non-operating benefits - net, amortization of intangibles (existing as of Separation), significant items, and goodwill impairment
charges.
Three Months Ended
September 30,
2019 20182 2019 20182
$ $ EPS (diluted) EPS (diluted)
Net loss from continuing operations attributable to Corteva (GAAP) $ (516 ) $ (5,341 ) (0.69 ) (7.13 )
Less: Non-operating benefits - net, after tax 1 23 38 0.03 0.05
Less: Amortization of intangibles (existing as of Separation), after tax (80 ) (71 ) (0.11 ) (0.09 )
Less: Goodwill impairment charge, after tax — (4,503 ) — (6.01 )
Less: Significant items charge, after tax (168 ) (356 ) (0.22 ) (0.48 )
Operating Loss (Non-GAAP) $ (291 ) $ (449 ) $ (0.39 ) $ (0.60 )
Nine Months Ended
September 30,
20192 20182 20192 20182
$ $ EPS (diluted) EPS (diluted)
Net income (loss) from continuing operations attributable to Corteva (GAAP) 58
(4,214 ) 0.08
(5.62 )
Less: Non-operating benefits - net, after tax 1 84 121 0.11 0.16
Less: Amortization of intangibles (existing as of Separation), after tax (250 ) (227 ) (0.33 ) (0.30 )
Less: Goodwill impairment charge, after tax — (4,503 ) — (6.01 )
Less: Significant items charge, after tax (796 ) (817 ) (1.06 ) (1.09 )
Operating Earnings (Non-GAAP) $ 1,020 $ 1,212 $ 1.36 $ 1.62
1. Non-operating benefits—net consists of non-operating pension and other post-employment benefit (OPEB) (benefit) costs, tax indemnification adjustments, and environmental remediation and legal costs associated with legacy EID businesses and sites. Tax indemnification adjustments relate to changes in indemnification balances, as a result of the application of the terms of the Tax Matters Agreement, between Corteva and Dow and/or DuPont that are recorded by the company as pre-tax income or expense.
2. Periods are presented on a Pro Forma Basis
News Release Q3 2019
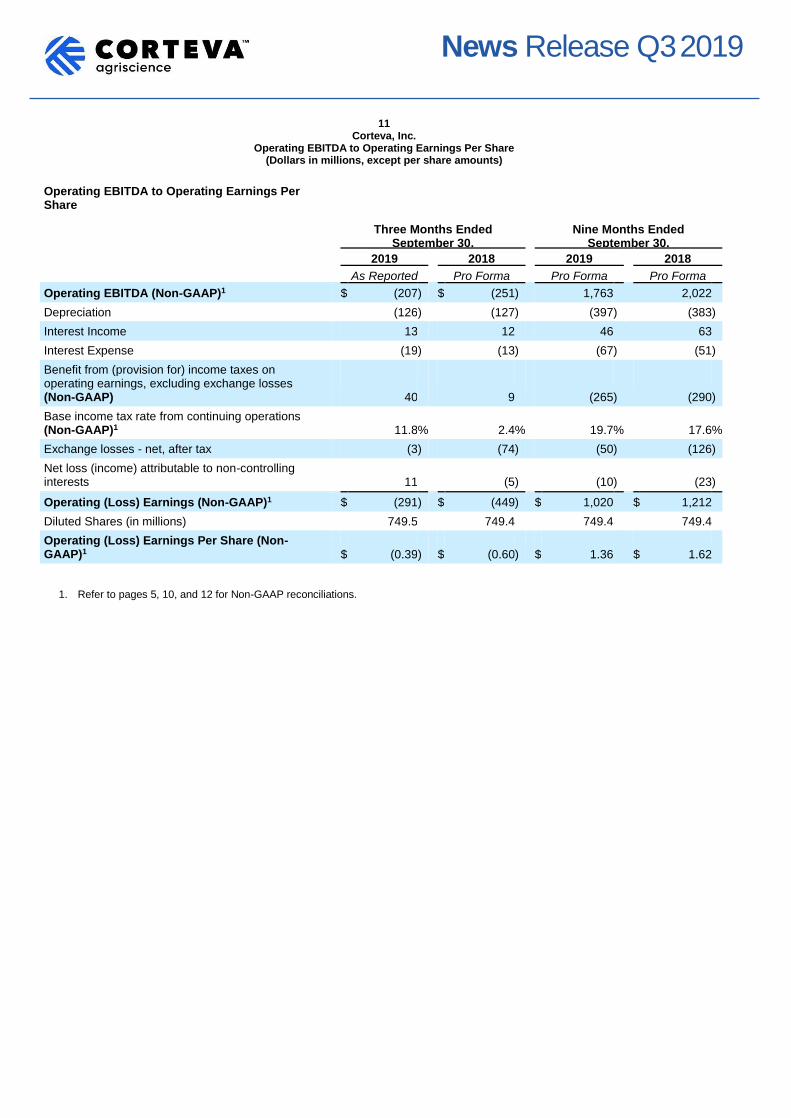
11 Corteva, Inc.
Operating EBITDA to Operating Earnings Per Share (Dollars in millions, except per share amounts)
Operating EBITDA to Operating Earnings Per Share
Three Months Ended
September 30, Nine Months Ended
September 30,
2019 2018 2019 2018
As Reported Pro Forma Pro Forma Pro Forma
Operating EBITDA (Non-GAAP)1 $ (207 ) $ (251 ) 1,763 2,022
Depreciation (126 ) (127 ) (397 ) (383 )
Interest Income 13 12 46 63
Interest Expense (19 ) (13 ) (67 ) (51 )
Benefit from (provision for) income taxes on operating earnings, excluding exchange losses (Non-GAAP) 40
9
(265 ) (290 )
Base income tax rate from continuing operations (Non-GAAP)1 11.8 % 2.4 % 19.7 % 17.6 %
Exchange losses - net, after tax (3 ) (74 ) (50 ) (126 )
Net loss (income) attributable to non-controlling interests 11
(5 ) (10 ) (23 )
Operating (Loss) Earnings (Non-GAAP)1 $ (291 ) $ (449 ) $ 1,020 $ 1,212
Diluted Shares (in millions) 749.5 749.4 749.4 749.4
Operating (Loss) Earnings Per Share (Non-GAAP)1 $ (0.39 ) $ (0.60 ) $ 1.36
$ 1.62
1. Refer to pages 5, 10, and 12 for Non-GAAP reconciliations.

News Release Q3 2019
12 Corteva, Inc.
Reconciliation of Non-GAAP Measures (Dollars in millions)
Reconciliation of Base Income Tax Rate to Effective Income Tax Rate
Base income tax rate is defined as the effective income tax rate less the effect of exchange gains (losses), significant items, goodwill impairment charges, amortization of intangibles (existing as of Separation), and non-operating benefits - net.
Three Months Ended
September 30, Nine Months Ended
September 30,
2019 2018 2019 2018
As
Reported Pro Forma Pro Forma Pro Forma
(Loss) income from continuing operations before income taxes (GAAP) $ (631 ) $ (5,364 ) $ 214 $ (3,997 )
Add: Significant items - charge 1 246 369 886 876
Goodwill impairment charge — 4,503 — 4,503
Non-operating benefits - net (32 ) (49 ) (106 ) (155 )
Amortization of intangibles (existing as of Separation) 100 88 314 284
Less: Exchange gains (losses), net 2 22 (74 ) (37 ) (140 )
(Loss) income from continuing operations before income taxes, significant items, goodwill impairment charges, non-operating benefits - net, amortization of intangibles (existing as of Separation), and exchange losses, net (Non-GAAP) $ (339 ) $ (379 ) $ 1,345
$ 1,651
(Benefit from) provision for income taxes on continuing operations (GAAP) $ (104 ) $ (28 ) $ 146
$ 194
Add: Tax benefits on significant items charge 78 13 90 59
Tax expenses on goodwill impairment charge — — — —
Tax expenses on non-operating benefits - net (9 ) (11 ) (22 ) (34 )
Tax benefits on amortization of intangibles (existing as of Separation) 20
17
64
57
Tax (expenses) benefits on exchange gains (losses), net (25 ) — (13 ) 14
(Benefit from) provision for income taxes on operating earnings, excluding exchange gains (losses), net (Non-GAAP) $ (40 ) $ (9 ) $ 265
$ 290
Effective income tax rate (GAAP) 16.5 % 0.5 % 68.2 % (4.9 )%
Significant items, goodwill impairment charge, non-operating benefits, and amortization of intangibles (existing as of Separation) effect (11.8 )% 1.5 % (46.9 )% 23.2 %
Tax rate from continuing operations before significant items, goodwill impairment charge, non-operating benefits - net, and amortization of intangibles (existing as of Separation) 4.7 % 2.0 % 21.3 % 18.3 %
Exchange gains (losses), net effect 7.1 % 0.4 % (1.6 )% (0.7 )%
Base income tax rate from continuing operations (Non-GAAP) 11.8 % 2.4 % 19.7 % 17.6 %
1. See Significant Items table for further detail.
2. Pre-tax exchange gains (losses), net for the three and nine months ended September 30, 2019, on an operating earnings basis (Non-GAAP), exclude a $(33) million exchange loss associated with the devaluation of the Argentine peso. Pre-tax exchange loss, net for the nine months ended September 30, 2018, on an operating earnings basis (Non-GAAP), excludes a $(50) million exchange loss related to adjustments to foreign currency exchange contracts as a result of U.S. tax reform.

News Release Q3 2019
13 Corteva, Inc.
(Dollars in millions, except per share amounts)
Exchange Gains/Losses
The company routinely uses forward exchange contracts to offset its net exposures, by currency, related to the foreign currency denominated monetary assets and liabilities of its operations. The objective of this program is to maintain an approximately balanced position in foreign currencies in order to minimize, on an after-tax basis, the effects of exchange rate changes. The net pre-tax exchange gains and losses are recorded in other income - net and the related tax impact is recorded in provision for (benefit from) income taxes on continuing operations in the Consolidated Statements of Operations.
Three Months Ended
September 30, Nine Months Ended
September 30,
2019 2018 2019 2018
Subsidiary Monetary Position Loss
Pre-tax exchange losses $ (33 ) $ (105 ) $ (26 ) $ (217 )
Local tax (expenses) benefits (12 ) 7 (15 ) 32
Net after-tax impact from subsidiary exchange losses $ (45 ) $ (98 ) $ (41 ) $ (185 )
Hedging Program Gain (Loss)
Pre-tax exchange gains (losses) $ 55 $ 31 $ (11 ) $ 77
Tax (expenses) benefits (13 ) (7 ) 2 (18 )
Net after-tax impact from hedging program exchange gains (losses) $ 42
$ 24
$ (9 ) $ 59
Total Exchange (Loss) Gain
Pre-tax exchange gains (losses) 1 $ 22 $ (74 ) $ (37 ) $ (140 )
Tax (expenses) benefits (25 ) — (13 ) 14
Net after-tax exchange losses $ (3 ) $ (74 ) $ (50 ) $ (126 )
As shown above, the "Total Exchange (Loss) Gain" is the sum of the "Subsidiary Monetary Position Loss" and the "Hedging Program Gain (Loss)."
1. Pre-tax exchange gains (losses), net for the three and nine months ended September 30, 2019, on an operating earnings basis (Non-GAAP), exclude a $(33) million exchange loss associated with the devaluation of the Argentine peso. Pre-tax exchange loss, net for the nine months ended September 30, 2018, on an operating earnings basis (Non-GAAP), excludes a $(50) million exchange loss related to adjustments to foreign currency exchange contracts as a result of U.S. tax reform.
News Release Q3 2019
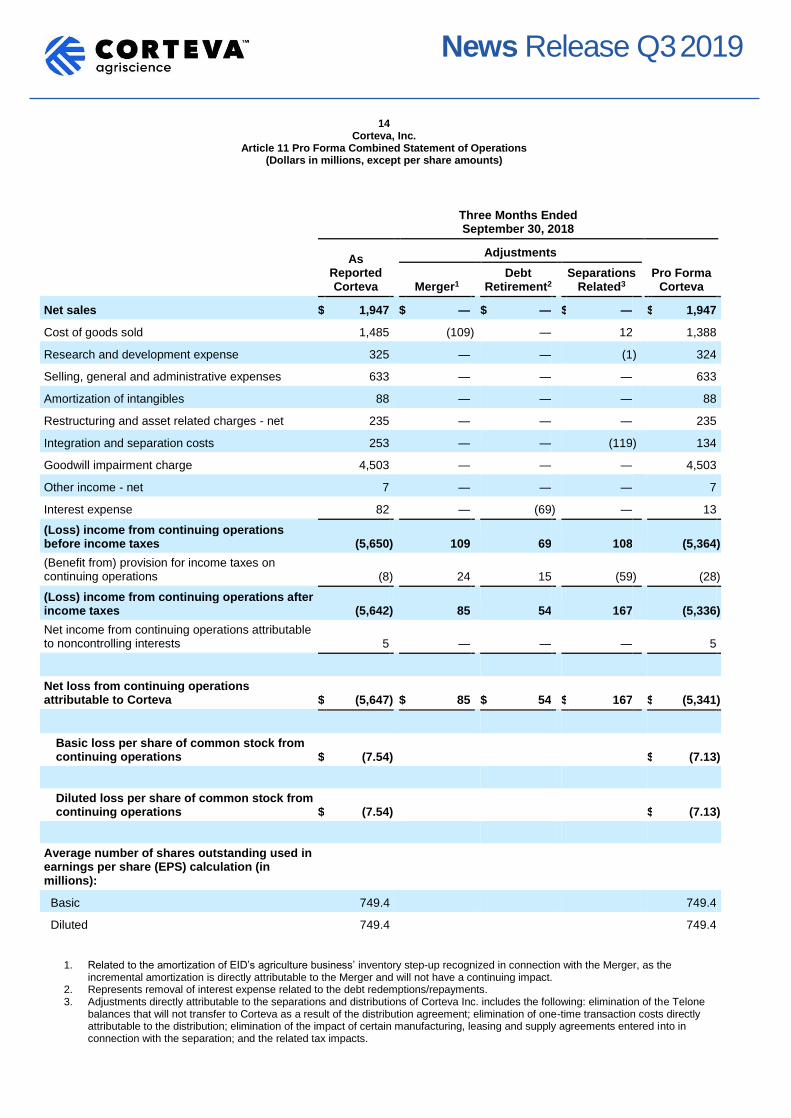
14 Corteva, Inc.
Article 11 Pro Forma Combined Statement of Operations (Dollars in millions, except per share amounts)
Three Months Ended September 30, 2018
As
Reported Corteva
Adjustments
Pro Forma Corteva Merger1
Debt Retirement2
Separations Related3
Net sales $ 1,947 $ — $ — $ — $ 1,947
Cost of goods sold 1,485 (109 ) — 12 1,388
Research and development expense 325 — — (1 ) 324
Selling, general and administrative expenses 633 — — — 633
Amortization of intangibles 88 — — — 88
Restructuring and asset related charges - net 235 — — — 235
Integration and separation costs 253 — — (119 ) 134
Goodwill impairment charge 4,503 — — — 4,503
Other income - net 7 — — — 7
Interest expense 82 — (69 ) — 13
(Loss) income from continuing operations before income taxes (5,650 ) 109
69
108
(5,364 )
(Benefit from) provision for income taxes on continuing operations (8 ) 24
15
(59 ) (28 )
(Loss) income from continuing operations after income taxes (5,642 ) 85
54
167
(5,336 )
Net income from continuing operations attributable to noncontrolling interests 5
—
—
—
5
Net loss from continuing operations attributable to Corteva $ (5,647 ) $ 85
$ 54
$ 167
$ (5,341 )
Basic loss per share of common stock from continuing operations $ (7.54 ) $ (7.13 )
Diluted loss per share of common stock from continuing operations $ (7.54 ) $ (7.13 )
Average number of shares outstanding used in earnings per share (EPS) calculation (in millions):
Basic 749.4 749.4
Diluted 749.4 749.4
1. Related to the amortization of EID’s agriculture business’ inventory step-up recognized in connection with the Merger, as the incremental amortization is directly attributable to the Merger and will not have a continuing impact.
2. Represents removal of interest expense related to the debt redemptions/repayments. 3. Adjustments directly attributable to the separations and distributions of Corteva Inc. includes the following: elimination of the Telone
balances that will not transfer to Corteva as a result of the distribution agreement; elimination of one-time transaction costs directly attributable to the distribution; elimination of the impact of certain manufacturing, leasing and supply agreements entered into in connection with the separation; and the related tax impacts.

News Release Q3 2019
15 Corteva, Inc.
Article 11 Pro Forma Combined Statement of Operations (Dollars in millions, except per share amounts)
Nine Months Ended September 30, 2019
As
Reported Corteva
Adjustments
Pro Forma Corteva Merger1
Debt Retirement2
Separations Related3
Net sales $ 10,863 $ — $ — $ — $ 10,863
Cost of goods sold 6,607 (205 ) — 16 6,418
Research and development expense 857 — — — 857
Selling, general and administrative expenses 2,318 — — 3 2,321
Amortization of intangibles 314 — — — 314
Restructuring and asset related charges - net 167 — — — 167
Integration and separation costs 694 — — (112 ) 582
Other income - net 90 — — — 90
Loss on early extinguishment of debt 13 — — — 13
Interest expense 112 — (45 ) — 67
(Loss) income from continuing operations before income taxes (129 ) 205
45
93
214
Provision for income taxes on continuing operations 99
36
10
1
146
(Loss) income from continuing operations after income taxes (228 ) 169
35
92
68
Net income from continuing operations attributable to noncontrolling interests 10
—
—
—
10
Net (loss) income from continuing operations attributable to Corteva $ (238 ) $ 169
$ 35
$ 92
$ 58
Basic (loss) earnings per share of common stock from continuing operations $ (0.32 ) $ 0.08
Diluted (loss) earnings per share of common stock from continuing operations $ (0.32 ) $ 0.08
Average number of shares outstanding used in earnings per share (EPS) calculation (in millions):
Basic 749.4 749.4
Diluted 749.4 749.4
1. Related to the amortization of EID’s agriculture business’ inventory step-up recognized in connection with the Merger, as the
incremental amortization is directly attributable to the Merger and will not have a continuing impact. 2. Represents removal of interest expense related to the debt redemptions/repayments. 3. Adjustments directly attributable to the separations and distributions of Corteva Inc. includes the following: elimination of the
Telone balances that will not transfer to Corteva as a result of the distribution agreement; elimination of one-time transaction costs directly attributable to the distribution; elimination of the impact of certain manufacturing, leasing and supply agreements entered into in connection with the separation; and the related tax impacts.
News Release Q3 2019
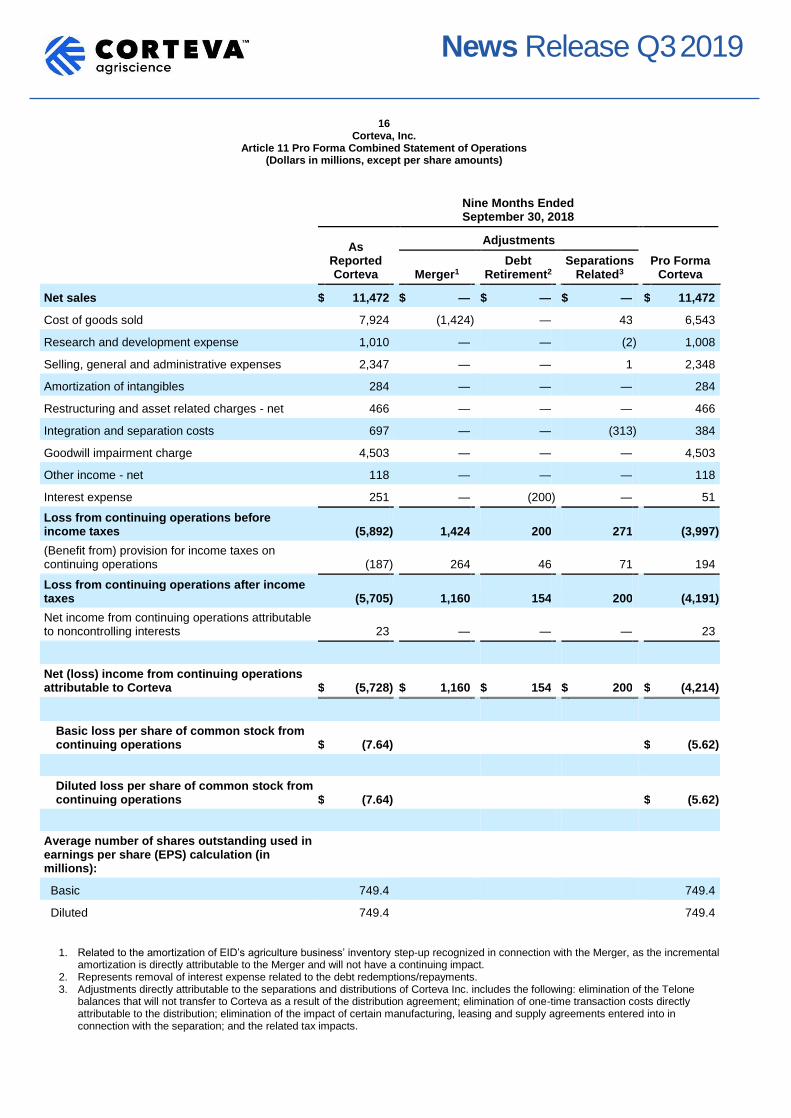
16 Corteva, Inc.
Article 11 Pro Forma Combined Statement of Operations (Dollars in millions, except per share amounts)
Nine Months Ended September 30, 2018
As
Reported Corteva
Adjustments
Pro Forma Corteva Merger1
Debt Retirement2
Separations Related3
Net sales $ 11,472 $ — $ — $ — $ 11,472
Cost of goods sold 7,924 (1,424 ) — 43 6,543
Research and development expense 1,010 — — (2 ) 1,008
Selling, general and administrative expenses 2,347 — — 1 2,348
Amortization of intangibles 284 — — — 284
Restructuring and asset related charges - net 466 — — — 466
Integration and separation costs 697 — — (313 ) 384
Goodwill impairment charge 4,503 — — — 4,503
Other income - net 118 — — — 118
Interest expense 251 — (200 ) — 51
Loss from continuing operations before income taxes (5,892 ) 1,424
200
271
(3,997 )
(Benefit from) provision for income taxes on continuing operations (187 ) 264
46
71
194
Loss from continuing operations after income taxes (5,705 ) 1,160
154
200
(4,191 )
Net income from continuing operations attributable to noncontrolling interests 23
—
—
—
23
Net (loss) income from continuing operations attributable to Corteva $ (5,728 ) $ 1,160
$ 154
$ 200
$ (4,214 )
Basic loss per share of common stock from continuing operations $ (7.64 ) $ (5.62 )
Diluted loss per share of common stock from continuing operations $ (7.64 ) $ (5.62 )
Average number of shares outstanding used in earnings per share (EPS) calculation (in millions):
Basic 749.4 749.4
Diluted 749.4 749.4
1. Related to the amortization of EID’s agriculture business’ inventory step-up recognized in connection with the Merger, as the incremental
amortization is directly attributable to the Merger and will not have a continuing impact. 2. Represents removal of interest expense related to the debt redemptions/repayments. 3. Adjustments directly attributable to the separations and distributions of Corteva Inc. includes the following: elimination of the Telone
balances that will not transfer to Corteva as a result of the distribution agreement; elimination of one-time transaction costs directly attributable to the distribution; elimination of the impact of certain manufacturing, leasing and supply agreements entered into in connection with the separation; and the related tax impacts.