ng khan loon - um students' repositorystudentsrepo.um.edu.my/4397/1/thesis_report_pdf.pdf ·...
TRANSCRIPT

DETERMINATION OF LEAD, CADMIUM, ZINC AND NICKEL IN
EDIBLE OIL PRODUCTS BY STRIPPING VOLTAMMETRY
NG KHAN LOON
DEPARTMENT OF CHEMISTRY
FACULTY OF SCIENCE
UNIVERSITY OF MALAYA
KUALA LUMPUR
2010
PDF processed with CutePDF evaluation edition www.CutePDF.com

DETERMINATION OF LEAD, CADMIUM, ZINC AND NICKEL IN
EDIBLE OIL PRODUCTS BY STRIPPING VOLTAMMETRY
NG KHAN LOON
DISSERTATION SUBMITTED IN FULFILLMENT OF THE
REQUIREMENTS FOR THE DEGREE OF MASTER OF SCIENCE
IN ANALYTICAL CHEMISTRY AND INSTRUMENTATION
DEPARTMENT OF CHEMISTRY
FACULTY OF SCIENCE
UNIVERSITY OF MALAYA
KUALA LUMPUR
2010

ii
ABSTRACT
Edible oil products had become an everyday food that been consumed by most of the
people either for dressing or for cooking purpose. Metal has become a common
contamination to the food product, which it found the way into the edible oil through
environment and processing contamination such as crushing, distillation, and
hydrogenation. In this Study, the main focuses of metal analysis are only confined to 4
common metals which are the Cadmium, Lead, Zinc and Nickel. These elements are
selected in this study due to reason that Cadmium and Lead are commonly known for
their contamination from environment and from processing equipment, and it is important
to be analyzed due to its health deteriorations to consumer. Nickel was chosen in this
analysis for its well known function as a catalyst for hydrogenation process in edible oil
and Zinc was known to be a micronutrient however excess concentration maybe impact
to human health. From analytical chemistry point of view, Spectroscopic techniques
particularly Atomic Absorption Spectroscopy (AAS) and Inductively Couple Plasma
Optical Emission Spectroscopy (ICP-OES) are some of the well known techniques used
for the analysis of metal, however in this study a second approach by electrochemistry
technique is employed to study and quantify the metal concentration, the method used is
known as Voltammetry Stripping Technique. The advantages of voltammetry technique
in comparison to others is it allows for detection limit of sub part per billion level, non
destruction method as well as simultaneous determination of some metals. In this study,
standard addition method was used as the calibration technique for the determination of
Zinc, Nickel, Lead and Cadmium in the edible oil products.

iii
ACKNOWLEDGMENT
The successful completion of this study or project was gratitude and thanks to my
supervisor Professor Dr Tan Guan Huat for understanding and supportive throughout the
duration of the implementation of this project. His advice and guidance has help me to
improve not only in term of project development but also to my perspective on this
particular field, for which I believe has trained and made me well prepare.
I will like to accord a special acknowledgement and great thanks to the followed person
for his support and encouragement not only in my personal development but also
inspiration to give my full diligence in completing this project:
1) Ms Jessica Pit York kin
2) Tsze Sow Lan and Ng kim Teng (My family)
3) Ms Chua Jean chek
4) Mr Ong Keng Fai
5) Loi Hean Wei
6) Sim Soon Eu
7) Yap Boon Siong
Finally I will like to thanks Metrohm (Malaysia) Sdn Bhd for it support and permission in
using the laboratory equipment and chemical during the duration of implementation of
this project.

TABLE OF CONTENTS
Page Number
ABSTRACT ii
ACKNOWLEDGMENT iii
LIST OF FIGURES vi
LIST OF TABLES vii
1.0 INTRODUCTION 1
2.0 OBJECTIVE OF STUDY 5
3.0 PRINCIPLE OF ANALYSIS 5
3.1 MICROWAVE DIGESTION 5
3.2 VOLTAMMETRY AND POLAROGRAPHY 9
3.2.1 PRINCIPLE AND INSTRUMENTATION OF 10
VOLTAMMETRY
3.2.2 STRIPPING VOLTAMMETRY 17
4.0 REVIEW OF LITERATURE 25
5.0 METHODOLOGY 34
5.1 APPARATUS AND INSTRUMENT 34
5.2 CHEMICAL 36
5.2.1 PREPARATION FOR POTASSIUM CHLORIDE 38
ACETATE BUFFER (KCl-ACT)
5.2.2 PREPARATION OF AMMONIA CHLORIDE 38
(NH4Cl)BUFFER
5.2.3 PREPARATION OF DIMETHLYGLOYXIME 39
(DMG) IN ETHANOL

Page Number
5.3 SAMPLING AND SAMPLE PREPARATION OF 39
EDIBLE OIL SAMPLE
5.3.1 SAMPLING OF EDIBLE OIL 39
5.3.2 SAMPLE DIGESTION BY MICROWAVE 41
DIGESTER
5.4 PREPARATION OF CALIBRATION STANDARD 43
5.4.1 PREPARATION OF 1.00 PPM MIXES 44
CADMIUM AND LEAD STANDARD
5.4.2 PREPARATION OF 1.00 PPM ZINC 44
STANDARDS
5.4.3 PREPARATION OF 1.00 PPM NICKEL 45
STANDARDS
5.5 PREPARATION OF SPIKE SAMPLE WITH NICKEL, 45
ZINC, LEAD AND CADMIUM STANDARD
5.6 PREPARATION OF VOLTAMMETRY INSTRUMENT 46
5.6.1 CALIBRATION OF VOLTAMMETRY 46
INSTRUMENT WITH DUMMY CELL
5.6.2 ELECTRODE CHECK 47
5.7 ANALYSIS OF ZINC, LEAD AND CADMIUM 48
IN SAMPLE WITH ANODIC STRIPPING
VOLTAMMETRY
5.8 ANALYSIS OF NICKEL IN SAMPLE WITH 51
ADSORPTIVE STRIPPING VOLTAMMETRY
6.0 RESULTS AND DISCUSSION 53
7.0 CONCLUSION 70
BIBLIOGRAPHY 71
APPENDIX 1 74

vi
LIST OF FIGURES
Page Number
Figure 1.1 Chemical Structure of Triglyceride 1
Figure 3.1 Microwave Digester 7
Figure 3.2 Voltammetry Instrument with 3 Electrode Systems 11
Figure 3.3. Double Junction Silver-Silver Chloride Reference 13
Electrode
Figure 3.4 Hanging Dropping Mercury 15
Figure 3.5 Multi-Mode Mercury Working Electrode 16
Figure 3.7 Chemical structure of Bis-(Dimethylglyoxime) 24
Nickel (II)
Figure 6.1 Voltammogram test result from 797VA computrace 53
dummy cell
Figure 6.9 Voltammogram of Cadmium, Lead and Zinc in Corn 59
Cooking Oil Sample
Figure 6.10 Voltammogram of Nickel in Corn Cooking Oil sample 60
Figure 6.11 Voltammogram of Zinc, Cadmium and Lead in 61
Olive Oil
Figure 6.13 Voltammogram of spike Cadmium, Lead, and Zinc 62
in Corn Oil Sample
Figure 6.14 Voltammogram of spike Nickel in Corn Oil Sample 63
Figure 6.17 Voltammogram of spike Cadmium, Lead and Zinc 65
in Olive Oil Sample
Figure 6.18 Voltammogram of Spike Nickel in Olive Oil 66
Sample
Figure 6.19 Voltammogram of Spike Nickel in Palm Oil 66
Margarine (bakery) Sample
Figure 6.20 Voltammogram of Spike Zinc in Palm Oil 67
Margarine (bakery) Sample

vii
LIST OF TABLES
Page Number
Table 3.6 List of complexing agent or Ligand used in 23
Adsorptive Stripping Voltammetry (AdSV)
Table 4.1 Carbon content (%) in various food types 26
Table 4.2 microwave digestion heating program for Edible Oil 27
Table 4.3 Determination of Zinc, Cadmium, Nickel and Lead 27
in Olive Oil with ICP-MS
Table 4.4 Determination of Nickel, Zinc and Lead in Edible Oil 28
by GFAAS and ICP-AES
Table 4.5 Determination of Zinc, Cadmium and Lead in 29
Edible Oil by Atomic Absorption Spectrometry (AAS)
Table 4.6 Determination of nickel and copper in edible oil 30
by GFAAS
Table 4.7 Determination of Zinc, Cadmium, Lead and Nickel 31
in Edible Oil by sample extraction and with ICP-AES
Table 4.8 Determination of Zinc, Cadmium and Lead in Edible Oil 33
by Derivative Potentiometric Stripping Analysis (DPSA)
Table 5.1 Type of product and Edible Oil source used for analysis 40
Table 5.2 Microwave Digester parameter setting for edible oil 43
sample digestion
Table 5.3 Operation Condition for Cadmium and Lead analysis 49
by Anodic Stripping Voltammetry.
Table 5.4 Operation Condition for Zinc analysis by Anodic 50
Strippping Voltammetry
Table 5.5 Operation Condition for Nickel analysis by Adsorptive 52
Stripping Voltammetry.
Table 6.2 Concentration (ug/L) of Nickel, Cadmium, Lead and 54
Zinc in Reagent Blank by Stripping Voltammetry

viii
Page Number
Table 6.3 Limit of Detection for Cadmium, Lead, Zinc and Nickel 55
for Edible oil sample by Stripping Voltammetry
Table 6.4 Concentration (ug/L) of Nickel, Cadmium, lead and Zinc 55
in various edible oil samples by Stripping Voltammetry
Table 6.5 Concentration (ug/g) of Cadmium in Edible oil samples 56
Table 6.6 Concentration (ug/g) of Lead in Edible Oil Samples 57
Table 6.7 Concentration (ug/g) of Nickel in Edible Oil Samples 57
Table 6.8 Concentration (ug/g) of Zinc in Edible Oil Samples 58
Table 6.12 Recovery studies of spike 100 ug/L of Cadmium, 62
Lead, Nickel and Zinc in Corn Oil Sample
Table 6.15 Recovery studies of spike 100 ug/L of Cadmium, Lead, 63
Nickel and Zinc in Olive Oil Sample
Table 6.16 Recovery studies of spike 100 ug/L of Cadmium, Lead, 64
Nickel and Zinc in Palm Oil Margarine (Bakery) Sample
Table 6.21 Linear Regression (R2) of the standard addition 68
calibration graph for each metal
- 1 -
1.0 INTRODUCTION
Vegetable oil or vegetable fat is fall in same chemical group know as lipid that is
extracted from plant sources. The different between vegetable fat and oil is basically in
term of it morphological, the term oil is referring to vegetable that exist in liquid form at
room temperature such as cooking oil, while vegetable fat are referring to solid at room
temperature such as margarine. Vegetable fat and oil are triglyceride that is consist of a
glycerol that attached to three molecule of fatty acid by an Ester bond, the chemical
structure of triglyceride is show in figure below:
Figure 1.1 Chemical Structure of Triglyceride
The source of Vegatable oil and fat can be come from variety of plant for example it can
be from Palm Oil, Sunflower Seed, Rape Seed, Olive, Soya bean, and Corn. The content
of saturated and unsaturated fatty Acid can be varied among the source, and it is usually
important as it determine the morphological properties as well as it application used in
the industry.

- 2 -
Vegetable oil had become more important in our daily life; it is widely used not
only in cooking and food processing (Edible Oil) but also in oleo-chemical which provide
an ample application included biodiesel, pharmaceutical such as tocopherol (vitamin E),
chemical industries and as well in cosmetic (such as glycerin). From the numerous
application of the vegetable oil, Edible oil is of highly concern in term of it quality
especially in heavy metal content as it had an implication toward health issue. The source
of metal contamination can be come from many sources, in basic it can be divide into two
types endogenous and exogenous (Pehlivan, Arslan, Gode and etc, 2008). Endogenous
factor can be due to the metabolism of the plant it self which is depend on the soil,
fertilizer and water where the plant growth. The metal take up by the plant is very depend
on the amount and type of metal that content in the soil, water or fertilizer that used in the
plant (Rehana, Tasneem and etc, 2009). In the cases of exogenous sources it can be
causes by metal that contaminated the vegetable oil during agronomic technique of
processing such as extracting, crushing, refining, bleaching, and hydrogenation (Pehlivan,
Arslan, Gode and etc, 2008), for example Nickel (Ni) contamination can be causes by the
hydrogenation process.
Ample of study and research paper had been publish in the analysis of heavy
metal in edible oil, from the many research work the most common heavy metal analysis
included Iron (Fe), Copper (Cu), Nickel (Ni), Zinc (Zn), Lead (Pb), Cadmium (Cd) and
Chromium (Cr). This metal is of greatly interest in edible oil analysis because the metal
are known to have a catalyst effect which accelerate the auto-oxidation mechanism that
lead to oxidation or rancidity of the vegetable oil, especially Iron, Copper, and Nickel

- 3 -
(Mareila and Reinaldo, 2006). Other metal lead, Cadmium and chromium is of highly
interest due to it toxicity effect. The main metals of interest in this study are basically
focused on Zinc, Cadmium, Lead and Nickel in edible oil, this metal are selected because
it is the most commonly assess for quality of the Edible oil
Nickel contain in Vegetable oil can be come from many sources, either from the
process itself or from the process equipment. The hydrogenation is a very important
process in vegetable oil especially in the production of margarine and shortening. The
main objective of hydrogenation process is mainly to modify the oxidative and thermal
stability properties of the edible oil which had an effect on the physical properties such as
melting temperature, Surface tension, viscosity and etc (Maria, Gabriela Guillermo and
etc, 2007). The hydrogenation processes are usually performed by adding nickel or
copper as a catalyst to accelerate the process. The nickel is preferable in contrast to
copper due to cost, as nickel is cheaper and in most cases copper is difficult to be
removed from the process (M.K Gupta, 2005). Apart from that, nickel contamination in
edible oil can also be causes by corrosion of the processing equipment (Mariela and
Reinaldo, 2006).The permitted amount of nickel in oil is set by many national and
international country at level of 0.2mg/Kg (Durali, Ozgur and etc, 2009).
Cadmium and lead contamination are hardly associated to edible oil processing, it
is mostly are cause by the environment exposure rather than process related. It present
can be causes by deposition or bioaccumulation from the soil or water due to pollution.
Cadmium and Lead are know to be accumulate in biological system for long half life. the

- 4 -
source of cadmium and lead (Pb) can be due to combustion of fuel in refinery process,
industrial emission, and from packaging material such as colorant and stabilizer in plastic
(Giacomo, Lara and Et al). It is also know to be highly contaminated from phosphate
base fertilizer (Rehana, Tasneem and etc, 2009) that used in the plantation. Lead and
cadmium are of greatly interested in edible oil analysis because of it toxicity which had
an implication to the health. Lead and cadmium are known to be acute and chronic
poisoning which can causes failure to the kidney, liver, heart and immune system. In
addition to that, exposure to such metal is also known to cause chromosome aberration,
cancer, and birth defect. As according to Durali, ozgur and etc that many national and
international countries had set the permitted amount of lead (Pb) in oil at 0.1mg/Kg and
Cadmium (Cd) at 0.05 mg/Kg. As according to World Health Organization (WHO) the
permitted doses of Cadmium (Cd) and lead (Pb) for an adult per week are set at 0.5 mg
and 3.0 mg respectively.
Zinc are mineral that exist in edible oil due to it function as metabolite and
micronutrient for the plant. The source of zinc are mainly from the soil which the plant
growth and as well from the water. Zinc is an essential mineral that required by human
body, which is important for normal growth, wound healing, normal taste sensational,
and appetite. Zinc usually is required at low concentration; however at high concentration
of Zinc it can pose some side effect that had health deleterious impact. The daily
recommended amount of zinc (Zn) intake for an adult male is at 15 mg and for adult
female is at 12 mg (Durali, Ozgur and etc, 2009).

- 5 -
2.0 OBJECTIVE OF STUDY
The objective with respect to the topic of ‘Determination of lead, Cadmium, Nickel and
Zinc in Edible Oil by Stripping Voltammetry’ is to study the analysis method for quantify
the concentration of the metal in the various edible oil sample by using electrochemistry
instrument particular stripping Voltammetry technique. In this study the Lead, Cadmium
and Zinc will be analyze by using the Anodic Stripping Voltammetry Technique, whereas
for Nickel will be analyzed by using Adsorptive Stripping Voltammetry. In order to
assess the method reliability a recovery study is perform on the spike sample for both
stripping method.
3.0 PRINCIPLE OF ANALYSIS
The propose method in this work was focus on the analysis of Zinc, Cadmium,
Lead and Nickel in Edible oil. Prior to metal analysis the sample are prepared by
digestion using microwave digestion technique and the metal is analyze by using
stripping voltammetry method, therefore in this chapter the principle of this analysis
method will be highlighted for better understanding of the analysis method.
3.1 MICROWAVE DIGESTION
Microwave Digestion technique had been introduce since 1980, and it had
become an important and preferable sample preparation technique especially in the

- 6 -
analysis of metal. Microwave digestion method is a simple and direct method, the
principle of this method is basically based on microwave electromagnetic radiation that
applied to the sample, as a consequences of this the energy of the microwave is absorb by
the water molecule that present in the digested solution (sample), which subsequently
causes the dipole rotation of the water molecule. Heat is produced as a result of friction
of the molecule movement, which is then conducted within the solution. By this
mechanism it heat up the solution of sample much faster in comparison to conventional
wet digestion technique and the organic matrix of the sample can be breakdown or
oxidized when suitable mineral acid is used.
A basic microwave digester instrument are consists of a microwave chamber,
carousel, cooling fan, temperature sensor and sample vessel. The microwave chamber is
where the sample carousel is put in place prior to digestion. A carousel usually is turn
able which allow for sample to be homogenously irradiated in the microwave chamber.
Cooling fan is basically functioning for cool down the sample upon completion of sample
digestion. In most microwave digester device that available in the market, is usually
equipped with temperature sensor which allow for accurate temperature control during
digestion process, in some cases whereby pressure sensor is also included for pressure
monitoring. In today advance microwave digester, almost of the system is able to be
monitor by microcomputer either built inside the system or can be connected to computer
directly, this allow for easy setting of the sample digestion condition such as microwave
power (watt), ramp time, temperature, hold time, cooling time and as well the pressure
setting, apart from that some software allow as well for recording of each sample vessel

- 7 -
digestion condition, sample identification, date, time and method used. The type of
sample vessel used is an important consideration it often very depend on the
characteristic of sample and mineral acid to be used. There are various types of sample
vessel used in microwave digester such as Polytetraflouroethylene (PTFE), Quartz,
Polyflouroacetate (PFA) and many more. The type of material used for the microwave
sample vessel must fulfill certain requirement. One of the most important criteria of the
sample vessel is that it must be transparent to the microwave so that the Electromagnetic
radiation can direct interact with the sample solution, apart from that the vessel as well
must be able to withstand the corrosiveness of mineral acid or oxidizing agent used such
as concentrated nitric acid (65%) and hydrogen peroxide, and the vessel as well must able
to withstand heat and pressure. The figure (3.1) below show an example of a microwave
digester
Figure 3.1 Microwave Digester Systems

- 8 -
Microwave digester, is preferable by most of the analysis of metal in organic material due
to the system is efficient, usually the sample digestion time can be greatly reduce and
beside that the temperature and pressure can be controlled in comparison to conventional
wet digestion method. One of the added advantages is that, the digestion is perform in
closed vessel which is important to prevent any lost of analyte by evaporation and also
contamination from environment especially when perform analysis at a trace level. Apart
from that, the sample vessel is transparent to microwave as a result the sample vessel is
not heated and can be easily handle after the sample digestion. However the disadvantage
of microwave digester is that only a small amount of sample can be used which is in the
range of 0.1-0.5 g. The amount of sample to be used is very depend on the carbon content
in the sample, the principle guidelines is the carbon content should not exceed 1.5 mg
Carbon per volume (ml) of the liner sample vessel (Pier Luigi Buldini, Loretta Ricci and
Jawahar Sharma, 2002)
The used of type of mineral acid for sample digestion is very depend on the type of
sample to be digest, some of the common mineral acid used for digestion included
hydrochloric acid (HCl), Sulfuric Acid, Nitric Acid, Hydrofluoric Acid, Perchloric acid
and many more. However the general guidelines for digestion of sample containing
organic matrices such as food sample, Nitric acid are often used due to it oxidizing
properties, therefore for the cases of edible oil, Nitric Acid is the choice of acid to be
used. In microwave digestion the amount of sample is important as it affected the
optimization of the sample dissolution. However, small sample amount during sample
preparation may pose a difficulty in trace metal analysis, as a result the microwave

- 9 -
digestion method may causes limitation for used with analytical equipment such as
Atomic Absorption Spectroscopy especially in the Part Per Billion (ppb) level.
The disadvantages of microwave digestion is associate with it limitation to sample
amount, which play a critical role especially when analyzing trace metal in edible oil
whereby high sample amount maybe preferable. Apart from that, Microwave digesters
are usually costly and expensive, therefore other optional preparation methods are
sometimes chosen in comparison to microwave digester.
3.2 VOLTAMMETRY AND POLAROGRAPHY
The term Voltammetry was first used by kolthoff in 1940, it refer to a group of
technique that fall under electrochemistry, which utilized the potential or voltage in the
unit of Volt that applied to an electrode system, and measure the current in the unit of
ampere that flow through the chemical cell. Polarography was the term that use, when
the voltammetry technique is applies to a working electrode system whereby a mercury is
flow through a capillary to form a droplet (dropping mercury electrode), and a potential
current relationship is measured. The technique of Polarography was introduce by
Heyrovsky and the word polarography was come from the name polarized, which mean
that no current are able to flow across the interface (Mercury) of the working electrode
with solution although there is a potential different across the electrode. In order to
prevent confusion, IUPAC define Voltammetry as a general term that used when current
potential relationship is measured, while Polarography term is used when the flowing

- 10 -
conducting liquid electrode such as dropping mercury electrode is used as the working
electrode for investigating the current potential relationship.
3.2.1 PRINCIPLE AND INSTRUMENTATION OF VOLTAMMETRY
In the early development of voltammetry and polarography instrument, the system
is basically consist of simple setup that comprise a direct current Potential Source
(potentiostat), an Ammeter for current measurement and a measuring cell. Two type of
electrode system was used in the early cell which is know as the counter electrode and the
working electrode, both electrode system was immersed in the ionic solution that contain
the substances of analytical interest and electrolytic conductance. This ionic solution will
complete the electric circuit of the whole set up, therefore when a voltage range is applied
to the working electrode, the resulting current is able to measure by the counter electrode.
The information and magnitude of the current response provides the evidence for which
quantitative and qualitative analysis can be perform.
The simple 2 electrode set up of the system does not provided a good outcome,
and as well limit the application of the system. In Basic, the counter electrode had 2
purposes, the first function is to act as a reference electrode and the second function is to
complete the circuit by carrying the current that generate at the working electrode during
the chemical process. The problem arise was due to the counter electrode used, which
cannot provide a stable and precise control of working electrode potential in relative to
the reference electrode being used. In order for the counter electrode to be used as an

- 11 -
ideal reference system, the counter electrode must be able to provide a constant potential
and as well must be depolarizable but that is not the cases in the counter electrode used.
Therefore, in modern voltammetry system 3 electrode system is employed the
counter electrode no longer function as both reference electrode and also as carrier for
current that generated in the working electrode, instead a third electrode know as the
auxiliary electrode (AE) is introduce which function to complete the current carrying
circuit, the type of auxiliary electrode used are of platinum electrode. The figure 3.2
illustrated a simple set up of a 3 electrode system of a voltammetry instrument.
Figure 3.2 Voltammetry Instrument with 3 Electrode Systems
The introductions of the Auxiliary electrode mean that now the counter electrode only
serve as one function as a true reference electrode. The construction of reference
electrode can be of single or double junction and very depend on the type of sample is
Working Electrode
Auxillary Electrode
Reference Electrode

- 12 -
measuring. Two of the well know references electrode that used in electrochemistry are
the silver-silver chloride (Ag-AgCl) electrode in which the electrolyte used are the
potassium chloride, the second type of is know as calomel electrode using a mercury
electrolyte. The latter system is less preferable due to it hazardous of mercury content.
The reference electrode system used provided a constant potential in order to ensure a
precise voltage or potential is apply to the working electrode, the chemical reaction for a
Ag-AgCl reference electrode is show as below:
AgCl -------------� Ag+
(solid) + Cl- (liquid) Std potential = 0.222v
The standard potential is only truth when 1 mol/L of potassium chloride (KCl) is used as
the electrolyte. However at different concentration the potential can be calculated from
Nerst equation:
New Ref potential (v) = Std Potential – RT/nf Log [Cl-]
Whereby, R= gas constant,
T = Temperature
n = Charge
f = Faraday constant
[Cl-] = concentration of Chloride in the electrolyte used

- 13 -
Two type of junction are usually available, a single junction (salt bridge) or double
junction (salt bridge), a double junction system had an advantage of allowing two
different electrolyte to be used, for instance if the chloride ion in the KCl causes
interference to the measuring cell a second kind of electrolyte can be used on the outer
compartment for example potassium nitrate (KNO3). The Figure (3.3) below illustrated
an example of a double junction reference electrode system:
(a) = Silver Wire
(b) = KCl Electrolyte
(c) =Silver Chloride
(d) = second electrolyte (KCl, KNO3)
(e) = Salt bridge (junction)
Figure 3.3. Double Junction Silver-Silver Chloride Reference Electrode
The working electrode are the most important in the voltammetry this because
various type of working electrode are available. In the cases mercury electrode is used as
a working electrode the term polarography is used to refer the system. In general the
working electrode can be divided into two types the liquid or solid working electrode.
The only type of liquid working electrode is the mercury electrode, whereas for solid
electrode there is various type example are rotating platinum disk electrode (RDE),
Glassy carbon electrode (GCE), carbon paste electrode (CPE), gold electrode and silver

- 14 -
electrode. The solid working electrodes are often used for cyclic voltammetry (CV)
analysis.
Mercury working electrode can be divided into 3 types and is depend on the
construction of the electrode itself. The 3 types are included, dropping mercury electrode
(DME), hanging mercury dropping electrode (HMDE), static mercury dropping electrode
(SMDE). The only different in this mode are the method of manipulating the mercury
dropping. Each of the modes used account for it different sensitivity. In the case DME
mode is used, often it is used for analysis in ppm range whereas for SMDE is for sub ppb
range and for HMDE is for ppb and Part per Trillion (ppt) analyses. In order for the
analysis using HMDE the voltammetry technique used often is by stripping voltammetry
technique. The sensitivity of DME is in ppm range due to the dropping mercury is
inconsistency as a result of the surface area of the mercury drop produce is continuously
changing and not constant. As a result a more improvised mode knows as SMDE was
introduced which produce a more constant surface area of the dropping mercury. The
construction of a SMDE working electrode is incorporated a valve system which can
open and shut at a short time of 20-200 milisecond, therefore this produce a mercury drop
which is more constant in surface area. In the case for HMDE mode the working
electrode form a small drop of mercury which hang on the tip of the capillary, this mode
produce a very constant surface area and long hanging time that allow stripping
voltammetry technique to be used perfectly. The figure 3.4 shows the hanging dropping
mercury electrode.

- 15 -
Figure 3.4 Hanging Dropping Mercury (HMDE)
Today modern mercury working electrode is design to be able to switch between
the 3 different modes of analysis. However the disposable of mercury waste are
sometimes a problem to the usage of voltammetry analysis, as a solution to the problem
above some manufacture had introduced the used of a thin film mercury electrode, in
which mercury is electrolytically deposited onto a solid electrode such as glassy carbon
or iridium prior to analysis, this type of electrode is suitable for stripping voltammetry
and chronopotentiometric analysis. However dropping mercury electrode is preferred in
some instance that a new surface is form in each mercury drop which makes it an
advantage against the thin film mercury electrode. The figure 3.5 illustrated a schematic
diagram of mercury dropping working electrode.
CAPILLARY
HANGING
DROPPING
MERCURY

- 16 -
Figure 3.5 Multi-Mode Mercury Working Electrode
The most classical technique of polarography was know as direct current polarography
(DCP) which the current that flow through the working electrode is measure in
corresponding to a linear voltage alteration, in which the chemical reaction (oxidation or
Reduction) is occur at the working electrode. On closer observation the current that flow
through the working electrode can be divided into faradaic current (If) and capacitive
current (Ic). The Capacitive current is basically occur due to the charging and discharging
or the electrochemical double layer on the surface of the working electrode. In most
polarographic analysis the Faradaic current is the measuring signal that we want, and the
capacitive current is the unwanted component due to it interferences to the faradaic
current, therefore the ratio of (If) to (Ic) is important as it give a sensitivity measure of the
Nitrogen inlet
Mercury Reservoir
Valve
Capillary

- 17 -
polarographic. Many technique had been introduced in order to maximize the ratio so that
the faradaic current is maximize while capacitive current is reduce as low as possible,
some of the technique that been developed in polarography included sampled Direct
Current Polarography (DCP) and Pulse method which emphasized on reducing the
capacitive current, and Stripping Voltammetry method which attempt to increase the
faradaic current in order to increase the (If) to (Ic) ratio. All this technique used apply to
different mode of working electrode this is DME, SMDE, and HMDE. In this dissertation,
only the principle of Stripping Voltammetry is highlighted due to this technique is used
for the analysis of nickel, cadmium, lead and zinc.
3.2.2 STRIPPING VOLTAMMETRY
Stripping voltammetry techniques are the most efficient electrochemical
technique for trace metal analysis. In comparison to the conventional direct current
polarography, the stripping voltammetry technique is highly sensitive by a factor of 103 to
105. This technique can have a detection limit of between 10
-9 to 10
-11 mol/L.
Stripping Voltammetry is a technique in polarography which utilized the hanging
mercury dropping electrode (HMDE) mode for analysis. The principle of stripping
voltammetry is basically can be divided into two steps. The first step is know as
deposition step in which a constant deposition potential is apply to the working electrode
and can be controlled by a time factor, as a result of the constant potential the analyte to
be analyze will be electrolytically deposited to the Hanging mercury working electrode

- 18 -
either as amalgam, or sparing soluble mercury compound or adsorptive as a complex
compound. On the second step is know as stripping step in which a potential sweep is
apply either cathodically or anodically which resulting in the reduction or oxidation
process at the working electrode, as a result of this the analyte will strip out from the
working electrode as anion or cation into the electrolyte and a diffusion current is
produce which flow through the working electrode. There is 3 common type of Stripping
Voltammetry technique namely Anodic Stripping Voltammetry (ASV), Cathodic
Stripping Voltammetry (CSV) and Adsorptive Stripping Method (AdSV). In some cases
often term such as DPASV or SWASV is used which it indicated the mode of potential is
used. The potential mode that apply in the stripping step are usually of differential pulse
(DP) or square wave (SW), instead of linear potential sweep
The main different among the 3 technique is in term of it deposition and stripping
characteristic. In Anodic Stripping Voltammetry, the metal or element that analyze must
be able to form amalgam with the mercury at the working electrode for example metal
such as Zinc, Cadmium, Lead, Chromium, Copper can be analyze with the ASV
technique. In the first step, during deposition potential often a very negatively potential is
applied for example such as at -1.5v. At this potential the metal of interest will undergo
cathodic reduction to form amalgam with the mercury (Me0Hg). At this step, the
deposition will occurs under control stirring and at an optimum deposition time in order
to ensure the metal is deposited to the working electrode. The deposition time play an
important role for the optimization of the analysis for example at a low concentration of
metal (ppb) the deposition time had to be increase to ensures sufficient amount of metal
- 19 -
is deposited to the working electrode. In the second step, a potential sweep (differential
pulse) is applied to the working electrode at a more positively potential direction such as
from -1.2v to -0.1 V. At this step, the metal will undergo oxidization (anodic) from the
amalgam to form free ion again (Men+
). At the stripping step, often the process takes
place at a non stirring condition. The Mechanism of Anodic Stripping Voltammetry
(ASV) can be summarized as below:
Deposition (cathodic)
Men+
+ Hg + ne- ==============� Amalgam(Me
0Hg)
=============
Stripping (anodic)
In the analysis of Cadmium, Zinc and Lead in the edible oil sample, the anodic
stripping voltammetry technique will be used. Lead and Cadmium will be analyzed in
one voltammogram scan, however due to Zinc often give a very sharp and large peak, the
zinc is analyse separately from cadmium and lead. Lead will strip at a potential of – 0.40v
and cadmium at – 0.60v therefore a deposition potential of -0.800v will be apply to the
working electrode, the deposition time will be varied depend on the concentration of the
metal in the sample. For the cases of Zinc, a separate scan will be perform and by using
the same sample solution, as the Voltammetry is a non destructive technique. Zinc
stripped at a potential of approximate -1.00v and therefore the deposition potential is set
at -1.20v. For both cases, the acetate buffer will be used as the electrolyte or supporting
solution. The function of the acetate buffer is important to adjust the pH of the solution in
order for the particular electrode reaction of the metal to occur. The diffrential pulse (DP)
is choose as the voltage modulation mode during the stripping or determination step.

- 20 -
In Cathodic Stripping Voltammetry (CSV), the technique only can be applied
provided that the analyte or metal in the sample can form a sparing soluble metal with
mercury salt. The cathodic stripping voltammetry is very similar to anodic stripping
voltammetry, in such a way that the process is the reverse mechanism of anodic stripping
voltammetry. It also consists of two step, during the deposition step the analyte or metal
which usually an inorganic or sometimes can be a organic anion will be anodically
deposited to the mercury working electrode as a sparing soluble mercury (I) salt (Hg2Mn).
In order to deposited, the mercury of the working electrode need to be oxidized usually a
more slighty negative potential is apply, in most of the case the deposition potential is set
at the range of -0.2v to +0.4v (against Ag-AgCl / 3 M KCl Reference electrode). The
deposition potential setting is very much depend on the electrolyte used this is because at
different electrolyte the mercury oxidized at a different potential. On the second step
which is the stripping step a cathodic potential is apply to reduce the mercury (I) salt
(Hg22+
) back to mercury metal (Hg0). Halides, Pseudohalides, Oxometallates, and organic
anions can be analyzed by this methods, however as in each cases the determination
process is based on the reduction of the mercury ion (Hg22+
) therefore only a same
potential peak will be observed. The mechanism of Cathodic Stripping Voltammetry
(CSV) can be summarized as follow:
Deposition step:
Anodic (Oxidation)
2 Hg -----------------------� Hg22+
Hg22+
+ nM- -----------------------� Hg2Mn

- 21 -
Determination Step (Stripping)
Cathodic (Reduction)
Hg2Mn ---------------------� 2Hg + nM-
One of the applications of Cathodic Stripping Voltammetry is the analysis of
Arsenic; other application to organic anion included as well Mercaptan, Thiols, cysteine,
Thiourea, Thioamine and many more. In Some cases Cathodic Stripping Voltammetry
analysis can be used to determine several elements by adding some solution partner into
the sample solution which function as an intermetallic compound, one of the applications
is the analysis of arsenic, tellurium and selenium by using Copper (II) as the intermetallic
compound.
In Adsorptive Stripping Voltammetry, the deposition of this method is indirect
and does not involve the formation of amalgam; in fact the accumulation is done by
adsorptive to the mercury of the working electrode. This method is an added advantages
to stripping voltammetry due to the fact that many metal such as nickel, Iron, Aluminium,
Cobalt, Titanium, uranium, platinum, tungsten, molybdenum, and many more does not
form amalgam easily with mercury and also due to that many of the reaction is
irreversible. Adsorptive striping voltammetry utilized a complexing agent or ligand
which can form complex with the analyte of interest; the complexes are usually
accumulated to the mercury by adsorptive process instead of a charge transfer process. As
similar to ASV and CSV, the first step of Adsorptive Stripping Voltammetry involve the
deposition of the complexing agent, but however the deposition step can be different in

- 22 -
mechanism and it is depend on the properties of the complexing agent used. One of the
simplest mechanisms is the formation of complexes between the analyte of interest and
the complexing agent, which only then follow by adsorption when a cathodic potential is
apply, the mechanism is summarized as below:
Complex formation
Mn+
+ nL ( complexing agent) ------� MLn+
(dissolved)
Adsorption
MLn+
(dissolved) ----� MLn+
(adsorbed)
Second deposition mechanism is based on adsorption of the complexing agent to the
mercury, which is then followed by complexation with the analyte of interest. The
mechanism can be summarized as below:
Adsorption
nL (complexing agent) ------� nL (adsorbed)
Complex formation
Mn+
+ nL (adsorbed) ------� MLn+
(adsorbed)
The magnitude of deposition potential is very depend on the physical properties of the
complexing agent or ligand used. In general a neutral molecules (complexing agent) tend
to adsorb to mercury at zero potential, this where the electrode charge is small and the
electric field in the double layer (Helmholtz layer) is weak, in the case of anion molecule

- 23 -
which included those that have aromatic ring are generally adsorbed in the region of
positive potential, and lastly the cation molecule which adsorbed in the negative region.
Therefore, the accumulation potential is very much depend on the type of complexing
agent used. The second step of the AdSV is the stripping of the complexing agent, which
give a characteristic current peak in the current-voltage plot. The stripping potential apply
is as well depend on the deposition potential of the complex-analyte adsorption.
The table 3.6 listed some of the common complexing agent or ligand that often used in
Adsorptive Stripping Voltammetry.
Complexing agent or Ligand Application (Element)
1,2 Dihydroxybenzene Uranium, Copper, Iron, Vanadium,
Germanium, Tin, Arsenic, Antimony
2,3-Butandione Dioxime (DMG) Cobalt, Nickel, Palladium
8-Hydroxyquinoline Copper, Cadmium, Lead, Uranium
N-Nitroso-N-Phenylhydroxylamine Uranium, Molybdenum, Thallium
0-Cresol phthalexone Cerium, Lanthanum, Praseodymium
Solochrome Violet RS Aluminium, Iron, Galium, Magnesium,
alkali and alkaline earth metal
Table 3.6 List of complexing agent or Ligand used in Adsorptive Stripping
Voltammetry (AdSV)
One of the advantage of adsorptive Stripping voltammetry (AdSV) technique is in term
of it detection limit, the AdSV can reach a determination limit in the ultra trace range to
approximate 10-10
Mol/L, beside that the AdSV technique can be used as well for
determination of surface active organic molecule with electro chemically active
functional group.

- 24 -
The Analysis of nickel in Edible oil sample is performed by using the Adsorptive
Stripping Voltammetry, the determination is done by using 2-3 Butanedione dioxime or
also know as dimethylglyoxime as the complexing agent. The analysis is first initiate by
formation of complexes (DMG-NI) in an alkaline pH condition usually ammonia buffer
is used. A deposition potential of -0.7 is apply and under stirring condition the complex
DMG-Ni is adsorbed to the hanging mercury surface. The determination step is
performed by applying a differential pulse voltage sweep to cathodic range, this is from -
0.7v to -1.15v, and the DMG-Ni will be desorbed from the surface and a peak current at
potential -1.0 V will be observed. The concentration of Ni in the sample can be
determined by using the standard addition technique. The figure 3.7 shows the structure
of Bis-(dimethylglyoxime) Nickel (II) complexes.
Figure 3.7 Chemical structure of Bis-(Dimethylglyoxime) Nickel (II)

- 25 -
4.0 REVIEW OF LITERATURE
In General various analytical and sample preparation methods had been propose for the
analysis of metal in edible oil. Most of the analytical methods used are multi-metal
analyses that can perform in a single run. The most frequent used technique is by
Inductively Couple Plasma (ICP) either of Mass Spectrometry (MS) or Atomic Emission
Spectroscopy (AES), other method also had been reported included Graphite furnace
Atomic Absorption Spectrometric (GFAAS), and as well the Atomic Absorption
Spectroscopy (AAS).
Although many analytical instrument techniques can be used in the analysis,
however sample preparation is still an important procedure since the sample are edible oil
which usually content high amount of carbon or organic. The amount of carbon content
in edible oil are in the range of 70 to 80 % (Pier Luigi, Loretta, and jawahar, 2002) which
required a proper and complete sample digestion or dissolution in order to de-
mineralised or to obtain a free ionic species. Many preparation techniques had been used
for the sample preparation in edible oil, the most commonly used are by microwave
digestion, other technique included extraction by reflux especially for edible oil such as
margarine, UV photolysis digestion, solvent extraction, dialysis and emulsified extraction.
The table on next page listed some example of carbon content in various food types.

- 26 -
No Food Carbon Content
1 Vegetable Oil 70-80%
2 Vegetable Fats 70-80%
3 Wheat 45%
4 Starches 40-50%
5 Fruit 40%
6 Fish 52%
7 Egg 50%
8 Sugar 42%
Table 4.1 Carbon content (%) in various food types
From the table, vegetable oil and fats contain the highest amount of carbon in compare to
other food, this is important because the information is vital especially in sample
preparation, especially in determine the required amount of sample, reagent and the
experiment condition.
Several methods had been developed for the analysis of metal in edible oil, one of
the works was developed by Y.Sahan, Basoglu and Gucer whereby the research interest
was only focus on olive oil that using microwave digestion and Inductively Couple
Plasma Mass spectrometry. The olive oil sample was prepared with microwave digester
and heated in the followed program (table 4.2) with 0.5g sample, 5ml of 65% HNO3 and
1 ml of 30% Hydrogen peroxide microwave digester.

- 27 -
Power (watt) Ramp (min) Hold Fan
250 0.00 01.00 1
400 05.00 10.00 1
600 05.00 30.00 2
0 20.00 2
Table 4.2 microwave digestion heating program for Edible Oil
The digested olive oil sample was analyzed with Inductively Couple Plasma Mass
Spectrometry (ICP-MS) method with radio frequency setting at 10MHz and sample flow
at 1.8ml/min. The average result obtained for the following metal Zinc, Cadmium, Nickel
and Lead in olive oil particular green olive oil and Black Olive oil was summarized in the
table below:
METAL BLACK OLIVE OIL
Mg/Kg
GREEN OLIVE OIL
mg/Kg
Zinc (Zn) 8.50 +/- 1.74 10.58 +/- 2.01
Cadmium (Cd) 0.11 +/- 0.01 0.12 +/- 0.04
Nickel (Ni) 0.30 +/- 0.06 0.37 +/- 0.06
Lead (Pb) 0.71 +/- 0.07 0.75 +/- 0.12
Table 4.3 Determination of Zinc, Cadmium, Nickel and Lead in Olive Oil with
ICP-MS
From this work (Y.Sahan, Basoglu and Gucer 2007), Zinc are found to be highest
concentration in the range of 8.00 mg/Kg to 11.00 mg/Kg, this is because zinc is a source
of micronutrient which required by most plant in comparison to other metal (Cd, Ni and

- 28 -
Pb) which are considered as toxic. The concentration of the Cadmium, Nickel and Lead
was reported at concentration of less than 1ppm.
A similar work was described by I.J Cindric, Michael Zeiner and steffan, whereby
Graphite Furnace Atomic Absorption Spectroscopy (GFAAS) and Inductively Couple
Plasma Atomic Emission Spectroscopy (ICP-AES) was used to analyze Aluminium (Al),
Cobalt (Co), Copper (Cu) Nickel (Ni), Lead (Pb), Zinc (Zn), Iron (Fe), and Magnesium
(Mg) in range of edible oil sample included pumpkin oil, olive oil, sunflower oil, soya oil
and rice oil. The sample (0.5g) was prepared by microwave digestion as well. Table 2.6
below summarized the analysis work of Lead, Nickel and Zinc in the edible oil by I.J
Cindric and Etc, 2007. The results reported are based on average result of 3 to 5 oil for
each sample.
Sample Nickel
mg/Kg
Zinc
Mg/Kg
Lead
Mg/Kg
Olive Oil 1.60 3.40 <0.001
Pumpkin Seed 6.10 13.50 <0.001
Sunflower Oil 0.10 3.20 <0.001
Soyabean Oil 0.23 4.30 <0.001
Rice Oil 0.08 2.90 <0.001
Table 4.4 Determination of Nickel, Zinc and Lead in Edible Oil by GFAAS and
ICP-AES
The analysis result describe by I.J cindric and etc, show that the concentration of
zinc are the highest in comparison to other metal in the range of 3.0 mg/Kg to 13.0
mg/Kg which is in adjacent to that of report by Y.Sahan and etc. The nickels are found to

- 29 -
be the highest concentration in the Pumpkin seed oil and Olive oil, whereas compare to
other sample are in the range of below 1ppm. The Lead is detected at concentration of
less than 0.001 mg/Kg.
Inductively Couple Plasma (ICP) technique had an advantaged of multiple metal
analysis and as well better detection limit. However Atomic Absorption (AAS) method is
sometimes preferable by laboratory due to it low operation cost. In contrast to ICP
method, analysis of metal in edible oil by AAS was worked by D.Mendal, M.Tuzen,
M.Soylak, and Uluozlu. The Edible Oil sample was prepared by microwave digestion
with 65% nitric acid and Hydrogen Peroxide. The following metal Copper, Zinc, Iron,
and cobalt was analyze with AAS, while Cadmium and lead was analyzer with GFAAS.
Table 4.5 showed the analysis result of the metal in edible oil namely Olive Oil,
Sunflower oil, Hazelnut Oil, and Margarine Oil
Sample Zinc (mg/Kg) Cadmium (ug/kg) Lead ( mg/Kg)
Olive Oil 1.03 +/- 0.1 0.15 +/- 0.02 0.03 +/- 0.003
Hazelnut Oil 1.15 +/- 0.1 4.57 +/- 0.4 0.01 +/- 0.01
Sunflower Oil 1.10 +/- 0.1 3.76 +/- 0.4 0.01 +/- 0.01
Margarine 2.71 +/- 0.2 3.66 +/- 0.3 0.01 +/- 0.01
Table 4.5 Determination of Zinc, Cadmium and Lead in Edible Oil by Atomic
Absorption Spectrometry (AAS)
The Atomic Absorption Spectrometry analysis in edible oil by D.mendel and etc
illustrate that the cadmium and lead are found to be present at part per billion (ppb) levels
only, which is expected to be low since both metal are known to be toxic. Although the

- 30 -
cadmium and lead was analyze with GFAAS which is only single element analysis,
however it show a comparable detection limit to Inductively Couple Plasma (ICP). On
other hand, Zinc is detected in the range of 1.0 mg/Kg to 3.0 mg/Kg. In another work by
Mariela N. Matos Reyes and Reinaldo C.Campos, (2006) an analysis of nickel and
copper by GFAAS was perform on edible oil mainly focus on Soybean Oil and Corn Oil,
the average result was summarized as below in table 4.6.
Sample Nickel mg/Kg Copper mg/Kg
Soybean Oil 3.62 3.16
Corn Oil 4.19 3.07
Table 4.6 Determination of nickel and copper in edible oil by GFAAS
The nickel concentration reported was higher in comparison to the result reported
by other literature (result table 4.3 and 4.4). This is reported at the range of 3.5 mg/Kg to
4.19 mg/Kg. The work described by Mariela N.Matis Reyes and et al only limited to
nickel, as the sample are direct analyze by Graphite Furnace Atomic Absorption
Spectroscopy (GFAAS) without sample pretreatment. Although the GFAAS technique is
direct and can prevent loses due to sample pretreatment such as digestion, nevertheless
the GFAAS method are not optimize for analysis of wide range of metal in edible oil
analysis due to the problem of non-specific absorption as a consequence of edible oil
sample matrixes (I.Karadjova, G.Zachariadis, G. Boskuo and J.Stratis, 1998).
The overall analysis of metal by ICP and AAS technique show a regularity result
when microwave digestion technique was employed as the sample preparation method.

- 31 -
However, similar work was also reported but with different sample preparation technique
particularly by extraction method instead of microwave digestion. Although microwave
technique is fast and reliable, nevertheless the microwave digesters are costly and maybe
not affordable by some laboratory, in contrast to extraction technique which is more
easily set up and at lower cost.
One of the works that employ the extraction procedure in edible oil sample
pretreatment for metal analysis was describe by Erol Pehlivan, Gulsin Arslan, F.Gode,
and et al (2008), whereby the edible oil sample was extracted with 10% dilute nitric acid
shaken at water bath (50 C) for 2 hours, then follow by centrifugation at 2800 rpm. The
acid aqueous layer was then removed and dilute in 25ml volumetric flask. The prepared
sample was analyzed with Inductively Couple Plasma Atomic Emission Spectroscopy
(ICP-AES) for the following metal Copper, Iron, Lead, Zinc, Cadmium, Chromium,
Cobalt, Manganese and Nickel. Table 4.7 summarized the average analysis result of the
metal in various type of edible oil sample.
Sample Zinc
mg/Kg
Cadmium
Mg/Kg
Lead
mg/Kg
Nickel
mg/Kg
Olive Oil 0.0512 0.0021 0.0017 0.0018
Sunflower Oil 0.0319 0.0017 0.0013 0.0032
Corn Oil 0.0294 0.0009 0.0000 0.0062
Almond Oil 0.2870 0.0003 0.0000 0.0254
Hazelnut Oil 0.0185 0.0012 0.0000 0.0072
Soybean Oil 0.0348 0.0013 0.0000 0.0027
Table 4.7 Determination of Zinc, Cadmium, Lead and Nickel in Edible Oil by
sample extraction and with ICP-AES

- 32 -
From the result, sample that prepare by extraction method showed a considerable lower
concentration of zinc and nickel in the edible oil, in comparison to sample that prepare by
microwave digestion. The overall concentration of the Zinc, Cadmium, Lead and Nickel
is less than 100 part per billion (ppb) except for Zinc in almond oil sample which is about
0.2870 mg/Kg.
In a similar case, described by Giacomo Dugo, Lara la pera, G.L La Torre
and D. Giuffrida (2004) the same extraction approach is used to prepared the edible oil
sample, electrochemistry technique know as Derivative potentiometric Striping analysis
(DPSA) is employ. The extraction procedure is perform with 2ml of 35% hydrogen
peroxide and 10ml of 36% hydrochloric acid. The extraction process is perform by using
magnetic stirrer for about 30 minute at temperature of 90 degree Celsius, then follow by
centrifugation the aqueous layer is diluted at volumetric flask, and the organic layer is
further extract. The prepared edible oil sample was analyzes using DPSA technique for
Cadmium, Copper, Zinc and lead. The table 4.8 summarized the average concentration of
the metal in edible oil by DPSA method. The result describe by Giacomo Dugo and Etc
show that the concentration of the zinc, cadmium and lead are in the range of less than
100 ppb except for some edible oil sample which show a slightly higher concentration of
Zinc.

- 33 -
Sample Zinc
(ug/Kg)
Cadmium
ug/Kg)
Lead
ug/Kg)
Sunflower Oil 232.76 1.72 9.98
Maize Oil 51.54 4.92 8.32
Peanuts Oil 396.1 2.69 10.00
Rice Oil 192.4 1.27 8.60
Soy Oil 37.76 3.75 25.48
Table 4.8 Determination of Zinc, Cadmium and Lead in Edible Oil by Derivative
Potentiometric Stripping Analysis (DPSA).

- 34 -
5.0 METHODOLOGY
The method used in this analysis can be divided into 2 parts which is the sample
preparation part and sample analysis part. As described above, the sample contain a high
organic matrixes which must be digested before sample analysis, a microwave digester
will be used for the sample preparation. The digested sample is kept in sample bottle and
labeled before analyze in the lab by voltammetry method.
5.1 APPARATUS AND INSTRUMENT
a) PRECISA Analytical Balance (0.001g)
b) CEM Microwave Digester, MARS XPRESS
The following accessories was used –
i) 8 Sample Vessel Carousel
ii) Polyflouroacetate (PFA) Sample Vessel
c) METROHM 797 VA (VOLTAMMETRY) COMPUTRACE
The system equipped with 3 electrodes –
i) Metrohm multimode Mercury Dropping Electrode for DME, SMDE
and HMDE mode.
ii) Platinum Auxillary electrode
iii) Silver-Silver Chloride Reference Electrode
- 35 -
d) Milipore Ultrapure Water (UPW) System
e) Micropipette 10-100ul
f) Micropipette 100-1000ul
g) Volumetric Flask 10ml
h) Volumetric Flask 100ml
i) Volumetric Flask 250ml
j) Volumetric Flask 50ml
k) Beaker 100ml
l) Volumetric Pipette 10ml
m) Measuring Cylinder 100ml
n) Measuring Cylinder 10ml
o) Wash Bottle
- 36 -
p) Glass Funnel
q) Sample bottle 50ml with PTFE Cap
r) Whiteman 0.45um Filter Paper
5.2 CHEMICAL
The chemical that used for microwave digestion and voltammetry were listed as below:
a) Hydrogen Peroxide 30%, H2O2
b) Concentrated Nitric Acid 70%, HNO3
c) Ultrapure Water (18MOhm)
d) Potassium Chloride, KCl
e) Glacial Acetic Acid 99.0%, CH3COOH

- 37 -
f) Sodium Hydroxide 30%, NaOH
- 30 g of NaOH pellet is weighed with analytical balance and transfer into a
100ml beaker. By using a measuring cyclinder, 100ml of ultrapure water was
measured and transfer into the beaker. The Solution was stirred until all the pellet
was complete dissolved.
g) Ammonium 25%, NH4
h) Hydrochloric Acid 37%, HCl
i) DimethylGlyoxime
j) Ethanol 95%, CH3CH2OH
k) Lead 1000ppm Standard, Pb (Metrohm)
l) Zinc 1000ppm Standard, Pb (Merck)
m) Nickel 1000ppm Standard, Pb (Merck)
n) Cadmium 1000ppm Standard, Cd (Merck)
o) 3M Potassium Chloride, KCL Electrolyte For Reference Electrode (METROHM)

- 38 -
p) Mercury (Fluke), for Working Electrode
q) Nitrogen Gas 99.999% purity, N2
5.2.1 PREPARATION FOR POTASSIUM CHLORIDE ACETATE
BUFFER (KCl-ACT)
1) 28.00g of Potassium Chloride powder was measure with Analytical Balance
and transferred into a beaker. By using measuring cylinder 100ml of ultrapure
water was measured and transfer into the beaker. The solution was stirred
until the potassium chloride was completely dissolved.
2) The Dissolved potassium chloride solution was transferred into a 250ml
volumetric flask.
3) 12.50ml of 30% Sodium Hydroxide and 7.1ml of Glacial Acetic Acid was
measured and transferred into the 250ml volumetric flask. The solution was
top up to 250ml with ultrapure water and shake to mix the solution.
5.2.2 PREPARATION OF AMMONIA CHLORIDE (NH4Cl) BUFFER
1) A 250ml Volumetric Flask was quarterly filled with ultrapure water. 11.04ml
of Concentrated Hydrochloric Acid was carefully measured and transfer into
the volumetric flask.

- 39 -
2) By using a measuring cylinder 56.25ml of Ammonia 25% was measured and
transferred carefully into the 500ml volumetric flask under fume cupboard.
3) The Solution was top up to 250ml with ultrapure water, and shake well to mix
the solution.
5.2.3 PREPARATION OF DIMETHLYGLOYXIME (DMG) IN
ETHANOL
1) 1.17g of DMG was weighed using analytical balance and dissolved in Ethanol.
The solution was stirred slowly until all the powder is dissolved.
2) The solution was then fill up to 100ml with ultrapure water
5.3 SAMPLING AND SAMPLE PREPARATION OF EDIBLE OIL
SAMPLE
As a common analysis procedure, prior to sample digestion the sample was first labeled
in details for each sampling bottle, as well the carousel position and the PFA Sample
vessel. Most of the samples used are from commercial ready to used product that
available in Malaysia.
5.3.1 SAMPLING OF EDIBLE OIL
Two type of edible oil product was selected for these analyses, which are the Cooking Oil
and the Margarine sample. Since for both product, various source of edible oil had been

- 40 -
used to produce the product, therefore only four type of edible oil source will be focused
which are the Sunflower Oil, Palm Oil, Corn Oil and Olive Oil. For the cases of olive oil,
margarine sample are only available as a mix product as a result of this, only the cooking
oil will be selected for the analysis. The table 5.1 summarized the types and source of
edible oil that had been purchase from commercial available product for the analysis.
The physical properties of Margarine and cooking oil are different in term of it
morphological as well it melting temperature. For the cooking oil sample basically less
sampling and preparation is required as the sample are present as a liquid form which the
chemical composition are more homogenized and are in ready to used form. Whereas in
the cases of margarine sample, the sample was present as a solid phase therefore
sampling and sample preparation is an important step.
No Type of Products Edible Oil Source
1 Cooking Oil Palm Oil
2 Cooking Oil Extra Virgin Olive Oil
3 Cooking Oil Corn Oil
4 Cooking Oil Sunflower Oil
5 Margarine Palm Oil
6 Margarine (Baking) Palm Oil
7 Margarine Corn Oil
Table 5.1 Type of product and Edible Oil source used for analysis

- 41 -
5.3.1.1 SAMPLING OF MARGARINE SAMPLE
1) By using a Spatula, the margarine sample was divided into 4 sections, in each
section the sample was sampled from top, medium and based from the sample
pack.
2) Each portion of the sample was transferred into a beaker. A water bath was
prepared at temperature of approximately 60 degree Celsius, and the beaker
contained sample was immersed to melt the solid sample into liquid form.
3) The sample was weighed and transferred into the PFA sample vessel (describe
in section 5.3.2)
5.3.1.2. SAMPLING OF COOKING OIL SAMPLE
1) The oil sample was shake well in the bottle, by using a graduated pipette the
sample is weighed accurately into the PFA sample vessel (Describe in Section
5.3.2)
5.3.2 SAMPLE DIGESTION BY MICROWAVE DIGESTER
1) 1.5-2.0 g sample was accurately weight using an analytical balance into the
PFA Sample vessel, by using a clean graduated pipette.

- 42 -
2) 5ml of concentrated Nitric Acid 70% was measured with a volumetric pipette
and transfer into the sample vessel carefully.
3) 2ml of hydrogen peroxide 30% was measure with a volumetric pipette and
transfer into the sample vessel carefully.
4) The PFA sample vessel was closed with a plug and a vent cover, and the
vessel was tighten with hand. The vessel was then placed into the sleeved
before arranged it in the sample carousel.
5) A blank sample (method blank) was prepared as well following step 1 -4
without any sample added only contain Nitric acid and Hydrogen Peroxide.
6) All the PFA sample vessel is labeled, the sample weigh and sample
information (sample name) was recorded.
7) The carousel was installed into the microwave digester chamber; the
programmed which had been set early was recall and loaded into the system,
and the digestion process is start. The table 5.2 below summarized the
Microwave digestion time programming.

- 43 -
Microwave digester Parameter Setting
Power (Watt) 800watt
Percentage power (%) 75%
Ramp Time (min) 15.00 min
Hold time (min) 10.00 min
Final temperature 200 degree Celsius
Table 5.2 Microwave Digester parameter setting for edible oil sample digestion
8) Once the digestion was completed, the sample vessel cap was release slowly
to allow the acid fume vapor pressure to escaped from the vessel, the sample
was then filtered through a 0.45um filter paper and transfer into a 25ml
Volumetric Flask via a glass funnel.
9) The volumetric flask was top up to 25ml with ultrapure water, and shake well
before transferred into labeled sample bottle.
5.4 PREPARATION OF CALIBRATION STANDARD
Freshly prepared calibration standard was used for through out the analysis procedure.
The Cadmium and Lead standard was prepared as a mix standard, whereas for the Zinc
and Nickel the standard was prepared individually from the cadmium and lead.

- 44 -
5.4.1 PREPARATION OF 1.00 PPM MIXES CADMIUM AND LEAD
STANDARD
1) A 100ml volumetric flask was half filled with ultrapure water.
2) By using a Micropipette, 1000ul of cadmium and Lead stock standard
(1.0g/L) was pipette and transfer into the 100ml volumetric flask.
3) 0.18ml of 30% nitric acid was pipette and transfer into the volumetric flask
and top up to 100ml with ultrapure water. The solution standard shall contain
0.014mol/L of nitric acid.
5.4.2 PREPARATION OF 1.00 PPM ZINC STANDARDS
1) A 100ml volumetric flask was half filled with ultrapure water.
2) By using a Micropipette, 1000ul of Zinc stock standard (1.0 g/L) was pipette
and transfer into the 100ml volumetric flask.
3) 0.18ml of 30% nitric acid was pipette and transfer into the volumetric flask
and top up to 100ml with ultrapure water. The solution standard shall contain
0.014mol/L of nitric acid

- 45 -
5.4.3 PREPARATION OF 1.00 PPM NICKEL STANDARDS
4) A 100ml volumetric flask was half filled with ultrapure water.
5) By using a Micropipette, 1000ul of Nickel stock standard (1.0 g/L) was
pipette and transfer into the 100ml volumetric flask.
6) 0.18ml of 30% nitric acid was pipette and transfer into the volumetric flask
and top up to 100ml with ultrapure water. The solution standard shall contain
0.014mol/L of nitric acid
5.5 PREPARATION OF SPIKE SAMPLE WITH NICKEL, ZINC,
LEAD AND CADMIUM STANDARD.
3 samples were spiked with the following metal Nickel, Zinc, Lead and Cadmium. Since
the samples are present in a small quantity (25ml) therefore a 10ml volumetric flask was
used.
1) A 10ppm Mix Standard of Zinc, Cadmium, Lead and Nickel was prepared by
pipette 1.0ml of each 1000ppm standard into a 100ml Volumetric flask, and
then top up to 100ml with ultrapure water
2) A 10ml Volumetric Flask was half filled with Sample (after digested sample)
from step 5.3.2.

- 46 -
3) By using a micropipette, 100ul of 10ppm mix standard (prepared in step 1)
was transferred into volumetric flask, and the solution was top up to 10ml
with sample.
4) Step 1 to 3 was repeated for the other 2 sample.
5.6 PREPARATION OF VOLTAMMETRY INSTRUMENT
5.6.1 CALIBRATION OF VOLTAMMETRY INSTRUMENT WITH
DUMMY CELL
As suggested by Metrohm procedure, the instrument system was checked with an
electronic dummy cell to ensure the system is function as accordingly to the specification.
1) The connector cable of the 3 electrode system (working electrode, Auxiliary
Electrode and Reference Electrode) was dismantle and connect to an
electronic dummy cell as accordingly to the label.
2) From the Voltammetry software, the dummy cell method was loaded and the
start button was click to execute the analysis
3) A Curve of Current against Voltage will be plot, and the result was recorded.

- 47 -
5.6.2 ELECTRODE CHECK
5.6.2.1 Reference Electrode
1) The outer filling electrolyte of the Ag/AgCl Reference electrode was removed
from the electrode.
2) A fresh Potassium Chloride 3Mol/L Solution was filled into the outer
compartment of the electrode.
5.6.2.2 Working Electrode
1) From the Voltammetry instrument software the manual control was click, the
Hanging mercury dropping (HMDE) mode was selected, and a new drop
button is click to allow mercury to drop and hang on the working electrode.
2) Step 1 was proceed few time, and the formation of hanging mercury was
observed to ensure fresh mercury with constant size is form on the working
electrode with every times the new drop button is click.
- 48 -
5.7 ANALYSIS OF ZINC, LEAD AND CADMIUM IN SAMPLE
WITH ANODIC STRIPPING VOLTAMMETRY
1) The voltammetry glass vessel was cleaned with ultrapure water for few times.
2) 10ml ultrapure water was accurately pipette and transfer into the glass vessel.
3) 0.25ml of KCL-Acetate Buffer was accurately added into the glass vessel by
using a micropipette.
4) 0.1ml of sample is accurately added into the sample vessel by using
micropipette. The total Volume of the solution was 10.350ml.
5) The vessel is mounted into the voltammetry stand, and the electrode is
lowered down into the sample until the lid was fully covered the vessel to
ensure the vessel is air tight.
6) The Electrode was checked to ensure it is immersed in the sample, and no air
bubble was formed in the solution.
7) From the voltammetry software the operating condition was set as following:

- 49 -
No Parameter Setting
1 Analysis Mode Anodic Stripping Voltammetry
2 Mode Differential Pulse
3 Working Electrode Mode HMDE
4 Deposition Potential - 1.1 V
5 Deposition time 30 s
6 Start Potential Sweep - 0.9 V
7 End Potential Sweep - 0.3 V
8 Sweep Rate 0.02 V/s
9 Pulse Amplitude 0.05 V
10 Pulse time 0.04 s
11 Purge Time 300 s
12 Stiring 2000 rpm
Table 5.3 Operation Condition for Cadmium and Lead analysis by Anodic
Stripping Voltammetry.
8) Once the operation condition is saved, the analysis was started. The deposition
time condition was subjected to change due to different analyte concentration.
9) Standard addition technique was performed with 0.100 ml of 1.00ppm mix
Cadmium and lead standard was added into the vessel, upon requested by the
voltammetry. 3 times standard addition was performed in each analysis.
10) Once the analysis is completed, the result was recorded.
11) The analysis was continuing with Zinc determination, the following operation
condition was set as followed.

- 50 -
No Parameter Setting
1 Analysis Mode Anodic Stripping Voltammetry
2 Mode Differential Pulse
3 Working Electrode Mode HMDE
4 Deposition Potential - 1.5 V
5 Deposition time 10 s
6 Start Potential Sweep - 1.5 V
7 End Potential Sweep - 0.8 V
8 Sweep Rate 0.02 V/s
9 Pulse Amplitude 0.05 V
10 Pulse time 0.04 s
11 Purge Time 20 s
12 Stiring 1000 rpm
Table 5.4 Operation Condition for Zinc analysis by Anodic Strippping Voltammetry
12) Once the operation condition was saved, the analysis started.
13) Standard addition technique was performed; 0.100 ml of 1.00ppm Zinc
standard was added into the vessel upon requested by the voltammetry. 3
times standard addition was performed in each analysis.
14) Once the analysis is completed, the result was recorded.
15) The sample was discharge into the waste bottle and the mercury droplet was
dispose into the mercury waste. The glass vessel and electrode was clean with
ultrapure water. The analysis was repeated for all samples, blank and spike
sample.

- 51 -
5.8 ANALYSIS OF NICKEL IN SAMPLE WITH ADSORPTIVE
STRIPPING VOLTAMMETRY
1) The voltammetry glass vessel was cleaned with ultrapure water for few times.
2) 10ml ultrapure water was accurately pipette and transfer into the glass vessel.
3) 1.0 ml of Ammonia Chloride Buffer was accurately added into the glass
vessel by using a micropipette.
4) 0.1ml of sample is accurately added into the sample vessel by using
micropipette.
5) 0.1ml of Dimethylglyoxime (DMG) was accurately pipette into the vessel by
micropipette. The total Volume of the solution was 11.200ml.
6) The vessel is mounted into the voltammetry stand, and the electrode is
lowered down into the sample until the lid was fully covered the vessel to ensure
the vessel is air tight.
7) The Electrode was checked to ensure it is immersed in the sample, and no air
bubble was formed in the solution.
8) From the voltammetry software the operating condition was set as following:

- 52 -
No Parameter Setting
1 Analysis Mode Adsorptive Stripping
Voltammetry
2 Mode Differential Pulse
3 Working Electrode Mode HMDE
4 Deposition Potential - 0.1 V
5 Deposition time 5 s
6 Start Potential Sweep - 0.8 V
7 End Potential Sweep - 1.15 V
8 Sweep Rate 0.015 V/s
9 Pulse Amplitude 0.05 V
10 Pulse time 0.04 s
11 Purge Time 300 s
12 Stiring 2000 rpm
Table 5.5 Operation Condition for Nickel analysis by Adsorptive Stripping
Voltammetry.
9) Once the operation condition is saved, the analysis was started. The deposition
time condition was subjected to change due to different analyte concentration.
10) Standard addition technique was performed; 0.100 ml of 1.00ppm Nickel
standard was added into the vessel upon requested by the voltammetry. 3 times
standard addition was performed in each analysis.
11) Once the analysis is completed, the result was recorded.
12) The sample was discharge into the waste bottle and the mercury droplet was
dispose into the mercury waste. The glass vessel and electrode was clean with
ultrapure water. The analysis was repeated for all samples, blank and spike
sample.

- 53 -
6.0 RESULTS AND DISCUSSION
An electronic Calibration analysis was performed on the voltammetry system prior to
sample analysis. A Dummy Cell which is an electronic circuit box that function to
stimulate the three electrode cable namely Working Electrode, Reference Electrode and
Auxillary electrode cable, the Voltammogram below show the Dummy Cell (stimulation)
result.
Test 797 VA Computrace with dummy cellDummy Cell WE-D
-0.20 -0.30 -0.40 -0.50 -0.60 -0.70 -0.80
U (V)
0
-200n
-400n
-600n
-800n
-1.00u
-1.20u
I (A
)
No.1
Figure 6.1 Voltammogram test result from 797VA computrace dummy cell
From the result, the peak current was 1.03 uA at voltage position of 0.47V, which the
theoretical should be 1.00 with tolerance of 0.05 uA (5%) and position at 0.5 V with
tolerance of +/- 0.05V. However the result was acceptable as it still within the tolerance
range.

- 54 -
A total of 7 samples from different edible oil products (off shelf) was purchase
from market and analyze. The sample that used was weighed and digested by using
microwave digestion method. 3 samples were spike with standard for recovery study and
a reagent blanks were prepared and analyze. For each of the analysis a minimum of two
Scan was performed and the voltammogram average result is taking for report. The table
below tabulated the details of blank result for Cadmium, Lead, Zinc and Nickel.
Blank Cadmium
(ug/L)
Lead (ug/L) Nickel (ug/L) Zinc (ug/L)
Blank 1 38.586 27.242 103.289 75.314
Blank 2 39.739 27.796 96.432 64.080
Average 39.163 27.519 99.861 69.697
Standard
Deviation
0.815 0.392 4.849 7.944
Table 6.2 Concentration (ug/L) of Nickel, Cadmium, Lead and Zinc in Reagent
Blank by Stripping Voltammetry
The concentration of the metal in the blank was found to be acceptable, this is because
the chemical used was analytical (AR) grade although suprapure grade is recommended
but due to unavailable therefore AR grade was used instead. The nickel in the blank was
found to contain the highest with average concentration of about 99.861ug/L. whereas for
other metal especially Cadmium and Lead are found at concentration range of below 40
ug/L. In the cases for Zinc, the average concentration was 69.697ug/L. The Limit of

- 55 -
Detection (LOD) was taken as 3 times the standard deviation of the blank, therefore the
LOD for each metal are as below:
No Metal Limit of Detection (ug/L)
1 Cadmium 39.163 + 2.445 = 41.608
2 Lead 27.519 + 1.176 = 28.695
3 Nickel 99.861 + 14.547 = 114.408
4 Zinc 69.697 + 23.832 = 93.529
Table 6.3 Limit of Detection for Cadmium, Lead, Zinc and Nickel for Edible oil
sample by Stripping Voltammetry.
In the analysis for sample the table below summarized the result for Cadmium, Lead,
Nickel and Zinc of the various edible oil products mainly are margarine, cooking oil and
oil for salad dressing.
Table 6.4 Concentration (ug/L) of Nickel, Cadmium, lead and Zinc in various edible
oil samples by Stripping Voltammetry
Sample Description Cadmium
(ug/L)
Lead (ug/L) Nickel
(ug/L)
Zinc (ug/L)
Palm oil Margarine
(Bakery)
10.160 21.967 164.607 180.195
Palm oil Margarine 145.251 70.035 103.199 422.711
Sunflower Margarine 42.374 156.246 300.222 192.074
Corn Cooking Oil 14.079 9.401 138.891 No peak
Olive Oil 443.044 601.537 242.216 286.799
Sunflower Cooking Oil 173.065 65.663 61.381 429.058
Palm Cooking Oil 58.409 46.722 216.935 375.516

- 56 -
The result obtained in the table above is the concentration of the metal in diluted sample,
therefore a calculation was performed to calculated the amount of the metal contain in per
gram of sample. Since the sample after digestion was transferred and top up to 25ml in a
volumetric flask, therefore the concentration of the metal in the sample is calculated by
the followed formula:
Concentration of Metal (Cd – Cb) ng/ml x 25 ml
in sample (ug/g) = --------------------------------
Sample saiz (g) x 1000
whereby, Cd = Concentration of metal in diluted sample (ug/L)
Cb = Concentration of Metal in Reagent Blank (ug/L)
The table below summarized the concentration of the metal in sample.
Sample Description Sample Saiz (g) Cd – Cb (ng/ml) Concentration of
Cadmium in ug/g
Palm oil Margarine
(Bakery)
1.4909 - 29.003 N.D
Palm oil Margarine 1.4971 106.088 1.772
Sunflower Margarine 1.4877 3.211 0.0540
Corn Cooking Oil 1.4366 -25.084 N.D
Olive Oil 1.5092 403.881 6.690
Sunflower Cooking
Oil
1.5108 133.902 2.216
Palm Cooking Oil 1.4925 19.246 0.322
Table 6.5 Concentration (ug/g) of Cadmium in Edible oil samples

- 57 -
Sample Description Sample Saiz (g) Cd – Cb (ng/ml) Concentration of
Lead in ug/g
Palm oil Margarine
(Bakery)
1.4909 -5.552 N.D
Palm oil Margarine 1.4971 42.516 0.710
Sunflower Margarine 1.4877 128.727 2.163
Corn Cooking Oil 1.4366 -18.118 N.D
Olive Oil 1.5092 574.018 9.509
Sunflower Cooking
Oil
1.5108 38.144 0.631
Palm Cooking Oil 1.4925 19.203 0.322
Table 6.6 Concentration (ug/g) of Lead in Edible Oil Samples
Sample Description Sample Saiz (g) Cd – Cb (ng/ml) Concentration of
Nickel in ug/g
Palm oil Margarine
(Bakery)
1.4909 64.746 1.619
Palm oil Margarine 1.4971 3.338 0.056
Sunflower Margarine 1.4877 200.361 3.367
Corn Cooking Oil 1.4366 39.030 0.679
Olive Oil 1.5092 142.355 2.358
Sunflower Cooking
Oil
1.5108 - 38.48 N.D
Palm Cooking Oil 1.4925 117.074 1.961
Table 6.7 Concentration (ug/g) of Nickel in Edible Oil Samples

- 58 -
Sample Description Sample Saiz (g) Cd – Cb (ng/ml) Concentration of
Zinc in ug/g
Palm oil Margarine
(Bakery)
1.4909 110.498 1.853
Palm oil Margarine 1.4971 353.014 5.895
Sunflower Margarine 1.4877 122.377 2.056
Corn Cooking Oil 1.4366 ND N.D
Olive Oil 1.5092 217.102 3.596
Sunflower Cooking
Oil
1.5108 359.361 5.947
Palm Cooking Oil 1.4925 305.819 5.123
Table 6.8 Concentration (ug/g) of Zinc in Edible Oil Samples
From the analysis result the Corn cooking oil (CCO) Sample does not contain any
detectable amount of Lead, Zinc and Cadmium as the concentration of the particular
metal is detect at below the blank value, therefore the concentration was reported as none
detected (N.D), however the Nickel was detected in the Corn cooking oil sample at about
0.679 ug/g. From the voltammogram of lead and cadmium in the corn cooking oil
analysis, both peaks were well separated with lead (Pb) peak position at -0.471 V and
cadmium (Cd) at -0.477 V (Figure 6.9). The Concentration are higher for blank may be
due to sample preparation is not well take care, as the sample container and digester
vessel maybe contaminated by small amount of cadmium and lead, that might present in
it since the apparatus is shared in the laboratory. Since the amount of blank is at a sub
part per billion level therefore contamination is often difficult to be avoided unless proper
cleaning of the vessel is well perform such as soaking with nitric acid solution, and

- 59 -
multiple rinsing with ultrapure water. For the cases of Zinc analysis in Corn Cooking Oil,
the Zinc Peak was not well resolved and interferes by an unknown peak at position of -
1.00 V (figure 6.9); as a result the Zinc peak was not detected and can’t be quantified.
Determination of Zn in edible OilCorn oil (Zn)
-1.40 -1.30 -1.20 -1.10 -1.00 -0.90
U (V)
20.0n
40.0n
60.0n
80.0n
I (A
)
Zinc
Figure 6.9 Voltammogram of Cadmium, Lead and Zinc in Corn Cooking Oil
Sample.
The nickel peak for Corn cooking Oil is sharp and without any interference of baseline or
other unknown peak (figure 6.10), the peak was positioned at -0.970 V.
Determination of Pb and Cd in edible OilCorn oil (Pb Cd)
-0.90 -0.80 -0.70 -0.60 -0.50 -0.40 -0.30
U (V)
10.0n
20.0n
30.0n
40.0n
I (A
)
Cadmium
Lead

- 60 -
Ni Determination in Edible OilCorn Oil (Ni)
-0.80 -0.90 -1.00 -1.10
U (V)
-50.0n
-100n
-150n
-200n
-250n
I (A
)
Nickel
Figure 6.10 Voltammogram of Nickel in Corn Cooking Oil sample.
From the analysis result, the Olive oil sample was found to contain the highest
concentration of Cadmium and Lead in comparison to other samples, with Cadmium
contain about 6.697 ug/g and Lead 9.509 ug/g (figure 6.11). As in comparison to other
sample the Lead (Pb) concentration was detected low for all samples except for Olive oil
(9.509 ug/g) and sunflower margarine (2.163 ug/g). Whereas for Cadmium, it is detected
high for Palm Oil Margarine (1.772 ug/g), Olive Oil (6.697 ug/g) and Sunflower Cooking
Oil (2.216 ug/g). The detected value is far higher than those reported in literature as most
is reported below than 1.0 ug/g. The high concentration of Lead and Cadmium in this
sample is maybe possible due to contamination of microwave digester vessel and sample
container.

- 61 -
Determination of Zn in edible OilOlive Oil Zn
-1.30 -1.20 -1.10 -1.00 -0.90 -0.80
U (V)
20.0n
40.0n
60.0n
80.0n
I (A
)Zinc
Determination of Pb and Cd in edible OilOlive oil Cd Pb
-0.90 -0.80 -0.70 -0.60 -0.50 -0.40 -0.30
U (V)
20.0n
40.0n
60.0n
80.0n
100n
I (A
)
Cadmium
Lead
Figure 6.11, Voltammogram of Zinc, Cadmium and Lead in Olive Oil
As in the cases for Nickel the concentration detected in the sample is in the range
of 0.250 to 3.500 ug/g which is inconsistent with the result that reported by the literature.
This is similarly observed for the Zinc metal, as the range detected is in between 1.000
ug/g to 6.000 ug/g for all the sample and the result is consistent with the literature which
reported at between 3.0 ug/g to 13 ug/g (Chapter 4.0).
For validation of the method, 3 spike samples were prepared and the recovery was
determined to ensure the method reliability. The three sample selected was Olive Oil,
Corn Oil, and Palm Oil Margarine (Bakery), an accurate spike of 100 ug/L of each Zinc,
Nickel, Lead and cadmium was performed in the sample. The table summarized the result
of the recovery studies.

- 62 -
Metal Sample without
spike ug/L
Sample with spike
ug/L
Recovery (%)
Cadmium (Cd) 14.079 99.935 85.856
Lead (Pb) 9.401 106.313 96.912
Nickel (Ni) 138.891 237.016 98.125
Zinc (Zn) No peak 101.450 101.450
Table 6.12 Recovery studies of spike 100 ug/L of Cadmium, Lead, Nickel and Zinc
in Corn Oil Sample.
Determination of Zn in edible OilCorn Oil spike 100ppb Zn
-1.40 -1.30 -1.20 -1.10 -1.00 -0.90 -0.80
U (V)
20.0n
40.0n
60.0n
80.0n
100n
I (A
)
Zinc
Determination of Pb and Cd in edible OilCorn Oil Spike 100ppb Cd Pb
-0.90 -0.80 -0.70 -0.60 -0.50 -0.40 -0.30
U (V)
10.0n
20.0n
30.0n
40.0n
50.0n
I (A
)
Cadmium
Lead
Figure 6.13 Voltammogram of spike Cadmium, Lead, and Zinc in Corn Oil Sample
The recovery studies of corn oil show that the Lead, Nickel and Zinc was recover at the
range of 95% to 105%, which is acceptable except for Cadmium with recovery of
85.856% which is 14.144% less than expected. From the voltammogram, it can observe

- 63 -
that the signal of cadmium, Lead and zinc peak (figure 6.13) was increase in comparison
to the un-spiked Corn Oil sample (figure 6.9).
Ni Determination in Edible OilCorn Oil Spike 100ppb Ni
-0.80 -0.90 -1.00 -1.10
U (V)
-50.0n
-100n
-150n
-200n
-250nI
(A)
Nickel
Figure 6.14 Voltammogram of spike Nickel in Corn Oil Sample
Metal Sample without
spike ug/L
Sample with spike
ug/L
Recovery (%)
Cadmium (Cd) 443.044 544.882 101.838
Lead (Pb) 601.537 714.902 113.365
Nickel (Ni) 242.216 349.268 107.052
Zinc (Zn) 286.799 384.359 97.560
Table 6.15 Recovery studies of spike 100 ug/L of Cadmium, Lead, Nickel and Zinc
in Olive Oil Sample.
The result of the olive oil spikes sample show a good recovery for Cadmium
(101.838 %), Nickel (107.052 %) and Zinc (97.560 %) except for Lead (113.365 %)
whereby the recovery was 13.365% more.

- 64 -
Metal Sample without
spike ug/L
Sample with spike
ug/L
Recovery (%)
Cadmium (Cd) 10.160 91.567 81.407
Lead (Pb) 21.967 43.927 21.960
Nickel (Ni) 164.607 263.234 98.627
Zinc (Zn) 180.195 280.463 100.268
Table 6.16 Recovery studies of spike 100 ug/L of Cadmium, Lead, Nickel and Zinc
in Palm Oil Margarine (Bakery) Sample.
For the cases of Palm oil margarine (bakery) spike sample it show only a good recovery
for Nickel and Zinc with recovery of 98.627% and 100.268% respectively. However both
Cadmium and Lead recovery was out from expectation value with lead only recovery by
21.960 % and Cadmium with 81.407 %.
From all the spike sample result, it shows that the Cadmium and Lead recovery
was more than +/- 5%, the reason for this maybe because due to human error during
calibration. In all three spike sample analysis, the volume of standard addition used for
calibration in the cadmium and lead analysis was 50ul using micropipette. As in compare
to Zinc and nickel, the volume of standard addition that used in the calibration was in the
range of 100ul for Nickel and 250ul to 500ul for Zinc. The small volume used in standard
addition for Cadmium and Lead maybe contribute to the error in the recovery studies, as
50ul standard addition maybe not accurate due to human error. Beside that, Lead and
Cadmium was present in the sample at lower concentration of below 25ug/L in the
sample in comparison to Nickel and Zinc, therefore the equipment sensitivity and
contamination may result in the recovery error. Apart from that Lead are usually not

- 65 -
stable without acidify the spike sample; therefore the spike sample should be analyze
freshly once prepared. However acidification of spike sample will affect the final pH
value of the sample, which as a consequence will affect the peak resolution between Lead
and Cadmium. The very low recovery of Lead in Palm Oil Margarine (bakery) sample
maybe cause by the instability of lead or matrix problem in the sample, as the spike Palm
oil Margarine sample preparation are not acidify.
Determination of Zn in edible OilOlive oil Spike 100ppb Zn
-1.30 -1.20 -1.10 -1.00 -0.90 -0.80
U (V)
20.0n
40.0n
60.0n
80.0n
I (A
)
Zinc
Figure 6.17 Voltammogram of spike Cadmium, Lead and Zinc in Olive Oil Sample
Determination of Pb and Cd in edible OilOlive oil Spike 100ppb Cd Pb
-0.90 -0.80 -0.70 -0.60 -0.50 -0.40 -0.30
U (V)
20.0n
40.0n
60.0n
80.0n
100n
120n
I (A
)
Cadmium
Lead

- 66 -
Ni Determination in Edible OilOlive Oil Ni
-0.80 -0.90 -1.00 -1.10
U (V)
-50.0n
-100n
-150n
-200n
I (A
)
Nickel
Ni Determination in Edible OilOlive Oil spike 100ppb Ni
-0.80 -0.90 -1.00 -1.10
U (V)
-50.0n
-100n
-150n
-200n
-250n
I (A
)
Nickel
Figure 6.18 Voltammogram of Spike Nickel in Olive Oil Sample
Ni Determination in Edible OilPalm Oil Maj Spike 100ppb Ni
-0.80 -0.90 -1.00 -1.10
U (V)
-50.0n
-100n
-150n
-200n
I (A
)
Nickel
Figure 6.19 Voltammogram of Spike Nickel in Palm Oil Margarine (bakery) Sample
Ni Determination in Edible OilPalm Oil Maj (bakery) Ni
-0.80 -0.90 -1.00 -1.10
U (V)
-50.0n
-100n
-150n
-200n
I (A
)
Nickel

- 67 -
Determination of Zn in edible OilPalm oil Maj (bakery) Zn
-1.30 -1.20 -1.10 -1.00 -0.90 -0.80
U (V)
10.0n
20.0n
30.0n
40.0n
50.0n
60.0n
I (A
)
Zinc
Determination of Zn in edible OilPalm Oil Maj Spike 100ppb Zn
-1.30 -1.20 -1.10 -1.00 -0.90 -0.80
U (V)
10.0n
20.0n
30.0n
40.0n
50.0n
60.0n
I (A
)
Zinc
Figure 6.20 Voltammogram of Spike Zinc in Palm Oil Margarine (bakery) Sample
From the Voltammogram of Palm oil Based Margarine bakery (figure 6.18) it is clear that
the Zinc signal increase sharply with spike sample, whereas the unknown peak remain the
same peak height. The recovery of Zinc in this spike sample was 100.28%. In the analysis
of metal by voltammetric in order for a peak to be well detected and quantify especially
in simultaneous metal analysis the resolution of the peak voltage must be more than
100mv (F.G Thomas and G.henze, 2001), For the case of zinc in the palm oil sample it is
clearly observed that the zinc peak is position at -1.12 v and unknown peak at -1.00 v,
which mean both peak was separated by more than 100mv.
The Linear regression for each standard addition graph of the metal was
calculated for each sample analysis, in order to study the linearity of the calibration by

- 68 -
standard addition method. The table below summarized the linear regression (R2) for
each of the calibration.
Sample description Cadmium
(Cd)
Lead (Pb) Nickel (Ni) Zinc (Zn)
Blank 1 0.9969 0.9983 0.9980 0.9978
Blank 2 0.9957 0.9934 0.9990 0.9941
Palm oil Margarine (Bakery) 0.9978 0.9957 1.0000 0.9983
Palm oil Margarine 0.9995 0.9994 0.9981 0.9995
Sunflower Margarine 0.9921 0.9919 0.9968 0.9988
Corn Cooking Oil 0.9965 0.9961 0.9997 0.9998
Olive Oil 0.9998 0.9994 0.9999 0.9995
Sunflower Cooking Oil 0.9981 0.9931 1.0000 0.9953
Palm Cooking Oil 0.9991 0.9935 0.9994 0.9911
Average 0.9973 0.9956 0.9990 0.9971
Table 6.21 Linear Regression (R2) of the standard addition calibration graph for
each metal
From the table, most of the sample analysis shows a linear regression of more than 0.999
except for some sample. In term of metal, nickel show a considerable good linearity with
average of 0.9990, all the sample analyses with R2
of more than 0.999 except for palm oil
margarine and sunflower margarine sample, with R2
of 0.9981 and 0.9968 respectively.
For the case of Cadmium and Zinc the average linear regression for all the analysis was
0.997 above and for lead is 0.9956. The lower linear regression for cadmium and lead is
expected, this is because the volume of standard addition used was very low in the range
of 50 to 100ul, this maybe the possible contribution to the error since manual addition
was performed. Whereas, For all the blank sample, most of the result have linear

- 69 -
regression of less than 0.999, this is because only 3 calibration point are used for the
calibration therefore the data for the regression calculation maybe insufficient, beside that
the standard addition was performed using a micropipette manually therefore error in
addition maybe occurs.

- 70 -
7.0 CONCLUSION
As a conclusion, the analysis of Lead, Cadmium, Zinc and Nickel in this Edible oil
product can be alternatively performed by Voltammetry Technique instead of other
methods such as Atomic Absoprtion Spectroscopy (AAS), Graphite Furnace Atomic
Absorption Spectroscopy (GFAAS) or Inductively Couple Plasma Mass Spectroscopy
(ICP-MS). From this experiment, it shows that Voltammetry method can equally
performed the metal analysis at the sub part per billion levels. Although the recovery and
linearity in this experiment was not to it expectation with 100 +/- 5% recovery and
calibration graph linear regression of more than 0.999, however further improvement can
be performed by careful handling of sample preparation and it is highly recommended the
use of high chemical grade such as Suprapure grade for preparation.
In Term of advantages, the Voltammetry technique is capable for simultaneous
analysis of Zinc, Cadmium and Lead without required changing of working electrode or
electrolyte. This is the advantage against AAS technique which is only single element
analysis. In comparison to ICP-MS technique, the Voltammetry had a lower operational
cost as it only uses nitrogen gas for purging and without any requirement for cooling of
the system. The simple set up of voltammetry is suitable for quality control purposes as
the equipment is easy handled and does not requires complicated settings. The only
disadvantages of voltammetry technique is the used of mercury in working electrode,
which often banned by many industries for its toxic handling.

71
BIBLIOGRAPHY
1) Pier Luigi Buldini, Loretta Ricci, Jawahar Lal Sharma. Review: Recent
Application of sample preparation technique in food analysis. Journal of
Chromatography A, 2002 Volume 975, pg 47-70.
2) Baljit S Ghotra, Sandra D. Dyal, Suresh S Narine. Review: Lipid Shortening.
Food Research International, 2002 Volume 35, Pg 1015-1048.
3) M. Murillo, Z. benzo, E. Marcano, C. Gomez, A. Garaboto, C. Marin.
Determination of Copper, Iron and Nickel in edible oil using emulsified
solution by ICP-AES. Journal of Analytical Atomic Spectrometry, 1999
Volume 14, Pg 815-820.
4) Erol Pehlivan, Gulsin Arslan, Fethiye Gode, Turkun Altun, and M. Musa
Ozcan. Determination of some inorganic metals in edible vegetables oils by
Inductively Couple Plasma atomic emission spectroscopy (ICP-AES). Grasas
Y Aceites, 2008 Volume 59 Pg 239-244.
5) I. Karadjova, G. Zachariadis, G. Boskou and J. Stratis. Electrothermal atomic
absorption spectrometric determination of aluminium, cadmium, chromium,
copper, iron, manganese, nickel and lead. Journal of Analytical Atomic
Spectrometry, 1998 Volume 13 Pg 201- 204.
6) Giacomo Dugo, Lara La Pera, Giovanna Loredana La Torre, Daniele giuffrida.
Determination of Cadmium (II), Copper (II), Lead(II), and Zinc(II) content in
commercial vegetable oils using derivative potentiometric stripping analysis.
Food Chemistry, 2004 Volume 87, Pg 639-645.
7) Yasemin Sahan, Fikri Basoglu, Seref Gucer. ICP-MS analysis of a series of
metals (Namely: Mg, Cr, Co, Ni, Fe, Cu, Zn, Sn, Cd, and Pb) in Black and
Green Olive samples from bursa, Turkey. Food Chemistry, 2007 Volume 105
pg 395-399.
8) Iva Juranovic Cindric, Michaela Zeiner, Ilse steffan. Trace element
Characterization of Edible oils by ICP-MS and GFAAS. Microchemical
journal, 2007 volume 85, Pg 136-139.
9) Michael T. Lam, J murimboh, Nouri M Hassan, C.L. Chakrabarti.
Competitive Ligand exchange/adsorptive cathodic stripping voltammetry
(CLE/AdCSV) for kinetic study of nickel speciationin aqueous environmental
samples containing heterogeneous, Macromolecules, organic complexants.
Analytical Chimica acta 1999, Volume 402 Pg 195-209.

72
10) Mariela N. Matos Reyes, Reinaldo C. Campos. Determination of copper and
nickel in vegetables oils by direct sampling graphite furnace atomic
absorption spectrometry. Talanta 2006, Volume 70 Pg 929-932.
11) T.Galeano Diaz, A. Guiberteau, M.D Lopez Soto, J.M Ortiz. Determination of
copper with 5,5-dimethylcyclohexane-1,2,3-trione 1,2-dioxime3-
thiosemicarbazone in Olive Oil by adsorptive Square Stripping Square Wave
Voltammetry. Food Chemistry, 2006 Volume 96, Pg 156-162.
12) Durali Mendil, Ozgur Dogan, Mustafa Tuzen, Mustafa Soylak. Investigation
of the levels of some elements in edible oil samples produces in turkey by
atomic absorption spectrometry. Journal of Hazardous Material. 2009 Volume
165 Pg 724-728.
13) Joaquim A. nobrega, Lilian C Trevizan, Georgia C.L Araujo, Ana Rita A
Nogueira. Review: Focused-microwave assisted strategies for sample
preparation. Spectrochimica Acta Part B, 2002 Volume 57, Pg 1855-1876.
14) Rehana Ansari, Tasneem Gul Kazi, Muhammad Khan Jamali, Muhammad
Balal Arain, Mohammad Dowood Wagan. Variation in accumulation of heavy
metal in different verities of sunflower seed oil with the aid of multivariate
technique. Food Chemistry, 2009 Volume 115 Pg 318-323.
15) Daniel B Gazda, James S fritz, Marc D porter. Determination of Nickel (II) as
the Nickel dimethylglyoxime complex using colorimetric solid phase
extraction. Journal of Analytica Chimica Acta, 2004 Volume 508, pg 53 – 59.
16) A.A Dakhel, Y.Ali-mohamed Ahmed, F.Z Henari. Structural and optical
studies of evaporated Bis-(dimethylglyoxime)Nickel (II) thin films. Journal of
Optical Material, 2006 Volume 28, pg 925-929.
17) Maria B Fernandes, Gabriella M. Tonetto, Guillermo H, Crapiste and et al.
Revisiting the hydrogenation of sunflower oil over a Ni catalyst. Journal of
food engineering 2007, Volume 82, pg 199 -208.
18) David Havey. Modern Analytical Chemistry. Mc-Graw Hill International
Edition, 1st edition, 2000.
19) Skoog, West, Holler, and Crouch. Fundamental of Analytical Chemistry.
Brooks and Cole, Eight Edition, 2002.
20) Applikon BV. Nickel determination in Water and wastewater. Application
Data Sheet, 2006.
21) Dr Gunter. Monograph: Introduction to Polarography. Metrohm Limited.
2003

73
22) Monoj. K Gupta, Frying Oil. MG Edible oil Consulting International.
Richardson , Texas.
23) F.G Thomas and G.Henze. Introduction to Voltammetric Analysis Theory and
Practice. Csiro Publishing, First edition, 2001.
24) Michaela Zeiner, Ilse Steffan, Iva Juranovic. Determination of trace element
in Olive Oil by ICP-AES, and ETA-AAS: A pilot study on the geographical
characterization. Microchemical Journal 2005, Volume 81, Pg 171 – 176.
25) Cotton and Wilkinson. Advance Inorganic Chemistry. John Wiley and sons,
Fifth edition, 1998.

74
APPENDIX 1

========== METROHM 797 VA COMPUTRACE (Version 1.2) (Serial No. 3158)
===========
Determination : BLk Cd Pb dth
Sample ID : BLk Cd Pb
Creator determ.: Date : 2009-12-23 Time: 10:35:41
Modified by : Date : 2010-01-21 Time: 23:35:26
--------------------------------------------------------------------------------
Method : Determination of Cd and Pb in edible Oil with Acetate buffer
Title : Determination of Pb and Cd in edible Oil
Remark1 : Sample (0.5 smpl + 10ml UPW)+0.25ml acetate buffer
Remark2 : deposition time 30s
--------------------------------------------------------------------------------
Sample amount : 0.500 mL
Cell volume : 10.350 mL
--------------------------------------------------------------------------------
Substance : Cadmium
Conc. : 1.000 mg/L
Conc.dev. : ---
Add.amount : 50.000 ul
VR V nA I.mean Std.Dev. I.delta Comments
----- ------ ------ ------ -------- -------- ----------------------
1 - 1 -0.692 2.12 2.20 0.070 0.00
1 - 2 -0.692 2.23
1 - 3 -0.692 2.26
2 - 1 -0.692 9.75 8.95 0.729 6.74
2 - 2 -0.692 8.76
2 - 3 -0.692 8.33
3 - 1 -0.692 15.21 14.48 0.784 5.53
3 - 2 -0.692 14.58
3 - 3 -0.692 13.65
Substance : Lead
Conc. : 0.500 mg/L
Conc.dev. : ---
Add.amount : 50.000 ul
VR V nA I.mean Std.Dev. I.delta Comments
----- ------ ------ ------ -------- -------- ----------------------
1 - 1 -0.471 0.841 0.848 0.014 0.000
1 - 2 -0.471 0.863
1 - 3 -0.471 0.839
2 - 1 -0.471 3.393 2.915 0.449 2.067
2 - 2 -0.471 2.852
2 - 3 -0.471 2.501
3 - 1 -0.471 4.838 4.317 0.555 1.402

3 - 2 -0.471 4.382
3 - 3 -0.471 3.732
Solutions
--------------------------------------------------------------------------------
No. Content Predose (mL)
--- ------------------------------------------------ ------------
Final results +/- Res. dev. % Comments
----------------------------------- ------------------ -------------------
Cadmium:
default = 38.586 ug/L 5.835 15.121
Lead :
default = 27.242 ug/L 7.068 25.947
Determination of Pb and Cd in edible OilBLk Cd Pb
-0.80 -0.60 -0.40 -0.20
U (V)
5.00n
10.0n
15.0n
I (A
)
Cadmium
Lead

-2.50e-6 0 2.50e-6 5.00e-6 7.50e-6 1.00e-5
c (g/L)
0
2.50n
5.00n
7.50n
10.0n
12.5n
15.0n
I (A
)
-1.9e-006
Cadmium
c = 38.586 ug/L
+/- 5.835 ug/L (15.12%)
-2.00e-6 0 2.00e-6 4.00e-6
c (g/L)
0
1.00n
2.00n
3.00n
4.00n
I (A
)
-1.3e-006
Lead
c = 27.242 ug/L
+/- 7.068 ug/L (25.95%)

========== METROHM 797 VA COMPUTRACE (Version 1.2) (Serial No. 3158)
===========
Determination : BLk Ni.dth
Sample ID : Blk Ni 1
Creator determ.: Date : 2009-12-23 Time: 11:24:51
Modified by : Date : 2010-01-22 Time: 00:09:20
--------------------------------------------------------------------------------
Method : Ni Determination in Edible Oil (continous method).mth
Title : Determination of Ni in edible oil
Remark1 : sample 0.5ml Samp+ 1.0ml NH4Cl Buffer + 0.1ml DMG
Remark2 : Deposition time 5s, total volume 11.4
--------------------------------------------------------------------------------
Sample amount : 0.500 mL
Cell volume : 11.400 mL
--------------------------------------------------------------------------------
Substance : Nickel
Conc. : 1.000 mg/L
Conc.dev. :
Add.amount : 100.000 ul
VR V nA I.mean Std.Dev. I.delta Comments
----- ------ ------ ------ -------- -------- ----------------------
1 - 1 -0.994 -16.39 -16.48 0.110 0.00
1 - 2 -0.994 -16.61
1 - 3 -0.994 -16.44
2 - 1 -0.994 -32.56 -33.20 0.773 -16.72
2 - 2 -0.994 -32.97
2 - 3 -0.994 -34.06
3 - 1 -0.994 -49.28 -47.49 1.601 -14.29
3 - 2 -0.994 -46.20
3 - 3 -0.994 -46.99
Solutions
--------------------------------------------------------------------------------
No. Content Predose (mL)
--- ------------------------------------------------ ------------
Final results +/- Res. dev. % Comments
----------------------------------- ------------------ -------------------
Nickel:
default = 103.289 ug/L 3.138 3.038

Determination of Ni in edible oil Blk Ni 1
-0.80 -0.90 -1.00 -1.10
U (V)
-10.0n
-20.0n
-30.0n
-40.0n
-50.0n
-60.0n
I (A
)
Nickel
-5.00e-6 -2.50e-6 0 2.50e-6 5.00e-6 7.50e-6
c (g/L)
0
-10.0n
-20.0n
-30.0n
-40.0n
-50.0n
I (A
)
-4.5e-006
Nickel
c = 103.289 ug/L
+/- 3.138 ug/L (3.04%)

========== METROHM 797 VA COMPUTRACE (Version 1.2) (Serial No. 3158)
===========
Determination : BLk Zn.dth
Sample ID : BLk Zn 1
Creator determ.: Date : 2009-12-23 Time: 10:59:53
Modified by : Date : 2010-01-21 Time: 23:54:03
--------------------------------------------------------------------------------
Method : Determination of Zn in edible Oil (Continous).mth
Title : Determination of Zn in edible Oil
Remark1 : Sample (0.50 smpl continous from previous Cd pb)
Remark2 : Deposition time 40s, total volume 10.50. stiring 1000rpm
--------------------------------------------------------------------------------
Sample amount : 0.500 mL
Cell volume : 10.500 mL
--------------------------------------------------------------------------------
Substance : Zinc
Conc. : 1.000 mg/L
Conc.dev. :
Add.amount : 50.000ul
VR V nA I.mean Std.Dev. I.delta Comments
----- ------ ------ ------ -------- -------- ----------------------
1 - 1 -1.101 1.500 1.446 0.051 0.000
1 - 2 -1.101 1.440
1 - 3 -1.101 1.399
2 - 1 -1.101 3.677 3.575 0.134 2.128
2 - 2 -1.101 3.624
2 - 3 -1.101 3.423
3 - 1 -1.101 5.332 5.374 0.063 1.799
3 - 2 -1.101 5.344
3 - 3 -1.101 5.446
Solutions
--------------------------------------------------------------------------------
No. Content Predose (mL)
--- ------------------------------------------------ ------------
Final results +/- Res. dev. % Comments
----------------------------------- ------------------ -------------------
Zinc:
default = 75.314 ug/L 4.375 5.809

Determination of Zn in edible OilBLk Zn 1
-1.50 -1.40 -1.30 -1.20 -1.10 -1.00 -0.90
U (V)
2.00n
4.00n
6.00n
8.00n
I (A
)
Zinc
-5.00e-6 -2.50e-6 0 2.50e-6 5.00e-6 7.50e-6 1.00e-5
c (g/L)
0
1.00n
2.00n
3.00n
4.00n
5.00n
I (A
)
-3.6e-006
Zinc
c = 75.314 ug/L
+/- 4.375 ug/L (5.81%)
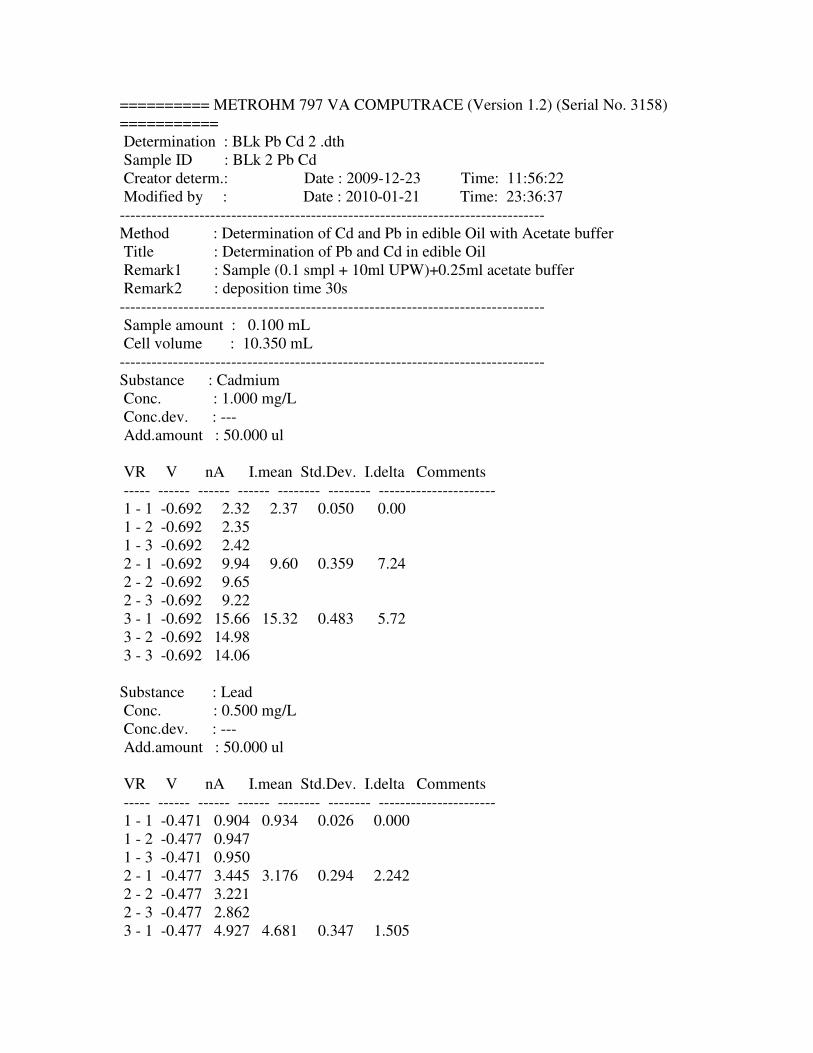
========== METROHM 797 VA COMPUTRACE (Version 1.2) (Serial No. 3158)
===========
Determination : BLk Pb Cd 2 .dth
Sample ID : BLk 2 Pb Cd
Creator determ.: Date : 2009-12-23 Time: 11:56:22
Modified by : Date : 2010-01-21 Time: 23:36:37
--------------------------------------------------------------------------------
Method : Determination of Cd and Pb in edible Oil with Acetate buffer
Title : Determination of Pb and Cd in edible Oil
Remark1 : Sample (0.1 smpl + 10ml UPW)+0.25ml acetate buffer
Remark2 : deposition time 30s
--------------------------------------------------------------------------------
Sample amount : 0.100 mL
Cell volume : 10.350 mL
--------------------------------------------------------------------------------
Substance : Cadmium
Conc. : 1.000 mg/L
Conc.dev. : ---
Add.amount : 50.000 ul
VR V nA I.mean Std.Dev. I.delta Comments
----- ------ ------ ------ -------- -------- ----------------------
1 - 1 -0.692 2.32 2.37 0.050 0.00
1 - 2 -0.692 2.35
1 - 3 -0.692 2.42
2 - 1 -0.692 9.94 9.60 0.359 7.24
2 - 2 -0.692 9.65
2 - 3 -0.692 9.22
3 - 1 -0.692 15.66 15.32 0.483 5.72
3 - 2 -0.692 14.98
3 - 3 -0.692 14.06
Substance : Lead
Conc. : 0.500 mg/L
Conc.dev. : ---
Add.amount : 50.000 ul
VR V nA I.mean Std.Dev. I.delta Comments
----- ------ ------ ------ -------- -------- ----------------------
1 - 1 -0.471 0.904 0.934 0.026 0.000
1 - 2 -0.477 0.947
1 - 3 -0.471 0.950
2 - 1 -0.477 3.445 3.176 0.294 2.242
2 - 2 -0.477 3.221
2 - 3 -0.477 2.862
3 - 1 -0.477 4.927 4.681 0.347 1.505

3 - 2 -0.477 4.436
3 - 3 -0.477 3.873
Solutions
--------------------------------------------------------------------------------
No. Content Predose (mL)
--- ------------------------------------------------ ------------
Final results +/- Res. dev. % Comments
----------------------------------- ------------------ -------------------
Cadmium:
default = 39.739 ug/L 4.901 12.334
Lead :
default = 27.796 ug/L 5.285 19.012
Determination of Pb and Cd in edible OilBLk 2 Pb Cd
-0.80 -0.60 -0.40 -0.20
U (V)
5.00n
10.0n
15.0n
20.0n
I (A
)
Cadmium
Lead

-2.50e-6 0 2.50e-6 5.00e-6 7.50e-6 1.00e-5
c (g/L)
0
2.50n
5.00n
7.50n
10.0n
12.5n
15.0n
I (A
)
-1.9e-006
Cadmium
c = 39.739 ug/L
+/- 4.901 ug/L (12.33%)
-2.00e-6 0 2.00e-6 4.00e-6
c (g/L)
0
1.00n
2.00n
3.00n
4.00n
5.00n
I (A
)
-1.3e-006
Lead
c = 27.796 ug/L
+/- 5.285 ug/L (19.01%)
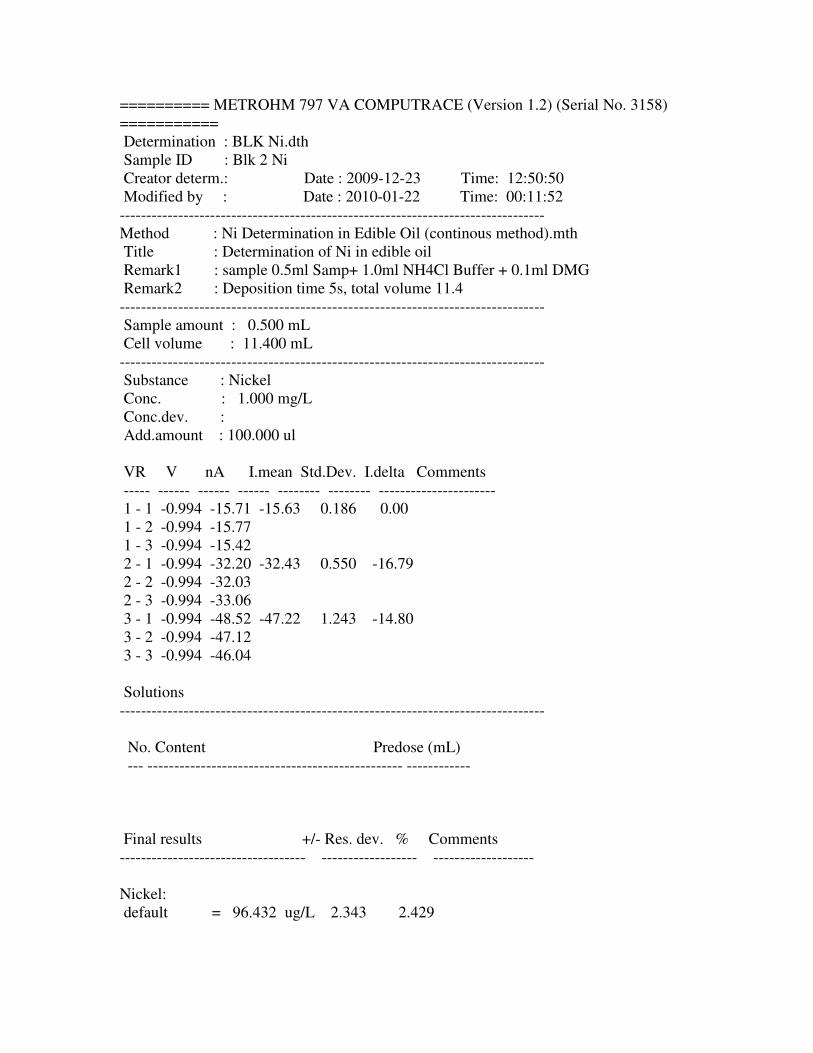
========== METROHM 797 VA COMPUTRACE (Version 1.2) (Serial No. 3158)
===========
Determination : BLK Ni.dth
Sample ID : Blk 2 Ni
Creator determ.: Date : 2009-12-23 Time: 12:50:50
Modified by : Date : 2010-01-22 Time: 00:11:52
--------------------------------------------------------------------------------
Method : Ni Determination in Edible Oil (continous method).mth
Title : Determination of Ni in edible oil
Remark1 : sample 0.5ml Samp+ 1.0ml NH4Cl Buffer + 0.1ml DMG
Remark2 : Deposition time 5s, total volume 11.4
--------------------------------------------------------------------------------
Sample amount : 0.500 mL
Cell volume : 11.400 mL
--------------------------------------------------------------------------------
Substance : Nickel
Conc. : 1.000 mg/L
Conc.dev. :
Add.amount : 100.000 ul
VR V nA I.mean Std.Dev. I.delta Comments
----- ------ ------ ------ -------- -------- ----------------------
1 - 1 -0.994 -15.71 -15.63 0.186 0.00
1 - 2 -0.994 -15.77
1 - 3 -0.994 -15.42
2 - 1 -0.994 -32.20 -32.43 0.550 -16.79
2 - 2 -0.994 -32.03
2 - 3 -0.994 -33.06
3 - 1 -0.994 -48.52 -47.22 1.243 -14.80
3 - 2 -0.994 -47.12
3 - 3 -0.994 -46.04
Solutions
--------------------------------------------------------------------------------
No. Content Predose (mL)
--- ------------------------------------------------ ------------
Final results +/- Res. dev. % Comments
----------------------------------- ------------------ -------------------
Nickel:
default = 96.432 ug/L 2.343 2.429

Ni Determination in Edible OilBlk 2 Ni
-0.80 -0.90 -1.00 -1.10
U (V)
-10.0n
-20.0n
-30.0n
-40.0n
-50.0n
-60.0n
I (A
)
Nickel
-5.00e-6 -2.50e-6 0 2.50e-6 5.00e-6 7.50e-6
c (g/L)
0
-10.0n
-20.0n
-30.0n
-40.0n
-50.0n
I (A
)
-4.2e-006
Nickel
c = 96.432 ug/L
+/- 2.343 ug/L (2.43%)

========== METROHM 797 VA COMPUTRACE (Version 1.2) (Serial No. 3158)
===========
Determination : BLk Zn.dth
Sample ID : BLk 2 Zn
Creator determ.: Date : 2009-12-23 Time: 12:28:23
Modified by : Date : 2010-01-21 Time: 23:55:10
--------------------------------------------------------------------------------
Method : Determination of Zn in edible Oil (Continous).mth
Title : Determination of Zn in edible Oil
Remark1 : Sample (0.50 smpl continous from previous Cd pb)
Remark2 : Deposition time 40s, total volume 10.50. stiring 1000rpm
--------------------------------------------------------------------------------
Sample amount : 0.500 mL
Cell volume : 10.500 mL
--------------------------------------------------------------------------------
Substance : Zinc
Conc. : 1.000 mg/L
Conc.dev. :
Add.amount : 50.000ul
VR V nA I.mean Std.Dev. I.delta Comments
----- ------ ------ ------ -------- -------- ----------------------
1 - 1 -1.101 1.139 1.123 0.014 0.000
1 - 2 -1.101 1.113
1 - 3 -1.101 1.117
2 - 1 -1.101 3.377 3.231 0.143 2.108
2 - 2 -1.101 3.225
2 - 3 -1.101 3.091
3 - 1 -1.101 4.970 4.836 0.121 1.605
3 - 2 -1.101 4.801
3 - 3 -1.101 4.736
Solutions
--------------------------------------------------------------------------------
No. Content Predose (mL)
--- ------------------------------------------------ ------------
Final results +/- Res. dev. % Comments
----------------------------------- ------------------ -------------------
Zinc:
default = 64.080 ug/L 6.376 9.950

Determination of Zn in edible OilBLk 2 Zn
-1.50 -1.40 -1.30 -1.20 -1.10 -1.00 -0.90
U (V)
2.00n
3.00n
4.00n
5.00n
6.00n
7.00n
8.00n
I (A
)
Zinc
-2.50e-6 0 2.50e-6 5.00e-6 7.50e-6 1.00e-5
c (g/L)
0
1.00n
2.00n
3.00n
4.00n
5.00n
I (A
)
-3.1e-006
Zinc
c = 64.080 ug/L
+/- 6.376 ug/L (9.95%)

======== METROHM 797 VA COMPUTRACE (Version 1.2) (Serial No. 3158)
===========
Determination : Corn oil (Pb Cd).dth
Sample ID : Corn oil (Pb Cd)
Creator determ. : Date : 2009-12-30 Time: 16:05:02
Modified by : Date : 2010-01-20 Time: 14:20:42
--------------------------------------------------------------------------------
Method : Determination of Cd and Pb in edible Oil with Acetate buffer
Title : Determination of Pb and Cd in edible Oil
Remark1 : Sample (0.500 smpl + 10ml UPW)+0.25 Acetate buffer buffer
Remark2 : Deposition time 30 s
--------------------------------------------------------------------------------
Sample amount : 0.500 mL
Cell volume : 10.350 mL
--------------------------------------------------------------------------------
Substance : Cadmium
Conc. : 1.000 mg/L
Conc.dev. : ---
Add.amount : 50.000 ul
VR V nA I.mean Std.Dev. I.delta Comments
----- ------ ------ ------ -------- -------- ----------------------
1 - 1 -0.668 0.56 0.56 0.003 0.00
1 - 2 -0.668 0.56
2 - 1 -0.668 9.66 8.69 --- 8.13
2 - 2 -0.668 8.69
3 - 1 -0.668 17.18 14.98 --- 6.29
3 - 2 -0.668 14.98
4 - 1 -0.668 21.46 21.46 --- 6.48
4 - 2 -0.668 19.39
Substance : Lead
Conc. : 1.000 mg/L
Conc.dev. : ---
Add.amount : 50.000 ul
VR V nA I.mean Std.Dev. I.delta Comments
----- ------ ------ ------ -------- -------- ----------------------
1 - 1 --- --- 0.66 --- 0.00
1 - 2 -0.477 0.66
2 - 1 -0.471 13.91 11.01 --- 10.35
2 - 2 -0.471 11.01
3 - 1 -0.471 24.46 18.80 --- 7.79
3 - 2 -0.471 18.80
4 - 1 -0.471 29.78 29.78 --- 10.98
4 - 2 -0.471 23.49

Solutions
--------------------------------------------------------------------------------
No. Content Predose (mL)
--- ------------------------------------------------ ------------
1 Standard For Cd and Pb -------
Final results +/- Res. dev. % Comments
----------------------------------- ------------------ -------------------
Cadmium:
default = 14.079 ug/L 4.905 34.840
Lead :
default = 9.401 ug/L 4.668 49.656
Determination of Pb and Cd in edible OilCorn oil (Pb Cd)
-0.90 -0.80 -0.70 -0.60 -0.50 -0.40 -0.30
U (V)
10.0n
20.0n
30.0n
40.0n
I (A
)
Cadmium
Lead

0 5.00e-6 1.00e-5 1.50e-5
c (g/L)
0
5.00n
10.0n
15.0n
20.0n
I (A
)
-6.8e-007
Cadmium
c = 14.079 ug/L
+/- 4.905 ug/L (34.84%)
0 5.00e-6 1.00e-5 1.50e-5
c (g/L)
0
5.00n
10.0n
15.0n
20.0n
25.0n
30.0n
I (A
)
-4.5e-007
Lead
c = 9.401 ug/L
+/- 4.668 ug/L (49.66%)

========== METROHM 797 VA COMPUTRACE (Version 1.2) (Serial No. 3158)
===========
Determination : Corn Oil (Ni).dth
Sample ID : Corn Oil (Ni)
Creator determ.: Date : 2009-12-30 Time: 16:37:09
Modified by : Date : 2010-01-20 Time: 15:44:57
--------------------------------------------------------------------------------
Method : Ni Determination in Edible Oil (continous method).mth
Title : Ni Determination in Edible Oil
Remark1 : sample 0.5ml Samp+ 1.0ml NH4Cl Buffer + 0.1ml DMG
Remark2 : Deposition time 5s, total volume 14.75
--------------------------------------------------------------------------------
Sample amount : 0.500 mL
Cell volume : 14.750 mL
--------------------------------------------------------------------------------
Substance : Nickel
Conc. : 1.000 mg/L
Conc.dev. :
Add.amount : 100.000 ul
VR V nA I.mean Std.Dev. I.delta Comments
----- ------ ------ ------ -------- -------- ----------------------
1 - 1 -0.970 -30.5 -30.5 0.094 0.0
1 - 2 -0.970 -30.6
2 - 1 -0.970 -74.5 -75.5 1.498 -45.0
2 - 2 -0.970 -76.6
3 - 1 -0.970 -116.2 -116.4 0.311 -40.9
3 - 2 -0.970 -116.7
4 - 1 -0.970 -160.6 -159.2 1.924 -42.8
4 - 2 -0.970 -157.8
Solutions
--------------------------------------------------------------------------------
No. Content Predose (mL)
--- ------------------------------------------------ ------------
Final results +/- Res. dev. % Comments
----------------------------------- ------------------ -------------------
Nickel:
default = 138.891 ug/L 2.439 1.756

Ni Determination in Edible OilCorn Oil (Ni)
-0.80 -0.90 -1.00 -1.10
U (V)
-50.0n
-100n
-150n
-200n
-250n
I (A
)
Nickel
-5.00e-6 0 5.00e-6 1.00e-5 1.50e-5 2.00e-5
c (g/L)
0
-25.0n
-50.0n
-75.0n
-100n
-125n
-150n
I (A
)
-4.7e-006
Nickel
c = 138.891 ug/L
+/- 2.439 ug/L (1.76%)

======== METROHM 797 VA COMPUTRACE (Version 1.2) (Serial No. 3158)
===========
Determination :Corn oil (Zn) dth
Sample ID : Corn oil (Zn)
Creator determ.: Date : 2009-12-30 Time: 15:59:17
Modified by : Date : 2010-01-20 Time: 16:05:39
--------------------------------------------------------------------------------
Method : Determination of Zn in edible Oil (Continous).mth
Title : Determination of Zn in edible Oil
Remark1 : Sample (0.50 smpl continous from previous Cd pb)
Remark2 : Deposition time 40s, total volume 10.65. stiring 1000rpm
--------------------------------------------------------------------------------
Sample amount : 0.500 mL
Cell volume : 10.650 mL
--------------------------------------------------------------------------------
Substance : Zinc
Conc. : 1.000 mg/L
Conc.dev. :
Add.amount : Variable. Add 1 - 0.500ml, Add 2 – 1.000ml, Add 3-1.000ml
VR V nA I.mean Std.Dev. I.delta Comments
----- ------ ------ ------ -------- -------- ----------------------
1 - 1 --- --- --- ---
1 - 2 --- ---
2 - 1 -1.101 6.78 6.66 0.171 6.66
2 - 2 -1.101 6.54
3 - 1 -1.101 22.34 22.74 0.563 16.08
3 - 2 -1.101 23.14
4 - 1 -1.101 37.38 36.74 0.910 14.00
4 - 2 -1.101 36.10
Solutions
--------------------------------------------------------------------------------
No. Content Predose (mL)
--- ------------------------------------------------ ------------
Final results +/- Res. dev. % Comments
----------------------------------- ------------------ -------------------
Zinc:
default = --- mg/L No result found

Determination of Zn in edible OilCorn oil (Zn)
-1.40 -1.30 -1.20 -1.10 -1.00 -0.90
U (V)
20.0n
40.0n
60.0n
80.0n
I (A
)
Zinc
0 5.00e-5 1.00e-4 1.50e-4 2.00e-4
c (g/L)
0
10.0n
20.0n
30.0n
I (A
)
Zinc
c = ---

========= METROHM 797 VA COMPUTRACE (Version 1.2) (Serial No. 3158)
===========
Determination : Corn Oil Spike 100ppb Cd Pb.dth
Sample ID : Corn Oil Spike 100ppb (Pb Cd)
Creator determ.: Date : 2010-01-02 Time: 13:20:27
Modified by : Date : 2010-01-20 Time: 14:46:12
--------------------------------------------------------------------------------
Method : Determination of Cd and Pb in edible Oil with Acetate Buffer
Title : Determination of Pb and Cd in edible Oil
Remark1 : Sample (0.50 smpl + 10ml UPW)+0.25 acetate buffer
Remark2 : Deposition time 30 s
--------------------------------------------------------------------------------
Sample amount : 0.500 mL
Cell volume : 10.350 mL
--------------------------------------------------------------------------------
Substance : Cadmium
Conc. Std : 1.000 mg/L
Conc.dev. :
Add.amount : 100.000 ul
VR V nA I.mean Std.Dev. I.delta Comments
----- ------ ------ ------ -------- -------- ----------------------
1 - 1 -0.668 3.75 3.61 0.196 0.00
1 - 2 -0.668 3.47
2 - 1 -0.668 12.76 12.61 0.208 9.00
2 - 2 -0.668 12.46
3 - 1 -0.668 20.84 19.94 1.270 7.33
3 - 2 -0.668 19.05
4 - 1 -0.668 26.69 26.69 6.75
4 - 2 -0.662 24.08
Substance : Lead
Conc. : 1.000 mg/L
Conc.dev. :
Add.amount : 100.000 ul
VR V nA I.mean Std.Dev. I.delta Comments
----- ------ ------ ------ -------- -------- ----------------------
1 - 1 -0.477 8.64 6.61 2.865 0.00
1 - 2 -0.477 4.59
2 - 1 -0.471 21.99 20.72 1.793 14.11
2 - 2 -0.471 19.45
3 - 1 -0.471 34.89 32.62 3.208 11.91
3 - 2 -0.471 30.36
4 - 1 -0.471 43.24 43.24 --- 10.62
4 - 2 -0.471 37.80

Solutions
--------------------------------------------------------------------------------
No. Content Predose (mL)
--- ------------------------------------------------ ------------
1 Standard For Cd and Pb -------
Final results +/- Res. dev. % Comments
----------------------------------- ------------------ -------------------
Cadmium:
default = 99.935 ug/L 13.714 13.723
Lead :
default = 106.313 ug/L 22.289 20.965
Determination of Pb and Cd in edible OilCorn Oil Spike 100ppb Cd Pb
-0.90 -0.80 -0.70 -0.60 -0.50 -0.40 -0.30
U (V)
10.0n
20.0n
30.0n
40.0n
50.0n
I (A
)
Cadmium
Lead

0 1.00e-5 2.00e-5 3.00e-5
c (g/L)
0
5.00n
10.0n
15.0n
20.0n
25.0n
I (A
)
-4.8e-006
Cadmium
c = 99.935 ug/L
+/- 13.714 ug/L (13.72%)
-1.00e-5 0 1.00e-5 2.00e-5 3.00e-5
c (g/L)
0
10.0n
20.0n
30.0n
40.0n
I (A
)
-5.1e-006
Lead
c = 106.313 ug/L
+/- 22.289 ug/L (20.97%)

========= METROHM 797 VA COMPUTRACE (Version 1.2) (Serial No. 3158)
===========
Determination :Corn Oil Spike 100ppb Ni.dth
Sample ID : Corn Oil Spike 100ppb Ni
Creator determ.: Date : 2010-01-02 Time: 14:20:13
Modified by : Date : 2010-01-20 Time: 15:44:30
--------------------------------------------------------------------------------
Method : Ni Determination in Edible Oil (continous method).mth
Title : Ni Determination in Edible Oil
Remark1 : sample 0.5ml Samp+ 1.0ml NH4Cl Buffer + 0.1ml DMG
Remark2 : deposition time 5s, total vol 14.75
--------------------------------------------------------------------------------
Sample amount : 0.500 mL
Cell volume : 14.750 mL
--------------------------------------------------------------------------------
Substance : Nickel
Conc. : 1.000 mg/L
Conc.dev. :
Add.amount : 100.000 ul
VR V nA I.mean Std.Dev. I.delta Comments
----- ------ ------ ------ -------- -------- ----------------------
1 - 1 -0.970 -47.1 -46.7 0.639 0.0
1 - 2 -0.970 -46.2
2 - 1 -0.970 -88.5 -87.7 1.199 -41.0
2 - 2 -0.970 -86.8
3 - 1 -0.970 -129.7 -127.8 2.622 -40.2
3 - 2 -0.970 -126.0
4 - 1 -0.970 -168.2 -158.3 --- -30.5
4 - 2 -0.970 -158.3
Solutions
--------------------------------------------------------------------------------
No. Content Predose (mL)
--- ------------------------------------------------ ------------
Final results +/- Res. dev. % Comments
----------------------------------- ------------------ -------------------
Nickel:
default = 237.016 ug/L 8.743 3.689

Ni Determination in Edible OilCorn Oil Spike 100ppb Ni
-0.80 -0.90 -1.00 -1.10
U (V)
-50.0n
-100n
-150n
-200n
-250nI
(A)
Nickel
-1.00e-5 -5.00e-6 0 5.00e-6 1.00e-5 1.50e-5 2.00e-5
c (g/L)
0
-25.0n
-50.0n
-75.0n
-100n
-125n
-150n
I (A
)
-8e-006
Nickel
c = 237.016 ug/L
+/- 8.743 ug/L (3.69%)

======= METROHM 797 VA COMPUTRACE (Version 1.2) (Serial No. 3158)
===========
Determination : Corn Oil spike 100ppb Zn.dth
Sample ID : Corn Oil spike 100ppb Zn
Creator determ.: Date : 2010-01-02 Time: 13:50:33
Modified by : Date : 2010-01-20 Time: 16:20:29
--------------------------------------------------------------------------------
Method : Determination of Zn in edible Oil (Continous).mth
Title : Determination of Zn in edible Oil
Remark1 : Sample (0.50 smpl continous from previous Cd pb)
Remark2 : Deposition time 10s, total volume 10.65. stiring 1000rpm
--------------------------------------------------------------------------------
Sample amount : 0.500 mL
Cell volume : 10.650 mL
--------------------------------------------------------------------------------
Substance : Zinc
Conc. : 1.000 mg/L
Conc.dev. :
Add.amount : 1.000ml
VR V nA I.mean Std.Dev. I.delta Comments
----- ------ ------ ------ -------- -------- ----------------------
1 - 1 -1.101 1.68 1.62 0.083 0.00
1 - 2 -1.101 1.56
2 - 1 -1.101 21.19 19.14 --- 17.88
2 - 2 -1.101 19.14
3 - 1 -1.101 35.74 35.37 0.521 16.23
3 - 2 -1.101 35.00
4 - 1 -1.101 50.74 50.57 0.242 15.20
4 - 2 -1.101 50.40
Solutions
--------------------------------------------------------------------------------
No. Content Predose (mL)
--- ------------------------------------------------ ------------
Final results +/- Res. dev. % Comments
----------------------------------- ------------------ -------------------
Zinc:
default = 101.450 ug/L 30.967 30.524

Determination of Zn in edible OilCorn Oil spike 100ppb Zn
-1.40 -1.30 -1.20 -1.10 -1.00 -0.90 -0.80
U (V)
20.0n
40.0n
60.0n
80.0n
100nI
(A)
Zinc
0 5.00e-5 1.00e-4 1.50e-4 2.00e-4
c (g/L)
0
10.0n
20.0n
30.0n
40.0n
50.0n
I (A
)
-4.8e-006
Zinc
c = 101.450 ug/L
+/- 30.967 ug/L (30.52%)

======== METROHM 797 VA COMPUTRACE (Version 1.2) (Serial No. 3158)
===========
Determination : Palm Cooking Oil Cd Pb.dth
Sample ID : Palm Cooking Oil Cd Pb
Creator determ.: Date : 2010-01-02 Time: 12:54:28
Modified by : Date : 2010-01-21 Time: 21:59:26
--------------------------------------------------------------------------------
Method : Determination of Cd and Pb in edible Oil with Acetate buffer
Title : Determination of Pb and Cd in edible Oil
Remark1 : Sample (0.10 smpl + 10ml UPW)+0.25ml Acetate buffer
Remark2 : Deposition time 30 s
--------------------------------------------------------------------------------
Sample amount : 0.100 mL
Cell volume : 10.350 mL
--------------------------------------------------------------------------------
Substance : Cadmium
Conc. : 1.000 mg/L
Conc.dev. : ---
Add.amount : 100.000 ul
VR V nA I.mean Std.Dev. I.delta Comments
----- ------ ------ ------ -------- -------- ----------------------
1 - 1 -0.668 1.95 2.10 0.200 0.00
1 - 2 -0.668 2.24
2 - 1 -0.668 11.04 10.36 --- 8.27
2 - 2 -0.668 10.36
3 - 1 -0.668 18.42 17.70 1.021 7.34
3 - 2 -0.668 16.98
4 - 1 -0.668 24.87 24.87 --- 7.17
4 - 2 -0.668 22.29
Substance : Lead
Conc. : 1.000 mg/L
Conc.dev. : ---
Add.amount : 100.000 ul
VR V nA I.mean Std.Dev. I.delta Comments
----- ------ ------ ------ -------- -------- ----------------------
1 - 1 -0.477 2.67 2.58 0.128 0.00
1 - 2 -0.477 2.49
2 - 1 -0.477 19.29 16.85 --- 14.26
2 - 2 -0.477 16.85
3 - 1 -0.477 31.65 29.35 3.252 12.50
3 - 2 -0.471 27.05
4 - 1 -0.477 39.01 39.01 --- 9.66
4 - 2 -0.471 33.52

Solutions
--------------------------------------------------------------------------------
No. Content Predose (mL)
--- ------------------------------------------------ ------------
1 Standard For Cd and Pb -------
Final results +/- Res. dev. % Comments
----------------------------------- ------------------ -------------------
Cadmium:
default = 58.409 ug/L 8.421 14.417
Lead :
default = 46.722 ug/L 12.086 25.868
Determination of Pb and Cd in edible OilPalm Cooking Oil Cd Pb
-0.90 -0.80 -0.70 -0.60 -0.50 -0.40 -0.30
U (V)
10.0n
20.0n
30.0n
40.0n
50.0n
I (A
)
Cadmium
Lead

0 1.00e-5 2.00e-5 3.00e-5
c (g/L)
0
5.00n
10.0n
15.0n
20.0n
25.0n
I (A
)
-2.8e-006
Cadmium
c = 58.409 ug/L
+/- 8.421 ug/L (14.42%)
0 1.00e-5 2.00e-5 3.00e-5
c (g/L)
0
10.0n
20.0n
30.0n
40.0n
I (A
)
-2.3e-006
Lead
c = 46.722 ug/L
+/- 12.086 ug/L (25.87%)

========== METROHM 797 VA COMPUTRACE (Version 1.2) (Serial No. 3158)
===========
Determination : Palm Cooking Oil Ni.dth
Sample ID : Palm Cooking Oil Ni
Creator determ.: Date : 2010-01-02 Time: 12:25:06
Modified by : Date : 2010-01-21 Time: 22:29:40
--------------------------------------------------------------------------------
Method : Ni Determination in Edible Oil (continous method).mth
Title : Ni Determination in Edible Oil
Remark1 : sample 0.5ml Samp+ 1.0ml NH4Cl Buffer + 0.1ml DMG
Remark2 : deposition time 5s, total vol 14.75
--------------------------------------------------------------------------------
Sample amount : 0.500 mL
Cell volume : 14.750 mL
--------------------------------------------------------------------------------
Substance : Nickel
Conc. : 1.000 mg/L
Conc.dev. :
Add.amount : 100.000 ul
VR V nA I.mean Std.Dev. I.delta Comments
----- ------ ------ ------ -------- -------- ----------------------
1 - 1 -0.959 -38.5 -38.6 0.087 0.0
1 - 2 -0.959 -38.6
2 - 1 -0.970 -75.7 -75.7 0.030 -37.1
2 - 2 -0.970 -75.7
3 - 1 -0.970 -107.6 -108.1 0.675 -32.4
3 - 2 -0.970 -108.5
4 - 1 -0.970 -145.2 -142.4 3.936 -34.3
4 - 2 -0.970 -139.6
Solutions
--------------------------------------------------------------------------------
No. Content Predose (mL)
--- ------------------------------------------------ ------------
Final results +/- Res. dev. % Comments
----------------------------------- ------------------ -------------------
Nickel:
default = 216.935 ug/L 5.318 2.452

Ni Determination in Edible OilPalm Cooking Oil Ni
-0.80 -0.90 -1.00 -1.10
U (V)
-50.0n
-100n
-150n
-200n
I (A
)
Nickel
-1.00e-5 -5.00e-6 0 5.00e-6 1.00e-5 1.50e-5 2.00e-5
c (g/L)
0
-25.0n
-50.0n
-75.0n
-100n
-125n
-150n
I (A
)
-7.4e-006
Nickel
c = 216.935 ug/L
+/- 5.318 ug/L (2.45%)

========== METROHM 797 VA COMPUTRACE (Version 1.2) (Serial No. 3158)
===========
Determination : Palm Cooking Oil Zn.dth
Sample ID : Palm Cooking Oil Zn
Creator determ.: Date : 2010-01-02 Time: 12:35:44
Modified by : Date : 2010-01-21 Time: 22:13:34
--------------------------------------------------------------------------------
Method : Determination of Zn in edible Oil (Continous).mth
Title : Determination of Zn in edible Oil
Remark1 : Sample (0.50smpl continous from previous Cd pb)
Remark2 : Deposition time 40s, total volume 10.65. stiring 1000rpm
--------------------------------------------------------------------------------
Sample amount : 0.500 mL
Cell volume : 10.350 mL
--------------------------------------------------------------------------------
Substance : Zinc
Conc. : 1.000 mg/L
Conc.dev. :
Add.amount : Variable. Add 1 - 0.500ml, Add 2 – 0.500ml, Add 3-1.000ml
VR V nA I.mean Std.Dev. I.delta Comments
----- ------ ------ ------ -------- -------- ----------------------
1 - 1 -1.106 4.10 4.10 0.004 0.00
1 - 2 -1.100 4.11
2 - 1 -1.106 14.90 15.43 0.760 11.33
2 - 2 -1.100 15.97
3 - 1 -1.106 25.28 25.26 0.033 9.82
3 - 2 -1.106 25.23
4 - 1 -1.100 41.41 41.56 0.210 16.30
4 - 2 -1.100 41.71
Solutions
--------------------------------------------------------------------------------
No. Content Predose (mL)
--- ------------------------------------------------ ------------
Final results +/- Res. dev. % Comments
----------------------------------- ------------------ -------------------
Zinc:
default = 375.716 ug/L 29.940 7.969

Determination of Zn in edible OilPalm Cooking Oil Zn
-1.30 -1.20 -1.10 -1.00 -0.90 -0.80
U (V)
10.0n
20.0n
30.0n
40.0n
50.0n
60.0n
I (A
)
Zinc
0 5.00e-5 1.00e-4 1.50e-4
c (g/L)
0
10.0n
20.0n
30.0n
40.0n
I (A
)
-1.8e-005
Zinc
c = 375.716 ug/L
+/- 29.940 ug/L (7.97%)
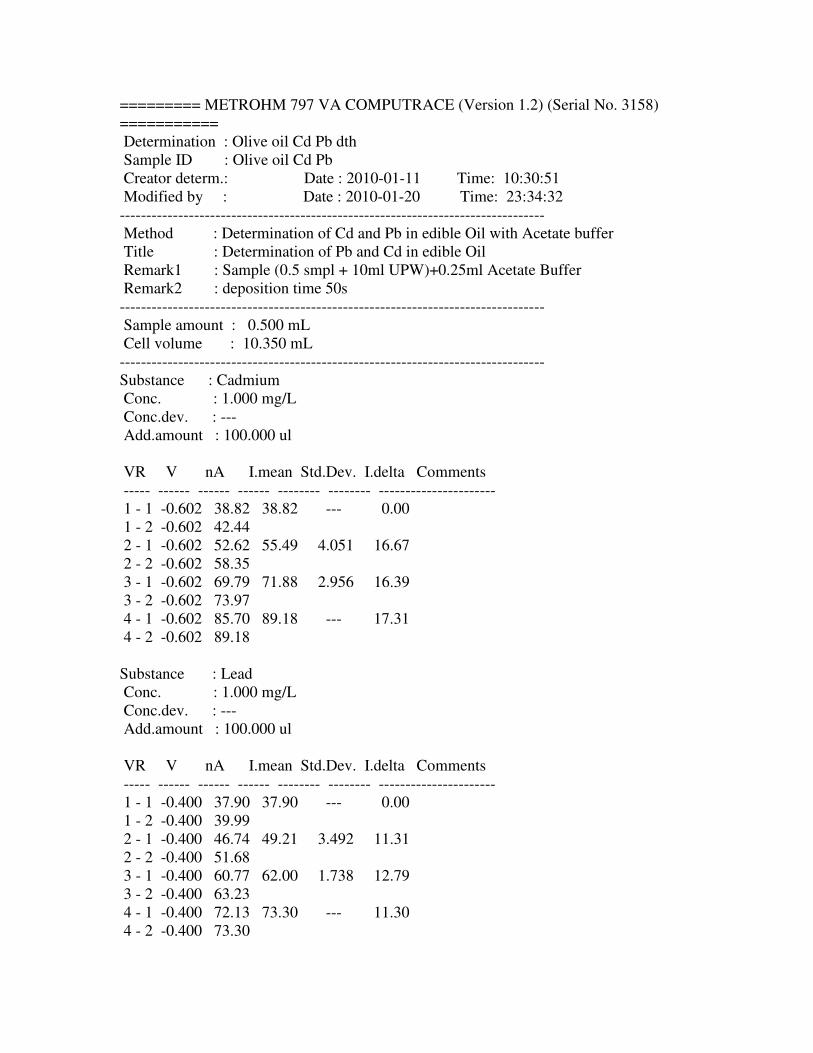
========= METROHM 797 VA COMPUTRACE (Version 1.2) (Serial No. 3158)
===========
Determination : Olive oil Cd Pb dth
Sample ID : Olive oil Cd Pb
Creator determ.: Date : 2010-01-11 Time: 10:30:51
Modified by : Date : 2010-01-20 Time: 23:34:32
--------------------------------------------------------------------------------
Method : Determination of Cd and Pb in edible Oil with Acetate buffer
Title : Determination of Pb and Cd in edible Oil
Remark1 : Sample (0.5 smpl + 10ml UPW)+0.25ml Acetate Buffer
Remark2 : deposition time 50s
--------------------------------------------------------------------------------
Sample amount : 0.500 mL
Cell volume : 10.350 mL
--------------------------------------------------------------------------------
Substance : Cadmium
Conc. : 1.000 mg/L
Conc.dev. : ---
Add.amount : 100.000 ul
VR V nA I.mean Std.Dev. I.delta Comments
----- ------ ------ ------ -------- -------- ----------------------
1 - 1 -0.602 38.82 38.82 --- 0.00
1 - 2 -0.602 42.44
2 - 1 -0.602 52.62 55.49 4.051 16.67
2 - 2 -0.602 58.35
3 - 1 -0.602 69.79 71.88 2.956 16.39
3 - 2 -0.602 73.97
4 - 1 -0.602 85.70 89.18 --- 17.31
4 - 2 -0.602 89.18
Substance : Lead
Conc. : 1.000 mg/L
Conc.dev. : ---
Add.amount : 100.000 ul
VR V nA I.mean Std.Dev. I.delta Comments
----- ------ ------ ------ -------- -------- ----------------------
1 - 1 -0.400 37.90 37.90 --- 0.00
1 - 2 -0.400 39.99
2 - 1 -0.400 46.74 49.21 3.492 11.31
2 - 2 -0.400 51.68
3 - 1 -0.400 60.77 62.00 1.738 12.79
3 - 2 -0.400 63.23
4 - 1 -0.400 72.13 73.30 --- 11.30
4 - 2 -0.400 73.30

Solutions
--------------------------------------------------------------------------------
No. Content Predose (mL)
--- ------------------------------------------------ ------------
1 Standard For Cd and Pb -------
Final results +/- Res. dev. % Comments
----------------------------------- ------------------ -------------------
Cadmium:
default = 443.044 ug/L 27.252 6.151
Lead :
default = 601.537 ug/L 39.827 6.621
Determination of Pb and Cd in edible OilOlive oil Cd Pb
-0.90 -0.80 -0.70 -0.60 -0.50 -0.40 -0.30
U (V)
20.0n
40.0n
60.0n
80.0n
100n
I (A
)
Cadmium
Lead

-2.00e-5 -1.00e-5 0 1.00e-5 2.00e-5 3.00e-5
c (g/L)
0
20.0n
40.0n
60.0n
80.0n
I (A
)
-2.1e-005
Cadmium
c = 443.044 ug/L
+/- 27.252 ug/L (6.15%)
-2.00e-5 0 2.00e-5
c (g/L)
0
20.0n
40.0n
60.0n
I (A
)
-2.9e-005
Lead
c = 601.537 ug/L
+/- 39.827 ug/L (6.62%)

========= METROHM 797 VA COMPUTRACE (Version 1.2) (Serial No. 3158)
===========
Determination : Olive Oil Ni (C).dth
Sample ID : Olive Oil Ni
Creator determ.: Date : 2010-01-11 Time: 11:10:44
Modified by : Date : 2010-01-21 Time: 16:15:18
--------------------------------------------------------------------------------
Method : Ni Determination in Edible Oil (continous method).mth
Title : Ni Determination in Edible Oil
Remark1 : sample 0.5ml Samp+ 1.0ml NH4Cl Buffer + 0.1ml DMG
Remark2 : deposition time 5s, Total Volume 14.750ml
--------------------------------------------------------------------------------
Sample amount : 0.500 mL
Cell volume : 14.750 mL
--------------------------------------------------------------------------------
Substance : Nickel
Conc. : 1.000 mg/L
Conc.dev. :
Add.amount : 100.000 ul
VR V nA I.mean Std.Dev. I.delta Comments
----- ------ ------ ------ -------- -------- ----------------------
1 - 1 -0.963 -48.2 -48.2 0.104 0.0
1 - 2 -0.963 -48.3
2 - 1 -0.966 -85.7 -86.6 1.281 -38.4
2 - 2 -0.966 -87.5
3 - 1 -0.970 -126.5 -126.4 0.215 -39.7
3 - 2 -0.970 -126.2
4 - 1 -0.970 -164.6 -164.3 0.551 -37.9
4 - 2 -0.970 -163.9
Solutions
--------------------------------------------------------------------------------
No. Content Predose (mL)
--- ------------------------------------------------ ------------
Final results +/- Res. dev. % Comments
----------------------------------- ------------------ -------------------
Nickel:
default = 242.216 ug/L 2.750 1.136

Ni Determination in Edible OilOlive Oil Ni
-0.80 -0.90 -1.00 -1.10
U (V)
-50.0n
-100n
-150n
-200n
I (A
)
Nickel
-1.00e-5 -5.00e-6 0 5.00e-6 1.00e-5 1.50e-5 2.00e-5
c (g/L)
0
-25.0n
-50.0n
-75.0n
-100n
-125n
-150n
I (A
)
-8.2e-006
Nickel
c = 242.216 ug/L
+/- 2.750 ug/L (1.14%)

========= METROHM 797 VA COMPUTRACE (Version 1.2) (Serial No. 3158)
===========
Determination : Olive Oil Zn (C).dth
Sample ID : Olive Oil Zn
Creator determ.: Date : 2010-01-11 Time: 10:51:07
Modified by : Date : 2010-01-21 Time: 16:46:10
--------------------------------------------------------------------------------
Method : Determination of Zn in edible Oil (Continous).mth
Title : Determination of Zn in edible Oil
Remark1 : Sample (0.50 smpl continous from previous Cd pb)
Remark2 : Deposition time 90s, total volume 10.65. stiring 1000rpm
--------------------------------------------------------------------------------
Sample amount : 0.500 mL
Cell volume : 10.650 mL
--------------------------------------------------------------------------------
Substance : Zinc
Conc. : 1.000 mg/L
Conc.dev. :
Add.amount : 250.00 ul
VR V nA I.mean Std.Dev. I.delta Comments
----- ------ ------ ------ -------- -------- ----------------------
1 - 1 -0.999 12.60 12.55 0.083 0.00
1 - 2 -1.004 12.49
2 - 1 -0.999 34.44 34.37 0.097 21.83
2 - 2 -0.999 34.30
3 - 1 -0.999 54.78 53.34 2.042 18.97
3 - 2 -0.999 51.89
4 - 1 -0.999 72.41 73.27 1.211 19.93
4 - 2 -0.999 74.12
Solutions
--------------------------------------------------------------------------------
No. Content Predose (mL)
--- ------------------------------------------------ ------------
Final results +/- Res. dev. % Comments
----------------------------------- ------------------ -------------------
Zinc:
default = 286.799 ug/L 8.017 2.795

Determination of Zn in edible OilOlive Oil Zn
-1.30 -1.20 -1.10 -1.00 -0.90 -0.80
U (V)
20.0n
40.0n
60.0n
80.0n
I (A
)
Zinc
-2.00e-5 0 2.00e-5 4.00e-5 6.00e-5
c (g/L)
0
20.0n
40.0n
60.0n
I (A
)
-1.3e-005
Zinc
c = 286.799 ug/L
+/- 8.017 ug/L (2.80%)

========== METROHM 797 VA COMPUTRACE (Version 1.2) (Serial No. 3158)
===========
Determination : Olive oil Cd Pb Spike 100ppb.dth
Sample ID : Olive oil Spike 100ppb Cd Pb
Creator determ.: Date : 2010-01-12 Time: 16:32:12
Modified by : --- Date : 2010-01-20 Time: 23:40:43
--------------------------------------------------------------------------------
Method : Determination of Cd and Pb in edible Oil with Acetate Buffer.mth
Title : Determination of Pb and Cd in edible Oil
Remark1 : Sample (0.50 smpl + 10ml UPW)+0.25ml Acetate Buffer
Remark2 : Deposition time 40s
--------------------------------------------------------------------------------
Sample amount : 0.500 mL
Cell volume : 10.350 mL
--------------------------------------------------------------------------------
Substance : Cadmium
Conc. Std : 1.000 mg/L
Conc.dev. :
Add.amount : 100.000 ul
VR V nA I.mean Std.Dev. I.delta Comments
----- ------ ------ ------ -------- -------- ----------------------
1 - 1 -0.602 48.0 50.9 --- 0.0
1 - 2 -0.602 50.9
2 - 1 -0.602 62.2 65.9 5.295 15.0
2 - 2 -0.602 69.7
3 - 1 -0.602 79.2 83.2 5.609 17.2
3 - 2 -0.602 87.1
4 - 1 -0.602 99.2 105.6 --- 22.4
4 - 2 -0.602 105.6
Substance : Lead
Conc. : 1.000 mg/L
Conc.dev. :
Add.amount : 100.000 ul
VR V nA I.mean Std.Dev. I.delta Comments
----- ------ ------ ------ -------- -------- ----------------------
1 - 1 -0.400 50.88 51.30 --- 0.00
1 - 2 -0.400 51.30
2 - 1 -0.400 58.88 62.04 4.469 10.74
2 - 2 -0.400 65.20
3 - 1 -0.400 72.91 76.19 4.647 14.15
3 - 2 -0.400 79.48
4 - 1 -0.400 85.59 92.20 --- 16.01
4 - 2 -0.400 92.20

Solutions
--------------------------------------------------------------------------------
No. Content Predose (mL)
--- ------------------------------------------------ ------------
1 Standard For Cd and Pb -------
Final results +/- Res. dev. % Comments
----------------------------------- ------------------ -------------------
Cadmium:
default = 544.882 ug/L 56.415 10.354
Lead :
default = 714.902 ug/L 74.995 10.490
Determination of Pb and Cd in edible Oil
Olive oil Spike 100ppb Cd Pb
-0.90 -0.80 -0.70 -0.60 -0.50 -0.40 -0.30
U (V)
20.0n
40.0n
60.0n
80.0n
100n
120n
I (A
)
Cadmium
Lead

-3.00e-5 -2.00e-5 -1.00e-5 0 1.00e-5 2.00e-5 3.00e-5
c (g/L)
0
20.0n
40.0n
60.0n
80.0n
100n
I (A
)
-2.6e-005
Cadmium
c = 544.882 ug/L
+/- 56.415 ug/L (10.35%)
-4.00e-5 -2.00e-5 0 2.00e-5
c (g/L)
0
20.0n
40.0n
60.0n
80.0n
I (A
)
-3.5e-005
Lead
c = 714.902 ug/L
+/- 74.995 ug/L (10.49%)
========= METROHM 797 VA COMPUTRACE (Version 1.2) (Serial No. 3158)
===========
Determination : Olive Oil spike 100ppb Ni dth
Sample ID : Olive Oil spike 100ppb Ni
Creator determ.: Date : 2010-01-12 Time: 17:15:02
Modified by : Date : 2010-01-21 Time: 16:32:08
--------------------------------------------------------------------------------
Method : Ni Determination in Edible Oil (continous method).mth
Title : Ni Determination in Edible Oil
Remark1 : sample 0.5ml Samp+ 1.0ml NH4Cl Buffer + 0.1ml DMG
Remark2 : deposition 5s, Total Volume 14.75
--------------------------------------------------------------------------------
Sample amount : 0.500 mL
Cell volume : 14.750 mL
--------------------------------------------------------------------------------
Substance : Nickel
Conc. : 1.000 mg/L
Conc.dev. :
Add.amount : 100.000 ul
VR V nA I.mean Std.Dev. I.delta Comments
----- ------ ------ ------ -------- -------- ----------------------
1 - 1 -0.966 -63.3 -70.0 9.472 0.0
1 - 2 -0.966 -76.7
2 - 1 -0.966 -102.4 -110.5 11.446 -40.5
2 - 2 -0.966 -118.6
3 - 1 -0.966 -137.8 -151.6 19.550 -41.1
3 - 2 -0.966 -165.4
4 - 1 -0.966 -171.7 -184.1 17.563 -32.5
4 - 2 -0.966 -196.5
Solutions
--------------------------------------------------------------------------------
No. Content Predose (mL)
--- ------------------------------------------------ ------------
Final results +/- Res. dev. % Comments
----------------------------------- ------------------ -------------------
Nickel:
default = 349.268 ug/L 53.782 15.398
Ni Determination in Edible OilOlive Oil spike 100ppb Ni
-0.80 -0.90 -1.00 -1.10
U (V)
-50.0n
-100n
-150n
-200n
-250n
I (A
)
Nickel
-1.00e-5 0 1.00e-5 2.00e-5
c (g/L)
0
-50.0n
-100n
-150n
I (A
)
-1.2e-005
Nickel
c = 349.268 ug/L
+/- 53.782 ug/L (15.40%)

======== METROHM 797 VA COMPUTRACE (Version 1.2) (Serial No. 3158)
===========
Determination : Olive oil Spike 100ppb Zn.dth
Sample ID : Olive oil Spike 100ppb Zn
Creator determ. : Date : 2010-01-12 Time: 16:53:14
Modified by : Date : 2010-01-21 Time: 16:59:48
--------------------------------------------------------------------------------
Method : Determination of Zn in edible Oil (Continous).mth
Title : Determination of Zn in edible Oil
Remark1 : Sample (0.50 smpl continous from previous Cd pb)
Remark2 : Deposition time 90s, total volume 10.65.
--------------------------------------------------------------------------------
Sample amount : 0.500 mL
Cell volume : 10.650 mL
--------------------------------------------------------------------------------
Substance : Zinc
Conc. : 1.000 mg/L
Conc.dev. :
Add.amount : 100.000 ul
VR V nA I.mean Std.Dev. I.delta Comments
----- ------ ------ ------ -------- -------- ----------------------
1 - 1 -0.999 15.76 15.76 --- 0.00
1 - 2 -0.999 16.42
2 - 1 -0.999 35.26 36.03 1.095 20.27
2 - 2 -0.999 36.80
3 - 1 -0.999 54.22 54.42 0.276 18.39
3 - 2 -0.999 54.61
4 - 1 -0.999 71.79 71.82 0.043 17.41
4 - 2 -0.999 71.85
Solutions
--------------------------------------------------------------------------------
No. Content Predose (mL)
--- ------------------------------------------------ ------------
Final results +/- Res. dev. % Comments
----------------------------------- ------------------ -------------------
Zinc:
default = 384.359 ug/L 7.390 1.923
Determination of Zn in edible Oil
Olive oil Spike 100ppb Zn
-1.30 -1.20 -1.10 -1.00 -0.90 -0.80
U (V)
20.0n
40.0n
60.0n
80.0n
I (A
)
Zinc
-2.00e-5 0 2.00e-5 4.00e-5 6.00e-5
c (g/L)
0
20.0n
40.0n
60.0n
I (A
)
-1.8e-005
Zinc
c = 384.359 ug/L
+/- 7.390 ug/L (1.92%)

========== METROHM 797 VA COMPUTRACE (Version 1.2) (Serial No. 3158)
===========
Determination : Palm Oil Maj (Cd Pb).dth
Sample ID : Palm Oil Maj
Creator determ.: Date : 2009-12-24 Time: 9:35:05
Modified by : --- Date : 2010-01-22 Time: 12:00.03
--------------------------------------------------------------------------------
Method : Determination of Cd and Pb in edible Oil with Acetate buffer
Title : Determination of Pb and Cd in edible Oil
Remark1 : Sample (0.5 smpl + 10ml UPW)+0.25ml acetate buffer
Remark2 : deposition time 30s
--------------------------------------------------------------------------------
Sample amount : 0.500 mL
Cell volume : 10.350 mL
--------------------------------------------------------------------------------
Substance : Cadmium
Conc. : 1.000 mg/L
Conc.dev. : ---
Add.amount : 100.000 ul
VR V nA I.mean Std.Dev. I.delta Comments
----- ------ ------ ------ -------- -------- ----------------------
1 - 1 -0.696 8.21 8.27 0.096 0.00
1 - 2 -0.702 8.34
1 - 3 --- ---
2 - 2 --- --- 19.82 0.237 11.54
2 - 2 -0.655 19.99
2 - 3 -0.661 19.65
3 - 1 -0.661 32.02 30.44 1.412 10.63
3 - 2 -0.655 29.29
3 - 3 -0.655 30.03
Substance : Lead
Conc. : 1.000 mg/L
Conc.dev. : ---
Add.amount : 100.000 ul
VR V nA I.mean Std.Dev. I.delta Comments
----- ------ ------ ------ -------- -------- ----------------------
1 - 1 -0.458 2.49 2.46 0.045 0.00
1 - 2 -0.458 2.42
1 - 3 -0.464 2.71
2 - 1 -0.470 8.65 8.04 0.529 5.58
2 - 2 -0.452 7.74
2 - 3 -0.452 7.73
3 - 1 -0.446 15.44 14.88 0.583 6.84

3 - 2 -0.446 14.28
3 - 3 -0.446 14.92
Solutions
--------------------------------------------------------------------------------
No. Content Predose (mL)
--- ------------------------------------------------ ------------
Final results +/- Res. dev. % Comments
----------------------------------- ------------------ -------------------
Cadmium:
default = 145.251 ug/L 5.130 3.532
Lead :
default = 70.035 ug/L 10.421 14.880
Determination of Pb and Cd in edible Oil Palm Oil Maj
-1.00 -0.80 -0.60 -0.40 -0.20
U (V)
20.0n
40.0n
60.0n
80.0n
I (A
)
Cadmium
Lead

-1.00e-5 -5.00e-6 0 5.00e-6 1.00e-5 1.50e-5 2.00e-5
c (g/L)
0
5.00n
10.0n
15.0n
20.0n
25.0n
30.0n
I (A
)
-7e-006
Cadmium
c = 145.251 ug/L
+/- 5.130 ug/L (3.53%)
-5.00e-6 0 5.00e-6 1.00e-5 1.50e-5 2.00e-5
c (g/L)
0
2.50n
5.00n
7.50n
10.0n
12.5n
15.0n
I (A
)
-3.4e-006
Lead
c = 70.035 ug/L
+/- 10.421 ug/L (14.88%)
========== METROHM 797 VA COMPUTRACE (Version 1.2) (Serial No. 3158)
===========
Determination : Palm Oil Maj Ni.dth
Sample ID : Palm Oil Maj Ni
Creator determ.: Date : 2009-12-24 Time: 9:27:29
Modified by : Date : 2010-01-22 Time: 14:39:27
--------------------------------------------------------------------------------
Method : Ni Determination in Edible Oil (continous method).mth
Title : Ni Determination in Edible Oil
Remark1 : sample 0.5ml Samp+ 1.0ml NH4Cl Buffer + 0.1ml DMG
Remark2 : deposition time 5s, Total Volume 11.400ml
--------------------------------------------------------------------------------
Sample amount : 0.500 mL
Cell volume : 11.4000 mL
--------------------------------------------------------------------------------
Substance : Nickel
Conc. : 1.000 mg/L
Conc.dev. :
Add.amount : 50.000 ul
VR V nA I.mean Std.Dev. I.delta Comments
----- ------ ------ ------ -------- -------- ----------------------
1 - 1 -0.994 -16.39 -16.48 0.110 0.00
1 - 2 -0.994 -16.61
1 - 3 -0.994 -16.44
2 - 1 -0.994 -32.56 -33.20 0.773 -16.72
2 - 2 -0.994 -32.97
2 - 3 -0.994 -34.06
3 - 1 -0.994 -49.28 -47.49 1.601 -14.29
3 - 2 -0.994 -46.20
3 - 3 -0.994 -46.99
Solutions
--------------------------------------------------------------------------------
No. Content Predose (mL)
--- ------------------------------------------------ ------------
Final results +/- Res. dev. % Comments
----------------------------------- ------------------ -------------------
Nickel:
default = 103.199 ug/L 3.126 3.029

Ni Determination in Edible OilPalm Oil Ni
-0.80 -0.90 -1.00 -1.10
U (V)
-10.0n
-20.0n
-30.0n
-40.0n
-50.0n
-60.0n
I (A
)
Nickel
-5.00e-6 0 5.00e-6 1.00e-5
c (g/L)
0
-10.0n
-20.0n
-30.0n
-40.0n
-50.0n
I (A
)
-4.8e-006
Nickel
c = 103.199 ug/L
+/- 3.126 ug/L (3.03%)

========= METROHM 797 VA COMPUTRACE (Version 1.2) (Serial No. 3158)
===========
Determination : MC Palm Oil Maj Zn .dth
Sample ID : MC Palm Oil Maj Zn
Creator determ.: Date : 2009-12-24 Time: 9:55:01
Modified by : Date : 2010-01-22 Time: 14:21:21
--------------------------------------------------------------------------------
Method : Determination of Zn in edible Oil (Continous).mth
Title : Determination of Zn in edible Oil
Remark1 : Sample (0.50 smpl continous from previous Cd pb)
Remark2 : Deposition time 90s, total volume 10.65. stiring 1000rpm
--------------------------------------------------------------------------------
Sample amount : 0.500 mL
Cell volume : 10.650 mL
--------------------------------------------------------------------------------
Substance : Zinc
Conc. : 1.000 mg/L
Conc.dev. :
Add.amount : 250.00 ul
VR V nA I.mean Std.Dev. I.delta Comments
----- ------ ------ ------ -------- -------- ----------------------
1 - 1 -0.999 20.49 20.50 0.019 0.00
1 - 2 -0.999 20.52
2 - 1 -0.999 44.60 44.59 0.011 24.09
2 - 2 -0.999 44.59
3 - 1 -0.999 65.69 65.51 0.257 20.91
3 - 2 -0.999 65.33
4 - 1 -0.999 89.10 87.29 2.557 21.78
4 - 2 -0.999 85.48
Solutions
--------------------------------------------------------------------------------
No. Content Predose (mL)
--- ------------------------------------------------ ------------
Final results +/- Res. dev. % Comments
----------------------------------- ------------------ -------------------
Zinc:
default = 422.711 ug/L 8.712 2.061

Determination of Zn in edible OilPalm Oil Maj Zn
-1.30 -1.20 -1.10 -1.00 -0.90 -0.80
U (V)
20.0n
40.0n
60.0n
80.0n
100n
I (A
)
Zinc
-2.00e-5 0 2.00e-5 4.00e-5 6.00e-5
c (g/L)
0
20.0n
40.0n
60.0n
80.0n
I (A
)
-2e-005
Zinc
c = 422.711 ug/L
+/- 8.712 ug/L (2.06%)

======= METROHM 797 VA COMPUTRACE (Version 1.2) (Serial No. 3158)
===========
Determination : Palm Oil Maj (Cd Pb).dth
Sample ID : Palm oil Maj (Cd Pb)
Creator determ.: Date : 2009-12-28 Time: 12:41:05
Modified by : Date : 2010-01-20 Time: 16:59:59
--------------------------------------------------------------------------------
Method : Determination of Cd and Pb in edible Oil with Acetate buffer
Title : Determination of Pb and Cd in edible Oil
Remark1 : Sample (0.5 smpl + 10ml UPW)+0.25ml acetate buffer
Remark2 : deposition time 30s
--------------------------------------------------------------------------------
Sample amount : 0.500 mL
Cell volume : 10.350 mL
--------------------------------------------------------------------------------
Substance : Cadmium
Conc. : 1.000 mg/L
Conc.dev. : ---
Add.amount : 100.000 ul
VR V nA I.mean Std.Dev. I.delta Comments
----- ------ ------ ------ -------- -------- ----------------------
1 - 1 -0.668 0.05 0.05 0.001 0.00
1 - 2 -0.674 0.05
2 - 1 -0.662 9.66 9.08 --- 9.03
2 - 2 -0.662 9.08
3 - 1 -0.662 16.96 16.49 0.653 7.41
3 - 2 -0.662 16.03
4 - 1 -0.662 23.86 23.86 --- 7.36
4 - 2 -0.662 21.83
Substance : Lead
Conc. : 1.000 mg/L
Conc.dev. : ---
Add.amount : 100.000 ul
VR V nA I.mean Std.Dev. I.delta Comments
----- ------ ------ ------ -------- -------- ----------------------
1 - 1 -0.477 1.14 1.13 0.013 0.00
1 - 2 -0.477 1.12
2 - 1 -0.471 20.05 17.88 --- 16.75 Not used
2 - 2 -0.471 17.88
3 - 1 -0.471 33.07 31.28 2.526 13.40
3 - 2 -0.471 29.50
4 - 1 -0.471 43.75 43.75 --- 12.47
4 - 2 -0.471 38.35

Solutions
--------------------------------------------------------------------------------
No. Content Predose (mL)
--- ------------------------------------------------ ------------
1 Standard For Cd and Pb -------
Final results +/- Res. dev. % Comments
----------------------------------- ------------------ -------------------
Cadmium:
default = 10.160 ug/L 8.010 78.834
Lead :
default = 21.967 ug/L 9.168 41.734
Determination of Pb and Cd in edible OilPalm oil Maj Cd Pb
-0.90 -0.80 -0.70 -0.60 -0.50 -0.40 -0.30
U (V)
10.0n
20.0n
30.0n
40.0n
50.0n
I (A
)
Lead
Cadmium

0 1.00e-5 2.00e-5 3.00e-5
c (g/L)
0
5.00n
10.0n
15.0n
20.0n
25.0n
I (A
)
-4.9e-007
Cadmium
c = 10.160 ug/L
+/- 8.010 ug/L (78.83%)
0 1.00e-5 2.00e-5 3.00e-5
c (g/L)
0
10.0n
20.0n
30.0n
40.0n
I (A
)
-1.1e-006
Lead
c = 21.967 ug/L
+/- 9.168 ug/L (41.73%)

======== METROHM 797 VA COMPUTRACE (Version 1.2) (Serial No. 3158)
===========
Determination : Palm Oil Maj Ni.dth
Sample ID : Palm Oil Maj Ni
Creator determ.: Date : 2009-12-28 Time: 13:20:30
Modified by : Date : 2010-01-20 Time: 17:38:47
--------------------------------------------------------------------------------
Method : Ni Determination in Edible Oil (continous method).mth
Title : Ni Determination in Edible Oil
Remark1 : sample 0.5ml Samp+ 1.0ml NH4Cl Buffer + 0.1ml DMG
Remark2 : deposition time 5s, total volume 14.75
--------------------------------------------------------------------------------
Sample amount : 0.500 mL
Cell volume : 14.750 mL
--------------------------------------------------------------------------------
Substance : Nickel
Conc. : 1.000 mg/L
Conc.dev. :
Add.amount : 100.000 ul
VR V nA I.mean Std.Dev. I.delta Comments
----- ------ ------ ------ -------- -------- ----------------------
1 - 1 -0.963 -32.8 -32.9 0.165 0.0
1 - 2 -0.963 -33.1
2 - 1 -0.970 -70.3 -71.8 2.206 -38.9
2 - 2 -0.970 -73.4
3 - 1 -0.970 -110.5 -111.3 1.141 -39.4
3 - 2 -0.970 -112.1
4 - 1 -0.970 -151.0 -150.3 1.012 -39.0
4 - 2 -0.970 -149.6
Solutions
--------------------------------------------------------------------------------
No. Content Predose (mL)
--- ------------------------------------------------ ------------
Final results +/- Res. dev. % Comments
----------------------------------- ------------------ -------------------
Nickel:
default = 164.607 ug/L 3.001 1.823

Ni Determination in Edible OilPalm Oil Maj (bakery) Ni
-0.80 -0.90 -1.00 -1.10
U (V)
-50.0n
-100n
-150n
-200n
I (A
)
Nickel
-5.00e-6 0 5.00e-6 1.00e-5 1.50e-5 2.00e-5
c (g/L)
0
-25.0n
-50.0n
-75.0n
-100n
-125n
-150n
I (A
)
-5.6e-006
Nickel
c = 164.607 ug/L
+/- 3.001 ug/L (1.82%)

========== METROHM 797 VA COMPUTRACE (Version 1.2) (Serial No. 3158)
===========
Determination : Palm Oil Maj Zn.dth
Sample ID : Palm Oil Maj Zn
Creator determ.: Date : 2009-12-28 Time: 13:03:02
Modified by : Date : 2010-01-20 Time: 17:58:52
--------------------------------------------------------------------------------
Method : Determination of Zn in edible Oil (Continous).mth
Title : Determination of Zn in edible Oil
Remark1 : Sample (0.50 smpl continous from previous Cd pb)
Remark2 : Deposition time 90s, total volume 10.65
--------------------------------------------------------------------------------
Sample amount : 0.500 mL
Cell volume : 10.650 mL
--------------------------------------------------------------------------------
Substance : Zinc
Conc. : 1.000 mg/L
Conc.dev. :
Add.amount : 100.00 ul
VR V nA I.mean Std.Dev. I.delta Comments
----- ------ ------ ------ -------- -------- ----------------------
1 - 1 -1.100 7.32 7.85 0.00 Not used
1 - 2 -1.100 7.85
2 - 1 -1.100 16.91 17.17 0.370 9.32
2 - 2 -1.100 17.43
3 - 1 -1.100 24.63 24.67 0.058 7.50
3 - 2 -1.100 24.71
4 - 1 -1.100 34.74 33.89 1.204 9.22
4 - 2 -1.100 33.04
Solutions
--------------------------------------------------------------------------------
No. Content Predose (mL)
--- ------------------------------------------------ ------------
Final results +/- Res. dev. % Comments
----------------------------------- ------------------ -------------------
Zinc:
default = 180.195 ug/L 10.126 5.619

Determination of Zn in edible OilPalm oil Maj (bakery) Zn
-1.30 -1.20 -1.10 -1.00 -0.90 -0.80
U (V)
10.0n
20.0n
30.0n
40.0n
50.0n
60.0n
I (A
)
Zinc
-1.00e-5 0 1.00e-5 2.00e-5 3.00e-5
c (g/L)
0
10.0n
20.0n
30.0n
I (A
)
-8.5e-006
Zinc
c = 180.195 ug/L
+/- 10.126 ug/L (5.62%)

========== METROHM 797 VA COMPUTRACE (Version 1.2) (Serial No. 3158)
===========
Determination : Palm Oil Maj Spike 100 ppb Pb Cd.dth
Sample ID : Palm Oil Maj Spike 100 ppb Pb Cd
Creator determ.: Date : 2009-12-29 Time: 10.21:13
Modified by : Date : 2010-01-20 Time: 17:21:00
--------------------------------------------------------------------------------
Method : Determination of Cd and Pb in edible Oil with NH4 buffer.mth
Title : Determination of Pb and Cd in edible Oil
Remark1 : Sample (0.50 smpl + 10ml UPW)+0.25ml acetate buffer
Remark2 : Depostion time 30s
--------------------------------------------------------------------------------
Sample amount : 0.500 mL
Cell volume : 10.350 mL
--------------------------------------------------------------------------------
Substance : Cadmium
Conc. Std : 1.000 mg/L
Conc.dev. :
Add.amount : 100.000 ul
VR V nA I.mean Std.Dev. I.delta Comments
----- ------ ------ ------ -------- -------- ----------------------
1 - 1 -0.662 3.23 3.23 --- 0.00
1 - 2 -0.662 3.00
2 - 1 -0.662 11.85 11.43 0.601 8.20
2 - 2 -0.662 11.01
3 - 1 -0.662 19.21 18.32 1.254 6.89
3 - 2 -0.662 17.43
4 - 1 -0.662 25.33 25.33 --- 7.01
4 - 2 -0.662 23.50
Substance : Lead
Conc. : 1.000 mg/L
Conc.dev. :
Add.amount : 100.000 ul
VR V nA I.mean Std.Dev. I.delta Comments
----- ------ ------ ------ -------- -------- ----------------------
1 - 1 -0.471 2.61 2.61 --- 0.00
1 - 2 -0.471 2.45
2 - 1 -0.466 21.01 19.84 1.650 17.23
2 - 2 -0.466 18.68
3 - 1 -0.466 34.63 32.25 3.365 12.40
3 - 2 -0.466 29.87
4 - 1 -0.471 43.99 43.99 --- 11.74
4 - 2 -0.466 38.62

Solutions
--------------------------------------------------------------------------------
No. Content Predose (mL)
--- ------------------------------------------------ ------------
1 Standard For Cd and Pb -------
Final results +/- Res. dev. % Comments
----------------------------------- ------------------ -------------------
Cadmium:
default = 91.567 ug/L 12.549 13.705
Lead :
default = 43.927 ug/L 14.266 32.476
Determination of Pb and Cd in edible OilPalm Oil Maj Spike 100ppb Pb Cd
-0.90 -0.80 -0.70 -0.60 -0.50 -0.40 -0.30
U (V)
10.0n
20.0n
30.0n
40.0n
50.0n
I (A
)
Lead
Cadmium

0 1.00e-5 2.00e-5 3.00e-5
c (g/L)
0
5.00n
10.0n
15.0n
20.0n
25.0n
I (A
)
-4.4e-006
Cadmium
c = 91.567 ug/L
+/- 12.549 ug/L (13.71%)
0 1.00e-5 2.00e-5 3.00e-5
c (g/L)
0
10.0n
20.0n
30.0n
40.0n
I (A
)
-2.1e-006
Lead
c = 43.927 ug/L
+/- 14.266 ug/L (32.48%)

========= METROHM 797 VA COMPUTRACE (Version 1.2) (Serial No. 3158)
===========
Determination : Palm Oil Maj Spike 100ppb Ni.dth
Sample ID : Palm Oil Maj Spike 100ppb Ni
Creator determ.: Date : 2009-12-29 Time: 11:03:42
Modified by : Date : 2010-01-20 Time: 17:39:41
--------------------------------------------------------------------------------
Method : Ni Determination in Edible Oil (continous method).mth
Title : Ni Determination in Edible Oil
Remark1 : sample 0.5ml Samp+ 1.0ml NH4Cl Buffer + 0.1ml DMG
Remark2 : Depostion time 5s, total volume 14.75
--------------------------------------------------------------------------------
Sample amount : 0.500 mL
Cell volume : 14.750 mL
--------------------------------------------------------------------------------
Substance : Nickel
Conc. : 1.000 mg/L
Conc.dev. :
Add.amount : 100.000 ul
VR V nA I.mean Std.Dev. I.delta Comments
----- ------ ------ ------ -------- -------- ----------------------
1 - 1 -0.966 -48.9 -49.4 --- 0.0 Not used
1 - 2 -0.966 -49.4
2 - 1 -0.970 -86.8 -87.1 0.439 -37.7
2 - 2 -0.970 -87.4
3 - 1 -0.970 -121.7 -123.6 2.784 -36.6
3 - 2 -0.970 -125.6
4 - 1 -0.970 -158.9 -158.1 1.125 -34.4
4 - 2 -0.970 -157.3
Solutions
--------------------------------------------------------------------------------
No. Content Predose (mL)
--- ------------------------------------------------ ------------
Final results +/- Res. dev. % Comments
----------------------------------- ------------------ -------------------
Nickel:
default = 263.234 ug/L 4.381 1.664

Ni Determination in Edible OilPalm Oil Maj Spike 100ppb Ni
-0.80 -0.90 -1.00 -1.10
U (V)
-50.0n
-100n
-150n
-200n
I (A
)
Nickel
-1.00e-5 0 1.00e-5 2.00e-5
c (g/L)
0
-25.0n
-50.0n
-75.0n
-100n
-125n
-150n
I (A
)
-8.9e-006
Nickel
c = 263.234 ug/L
+/- 4.381 ug/L (1.66%)

========== METROHM 797 VA COMPUTRACE (Version 1.2) (Serial No. 3158)
===========
Determination : Palm Oil Maj Spike 100ppb Zn .dth
Sample ID : Palm Oil Maj Spike 100ppb Zn
Creator determ .: Date : 2009-12-29 Time: 10.45.02
Modified by : Date : 2010-01-20 Time: 18.00.13
--------------------------------------------------------------------------------
Method : Determination of Zn in edible Oil (Continous).mth
Title : Determination of Zn in edible Oil
Remark1 : Sample (0.50 smpl continous from previous Cd pb)
Remark2 : Deposition time 90s, total volume 10.65.
--------------------------------------------------------------------------------
Sample amount : 0.500 mL
Cell volume : 10.650 mL
--------------------------------------------------------------------------------
Substance : Zinc
Conc. : 1.000 mg/L
Conc.dev. :
Add.amount : 100.000 ul
VR V nA I.mean Std.Dev. I.delta Comments
----- ------ ------ ------ -------- -------- ----------------------
1 - 1 -1.100 12.33 12.43 0.141 0.00
1 - 2 -1.100 12.53
2 - 1 -1.100 22.49 22.49 0.013 10.05
2 - 2 -1.100 22.48
3 - 1 -1.094 30.69 30.38 0.440 7.90
3 - 2 -1.094 30.07
4 - 1 -1.094 37.70 37.82 0.167 7.44
4 - 2 -1.094 37.94
Solutions
--------------------------------------------------------------------------------
No. Content Predose (mL)
--- ------------------------------------------------ ------------
Final results +/- Res. dev. % Comments
----------------------------------- ------------------ -------------------
Zinc:
default = 280.463 ug/L 14.152 5.046

Determination of Zn in edible OilPalm Oil Maj Spike 100ppb Zn
-1.30 -1.20 -1.10 -1.00 -0.90 -0.80
U (V)
10.0n
20.0n
30.0n
40.0n
50.0n
60.0n
I (A
)
Zinc
-1.00e-5 0 1.00e-5 2.00e-5 3.00e-5
c (g/L)
0
10.0n
20.0n
30.0n
40.0n
I (A
)
-1.3e-005
Zinc
c = 280.463 ug/L
+/- 14.152 ug/L (5.05%)

========= METROHM 797 VA COMPUTRACE (Version 1.2) (Serial No. 3158)
===========
Determination : Sunflower Maj Pb,Cd.dth
Sample ID : Sunflower Maj Pb Cd
Creator determ.: Date : 2009-12-30 Time: 13:21:29
Modified by : Date : 2010-01-21 Time: 21:04:06
--------------------------------------------------------------------------------
Method : Determination of Cd and Pb in edible Oil with Acetate buffer
Title : Determination of Pb and Cd in edible Oil
Remark1 : Sample (0.50 smpl + 10ml UPW)+0.25ml Acetate buffer
Remark2 : Deposition time 30s,
--------------------------------------------------------------------------------
Sample amount : 0.500 mL
Cell volume : 10.350 mL
--------------------------------------------------------------------------------
Substance : Cadmium
Conc. : 1.000 mg/L
Conc.dev. : ---
Add.amount : 100.000 ul
VR V nA I.mean Std.Dev. I.delta Comments
----- ------ ------ ------ -------- -------- ----------------------
1 - 1 -0.704 1.15 1.00 0.218 0.00
1 - 2 -0.698 0.84
2 - 1 -0.698 12.23 10.49 --- 9.49
2 - 2 -0.698 10.49
3 - 1 -0.698 17.71 17.42 0.416 6.93
3 - 2 -0.698 17.13
4 - 1 -0.698 24.24 23.74 0.698 6.33
4 - 2 -0.698 23.25
Substance : Lead
Conc. : 1.000 mg/L
Conc.dev. : ---
Add.amount : 100.000 ul
VR V nA I.mean Std.Dev. I.delta Comments
----- ------ ------ ------ -------- -------- ----------------------
1 - 1 -0.477 9.82 9.13 0.986 0.00
1 - 2 -0.477 8.43
2 - 1 -0.477 23.79 21.60 --- 12.48
2 - 2 -0.477 21.60
3 - 1 -0.477 35.96 33.95 2.840 12.35
3 - 2 -0.477 31.94
4 - 1 -0.477 45.39 42.09 4.670 8.14
4 - 2 -0.477 38.79

Solutions
--------------------------------------------------------------------------------
No. Content Predose (mL)
--- ------------------------------------------------ ------------
1 Standard For Cd and Pb -------
Final results +/- Res. dev. % Comments
----------------------------------- ------------------ -------------------
Cadmium:
default = 42.374 ug/L 15.347 36.217
Lead :
default = 156.246 ug/L 19.955 12.771
Determination of Pb and Cd in edible OilSunflower Maj Pb Cd
-0.90 -0.80 -0.70 -0.60 -0.50 -0.40 -0.30
U (V)
10.0n
20.0n
30.0n
40.0n
50.0n
I (A
) Cadmium
Lead

0 1.00e-5 2.00e-5 3.00e-5
c (g/L)
0
5.00n
10.0n
15.0n
20.0n
25.0n
I (A
)
-2e-006
Cadmium
c = 42.374 ug/L
+/- 15.347 ug/L (36.22%)
-1.00e-5 0 1.00e-5 2.00e-5 3.00e-5
c (g/L)
0
10.0n
20.0n
30.0n
40.0n
I (A
)
-7.5e-006
Lead
c = 156.246 ug/L
+/- 19.955 ug/L (12.77%)

========= METROHM 797 VA COMPUTRACE (Version 1.2) (Serial No. 3158)
===========
Determination : Sunflower Maj Ni.dth
Sample ID : Sunflower Maj Ni
Creator determ.: Date : 2009-12-30 Time: 14:07:03
Modified by : Date : 2010-01-21 Time: 21:46:13
--------------------------------------------------------------------------------
Method : Ni Determination in Edible Oil (continous method).mth
Title : Ni Determination in Edible Oil
Remark1 : Sample 0.5ml Samp+ 1.0ml NH4Cl Buffer + 0.1ml DMG
Remark2 : deposition time 5s, total volume 14.75
--------------------------------------------------------------------------------
Sample amount : 0.500 mL
Cell volume : 14.750 mL
--------------------------------------------------------------------------------
Substance : Nickel
Conc. : 1.000 mg/L
Conc.dev. :
Add.amount : 100.000 ul
VR V nA I.mean Std.Dev. I.delta Comments
----- ------ ------ ------ -------- -------- ----------------------
1 - 1 -0.970 -57.4 -57.7 0.450 0.0
1 - 2 -0.970 -58.0
2 - 1 -0.970 -97.7 -96.6 1.643 -38.8
2 - 2 -0.970 -95.4
3 - 1 -0.970 -135.9 -136.1 0.328 -39.6
3 - 2 -0.970 -136.3
4 - 1 -0.970 -168.3 -166.4 2.681 -30.3
4 - 2 -0.970 -164.5
Solutions
--------------------------------------------------------------------------------
No. Content Predose (mL)
--- ------------------------------------------------ ------------
Final results +/- Res. dev. % Comments
----------------------------------- ------------------ -------------------
Nickel:
default = 300.222 ug/L 9.340 3.111

Ni Determination in Edible OilSunflower Maj Ni
-0.80 -0.90 -1.00 -1.10
U (V)
-50.0n
-100n
-150n
-200n
I (A
)
Nickel
-1.00e-5 0 1.00e-5 2.00e-5
c (g/L)
0
-50.0n
-100n
-150n
I (A
)
-1.2e-005
Nickel
c = 300.222 ug/L
+/- 9.340 ug/L (3.11%)

========= METROHM 797 VA COMPUTRACE (Version 1.2) (Serial No. 3158)
===========
Determination : Sunflower Maj Zn .dth
Sample ID : Sunflower Maj Zn
Creator determ.: Date : 2009-12-30 Time: 13:46:41
Modified by : Date : 2010-01-21 Time: 21:15:18
--------------------------------------------------------------------------------
Method : Determination of Zn in edible Oil (Continous).mth
Title : Determination of Zn in edible Oil
Remark1 : Sample (0.50 smpl continous from previous Cd pb)
Remark2 : Deposition time 90s, total volume 10.65
--------------------------------------------------------------------------------
Sample amount : 0.500 mL
Cell volume : 10.650 mL
--------------------------------------------------------------------------------
Substance : Zinc
Conc. : 1.000 mg/L
Conc.dev. :
Add.amount : 250.00 ul
VR V nA I.mean Std.Dev. I.delta Comments
----- ------ ------ ------ -------- -------- ----------------------
1 - 1 -1.010 8.52 8.85 --- 0.00
1 - 2 -1.010 8.85
2 - 1 -1.004 32.99 32.04 1.344 23.19
2 - 2 -1.004 31.09
3 - 1 -1.010 54.14 53.11 1.454 21.07
3 - 2 -1.004 52.08
4 - 1 -1.004 72.18 72.10 0.111 18.99
4 - 2 -1.004 72.02
Solutions
--------------------------------------------------------------------------------
No. Content Predose (mL)
--- ------------------------------------------------ ------------
Final results +/- Res. dev. % Comments
----------------------------------- ------------------ -------------------
Zinc:
default = 192.074 ug/L 8.010 4.170

Determination of Zn in edible OilSunflower Maj Zn
-1.30 -1.20 -1.10 -1.00 -0.90 -0.80
U (V)
20.0n
40.0n
60.0n
80.0n
I (A
)
Zinc
-2.00e-5 0 2.00e-5 4.00e-5 6.00e-5
c (g/L)
0
20.0n
40.0n
60.0n
I (A
)
-9.3e-006
Zinc
c = 192.074 ug/L
+/- 8.010 ug/L (4.17%)

========== METROHM 797 VA COMPUTRACE (Version 1.2) (Serial No. 3158)
===========
Determination :Sunflower Oil Cd Pb.dth
Sample ID : Sunflower Oil Cd Pb
Creator determ.: Date : 2009-12-24 Time: 11:20:36
Modified by : Date : 2010-01-22 Time: 14:57:09
--------------------------------------------------------------------------------
Method : Determination of Cd and Pb in edible Oil with Acetate buffer
Title : Determination of Pb and Cd in edible Oil
Remark1 : Sample (0.50 smpl + 10ml UPW)+0.25ml Acetate buffer
Remark2 : Deposition time 30s,
--------------------------------------------------------------------------------
Sample amount : 0.500 mL
Cell volume : 10.350 mL
--------------------------------------------------------------------------------
Substance : Cadmium
Conc. : 1.000 mg/L
Conc.dev. : ---
Add.amount : 100.000 ul
VR V nA I.mean Std.Dev. I.delta Comments
----- ------ ------ ------ -------- -------- ----------------------
1 - 1 -0.702 9.67 9.48 0.293 0.00
1 - 2 -0.684 9.14
1 - 3 -0.702 9.63
2 - 1 -0.661 21.16 21.82 1.368 12.34
2 - 2 -0.661 20.86
2 - 3 -0.667 22.79
3 - 1 -0.661 29.18 30.56 1.940 8.73
3 - 2 -0.667 31.93
3 - 3 -0.672 34.09
Substance : Lead
Conc. : 1.000 mg/L
Conc.dev. : ---
Add.amount : 100.000 ul
VR V nA I.mean Std.Dev. I.delta Comments
----- ------ ------ ------ -------- -------- ----------------------
1 - 1 -0.458 2.77 2.67 0.133 0.00
1 - 2 -0.458 2.58
1 - 3 --- ---
2 - 1 -0.452 8.28 8.70 0.406 6.03
2 - 2 -0.452 8.42
2 - 3 -0.452 8.99
3 - 1 -0.446 15.23 16.69 2.068 7.99

3 - 2 -0.446 18.15
3 - 3 -0.452 19.42
Solutions
--------------------------------------------------------------------------------
No. Content Predose (mL)
--- ------------------------------------------------ ------------
Final results +/- Res. dev. % Comments
----------------------------------- ------------------ -------------------
Cadmium:
default = 173.065 ug/L 14.831 8.569
Lead :
default = 65.663 ug/L 17.678 26.923
Determination of Pb and Cd in edible OilSunflower Oil Cd Pb
-0.80 -0.60 -0.40
U (V)
20.0n
40.0n
60.0n
I (A
)
Cadmium
Lead
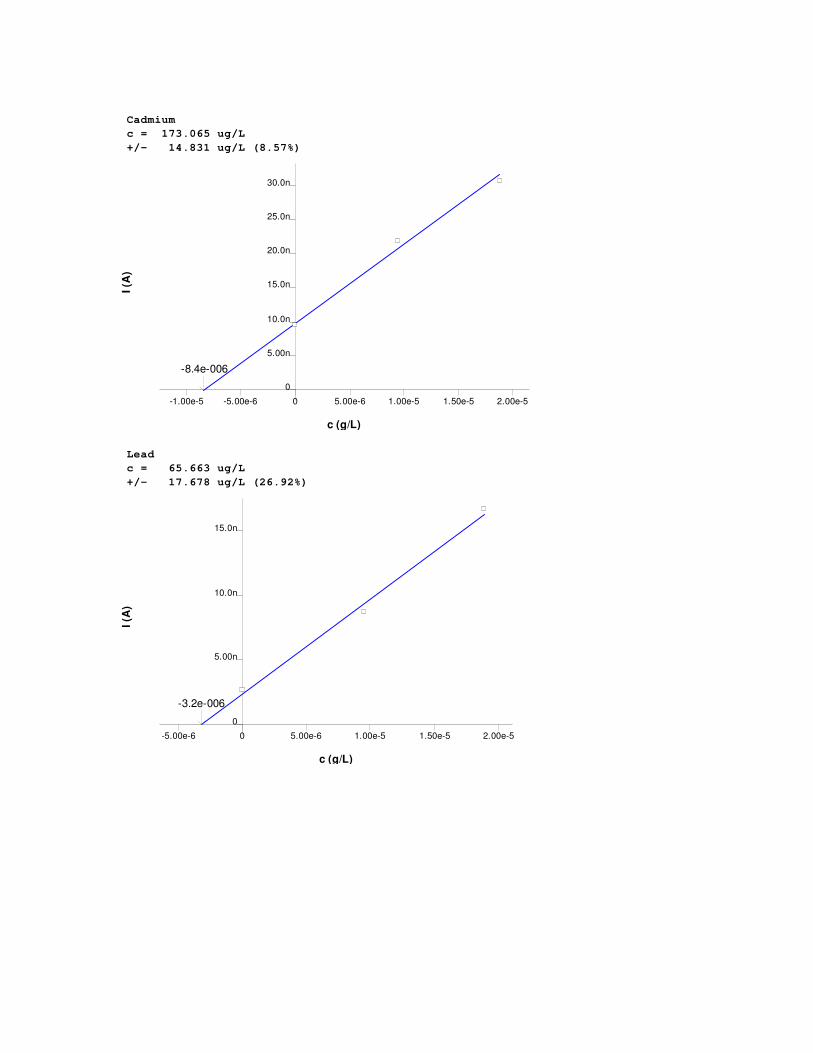
-1.00e-5 -5.00e-6 0 5.00e-6 1.00e-5 1.50e-5 2.00e-5
c (g/L)
0
5.00n
10.0n
15.0n
20.0n
25.0n
30.0n
I (A
)
-8.4e-006
Cadmium
c = 173.065 ug/L
+/- 14.831 ug/L (8.57%)
-5.00e-6 0 5.00e-6 1.00e-5 1.50e-5 2.00e-5
c (g/L)
0
5.00n
10.0n
15.0n
I (A
)
-3.2e-006
Lead
c = 65.663 ug/L
+/- 17.678 ug/L (26.92%)

========== METROHM 797 VA COMPUTRACE (Version 1.2) (Serial No. 3158)
===========
Determination : Sunflower Oil Ni.dth
Sample ID : Sunflower Oil Ni
Creator determ.: Date : 2009-12-24 Time: 12.02.03
Modified by : Date : 2010-01-22 Time: 15:31:30
--------------------------------------------------------------------------------
Method : Ni Determination in Edible Oil (continous method).mth
Title : Ni Determination in Edible Oil
Remark1 : sample 0.5ml Samp+ 1.0ml NH4Cl Buffer + 0.1ml DMG
Remark2 : deposition time 5s, Total Volume 11.400ml
--------------------------------------------------------------------------------
Sample amount : 0.500 mL
Cell volume : 11.400 mL
--------------------------------------------------------------------------------
Substance : Nickel
Conc. : 1.000 mg/L
Conc.dev. :
Add.amount : 30.000 ul
VR V nA I.mean Std.Dev. I.delta Comments
----- ------ ------ ------ -------- -------- ----------------------
1 - 1 -1.022 -9.82 -9.95 0.428 0.00
1 - 2 -1.022 -9.61
1 - 3 -1.022 -10.43
2 - 1 -1.038 -18.85 -19.56 1.675 -9.61
2 - 2 -1.038 -21.48
2 - 3 -1.038 -18.36
3 - 1 -1.038 -28.96 -29.27 0.740 -9.71
3 - 2 -1.038 -30.12
3 - 3 -1.038 -28.74
Solutions
--------------------------------------------------------------------------------
No. Content Predose (mL)
--- ------------------------------------------------ ------------
Final results +/- Res. dev. % Comments
----------------------------------- ------------------ -------------------
Nickel:
default = 61.381 ug/L 3.695 6.020

Ni Determination in Edible OilSunflower Oil Ni
-0.80 -0.90 -1.00 -1.10
U (V)
-10.0n
-20.0n
-30.0n
-40.0n
I (A
)
Nickel
-2.00e-6 0 2.00e-6 4.00e-6 6.00e-6
c (g/L)
0
-5.00n
-10.0n
-15.0n
-20.0n
-25.0n
-30.0n
I (A
)
-2.7e-006
Nickel
c = 61.381 ug/L
+/- 3.695 ug/L (6.02%)

========= METROHM 797 VA COMPUTRACE (Version 1.2) (Serial No. 3158)
===========
Determination : Sunflower Oil Zn .dth
Sample ID : Sunflower Oil Zn
Creator determ.: Date : 2010-01-18 Time: 11:49:23
Modified by : Date : 2010-01-22 Time: 15:19:52
--------------------------------------------------------------------------------
Method : Determination of Zn in edible Oil (Continous).mth
Title : Determination of Zn in edible Oil
Remark1 : Sample (0.50 smpl + 10ml UPW)+0.25ml Acetate buffer
Remark2 : Deposition time 90s, total volume 10.35 - repeat
--------------------------------------------------------------------------------
Sample amount : 0.500 mL
Cell volume : 10.35 mL
--------------------------------------------------------------------------------
Substance : Zinc
Conc. : 1.000 mg/L
Conc.dev. :
Add.amount : 250.00 ul
VR V nA I.mean Std.Dev. I.delta Comments
----- ------ ------ ------ -------- -------- ----------------------
1 - 1 -1.004 18.49 19.43 1.332 0.00
1 - 2 -1.004 20.37
2 - 1 -1.004 39.45 41.23 2.510 21.79
2 - 2 -1.004 43.00
3 - 1 --- --- 63.89 --- 22.66
3 - 2 -1.004 63.89
4 - 1 -1.004 77.60 79.61 2.850 15.72
4 - 2 -1.004 81.63
Solutions
--------------------------------------------------------------------------------
No. Content Predose (mL)
--- ------------------------------------------------ ------------
Final results +/- Res. dev. % Comments
----------------------------------- ------------------ -------------------
Zinc:
default = 429.058 ug/L 25.247 5.884

Determination of Zn in edible OilSunflower Oil Zn
-1.30 -1.20 -1.10 -1.00 -0.90 -0.80
U (V)
20.0n
40.0n
60.0n
80.0n
100n
I (A
)
Zinc
-2.00e-5 0 2.00e-5 4.00e-5 6.00e-5
c (g/L)
0
20.0n
40.0n
60.0n
80.0n
I (A
)
-2.1e-005
Zinc
c = 429.058 ug/L
+/- 25.247 ug/L (5.88%)