ng, w.j, chin, c.w., junaidah, j, and mohd nasruddin …isopb.mpob.gov.my/pdffile/2nd/paper 4 ng w j...
TRANSCRIPT

Ng, W.J, Chin, C.W., Junaidah, J, and
Mohd Nasruddin Mohd
IntroductionIntroduction
Deli dura descended fromfour palms introduced to Bogor in 1848
Female parental palms are basically Deli dura and male parental palms are mainly Yangambi and AVROS pisifera
Oil yield has reached a plateau (Hardon,2000; Stringfellow,2000)
Necessary to enhance the basic population by adding new materials

Create genotypes with the maximum potential for Oil and Kernel production per unit area
Introduction of the NPM by the MPOB
Broadening the genetic base of FELDA’sbreeding population
Breeding Breeding programmesprogrammes involving elite involving elite NPM gave interesting crosses (Chin NPM gave interesting crosses (Chin et et alal., 1999)., 1999)

DELI DURA X NIGERIAN DURA CROSSES
Progeny Pedigree PeriodMean Mean Mean OilBunch Bunch FFB Yield
No. Wt (kg) (kg) (t/ha)
C2 CCP 29 x 9747 7/93 - 12/97 17.0 9.8 167.1 4.67
GKN CCP 29 x 9747 1/95 - 12/97 17.2 12.5 216.7 6.23
C6 CBP 28 x 13481 7/93 - 12/97 17.0 9.7 164.2 4.7
C39 CDN 53 x 13481 10/95 - 12/97 18.8 10.2 192.4 6.5
J4 ARO 127 x 13481 10/95 - 12/97 19.3 9.7 187.5 5.54
N1 ARK 27 x 13481 1/98 - 12/01 13.0 15.7 203.4 6.29
Materials and MethodsMaterials and Methods
Materials and MethodsMaterials and Methods
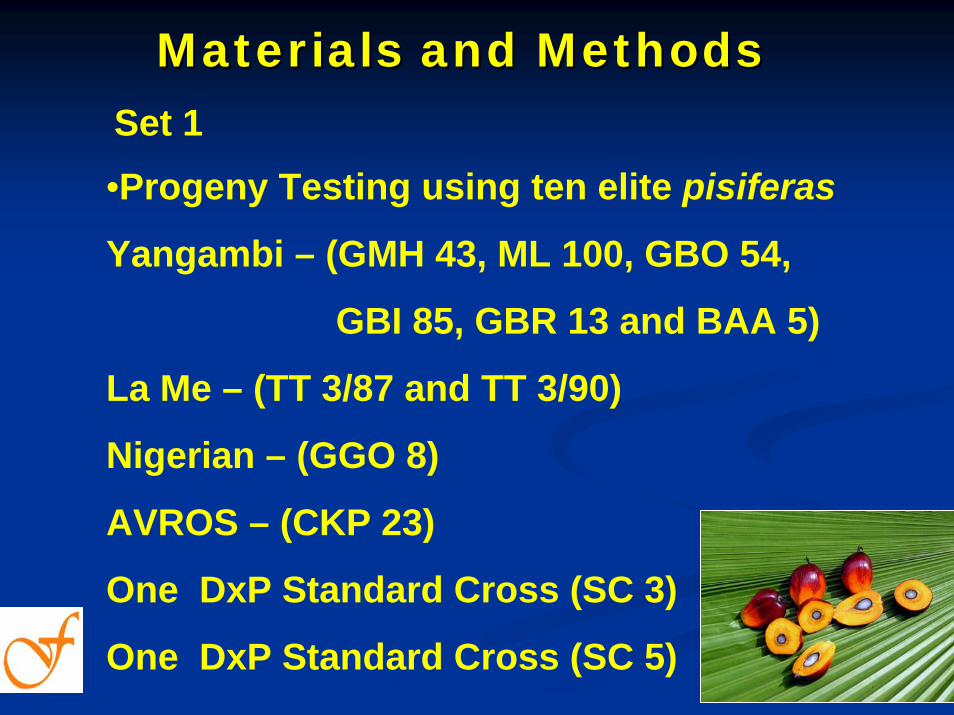
•Progeny Testing using ten elite pisiferas
Yangambi – (GMH 43, ML 100, GBO 54,
GBI 85, GBR 13 and BAA 5)
La Me – (TT 3/87 and TT 3/90)
Nigerian – (GGO 8)
AVROS – (CKP 23)
One DxP Standard Cross (SC 3)
One DxP Standard Cross (SC 5)
Set 1

Planted : June 1999 at Kota Gelanggi Block 7 (2&3) as Trials 14,15 and 16 -4 replications
-Katong Series Soil
-RCBD
-Yield record (January 2002 to December 2005)

Materials and MethodsMaterials and Methods
•Progeny Testing using nine elite pisiferas
Yangambi – (GMH 43, ML 100, BAA 5 and GBI 85)
La Me - (TT 23/3 and TT 3/90)
Nigerian – (GGO and GKF 28)
AVROS – (CKP 23)
One Standard Cross (SC 5)
Set 2

Planted : December 1999 PPPTR 5AR as Trial 4
-3 replications
-Munchong Series Soil
-RCBD
-Yield record (July 2002 to December 2005)
Results and Discussion

Date Planted : June 1999 Location : Block 7 (2&3) Kota Gelanggi 06 Materials : DxP Statistical Design : 5x5 Balanced Lattice No of Reps : 4
NO PROGENY FEM MALE OY1 TEP1tha-1 tha-1
1 DQ 20 E22/58 x CKP 23 157.10 ghji 16.35 g 6.07 ghijk 6.86 efgh2 DQ 47 N1/25 x CKP 23 134.38 m 13.85 i 4.98 o 5.55 m3 DQ 21 FPF 70 x GBI 85 143.50 kl 14.98 h 5.59 klmn 5.90 lm4 DQ 23 GQL 26 x GBI 85 162.07 fghi 17.59 ef 6.15 ghij 6.64 ghi5 DQ 4 FPF 70 x GBO 54 143.80 kl 15.82 gh 5.43 no 5.82 lm6 DQ 35 C2/79 x GGO 8 151.12 jk 16.48 g 5.84 ijklmn 6.51 hijk7 DQ 73 N1/78 x GGO 8 150.59 jk 16.33 g 5.92 hijklmn 6.53 ghijk8 DQ 10 GKN 53 x GMH 43 200.89 a 21.93 a 8.51 a 9.17 a9 DQ 25 J4/47 x GMH 43 176.30 cd 19.60 bc 6.83 de 7.44 cd
10 DQ 26 GGM 46 x GMH 43 164.32 efgh 18.97 cd 5.55 lmn 6.31 ijkl11 DQ 34 C2/73 x GMH 43 191.45 b 21.91 a 7.70 c 8.35 b12 DQ 45 C6/10 x GMH 43 159.46 fghij 17.42 f 6.00 ghijk 6.56 ghij13 DQ 6 GGN 14 x GMH 43 195.60 ab 21.89 a 7.77 bc 8.57 b14 DQ 64 C39/12 x GMH 43 177.09 cd 19.68 bc 7.00 d 7.56 c15 DQ 69 N1/78 x GMH 43 195.21 ab 21.63 a 8.23 ab 8.74 ab16 DQ 11 C39/12 x ML 100 140.63 lm 15.10 h 5.66 jklmn 6.23 jkl17 DQ 12 GKE 18 x ML 100 168.10 def 17.73 ef 6.55 defg 7.44 cde18 DQ 5 GKN 12 x ML 100 165.55 efg 17.58 ef 6.77 def 7.38 cdef19 DQ 36 GKE 18 x TT3/87 173.39 cde 19.14 cd 5.97 hijkl 6.85 fghi20 DQ 50 C39/12 x TT3/87 165.35 efg 18.51 de 6.05 hijkl 6.80 ghi21 DQ 53 L15/536 x TT3/87 176.41 cd 19.62 bc 6.21 ghi 6.96 defgh22 DQ 57 GKN 32 x TT3/90 181.81 c 20.21 b 6.41 efgh 7.08 cdefg23 DQ 67 C2/79 x TT3/90 175.56 cd 19.37 bcd 6.24 fghi 6.86 defgh24 SC 3** CDN 61 x CEO 10 154.90 ij 16.35 g 5.47 mno 6.22 jkl25 SC 5** CDN 95 x CEN 118 155.74 hij 16.78 fg 5.53 lmn 6.05 klm
MEAN (1-25) 166.40 18.19 6.34 6.97SE 0.78 0.09 0.09 0.10CV 17.37 18.31 14.98 14.17LSD ( P ≤ 0.05) 8.20 0.87 0.56 0.51
Notes : Mean with the same letter in the same column are not statistically significant by Duncan Multiple Range test**SC : Standard CrossLetters in bold indicated minimum and maximum values
kg/p/yr no/p/yr
Table 1 : Progeny Mean for Selected Traits in Trial 14
MEAN 2002 - 2005FFB BNO

Date Planted : June 1999 Location : Block 7 (2&3) Kota Gelanggi 06 Materials : DxP Statistical Design : 4x4 Balanced Latttice No of Reps : 4
NO PROGENY FEM MALE OY1 TEP1t/ha-1 t/ha-1
1 DQ 13 GKE 14 x BAA 5 159.43 efg 16.89 ef 6.43 bcde 7.09 bcd2 DQ 60 GQL 26 x GBR 13 166.51 def 18.21 cd 6.28 cde 6.81 cdef3 DQ 38 C2/1 x GGO 8 156.07 g 17.06 e 5.82 ef 6.65 defg4 DQ 46 N1/74 x GGO 8 127.94 i 13.53 h 4.89 h 5.37 i5 DQ 2 C2/42 x GMH 43 182.13 a 20.02 a 7.37 a 8.05 a6 DQ 24 C6/16 x GMH 43 177.93 ab 18.91 bc 6.98 ab 7.61 ab7 DQ 68 GKF 12 x GMH 43 179.90 ab 19.51 ab 6.64 bc 7.43 abc8 DQ 70 GGM 11 x GMH 43 171.91 bcd 18.52 bcd 6.60 bcd 7.27 bcd9 DQ 16 C2/27 x ML 100 175.49 abcd 19.00 bc 6.37 bcde 6.97 bcd
10 DQ 28 GKE 14 x ML 100 166.85 def 17.79 de 6.74 abc 7.40 abc11 DQ 3 GKN 16 x ML 100 168.31 cde 18.30 cd 5.92 ef 6.65 defg12 DQ 30 B36/36 x ML 100 152.35 g 16.08 f 5.78 ef 6.59 defg13 DQ 43 N1/25 x TT3/87 158.52 fg 17.22 e 5.01 hg 5.62 hi14 DQ 58 GGN 38 x TT3/87 176.38 abc 19.13 abc 5.96 def 6.87 bcde15 DQ 9 C39/3 x TT3/90 160.22 efg 16.96 ef 5.55 fg 6.12 efgh16 SC 3** CDN 61 x CEO 10 154.97 cd 16.35 ef 5.47 fgh 6.22 efgh17 SC 5** CDN 95 x CEN 118 155.74 cd 16.78 ef 5.53 fg 6.05 ghi
MEAN (1-17) 164.15 17.70 6.08 6.75SE 0.88 0.10 0.09 0.10CV 16.34 16.88 12.79 12.27LSD ( P ≤ 0.05) 8.22 0.90 0.5863 0.6531
Notes : Mean with the same letter in the same column are not statistically significant by Duncan Multiple Range test**SC : Standard CrossLetters in bold indicated minimum and maximum values
kg/p/yr no/p/yr
Table 2 : Progeny Mean for Selected Traits in Trial 15
MEAN 2002 - 2005FFB BNO

Date Planted : June 1999 Location : Block 7 (2&3) Kota Gelanggi 06 Materials : DxP Statistical Design : 3x3 Balanced Lattice No of Reps : 4
NO PROGENY FEM MALE OY1 TEP1tha-1 tha-1
1 DQ 1 GQL 2 x CKP 23 159.16 e 17.15 d 5.70 cd 6.31 cde2 DQ 66 GQL 2 x GBO 54 177.40 bc 19.33 b 6.63 b 7.24 b3 DQ 48 C2/97 x GGO 8 159.52 e 16.66 d 5.46 d 6.27 cde4 DQ 22 C6/39 x GMH 43 184.05 b 19.87 b 7.39 a 8.07 a5 DQ 7 C2/16 x GMH 43 196.08 a 21.23 a 7.53 a 8.09 a6 DQ 15 C39/10 x ML 100 140.89 f 13.96 e 5.38 d 5.93 e7 DQ 49 C2/4 x ML 100 165.64 de 17.18 d 6.10 bc 6.72 bcd8 DQ 71 GKN 53 x ML 100 169.20 cd 18.31 c 6.14 cb 6.89 bc9 DQ 41 C39/8 x TT3/90 156.33 e 16.91 d 5.63 cd 6.32 cde
10 SC 3 CDN 61 x CEO 10 154.90 de 16.35 d 5.48 d 6.22 cde11 SC 5 CDN 95 x CEN 118 155.70 de 16.78 d 5.54 d 6.05 de
MEAN (11) 165.35 17.61 6.08 6.74SE 2.64 0.14 0.12 0.12CV 10.61 18.78 13.50 12.30LSD ( P ≤ 0.05) 15.08 0.94 0.56 0.62
Notes : Mean with the same letter in the same column are not statistically significant by Duncan Multiple Range test**SC : Standard CrossLetters in bold indicated minimum and maximum values
kg/p/yr no/p/yr
Table 3 : Progeny Mean for Selected Traits in Trial 16
MEAN 2002 - 2005FFB BNO

Dura Pisifera No. of Mean Yield Bunch Oil TEPGrouping prog. Yield Number Yield over
Code (% Over SC 3) (% Over SC 3) (% Over SC 3) (% SC 3)C 2/GKN GMH 43 4 125 130 143 135
(Deli-NPM) (Yangambi) (118-130) (122-134) (135-156) (129-147)
C 6 GMH 43 3 112 115 124 119(Deli-NPM) (Yangambi) (103-119) (107-122) (110-135) (105-130)
J 4 GMH 43 1 114 120 125 120(Deli-NPM) (Yangambi)
N 1 GMH 43 1 126 132 151 140(Deli-NPM) (Yangambi)
C 39 GMH 43 1 114 120 128 122(Deli-NPM) (Yangambi)
GGM GMH 43 2 109 115 111 104(NPM) (Yangambi) (106-111) (113-116) (101-121) (101-117)
GGN GMH 43 1 126 134 142 138(NPM) (Yangambi)
(Trials 14,15 and 16
Deli-NPM Dura or NPM Dura x Yangambi Over SC 3
Dura Pisifera No. of Mean Yield Bunch Oil TEPGrouping prog. Yield Number Yield over
Code (% Over SC 3) (% Over SC 3) ( % Over SC 3) (% SC 3)
DxP (Yangambi) (Standard Cross) 100 100 100 100(SC 3) (20.9 t/ha) (16.4) (5.47 t/ha) (6.22 t/ha)

Dura Pisifera No. of Mean Yield Bunch Oil TEPGrouping prog. Yield Number Yield over
Code (% Over SC 3) (% Over SC 3) (% Over SC 3) (% SC 3)
C 2/GKN ML 100 5 109 111 114 111(Deli-NPM) (Yangambi) (107-113) (108-116) (108-124) (107-119)
C 39 ML 100 2 91 89 101 98(Deli-NPM) (Yangambi) (91-91) (85-92) (98-104) (95-100)
GKE ML 100 2 109 109 122 120(NPM) (Yangambi) (108-109) (108-109) (120-123) (119-120)
Dura Pisifera No. of Mean Yield Bunch Oil TEPGrouping prog. Yield Number Yield over
Code (% Over SC 3) (% Over SC 3) (% Over SC 3) (% SC 3)
GKE BAA 5 1 103 103 118 114(NPM) (Yangambi)
Deli-NPM Dura or NPM Dura x Yangambi
Dura Pisifera No. of Mean Yield Bunch Oil TEPGrouping prog. Yield Number Yield over
Code (% Over SC 3) (% Over SC 3) ( % Over SC 3) (% SC 3)
DxP (Yangambi) (Standard Cross) 100 100 100 100(SC 3) (20.9 t/ha) (16.4) (5.47 t/ha) (6.22 t/ha)
Dura Pisifera No. of Mean Yield Bunch Oil TEPGrouping prog. Yield Number Yield over
Code (% Over SC 3) (% Over SC 3) ( % Over SC 3) (% SC 3)
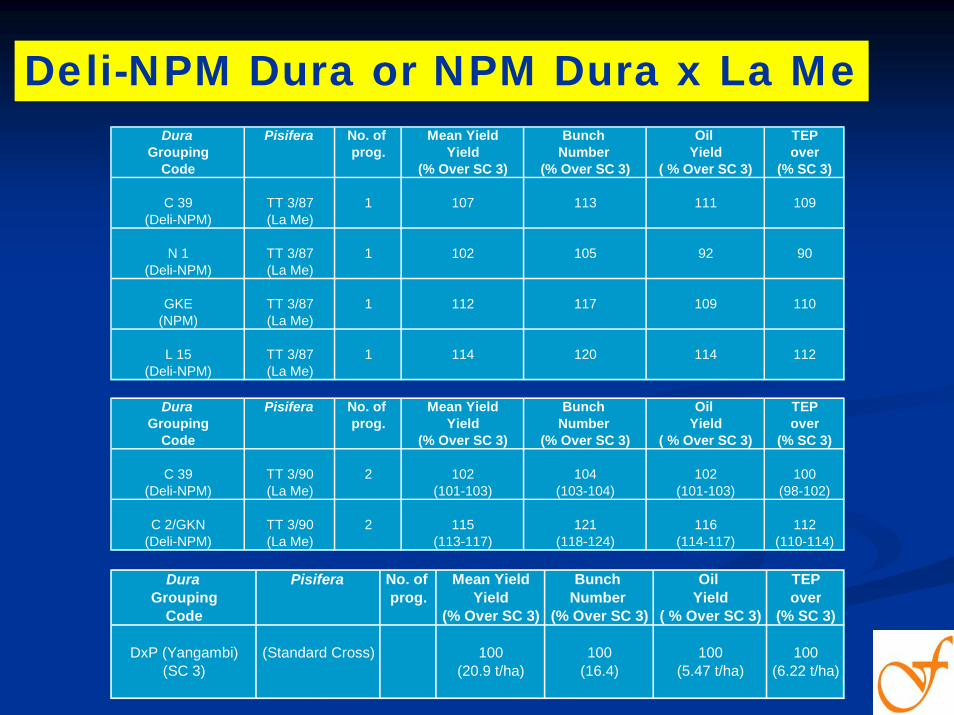
C 39 TT 3/87 1 107 113 111 109(Deli-NPM) (La Me)
N 1 TT 3/87 1 102 105 92 90(Deli-NPM) (La Me)
GKE TT 3/87 1 112 117 109 110(NPM) (La Me)
L 15 TT 3/87 1 114 120 114 112(Deli-NPM) (La Me)
Dura Pisifera No. of Mean Yield Bunch Oil TEPGrouping prog. Yield Number Yield over
Code (% Over SC 3) (% Over SC 3) ( % Over SC 3) (% SC 3)
C 39 TT 3/90 2 102 104 102 100(Deli-NPM) (La Me) (101-103) (103-104) (101-103) (98-102)
C 2/GKN TT 3/90 2 115 121 116 112(Deli-NPM) (La Me) (113-117) (118-124) (114-117) (110-114)
Deli-NPM Dura or NPM Dura x La Me
Dura Pisifera No. of Mean Yield Bunch Oil TEPGrouping prog. Yield Number Yield over
Code (% Over SC 3) (% Over SC 3) ( % Over SC 3) (% SC 3)
DxP (Yangambi) (Standard Cross) 100 100 100 100(SC 3) (20.9 t/ha) (16.4) (5.47 t/ha) (6.22 t/ha)
Dura Pisifera No. of Mean Yield Bunch Oil TEPGrouping prog. Yield Number Yield over
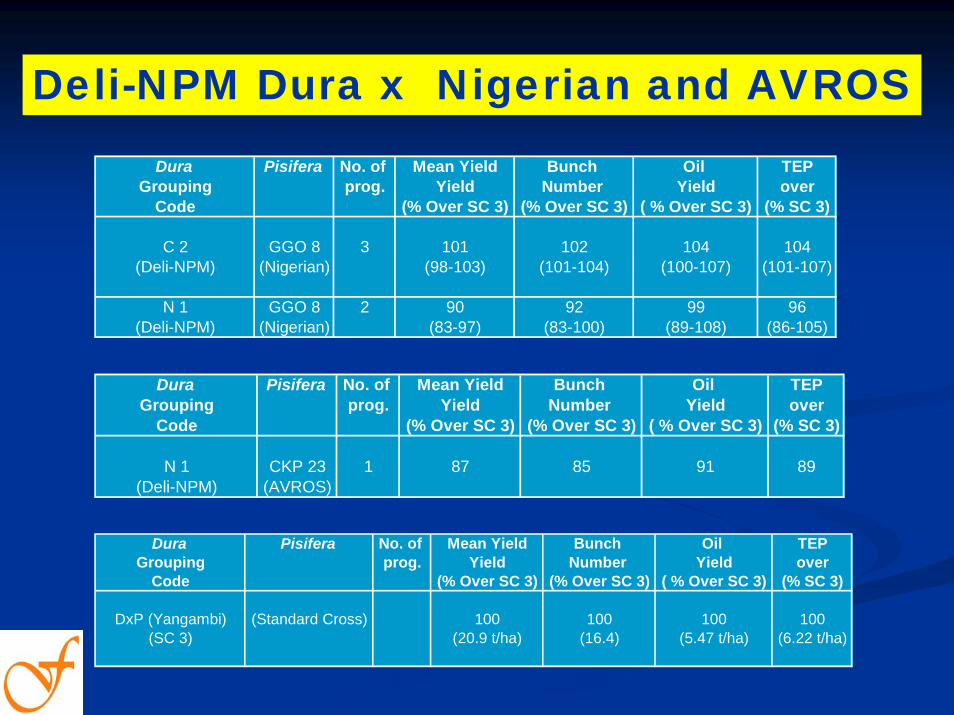
Code (% Over SC 3) (% Over SC 3) ( % Over SC 3) (% SC 3)
C 2 GGO 8 3 101 102 104 104(Deli-NPM) (Nigerian) (98-103) (101-104) (100-107) (101-107)
N 1 GGO 8 2 90 92 99 96(Deli-NPM) (Nigerian) (83-97) (83-100) (89-108) (86-105)
Dura Pisifera No. of Mean Yield Bunch Oil TEPGrouping prog. Yield Number Yield over
Code (% Over SC 3) (% Over SC 3) ( % Over SC 3) (% SC 3)
N 1 CKP 23 1 87 85 91 89(Deli-NPM) (AVROS)
Deli-NPM Dura x Nigerian and AVROS
Dura Pisifera No. of Mean Yield Bunch Oil TEPGrouping prog. Yield Number Yield over
Code (% Over SC 3) (% Over SC 3) ( % Over SC 3) (% SC 3)
DxP (Yangambi) (Standard Cross) 100 100 100 100(SC 3) (20.9 t/ha) (16.4) (5.47 t/ha) (6.22 t/ha)

Relative Performance of Major Group For FFB, Bunch Number, Oil Yield and TEP Over 3 Trials (14, 15 and 16)
Dura Pisifera No. of Mean Yield Bunch Oil TEPGrouping prog. Yield Number Yield
Code (% SC 5) (% Over SC 5) ( % Over SC 5) (% over SC 5)
C 2/GKN GMH 43 4 124 127 141 139(Deli-NPM) (Yangambi) (117-129) (119-131) (133-154) (133-151)
N 1 GMH 43 1 125 129 149 144(Deli-NPM) (Yangambi)
GGN GMH 43 1 126 130 140 142(NPM) (Yangambi)
J 4 GMH 43 1 113 117 124 123(Deli-NPM) (Yangambi)
C 39 GMH 43 1 114 117 127 125(Deli-NPM) (Yangambi)
C 6 GMH 43 3 111 112 123 122(Deli-NPM) (Yangambi) (102-118) (104-118) (108-134) (108-133)
GKF GMH 43 1 116 116 120 123(NPM) (Yangambi)
GGM GMH 43 2 108 112 110 112(NPM) (Yangambi) (106-110) (110-113) (100-119) (104-120)
B 36 ML 100 1 98 96 104 109(Yangambi-NPM) (Yangambi)
C 2/GKN ML 100 5 108 108 113 114(Deli-NPM) (Yangambi) (106-113) (102-113) (110-122) (110-122)
C 39 ML 100 2 90 87 100 101(Deli-NPM) (Yangambi) (90-90) (83-90) (97-102) (98-103)
GKE ML 100 2 108 106 120 123(NPM) (Yangambi) (107-108) (106-106) (118-122) (122-123)
GKE BAA 5 1 102 101 116 117(NPM) (Yangambi)
[(Figures Are Results Expressed As Percentage Of The DxP (La Me) Standard Cross (SC 5)]Deli-NPM Dura or NPM Dura x Yangambi Over SC 5
Dura Pisifera No. of Mean Yield Bunch Oil TEPGrouping prog. Yield Number Yield
Code (% SC 5) (% Over SC 5) ( % Over SC 5) (% over SC 5)
DxP (La Me) (Standard Cross) 100 100 100 100(SC 5) (21.0 t/ha) (16.8) (5.53 t/ha) (6.05 t/ha)
Dura Pisifera No. of Mean Yield Bunch Oil TEPGrouping prog. Yield Number Yield
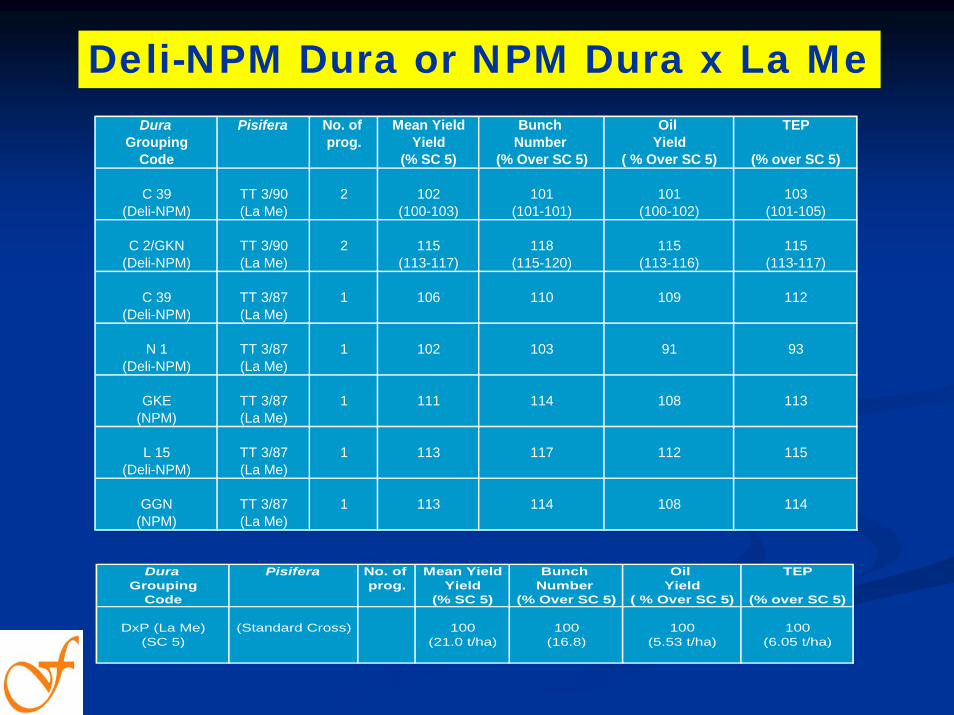
Code (% SC 5) (% Over SC 5) ( % Over SC 5) (% over SC 5)
C 39 TT 3/90 2 102 101 101 103(Deli-NPM) (La Me) (100-103) (101-101) (100-102) (101-105)
C 2/GKN TT 3/90 2 115 118 115 115(Deli-NPM) (La Me) (113-117) (115-120) (113-116) (113-117)
C 39 TT 3/87 1 106 110 109 112(Deli-NPM) (La Me)
N 1 TT 3/87 1 102 103 91 93(Deli-NPM) (La Me)
GKE TT 3/87 1 111 114 108 113(NPM) (La Me)
L 15 TT 3/87 1 113 117 112 115(Deli-NPM) (La Me)
GGN TT 3/87 1 113 114 108 114(NPM) (La Me)
Deli-NPM Dura or NPM Dura x La Me
Dura Pisifera No. of Mean Yield Bunch Oil TEPGrouping prog. Yield Number Yield
Code (% SC 5) (% Over SC 5) ( % Over SC 5) (% over SC 5)
DxP (La Me) (Standard Cross) 100 100 100 100(SC 5) (21.0 t/ha) (16.8) (5.53 t/ha) (6.05 t/ha)
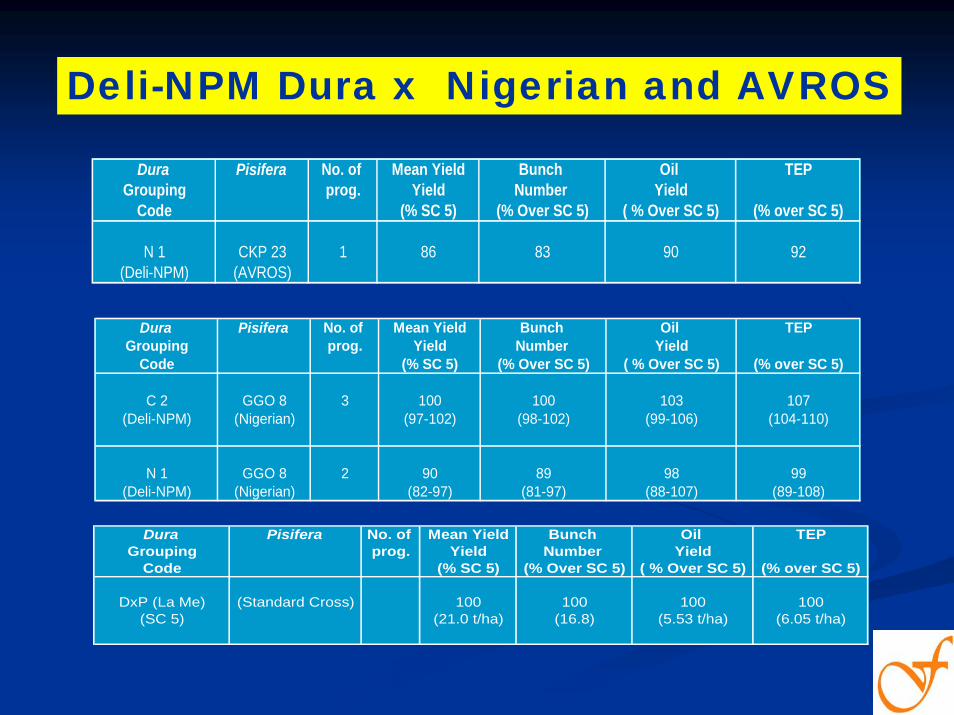
Dura Pisifera No. of Mean Yield Bunch Oil TEPGrouping prog. Yield Number Yield
Code (% SC 5) (% Over SC 5) ( % Over SC 5) (% over SC 5)
N 1 CKP 23 1 86 83 90 92(Deli-NPM) (AVROS)
Dura Pisifera No. of Mean Yield Bunch Oil TEPGrouping prog. Yield Number Yield
Code (% SC 5) (% Over SC 5) ( % Over SC 5) (% over SC 5)
C 2 GGO 8 3 100 100 103 107(Deli-NPM) (Nigerian) (97-102) (98-102) (99-106) (104-110)
N 1 GGO 8 2 90 89 98 99(Deli-NPM) (Nigerian) (82-97) (81-97) (88-107) (89-108)
Deli-NPM Dura x Nigerian and AVROS
Dura Pisifera No. of Mean Yield Bunch Oil TEPGrouping prog. Yield Number Yield
Code (% SC 5) (% Over SC 5) ( % Over SC 5) (% over SC 5)
DxP (La Me) (Standard Cross) 100 100 100 100(SC 5) (21.0 t/ha) (16.8) (5.53 t/ha) (6.05 t/ha)

C2/GKN x Yangambi (GMH 43)
- High bunch number
- High FFB
- High Oil Yield
- High TEP
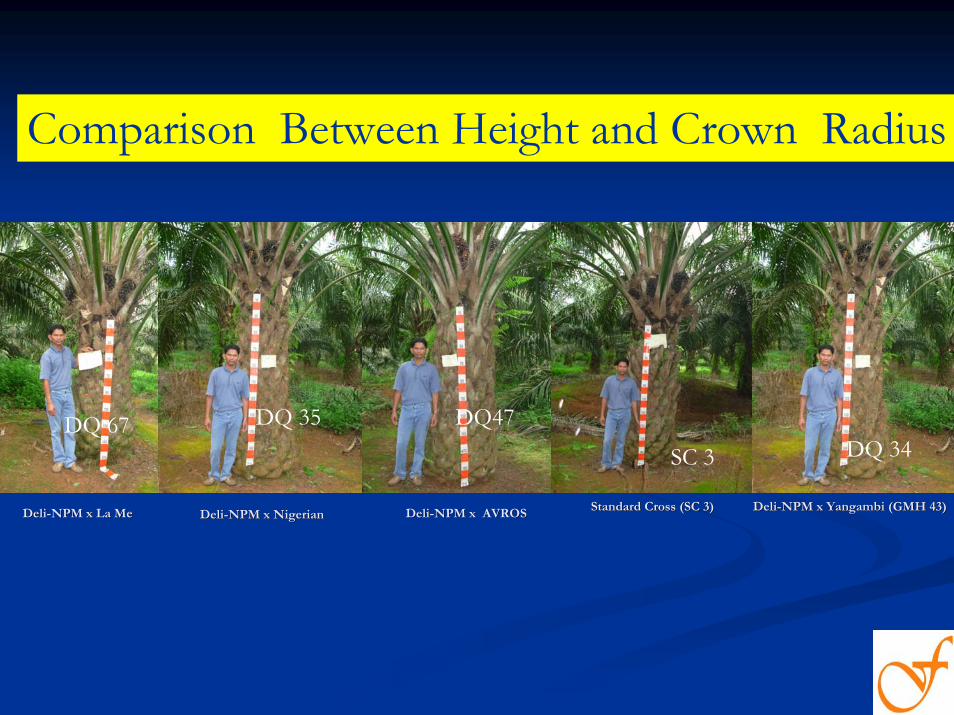
DQ 34DQ 2
DQ 7
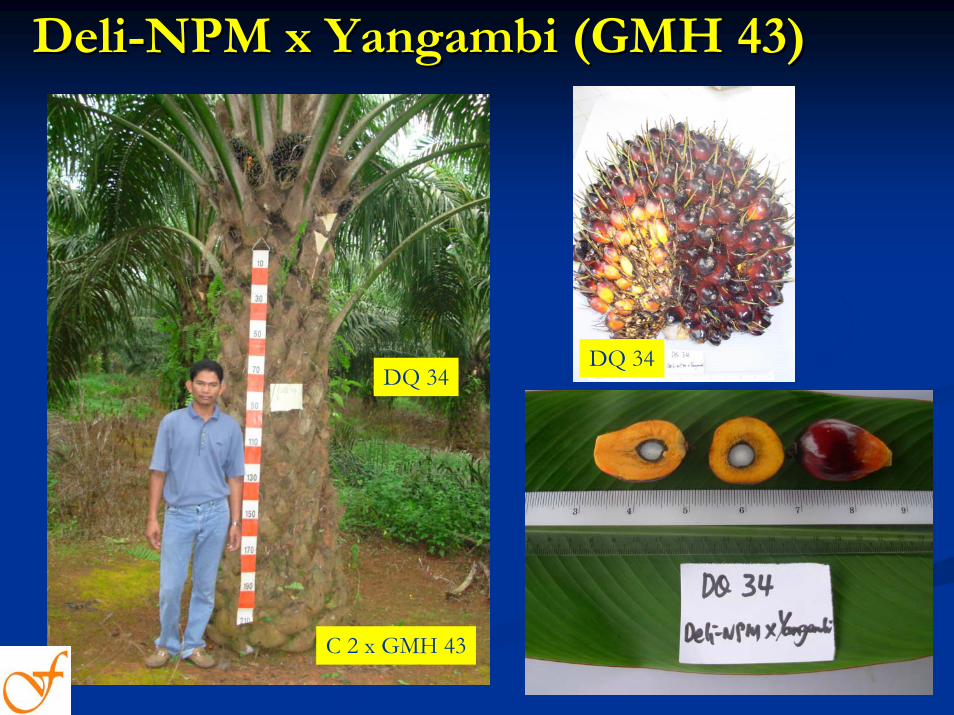
DeliDeli--NPM x NPM x YangambiYangambi (GMH 43)(GMH 43)
DQ 34DQ 34
C 2 x GMH 43

DeliDeli--NPM x NigerianNPM x Nigerian
DQ 35
DQ 35
C 2 x GGO 8

NPM x NPM x YangambiYangambi
DQ 6
DQ 6
GGN x GMH 43

DeliDeli--NPM x La MeNPM x La Me
DQ 67
DQ 67
C2 x TT 3/90
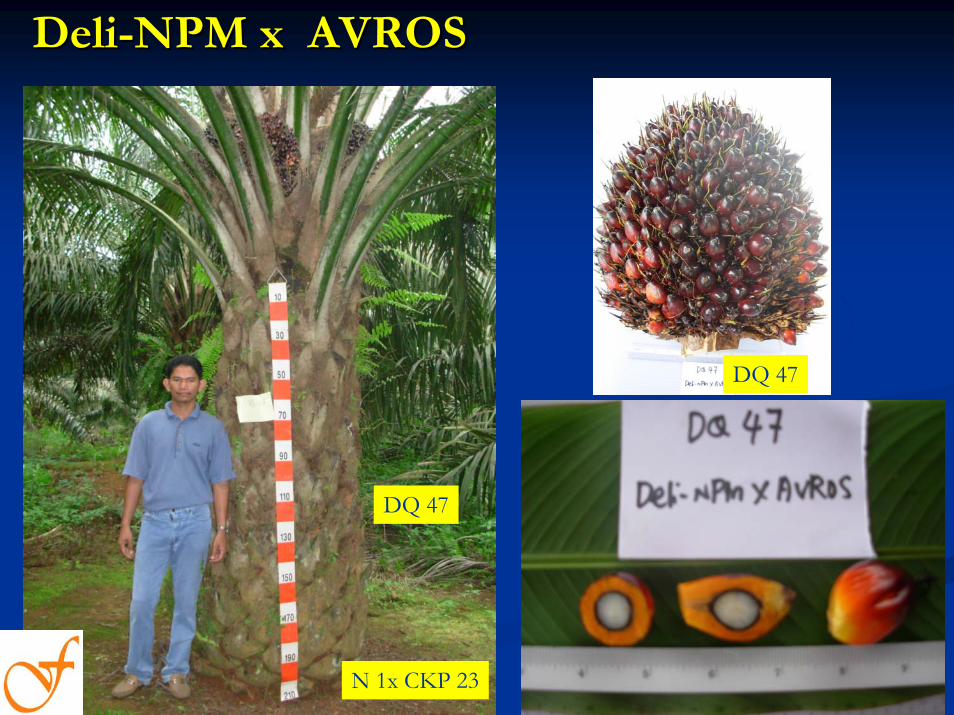
DeliDeli--NPM x AVROSNPM x AVROS
DQ 47
DQ 47
N 1x CKP 23

SC 3
Standard Cross (SC 3)Standard Cross (SC 3)
SC 3

Standard Cross (SC 5)Standard Cross (SC 5)
SC 5
SC 5
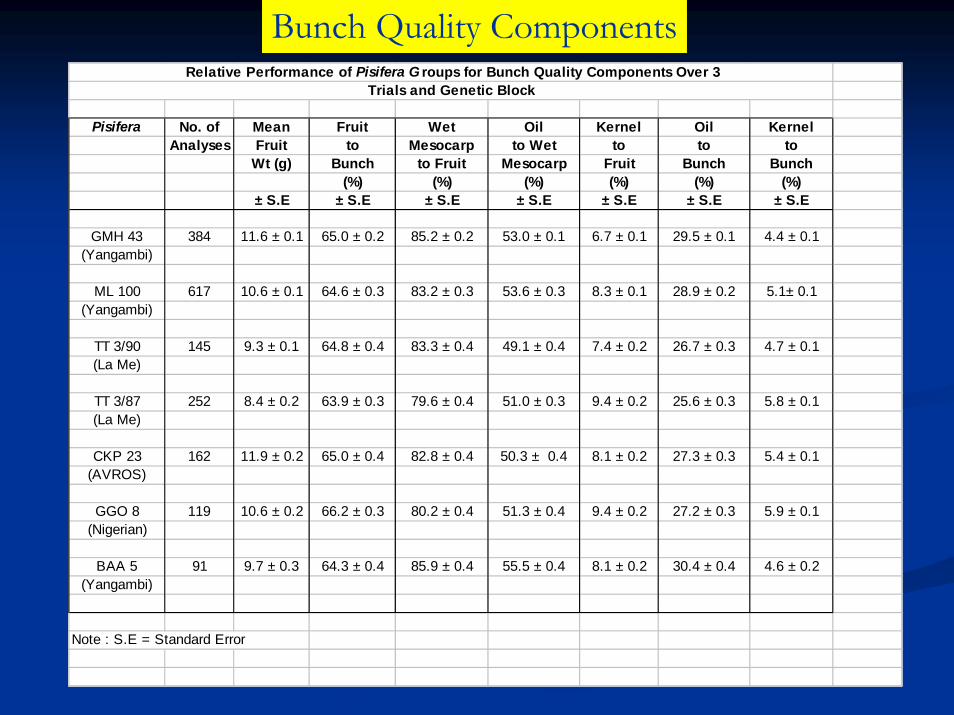
Pisifera No. of Mean Fruit Wet Oil Kernel Oil KernelAnalyses Fruit to Mesocarp to Wet to to to
Wt (g) Bunch to Fruit Mesocarp Fruit Bunch Bunch(%) (%) (%) (%) (%) (%)
± S.E ± S.E ± S.E ± S.E ± S.E ± S.E ± S.E
GMH 43 384 11.6 ± 0.1 65.0 ± 0.2 85.2 ± 0.2 53.0 ± 0.1 6.7 ± 0.1 29.5 ± 0.1 4.4 ± 0.1(Yangambi)
ML 100 617 10.6 ± 0.1 64.6 ± 0.3 83.2 ± 0.3 53.6 ± 0.3 8.3 ± 0.1 28.9 ± 0.2 5.1± 0.1(Yangambi)
TT 3/90 145 9.3 ± 0.1 64.8 ± 0.4 83.3 ± 0.4 49.1 ± 0.4 7.4 ± 0.2 26.7 ± 0.3 4.7 ± 0.1(La Me)
TT 3/87 252 8.4 ± 0.2 63.9 ± 0.3 79.6 ± 0.4 51.0 ± 0.3 9.4 ± 0.2 25.6 ± 0.3 5.8 ± 0.1(La Me)
CKP 23 162 11.9 ± 0.2 65.0 ± 0.4 82.8 ± 0.4 50.3 ± 0.4 8.1 ± 0.2 27.3 ± 0.3 5.4 ± 0.1(AVROS)
GGO 8 119 10.6 ± 0.2 66.2 ± 0.3 80.2 ± 0.4 51.3 ± 0.4 9.4 ± 0.2 27.2 ± 0.3 5.9 ± 0.1(Nigerian)
BAA 5 91 9.7 ± 0.3 64.3 ± 0.4 85.9 ± 0.4 55.5 ± 0.4 8.1 ± 0.2 30.4 ± 0.4 4.6 ± 0.2(Yangambi)
Note : S.E = Standard Error
Relative Performance of Pisifera G roups for Bunch Quality Components Over 3 Trials and Genetic Block
Bunch Quality Components
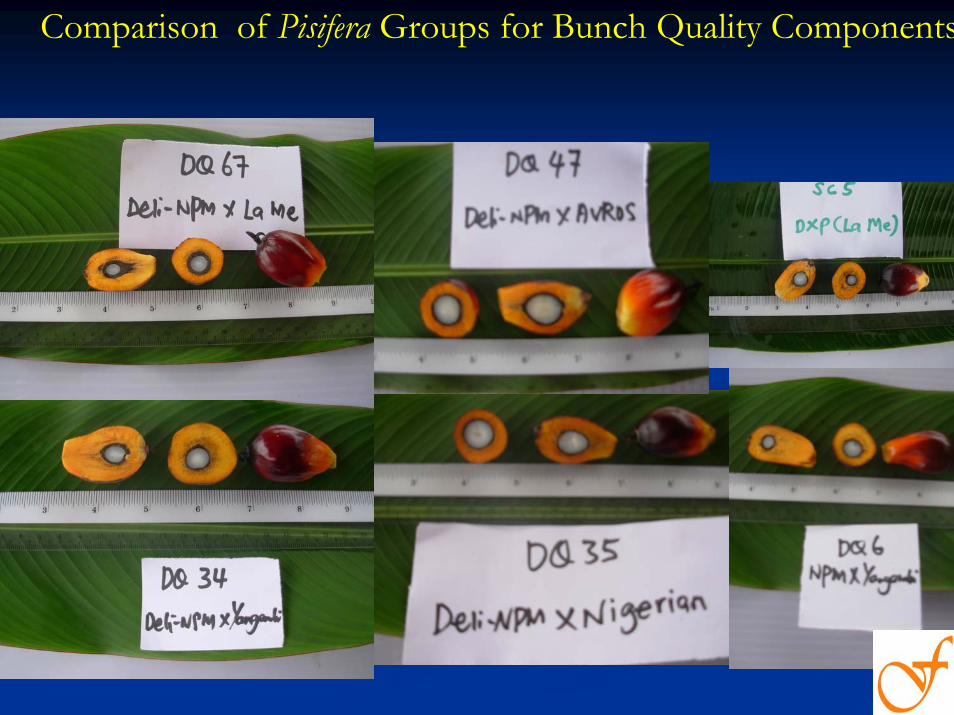
Comparison of Pisifera Groups for Bunch Quality Components

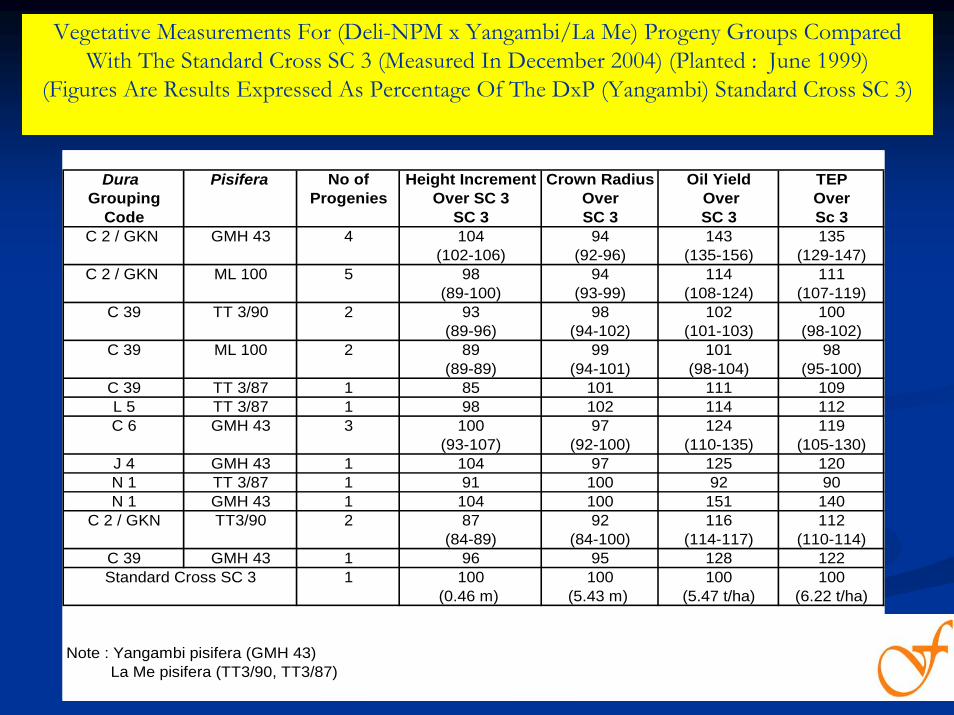
Vegetative Measurements For (Deli-NPM x Yangambi/La Me) Progeny Groups Compared With The Standard Cross SC 3 (Measured In December 2004) (Planted : June 1999)
(Figures Are Results Expressed As Percentage Of The DxP (Yangambi) Standard Cross SC 3)
Dura Pisifera No of Rachis Petiole Petiole Leaflet LeafletGrouping Progenies Length Depth Width Width Length
Code Over SC 3 Over SC 3 Over SC 3 Over SC 3 Over SC 3C 2 / GKN GMH 43 4 96 83 78 97 96
(93-99) (79-88) (74-81) (94-100) (93-98)C 2 / GKN ML 100 5 100 89 81 93 106
(97-144) (83-94) (76-88) (87-96) (102-108)C 39 TT 3/90 2 101 96 85 107 94
(100-102) (90-101) (81-88) (106-108) (93-95)C 39 ML 100 2 100 92 85 95 103
(96-105) (89-95) (81-89) (91-100) (100-106)C 39 TT 3/87 1 95 88 80 93 97L 5 TT 3/87 1 108 98 87 94 106C 6 GMH 43 3 99 94 85 103 98
(97-100) (91-96) (84-86) (101-105) (95-100)J 4 GMH 43 1 97 103 83 102 97N 1 TT 3/87 1 110 95 89 102 104N 1 GMH 43 1 99 84 85 97 96
C 2 / GKN TT3/90 2 95 84 77 98 93(89-100) (84-87) (75-79) (96-99) (88-97)
C 39 GMH 43 1 95 87 84 97 91100 100 100 100 100
1 ( 4.76m ) ( 3.96 cm) ( 7.35cm ) ( 4.65cm ) ( 85.0 cm)
Note : Yangambi pisifera (GMH 43) La Me pisifera (TT3/90, TT3/87)
Standard Cross SC 3

Comparison between C2 x GMH 43 and DxP (SC 3)Comparison between C2 x GMH 43 and DxP (SC 3)
SC 3SC 3
SC 3
SC 3
DQ 34DQ 34
DQ 34DQ 34
Vegetative Measurements For (Deli-NPM x Yangambi/La Me) Progeny Groups Compared With The Standard Cross SC 3 (Measured In December 2004) (Planted : June 1999)
(Figures Are Results Expressed As Percentage Of The DxP (Yangambi) Standard Cross SC 3)
Dura Pisifera No of Height Increment Crown Radius Oil Yield TEPGrouping Progenies Over SC 3 Over Over Over
Code SC 3 SC 3 SC 3 Sc 3C 2 / GKN GMH 43 4 104 94 143 135
(102-106) (92-96) (135-156) (129-147)C 2 / GKN ML 100 5 98 94 114 111
(89-100) (93-99) (108-124) (107-119)C 39 TT 3/90 2 93 98 102 100
(89-96) (94-102) (101-103) (98-102)C 39 ML 100 2 89 99 101 98
(89-89) (94-101) (98-104) (95-100)C 39 TT 3/87 1 85 101 111 109L 5 TT 3/87 1 98 102 114 112C 6 GMH 43 3 100 97 124 119
(93-107) (92-100) (110-135) (105-130)J 4 GMH 43 1 104 97 125 120N 1 TT 3/87 1 91 100 92 90N 1 GMH 43 1 104 100 151 140
C 2 / GKN TT3/90 2 87 92 116 112(84-89) (84-100) (114-117) (110-114)
C 39 GMH 43 1 96 95 128 1221 100 100 100 100
(0.46 m) (5.43 m) (5.47 t/ha) (6.22 t/ha)
Note : Yangambi pisifera (GMH 43) La Me pisifera (TT3/90, TT3/87)
Standard Cross SC 3
SC 3
DQ47DQ 67 DQ 35DQ 34
Comparison Between Height and Crown Radius
DeliDeli--NPM x NPM x YangambiYangambi (GMH 43)(GMH 43)Standard Cross (SC 3)Standard Cross (SC 3)DeliDeli--NPM x AVROSNPM x AVROSDeliDeli--NPM x NigerianNPM x NigerianDeliDeli--NPM x La MeNPM x La Me
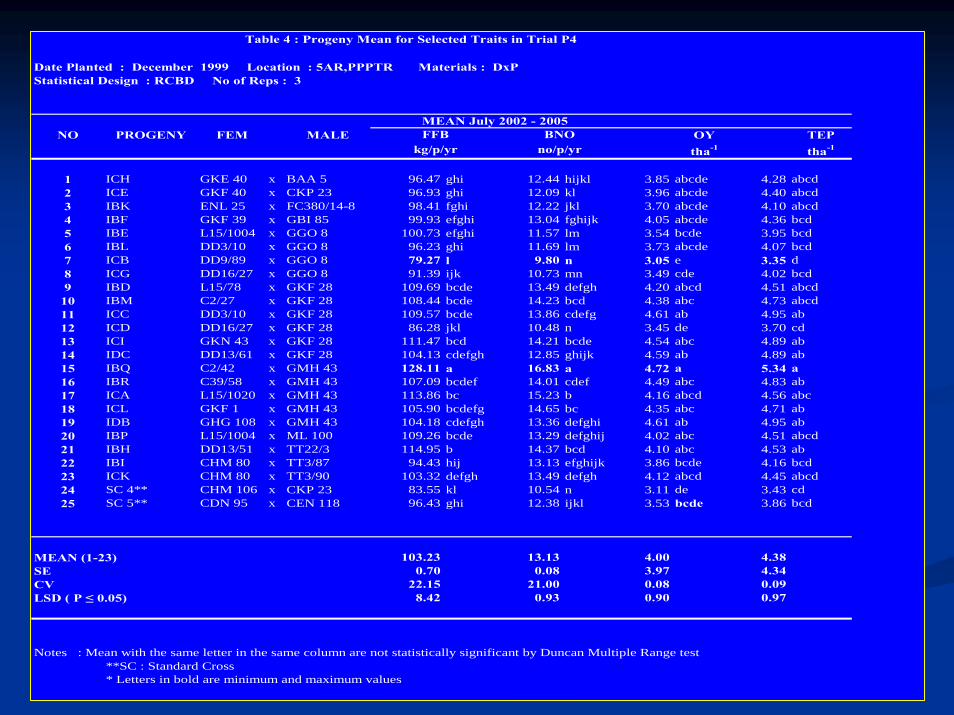
Date Planted : December 1999 Location : 5AR,PPPTR Materials : DxP Statistical Design : RCBD No of Reps : 3
NO PROGENY FEM MALE OY TEPtha-1 tha-1
1 ICH GKE 40 x BAA 5 96.47 ghi 12.44 hijkl 3.85 abcde 4.28 abcd2 ICE GKF 40 x CKP 23 96.93 ghi 12.09 kl 3.96 abcde 4.40 abcd3 IBK ENL 25 x FC380/14-8 98.41 fghi 12.22 jkl 3.70 abcde 4.10 abcd4 IBF GKF 39 x GBI 85 99.93 efghi 13.04 fghijk 4.05 abcde 4.36 bcd5 IBE L15/1004 x GGO 8 100.73 efghi 11.57 lm 3.54 bcde 3.95 bcd6 IBL DD3/10 x GGO 8 96.23 ghi 11.69 lm 3.73 abcde 4.07 bcd7 ICB DD9/89 x GGO 8 79.27 l 9.80 n 3.05 e 3.35 d8 ICG DD16/27 x GGO 8 91.39 ijk 10.73 mn 3.49 cde 4.02 bcd9 IBD L15/78 x GKF 28 109.69 bcde 13.49 defgh 4.20 abcd 4.51 abcd
10 IBM C2/27 x GKF 28 108.44 bcde 14.23 bcd 4.38 abc 4.73 abcd11 ICC DD3/10 x GKF 28 109.57 bcde 13.86 cdefg 4.61 ab 4.95 ab12 ICD DD16/27 x GKF 28 86.28 jkl 10.48 n 3.45 de 3.70 cd13 ICI GKN 43 x GKF 28 111.47 bcd 14.21 bcde 4.54 abc 4.89 ab14 IDC DD13/61 x GKF 28 104.13 cdefgh 12.85 ghijk 4.59 ab 4.89 ab15 IBQ C2/42 x GMH 43 128.11 a 16.83 a 4.72 a 5.34 a16 IBR C39/58 x GMH 43 107.09 bcdef 14.01 cdef 4.49 abc 4.83 ab17 ICA L15/1020 x GMH 43 113.86 bc 15.23 b 4.16 abcd 4.56 abc18 ICL GKF 1 x GMH 43 105.90 bcdefg 14.65 bc 4.35 abc 4.71 ab19 IDB GHG 108 x GMH 43 104.18 cdefgh 13.36 defghi 4.61 ab 4.95 ab20 IBP L15/1004 x ML 100 109.26 bcde 13.29 defghij 4.02 abc 4.51 abcd21 IBH DD13/51 x TT22/3 114.95 b 14.37 bcd 4.10 abc 4.53 ab22 IBI CHM 80 x TT3/87 94.43 hij 13.13 efghijk 3.86 bcde 4.16 bcd23 ICK CHM 80 x TT3/90 103.32 defgh 13.49 defgh 4.12 abcd 4.45 abcd24 SC 4** CHM 106 x CKP 23 83.55 kl 10.54 n 3.11 de 3.43 cd25 SC 5** CDN 95 x CEN 118 96.43 ghi 12.38 ijkl 3.53 bcde 3.86 bcd
MEAN (1-23) 103.23 13.13 4.00 4.38SE 0.70 0.08 3.97 4.34CV 22.15 21.00 0.08 0.09LSD ( P ≤ 0.05) 8.42 0.93 0.90 0.97
Notes : Mean with the same letter in the same column are not statistically significant by Duncan Multiple Range test**SC : Standard Cross* Letters in bold are minimum and maximum values
kg/p/yr no/p/yr
Table 4 : Progeny Mean for Selected Traits in Trial P4
MEAN July 2002 - 2005FFB BNO
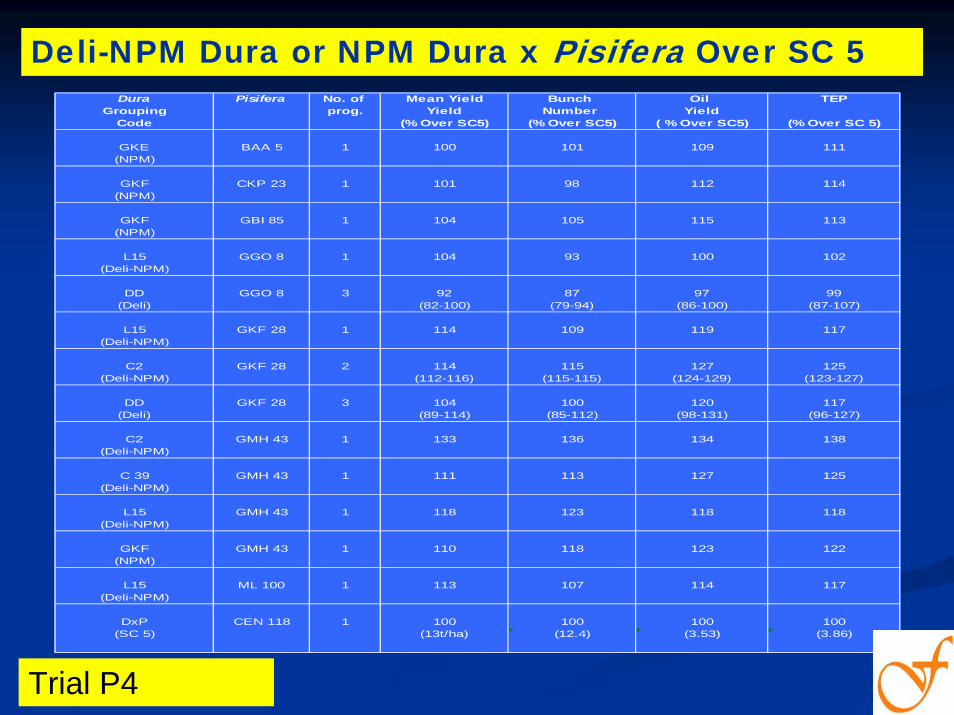
Dura Pisifera No. of Mean Yield Bunch Oil TEPGrouping prog. Yield Number Yield
Code (% Over SC5) (% Over SC5) ( % Over SC5) (% Over SC 5)
GKE BAA 5 1 100 101 109 111(NPM)
GKF CKP 23 1 101 98 112 114(NPM)
GKF GBI 85 1 104 105 115 113(NPM)
L15 GGO 8 1 104 93 100 102(Deli-NPM)
DD GGO 8 3 92 87 97 99(Deli) (82-100) (79-94) (86-100) (87-107)
L15 GKF 28 1 114 109 119 117(Deli-NPM)
C2 GKF 28 2 114 115 127 125(Deli-NPM) (112-116) (115-115) (124-129) (123-127)
DD GKF 28 3 104 100 120 117(Deli) (89-114) (85-112) (98-131) (96-127)
C2 GMH 43 1 133 136 134 138(Deli-NPM)
C 39 GMH 43 1 111 113 127 125(Deli-NPM)
L15 GMH 43 1 118 123 118 118(Deli-NPM)
GKF GMH 43 1 110 118 123 122(NPM)
L15 ML 100 1 113 107 114 117(Deli-NPM)
DxP CEN 118 1 100 100 100 100(SC 5) (13t/ha) (12.4) (3.53) (3.86)
Trial P4Deli-NPM Dura or NPM Dura x Pisifera Over SC 5
Trial P4

ICC
Deli x NigerianDeli x Nigerian
ICC
DD 3 x GKF 28

ICI
Deli Deli ––NPM x NigerianNPM x Nigerian
ICI
GKN x GKF 28
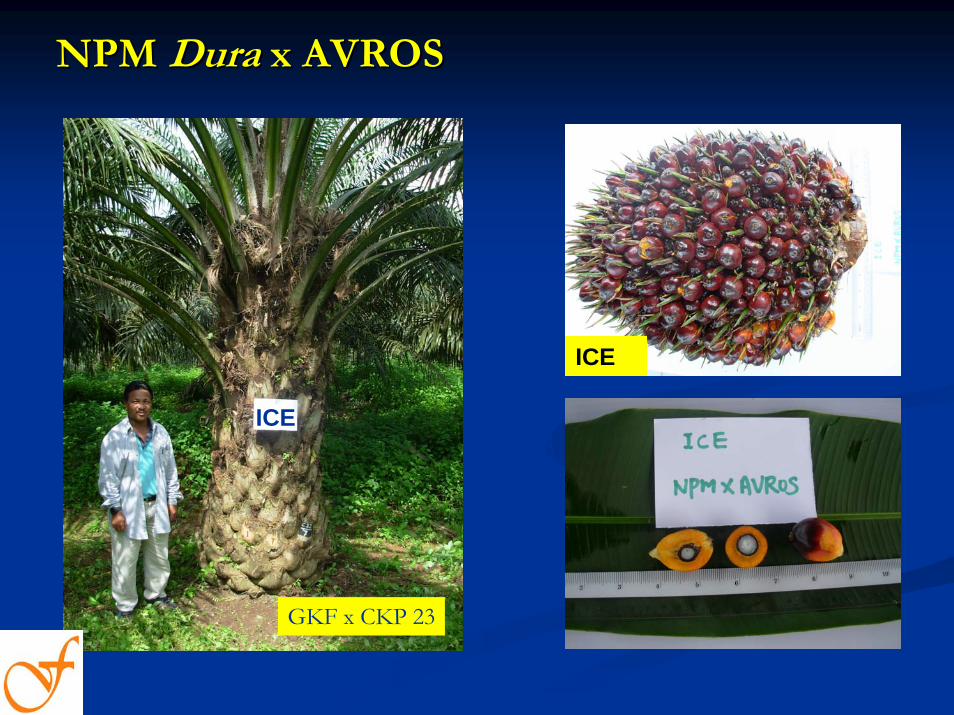
ICE
NPM NPM Dura Dura x AVROSx AVROS
ICE
GKF x CKP 23

IBE
Deli Deli ––NPM x NigerianNPM x Nigerian
IBE
L 15 x GGO 8
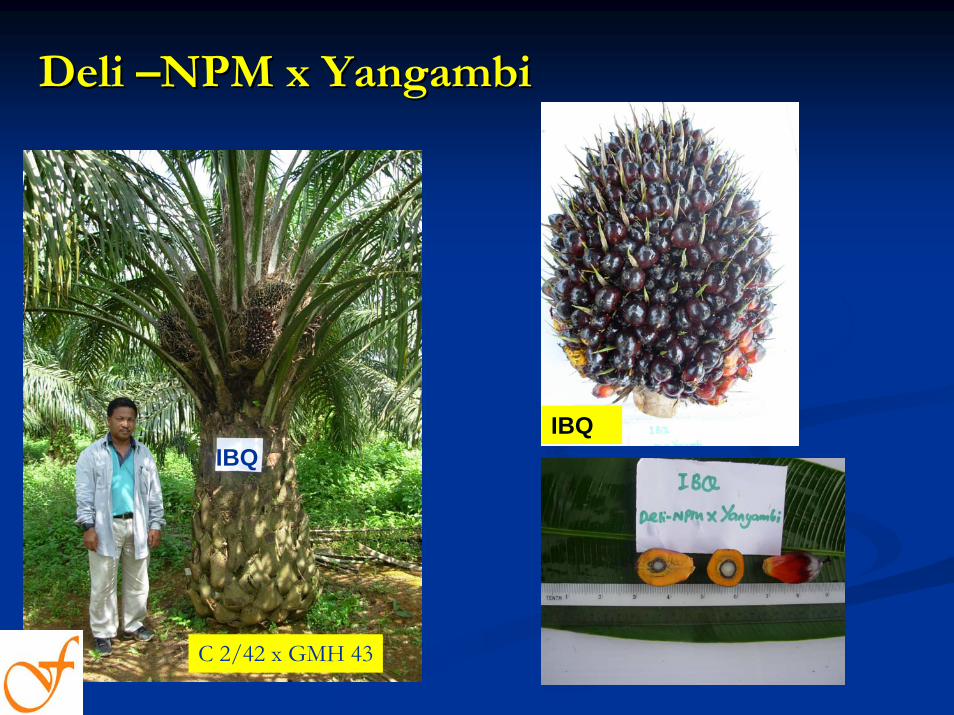
IBQ
Deli Deli ––NPM x NPM x YangambiYangambi
IBQ
C 2/42 x GMH 43

SC 5
Deli x La Me (SC 5)Deli x La Me (SC 5)
IBE
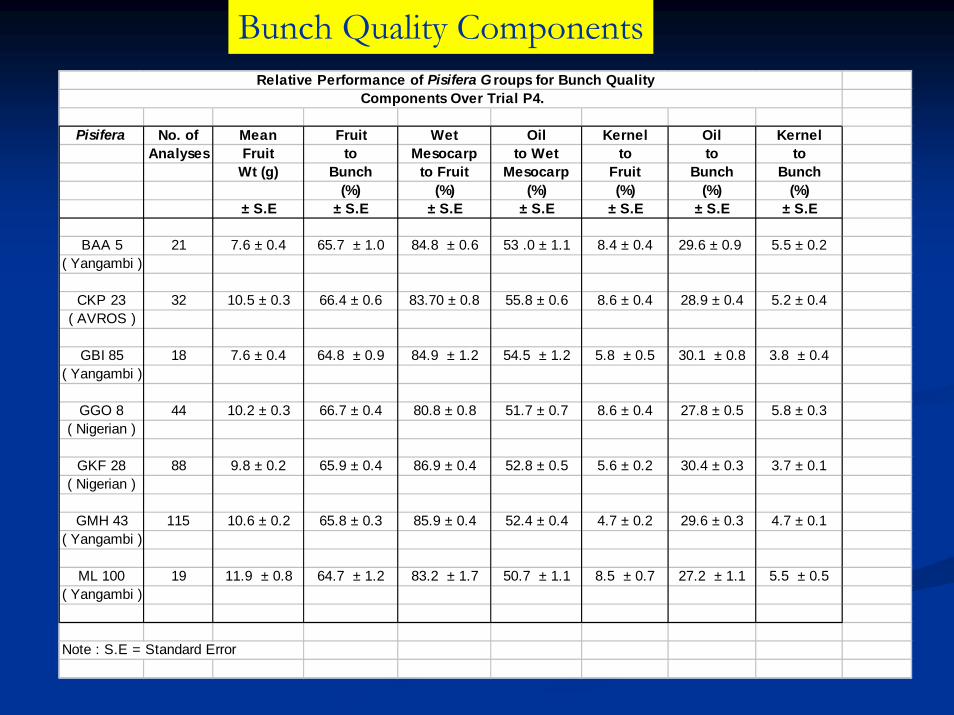
Pisifera No. of Mean Fruit Wet Oil Kernel Oil KernelAnalyses Fruit to Mesocarp to Wet to to to
Wt (g) Bunch to Fruit Mesocarp Fruit Bunch Bunch(%) (%) (%) (%) (%) (%)
± S.E ± S.E ± S.E ± S.E ± S.E ± S.E ± S.E
BAA 5 21 7.6 ± 0.4 65.7 ± 1.0 84.8 ± 0.6 53 .0 ± 1.1 8.4 ± 0.4 29.6 ± 0.9 5.5 ± 0.2( Yangambi )
CKP 23 32 10.5 ± 0.3 66.4 ± 0.6 83.70 ± 0.8 55.8 ± 0.6 8.6 ± 0.4 28.9 ± 0.4 5.2 ± 0.4( AVROS )
GBI 85 18 7.6 ± 0.4 64.8 ± 0.9 84.9 ± 1.2 54.5 ± 1.2 5.8 ± 0.5 30.1 ± 0.8 3.8 ± 0.4( Yangambi )
GGO 8 44 10.2 ± 0.3 66.7 ± 0.4 80.8 ± 0.8 51.7 ± 0.7 8.6 ± 0.4 27.8 ± 0.5 5.8 ± 0.3( Nigerian )
GKF 28 88 9.8 ± 0.2 65.9 ± 0.4 86.9 ± 0.4 52.8 ± 0.5 5.6 ± 0.2 30.4 ± 0.3 3.7 ± 0.1( Nigerian )
GMH 43 115 10.6 ± 0.2 65.8 ± 0.3 85.9 ± 0.4 52.4 ± 0.4 4.7 ± 0.2 29.6 ± 0.3 4.7 ± 0.1( Yangambi )
ML 100 19 11.9 ± 0.8 64.7 ± 1.2 83.2 ± 1.7 50.7 ± 1.1 8.5 ± 0.7 27.2 ± 1.1 5.5 ± 0.5( Yangambi )
Note : S.E = Standard Error
Relative Performance of Pisifera G roups for Bunch Quality Components Over Trial P4.
Bunch Quality Components

Comparison of Pisifera Groups for Bunch Quality Components

Efficacy of Phosphate Rock Sources On Oil Palm Efficacy of Phosphate Rock Sources On Oil Palm Seedling Using 32Seedling Using 32p p Isotope Dilution TechniqueIsotope Dilution Technique
Progeny Pedigree Mean Yield Mean Bunch Mean Mean1/2001-12/2005 Number Oil Yield TEP
DQ 29 C2/4 x GMH 43 27.7 t/ha 22.2 8.66 t/ha 9.35 t/ha
Code Frond Leaf Frond Leaf Total PlantKA 16 23.10 a 17.14 a 49.66 a 60.38 a 54.59 aKA 2 1.96 b 3.34 b 22.93 b 26.58 b 24.57 b
% pdff 3 months leaf % pdff 6 months leaf
Progeny Mean for Selected Trials in Genetic Block 7 (2&3) at KG 6
P derived from fertilizer (% pdff) between two progenies at 3 and 6 months after transplanting
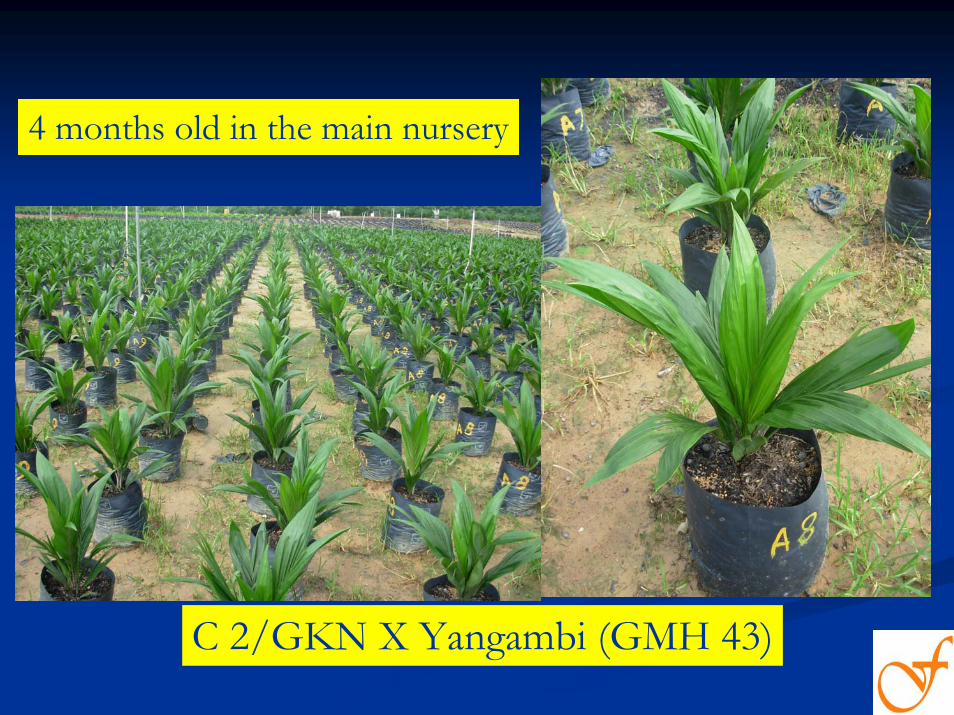
C 2/GKN X Yangambi (GMH 43)
4 months old in the main nursery
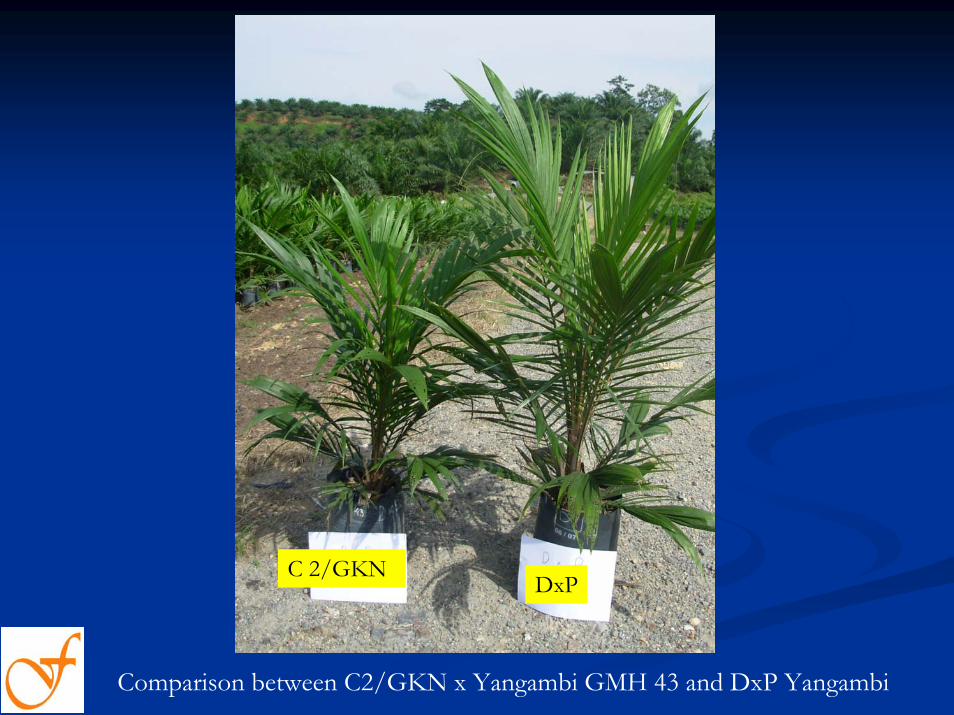
Comparison between C2/GKN x Yangambi GMH 43 and DxP Yangambi
C 2/GKNDxP

Comparison between C2/GKN x Yangambi( GMH 43) and DxP Yangambi in the main nursery
DxP ( Yangambi) C2/GKN X Yangambi (GMH 43)
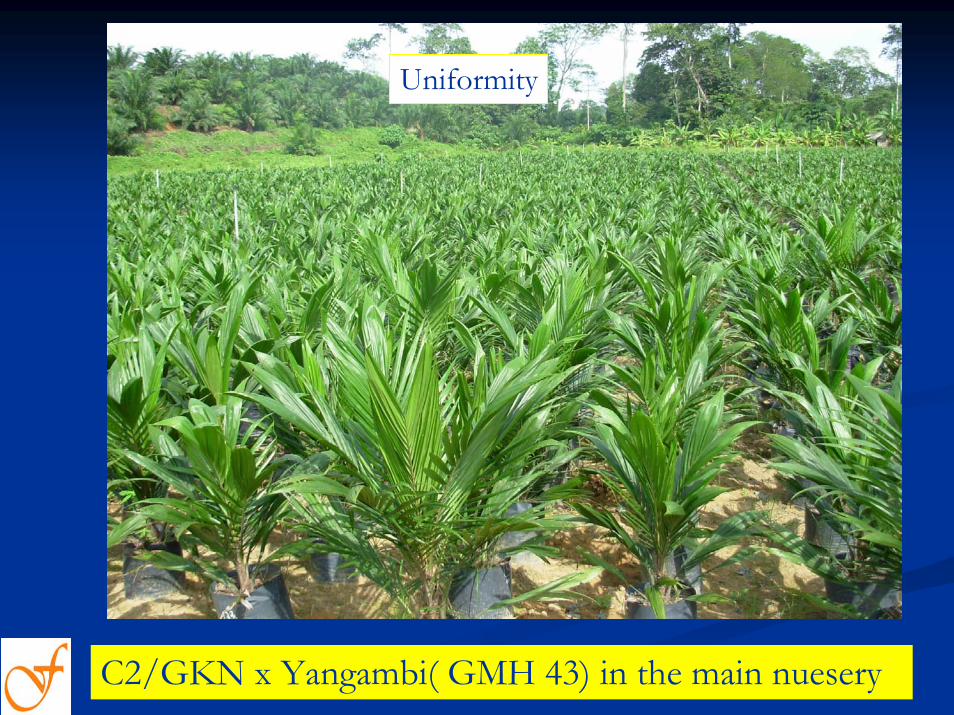
C2/GKN x Yangambi( GMH 43) in the main nuesery
Uniformity

BREEDING FOR GANODERMA TOLERANCE
Ganoderma serious disease especially in replants
Breed for tolerance ?

Susceptibility and Tolerance for Susceptibility and Tolerance for GanodermaGanoderma DiseaseDisease
Deli Deli duradura highly susceptible (de highly susceptible (de FranquevilleFranqueville eet alt al.; .; IdrisIdris et et alal.),.),
La Me and Yangambi La Me and Yangambi certain degree of resistance;certain degree of resistance;
Zaire Zaire duradura x Cameroon x Cameroon pisiferapisifera most tolerant in a most tolerant in a nursery trial;nursery trial;
Need to screen introgressed DeliNeed to screen introgressed Deli--NPM x Yangambi crosses NPM x Yangambi crosses for their tolerance / susceptibilityfor their tolerance / susceptibility
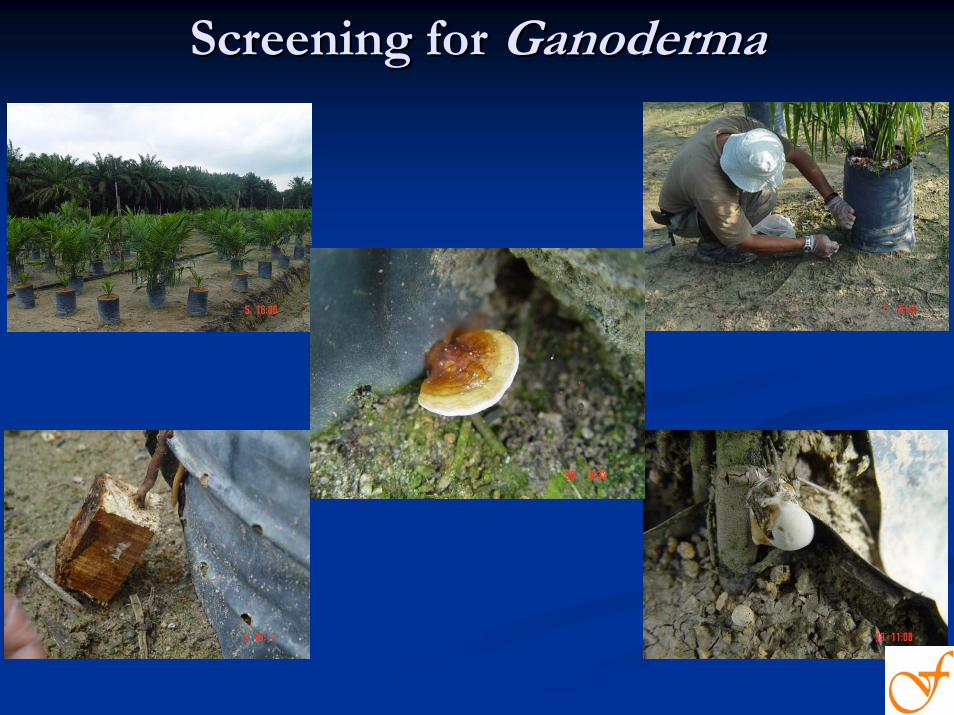
Screening for Screening for GanodermaGanoderma

ConclusionsConclusions
- Deli-NPM dura (C 2/ GKN) x Yangambi (GMH 43) crosses showed superrior oil yields by outyielding the DxP (Yanganbi) Standard Cross SC 3 by 25% for FFB, 43% for oil yield and 35% for TEP
- In absolute terms, this translates to 26.1 t/ha for FFB, 7.82 t/ha for oil yield and 8.40 t/ha for TEP for mean of the first 4 years of recording

ConclusionsConclusions
-- Conversely these materials gave smaller mean Conversely these materials gave smaller mean crown radius which was 6% below the DxP crown radius which was 6% below the DxP (Yangambi) Standard Cross SC 3(Yangambi) Standard Cross SC 3-- Possible for higher density plantingPossible for higher density planting--Larger scale Larger scale testingstestings to confirm their superior to confirm their superior oil yields are now in progressoil yields are now in progress
